week 96 results from a real-world, multicenter alafenamide
TRANSCRIPT

Page 1/23
Sequential HBV Treatment With TenofovirAlafenamide for Patients With Chronic Hepatitis B:Week 96 Results From a Real-world, MulticenterCohort StudyEiichi Ogawa ( [email protected] )
Kyushu University Hospital https://orcid.org/0000-0002-5082-3967Makoto Nakamuta
Kyushu Medical CenterToshimasa Koyanagi
Fukuoka City Hospital: Fukuoka Shimin ByoinAritsune Ooho
Steele Memorial Yawata HospitalNorihiro Furusyo
Taihaku Avenue ClinicEiji Kajiwara
Kajiwara ClinicKazufumi Dohmen
Chihaya HospitalAkira Kawano
Kitakyushu Municipal Medical Center: Kitakyushu Shiritsu Iryo CenterTakeaki Satoh
Kokura Medical CenterKazuhiro Takahashi
Hamanomachi HospitalKoichi Azuma
Kyushu Central HospitalNobuyuki Yamashita
Shin-Kokura HospitalNaoki Yamashita
Kyushu Medical CenterRie Sugimoto
Kyushu Cancer CenterHiromasa Amagase
Amagase Clinic

Page 2/23
Masami Kuniyoshi Kyushu Rosai Hospital: Kyushu Rosai Byoin
Yasunori Ichiki JCHO Kyushu Hospital
Chie Morita Railway Kyushu Memorial Hospital
Shinji Shimoda Kyushu University: Kyushu Daigaku
Hideyuki Nomura Haradoi Hospital
Jun Hayashi Haradoi Hospital
Research Article
Keywords: Hepatitis B virus, Tenofovir alafenamide, Entecavir, Tenofovir disoproxil fumarate, Sequentialtherapy
Posted Date: March 11th, 2021
DOI: https://doi.org/10.21203/rs.3.rs-268836/v1
License: This work is licensed under a Creative Commons Attribution 4.0 International License. Read Full License

Page 3/23
AbstractBackground and Aims
Outcome data of sequential hepatitis B virus treatment with tenofovir alafenamide (TAF) are limited. Weaimed to assess the effectiveness and renal safety of TAF in chronic hepatitis B (CHB) patients who werepreviously treated with entecavir (ETV), tenofovir disoproxil fumarate (TDF), or nucleos(t)ide analog (NA)combination.
Methods
This multicenter, retrospective, cohort study included 458 consecutive CHB patients who switched to TAFmonotherapy after at least two years of treatment with another NA. The longitudinalvirological/laboratory responses were evaluated up to 96 weeks after switchover. Chronic kidney disease(CKD) was de�ned as an estimated glomerular �ltration rate (eGFR)<60 mL/min/1.73m2.
Results
The proportions of HBV DNA suppression (HBV DNA<20 IU/mL) at week 96 were 99.0%, 97.8%, and98.4% in the prior ETV (n=198), TDF (n=137), and NA combination (n=123) groups, respectively. Almostall patients with HBV DNA of 20-2000 IU/mL at baseline achieved HBV DNA suppression at week 96. Onmultivariable generalized estimated equation (GEE) analysis, a low quantitative hepatitis surface antigen(qHBsAg) level at baseline was associated with a lower follow-up qHBsAg level (coe�cient 0.81,P<0.001). The eGFR showed greater improvement in patients with CKD compared to those with non-CKDaccording to the multivariable GEE analysis (coe�cient 21.7, P<0.001). However, the increase of eGFRreached a peak between weeks 24 and 48.
Conclusions
Based on this longitudinal data analysis up to 96 weeks, sequential NA therapy with a switch to TAF is agood option to better achieve high viral suppression and renal safety.
IntroductionChronic hepatitis B (CHB) remains one of the leading causes of cirrhosis, hepatocellular carcinoma(HCC), and liver-related mortality worldwide [1, 2]. Antiviral treatment with potent nucleos(t)ide analogues(NA) such as entecavir (ETV), tenofovir disoproxil fumarate (TDF), and tenofovir alafenamide fumarate(TAF) is widespread, and they have been recommended as �rst-line oral agents that can reduce the risk ofHCC development and liver-related complications [3–5]. Hepatitis B surface antigen (HBsAg)seroclearance is currently regarded as the functional cure because this is uncommon among treatedpatients [6, 7], thus for almost all patients lifelong NA treatment is necessary.

Page 4/23
TAF is the newest NA drug approved for use in hepatitis B virus (HBV) treatment in Japan, at the end of2016.It is a prodrug of tenofovir, a nucleotide analogue that inhibits reverse transcription of both HBV andhuman immunode�ciency virus (HIV) [8]. Other �rst-line drugs with ETV and TDF were approved in 2005and 2008, respectively, and good virological e�cacy has been provided [9–11], although impaired kidneyfunction and decreased bone mineral density (BMD) have been reported in long-term TDF treatment [12,13]. Therefore, the majority of CHB patients continue to be treated with ETV or TDF. According to ongoingphase III trials of the e�cacy and safety of TAF versus TDF for CHB patients [14–16], TAF has beenshown to be virologically effective and well tolerated, with improved renal and bone safety for patientsswitching from TDF. Unfortunately, data, including real-world data, on the effectiveness and safety of TAFfollowing switching from ETV or NA combinations is lacking.
We recently published real-world data on the effectiveness and renal safety of TAF for patients who hadpreviously been treated with ETV or NA combinations [17]. Our results showed that the rate of HBV DNAsuppression signi�cantly increased and that a continued reduction of the quantitative HBsAg (qHBsAg)level was noted at week 48. Moreover, the estimated glomerular �ltration rate (eGFR) was signi�cantlyimproved in patients with chronic kidney disease (CKD) who were treated with a nucleotide analogue.Although advantages from the switchover were elucidated, the length of time for follow-up post switchwas somewhat short, less than one year, thus, the purpose of this study was to examine virological,biochemical, and renal outcomes up to 96 weeks in a multicenter, real-world cohort of CHB patients whohave switched to TAF from ETV, TDF, or an NA combination.
Patients And Methods
PatientsThe Kyushu University Liver Disease Study (KULDS) Group consists of hepatologists from KyushuUniversity Hospital and its a�liated hospitals located in the northern Kyushu area of Japan. Thismulticenter, retrospective, observational cohort study consisted of consecutive patients from March 2017until December 2018 who switched to a �xed-dose of TAF, 25mg orally once daily (Vemlidy; GileadSciences K.K., Tokyo, Japan).
Eligible patients were (1) aged 18 years and older with con�rmed chronic HBV infection, and (2) NAtreatment switching to TAF monotherapy from an at least two-year course of ETV, TDF, or an NAcombination of lamivudine (LAM)/adeforvir (ADF), LAM/TDF, ETV/ADF, or ETV/TDF. Exclusion criteriaincluded (1) duration of follow-up under two years: (2) viable HCC within three months before TAFinitiation by imaging examination such as abdominal ultrasound, computed tomography, or magneticresonance imaging; (3) positivity for antibody to HIV or positivity for hepatitis C antibody; (4) terminalillness; and (5) insu�cient medical records for primary endpoints and objectives.

Page 5/23
The study was conducted in accordance with the ethical principles of the Declaration of Helsinki and theSTROBE statement.
It was approved by the Ethics Committees of Kyushu University Hospital and each study site and isregistered as a clinical study on the University Hospital Medical Information Network (ID 000034696).
Laboratory, and virological assessmentsAll patients were followed every 8–12 weeks during TAF treatment.Laboratory assessments included hematological analysis, serum biochemistry tests, and urinalysis,including measures of renal function. The eGFR was calculated with the following formulas [18]; for meneGFR (mL/min/1.73m2) = 194 × serum creatinine level− 1.094 × age− 0.287 and for women eGFR = 194 ×SCr− 1.094 × age− 0.287 × 0.739. As a renal safety endpoint, we de�ned CKD and the lower limit of the serumphosphorus level as an eGFR < 60 mL/min/1.73m2 and serum phosphorus level < 2.5 mg/dL, respectively.Liver cirrhosis was de�ned by liver biopsy demonstrating a METAVIR F4 score, transient elastography(FibroScan®; Echosens, Paris, France) greater than 12.0 kPa [19], or ultrasound examination with signs ofcirrhosis based on nodularity, portal velocity, liver size, caudate hypertrophy, echogenicity, portal veindiameter, and spleen size. These assessments were performed within three months before the initiationof TAF treatment.
Primary and secondary endpointsThe primary endpoint was the proportion of patients with HBV DNA suppression (less than 20 IU/mL, thelower limit of quantitation) as determined by real-time reverse transcriptase PCR assay (COBAS TaqManHBV assay, Version 2.0) (Roche Molecular Diagnostics, Tokyo, Japan) at week 96 after switching to TAF.Key prespeci�ed secondary endpoints were the longitudinal change of alanine aminotransferase (ALT),qHBsAg level, and eGFR. A patient was determined to have ALT normalization if ALT was less than 35U/L for men or 25 U/L for women, according to the American Association for the Study of Liver Diseases(AASLD) normal range [3]. Moreover, we calculated complete response rates with both HBV DNAsuppression and ALT normalization.
Statistical analysisStatistical analyses were conducted using SPSS Statistics version 25.0 (IBM SPSS Inc, Chicago, IL, USA).Baseline continuous data are expressed as median (�rst-third quartile) or mean (± standard deviation)and categorical variables are reported as frequencies and percentages. Trends for continuous variableswere assessed using the repeated measures ANOVA test. Univariate analyses were done using the Chi-square, Student’s t, or Mann-Whitney U test, as appropriate. We used the multivariable generalizedestimating equation (GEE) model adjusted for age, sex, body mass index (BMI), cirrhosis, hypertension,diabetes mellitus, and previous NA regimen to estimate coe�cients associated with baseline parametersor factors to changes in ALT, qHBsAg level, and eGFR. The results are expressed as coe�cients and their95% con�dence interval (CI). A P value less than 0.05 was regarded as statistically signi�cant in allanalyses.

Page 6/23
Results
Patient characteristicsA total of 478 patients who switched to TAF were identi�ed during the study period.
Twenty were excluded in accordance with the criteria, leaving the data of 458 available for analysis.Of the eligible patients, 198 (43.2%) received ETV, 137 (29.9%) TDF, and 123 (26.9%) an NA combinationbefore switching to TAF. Demographic and baseline characteristics according to the previous NAtreatment are shown in Table 1. Median treatment durations of the previous drug for the ETV, TDF, and NAcombination groups were 7.0, 4.5, and 4.3 years, respectively.

Page 7/23
Table 1Baseline characteristics according to the previous nucleos(t)ide analog (NA) treatment
Previous NA regimen Entecavir Tenofovir disoproxilfumarate
NAcombination
Number 198 137 123
Age
range
61 (50–69)
26–90
51 (43–66)
29–79
61 (53–68)
33–84
Male 124 (62.6) 78 (56.9) 81 (65.9)
Body mass index (kg/m2) 22.4 (20.3–24.3)
22.3 (20.5–24.9) 22.9 (20.9–25.2)
Cirrhosis 27 (13.6) 20 (14.6) 23 (18.7)
History of HCC 19 (9.6) 16 (11.7) 22 (17.9)
Hypertension 58 (29.3) 14 (10.2) 25 (20.3)
Diabetes 26 (13.1) 14 (10.2) 16 (13.0)
Albumin (g/L) 43 (41–45) 43 (41–45) 44 (41–46)
Total bilirubin (mg/dL) 0.8 (0.5–1.1) 0.7 (0.5-1.0) 0.7 (0.4-1.0)
AST (U/L) 24 (19–29) 25 (22–32) 24 (20–30)
ALT (U/L) 20 (14–27) 24 (18–34) 20 (16–31)
gGTP (U/L) 24 (17–44) 21 (15–40) 21 (15–42)
eGFR (mL/min/1.73m2)
30–60
15- < 30
71 (61–82)
44 (22.2)
2 (1.0)
74 (62–85)
29 (21.2)
2 (1.5)
69 (55–81)
34 (27.6)
3 (2.4)
Phosphorus (mg/dL) 3.3 (3.0-3.6) 3.3 (2.8–3.7) 3.0 (2.6–3.5)
AFP (ng/mL) 2.9 (2.0-3.4) 3.0 (2.2–4.4) 3.0 (2.1–3.7)
Platelet count (103/µL) 178 (146–218)
184 (144–235) 183 (139–221)
HBeAg positive 28 (14.1) 31 (22.6) 27 (22.0)
Data are n (%) or median (�rst-third quartile).
HCC, hepatocellular carcinoma; AST, aspartate aminotransferase; ALT, alanine aminotransferase;gGTP, gamma-glutamyl transpeptidase; eGFR, estimated glomerular �ltration rate; AFP, alpha-fetoprotein; HBeAg, hepatitis B e antigen; HBV, hepatitis B virus; LAM, lamivudine; ADV, adefovir; ETV,entecavir; TDF, tenofovir disoproxil fumarate.

Page 8/23
Previous NA regimen Entecavir Tenofovir disoproxilfumarate
NAcombination
HBV DNA (IU/mL)
< 20 + or negative
20 − 2,000
> 2,000
152 (76.8)
34 (17.2)
12 (6.1)
130 (94.9)
7 (5.1)
0
113 (91.9)
10 (8.1)
0
Previous NA treatment duration(year)
5.0 (4.3–7.4) 3.2 (2.6–3.5) 4.3 (3.2–9.2)
Previous NAs combination
LAM + ADV
LAM + TDF
ETV + ADV
ETV + TDF
44 (35.8)
39 (31.7)
3 (2.4)
37 (30.1)
Data are n (%) or median (�rst-third quartile).
HCC, hepatocellular carcinoma; AST, aspartate aminotransferase; ALT, alanine aminotransferase;gGTP, gamma-glutamyl transpeptidase; eGFR, estimated glomerular �ltration rate; AFP, alpha-fetoprotein; HBeAg, hepatitis B e antigen; HBV, hepatitis B virus; LAM, lamivudine; ADV, adefovir; ETV,entecavir; TDF, tenofovir disoproxil fumarate.
In the prior ETV group, the median age was 61, 124 (62.6%) were male, 27 (13.6%) had compensatedcirrhosis, and 28 (14.1%) were hepatitis B e antigen (HBeAg)-positive at baseline. Approximately 23% hadHBV DNA more than 20 IU/mL. In the prior TDF group, the median age was 51, 78 (56.9%) were male, 20(14.6%) had compensated cirrhosis, and 31 (22.6%) were HBeAg-positive at baseline. Unlike the prior ETVgroup, almost all (94.9%) had HBV DNA less than 20 IU/mL. In the prior NA combination group, themedian age was 61, 81 (65.9%) were male, 23 (18.7%) had compensated cirrhosis, and 27 (22.0%) wereHBeAg-positive at baseline. Similar to the prior TDF group, almost all (91.9%) had HBV DNA less than 20IU/mL. Furthermore, in the prior TDF and NA combination groups, none of the patients had uncontrolledHBV DNA (> 2,000 IU/mL).
Virological and biochemical responses 96 weeks afterswitching to TAFThe proportions of HBV DNA suppression at week 96 after switchover were 99.0% (196/198), 97.8%(134/137), and 98.4% (121/123) in the prior ETV, TDF, and NA combination groups, respectively. Of the 46patients who had prior ETV with HBV DNA of 20-2000 IU/mL at baseline, most achieved HBV DNAsuppression from the early stage of TAF treatment, and at week 96 the proportion was 95.7% (42/44)(Table 2). Regardless of the prior treatment regimen, none experienced HBV breakthrough during thefollow-up period. In contrast, the achievement rates of HBeAg loss for patients HBeAg-positive at baseline

Page 9/23
remained low; under 30% in all prior treatment groups (Table 2). Even though patients had a low-titer ofHBeAg (< 10 S/CO) at baseline, only 35–40% had achieved HBeAg loss at week 96.

Page 10/23
Table 2HBeAg loss and HBV DNA suppression after switching to tenofovir alafenamide
HBeAgtiter atbaseline(S/CO)
HBeAgloss atweek48
HBeAgloss atweek96
HBV DNAlevel atbaseline(IU/mL)
HBV DNAsuppressionat week 48
HBV DNAsuppressionat week 96
Previous ETV
HBeAg-positiveat baseline (n = 28)
1 - <10
10 - <100
>100
Unknown
3 / 8(37.5)
1 / 5(20.0)
1 / 10(10.0)
1 / 5(20.0)
3 / 8(37.5)
2 / 5(40.0)
1 / 10(10.0)
2 / 5(40.0)
HBV DNA-positive atbaseline (n = 46)
20-2000
> 2000
33 / 34(97.1)
9 / 12 (75.0)
33 / 34(97.1)
11 / 12(91.7)
HBV DNAsuppression atbaseline (n = 152)
< 20 152 / 152(100)
152 / 152(100)
Previous TDF
HBeAg-positiveat baseline (n = 31)
1 - <10
10 - <100
>100
Unknown
5 / 18(27.8)
1 / 6(16.7)
1 / 7(14.3)
-
7 / 18(38.9)
1 / 6(16.7)
1 / 7(14.3)
-
HBV DNA-positive atbaseline (n = 7)
20-2000
> 2000
3 / 7 (42.9)
-
5 / 7 (71.4)
-
HBV DNAsuppression atbaseline (n = 129)
< 20 129 / 129(100)
129 / 129(100)
Data are n (%).
HBeAg, hepatitis B e antigen; HBV, hepatitis B virus; ETV, entecavir; TDF, tenofovir disoproxil fumarate;NA, nucleos(t)ide analog.
Page 11/23
HBeAgtiter atbaseline(S/CO)
HBeAgloss atweek48
HBeAgloss atweek96
HBV DNAlevel atbaseline(IU/mL)
HBV DNAsuppressionat week 48
HBV DNAsuppressionat week 96
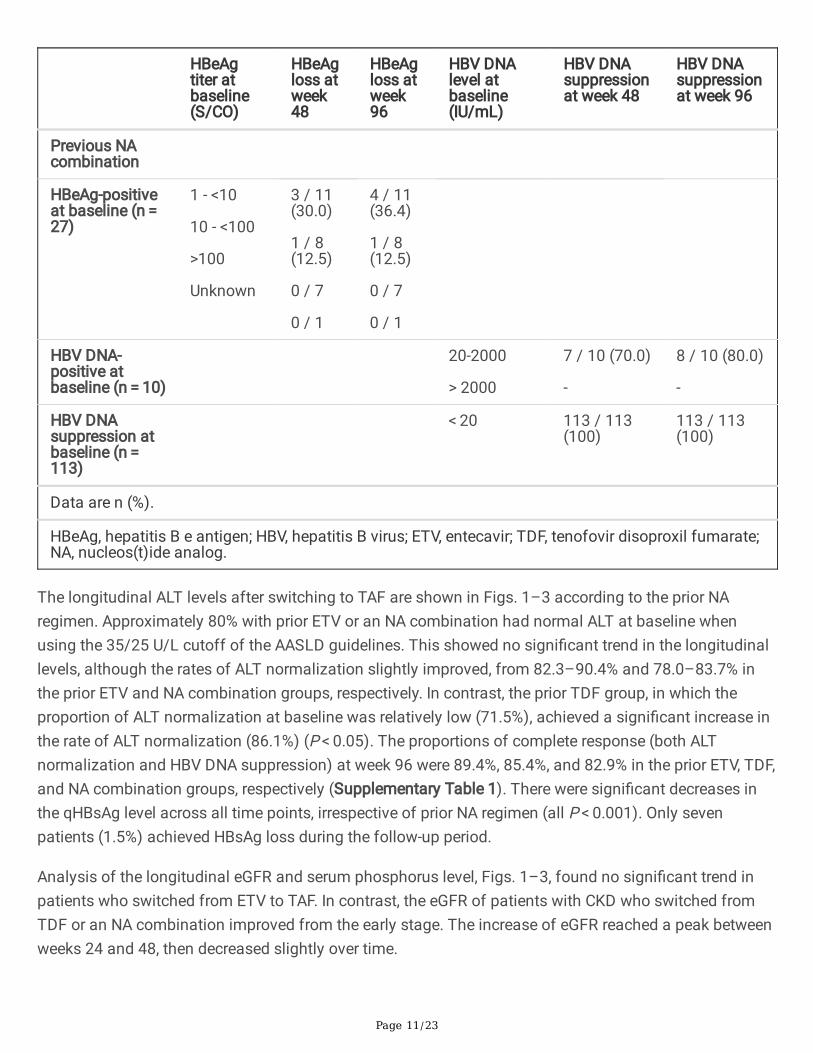
Previous NAcombination
HBeAg-positiveat baseline (n = 27)
1 - <10
10 - <100
>100
Unknown
3 / 11(30.0)
1 / 8(12.5)
0 / 7
0 / 1
4 / 11(36.4)
1 / 8(12.5)
0 / 7
0 / 1
HBV DNA-positive atbaseline (n = 10)
20-2000
> 2000
7 / 10 (70.0)
-
8 / 10 (80.0)
-
HBV DNAsuppression atbaseline (n = 113)
< 20 113 / 113(100)
113 / 113(100)
Data are n (%).
HBeAg, hepatitis B e antigen; HBV, hepatitis B virus; ETV, entecavir; TDF, tenofovir disoproxil fumarate;NA, nucleos(t)ide analog.
The longitudinal ALT levels after switching to TAF are shown in Figs. 1–3 according to the prior NAregimen. Approximately 80% with prior ETV or an NA combination had normal ALT at baseline whenusing the 35/25 U/L cutoff of the AASLD guidelines. This showed no signi�cant trend in the longitudinallevels, although the rates of ALT normalization slightly improved, from 82.3–90.4% and 78.0–83.7% inthe prior ETV and NA combination groups, respectively. In contrast, the prior TDF group, in which theproportion of ALT normalization at baseline was relatively low (71.5%), achieved a signi�cant increase inthe rate of ALT normalization (86.1%) (P < 0.05). The proportions of complete response (both ALTnormalization and HBV DNA suppression) at week 96 were 89.4%, 85.4%, and 82.9% in the prior ETV, TDF,and NA combination groups, respectively (Supplementary Table 1). There were signi�cant decreases inthe qHBsAg level across all time points, irrespective of prior NA regimen (all P < 0.001). Only sevenpatients (1.5%) achieved HBsAg loss during the follow-up period.
Analysis of the longitudinal eGFR and serum phosphorus level, Figs. 1–3, found no signi�cant trend inpatients who switched from ETV to TAF. In contrast, the eGFR of patients with CKD who switched fromTDF or an NA combination improved from the early stage. The increase of eGFR reached a peak betweenweeks 24 and 48, then decreased slightly over time.

Page 12/23
Factors associated with the changes of ALT, qHBsAg level,and eGFRResults of our analysis of the factors associated with the changes in ALT, qHBsAg level, and eGFR at 96weeks after switching to TAF are shown in Table 3. After adjusting for age, sex, BMI, cirrhosis, diabetesmellitus, and prior NA regimen, BMI (coe�cient 1.69, 95%CI 0.89–2.49, P < 0.001) and cirrhosis(coe�cient 4.03, 95%CI 0.32–7.74, P = 0.033) were associated with a longitudinal change in the ALT level.After adjusting for age, sex, cirrhosis, baseline HBeAg, baseline qHBsAg level, and prior NA regimen, age(coe�cient − 7.75, 95%CI -14.3- -1.24, P = 0.020) and baseline qHBsAg level (coe�cient 0.81, 95%CI 0.74–0.88, P < 0.001) were associated with a longitudinal change in the qHBsAg level. Lastly, after adjusting forage, sex, BMI, cirrhosis, diabetes mellitus, hypertension, baseline eGFR, and prior NA regimen, age(coe�cient − 0.48, 95%CI -0.60- -0.36, P = 0.020) and baseline eGFR < 60 (coe�cient 21.7, 95%CI 19.2–24.1, P < 0.001) were associated with a longitudinal change in eGFR.

Page 13/23
Table 3Generalized estimated equation analysis for estimated predictors of changes in ALT, qHBsAg, and eGFR
levels after switching to tenofovir alafenamide
ALT
Characteristics Coe�cient (95%CI) P-value
Age (year) -0.11 (-0.47–0.25) 0.21
Male 1.69 (-3.13–6.51) 0.49
Body mass index (kg/m2) 1.69 (0.89–2.49) < 0.001
Cirrhosis 4.03 (0.32–7.74) 0.033
Diabetes -2.57 (-7.01–1.87) 0.26
Previous NA regimen
ETV monotherapy Reference
TDF monotherapy -3.09 (-8.01–1.84) 0.22
NA combination -1.24 (-6.07–3.60) 0.62
qHBsAg
Characteristics Coe�cient (95%CI) P-value
Age (year) -7.75 (-14.3 – -1.24) 0.020
Male -55.1 (-297–187) 0.66
Cirrhosis -9.70 (-130–111) 0.88
Baseline HBeAg-positive -109 (-532–315) 0.61
Baseline qHBsAg 0.81 (0.74–0.88) < 0.001
Previous NA regimen
ETV monotherapy Reference
TDF monotherapy 27.4 (-259–314) 0.85
NA combination 150 (-98.5–399) 0.24
eGFR
Characteristics Coe�cient (95%CI) P-value
Age (year) -0.48 (-0.60 – -0.36) < 0.001
ALT, alanine aminotransferase; qHBsAg, quantitative hepatitis B surface antigen; eGFR, estimatedglomerular �ltration rate; CI, con�dence interval; NA, nucleos(t)ide analog; ETV, entecavir; TDF,tenofovir disoproxil fumarate; HBeAg, hepatitis B e antigen; HBsAg, hepatitis B surface antigen.

Page 14/23
ALT
Male -0.41 (-3.04–2.21) 0.76
Body mass index (kg/m2) -0.10 (-0.56–0.36) 0.67
Cirrhosis -0.71 (-3.65–2.22) 0.63
Diabetes 2.14 (-2.23–6.51) 0.34
Hypertension 2.11 (-1.24–5.45) 0.22
Baseline eGFR (mL/min/1.73m2)
≥60 Reference
<60 21.7 (19.2–24.1) < 0.001
Previous NA regimen
ETV monotherapy Reference
TDF/ADF included -0.06 (-2.57–2.45) 0.96
ALT, alanine aminotransferase; qHBsAg, quantitative hepatitis B surface antigen; eGFR, estimatedglomerular �ltration rate; CI, con�dence interval; NA, nucleos(t)ide analog; ETV, entecavir; TDF,tenofovir disoproxil fumarate; HBeAg, hepatitis B e antigen; HBsAg, hepatitis B surface antigen.
DiscussionIn our previous cohort study, we showed the virological effectiveness and the renal safety 48 weeks afterswitching to TAF [17]. We noted that the durability of the results would need con�rmation in longer termanalysis. The present study done post-96 weeks con�rmed the previous �ndings and clari�ed the long-term effects of switching to TAF.
We divided patients into three groups according to the prior NA regimen (ETV, TDF, or NA combination).Almost all had achieved HBV DNA suppression by week 96 post switchover, even those treated with anNA combination. Moreover, the prior NA regimen had little in�uence on the longitudinal changes of ALT,qHBsAg level, or eGFR. We believe that our study provides important insights into the effectiveness of aswitch to TAF for patients with CHB who had been treated with older NAs.
Virological e�cacy, including HBV DNA suppression and a decrease of the qHBsAg level, has contributedto a decline of the HCC incidence rate [20–22]. In our prior ETV group, 91.3% of the patients who haddetectable HBV DNA at baseline achieved HBV DNA suppression at week 48, as did 95.7% at week 96.Similar �ndings were seen in the prior TDF and NA combination groups. These incrementalimprovements following switching to TAF were signi�cant, even though our patients had already receivedNA treatment for an average duration of more than seven years. It is noteworthy that none of the patientsunder controlled virological condition by a prior NA regimen experienced viral breakthrough during the 96

Page 15/23
weeks after switchover. In contrast, virological response with HBeAg loss was not adequately achieved atweek 96. For those with a low-titer of HBeAg (< 10 S/CO) at baseline, fewer than half experienced HBeAgloss. The rate of HBsAg loss remained very low (approximately 1% annually), and the decline in theqHBsAg levels were small (approximately 0.1 logIU/mL annually). Nevertheless, a lower qHBsAg level atbaseline was signi�cantly associated with a decreased qHBsAg level.
Consistent with our previous study of 48 weeks [17], we did not observe signi�cant positive changes inthe rates of ALT normalization at 96 weeks after switching to TAF. More patients in the prior TDF groupwho had an elevated ALT level at baseline achieved ALT normalization when using the normal rangeproposed by AASLD, similar to a recent report [23]; however, as we noted, those who had higher BMI andcirrhosis were less likely to have an improvement in the ALT level at 96 weeks after adjustment forconfounding factors. The evaluation of non-alcoholic fatty liver disease and steatohepatitis will beimportant in the monitoring of patients with elevated ALT levels.
The high prevalence of renal dysfunction highlights the long-term need for careful monitoring orswitching to TAF from ADF or TDF treatment, as is recommended in the guidelines [3, 4]. Phase 3 clinicaltrials, in which virologically suppressed CHB patients were switched from TDF to TAF, showedimprovements in kidney parameters at week 96 after switching [23]. One of the strengths of this studywas the inclusion of patients with prior ETV or NA combination therapy, all of whom were treated withTAF for at least 96 weeks. In our multivariable GEE analysis that controlled cofounding factors withkidney function, patients of older age and without CKD were less likely to experience positive changes ineGFR. There was no statistically signi�cant trend in eGFR over time for patients with without CKD: thedecrement was approximately 1 mL/min/1.73m2 per year, which is considered to be physiologicalreduction. Instead, the improvement in eGFR for those with CKD should be emphasized because thedecline in eGFR was consistently more in those with lower baseline eGFR. It is also important to note thatthe incremental improvements following switching to TAF peeked between 24 and 48 weeks thendecreased physiologically, but without a statistically signi�cant trend.
Data on the 96 weeks after TAF switchover is currently lacking, so longer-term follow-up will be needed tofully characterize the virological and safety pro�les. In addition to the fact that our patients had beenpreviously treated with ETV or an NA combination, the strengths of this study are that it included manyelderly (65 and over: n = 167) and CKD patients (n = 114), which empowers our interpretation. Moreover,we used GEE modeling, which controls for collinearity across variables, allows a bigger sample size to beexamined, and makes it possible to better evaluate the related factors for improvements of ALT, qHBsAglevel, and eGFR.
This study has several limitations. First, control with a continuing NA groups and data on bone mineraldensity are lacking, as we mentioned previously. These data will be necessary to better determinedifferences in clinical outcomes in future study. However, we have provided the data of 458 patients whohave been treated with TAF for 96 weeks; to our knowledge, this is the largest real-world study ofsequential treatment with TAF. Second, learning the background of or reasons for the switch to TAF for

Page 16/23
each patient would be useful to more deeply understand the outcomes: another report suggested thatpatients who were switched to TAF had better adherence [25]. Last, we have not shown data on the NAdrug resistance pro�le, including LMV, ADF, and ETV. Detailed information regarding the resistance pro�lewould be helpful for the monitoring of intractable cases.
In summary, switching the drug used in HBV treatment to TAF was effective for HBV suppression andcontinued qHBsAg reduction at 96 weeks. The proportion of complete response reached a plateau at 48weeks, irrespective of previous NA regimen. Patients with CKD who were previously treated with TDF oran NA combination had a favorable outcome with an improvement of eGFR within one year of switchoverthat was maintained over the 96 weeks of study.
AbbreviationsCHB, chronic hepatitis B; HCC, hepatocellular carcinoma; NA, nucleos(t)ide analog; ETV, entecavir; TDF,tenofovir disoproxil fumarate; TAF, tenofovir alafenamide; HBsAg, hepatitis B surface antigen; HBV,hepatitis B virus; HIV, human immunode�ciency virus; BMD, bone mineral density; qHBsAg, quantitativehepatitis B surface antigen; eGFR, estimated glomerular �ltration rate; CKD, chronic kidney disease; LAM,lamivudine; ADF, adefovir; ALT, alanine aminotransferase; AASLD, American Association for the Study ofLiver Diseases; GEE, generalized estimating equation; BMI, body mass index; CI, con�dence interval;HBeAg, hepatitis B e antigen.
DeclarationsAuthor contributions:
All authors were involved in the design of the study, acquisition of samples and/or analysis. EO draftedthe manuscript. All authors contributed to the critical discussion of the results and approved the �nalversion of the article.
Con�icts of interest:
EO has received speaker fees from Gilead Sciences and AbbVie. The other authors declare that they haveno con�icts of interest.
Funding:
This study was funded by Gilead Sciences.
References[1] Lozano R, Naghavi M, Foreman K, Lim S, Shibuya K, Aboyans V, et al. Global and regional mortalityfrom 235 causes of death for 20 age groups in 1990 and 2010: a systematic analysis for the GlobalBurden of Disease Study 2010. Lancet 2012; 380: 2095-2128.

Page 17/23
[2] Schweitzer A, Horn J, Mikolajczyk RT, Krause G, Ott JJ. Estimations of worldwide prevalence of chronichepatitis B virus infection: a systematic review of data published between 1965 and 2013. Lancet 2015;386: 1546-1555.
[3] Terrault NA, Lok ASF, McMahon BJ, et al. Update on prevention, diagnosis, and treatment of chronichepatitis B: AASLD 2018 hepatitis B guidance. Hepatology 2018; 67: 1560-1599.
[4] European Association for the Study of the Liver. EASL 2017 Clinical Practice Guidelines on themanagement of hepatitis B virus infection. J Hepatol 2017; 67: 370-398.
[5] Sarin SK, Kumar M, Lau GK, Abbas Z, Chan HL, Chen CJ, et al. Asian-Paci�c clinical practice guidelineson the management of hepatitis B: a 2015 update. Hepatol Int 2016; 10: 1-98.
[6] Lok AS, Zoulim F, Dusheiko G, Ghany MG. Hepatitis B cure: From discovery to regulatory approval. JHepatol 2017; 67: 847-861.
[7] Cornberg M, Lok AS, Terrault NA, Zoulim F; 2019 EASL-AASLD HBV Treatment Endpoints ConferenceFaculty. Guidance for design and endpoints of clinical trials in chronic hepatitis B - Report from the 2019EASL-AASLD HBV Treatment Endpoints Conference‡. J Hepatol 2020; 72: 539-557.
[8] Ogawa E, Furusyo N, Nguyen MH. Tenofovir alafenamide in the treatment of chronic hepatitis B:design, development, and place in therapy. Drug Des Devel Ther 2017; 11: 3197-3204.
[9] Lok AS, McMahon BJ, Brown RS Jr, Wong JB, Ahmed AT, Farah W, Almasri J, Alahdab F, Benkhadra K,Mouchli MA, Singh S, Mohamed EA, Abu Dabrh AM, Prokop LJ, Wang Z, Murad MH, Mohammed K.Antiviral therapy for chronic hepatitis B viral infection in adults: A systematic review and meta-analysis.Hepatology 2016; 63: 284-306.
[10] Woo G, Tomlinson G, Nishikawa Y, Kowgier M, Sherman M, Wong DK, Pham B, Ungar WJ, EinarsonTR, Heathcote EJ, Krahn M. Tenofovir and entecavir are the most effective antiviral agents for chronichepatitis B: a systematic review and Bayesian meta-analyses. Gastroenterology 2010; 139: 1218-1229.
[11] Tang LSY, Covert E, Wilson E, Kottilil S. Chronic Hepatitis B Infection: A Review. JAMA 2018; 319:1802-1813.
[12] Casado JL. Renal and Bone Toxicity with the Use of Tenofovir: Understanding at the End. AIDS Rev2016; 18: 59-68.
[13] Buti M, Tsai N, Petersen J, Flisiak R, Gurel S, Krastev Z, Aguilar Schall R, Flaherty JF, Martins EB,Charuworn P, Kitrinos KM, Subramanian GM, Gane E, Marcellin P. Seven-year e�cacy and safety oftreatment with tenofovir disoproxil fumarate for chronic hepatitis B virus infection. Dig Dis Sci 2015; 60:1457-1464.

Page 18/23
[14] Chan HL, Fung S, Seto WK, et al. Tenofovir alafenamide versus tenofovir disoproxil fumarate for thetreatment of HBeAg-positive chronic hepatitis B virus infection: a randomised, double-blind, phase 3, non-inferiority trial. Lancet Gastroenterol Hepatol 2016; 1: 185-195.
[15] Buti M, Gane E, Seto WK, et al. Tenofovir alafenamide versus tenofovir disoproxil fumarate for thetreatment of patients with HBeAg-negative chronic hepatitis B virus infection: a randomised, double-blind,phase 3, non-inferiority trial. Lancet Gastroenterol Hepatol 2016; 1: 196-206.
[16] Agarwal K, Brunetto M, Seto WK, et al. 96 weeks treatment of tenofovir alafenamide vs. tenofovirdisoproxil fumarate for hepatitis B virus infection. J Hepatol 2018; 68: 672-681.
[17] Ogawa E, Nomura H, Nakamuta M, Furusyo N, Koyanagi T, Dohmen K, Ooho A, Satoh T, Kawano A,Kajiwara E, Takahashi K, Azuma K, Kato M, Shimoda S, Hayashi J. Tenofovir alafenamide after switchingfrom entecavir or nucleos(t)ide combination therapy for patients with chronic hepatitis B. Liver Int 2020;40: 1578-1589.
[18] Matsuo S, Imai E, Horio M, et al. Revised equations for estimated GFR from serum creatinine inJapan. Am J Kidney Dis 2009; 53: 982-992.
[19] Ogawa E, Furusyo N, Murata M, et al. Longitudinal assessment of liver stiffness by transientelastography for chronic hepatitis B patients treated with nucleoside analog. Hepatol Res 2011; 41: 1178-1188.
[20] Wong GL, Chan HL, Mak CW, Lee SK, Ip ZM, Lam AT, Iu HW, Leung JM, Lai JW, Lo AO, Chan HY, WongVW. Entecavir treatment reduces hepatic events and deaths in chronic hepatitis B patients with livercirrhosis. Hepatology 2013; 58: 1537-1547.
[21] Tseng TC, Liu CJ, Yang HC, Su TH, Wang CC, Chen CL, Kuo SF, Liu CH, Chen PJ, Chen DS, Kao JH.High levels of hepatitis B surface antigen increase risk of hepatocellular carcinoma in patients with lowHBV load. Gastroenterology 2012; 142: 1140-1149.
[22] Yip TC, Wong GL, Chan HL, Tse YK, Lam KL, Lui GC, Wong VW. HBsAg seroclearance further reduceshepatocellular carcinoma risk after complete viral suppression with nucleos(t)ide analogues. J Hepatol2019; 70: 361-370.
[23] Chan HLY, Buti M, Agarwal K, et al. Maintenance of high levels of viral suppression and improvedsafety pro�le of tenofovir alafenamide relative to tenofovir disoproxil fumarate in chronic hepatitis Bpatients treated for 5 years in 2 ongoing phase 3 studies. Hepatology 2020; 72: 490A.
[24] Coresh J, Turin TC, Matsushita K, Sang Y, Ballew SH, Appel LJ, Arima H, Chadban SJ, Cirillo M,Djurdjev O, Green JA, Heine GH, Inker LA, Irie F, Ishani A, Ix JH, Kovesdy CP, Marks A, Ohkubo T, Shalev V,Shankar A, Wen CP, de Jong PE, Iseki K, Stengel B, Gansevoort RT, Levey AS. Decline in estimated

Page 19/23
glomerular �ltration rate and subsequent risk of end-stage renal disease and mortality. JAMA 2014; 311:2518-2531.
[25] Tamaki N, Kurosaki M, Nakanishi H, Itakura J, Inada K, Kirino S, Yamashita K, Osawa L, Sekiguchi S,Hayakawa Y, Wang W, Okada M, Higuchi M, Takaura K, Maeyashiki C, Kaneko S, Yasui Y, Tsuchiya K,Takahashi Y, Izumi N. Comparison of medication adherence and satisfaction between entecavir andtenofovir alafenamide therapy in chronic hepatitis B. J Med Virol 2020; 92: 1355-1358.
Figures

Page 20/23
Figure 1
Longitudinal change in (a) ALT, (b) qHBsAg level, (c) eGFR, and (d) serum phosphorus level from baselineto 96 weeks after switching from ETV to TAF. Bars are expressed as mean ± standard deviation. ALT,alanine aminotransferase; qHBsAg, quantitative hepatitis B surface antigen; eGFR, estimated glomerular�ltration rate; ETV, entecavir; TAF, tenofovir alafenamide.

Page 21/23
Figure 2
Longitudinal change in (a) ALT, (b) qHBsAg level, (c) eGFR, and (d) serum phosphorus level from baselineto 96 weeks after switching from TDF to TAF. Bars are expressed as mean ± standard deviation. ALT,alanine aminotransferase; qHBsAg, quantitative hepatitis B surface antigen; eGFR, estimated glomerular�ltration rate; TDF, tenofovir disoproxil fumarate; TAF, tenofovir alafenamide.

Page 22/23
Figure 3
Longitudinal change in (a) ALT, (b) qHBsAg level, (c) eGFR, and (d) serum phosphorus level from baselineto 96 weeks after switching from NA combination to TAF. Bars are expressed as mean ± standarddeviation. ALT, alanine aminotransferase; qHBsAg, quantitative hepatitis B surface antigen; eGFR,estimated glomerular �ltration rate; NA, nucleos(t)ide analog; TAF, tenofovir alafenamide.

Page 23/23
Supplementary Files
This is a list of supplementary �les associated with this preprint. Click to download.
KULDSHBVTAFswitch96wSuppleTableHepatInt.docx