weblogic km
TRANSCRIPT

PATROL® for BEA WebLogicUser Guide
Supporting
PATROL for BEA WebLogic 2.7.00
January 2008

Contacting BMC Software
You can access the BMC Software website at http://www.bmc.com. From this website, you can obtain information about the company, its products, corporate offices, special events, and career opportunities.
United States and Canada
Address BMC SOFTWARE INC2101 CITYWEST BLVDHOUSTON TX 77042-2827 USA
Telephone 713 918 8800 or800 841 2031
Fax 713 918 8000
Outside United States and Canada
Telephone (01) 713 918 8800 Fax (01) 713 918 8000
Copyright January 2008 BMC Software, Inc., as an unpublished work. All rights reserved.
BMC, BMC Software, and the BMC Software logo are the exclusive properties of BMC Software, Inc., are registered with the U.S. Patent and Trademark Office, and may be registered or pending registration in other countries. All other BMC trademarks, service marks, and logos may be registered or pending registration in the U.S. or in other countries. All other trademarks or registered trademarks are the property of their respective owners.
All other trademarks belong to their respective companies.
BMC Software considers information included in this documentation to be proprietary and confidential. Your use of this information is subject to the terms and conditions of the applicable End User License Agreement for the product and the proprietary and restricted rights notices included in this documentation.
Restricted rights legend
U.S. Government Restricted Rights to Computer Software. UNPUBLISHED -- RIGHTS RESERVED UNDER THE COPYRIGHT LAWS OF THE UNITED STATES. Use, duplication, or disclosure of any data and computer software by the U.S. Government is subject to restrictions, as applicable, set forth in FAR Section 52.227-14, DFARS 252.227-7013, DFARS 252.227-7014, DFARS 252.227-7015, and DFARS 252.227-7025, as amended from time to time. Contractor/Manufacturer is BMC SOFTWARE INC, 2101 CITYWEST BLVD, HOUSTON TX 77042-2827, USA. Any contract notices should be sent to this address.

3
Customer support
You can obtain technical support by using the BMC Software Customer Support website or by contacting Customer Support by telephone or e-mail. To expedite your inquiry, see “Before contacting BMC.”
Support website
You can obtain technical support from BMC 24 hours a day, 7 days a week at http://www.bmc.com/support_home. From this website, you can
■ read overviews about support services and programs that BMC offers■ find the most current information about BMC products■ search a database for issues similar to yours and possible solutions■ order or download product documentation■ download products and maintenance■ report an issue or ask a question■ subscribe to receive proactive e-mail alerts when new product notices are released■ find worldwide BMC support center locations and contact information, including e-mail addresses, fax numbers, and
telephone numbers
Support by telephone or e-mail
In the United States and Canada, if you need technical support and do not have access to the web, call 800 537 1813 or send an e-mail message to [email protected]. (In the subject line, enter SupID:<yourSupportContractID>, such as SupID:12345). Outside the United States and Canada, contact your local support center for assistance.
Before contacting BMC
Have the following information available so that Customer Support can begin working on your issue immediately:
■ product information
— product name— product version (release number)— license number and password (trial or permanent)
■ operating system and environment information
— machine type— operating system type, version, and service pack or other maintenance level such as PUT or PTF— system hardware configuration— serial numbers— related software (database, application, and communication) including type, version, and service pack or
maintenance level
■ sequence of events leading to the issue
■ commands and options that you used
■ messages received (and the time and date that you received them)
— product error messages— messages from the operating system, such as file system full— messages from related software

4 PATROL for BEA WebLogic User Guide
ContentsChapter 1 Product components and capabilities 19
PATROL for BEA WebLogic features . . . . . . . . . . . . . . . . . . . . . . . . . . . . . . . . . . . . . . . . 20Server management. . . . . . . . . . . . . . . . . . . . . . . . . . . . . . . . . . . . . . . . . . . . . . . . . . . . 20Web services management. . . . . . . . . . . . . . . . . . . . . . . . . . . . . . . . . . . . . . . . . . . . . . 21Portal server management . . . . . . . . . . . . . . . . . . . . . . . . . . . . . . . . . . . . . . . . . . . . . . 21Integration server management . . . . . . . . . . . . . . . . . . . . . . . . . . . . . . . . . . . . . . . . . 21Clustering support . . . . . . . . . . . . . . . . . . . . . . . . . . . . . . . . . . . . . . . . . . . . . . . . . . . . 21J2EE performance . . . . . . . . . . . . . . . . . . . . . . . . . . . . . . . . . . . . . . . . . . . . . . . . . . . . . 21JVM profiling . . . . . . . . . . . . . . . . . . . . . . . . . . . . . . . . . . . . . . . . . . . . . . . . . . . . . . . . . 22JMX MBean monitoring . . . . . . . . . . . . . . . . . . . . . . . . . . . . . . . . . . . . . . . . . . . . . . . . 22Log file monitoring . . . . . . . . . . . . . . . . . . . . . . . . . . . . . . . . . . . . . . . . . . . . . . . . . . . . 22Response time probe . . . . . . . . . . . . . . . . . . . . . . . . . . . . . . . . . . . . . . . . . . . . . . . . . . . 23Component monitoring . . . . . . . . . . . . . . . . . . . . . . . . . . . . . . . . . . . . . . . . . . . . . . . . 24
Product architecture . . . . . . . . . . . . . . . . . . . . . . . . . . . . . . . . . . . . . . . . . . . . . . . . . . . . . . 25Application classes and icons . . . . . . . . . . . . . . . . . . . . . . . . . . . . . . . . . . . . . . . . . . . . . . 28
Application class icons and functions . . . . . . . . . . . . . . . . . . . . . . . . . . . . . . . . . . . . 29Application instance naming conventions. . . . . . . . . . . . . . . . . . . . . . . . . . . . . . . . . 37
Where to Go from Here. . . . . . . . . . . . . . . . . . . . . . . . . . . . . . . . . . . . . . . . . . . . . . . . . . . . 39
Chapter 2 Installing and migrating PATROL for BEA WebLogic 41
Installation requirements . . . . . . . . . . . . . . . . . . . . . . . . . . . . . . . . . . . . . . . . . . . . . . . . . . 42Performance and scalability. . . . . . . . . . . . . . . . . . . . . . . . . . . . . . . . . . . . . . . . . . . . . 42License. . . . . . . . . . . . . . . . . . . . . . . . . . . . . . . . . . . . . . . . . . . . . . . . . . . . . . . . . . . . . . . 43Installation account . . . . . . . . . . . . . . . . . . . . . . . . . . . . . . . . . . . . . . . . . . . . . . . . . . . . 43
Preparing to install. . . . . . . . . . . . . . . . . . . . . . . . . . . . . . . . . . . . . . . . . . . . . . . . . . . . . . . . 44Security Requirements . . . . . . . . . . . . . . . . . . . . . . . . . . . . . . . . . . . . . . . . . . . . . . . . . 44Installation prerequisites . . . . . . . . . . . . . . . . . . . . . . . . . . . . . . . . . . . . . . . . . . . . . . . 44Default and custom installation types . . . . . . . . . . . . . . . . . . . . . . . . . . . . . . . . . . . . 48Remotely versus locally managed servers. . . . . . . . . . . . . . . . . . . . . . . . . . . . . . . . . 51
Installing PATROL for BEA WebLogic. . . . . . . . . . . . . . . . . . . . . . . . . . . . . . . . . . . . . . . 52Typical new installation . . . . . . . . . . . . . . . . . . . . . . . . . . . . . . . . . . . . . . . . . . . . . . . . 52
Upgrading from an earlier version . . . . . . . . . . . . . . . . . . . . . . . . . . . . . . . . . . . . . . . . . . 55Removing previous profiling and instrumentation libraries . . . . . . . . . . . . . . . . . 55Automatic migration of console and agent customizations . . . . . . . . . . . . . . . . . . 58Determining whether you can migrate KM customizations. . . . . . . . . . . . . . . . . . 58Conditions for upgrading. . . . . . . . . . . . . . . . . . . . . . . . . . . . . . . . . . . . . . . . . . . . . . . 59Determining the location of PATROL . . . . . . . . . . . . . . . . . . . . . . . . . . . . . . . . . . . . 59
Upgrade scenarios for PATROL for BEA WebLogic . . . . . . . . . . . . . . . . . . . . . . . . . . . 61Upgrading without saving KM customizations . . . . . . . . . . . . . . . . . . . . . . . . . . . . 63
Contents 5
Upgrading and preserving KM customizations . . . . . . . . . . . . . . . . . . . . . . . . . . . . 63Migrating your KM customizations . . . . . . . . . . . . . . . . . . . . . . . . . . . . . . . . . . . . . . 64Preparing to upgrade. . . . . . . . . . . . . . . . . . . . . . . . . . . . . . . . . . . . . . . . . . . . . . . . . . . 64Migrating customizations with the PATROL migration tools . . . . . . . . . . . . . . . . 65Creating an installation package of the merged PATROL for BEA WebLogic. . . 72Removing files from the PATROL_CACHE directories . . . . . . . . . . . . . . . . . . . . . 73Migrating customizations manually . . . . . . . . . . . . . . . . . . . . . . . . . . . . . . . . . . . . . . 73
Importing into a distribution tool . . . . . . . . . . . . . . . . . . . . . . . . . . . . . . . . . . . . . . . . . . . 74Distribution Server. . . . . . . . . . . . . . . . . . . . . . . . . . . . . . . . . . . . . . . . . . . . . . . . . . . . . 75Importing into the Distribution Server . . . . . . . . . . . . . . . . . . . . . . . . . . . . . . . . . . . . 75Installing by using the Distribution Server . . . . . . . . . . . . . . . . . . . . . . . . . . . . . . . . 76
Considerations for using online Help . . . . . . . . . . . . . . . . . . . . . . . . . . . . . . . . . . . . . . . . 77Browser version required for viewing PATROL Console for Unix Help . . . . . . . 77Additional considerations for using online Help for Unix . . . . . . . . . . . . . . . . . . . 78
Uninstalling PATROL for BEA WebLogic . . . . . . . . . . . . . . . . . . . . . . . . . . . . . . . . . . . . 80Determining the version of the installation utility . . . . . . . . . . . . . . . . . . . . . . . . . . 80Other information to know before uninstalling PATROL for BEA WebLogic . . . 80Uninstalling PATROL for BEA WebLogic on Unix . . . . . . . . . . . . . . . . . . . . . . . . . 81Uninstalling all products on Unix preserving customizations . . . . . . . . . . . . . . . . 82Uninstalling all products on Unix without preserving customizations . . . . . . . . 83Uninstalling PATROL for BEA WebLogic on Windows . . . . . . . . . . . . . . . . . . . . . 85Uninstalling all products on Windows preserving customizations . . . . . . . . . . . . 86Uninstalling all products on Windows without preserving customizations . . . . 87
Where to go from here . . . . . . . . . . . . . . . . . . . . . . . . . . . . . . . . . . . . . . . . . . . . . . . . . . . . . 89
Chapter 3 Configuring PATROL for BEA WebLogic 91
Loading PATROL for BEA WebLogic . . . . . . . . . . . . . . . . . . . . . . . . . . . . . . . . . . . . . . . . 92Configuring the KM . . . . . . . . . . . . . . . . . . . . . . . . . . . . . . . . . . . . . . . . . . . . . . . . . . . . . . . 93
Registering a server . . . . . . . . . . . . . . . . . . . . . . . . . . . . . . . . . . . . . . . . . . . . . . . . . . . . 93Updating the registration of a server . . . . . . . . . . . . . . . . . . . . . . . . . . . . . . . . . . . . 101
Enabling and disabling instrumentation and profiling features . . . . . . . . . . . . . . . . . 106Deciding what to enable: added value by feature. . . . . . . . . . . . . . . . . . . . . . . . . . 106Turning on instrumentation or JVM performance monitoring. . . . . . . . . . . . . . . 111Disabling instrumentation or JVM performance monitoring . . . . . . . . . . . . . . . . 114Removing instrumentation or JVM performance monitoring . . . . . . . . . . . . . . . 115Enabling method-level profiling . . . . . . . . . . . . . . . . . . . . . . . . . . . . . . . . . . . . . . . . 116Disabling method-level profiling. . . . . . . . . . . . . . . . . . . . . . . . . . . . . . . . . . . . . . . . 117Activating JVM thread objects collection . . . . . . . . . . . . . . . . . . . . . . . . . . . . . . . . . 117Deactivating JVM thread objects collection . . . . . . . . . . . . . . . . . . . . . . . . . . . . . . . 118Stopping the monitoring of classes . . . . . . . . . . . . . . . . . . . . . . . . . . . . . . . . . . . . . . 118
Verifying and troubleshooting WebLogic Server configuration . . . . . . . . . . . . . . . . . 119Where to go from here . . . . . . . . . . . . . . . . . . . . . . . . . . . . . . . . . . . . . . . . . . . . . . . . . . . . 122
Chapter 4 Managing the BEA WebLogic environment 123
Monitoring a WebLogic environment . . . . . . . . . . . . . . . . . . . . . . . . . . . . . . . . . . . . . . . 124Working with parameters . . . . . . . . . . . . . . . . . . . . . . . . . . . . . . . . . . . . . . . . . . . . . . . . . 124Working with events . . . . . . . . . . . . . . . . . . . . . . . . . . . . . . . . . . . . . . . . . . . . . . . . . . . . . 125
Managing event triggers to work with other products . . . . . . . . . . . . . . . . . . . . . 126
6 PATROL for BEA WebLogic User Guide

Managing events using PEM . . . . . . . . . . . . . . . . . . . . . . . . . . . . . . . . . . . . . . . . . . . 127Estimating response times . . . . . . . . . . . . . . . . . . . . . . . . . . . . . . . . . . . . . . . . . . . . . . . . 128
Testing file transfer rate . . . . . . . . . . . . . . . . . . . . . . . . . . . . . . . . . . . . . . . . . . . . . . . 129Testing web page response . . . . . . . . . . . . . . . . . . . . . . . . . . . . . . . . . . . . . . . . . . . . 129Administering Probe. . . . . . . . . . . . . . . . . . . . . . . . . . . . . . . . . . . . . . . . . . . . . . . . . . 130
Generating reports . . . . . . . . . . . . . . . . . . . . . . . . . . . . . . . . . . . . . . . . . . . . . . . . . . . . . . . 131
Chapter 5 Managing clusters and servers 137
Managing WebLogic Servers . . . . . . . . . . . . . . . . . . . . . . . . . . . . . . . . . . . . . . . . . . . . . . 138Booting a WebLogic Server . . . . . . . . . . . . . . . . . . . . . . . . . . . . . . . . . . . . . . . . . . . . 138Shutting down a WebLogic Server . . . . . . . . . . . . . . . . . . . . . . . . . . . . . . . . . . . . . . 139Locking or unlocking a server . . . . . . . . . . . . . . . . . . . . . . . . . . . . . . . . . . . . . . . . . . 140Performing Java garbage collection . . . . . . . . . . . . . . . . . . . . . . . . . . . . . . . . . . . . . 141Tuning a server configuration . . . . . . . . . . . . . . . . . . . . . . . . . . . . . . . . . . . . . . . . . . 141Identifying processes with high CPU usage . . . . . . . . . . . . . . . . . . . . . . . . . . . . . . 143
Monitoring and managing a single managed server . . . . . . . . . . . . . . . . . . . . . . . . . . 144Managing the node manager . . . . . . . . . . . . . . . . . . . . . . . . . . . . . . . . . . . . . . . . . . . . . . 146
Chapter 6 Managing portal servers 149
Managing WebLogic portal servers . . . . . . . . . . . . . . . . . . . . . . . . . . . . . . . . . . . . . . . . 150Tuning a cache . . . . . . . . . . . . . . . . . . . . . . . . . . . . . . . . . . . . . . . . . . . . . . . . . . . . . . . 150Flushing a cache. . . . . . . . . . . . . . . . . . . . . . . . . . . . . . . . . . . . . . . . . . . . . . . . . . . . . . 151Suspending cache monitoring . . . . . . . . . . . . . . . . . . . . . . . . . . . . . . . . . . . . . . . . . . 151Resuming cache monitoring . . . . . . . . . . . . . . . . . . . . . . . . . . . . . . . . . . . . . . . . . . . 152
Chapter 7 Managing WebLogic components and services 153
Configuring WebLogic components . . . . . . . . . . . . . . . . . . . . . . . . . . . . . . . . . . . . . . . . 154Configuring the JTA . . . . . . . . . . . . . . . . . . . . . . . . . . . . . . . . . . . . . . . . . . . . . . . . . . 154Configuring the JMS . . . . . . . . . . . . . . . . . . . . . . . . . . . . . . . . . . . . . . . . . . . . . . . . . . 155
Managing JDBC pools . . . . . . . . . . . . . . . . . . . . . . . . . . . . . . . . . . . . . . . . . . . . . . . . . . . . 157Creating a JDBC pool . . . . . . . . . . . . . . . . . . . . . . . . . . . . . . . . . . . . . . . . . . . . . . . . . 157Removing a JDBC pool . . . . . . . . . . . . . . . . . . . . . . . . . . . . . . . . . . . . . . . . . . . . . . . . 160Administering JDBC pools. . . . . . . . . . . . . . . . . . . . . . . . . . . . . . . . . . . . . . . . . . . . . 160Enabling or disabling JDBC profiling. . . . . . . . . . . . . . . . . . . . . . . . . . . . . . . . . . . . 162Generating JDBC profiling reports . . . . . . . . . . . . . . . . . . . . . . . . . . . . . . . . . . . . . . 162Configuring the JDBC . . . . . . . . . . . . . . . . . . . . . . . . . . . . . . . . . . . . . . . . . . . . . . . . . 163
Monitoring web services . . . . . . . . . . . . . . . . . . . . . . . . . . . . . . . . . . . . . . . . . . . . . . . . . . 164Resetting statistics . . . . . . . . . . . . . . . . . . . . . . . . . . . . . . . . . . . . . . . . . . . . . . . . . . . . 164Monitoring service operations. . . . . . . . . . . . . . . . . . . . . . . . . . . . . . . . . . . . . . . . . . 165Monitoring operation handlers . . . . . . . . . . . . . . . . . . . . . . . . . . . . . . . . . . . . . . . . . 165Stopping the monitoring of handlers or operations . . . . . . . . . . . . . . . . . . . . . . . . 166
Managing applications . . . . . . . . . . . . . . . . . . . . . . . . . . . . . . . . . . . . . . . . . . . . . . . . . . . 166Automatically deploying domain applications . . . . . . . . . . . . . . . . . . . . . . . . . . . 167Deploying and undeploying applications to servers . . . . . . . . . . . . . . . . . . . . . . . 168Selecting a servlet to monitor. . . . . . . . . . . . . . . . . . . . . . . . . . . . . . . . . . . . . . . . . . . 169Stopping the monitoring of a servlet . . . . . . . . . . . . . . . . . . . . . . . . . . . . . . . . . . . . 170
Contents 7
Chapter 8 Managing integration servers 171
Managing processes . . . . . . . . . . . . . . . . . . . . . . . . . . . . . . . . . . . . . . . . . . . . . . . . . . . . . . 172Specifying a monitoring Java Process Definition (JPD) . . . . . . . . . . . . . . . . . . . . . 172Forcing archiving . . . . . . . . . . . . . . . . . . . . . . . . . . . . . . . . . . . . . . . . . . . . . . . . . . . . . 173Configuring an SLA for a business process . . . . . . . . . . . . . . . . . . . . . . . . . . . . . . . 173Administering a process . . . . . . . . . . . . . . . . . . . . . . . . . . . . . . . . . . . . . . . . . . . . . . . 174Stopping the monitoring of a process . . . . . . . . . . . . . . . . . . . . . . . . . . . . . . . . . . . . 175
Chapter 9 Instrumenting and profiling J2EE components 177
Instrumenting and profiling J2EE objects . . . . . . . . . . . . . . . . . . . . . . . . . . . . . . . . . . . . 178Using instrumentation to monitor the most critical SQL objects . . . . . . . . . . . . . . . . 178
Running the Top N SQL report . . . . . . . . . . . . . . . . . . . . . . . . . . . . . . . . . . . . . . . . . 178Monitoring SQL objects . . . . . . . . . . . . . . . . . . . . . . . . . . . . . . . . . . . . . . . . . . . . . . . 180
Using instrumentation monitor the most critical EJBs . . . . . . . . . . . . . . . . . . . . . . . . . 181Running the Top N EJB or Top N EJB Methods report . . . . . . . . . . . . . . . . . . . . . 181Monitoring EJB methods . . . . . . . . . . . . . . . . . . . . . . . . . . . . . . . . . . . . . . . . . . . . . . 183
Using instrumentation to monitor the most critical application servlets. . . . . . . . . . 184Running the Top N WebApps report . . . . . . . . . . . . . . . . . . . . . . . . . . . . . . . . . . . . 184Running the Top N Servlets report . . . . . . . . . . . . . . . . . . . . . . . . . . . . . . . . . . . . . . 186Monitoring servlets to the method level. . . . . . . . . . . . . . . . . . . . . . . . . . . . . . . . . . 187
Profiling the Java virtual machine . . . . . . . . . . . . . . . . . . . . . . . . . . . . . . . . . . . . . . . . . . 188Running a thread detail report. . . . . . . . . . . . . . . . . . . . . . . . . . . . . . . . . . . . . . . . . . 188
Chapter 10 Managing JMX-instrumented applications 191
Monitoring JMX MBeans . . . . . . . . . . . . . . . . . . . . . . . . . . . . . . . . . . . . . . . . . . . . . . . . . . 192Instrumenting your application with JMX. . . . . . . . . . . . . . . . . . . . . . . . . . . . . . . . 192The PATROL for BEA WebLogic MBean interface. . . . . . . . . . . . . . . . . . . . . . . . . 193Activating JMX monitoring . . . . . . . . . . . . . . . . . . . . . . . . . . . . . . . . . . . . . . . . . . . . 193Setting default e-mail address for notifications. . . . . . . . . . . . . . . . . . . . . . . . . . . . 194Defining conditions for monitoring JMX MBeans . . . . . . . . . . . . . . . . . . . . . . . . . 195Adding automatic actions. . . . . . . . . . . . . . . . . . . . . . . . . . . . . . . . . . . . . . . . . . . . . . 200Adding e-mail notifications . . . . . . . . . . . . . . . . . . . . . . . . . . . . . . . . . . . . . . . . . . . . 202
Advanced features for JMX monitoring . . . . . . . . . . . . . . . . . . . . . . . . . . . . . . . . . . . . . 203Manually registering an MBean. . . . . . . . . . . . . . . . . . . . . . . . . . . . . . . . . . . . . . . . . 204Defining conditions for an unregistered MBean . . . . . . . . . . . . . . . . . . . . . . . . . . . 205Setting JMX debug flags . . . . . . . . . . . . . . . . . . . . . . . . . . . . . . . . . . . . . . . . . . . . . . . 206
Understanding condition settings and the ConditionDef configuration variable . . 207
Chapter 11 Working with log files 211
Understanding logs . . . . . . . . . . . . . . . . . . . . . . . . . . . . . . . . . . . . . . . . . . . . . . . . . . . . . . 212Rotation . . . . . . . . . . . . . . . . . . . . . . . . . . . . . . . . . . . . . . . . . . . . . . . . . . . . . . . . . . . . . 212Severity . . . . . . . . . . . . . . . . . . . . . . . . . . . . . . . . . . . . . . . . . . . . . . . . . . . . . . . . . . . . . 212
Managing log files . . . . . . . . . . . . . . . . . . . . . . . . . . . . . . . . . . . . . . . . . . . . . . . . . . . . . . . 213Selecting a log file for monitoring . . . . . . . . . . . . . . . . . . . . . . . . . . . . . . . . . . . . . . . 213Configuring the domain log . . . . . . . . . . . . . . . . . . . . . . . . . . . . . . . . . . . . . . . . . . . . 214Configuring the server log . . . . . . . . . . . . . . . . . . . . . . . . . . . . . . . . . . . . . . . . . . . . . 215Configuring the JDBC log . . . . . . . . . . . . . . . . . . . . . . . . . . . . . . . . . . . . . . . . . . . . . . 216
8 PATROL for BEA WebLogic User Guide
Configuring the HTTP log . . . . . . . . . . . . . . . . . . . . . . . . . . . . . . . . . . . . . . . . . . . . . 217Configuring the transaction log. . . . . . . . . . . . . . . . . . . . . . . . . . . . . . . . . . . . . . . . . 219Defining sniff patterns . . . . . . . . . . . . . . . . . . . . . . . . . . . . . . . . . . . . . . . . . . . . . . . . 220Stopping the monitoring of a log file . . . . . . . . . . . . . . . . . . . . . . . . . . . . . . . . . . . . 222Viewing a log file . . . . . . . . . . . . . . . . . . . . . . . . . . . . . . . . . . . . . . . . . . . . . . . . . . . . . 223Watching a log file. . . . . . . . . . . . . . . . . . . . . . . . . . . . . . . . . . . . . . . . . . . . . . . . . . . . 224Viewing sniff patterns. . . . . . . . . . . . . . . . . . . . . . . . . . . . . . . . . . . . . . . . . . . . . . . . . 225Turning off and restarting sniff patterns . . . . . . . . . . . . . . . . . . . . . . . . . . . . . . . . . 225Changing the sniff type . . . . . . . . . . . . . . . . . . . . . . . . . . . . . . . . . . . . . . . . . . . . . . . 226Updating a log file location . . . . . . . . . . . . . . . . . . . . . . . . . . . . . . . . . . . . . . . . . . . . 226Registering for log notification messages . . . . . . . . . . . . . . . . . . . . . . . . . . . . . . . . 227Unregistering for log notification messages . . . . . . . . . . . . . . . . . . . . . . . . . . . . . . 228
Chapter 12 Administering the KM 229
Monitoring WebLogic across the enterprise . . . . . . . . . . . . . . . . . . . . . . . . . . . . . . . . . 230Tuning KM performance . . . . . . . . . . . . . . . . . . . . . . . . . . . . . . . . . . . . . . . . . . . . . . . . . 230
Selecting servers for monitoring . . . . . . . . . . . . . . . . . . . . . . . . . . . . . . . . . . . . . . . . 231Deselecting servers from monitoring . . . . . . . . . . . . . . . . . . . . . . . . . . . . . . . . . . . . 232Selecting components for monitoring . . . . . . . . . . . . . . . . . . . . . . . . . . . . . . . . . . . 233Deselecting components from monitoring . . . . . . . . . . . . . . . . . . . . . . . . . . . . . . . 234Scheduling PATROL parameter discovery for configured WebLogic objects . . 235Scheduling blackout periods . . . . . . . . . . . . . . . . . . . . . . . . . . . . . . . . . . . . . . . . . . . 235Restarting PATROL’s Java collector . . . . . . . . . . . . . . . . . . . . . . . . . . . . . . . . . . . . . 237
Troubleshooting and debugging . . . . . . . . . . . . . . . . . . . . . . . . . . . . . . . . . . . . . . . . . . . 237Setting PSL debug flag . . . . . . . . . . . . . . . . . . . . . . . . . . . . . . . . . . . . . . . . . . . . . . . . 238Setting debug status for a server . . . . . . . . . . . . . . . . . . . . . . . . . . . . . . . . . . . . . . . . 240Setting debug status for Java collector . . . . . . . . . . . . . . . . . . . . . . . . . . . . . . . . . . . 241Recording data . . . . . . . . . . . . . . . . . . . . . . . . . . . . . . . . . . . . . . . . . . . . . . . . . . . . . . . 241Gathering information for support . . . . . . . . . . . . . . . . . . . . . . . . . . . . . . . . . . . . . . 242
Appendix A Accessing menu commands, InfoBoxes, and online Help 245
Accessing KM commands and InfoBoxes . . . . . . . . . . . . . . . . . . . . . . . . . . . . . . . . . . . 246Accessing online Help . . . . . . . . . . . . . . . . . . . . . . . . . . . . . . . . . . . . . . . . . . . . . . . . . . . . 247
Appendix B Parameter reference 249
Parameters for a WebLogic environment. . . . . . . . . . . . . . . . . . . . . . . . . . . . . . . . . . . . 249Column headings defined . . . . . . . . . . . . . . . . . . . . . . . . . . . . . . . . . . . . . . . . . . . . . 250Abbreviations defined . . . . . . . . . . . . . . . . . . . . . . . . . . . . . . . . . . . . . . . . . . . . . . . . 252
Collector-consumer dependencies. . . . . . . . . . . . . . . . . . . . . . . . . . . . . . . . . . . . . . . . . . 292
Appendix C Menu summary 307
About menu commands . . . . . . . . . . . . . . . . . . . . . . . . . . . . . . . . . . . . . . . . . . . . . . . . . . 309BEAWLI_INTEGRATION application menu . . . . . . . . . . . . . . . . . . . . . . . . . . . . . . . . 309BEAWLI_PROCESS application menu . . . . . . . . . . . . . . . . . . . . . . . . . . . . . . . . . . . . . . 310BEAWLP_CACHE application menu . . . . . . . . . . . . . . . . . . . . . . . . . . . . . . . . . . . . . . . 310BEAWLP_PORTAL application menu . . . . . . . . . . . . . . . . . . . . . . . . . . . . . . . . . . . . . . 311BEAWLS_DBURL application menu . . . . . . . . . . . . . . . . . . . . . . . . . . . . . . . . . . . . . . . 311
Contents 9
BEAWLS_EJB_HOME application menu . . . . . . . . . . . . . . . . . . . . . . . . . . . . . . . . . . . . 312BEAWLS_EJB_METHOD application menu . . . . . . . . . . . . . . . . . . . . . . . . . . . . . . . . . 312BEAWLS_EXEC_QUEUE application menu . . . . . . . . . . . . . . . . . . . . . . . . . . . . . . . . . 313BEAWLS_JDBC application menu. . . . . . . . . . . . . . . . . . . . . . . . . . . . . . . . . . . . . . . . . . 313BEAWLS_JMS_DESTINATION application menu . . . . . . . . . . . . . . . . . . . . . . . . . . . . 315BEAWLS_JMSSERVER application menu . . . . . . . . . . . . . . . . . . . . . . . . . . . . . . . . . . . 316BEAWLS_JROCKIT application menu . . . . . . . . . . . . . . . . . . . . . . . . . . . . . . . . . . . . . . 316BEAWLS_JVMPROFILER application menu . . . . . . . . . . . . . . . . . . . . . . . . . . . . . . . . . 317BEAWLS_J2EE_APPS application menu . . . . . . . . . . . . . . . . . . . . . . . . . . . . . . . . . . . . 317BEAWLS_LOCAL_MANAGED application menu. . . . . . . . . . . . . . . . . . . . . . . . . . . . 318BEAWLS_LOG application menu . . . . . . . . . . . . . . . . . . . . . . . . . . . . . . . . . . . . . . . . . . 320BEAWLS_MANAGED application menu. . . . . . . . . . . . . . . . . . . . . . . . . . . . . . . . . . . . 321BEAWLS_PROBE application menu . . . . . . . . . . . . . . . . . . . . . . . . . . . . . . . . . . . . . . . . 322BEAWLS_PROF_CLASS application menu . . . . . . . . . . . . . . . . . . . . . . . . . . . . . . . . . . 323BEAWLS_OS application menu . . . . . . . . . . . . . . . . . . . . . . . . . . . . . . . . . . . . . . . . . . . . 323BEAWLS_SERVER application menu . . . . . . . . . . . . . . . . . . . . . . . . . . . . . . . . . . . . . . 324BEAWLS_SERVLET application menu . . . . . . . . . . . . . . . . . . . . . . . . . . . . . . . . . . . . . . 329BEAWLS_SETUP application menu . . . . . . . . . . . . . . . . . . . . . . . . . . . . . . . . . . . . . . . . 329BEAWLS_SQL application menu. . . . . . . . . . . . . . . . . . . . . . . . . . . . . . . . . . . . . . . . . . . 330BEAWLS_THREADPOOL application menu . . . . . . . . . . . . . . . . . . . . . . . . . . . . . . . . 331BEAWLS_WEBAPP application menu . . . . . . . . . . . . . . . . . . . . . . . . . . . . . . . . . . . . . . 332BEAWLS_WS application menu . . . . . . . . . . . . . . . . . . . . . . . . . . . . . . . . . . . . . . . . . . . 332BEAWLS_WS_HDL application menu . . . . . . . . . . . . . . . . . . . . . . . . . . . . . . . . . . . . . . 333BEAWLS_WS_OPER application menu . . . . . . . . . . . . . . . . . . . . . . . . . . . . . . . . . . . . . 333JMX_CONDITION application menu . . . . . . . . . . . . . . . . . . . . . . . . . . . . . . . . . . . . . . . 334JMX_DOMAIN application menu . . . . . . . . . . . . . . . . . . . . . . . . . . . . . . . . . . . . . . . . . . 334JMX_MAIN application menu . . . . . . . . . . . . . . . . . . . . . . . . . . . . . . . . . . . . . . . . . . . . . 335JMX_SERVER application menu . . . . . . . . . . . . . . . . . . . . . . . . . . . . . . . . . . . . . . . . . . . 336
Appendix D InfoBox Summary 337
About InfoBoxes . . . . . . . . . . . . . . . . . . . . . . . . . . . . . . . . . . . . . . . . . . . . . . . . . . . . . . . . . 339BEAWLI_INTEGRATION InfoBox . . . . . . . . . . . . . . . . . . . . . . . . . . . . . . . . . . . . . . . . . 339BEAWLI_PROCESS InfoBox. . . . . . . . . . . . . . . . . . . . . . . . . . . . . . . . . . . . . . . . . . . . . . . 340BEAWLP_CACHE InfoBox. . . . . . . . . . . . . . . . . . . . . . . . . . . . . . . . . . . . . . . . . . . . . . . . 341BEAWLP_PORTAL InfoBox . . . . . . . . . . . . . . . . . . . . . . . . . . . . . . . . . . . . . . . . . . . . . . . 341BEAWLS_CLUSTER InfoBox . . . . . . . . . . . . . . . . . . . . . . . . . . . . . . . . . . . . . . . . . . . . . . 341BEAWLS_DBURL InfoBox . . . . . . . . . . . . . . . . . . . . . . . . . . . . . . . . . . . . . . . . . . . . . . . . 342BEAWLS_EJB InfoBox . . . . . . . . . . . . . . . . . . . . . . . . . . . . . . . . . . . . . . . . . . . . . . . . . . . . 342BEAWLS_EJB_HOME InfoBox. . . . . . . . . . . . . . . . . . . . . . . . . . . . . . . . . . . . . . . . . . . . . 343BEAWLS_EJB_METHOD InfoBox . . . . . . . . . . . . . . . . . . . . . . . . . . . . . . . . . . . . . . . . . . 343BEAWLS_EXEC_QUEUE InfoBox . . . . . . . . . . . . . . . . . . . . . . . . . . . . . . . . . . . . . . . . . . 344BEAWLS_JCA InfoBox . . . . . . . . . . . . . . . . . . . . . . . . . . . . . . . . . . . . . . . . . . . . . . . . . . . 344BEAWLS_JDBC InfoBox . . . . . . . . . . . . . . . . . . . . . . . . . . . . . . . . . . . . . . . . . . . . . . . . . . 346BEAWLS_JMS InfoBox. . . . . . . . . . . . . . . . . . . . . . . . . . . . . . . . . . . . . . . . . . . . . . . . . . . . 348BEAWLS_JMS_DESTINATION InfoBox . . . . . . . . . . . . . . . . . . . . . . . . . . . . . . . . . . . . 348BEAWLS_JMSSERVER InfoBox . . . . . . . . . . . . . . . . . . . . . . . . . . . . . . . . . . . . . . . . . . . . 349BEAWLS_JROCKIT InfoBox . . . . . . . . . . . . . . . . . . . . . . . . . . . . . . . . . . . . . . . . . . . . . . . 350BEAWLS_JVMPROFILER InfoBox . . . . . . . . . . . . . . . . . . . . . . . . . . . . . . . . . . . . . . . . . 351BEAWLS_JOLT InfoBox . . . . . . . . . . . . . . . . . . . . . . . . . . . . . . . . . . . . . . . . . . . . . . . . . . 352
10 PATROL for BEA WebLogic User Guide

BEAWLS_J2EE_APPS InfoBox. . . . . . . . . . . . . . . . . . . . . . . . . . . . . . . . . . . . . . . . . . . . . 353BEAWLS_LOCAL_MANAGED InfoBox . . . . . . . . . . . . . . . . . . . . . . . . . . . . . . . . . . . 354BEAWLS_LOG InfoBox. . . . . . . . . . . . . . . . . . . . . . . . . . . . . . . . . . . . . . . . . . . . . . . . . . . 355BEAWLS_MANAGED InfoBox . . . . . . . . . . . . . . . . . . . . . . . . . . . . . . . . . . . . . . . . . . . . 356BEAWLS_MESSAGING_BRIDGE InfoBox . . . . . . . . . . . . . . . . . . . . . . . . . . . . . . . . . . 357BEAWLS_OS InfoBox . . . . . . . . . . . . . . . . . . . . . . . . . . . . . . . . . . . . . . . . . . . . . . . . . . . . 358BEAWLS_PROBE InfoBox . . . . . . . . . . . . . . . . . . . . . . . . . . . . . . . . . . . . . . . . . . . . . . . . 359BEAWLS_PROF_CLASS InfoBox . . . . . . . . . . . . . . . . . . . . . . . . . . . . . . . . . . . . . . . . . . 359BEAWLS_PROF_METHOD InfoBox . . . . . . . . . . . . . . . . . . . . . . . . . . . . . . . . . . . . . . . 359BEAWLS_SAF InfoBox . . . . . . . . . . . . . . . . . . . . . . . . . . . . . . . . . . . . . . . . . . . . . . . . . . . 360BEAWLS_SAFAGENT InfoBox . . . . . . . . . . . . . . . . . . . . . . . . . . . . . . . . . . . . . . . . . . . . 360BEAWLS_SERVER InfoBox . . . . . . . . . . . . . . . . . . . . . . . . . . . . . . . . . . . . . . . . . . . . . . . 361BEAWLS_SERVLET InfoBox . . . . . . . . . . . . . . . . . . . . . . . . . . . . . . . . . . . . . . . . . . . . . . 362BEAWLS_SERVLET_METHOD InfoBox . . . . . . . . . . . . . . . . . . . . . . . . . . . . . . . . . . . . 363BEAWLS_SETUP InfoBox. . . . . . . . . . . . . . . . . . . . . . . . . . . . . . . . . . . . . . . . . . . . . . . . . 363BEAWLS_SQL InfoBox . . . . . . . . . . . . . . . . . . . . . . . . . . . . . . . . . . . . . . . . . . . . . . . . . . . 364BEAWLS_THREADPOOL InfoBox . . . . . . . . . . . . . . . . . . . . . . . . . . . . . . . . . . . . . . . . 364BEAWLS_TUXEDO_CONNECTOR InfoBox . . . . . . . . . . . . . . . . . . . . . . . . . . . . . . . . 364BEAWLS_WEBAPP InfoBox . . . . . . . . . . . . . . . . . . . . . . . . . . . . . . . . . . . . . . . . . . . . . . 365BEAWLS_WORKLOAD InfoBox . . . . . . . . . . . . . . . . . . . . . . . . . . . . . . . . . . . . . . . . . . 365BEAWLS_WS InfoBox . . . . . . . . . . . . . . . . . . . . . . . . . . . . . . . . . . . . . . . . . . . . . . . . . . . . 366BEAWLS_WS_HDL InfoBox . . . . . . . . . . . . . . . . . . . . . . . . . . . . . . . . . . . . . . . . . . . . . . 366BEAWLS_WS_OPER InfoBox . . . . . . . . . . . . . . . . . . . . . . . . . . . . . . . . . . . . . . . . . . . . . 367JMX_CONDITION InfoBox . . . . . . . . . . . . . . . . . . . . . . . . . . . . . . . . . . . . . . . . . . . . . . . 368JMX_SERVER InfoBox. . . . . . . . . . . . . . . . . . . . . . . . . . . . . . . . . . . . . . . . . . . . . . . . . . . . 368
Appendix E Agent configuration variables 371
Appendix F Installed files, directories, and system changes 375
Main file types . . . . . . . . . . . . . . . . . . . . . . . . . . . . . . . . . . . . . . . . . . . . . . . . . . . . . . . . . . 376Product objects and dependencies . . . . . . . . . . . . . . . . . . . . . . . . . . . . . . . . . . . . . . . . . 377
Directories and files. . . . . . . . . . . . . . . . . . . . . . . . . . . . . . . . . . . . . . . . . . . . . . . . . . . 377Processes and services . . . . . . . . . . . . . . . . . . . . . . . . . . . . . . . . . . . . . . . . . . . . . . . . 388Microsoft Windows Registry modifications . . . . . . . . . . . . . . . . . . . . . . . . . . . . . . 389Product and process dependencies. . . . . . . . . . . . . . . . . . . . . . . . . . . . . . . . . . . . . . 389
Glossary 391
Index 397
Contents 11

12 PATROL for BEA WebLogic User Guide

FiguresApplication class hierarchy when monitoring BEA WebLogic Servers . . . . . . . . . . . 26Collector architecture of PATROL for BEA WebLogic . . . . . . . . . . . . . . . . . . . . . . . . . 27PATROL Console . . . . . . . . . . . . . . . . . . . . . . . . . . . . . . . . . . . . . . . . . . . . . . . . . . . . . . . . 28Upgrading overview for PATROL for BEA WebLogic . . . . . . . . . . . . . . . . . . . . . . . . . 62WebLogic Server Registration (Step 2) with username/password authentication . . 95WebLogic Server Registration (Step 2) with digital certificate authentication . . . . . 96Update WebLogic Server Registration (username/password authentication) . . . . 101Update WebLogic Server Registration (digital certificate authentication) . . . . . . . . 103WebLogic Server icon in PATROL Console . . . . . . . . . . . . . . . . . . . . . . . . . . . . . . . . . 119Example of monitored WebLogic 8.1 Server . . . . . . . . . . . . . . . . . . . . . . . . . . . . . . . . . 120Select property key(s) for narrowing MBean selection dialog box . . . . . . . . . . . . . . 196Define Condition dialog box for ExtremeTemperature . . . . . . . . . . . . . . . . . . . . . . . 208Message Filter dialog box for DOMAIN or SERVER . . . . . . . . . . . . . . . . . . . . . . . . . . 223
Figures 13

14 PATROL for BEA WebLogic User Guide

TablesApplication class icons and functions . . . . . . . . . . . . . . . . . . . . . . . . . . . . . . . . . . . . . . . 29Instance naming conventions . . . . . . . . . . . . . . . . . . . . . . . . . . . . . . . . . . . . . . . . . . . . . . 37Mount commands by platform . . . . . . . . . . . . . . . . . . . . . . . . . . . . . . . . . . . . . . . . . . . . . 50NFS mount commands by platform . . . . . . . . . . . . . . . . . . . . . . . . . . . . . . . . . . . . . . . . . 50Profiling and instrumentation files . . . . . . . . . . . . . . . . . . . . . . . . . . . . . . . . . . . . . . . . . 57Versions that you can migrate . . . . . . . . . . . . . . . . . . . . . . . . . . . . . . . . . . . . . . . . . . . . . . 58Choosing an upgrade procedure . . . . . . . . . . . . . . . . . . . . . . . . . . . . . . . . . . . . . . . . . . . 59Default values for PATROL location variables . . . . . . . . . . . . . . . . . . . . . . . . . . . . . . . . 60Parameters . . . . . . . . . . . . . . . . . . . . . . . . . . . . . . . . . . . . . . . . . . . . . . . . . . . . . . . . . . . . . 107Reports in PATROL for BEA WebLogic . . . . . . . . . . . . . . . . . . . . . . . . . . . . . . . . . . . . 132Boot Server dialog box fields . . . . . . . . . . . . . . . . . . . . . . . . . . . . . . . . . . . . . . . . . . . . . . 139Admin server functions in single managed server mode . . . . . . . . . . . . . . . . . . . . . . 145MBean Management dialog box fields . . . . . . . . . . . . . . . . . . . . . . . . . . . . . . . . . . . . . 198Attributes of a JMX condition definition for ExtremeWeather . . . . . . . . . . . . . . . . . 208Accessing KM commands and InfoBoxes . . . . . . . . . . . . . . . . . . . . . . . . . . . . . . . . . . . 246Accessing online Help . . . . . . . . . . . . . . . . . . . . . . . . . . . . . . . . . . . . . . . . . . . . . . . . . . . 247Parameters for monitoring WebLogic Servers . . . . . . . . . . . . . . . . . . . . . . . . . . . . . . . 253JMX parameters when monitoring WebLogic Servers . . . . . . . . . . . . . . . . . . . . . . . . 289PATROL for BEA WebLogic collector-consumer dependencies . . . . . . . . . . . . . . . . 292BEAWLI_INTEGRATION menu commands . . . . . . . . . . . . . . . . . . . . . . . . . . . . . . . . 309BEAWLI_PROCESS menu commands . . . . . . . . . . . . . . . . . . . . . . . . . . . . . . . . . . . . . 310BEAWLP_CACHE menu commands . . . . . . . . . . . . . . . . . . . . . . . . . . . . . . . . . . . . . . . 310BEAWLP_PORTAL menu commands . . . . . . . . . . . . . . . . . . . . . . . . . . . . . . . . . . . . . . 311BEAWLS_DBURL menu commands . . . . . . . . . . . . . . . . . . . . . . . . . . . . . . . . . . . . . . . 311BEAWLS_EJB_HOME menu commands . . . . . . . . . . . . . . . . . . . . . . . . . . . . . . . . . . . 312BEAWLS_EJB_METHOD menu commands . . . . . . . . . . . . . . . . . . . . . . . . . . . . . . . . . 312BEAWLS_EXEC_QUEUE menu commands . . . . . . . . . . . . . . . . . . . . . . . . . . . . . . . . . 313BEAWLS_JDBC menu commands . . . . . . . . . . . . . . . . . . . . . . . . . . . . . . . . . . . . . . . . . 313BEAWLS_JMS_DESTINATION menu commands . . . . . . . . . . . . . . . . . . . . . . . . . . . 315BEAWLS_JMSSERVER menu commands . . . . . . . . . . . . . . . . . . . . . . . . . . . . . . . . . . . 316BEAWLS_JROCKIT menu commands . . . . . . . . . . . . . . . . . . . . . . . . . . . . . . . . . . . . . . 317BEAWLS_JVMPROFILER menu commands . . . . . . . . . . . . . . . . . . . . . . . . . . . . . . . . 317BEAWLS_J2EE_APPS menu commands . . . . . . . . . . . . . . . . . . . . . . . . . . . . . . . . . . . . 317BEAWLS_LOCAL_MANAGED menu commands . . . . . . . . . . . . . . . . . . . . . . . . . . . 318BEAWLS_LOG menu commands . . . . . . . . . . . . . . . . . . . . . . . . . . . . . . . . . . . . . . . . . . 320BEAWLS_MANAGED menu commands . . . . . . . . . . . . . . . . . . . . . . . . . . . . . . . . . . . 321BEAWLS_PROBE menu commands . . . . . . . . . . . . . . . . . . . . . . . . . . . . . . . . . . . . . . . 322BEAWLS_PROF_CLASS menu commands . . . . . . . . . . . . . . . . . . . . . . . . . . . . . . . . . 323BEAWLS_OS menu commands . . . . . . . . . . . . . . . . . . . . . . . . . . . . . . . . . . . . . . . . . . . 323BEAWLS_SERVER menu commands . . . . . . . . . . . . . . . . . . . . . . . . . . . . . . . . . . . . . . 324
Tables 15

BEAWLS_SERVLET menu commands . . . . . . . . . . . . . . . . . . . . . . . . . . . . . . . . . . . . . . 329BEAWLS_SETUP menu commands . . . . . . . . . . . . . . . . . . . . . . . . . . . . . . . . . . . . . . . . 329BEAWLS_SQL menu commands . . . . . . . . . . . . . . . . . . . . . . . . . . . . . . . . . . . . . . . . . . 330BEAWLS_THREADPOOL menu commands . . . . . . . . . . . . . . . . . . . . . . . . . . . . . . . . 331BEAWLS_WEBAPP menu commands . . . . . . . . . . . . . . . . . . . . . . . . . . . . . . . . . . . . . . 332BEAWLS_WS menu commands . . . . . . . . . . . . . . . . . . . . . . . . . . . . . . . . . . . . . . . . . . . 332BEAWLS_WS_HDL menu commands . . . . . . . . . . . . . . . . . . . . . . . . . . . . . . . . . . . . . . 333BEAWLS_WS_OPER menu commands . . . . . . . . . . . . . . . . . . . . . . . . . . . . . . . . . . . . . 333JMX_CONDITION menu commands . . . . . . . . . . . . . . . . . . . . . . . . . . . . . . . . . . . . . . . 334JMX_DOMAIN menu commands . . . . . . . . . . . . . . . . . . . . . . . . . . . . . . . . . . . . . . . . . . 334JMX_MAIN Menu commands . . . . . . . . . . . . . . . . . . . . . . . . . . . . . . . . . . . . . . . . . . . . . 335JMX_SERVER menu commands . . . . . . . . . . . . . . . . . . . . . . . . . . . . . . . . . . . . . . . . . . . 336BEAWLI_INTEGRATION InfoBox for WebLogic 8.1 . . . . . . . . . . . . . . . . . . . . . . . . . 339BEAWLI_PROCESS InfoBox for WebLogic 8.1 . . . . . . . . . . . . . . . . . . . . . . . . . . . . . . . 340BEAWLP_CACHE InfoBox for WebLogic 8.1 . . . . . . . . . . . . . . . . . . . . . . . . . . . . . . . . 341BEAWLP_PORTAL InfoBox for WebLogic 8.1 . . . . . . . . . . . . . . . . . . . . . . . . . . . . . . . 341BEAWLS_CLUSTER InfoBox for WebLogic 7.0 . . . . . . . . . . . . . . . . . . . . . . . . . . . . . . 341BEAWLS_DBURL InfoBox for WebLogic 7.0 and 8.1 . . . . . . . . . . . . . . . . . . . . . . . . . 342BEAWLS_EJB InfoBox for WebLogic 7.0 . . . . . . . . . . . . . . . . . . . . . . . . . . . . . . . . . . . . 343BEAWLS_EJB InfoBox for WebLogic 7.0, 8.1, 9.x, and 10.x . . . . . . . . . . . . . . . . . . . . . 343BEAWLS_EJB InfoBox for WebLogic 8.1, 9.x, and 10.x . . . . . . . . . . . . . . . . . . . . . . . . 343BEAWLS_EJB_HOME InfoBox . . . . . . . . . . . . . . . . . . . . . . . . . . . . . . . . . . . . . . . . . . . . 343BEAWLS_EJB_METHOD InfoBox for WebLogic 7.0 and 8.1 . . . . . . . . . . . . . . . . . . . 344BEAWLS_EXEC_QUEUE InfoBox for WebLogic 7.0 and 8.1 . . . . . . . . . . . . . . . . . . . 344BEAWLS_EXEC_QUEUE InfoBox for WebLogic 7.0 and 8.1 . . . . . . . . . . . . . . . . . . . 344BEAWLS_JCA InfoBox for WebLogic 7.0, 8.1, 9.x, and 10.x . . . . . . . . . . . . . . . . . . . . 345BEAWLS_JCA InfoBox for WebLogic 8.1, 9.x, and 10.x . . . . . . . . . . . . . . . . . . . . . . . . 346BEAWLS_JCA InfoBox for WebLogic 9.x and 10.x . . . . . . . . . . . . . . . . . . . . . . . . . . . . 346BEAWLS_JDBC InfoBox for WebLogic 7.0 . . . . . . . . . . . . . . . . . . . . . . . . . . . . . . . . . . 346BEAWLS_JDBC InfoBox for WebLogic 7.0, 8.1, 9.x, and 10.x . . . . . . . . . . . . . . . . . . . 347BEAWLS_JDBC InfoBox for WebLogic 8.1, 9.x, and 10.x . . . . . . . . . . . . . . . . . . . . . . 347BEAWLS_JMS InfoBox for WebLogic 7.0 and 8.1 . . . . . . . . . . . . . . . . . . . . . . . . . . . . . 348BEAWLS_JMS_DESTINATION InfoBox for WebLogic 7.0 and 8.1 . . . . . . . . . . . . . . 348BEAWLS_JMSSERVER InfoBox for WebLogic 7.0 . . . . . . . . . . . . . . . . . . . . . . . . . . . . 349BEAWLS_JMSSERVER InfoBox for WebLogic 7.0 and 8.1 . . . . . . . . . . . . . . . . . . . . . 349BEAWLS_JMSSERVER InfoBox for WebLogic 8.1 . . . . . . . . . . . . . . . . . . . . . . . . . . . . 350BEAWLS_JROCKIT InfoBox for WebLogic 8.1, 9.x, and 10.x . . . . . . . . . . . . . . . . . . . 350BEAWLS_JVMPROFILER InfoBox for WebLogic 7.0 and 8.1 . . . . . . . . . . . . . . . . . . . 351BEAWLS_JOLT InfoBox for WebLogic 7.0, 8.1, 9.x, and 10.x . . . . . . . . . . . . . . . . . . . 353BEAWLS_J2EE_APPS InfoBox . . . . . . . . . . . . . . . . . . . . . . . . . . . . . . . . . . . . . . . . . . . . 353BEAWLS_LOCAL_MANAGED InfoBox for WebLogic 7.0, 8.1, 9.x, and 10.x . . . . . 354BEAWLS_LOG InfoBox for WebLogic 7.0, 8.1, 9.x, and 10.x . . . . . . . . . . . . . . . . . . . 355BEAWLS_MANAGED InfoBox for WebLogic 7.0, 8.1, 9.x, and 10.x . . . . . . . . . . . . . 356BEAWLS_MESSAGING_BRIDGE InfoBox for WebLogic 8.1, 9.x, and 10.x . . . . . . 357BEAWLS_OS InfoBox for WebLogic 7.0, 8.1, 9.x, and 10.x . . . . . . . . . . . . . . . . . . . . . 358BEAWLS_PROBE InfoBox for WebLogic 7.0, 8.1, 9.x, and 10.x . . . . . . . . . . . . . . . . . 359BEAWLS_PROF_CLASS InfoBox for WebLogic 7.0 and 8.1 . . . . . . . . . . . . . . . . . . . . 359BEAWLS_PROF_METHOD InfoBox for WebLogic 7.0 and 8.1 . . . . . . . . . . . . . . . . . 359BEAWLS_SAF InfoBox for WebLogic 9.x and 10.x . . . . . . . . . . . . . . . . . . . . . . . . . . . 360
16 PATROL for BEA WebLogic User Guide

BEAWLS_SAFAGENT InfoBox for WebLogic 9.x and 10.x . . . . . . . . . . . . . . . . . . . . 360BEAWLS_SERVER InfoBox for WebLogic 7.0, 8.1, 9.x, and 10.x . . . . . . . . . . . . . . . . 361BEAWLS_SERVLET InfoBox for WebLogic 7.0, 8.1, 9.x, and 10.x . . . . . . . . . . . . . . . 362BEAWLS_SERVLET InfoBox for WebLogic 8.1 . . . . . . . . . . . . . . . . . . . . . . . . . . . . . . 363BEAWLS_SERVLET_METHOD InfoBox for WebLogic 7.0 and 8.1 . . . . . . . . . . . . . 363BEAWLS_SETUP InfoBox for WebLogic 7.0, 8.1, 9.x, and 10.x . . . . . . . . . . . . . . . . . 363BEAWLS_SQL InfoBox for WebLogic 7.0 and 8.1 . . . . . . . . . . . . . . . . . . . . . . . . . . . . 364BEAWLS_THREADPOOL InfoBox for WebLogic 9.x and 10.x . . . . . . . . . . . . . . . . . 364BEAWLS_TUXEDO_CONNECTOR InfoBox for WebLogic 9.1 and 10.x . . . . . . . . 365BEAWLS_WEBAPP InfoBox . . . . . . . . . . . . . . . . . . . . . . . . . . . . . . . . . . . . . . . . . . . . . . 365BEAWLS_WORKLOAD InfoBox for WebLogic 9.x and 10.x . . . . . . . . . . . . . . . . . . . 365BEAWLS_WS InfoBox for WebLogic 8.1, 9.x, and 10.x . . . . . . . . . . . . . . . . . . . . . . . . 366BEAWLS_WS_HDL InfoBox for WebLogic 8.1 . . . . . . . . . . . . . . . . . . . . . . . . . . . . . . 366BEAWLS_WS_OPER InfoBox for WebLogic 8.1, 9.x, and 10.x . . . . . . . . . . . . . . . . . . 367JMX_CONDITION InfoBox for WebLogic 7.0, 8.1, 9.x, and 10.x . . . . . . . . . . . . . . . . 368JMX_SERVER InfoBox for WebLogic 7.0, 8.1, 9.x, and 10.x . . . . . . . . . . . . . . . . . . . . 368Agent variables . . . . . . . . . . . . . . . . . . . . . . . . . . . . . . . . . . . . . . . . . . . . . . . . . . . . . . . . . 371File types by file extension . . . . . . . . . . . . . . . . . . . . . . . . . . . . . . . . . . . . . . . . . . . . . . . . 376Directories and files installed on a PATROL Agent computer . . . . . . . . . . . . . . . . . 378Directories and files installed on a PATROL Console Server computer . . . . . . . . . . 381Directories and files installed on a PATROL 3.x Console computer . . . . . . . . . . . . . 383Common directories and files installed regardless of computer role . . . . . . . . . . . . 384Processes run by PATROL for BEA WebLogic . . . . . . . . . . . . . . . . . . . . . . . . . . . . . . . 389
Tables 17

18 PATROL for BEA WebLogic User Guide

C h a p t e r 1
1 Product components and capabilitiesThe chapter provides a brief overview of jca.
PATROL for BEA WebLogic features . . . . . . . . . . . . . . . . . . . . . . . . . . . . . . . . . . . . . . . . 20Server management. . . . . . . . . . . . . . . . . . . . . . . . . . . . . . . . . . . . . . . . . . . . . . . . . . . . 20Web services management. . . . . . . . . . . . . . . . . . . . . . . . . . . . . . . . . . . . . . . . . . . . . . 21Portal server management . . . . . . . . . . . . . . . . . . . . . . . . . . . . . . . . . . . . . . . . . . . . . . 21Integration server management . . . . . . . . . . . . . . . . . . . . . . . . . . . . . . . . . . . . . . . . . 21Clustering support . . . . . . . . . . . . . . . . . . . . . . . . . . . . . . . . . . . . . . . . . . . . . . . . . . . . 21J2EE performance . . . . . . . . . . . . . . . . . . . . . . . . . . . . . . . . . . . . . . . . . . . . . . . . . . . . . 21JVM profiling . . . . . . . . . . . . . . . . . . . . . . . . . . . . . . . . . . . . . . . . . . . . . . . . . . . . . . . . . 22JMX MBean monitoring . . . . . . . . . . . . . . . . . . . . . . . . . . . . . . . . . . . . . . . . . . . . . . . . 22Log file monitoring . . . . . . . . . . . . . . . . . . . . . . . . . . . . . . . . . . . . . . . . . . . . . . . . . . . . 22Response time probe . . . . . . . . . . . . . . . . . . . . . . . . . . . . . . . . . . . . . . . . . . . . . . . . . . . 23Component monitoring . . . . . . . . . . . . . . . . . . . . . . . . . . . . . . . . . . . . . . . . . . . . . . . . 24
Product architecture . . . . . . . . . . . . . . . . . . . . . . . . . . . . . . . . . . . . . . . . . . . . . . . . . . . . . . 25Application classes and icons. . . . . . . . . . . . . . . . . . . . . . . . . . . . . . . . . . . . . . . . . . . . . . . 28
Application class icons and functions . . . . . . . . . . . . . . . . . . . . . . . . . . . . . . . . . . . . 29Application instance naming conventions. . . . . . . . . . . . . . . . . . . . . . . . . . . . . . . . . 37
Where to Go from Here. . . . . . . . . . . . . . . . . . . . . . . . . . . . . . . . . . . . . . . . . . . . . . . . . . . . 39
Chapter 1 Product components and capabilities 19

1
PATROL for BEA WebLogic featuresPATROL for BEA WebLogic provides a complete monitoring and management solution to ensure reliable, predictable performance of a BEA WebLogic Server environment.
PATROL for BEA WebLogic also provides several reporting mechanisms for key parameters and allows you to perform a wide range of WebLogic Server administrative functions from within the PATROL Console environment.
Server management
PATROL for BEA WebLogic includes several menu commands and parameters for managing instances of BEA WebLogic Servers, including administrative and managed servers. Within PATROL, you can perform the following tasks:
■ Shut down or reboot the server.
■ Lock out user sessions.
■ Perform Java garbage collection.
■ Briefly suspend alarms and event generation during routine maintenance periods to prevent spurious alarms. During a blackout period, PATROL continues to monitor the WebLogic environment but does not report object state changes nor does it generate warnings or alarms.
■ Tune PATROL for your monitoring environment by turning off selected collectors. By turning off collectors for parts of the system that are not critical to your WebLogic environment, you can reduce resource demands and improve overall PATROL performance. If you experience slow performance, try turning off unnecessary collectors.
■ Select the servers and components to monitor.
■ Monitor a single Managed Server without requiring an available Admin Server: even if the Admin Server is down, PATROL can continue to collect data, monitor performance, and manage the Managed Server.
■ Monitor the availability and memory usage of the Node Manager process associated with each WebLogic server in a domain. The Node Manager will appear as the ActiveProcesses list in the BEAWLS_OS class (you can exclude it if you want).
■ Check the consistency of JDKs and WebLogic versions in a monitored domain.
20 PATROL for BEA WebLogic User Guide

1
Web services management
PATROL for BEA WebLogic allows you to monitor the deployed web services, web service operations, and service-level JAX-RPC handlers in the WebLogic Server 8.1 environment. In addition, you can generate the overall web services performance matrix report for service availability and assurance.
Portal server management
The BEA WebLogic Portal server provides a single framework for configuring, accessing, monitoring, and maintaining caches. PATROL for BEA WebLogic provides the functionality for monitoring and managing the caches. When configured properly, the caches can reduce the time needed to retrieve frequently used data.
Integration server management
The BEA WebLogic Integration server provides functionality for businesses to use to develop new applications, integrate them with existing systems, streamline business processes, and extend e-business infrastructure through portal gateways.
PATROL for BEA WebLogic provides the functionality for monitoring and managing the BEA Integration server, including monitoring the status of application views and adapters, the average service elapsed time, and the number of event notifications.
Clustering support
PATROL for BEA WebLogic supports a clustered server environment and provides features to manage clustered nodes. The cluster improves scalability by allowing additional servers to be quickly added to the WebLogic environment and improves availability by providing redundancy and a fail-safe mechanism for rolling functions over to other servers in the event of a server failure.
J2EE performance
PATROL for BEA WebLogic provides a J2EE application-centric view so that you can diagnose performance of the application and easily identify performance bottlenecks of the components inside the application.
Chapter 1 Product components and capabilities 21

1
JVM profiling
PATROL for BEA WebLogic provides the ability to monitor performance of the Java Virtual Machine (JVM) by monitoring selected Java classes and profiling performance. Available data includes JVM memory statistics, garbage collection metrics, method-level data, and thread data.
JMX MBean monitoring
PATROL for BEA WebLogic provides tools that let you monitor MBeans used in a JMX-managed WebLogic Server. You can select which MBeans you want to monitor and you can define attributes that determine which MBeans are monitored, that trigger automatic alerts (including events that can be managed in the PATROL Event Manager), and that can take automatic actions based on your monitoring criteria.
Log file monitoring
Log files are monitored from the BEAWLS_LOG application class. The domain, server, HTTP, and Java Database Connection (JDBC) logs are monitored by default; however, you can register any log file to be monitored. In addition to being able to watch error and informational messages as they are written to the log, you can define sniff patterns to isolate critical error messages and you can subscribe to email or Event Manager notifications; you can also generate PATROL events when specific text patterns are written to the log.
Sniff patterns
You can set up sniff patterns to match text strings in the log file so that you can pinpoint error messages that are most critical to your monitoring environment. You can define sniff patterns for any kind of text occurrence. Some of the most common strategies are to set up patterns for the following items:
■ Resource or service type—you could specify a sniff pattern of SSLListenThread to isolate only those messages pertaining to the secure socket listener.
■ Date—you could specify a sniff pattern to look at the log file to determine the date format you should match. When you view the server log file, the Message Filter dialog box provides a field for limiting the date range.
22 PATROL for BEA WebLogic User Guide

1
■ Severity level—you could specify a sniff pattern to limit output to only errors or warnings, or show just the informational messages if you are looking for a specific text string. For example, on the server log file, you could set a sniff pattern of <!> to see the warnings, or you could use <I> to find the informational only messages.
■ Host name—you could use the hostname as a sniff pattern to isolate messages based on the server name if you are monitoring an environment with many servers.
For each log file, you can define multiple sniff patterns. When you use the Sniff Pattern Setup menu commands, the sniff patterns you previously defined can be selected, viewed, edited or deleted. Each sniff pattern can also be set up to generate annotated data points on graph parameters, and to generate events that can be monitored through the PATROL Event Manager (PEM).
Events
When you define a new sniff pattern, you have the option of having it automatically trigger a PATROL event whenever the message is written to the log file. Triggering the events allows you to monitor the events through the PEM interface.
The PEM window displays events generated from the selected log file. From within this window, you can manage events as you do for any other PATROL event classes. See the PEM Help in your Console for more information about managing events.
Notifications
When critically important messages are written to the log file, you can use the notification feature to automatically have PATROL send you an email message alerting you to the error situation. You can also have these messages reported to the PEM.
Response time probe
The BEAWLS_PROBE application class provides a way to monitor and manage server timing data. You can automatically generate events based on ping time or response time whenever the status changes to WARNING or ALARM. You can then monitor PATROL events through the PEM interface. The BEAWLS_PROBE class is not active when monitoring remote managed servers.
Chapter 1 Product components and capabilities 23

1
Component monitoring
Application classes are provided to monitor the following critical components of the WebLogic environment:
■ the Java Transaction API (JTA), whose functions include the ability to generate various reports with performance metric details
■ the Java Messaging Service (JMS)
— the BEAWLS_JMSSERVER application class monitors the JMS server and includes commands to configure the JMS server within the PATROL monitoring environment
— the BEAWLS_JMS_DESTINATION application class monitors the JMS destinations
■ the Java Connection Architecture (JCA), which is the foundation for web applications to interact with other types of business software, including transaction processing systems, databases, and ERP applications. PATROL for BEA WebLogic provides several parameters that can monitor usage of the JCA connectors.
■ Enterprise Java Beans (EJBs)
■ execution queues
■ web applications
■ Jolt and JDBC pools; JDBC performance information is available for peak usage and number of active connections, as well as for connection waiting times. Additional JDBC features include profiling for connection leaks, prepared statement cache, and SQL roundtrip metrics.
■ the JRockit JVM (with WebLogic 8.1 or higher)
■ the WebLogic Messaging Bridge (with WebLogic 8.1 or higher)
■ the Store and Forward (SAF) service and agents (with WebLogic 9.x or higher)
■ the WebLogic Tuxedo Connector (WTC) service (with WebLogic 9.1 or higher)
Web application monitoring capabilities include the ability to monitor specific servlets.
24 PATROL for BEA WebLogic User Guide
1
Product architectureFigure 1 shows how PATROL for BEA WebLogic is organized within the console monitoring environment. Most application classes can have multiple instances. For more information about each application class, see “Application classes and icons” on page 28. For more information about how these instances are named, see page 37.
Chapter 1 Product components and capabilities 25

1
Figure 1 Application class hierarchy when monitoring BEA WebLogic Servers
EJBJDBC JOLT LOG PROBE
one or moreinstances
WEBAPP
SERVLET
only onadmin server
only selectedservlets aremonitored
JMS EXECQUEUE
JCA
EJB_HOME
EJB_METHODJMXDOMAIN
JMXCONDITION
SERVLET_METHOD
SQL
PORTAL
HANDLER OPERATION
WS**
JMSDESTINATION
JMS_SERVER
JMXSERVER DBURL OS CACHEJ2EE*JROCKIT
system-wide icon for WebLogic
managed servers:one or more managed WebLogic Server instances
servers running PATROL Agent are identified as Local Managed
administrative server icon
console
setup icon
containers
local managed server
optional cluster
WS**
*The J2EE application can also contain EJB or WEBAPP branches, depending on your J2EE environment.
**BEAWLS_WS is the child of BEAWLS_SERVER on WebLogic 8.1, and of BEAWLS_J2EE_APPS on WebLogic 9.x and higher.
instances
PROCESS
INTEGRATION THREADPOOL
SAF
SAFAGENT
MESSAGINGBRIDGE
WORKLOAD
TUXEDO_CONNECTOR
PROF_METHOD
PROF_CLASS
JVMPROFILER
26 PATROL for BEA WebLogic User Guide

1
Figure 2 shows how the PATROL Console interacts with the PATROL Agent on a WebLogic administration server. Performance data is maintained by BEA WebLogic using JMX Mbeans. This data is then collected by a Java-based PATROL collector and returned to PATROL via a PATROL Script Language (PSL) pipe. Profiling data on J2EE objects (like EJBs, SQL, or servlets) uses the JVMPI interface to communicate with applications running on the server.
Figure 2 Collector architecture of PATROL for BEA WebLogic
Console
• PATROL for BEA WebLogic• other PATROL Console KMs
WebLogic Administration Server• PATROL Agent • PATROL for BEA WebLogic• other PATROL Agent KMs
• PATROL Console
PATROL Agent
PATCOL WebLogic(Java collector)
PATROL Console
PSLPipe WebLogic Server
ServerMBeanEJBMBeanJDBCMBeanJMX...
JVM
JVMPI
PATROL Profiler
ProfilingData Storage
XML
J2EE objects
Message
profiling data
Chapter 1 Product components and capabilities 27

1
Application classes and icons PATROL for BEA WebLogic contains applications and application containers. Application containers group together multiple instances of a managed resource.
The BEAWLS_SERVER application container represents the entire BEA WebLogic Server environment and acts as a container for all PATROL for BEA WebLogic application classes. The BEAWLS_SERVER icon appears in the Console window for a specific computer host.
The BEAWLS_SETUP icon and the BEAWLS_SERVER icon are displayed in the computer window along with the operating system application icons and the PATROL Agent icon, as shown in Figure 3. The BEAWLS_SETUP icon is used to configure the product; for more information, see “Configuring the KM” on page 93).
Figure 3 PATROL Console
icon for monitoring and managing BEA WebLogic Server
setup icon for PATROL for BEA WebLogic
28 PATROL for BEA WebLogic User Guide
1
Application class icons and functions
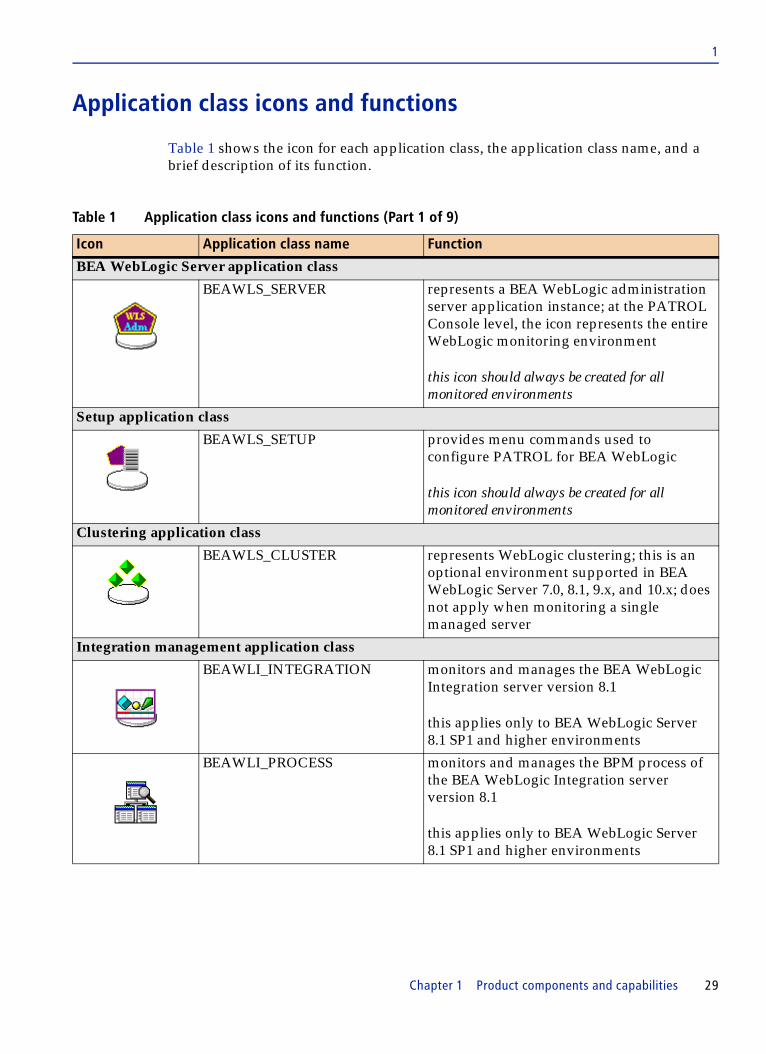
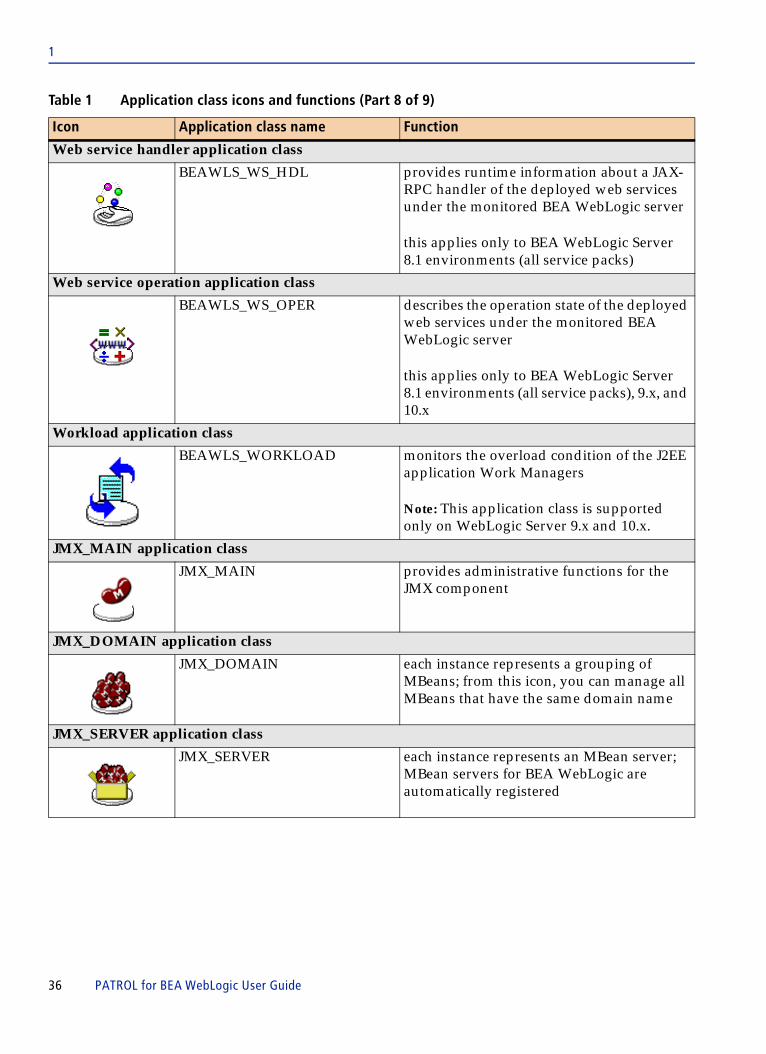
Table 1 shows the icon for each application class, the application class name, and a brief description of its function.
Table 1 Application class icons and functions (Part 1 of 9)
Icon Application class name Function
BEA WebLogic Server application class
BEAWLS_SERVER represents a BEA WebLogic administration server application instance; at the PATROL Console level, the icon represents the entire WebLogic monitoring environment
this icon should always be created for all monitored environments
Setup application class
BEAWLS_SETUP provides menu commands used to configure PATROL for BEA WebLogic
this icon should always be created for all monitored environments
Clustering application class
BEAWLS_CLUSTER represents WebLogic clustering; this is an optional environment supported in BEA WebLogic Server 7.0, 8.1, 9.x, and 10.x; does not apply when monitoring a single managed server
Integration management application class
BEAWLI_INTEGRATION monitors and manages the BEA WebLogic Integration server version 8.1
this applies only to BEA WebLogic Server 8.1 SP1 and higher environments
BEAWLI_PROCESS monitors and manages the BPM process of the BEA WebLogic Integration server version 8.1
this applies only to BEA WebLogic Server 8.1 SP1 and higher environments
Chapter 1 Product components and capabilities 29

1
Portal management application class
BEAWLP_PORTAL provides a container for the BEAWLP_CACHE KM to monitor and manage the BEA WebLogic Portal server version 8.1
this applies only to BEA WebLogic Server 8.1 SP1 and higher environments
Portal cache management application class
BEAWLP_CACHE monitors and manages the cache service of the BEA WebLogic Portal server version 8.1
this applies only to BEA WebLogic Server 8.1 SP1 and higher environments
Database URL application class
BEAWLS_DBURL represents a database URL on which there are configured JDBC connection pools
Enterprise Java Bean application class
BEAWLS_EJB represents all deployed Enterprise Java beans deployed on a given server
EJB Home application class
BEAWLS_EJB_HOME represents home runtime interfaces of an EJB; monitors and administers runtime information (transaction counts) for stateful, stateless, entity beans, and message driven beans
EJB Method application class
BEAWLS_EJB_METHOD provides byte-code instrumentation of selected EJB methods; this application class appears only if EJB method level data collection is enabled via the Advanced Monitoring command in the BEAWLS_SERVER class
Table 1 Application class icons and functions (Part 2 of 9)
Icon Application class name Function
30 PATROL for BEA WebLogic User Guide
1
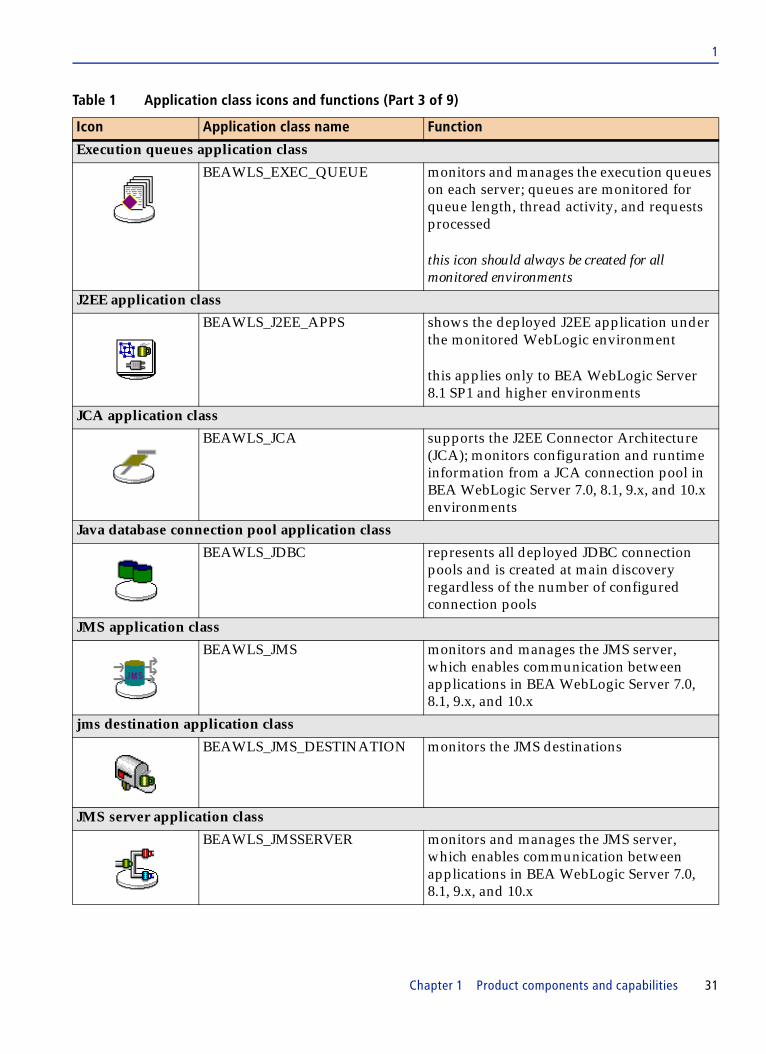
Execution queues application class
BEAWLS_EXEC_QUEUE monitors and manages the execution queues on each server; queues are monitored for queue length, thread activity, and requests processed
this icon should always be created for all monitored environments
J2EE application class
BEAWLS_J2EE_APPS shows the deployed J2EE application under the monitored WebLogic environment
this applies only to BEA WebLogic Server 8.1 SP1 and higher environments
JCA application class
BEAWLS_JCA supports the J2EE Connector Architecture (JCA); monitors configuration and runtime information from a JCA connection pool in BEA WebLogic Server 7.0, 8.1, 9.x, and 10.x environments
Java database connection pool application class
BEAWLS_JDBC represents all deployed JDBC connection pools and is created at main discovery regardless of the number of configured connection pools
JMS application class
BEAWLS_JMS monitors and manages the JMS server, which enables communication between applications in BEA WebLogic Server 7.0, 8.1, 9.x, and 10.x
jms destination application class
BEAWLS_JMS_DESTINATION monitors the JMS destinations
JMS server application class
BEAWLS_JMSSERVER monitors and manages the JMS server, which enables communication between applications in BEA WebLogic Server 7.0, 8.1, 9.x, and 10.x
Table 1 Application class icons and functions (Part 3 of 9)
Icon Application class name Function
Chapter 1 Product components and capabilities 31

1
Jolt for WebLogic application class
BEAWLS_JOLT represents configured Jolt connection pools deployed in the WebLogic environment
Jolt is a Java-based client API that manages requests for BEA Tuxedo services
JROCKIT application class
BEAWLS_JROCKIT represents the BEA WebLogic JRockit JVM 1.4.1 or higher, supported for WebLogic 8.1 or higher
although PATROL will work with JRockit 1.3.1 on WebLogic 7.0, the JROCKIT class will not be created for full monitoring
JVM profiler application class
BEAWLS_JVMPROFILER provides statistical information about the Java Virtual Machine (JVM) when the profiling advanced monitoring option is enabled
Local managed application class
BEAWLS_LOCAL_MANAGED monitors and manages a WebLogic “managed” Server that is running on the same host as the PATROL Agent (see also the Managed Server Application Class, BEAWLS_MANAGED)
Log file monitoring application class
BEAWLS_LOG monitors log files and generates events for the PATROL Event Manager
Domain, Server, HTTP, and JDBC log files are monitored
this icon should always be created for all monitored environments, although it will disappear if you stop monitoring all logs
Table 1 Application class icons and functions (Part 4 of 9)
Icon Application class name Function
32 PATROL for BEA WebLogic User Guide

1
Managed server application class
BEAWLS_MANAGED monitors and manages a “managed” WebLogic Server that is remote to a given PATROL Agent (see also Local Managed Server Application Class, LOCAL_MANAGED)
in an environment with multiple WebLogic Server instances, one server will be designated the administrative server and others designated as managed servers
Messaging bridge application class
BEAWLS_MESSAGING_BRIDGE
monitors the WebLogic messaging bridge
this icon is created under each WebLogic server instance of a monitored domain which includes a Messaging Bridge
Operating system application class
BEAWLS_OS monitors the local operating system of a host on which a monitored WebLogic Administration Server JVM is running; also monitors all JVMs on local managed servers
this icon should always be created for all monitored environments, although parameters may be offline if the Unix or Windows OS KM is not loaded
Response time probe application class
BEAWLS_PROBE provides connection time and estimated transfer rate to the administrative server via the AvgPingTime and AvgConnTime parameters
the BEAWLS_PROBE class is always active, but may appear at a different level when monitoring a remote managed server
Table 1 Application class icons and functions (Part 5 of 9)
Icon Application class name Function
Chapter 1 Product components and capabilities 33

1
Profiling application class
BEAWLS_PROF_CLASS container for Java classes for which method level response information is being collected
this application class is created only when JVM performance data collection is turned on via the Advance Monitoring menu command in the BEAWLS_SERVER class and method profiling is turned on via the Configure Method Profiling menu command in BEAWLS_SERVER
Profiling method application class
BEAWLS_PROF_METHOD container for Java classes for which method level response information is being collected
this application class is created only when JVM performance data collection is turned on via the Advance Monitoring menu command in the BEAWLS_SERVER class and method profiling is turned on via the Configure Method Profiling menu command in BEAWLS_SERVER
HTTP and JSP servlet application class
BEAWLS_SERVLET represents HTTP, JSP, and servlets
HTTP, JSP, and servlets represent server-side logic in e-commerce applications
SAF service application class
BEAWLS_SAF monitors the Store-and-Forward (SAF) service
this icon is created under each WebLogic server instance of a monitored domain which includes SAF Agents
SAF agent application class
BEAWLS_SAFAGENT monitors the Store-and-Forward (SAF) agents
this icon is created under each BEAWLS_SAF instance
Table 1 Application class icons and functions (Part 6 of 9)
Icon Application class name Function
34 PATROL for BEA WebLogic User Guide

1
Servlet method application class
BEAWLS_SERVLET_METHOD monitors methods for a selected servlet
monitors only doGet, doPut, doDelete, and doPost methods
SQL application class
BEAWLS_SQL monitors SQL statements
Threadpool application class
BEAWLS_THREADPOOL monitors the thread pool of all WebLogic servers inside the domain
Note: This application class is supported only on WebLogic Server 9.x and 10.x.
Tuxedo Connector application class
BEAWLS_TUXEDO_CONNECTOR
monitors the WebLogic Tuxedo Connector service in all WebLogic servers inside the domain
Note: This application class is supported only on WebLogic Server 9.1 and 10.x.
Web applications application class
BEAWLS_WEBAPP monitors and manages resources used by a web application running on a configured and managed WebLogic Server
monitors all deployed web applications and can monitor specific servlets for a given application
Web service application class
BEAWLS_WS represents the deployed web services under the monitored BEA WebLogic server
this applies only to BEA WebLogic Server 8.1 environments (all service packs), 9.x, and 10.x
Table 1 Application class icons and functions (Part 7 of 9)
Icon Application class name Function
Chapter 1 Product components and capabilities 35
1
Web service handler application class
BEAWLS_WS_HDL provides runtime information about a JAX-RPC handler of the deployed web services under the monitored BEA WebLogic server
this applies only to BEA WebLogic Server 8.1 environments (all service packs)
Web service operation application class
BEAWLS_WS_OPER describes the operation state of the deployed web services under the monitored BEA WebLogic server
this applies only to BEA WebLogic Server 8.1 environments (all service packs), 9.x, and 10.x
Workload application class
BEAWLS_WORKLOAD monitors the overload condition of the J2EE application Work Managers
Note: This application class is supported only on WebLogic Server 9.x and 10.x.
JMX_MAIN application class
JMX_MAIN provides administrative functions for the JMX component
JMX_DOMAIN application class
JMX_DOMAIN each instance represents a grouping of MBeans; from this icon, you can manage all MBeans that have the same domain name
JMX_SERVER application class
JMX_SERVER each instance represents an MBean server; MBean servers for BEA WebLogic are automatically registered
Table 1 Application class icons and functions (Part 8 of 9)
Icon Application class name Function
36 PATROL for BEA WebLogic User Guide

1
Application instance naming conventions
The application classes in this product use the naming conventions shown in Table 2 for labeling icons to differentiate each application class instance.
JMX_CONDITION application class
JMX_CONDITION each instance represents a monitored condition that you have previously defined; the condition includes definitions of attribute value thresholds and notifications; if a condition applies to a single JMX domain, the icon is a child of JMX_DOMAIN, if it applies to multiple domains, it is a child of JMX_SERVER
Table 2 Instance naming conventions (Part 1 of 3)
Application Instance naming convention Example
WebLogic 9.x and 10.x environment
BEAWLS_SAF the SAF Service for all SAF Agents for the entire WebLogic server
SAF Service
BEAWLS_SAFAGENT
unique instance name of the SAF Agent
exampleSAFAgent
WebLogic 8.1, 9.x, and 10.x environments
BEAWLI_ INTEGRATION
the name of the host WorkflowBilling, OrderNew, OrderRequisition
BEAWLI_ PROCESS
the name of the process WorkflowBilling, OrderNew, OrderRequisition
BEAWLP_CACHE the name of the cache service documentIdCache, adServiceCache
BEAWLP_ PORTAL
the name of the portal service e2ePortal
BEAWLS_ MESSAGING_BRIDGE
unique user-defined name specified when creating Messaging Bridge
MsgBridge
WebLogic 7.0 and 8.1 environments
BEAWLS_EJB_ HOME
full JNDI name of bean, or display name
portal.PortalGroupHierarchyHome, theory.smart.ebusiness.tax. TaxCalculator, TheCart
WebLogic 7.0, 8.1, 9.x, and 10.x environment
Table 1 Application class icons and functions (Part 9 of 9)
Icon Application class name Function
Chapter 1 Product components and capabilities 37

1
BEAWLS_EXEC_QUEUE
unique name for the execute queue; these are created at startup
MyAppQueue
BEAWLS_JCA the JCA application name which is the name of its resource adapter archive file (.rar)
BlackBoxNoTx
BEAWLS_JDBC unique user-defined name specified when creating JDBC connection pool
commercePool, docPool
BEAWLS_ JMS the JMS Service for all JMS servers for the entire WebLogic server
JMS Service
BEAWLS_ JMS_ DESTINATION
the destination of the JMS JMS Service
BEAWLS_ JMSSERVER
unique instance name of the JMS server
exampleJMSServer
BEAWLS_JOLT unique user-defined name specified when creating Jolt connection pool
ccjoltPool, demoJoltPool
BEAWLS_J2EE the name of the application WLI System EJBs, e2eWorkflow
BEAWLS_LOG user-defined name specified in Log Name Alias field of the dialog box that appears when setting up monitoring for another log
by default, the application creates instances for the JDBC, HTTP, DOMAIN, and Server log files, as defined in the WebLogic MBean server configuration
JDBC, HTTP, SERVER, DOMAIN
BEAWLS_ MANAGED
name of the remote managed server (remote to this PATROL Agent)
sales_server2
BEAWLS_ PROBE role of the server (administration or local managed) being monitored; not relevant when monitoring remote managed servers
Admin_PROBE, LocalMgr_PROBE
BEAWLS_PROF_ CLASS
name of the Java class being profiled weblogic.managementAdmin
BEAWLS_PROF_ METHOD
name of the method being profiled getShoppingCart
BEAWLS_ SERVER unique server instance name specified when registering a server
WLServer1
BEAWLS_SERVLET
file name of the servlet executable surveyResponse, RegistrationForm
BEAWLS_THREADPOOL
name of the WebLogic server defined by the WebLogic administrator
WLServer1
Table 2 Instance naming conventions (Part 2 of 3)
Application Instance naming convention Example
38 PATROL for BEA WebLogic User Guide

1
Where to Go from HereIf you are ready to install and configure the PATROL for BEA WebLogic product, see Chapter 2, “Installing and migrating PATROL for BEA WebLogic”. If you are already running the product, see Chapter 4, “Managing the BEA WebLogic environment.”
BEAWLS_ WEBAPP
file name of the web application
a web archive contains all of the files that make up a web application
petStore
BEAWLS_WORKLOAD
name of the workload manager defined by the WebLogic administrator
WorkloadMgr1
BEAWLS_ WS file name of the web service
a web archive contains all of the files that make up a web application
CampaignWS, PropertySetWS
BEAWLS_ WS_HDL
java class name of the handler
a web archive contains all of the files that make up a web application
handler-0 [getAdIds], handler-1 [get AdIds]
BEAWLS_ WS_OPER
name of the operation
a web archive contains all of the files that make up a web application
getAdIds, getEmailURIs
JMX_SERVER the string “MBeans on” followed by server name
MBeans on QSERVE5
JMX_DOMAIN name of the web application containing the bean
petstore(Administration)
JMX_CONDITION condition label you specified when defining the condition
MonitorEStoreAcct
Table 2 Instance naming conventions (Part 3 of 3)
Application Instance naming convention Example
Chapter 1 Product components and capabilities 39

1
40 PATROL for BEA WebLogic User Guide

C h a p t e r 2
2 Installing and migrating PATROL for BEA WebLogicThis chapter describes how to install and upgrade PATROL for BEA WebLogic.
Installation requirements . . . . . . . . . . . . . . . . . . . . . . . . . . . . . . . . . . . . . . . . . . . . . . . . . . 42Performance and scalability. . . . . . . . . . . . . . . . . . . . . . . . . . . . . . . . . . . . . . . . . . . . . 42License. . . . . . . . . . . . . . . . . . . . . . . . . . . . . . . . . . . . . . . . . . . . . . . . . . . . . . . . . . . . . . . 43Installation account . . . . . . . . . . . . . . . . . . . . . . . . . . . . . . . . . . . . . . . . . . . . . . . . . . . . 43
Preparing to install. . . . . . . . . . . . . . . . . . . . . . . . . . . . . . . . . . . . . . . . . . . . . . . . . . . . . . . . 44Security Requirements . . . . . . . . . . . . . . . . . . . . . . . . . . . . . . . . . . . . . . . . . . . . . . . . . 44Installation prerequisites . . . . . . . . . . . . . . . . . . . . . . . . . . . . . . . . . . . . . . . . . . . . . . . 44Target computers and their roles . . . . . . . . . . . . . . . . . . . . . . . . . . . . . . . . . . . . . . . . 46Determining where to install KMs based on architecture. . . . . . . . . . . . . . . . . . . . 47Default and custom installation types . . . . . . . . . . . . . . . . . . . . . . . . . . . . . . . . . . . . 48PATROL security. . . . . . . . . . . . . . . . . . . . . . . . . . . . . . . . . . . . . . . . . . . . . . . . . . . . . . 49Remotely versus locally managed servers. . . . . . . . . . . . . . . . . . . . . . . . . . . . . . . . . 51
Installing PATROL for BEA WebLogic. . . . . . . . . . . . . . . . . . . . . . . . . . . . . . . . . . . . . . . 52Typical new installation . . . . . . . . . . . . . . . . . . . . . . . . . . . . . . . . . . . . . . . . . . . . . . . . 52
Upgrading from an earlier version . . . . . . . . . . . . . . . . . . . . . . . . . . . . . . . . . . . . . . . . . . 55Removing previous profiling and instrumentation libraries . . . . . . . . . . . . . . . . . 55Automatic migration of console and agent customizations . . . . . . . . . . . . . . . . . . 58Determining whether you can migrate KM customizations. . . . . . . . . . . . . . . . . . 58Conditions for upgrading. . . . . . . . . . . . . . . . . . . . . . . . . . . . . . . . . . . . . . . . . . . . . . . 59Determining the location of PATROL . . . . . . . . . . . . . . . . . . . . . . . . . . . . . . . . . . . . 59
Upgrade scenarios for PATROL for BEA WebLogic . . . . . . . . . . . . . . . . . . . . . . . . . . . 61Upgrading without saving KM customizations . . . . . . . . . . . . . . . . . . . . . . . . . . . . 63Upgrading and preserving KM customizations . . . . . . . . . . . . . . . . . . . . . . . . . . . . 63Migrating your KM customizations . . . . . . . . . . . . . . . . . . . . . . . . . . . . . . . . . . . . . . 64Preparing to upgrade . . . . . . . . . . . . . . . . . . . . . . . . . . . . . . . . . . . . . . . . . . . . . . . . . . 64Migrating customizations with the PATROL migration tools . . . . . . . . . . . . . . . . 65Creating an installation package of the merged PATROL for BEA WebLogic . . 72Removing files from the PATROL_CACHE directories . . . . . . . . . . . . . . . . . . . . . 73Migrating customizations manually. . . . . . . . . . . . . . . . . . . . . . . . . . . . . . . . . . . . . . 73
Importing into a distribution tool . . . . . . . . . . . . . . . . . . . . . . . . . . . . . . . . . . . . . . . . . . . 74Distribution Server . . . . . . . . . . . . . . . . . . . . . . . . . . . . . . . . . . . . . . . . . . . . . . . . . . . . 75
Chapter 2 Installing and migrating PATROL for BEA WebLogic 41

2
Importing into the Distribution Server . . . . . . . . . . . . . . . . . . . . . . . . . . . . . . . . . . . . 75Installing by using the Distribution Server . . . . . . . . . . . . . . . . . . . . . . . . . . . . . . . . 76
Considerations for using online Help . . . . . . . . . . . . . . . . . . . . . . . . . . . . . . . . . . . . . . . . 77Uninstalling PATROL for BEA WebLogic . . . . . . . . . . . . . . . . . . . . . . . . . . . . . . . . . . . . 80
Uninstalling PATROL for BEA WebLogic on Unix . . . . . . . . . . . . . . . . . . . . . . . . . 81Uninstalling PATROL for BEA WebLogic on Windows . . . . . . . . . . . . . . . . . . . . . 85
Where to go from here . . . . . . . . . . . . . . . . . . . . . . . . . . . . . . . . . . . . . . . . . . . . . . . . . . . . . 89
Installation requirementsBefore installing PATROL for BEA WebLogic, verify that your system is supported for this product and that you have a valid license from BMC Software and an appropriate account from which to install the product. For information about the system requirement, see the Release Notes for this release of the product.
If you will be using the JVM Profiling and Instrumentation features, verify that your Java environment is supported for this product.
Performance and scalability
BMC Software tested PATROL for BEA WebLogic to assess its performance in typical WebLogic environments in different configurations with the following results:
■ In a basic out-of-the-box configuration, monitoring an active WebLogic environment, PATROL for BEA WebLogic used negligible resources.
■ Turning on Instrumentation features slightly increased the load on the PATROL Agent.
■ Due to inherent overhead of the JVMPI, turning on Profiling features significantly increased the CPU load and caused extended load times for the PATROL Agent. As a result, BMC Software recommends using Profiling features only as a development and test tool outside the production environment.
NOTE Any information for Unix, unless otherwise specified, applies to any supported versions of Linux.
42 PATROL for BEA WebLogic User Guide
2
License
Verify that you have a a permanent license to run your PATROL product or a valid demonstration license. If you have not yet installed a permanent license, contact your BMC Software sales representative or BMC’s Contract Administration department for licensing information.
Installation account
Install PATROL for BEA WebLogic on each machine using the dedicated PATROL OS account under which you installed the PATROL Console or Agent.
If you do not already have a dedicated PATROL account, this section describes how to set up a PATROL installation account for Windows and Unix platforms.
Windows environment
PATROL requires a dedicated user account in the Windows environment known as the PATROL default account. The PATROL default account must be created before you install PATROL. The PATROL default account can be either a local or a domain account.
Stand-alone workgroup servers must use a local user account as a PATROL default account. Servers that are trusted members of a domain may use either a local or domain account. In each case, the PATROL default account must be a member of the local administrators group of the computer where the agent will reside.
PATROL default accounts on domain controllers should be only domain accounts. The account on a domain controller must be a member of the domain administrators group.
Although you can use an existing Windows user account, BMC Software recommends that you create a separate Windows user account for PATROL.
Unix environments
BMC Software recommends that the Unix account that you create meets the following conditions:
WARNING Do not use a domain or local Administrator account as the PATROL default account. Such account usage causes files created by PATROL to be owned by the Administrator, which could result in security or file access problems.
Chapter 2 Installing and migrating PATROL for BEA WebLogic 43
2
■ The account .login, .profile, .cshrc, and .kshrc files should contain as little user customization as possible. Specifically, there should be no aliases, the prompt should be set to the default, and there should be no command in these files to change the umask setting. The recommended umask setting for the installation account is 022.
■ Do not use root to install PATROL products as this may create security risks.
■ Be sure the account has permission to create directories in the directory where you will install PATROL products.
The account that you use to install PATROL must have permission to write the installation logs to the $HOME and /tmp directories on the computer where you are installing products.
Preparing to installBMC Software recommends that you install the product on a limited number of development or test machines first, configure and test the product, and then install it onto production machines.
Security Requirements
■ The default PATROL User needs to have recursive read access to the entire WebLogic and JDK installation trees.
■ The files in the subdirectory $PATROL_HOME/../BEAWLKM must be recursively readable for the world.
■ The subdirectory $PATROL_HOME/../BEAWLKM must be writable to the world.
Installation prerequisites
Before you install PATROL for BEA WebLogic, you must
■ ensure you are using the appropriate version of the installation utility (see page 45)■ understand target machines and their roles (see page 46)■ understand PATROL security options (see page 49)■ decide if you want to manage your WebLogic servers locally or remotely (see
page 51)
44 PATROL for BEA WebLogic User Guide
2
Checking for product patches or fixes before installing
Product fixes or patches are often available through the BMC Software Web site. Patches correct problems that are found after a product is released. BMC Software recommends that you check the product page for this version of PATROL for BEA WebLogic on the BMC Software Customer Support Web page to determine whether a patch is available before you begin installing a product.
Remote installation
If you create an installable image, the product configuration information that you enter, such as the BMC Software products installation directory, account names, passwords, PATROL Agent port number, and security options, must be the same for all computers on which the image is to be installed. If you want to specify different settings for different computers, you must either create a separate image for each set of values that you want to implement or edit the variables in the image’s control file by using the ctltool.
For more information about creating, distributing, and installing installable images, and about using the ctltool, see the PATROL Installation Reference Manual.
Determining the version of the installation utility
The installation instructions contained in this version of the PATROL for BEA WebLogic User Guide pertain to version 7.5.21 of the PATROL Installation Utility.
This version of the installation utility might be different from the version included on another product CD or from a version that you downloaded from the BMC Software Electronic Product Download (EPD) site. If you use a version of the PATROL Installation Utility other than version 7.5.21, the instructions in this manual may not precisely match what you see on your screen.
To determine the version of an installation utility, perform the following steps:
1 Open a command prompt.
2 Navigate to the directory where the installation utility is located.
3 Enter one of the following commands:
■ setup.exe -v (Windows) ■ setup.sh -v (Unix)
A message box displays the version of the installation utility.
Chapter 2 Installing and migrating PATROL for BEA WebLogic 45

2
Target computers and their roles
The installation utility prompts you to select the roles performed by the computer on which you are installing BMC Software products (the target computer). Before beginning the installation process, review the following definitions of the roles that are presented in the installation utility and decide which of these roles is performed by each computer in your environment.
Roles performed by computers in the PATROL architecture
■ Console Systems (also referred to as console computers) host user desktop applications such as consoles, user interfaces, viewers, and browsers. Select this option if the computer to which you are installing will perform any of the following roles:
— monitor and manage on Windows by using a PATROL Central Operator — Microsoft Windows Edition console (PATROL 7.x architecture)
— monitor, manage, and develop KMs on Unix by using a PATROL Classic Console for Unix (PATROL 3.x architecture)
— monitor, manage, and develop KMs on Windows by using a PATROL Classic Console for Windows (PATROL 3.x architecture)
■ Managed Systems (also referred to as agent computers) host software that manages the resources on the computer, such as a PATROL Agent, PATROL Knowledge Modules, and Service Reporting Retrievers. Select this option if the computer to which you are installing will perform any of the following roles:
— host a PATROL Agent 3.5 (works with both the PATROL 3.x and PATROL 7.x architecture)
— host KMs and components that contain the knowledge that PATROL uses to monitor the resources on this computer
■ A Common Services (PATROL 7.x architecture) computer hosts services that are shared among managed systems and console systems. You can install each of these common services on any computer in the network. Select this option if the computer to which you are installing will perform any of the following roles:
— host the PATROL Central Operator – Web Edition (PATROL 7.x architecture) Web server
— host the PATROL Console Servers— host the RTservers
46 PATROL for BEA WebLogic User Guide

2
Additional information
For more information about the PATROL consoles and PATROL Console Server or RTserver, see the product’s respective online help systems and the following documents:
■ PATROL Central Operator - Web Edition Getting Started■ PATROL Central Operator - Microsoft Windows Edition Getting Started■ PATROL Console Server and RTserver Getting Started■ PATROL Configuration Manager User Guide■ PATROL Console for Unix User Guide■ PATROL Console for Microsoft Windows User Guide - Understanding the Basics of
PATROL, Volume 1
Determining where to install KMs based on architecture
PATROL 3.x and PATROL 7.x architectures differ as to which target computers store Knowledge Modules and how much KM information is required by each type of system. During installation, ensure that you select the appropriate types of systems according to the following information:
PATROL 3.x
Install KM packages to Managed Systems and Console Systems.
A PATROL 3.x environment includes the following components:
■ PATROL Agent 3.5 or 3.6 runs on Managed Systems.■ PATROL Console for Windows or PATROL Console for Unix 3.5 runs on Console
Systems.
PATROL 7.x
For PATROL Central Operator – Microsoft Windows Edition, install KM packages to Console Systems, Common Services Systems, and Managed Systems.
For PATROL Central Operator – Web Edition, install KM packages to Common Services Systems and Managed Systems.
Chapter 2 Installing and migrating PATROL for BEA WebLogic 47

2
A PATROL 7.x environment includes the following components:
■ PATROL Agent 3.5 or 3.6 runs on Managed Systems.■ RTserver runs on Commons Services Systems.■ PATROL Console Server runs on Common Services Systems.■ PATROL Central Operator – Microsoft Windows Edition, PATROL Central
Operator – Web Edition, or both run on Console Systems.
For more information about the PATROL 7.x architecture, see the PATROL Infrastructure Planning Guide.
Mixed PATROL 3.x and 7.x environment
A mixed PATROL 3.x and 7.x environment includes the components from both a PATROL 3.x environment and a PATROL 7.x environment.
Default and custom installation types
The installation utility prompts you to select one of the following installation types:
■ In general, use the Default installation type if you are installing PATROL for BEA WebLogic for the first time or if you are upgrading from a previous installation and you want to use standard default settings for directories and port numbers.
■ In general, use the Custom installation type if you want to install only individual components, or if you are upgrading from a previous version of PATROL for BEA WebLogic and have a PATROL environment that may be configured with non-standard settings.
NOTE If you are installing PATROL for BEA WebLogic to an existing PATROL Agent or Console environment that is not in the default installation directory, use Custom. Do not use Default. Default will automatically install the agent or console with PATROL for BEA WebLogic and overwrite your existing installation. If you do not want to overwrite your existing installation, use Custom so that you can clear the selection of the agent or console product.
48 PATROL for BEA WebLogic User Guide

2
PATROL security
You can secure the data passed between PATROL components and restrict unauthorized users from accessing your data by implementing PATROL security. PATROL security is installed as part of the agent, console server, and consoles. KMs inherit the security policy from the agent, console server, and console on which they are installed.
For more information about implementing and using PATROL security, see the following documentation:
■ PATROL Security User Guide■ PATROL Security Release Notes
Default login shell
BMC Software recommends that you define the default login shell as part of preparation to install, if you are installing into a Unix environment. Although setting a default login shell is not specifically a requirement for installation, starting the KM without having defined the correct login shell could result in unpredictable behavior.
Both the WebLogic Administration Account and the PATROL Default User Account must be set to use one of the following the default login shells:
■ the Bourne shell (sh)■ the Korn shell (ksh)
Mounting a CD on Unix
The following sections provide information about the mount commands you must use to mount the PATROL product CDs on your Unix system.
Mounting the CD drive
In this procedure, the root directory for the CD drive is called /cdrom. This directory might be different for your computer, depending on how your system administrator has configured the device. If a problem occurs, consult your system administrator or read the man page for mount.
1 Log on as root.
2 Insert the CD into the CD drive.
Chapter 2 Installing and migrating PATROL for BEA WebLogic 49

2
3 Use the mount command appropriate to your platform to mount the CD, as shown in Table 3:
4 Log off.
Mounting the CD drive for an NFS Client
Before you can mount the CD on an Network File System (NFS) device, you must export the CD file system so that it can be mounted by NFS clients.
Most platforms use the exportfs command to export a local file system, including a CD file system. However, Solaris platforms use the share command.
To mount the CD on an NFS client, follow these steps:
1 Log on as root.
2 Create a directory on your local computer (for example, /mnt/cdrom or /mnt/cdrom/cdrom0 for Solaris) as the mount point for the CD on the remote host computer.
3 Use the mount command appropriate to your platform to mount the CD.
If a problem occurs, consult your system administrator or read the man page for mount.
4 Log off.
Table 3 Mount commands by platform
Platform Mount command
AIX mount -r -v cdrfs /dev/cd0 /cdrom
HP-UX mount -F cdfs -o ro /dev/dsk/drive_for_cdrom/cdrom
Linux mount /dev/cdrom /path_to_target _mount_point
Solaris Volume Manager (/usr/sbin/vold) automatically mounts. Otherwise, mount -r -F hsfs /dev/sr0 /cdrom
Table 4 NFS mount commands by platform
Platform Mount command
AIX, HPUX-PA1.0 mount host:/cdrom /mnt/cdrom
Linux mount host:/path_to_file_system_to_be_exported / path_to_target_mount_point
Solaris mount host:/cdrom/cdrom0 /mnt/cdrom/cdrom0
50 PATROL for BEA WebLogic User Guide
2
Remotely versus locally managed servers
For remote management, which is the default configuration of PATROL for BEA WebLogic, the KM and PATROL Agent are installed only on the Admin Server Node. All other application servers running on different nodes (remote managed instances), but that are part of the same Admin domain, are automatically managed from the single Admin server node. These instances are displayed as BEAWLS_MANAGED icons.
You can also monitor a managed server without registering, monitoring, or discovering its Admin server or other managed servers within its Admin domain. In this case, you must install the PATROL Agent and KM following the same guidelines provided here for a local managed host.
If you want to monitor a remote Node Manager process, you must install the PATROL Agent and KM on the remote host and you must register the remote managed host.
For local management, a PATROL Agent and the KM must be installed on each computer that has WebLogic server running as a managed server of any monitored domain. These instances are displayed as BEAWLS_LOCAL_MANAGED icons.
The local managed server has the following additional functionalities over remote managed server:
■ log monitoring■ advance monitoring, including instrumentation and profiling■ the management of timing information using PATROL event generation on the
AvgPingTime or AvgConnTime parameters
As an example, a monitored WebLogic server domain named petstore has the following servers installed:
■ an admin server labeled as A■ a managed server (labeled as B) in the same computer as the admin server A■ a computer labeled C
Where the PATROL Agent is installed determines if the instance is a local or remote instance.
If the monitored PATROL agent is installed in A, then B is shown as a BEAWLS_LOCAL_MANAGED instance from PATROL console, while C is discovered as the BEAWLS_MANAGED instance (a remote instance).
Chapter 2 Installing and migrating PATROL for BEA WebLogic 51

2
However, if the PATROL Agent is installed in C and the PATROL console is used to attach to the PATROL Agent in C, C is displayed as the BEAWLS_LOCAL_MANAGED instance and server B is the instance of BEAWLS_MANAGED server (a remote instance).
The steps to install a local instance would be as follows:
1. Install and configure a PATROL Agent in the same machine as the WebLogic managed server.
2. Install the WebLogic KM in the host of this managed server. For more information, see “Typical new installation” on page 52.
3. Load the WebLogic Server KM to this Patrol agent. For more information, see “Loading PATROL for BEA WebLogic” on page 92.
4. Register the WebLogic Server to configure the monitored domain, inputting the admin server URL during the KM configuration. For more information, see “Registering a server” on page 93.
Installing PATROL for BEA WebLogicThis section describes how to install the latest version of PATROL for BEA WebLogic.
You should first install on a limited number of machines in a test environment, test the installation thoroughly, and then install in your production environment.
Typical new installation
1 Shut down the PATROL Agent and any classic Consoles that are running on the computer where you are installing.
2 Perform the appropriate action:
■ If you are installing from the PATROL for BEA WebLogic product CD, insert it in the CD-ROM. If you are using a Unix system, mount the CD.
NOTE By default, the Typical installation configures the PATROL Agent to connect through port 3181. If you want to use a different port, you must use the Custom installation, see “Upgrading from an earlier version” on page 55.
52 PATROL for BEA WebLogic User Guide

2
■ If you are installing from a downloaded image locate it.
3 From the root directory of the CD or the downloaded image, run the appropriate command:
■ Windows: setup.exe
■ Unix: setup.sh
If you are in a Unix environment with no web browser, or are in a Windows 2000 environment with Citrix Metaframe, perform the following steps to launch the installation program:
A From a command line prompt, change to the directory in which the installation utility is located.
B Start the installation utility using one of the following commands:
■ Unix: ./setup.sh -serveronly
■ Windows: setup.exe -serveronly
The installation program opens a dialog box with a message similar to the following example:
To connect to to the WEB server open a browser an use the following URL: http://xxx.xxx.xxx.xxx:50001/. Press OK to stop the WEB server.
C Start a web browser.
D Direct the browser to the URL displayed in the message box.
4 In the Welcome to the Installation Utility page, click Next to begin your installation.
5 In the Review Licence Agreement page, select Accept, then click Next.
6 In the Select Installation Option page, select Install products on this computer now, then click Next.
7 In the Select Type of Installation page, select the Default installation method, then click Next.
NOTE If you are installing on Compaq Tru64 4.0, you may need to use the target override option. To do this, start the setup using the following command:./setup.sh -target_override OSF1-alpha-V4
Chapter 2 Installing and migrating PATROL for BEA WebLogic 53

2
8 In the Specify Installation Directory page, enter a directory path if you do not want to accept the default directory. Click Next to continue.
9 In the Select System Roles page, select whether the computer to which you are installing is used as a monitoring console or as a target managed system (or both). Select the appropriate role, then click Next.
■ Select Console System if you are installing to computer that will host the PATROL Classic Console.
■ Select Managed System if you are installing to a computer that will host a PATROL Agent. (This is a computer on which you run BEA WebLogic Server).
■ Select Common Services if you are installing to a computer that will host the PATROL Central Operator - Web Edition (PATROL 7.x architecture) web server, the PATROL Console Servers, or the RTservers.
■ If you are not sure which option to choose, select all three roles.
10 In the Select Products and Components to Install page, click + to expand the PATROL Solutions branch, then select PATROL for BEA WebLogic version versionNumber.
11 Click Next.
12 Review the setup information on the Review Selections and Install (or Review Selections and Create Installable Image) window. If you want to change settings, click Back to go back to previous dialog boxes. Click Start Install to continue the installation.
13 When the status dialog box reports that installation is 100% complete, click Next to see the results dialog box. (Next does not appear until installation is complete.)
14 In the Installation Results page, you can click View Log to review details of the installation. Click Next to continue.
15 In the final Installation Results page, click Finish to close the installation utility.
16 If you manually started the web server is step step 2 on page 45, go to the computer where you started the web server and click OK in the dialog box.
54 PATROL for BEA WebLogic User Guide

2
Upgrading from an earlier versionIf you have a previous version of PATROL for BEA WebLogic installed on the target computer, you have the following options for upgrading to the new version of PATROL for BEA WebLogic:
■ “Upgrading without saving KM customizations” on page 63■ “Upgrading and preserving KM customizations” on page 63
Figure 4 on page 62 describes the general process of upgrading to a new version of PATROL for BEA WebLogic and migrating any customizations.
Removing previous profiling and instrumentation libraries
The JVM profiling and J2EE bytecode instrumentation features of PATROL for BEA WebLogic require several resources that must be removed if you are upgrading to this version of the product.
To remove the files that support advanced monitoring features:
1 Turn off all advanced monitoring features anywhere you have enabled it in your monitored environment. For each server on which profiling, instrumentation, or both, have been activated, disable the features as explained in “Enabling and disabling instrumentation and profiling features” on page 106.
2 Stop each of the servers on which profiling or instrumentation has been activated.
3 Clear the profiling and instrumentation code:
A Access the icon of an application server on which profiling or instrumentation has been activated.
B Choose the Advance Monitoring => Configure command.
C Select Remove This Advance Monitoring Feature.
D Click Accept.
NOTE When you select Remove This Advance Monitoring Feature, all enabled advanced monitoring features will be removed. They can not be selectively removed.
Chapter 2 Installing and migrating PATROL for BEA WebLogic 55

2
E Repeat steps A through D for each of the remaining application servers on which profiling or instrumentation has been activated.
4 Terminate all Java processes that reference the WebLogic JRE.
■ If possible, locate and terminate each process that references the WebLogic JRE.
■ If you cannot identify which JRE is a running process, it might be necessary to terminate all running Java processes.
NOTE Although a message is displayed indicating that the command succeeded, the removal of the libraries in the WebLogic JRE is a Java process which is only sched-uled, not actually accomplished.
WARNING Some Unix systems allow files to be deleted even if they are still being referenced, but doing so could produce unexpected results. Window NT and Windows 2000 require that files no longer be in use before they can be deleted.
56 PATROL for BEA WebLogic User Guide

2
5 Verify that the following files are cleared from the WebLogic JRE:
Table 5 Profiling and instrumentation files
6 If any of the files still exist in the location identified in Table 5, delete the file or files manually.
If you get an error and cannot delete a file, it is probably still being referenced by a Java process. Terminate the process and try deleting again until all of the files identified in the table have been deleted.
Operating system Path File
All OSs JAVA_HOME/jre/lib/ext BMCJ2eeExt.jar
BMCSvrExt.jar
Unix PATROL_HOME/../j2ee/bin BMCJ2eeCP.jar
BMCJ2eeSetup.jar
BMCJ2eeExt.jar
BMCJ2eeRef.jar
Windows PATROL_HOME\j2ee\bin BMCJ2eeCP.jar
BMCJ2eeSetup.jar
BMCJ2eeExt.jar
BMCJ2eeRef.jar
Windows 2000 or 2003 %JAVA_HOME%\jre\bin BMCProfiler.dll
AIX $JAVA_HOME/jre/bin libBMCProfiler.so
Solaris $JAVA_HOME/jre/lib/sparc
HP-UX $JAVA_HOME/jre/lib/PA_RISC2.0 libBMCProfiler.sl
Red Hat $JAVA_HOME/jre/lib/i386 libBMCProfiler.so
Itanium Red Hat $JAVA_HOME/jre/lib/ia64 libBMCProfiler.so
Itanium HP-UX 11.23 $JAVA_HOME/jre/lib/IA64N libBMCProfiler.so
Itanium Windows 2003 %JAVA_HOME%\jre\bin libBMCProfiler.so
SuSE SLES 8 $JAVA_HOME/jre/lib/i386 libBMCProfiler.so
Chapter 2 Installing and migrating PATROL for BEA WebLogic 57

2
Automatic migration of console and agent customizations
Only customizations to Knowledge Modules must be migrated.
Whether you choose to save and migrate your KM customizations or not, the customizations you have made to
■ agents—stored in the agent configuration file■ consoles—stored in the console cache files
are preserved and incorporated into the new version automatically.
Determining whether you can migrate KM customizations
Before migrating customizations, you must determine whether or not your customizations to PATROL for BEA WebLogic can be migrated to the new version of PATROL for BEA WebLogic. See Table 6 to determine whether migration is supported for your current version of PATROL for BEA WebLogic. If migration is supported, choose one of the following installation procedures to migrate your customizations:
■ migrating customizations using the PATROL Migration Tools version 3.5 (page 65)■ migrating customizations manually (page 73)
NOTE Customized Knowledge Modules and PSL files are also stored in the cache but they are not automatically preserved and incorporated.
Table 6 Versions that you can migrate
Component Version
PATROL for BEA WebLogic 2.4.00
PATROL for BEA WebLogic 2.3.00
PATROL for BEA WebLogic 2.2.00
PATROL for BEA WebLogic 2.1.00, 2.1.01
PATROL for BEA WebLogic 1.3.00
58 PATROL for BEA WebLogic User Guide

2
Conditions for upgrading
Use Table 7 to help you choose an upgrade procedure.
Determining the location of PATROL
During the installation process, the PATROL Installation Utility records where it installs PATROL components in environment variables. To function properly, various components of the PATROL product, such as the migration tools, require the information stored in these variables. Two important variables are PATROL_HOME and PATROL_CACHE.
Throughout this section, all references to PATROL_HOME represent %PATROL_HOME% if you are using Windows and $PATROL_HOME if you are using Unix. All references to PATROL_CACHE represent %PATROL_CACHE% if you are using Windows and $HOME/patrol if you are using Unix.
Table 7 Choosing an upgrade procedure
Use this procedure If you have this situation
Upgrading without saving KM cus-tomizations
■ have not made any customizations to the KM files in your previous version of PATROL for BEA WebLogic
■ want to overwrite customizations you made to the KM files with the default values of the new version of PATROL for BEA WebLogic
■ have a currently installed version of PATROL for BEA WebLogic that cannot be migrated (See Table 6)
Upgrading and preserving KM cus-tomizations
made customizations to the KM files in your previously installed version of PATROL for BEA WebLogic and want to save those customizations and migrate them to the new version of PATROL for BEA WebLogic
Chapter 2 Installing and migrating PATROL for BEA WebLogic 59
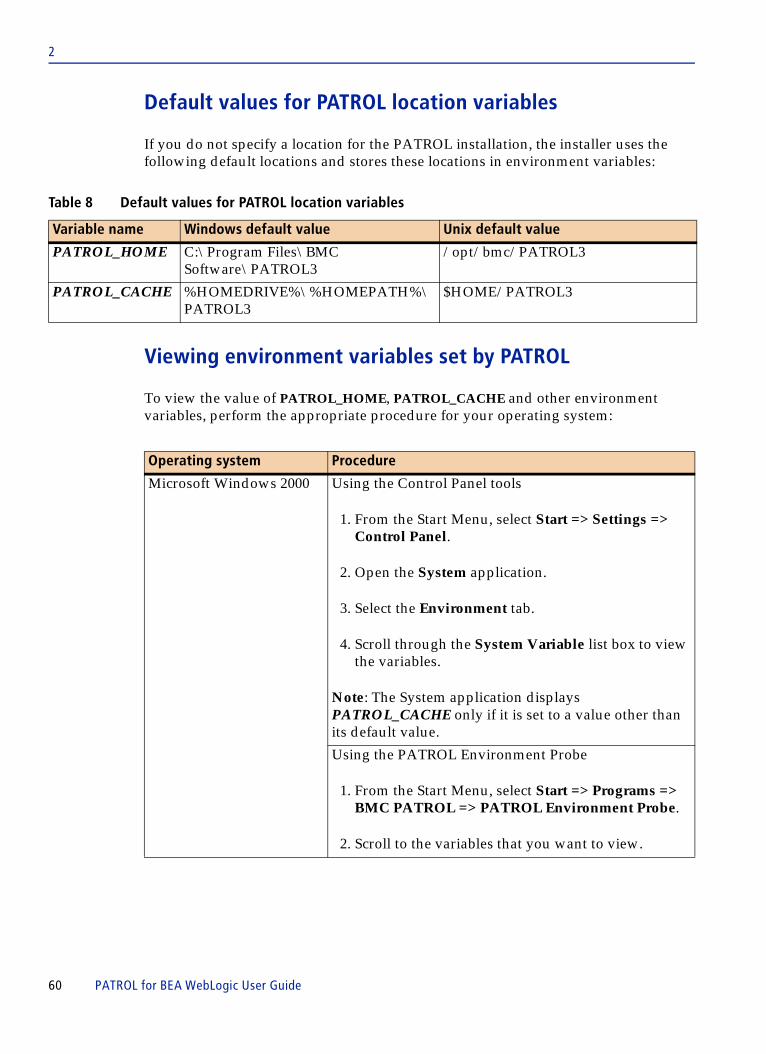
2
Default values for PATROL location variables
If you do not specify a location for the PATROL installation, the installer uses the following default locations and stores these locations in environment variables:
Viewing environment variables set by PATROL
To view the value of PATROL_HOME, PATROL_CACHE and other environment variables, perform the appropriate procedure for your operating system:
Table 8 Default values for PATROL location variables
Variable name Windows default value Unix default value
PATROL_HOME C:\Program Files\BMC Software\PATROL3
/opt/bmc/PATROL3
PATROL_CACHE %HOMEDRIVE%\%HOMEPATH%\ PATROL3
$HOME/PATROL3
Operating system Procedure
Microsoft Windows 2000 Using the Control Panel tools
1. From the Start Menu, select Start => Settings => Control Panel.
2. Open the System application.
3. Select the Environment tab.
4. Scroll through the System Variable list box to view the variables.
Note: The System application displays PATROL_CACHE only if it is set to a value other than its default value.
Using the PATROL Environment Probe
1. From the Start Menu, select Start => Programs => BMC PATROL => PATROL Environment Probe.
2. Scroll to the variables that you want to view.
60 PATROL for BEA WebLogic User Guide

2
Upgrade scenarios for PATROL for BEA WebLogic
Figure 4 on page 62 illustrates several different scenarios for upgrading PATROL for BEA WebLogic. These scenarios include
■ not migrating customizations■ migrating customizations manually■ migrating customizations using the PATROL Migration Tools and then installing
the product using,— the Common Installation Utility for local installations— the Distribution Server for remote installations)
Unix using Bourne or Korn Shell
At the shell command prompt, type export and press ENTER.
The shell displays a list of environment variables and their values.
Note: If PATROL_HOME is not set, run patrolrc.sh.
Unix using C Shell At the shell command prompt, type setenv and press ENTER.
The shell displays a list of environment variables and their values.
Note: If PATROL_HOME is not set, run patrolrc.sh.
Operating system Procedure
Chapter 2 Installing and migrating PATROL for BEA WebLogic 61
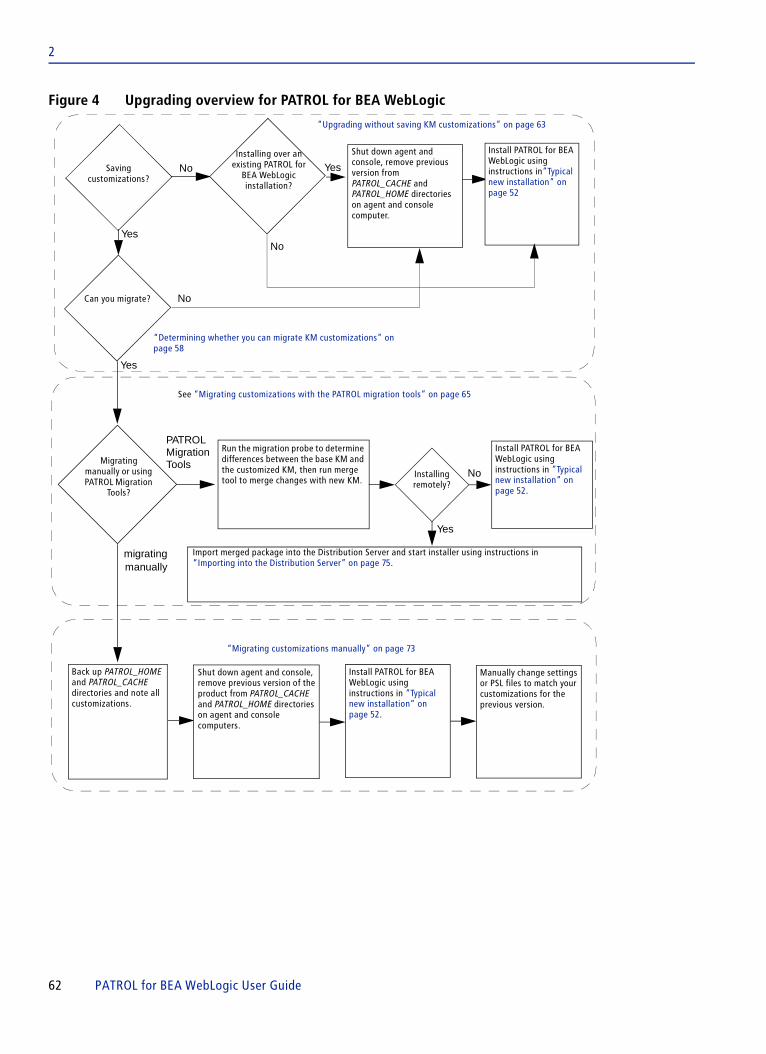
2
Figure 4 Upgrading overview for PATROL for BEA WebLogic
Saving customizations?
Migrating manually or using PATROL Migration
Tools?
Install PATROL for BEA WebLogic using instructions in“Typical new installation” on page 52
Shut down agent and console, remove previous version from PATROL_CACHE and PATROL_HOME directories on agent and console computer.
Yes
No
PATROL
migrating
Back up PATROL_HOME and PATROL_CACHE directories and note all customizations.
Install PATROL for BEA WebLogic using instructions in “Typical new installation” on page 52.
Shut down agent and console, remove previous version of the product from PATROL_CACHE and PATROL_HOME directories on agent and console computers.
manually
MigrationTools
Manually change settings or PSL files to match your customizations for the previous version.
Installing over an existing PATROL for
BEA WebLogic installation?
Yes
No
Run the migration probe to determine differences between the base KM and the customized KM, then run merge tool to merge changes with new KM.
Install PATROL for BEA WebLogic using instructions in “Typical new installation” on page 52.
See “Migrating customizations with the PATROL migration tools” on page 65
“Migrating customizations manually” on page 73
Installing remotely?
Yes
No
Import merged package into the Distribution Server and start installer using instructions in “Importing into the Distribution Server” on page 75.
“Upgrading without saving KM customizations” on page 63
Yes
NoCan you migrate?
“Determining whether you can migrate KM customizations” on page 58
62 PATROL for BEA WebLogic User Guide

2
Upgrading without saving KM customizations
If you do not want to save any customizations of .km files, PSL code, alarm thresholds, or events, you can simply install the new version of PATROL for BEA WebLogic over your previous version after moving or deleting PATROL for BEA WebLogic files from the PATROL_CACHE. See “Installing PATROL for BEA WebLogic” on page 52 for instructions.
Upgrading and preserving KM customizations
Use the appropriate task in this section if you want to upgrade to the new version of PATROL for BEA WebLogic and you want to preserve any customizations you have made to the .km files in the previous version of PATROL for BEA WebLogic.
You must first migrate your customizations from the old version of PATROL for BEA WebLogic to the new version, and then install the result into your environment. You should complete this process on a limited number of computers in the test environment first, test the merged KMs thoroughly, and then deploy them to your production environment.
NOTE Customizations applied using PATROL Configuration Manager or operator over-rides are automatically saved in the agent configuration database. They will take effect automatically unless the parameter name or application name has changed. In either of those cases, you must reapply the customizations.
NOTE To upgrade and preserve customizations, you must either migrate your customiza-tions manually, use the PATROL Migration Tools version 3.5, or use the Distribution Server. If you are using the Distribution Server, ensure that you have the latest ver-sion of the product installed as well as any available patches.
Chapter 2 Installing and migrating PATROL for BEA WebLogic 63

2
Migrating your KM customizations
Customizations made to PATROL for BEA WebLogic can include changes to the parameter alarm ranges, states, or other parameter properties.
You can migrate customizations manually or use the PATROL migration tools. Migration of .km files with the migration tools is automated, with the following exceptions:
■ modified PSL code, whether it is embedded in .km files or in .psl files■ new Knowledge Modules that you created
The results from the migration tools can be installed using either the PATROL Installation Utility or the Distribution Server. For more information about the PATROL migration tools, see the PATROL Migration Tools User Guide.
Preparing to upgrade
Whether you are upgrading and migrating customizations or simply upgrading, you must first back up the current installation. If the .kml file or any of the .km files for the new version of PATROL for BEA WebLogic has a different file name from the previous version, you must remove those files from the list of KMs that are preloaded on the PATROL Agent.
Before you begin
■ If you plan to migrate your customizations, determine whether you can migrate from a previous version of PATROL for BEA WebLogic. See Table 6 on page 58 to determine whether migration is supported for your current version of PATROL for BEA WebLogic.
■ If you are upgrading from version 2.2.00 or higher of PATROL for BEA WebLogic, you must remove the advanced Java monitoring components before upgrading. See “Removing previous profiling and instrumentation libraries” on page 55.
To back up the current installation
Back up your customizations so that you can restore the current installation if you want to roll back your upgrade.
1 Shut down any PATROL Agents, consoles, and related services that are currently running.
2 Ensure that no one is accessing any PATROL files or directories.
64 PATROL for BEA WebLogic User Guide

2
3 Perform a full backup of the directories where PATROL files are typically stored. These directories are listed in the following tables:
Windows
Unix and Linux
Where to go from here
If you are migrating customizations automatically, go to “Migrating customizations with the PATROL migration tools” on page 65.
If you are migrating customizations manually (not using the migration tools), go to “Migrating customizations manually” on page 73.
Migrating customizations with the PATROL migration tools
Use the following steps to migrate PATROL for BEA WebLogic by using the PATROL migration tools. The PATROL migration tools identify, preserve, and merge customizations from the prior version of PATROL for BEA WebLogic before you install the new version of PATROL for BEA WebLogic. The migration probe identifies and preserves customizations; the merge tool merges your customizations into the new version of PATROL for BEA WebLogic.
File type Directory
executables and data PATROL_HOME for agent and console installation directories
console customizations PATROL_CACHE for the console working cache
File type Directory
executables and data PATROL_HOME/.. for agent and console installation directories
console customizations PATROL_CACHE for the console working cache
NOTE The PATROL 3.5 migration tools do not require a KMDS server. For a detailed expla-nation and instructions for using the migration tools, see the PATROL Migration Tools User Guide.
Chapter 2 Installing and migrating PATROL for BEA WebLogic 65

2
Before you begin
■ Ensure that you have performed the procedures in “Upgrading and preserving KM customizations” on page 63.
■ Verify that the PATROL migration tools version 3.5 have been installed.
■ Verify that you have the latest version of the KM archive, available from the BMC Software ftp site at ftp://ftp.bmc.com/pub/patrol/patches/p_migration_tools.
If you do not have the latest version of the KM archive, download the updated archive from the cited ftp site and download the latest installer from ftp://ftp.bmc.com/pub/patrol/patches/COMMON_INSTALLv.r.mm/operating_system. Then extract both the KM archive and the installer and run the installer.
■ Verify that you know the version release number of the KM product that you want to probe and merge from. To determine the KM version, check the application InfoBox or view the header in the any of the .km files that compose the product.
The migration probe lists the versions of the KM packages in the syntax KM_Package_Name: v.r.mm_mm-yyyy.
■ If you are using an EPD image, ensure that the files for PATROL for BEA WebLogic and the associated installation utility have been extracted into a temporary directory.
■ (Unix only) Set the environment variables for the migration tools by running the following scripts from the directory where the migration tools and the KM archives are installed:
(Windows only) To use the PATROL Migration Probe
The PATROL migration probe compares your customized PATROL for BEA WebLogic and the original version of the PATROL for BEA WebLogic to determine the differences.
1 Start the migration probe by using the menu command (Start => Programs => BMC PATROL => New PATROL KM Migration Probe) or by executing the wmigprobe.exe file from the PATROL_HOME\bin directory.
2 From the Specify how to find KM files to be migrated dialog box, select one of the following methods to locate the KMs that you want to migrate:
Type of shell Command
Bourne or Korn . ./migrc.sh
C source ./migrc.sh
66 PATROL for BEA WebLogic User Guide

2
3 Enter the PATROL_CACHE and the PATROL_HOME directories for the modified KMs that you want to migrate and click Next.
4 In the Select KM Packages to Migrate dialog box, in the Available KM Packages list box, highlight the modified KM package that you want to migrate and click Select.
The probe lists all the archive versions of that KM product that are in the KM archives.
5 Select the version of the KM that is the same version as the KM that you customized and click Next.
6 Repeat step 4 and step 5 for all the KMs that you want to migrate. Then, click Next on the Select KM Packages to Migrate dialog box.
The probe prepares the selected KMs for output.
7 In the Output Probe Results dialog box, enter the directory for the image (either CD or EPD) for the new version of your KM product in the Location of new CD Image field, and then navigate to the Products directory.
8 In the Output Probe Results dialog box, enter the directory where you want to place the probe results in the Destination of Probe results field.
Option Description
Automatically locate KM packages in PATROL_CACHE/PATROL_HOME
generates a list of all the KMs it finds in the PATROL_CACHE or PATROL_HOME.
You can then select which of these available KMs that you want to migrate. This search method may take a long time to complete.
Automatically locate KM Packages from a console session definition
generates a list of all KMs loaded in a session by check-ing a console session file (session-<id>.km)
If you select this option, you are asked to supply the session ID number.
Manually select KM Packages
generates a list of all KM products in the KM archives
This method is the quickest and is recommended if you know which KM you want to migrate.
NOTE If you are using an EPD image, ensure that the files for PATROL for BEA WebLogic and the associated installation utility have been extracted into a tempo-rary directory.
Chapter 2 Installing and migrating PATROL for BEA WebLogic 67

2
The following directories will be created by the migration probe under the results directory that you entered:
9 Click Copy Files to start the migration process, then exit from the migration probe after the migration probe finishes.
(Windows only) To use the PATROL Merge Tool
1 Start the PATROL merge tool by using the menu command (Start => Programs => BMC PATROL => New PATROL KM Merge Tool) or by executing the wmigmerge.exe from the PATROL_HOME\bin directory.
2 In the Location of product files window, enter in the Directory Path field the results directory that you specified in step 8 on page 67.
3 Select the Use KM Merge Map file check box, and enter the directory and file for the KM merge map file:
weblogic_2_5_01.map
4 Click Merge KM to start the Merge KM process.
5 Click Create Product Image to start creating a product image.
6 When the product image is created and the process is complete, exit from the PATROL merge tool.
The PATROL merge tool creates the following additional directories under the results directory that was created by the migration probe:
Directory name Description
results_directory_name/packagename/base the original PATROL for BEA WebLogic files from the archives
results_directory_name/packagename/modified the PATROL for BEA WebLogic files to which you have made customizations
results_directory_name/packagename/new the new version of the PATROL for BEA WebLogic files from the EPD or CD image
WARNING Ensure that you use the merge map file that is created by the PATROL migration probe. The location is specified in step 8 on page 67. The location is results_directory_name\package_name\new\lib\kmmergemap.
68 PATROL for BEA WebLogic User Guide

2
(Unix only) To use the PATROL Migration Probe
The PATROL migration probe compares your customized PATROL for BEA WebLogic and the original version of the PATROL for BEA WebLogic to determine the differences.
1 Start the migration probe by executing the tmigprobe file from the PATROL_HOME directory. The migration probe has a text-based interface.
2 Select a method for locating the KMs that you want to migrate by entering the appropriate option number:
3 Enter the PATROL_CACHE and the PATROL_HOME directories for the modified KMs that you want to migrate.
4 Accept you selection of directories and continue.
Directory name Description
results_directory_name/packagename/results the merged files
results_directory_name/packagename/merged_results the complete merged PATROL for BEA WebLogic, including changed and unchanged files
results_directory_name/packagename/packaged_results the complete merged PATROL for BEA WebLogic in a package that can be used to create an installation package
Option Description
(1) Automatically locate KM packages in PATROL_CACHE/PATROL_HOME
generates a list of all the KMs it finds in the PATROL_CACHE or PATROL_HOME.
You can then select which of these available KMs that you want to migrate. This search method may take a long time to complete.
(2) Automatically locate KM Packages from a con-sole session definition
generates a list of all KMs loaded in a session by checking a console session file (session-<id>.km)
If you select this option, you are asked to supply the session ID number.
(3) Manually select KM Packages
generates a list of all KM products in the KM archives
This is the quickest method and is recommended if you know which KM you want to migrate.
Chapter 2 Installing and migrating PATROL for BEA WebLogic 69
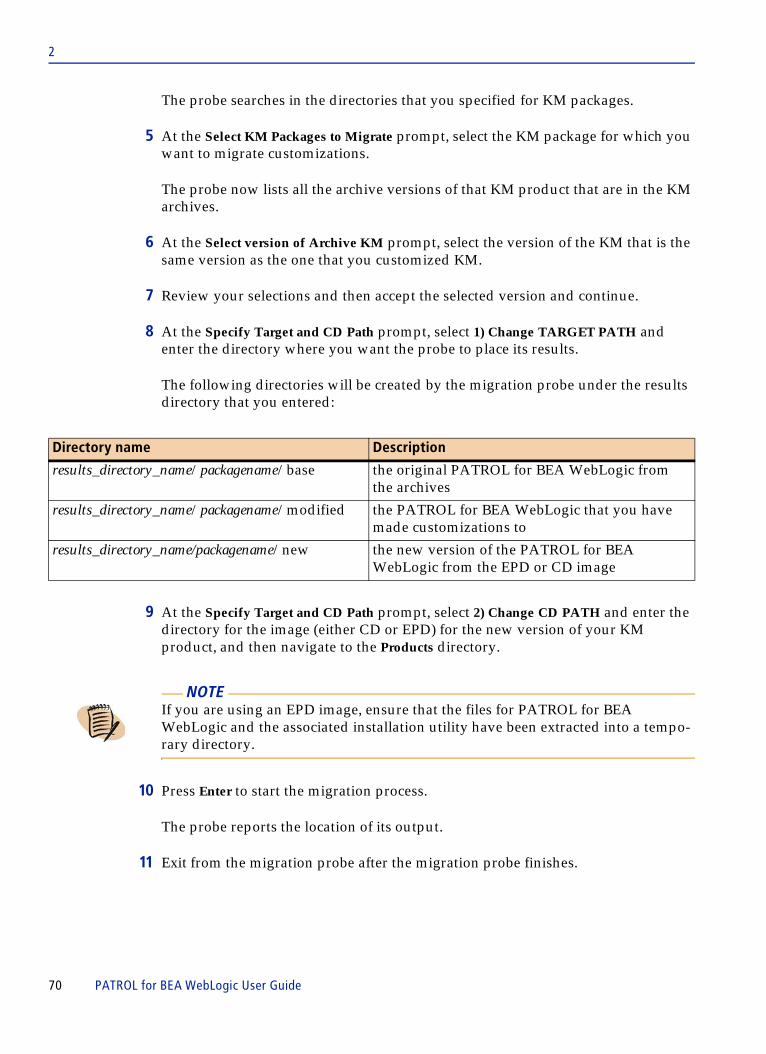
2
The probe searches in the directories that you specified for KM packages.
5 At the Select KM Packages to Migrate prompt, select the KM package for which you want to migrate customizations.
The probe now lists all the archive versions of that KM product that are in the KM archives.
6 At the Select version of Archive KM prompt, select the version of the KM that is the same version as the one that you customized KM.
7 Review your selections and then accept the selected version and continue.
8 At the Specify Target and CD Path prompt, select 1) Change TARGET PATH and enter the directory where you want the probe to place its results.
The following directories will be created by the migration probe under the results directory that you entered:
9 At the Specify Target and CD Path prompt, select 2) Change CD PATH and enter the directory for the image (either CD or EPD) for the new version of your KM product, and then navigate to the Products directory.
10 Press Enter to start the migration process.
The probe reports the location of its output.
11 Exit from the migration probe after the migration probe finishes.
Directory name Description
results_directory_name/packagename/base the original PATROL for BEA WebLogic from the archives
results_directory_name/packagename/modified the PATROL for BEA WebLogic that you have made customizations to
results_directory_name/packagename/new the new version of the PATROL for BEA WebLogic from the EPD or CD image
NOTE If you are using an EPD image, ensure that the files for PATROL for BEA WebLogic and the associated installation utility have been extracted into a tempo-rary directory.
70 PATROL for BEA WebLogic User Guide
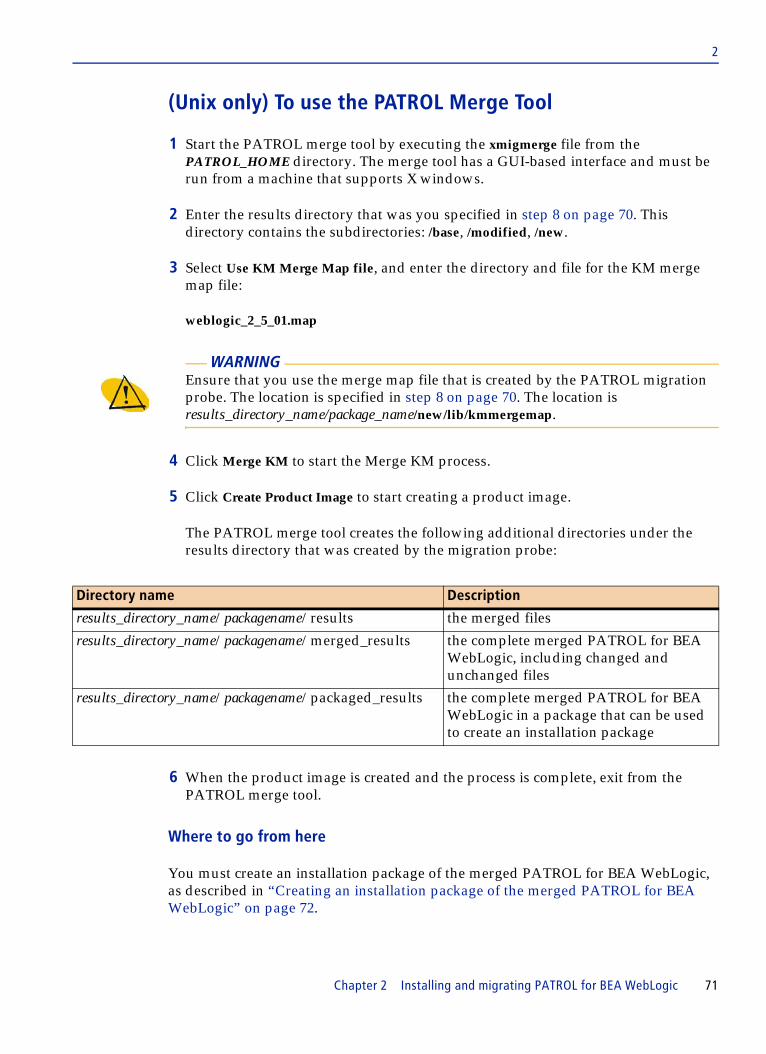
2
(Unix only) To use the PATROL Merge Tool
1 Start the PATROL merge tool by executing the xmigmerge file from the PATROL_HOME directory. The merge tool has a GUI-based interface and must be run from a machine that supports X windows.
2 Enter the results directory that was you specified in step 8 on page 70. This directory contains the subdirectories: /base, /modified, /new.
3 Select Use KM Merge Map file, and enter the directory and file for the KM merge map file:
weblogic_2_5_01.map
4 Click Merge KM to start the Merge KM process.
5 Click Create Product Image to start creating a product image.
The PATROL merge tool creates the following additional directories under the results directory that was created by the migration probe:
6 When the product image is created and the process is complete, exit from the PATROL merge tool.
Where to go from here
You must create an installation package of the merged PATROL for BEA WebLogic, as described in “Creating an installation package of the merged PATROL for BEA WebLogic” on page 72.
WARNING Ensure that you use the merge map file that is created by the PATROL migration probe. The location is specified in step 8 on page 70. The location is results_directory_name/package_name/new/lib/kmmergemap.
Directory name Description
results_directory_name/packagename/results the merged files
results_directory_name/packagename/merged_results the complete merged PATROL for BEA WebLogic, including changed and unchanged files
results_directory_name/packagename/packaged_results the complete merged PATROL for BEA WebLogic in a package that can be used to create an installation package
Chapter 2 Installing and migrating PATROL for BEA WebLogic 71
2
Creating an installation package of the merged PATROL for BEA WebLogic
After you have migrated and merged your customizations, you must create an installation package that can be used with the installation utility to install locally on one computer or with Distribution Server, to install remotely on multiple computers.
1 Copy the entire contents of the PATROL for BEA WebLogic CD to a temporary directory on a hard drive on a server. You can delete this temporary directory after you have successfully created an installable image.
2 Navigate to the packaged_results directory for the merged package and open the .ppf file with a text editor. Write down the file name in the first line of the .ppf file. This file name is the name of the directory that you will look for in the Products directory of the CD image.
3 Rename the packaged_results directory with the file name that you found in the .ppf file in the previous step.
4 Copy the renamed directory to the Products directory of the temporary directory that you used in Step 1. You will be replacing the files there with the merged files that contain your customizations.
5 Copy the PATROL for BEA WebLogic CD image to the server that you will use to install PATROL for BEA WebLogic.
Where to go from here
■ Remove the files in the PATROL_CACHE directory by following the instructions in “Removing files from the PATROL_CACHE directories” on page 73.
■ Install PATROL for BEA WebLogic from the target server by following the instructions in “Installing PATROL for BEA WebLogic” on page 52.
■ Import the customized version of PATROL for BEA WebLogic into the Distribution Server by following the instructions in “Importing into the Distribution Server” on page 75.
EXAMPLE If pokckm/8.5.00/030107-233044 was listed in the first line of the .ppf file, you would use pokckm as the directory name.
72 PATROL for BEA WebLogic User Guide

2
Removing files from the PATROL_CACHE directories
Before you install, you must remove the current PATROL for BEA WebLogic files from the PATROL_CACHE directory for the console. If you do not, old product files in PATROL_CACHE are loaded instead of the newly installed files from PATROL_HOME. You may want to create a backup copy of the files elsewhere on your system before deleting the files.
Delete files with the following naming patterns from PATROL_CACHE\knowledge and PATROL_CACHE\psl:
■ BEAWL*■ JMX*
Migrating customizations manually
If you have only a few customizations, you might find manual migration easier than migrating using the PATROL migration tools. If you have made customizations to the PATROL Script Language (PSL) code, you must manually migrate those customizations. This task contains a procedure for manually migrating each kind of customization.
To migrate customizations to KM Files manually
1 Ensure that you have made a record of your customizations and have backed up the customized files in the PATROL_HOME and PATROL_CACHE directories.
2 Uninstall the old version of PATROL for BEA WebLogic.
3 Install the new version of PATROL for BEA WebLogic as described in the section “Installing PATROL for BEA WebLogic” on page 52.
4 Identify and record the coding changes, which represent your customizations, in PATROL for BEA WebLogic by comparing the content of the ASCII files in the newly installed PATROL for BEA WebLogic version with the content of the customized ASCII files with the same name that is saved in the directory to which you moved the old version.
5 Incorporate your customizations to the new PATROL for BEA WebLogic by performing the following steps:
A Restart the PATROL console.
B Load the newly installed PATROL for BEA WebLogic.
Chapter 2 Installing and migrating PATROL for BEA WebLogic 73
2
C Using a PATROL developer console, enter the customizations that you identified in step 4, one by one.
To migrate customized PSL code
Customizations made to PATROL Script Language (PSL) code are not automatically migrated. These customizations may be embedded in .km files or stored in separate .psl files. Migrate these customizations manually, using the following guidelines:
■ If you modified .psl files that were shipped by BMC Software, you must manually re-edit the PSL code in the new KM by using a PATROL developer console to reapply your changes.
■ If you modified PSL code embedded in a .km file, that code will be overwritten when you install a new version of the product. You must manually edit the new .km files by using a PATROL developer console to reapply your changes.
■ If you created a new PSL file (not shipped by BMC Software) outside of a .km file, or if you created new PSL code (not shipped by BMC Software) and embedded it in a .km file that was shipped by BMC Software, use the pslsearch utility to search your .km, .psl, and .ctg files for terms that you may have used that have since been adopted by BMC Software as PSL keywords. Rename any terms that pslsearch identifies as matching existing keywords. Reapply your changes by using a PATROL developer console. For instructions about using the pslsearch utility, see the PATROL Migration Tools User Guide.
Importing into a distribution toolThe PATROL for BEA WebLogic can be installed locally to a single computer or remotely to multiple computers using BMC Software’s Distribution Server.
The details of how to install a product across an enterprise to multiple machines by using Distribution Server is beyond the scope of this book. However, this section does describe how to import the PATROL for BEA WebLogic product into the tool. It also provides a high-level overview of the enterprise installation process that uses this product.
NOTE If you have a customized PSL library that was compiled with an earlier version of the PSL compiler than the version that was provided with PATROL 3.2.09i, you must manually recompile the library by using the PATROL 3.4.11 compiler.
74 PATROL for BEA WebLogic User Guide

2
Distribution Server
You use the Distribution Server to perform remote installations or uninstallations of BMC Software distributed systems products across multiple systems from a central location.
With the Distribution Server you can
■ Install, uninstall, upgrade, and reinstall products on remote systems from one central location.
■ Create collections of products and system groups to distribute multiple products to multiple systems in one distribution.
■ Schedule a distribution for a specific date and time.
■ Maintain multiple product versions to be distributed.
■ View reports to check distribution status, gather distribution data, and diagnosis problems.
Importing into the Distribution Server
This task describes how to import components into the Distribution Server for deployment to multiple locations.
Before you begin
■ The customized installation packages that resulted from “Creating an installation package of the merged PATROL for BEA WebLogic” on page 72 must be accessible to the Distribution Server.
■ Ensure that you use the Distribution Server version 7.1.15 and apply any available patches.
To import components into the Distribution Server
1 Using the Distribution Server Manager, start the Distribution Server and connect to it.
2 In the Distribution Server tab area, click the Components tab.
3 In the list area, click the Import button.
Chapter 2 Installing and migrating PATROL for BEA WebLogic 75

2
4 Navigate to the location where the components are located and click Next.
5 Select the directory that contains the Products directory (do not select the Products directory itself).
If the components are not accessible on a local drive, you can specify them by using the NFS name and path.
6 Select the check boxes for the components that you want to import and click OK.
7 Click Import to import the selected components.
Installing by using the Distribution Server
Once you have imported the PATROL for BEA WebLogic into the Distribution Server, you must perform the following tasks within the tool. The tasks can be grouped into three stages.
To set up products
1 Import components into the Distribution Server repository on the Components tab of the Distribution Manager.
2 Arrange components in collections on the Collections tab of the Distribution Manager.
3 Configure the collections on the Configurations tab of the Distribution Manager.
EXAMPLE Assuming that you copied the CD image into a directory called merged_CD and then, after migrating your customizations and creating a customized installation package, you copied the updated package to the directory containing the CD image, the resultant directory structure would resemble:(Windows Only) merged_CD\Products\pokchm (Unix Only) merged_CD/Products/pukchmYou would select the directory merged_CD.
76 PATROL for BEA WebLogic User Guide

2
To set up systems
1 Create accounts in the operating system of the computers to which you want to distribute PATROL for BEA WebLogic.
2 Add accounts and create profiles for the systems on the Systems tab of the Distribution Manager.
3 Add the systems and install the Distribution Client on the Systems tab of the Distribution Manager.
4 Arrange systems in system groups on the Systems tab of the Distribution Manager.
To distribute products
1 Distribute configurations of collections to system groups on the Distributions tab of the Distribution Manager.
2 Run reports to review distributions on the Reports tab of the Distribution Manager.
For detailed instructions about how to perform remote installations with the Distribution Server, see the Distribution Server Getting Started Guide.
Considerations for using online HelpIf you plan to install the Unix version of PATROL for BEA WebLogic on a PATROL Console for Unix, you must install the supported version of the Help browser separately if it is not already installed.
Browser version required for viewing PATROL Console for Unix Help
The appropriate one of the following browsers is required to view PATROL Help in PATROL version 3.x:
■ Unix: Netscape Navigator version 3.01 through 4.78■ Red Hat Linux: Netscape Navigator version 4.x
PATROL Help does not support Netscape Navigator 6.0.
Chapter 2 Installing and migrating PATROL for BEA WebLogic 77
2
Installation requirement
You must install Netscape Navigator on the computer where the PATROL console resides. You can install Netscape anywhere on your Unix computer as long as the binary is in the path.
Download location
Netscape Navigator is supplied by Netscape Communications Corp. You can locate the browser at http://browser.netscape.com/ns8/download/archive.jsp.
Additional considerations for using online Help for Unix
When you select Help from the PATROL Console for Unix, it may take a few seconds for the Help browser to launch. Two windows will be displayed. First, the Netscape Navigator window is displayed as an icon, and then a browser window that contains the Help is displayed.
In addition, you must be aware of the following restrictions:
■ Netscape Navigator displays warning messages when it is invoked multiple times within the same user account because of its file-locking mechanism. It will, however, continue functioning.
■ By default, when Netscape Navigator starts, it uses a private color map. As a result, you might experience color flashing on your workstation. If so, you can set the value of PATROL_BROWSER so that the colormap option is not specified. However, some subsequent color requests might fail and the online Help will be improperly displayed.
■ The Exceed for Windows NT X Window Server product by Hummingbird Communication Ltd. may not always display the Help files properly.
Consult your Netscape Navigator documentation for specific platform requirements and restrictions.
Required environment variables settings for the browser
The LANG, PATH, and PATROL_BROWSER environment variables must be set for the Help browser to run properly. The following sections describe these variables.
78 PATROL for BEA WebLogic User Guide

2
LANG variable
The Unix LANG environment variable must be set to C so that Netscape Navigator will work properly. Otherwise, you might experience product failures.
PATH variable
The PATROL user account PATH variable must contain the location of the directory containing the Netscape files. If the directory containing the Netscape files is not in the path, add the directory to the PATROL user account path.
This requirement applies only to the PATROL user account on the PATROL console computer.
PATROL_BROWSER variable
When PATROL starts the Help browser, it uses the command in the PATROL_BROWSER environment variable. As a default, the PATROL_BROWSER environment variable contains the following command:
To use different arguments, set the value of PATROL_BROWSER to the appropriate string.
Type of shell Export command for LANG variable
Bourne LANG=Cexport LANG
Korn export LANG=C
C setenv LANG=C
Type of shell Export command for PATH variable
Bourne PATH=$PATH:/netscape_locationexport PATH
Korn export PATH=$PATH:/netscape_location
C setenv PATH=$PATH:/netscape_location
Type of shell Export command for PATROL_BROWSER variable
Bourne PATROL_BROWSER=netscape -display $DISPLAY -install -iconicexport LANG
Korn export PATROL_BROWSER=netscape -display $DISPLAY -install -iconic
C setenv PATROL_BROWSER=netscape -display $DISPLAY -install -iconic
Chapter 2 Installing and migrating PATROL for BEA WebLogic 79

2
Uninstalling PATROL for BEA WebLogicTo uninstall PATROL for BEA WebLogic you must use the same version of the installation utility that you used to install the product. Run the installation utility in uninstall mode to uninstall PATROL for BEA WebLogic from your system.
Determining the version of the installation utility
To determine the version of the installer, perform the following procedure.
1 Access a command prompt and navigate to the appropriate location:
■ Windows: BMC_ROOT\Uninstall
■ Unix: BMC_ROOT/Uninstall
2 Type the following command and press ENTER.
■ Windows: uninstall.exe -v
■ Unix: ./uninstall.sh -v
Other information to know before uninstalling PATROL for BEA WebLogic
EXAMPLE For a Korn shell:
export PATROL_BROWSER=/usr/local/bin/netscape -raise
WARNING If you use a different version of the installation program to uninstall, you might remove files needed to perform uninstallation of other BMC Software products.
NOTE If you used the advanced profiling and instrumentation features of PATROL for BEA WebLogic, you may need to uninstall Java components. See “Removing previous profiling and instrumentation libraries” on page 55.
80 PATROL for BEA WebLogic User Guide

2
Uninstalling PATROL for BEA WebLogic on Unix
The following procedure describes how to uninstall PATROL for BEA WebLogic from a Unix environment with or without a browser installed.
To uninstall individual products using the installation utility
1 Change to the Uninstall directory in your BMC Software product installation directory and enter the following command to launch the installation utility in uninstall mode:
./uninstall.sh
2 The Welcome window is displayed, and click Next.
3 Select the installation directory from which you want to remove a product, and click Next.
4 Select the product or products that you want to uninstall, and click Next.
5 Review your selections and click Uninstall.
After the uninstallation is complete, a window is displayed that tells you whether the uninstallation was successful.
To uninstall individual products in a Unix environment without a browser
1 If you are uninstalling from a Unix environment without a browser perform the following steps to launch the installation utility:
A From a command line, change to the Uninstall directory and enter the following command to start the installation Web server:
./uninstall.sh -serveronly
A A message box is displayed that shows the URL to use to connect to the installation Web server.
B On another machine with a browser, start the browser.
C Connect to the installation Web server from the browser to start the installation utility by using the URL that is displayed in the message box.
2 The Welcome window is displayed, and click Next.
Chapter 2 Installing and migrating PATROL for BEA WebLogic 81

2
3 Select the installation directory from which you want to remove a product, and click Next.
4 Select the product or products that you want to uninstall, and click Next.
5 Review your selections and click Uninstall.
After the uninstallation is complete, a window is displayed that tells you whether the uninstallation was successful.
Uninstalling all products on Unix preserving customizations
This task describes how to uninstall the PATROL product but retain log files, which contain history for future analysis, and configuration files for redeployment.
1 Uninstall all products as described in “To uninstall individual products” on page 85.
2 Locate the uninstall.ctl file in the following directory.
BMC_Products_Installation_directory/Uninstall/Install/instdata
3 Open the uninstall.ctl file in a text editor, and edit the /BMC/Base variable to specify the name of the directory from which you removed the products in step 1.
4 Open a command line prompt.
5 Change to the following directory.
BMC_Products_Installation_directory/Uninstall/Install/ instbin
6 Enter the following commands:
thorinst.sh -uninstall path_to_control_file -log path_to_log_file -output path_to_output_log_file
Use the following table to help determine the log file and output log file locations:
82 PATROL for BEA WebLogic User Guide

2
Example (Unix only)
If /opt/bmc is your product installation directory, you would change to /opt/bmc/Uninstall/Install/instbin directory and enter the following command:
This action would remove all installation files and directories except those that are used by the utility at the time the uninstallation is performed. Log files, configuration files, and user-modified files would also be retained.
Uninstalling all products on Unix without preserving customizations
This task describes how to remove all PATROL products and related log files and configuration files from your Unix computer. Once these files have been removed, you cannot recover them unless you have made a back-up copy of the installation.
Option Description Value
-log sends the log information to a standard log file
This file contains all installation status information.
path to log file;any valid path and file name (with a .txt extension)
If a space exists in the path, the entire path must be enclosed in quotation marks.
-output sends the log information to an output log file
This file contains all messages about the progress of the installation that are normally sent to standard output.
path to output log file;any valid path and file name (with a .txt extension)
If a space exists in the path, the entire path must be enclosed in quotation marks.
thorinst.sh -uninstall “/opt/bmc/Uninstall/Install/instdata/uninstall.ctl” -log /var/logs/NetworkLogs/MyLogs.txt -output /var/adm/NetworkLogs/MyLogs.out
Chapter 2 Installing and migrating PATROL for BEA WebLogic 83
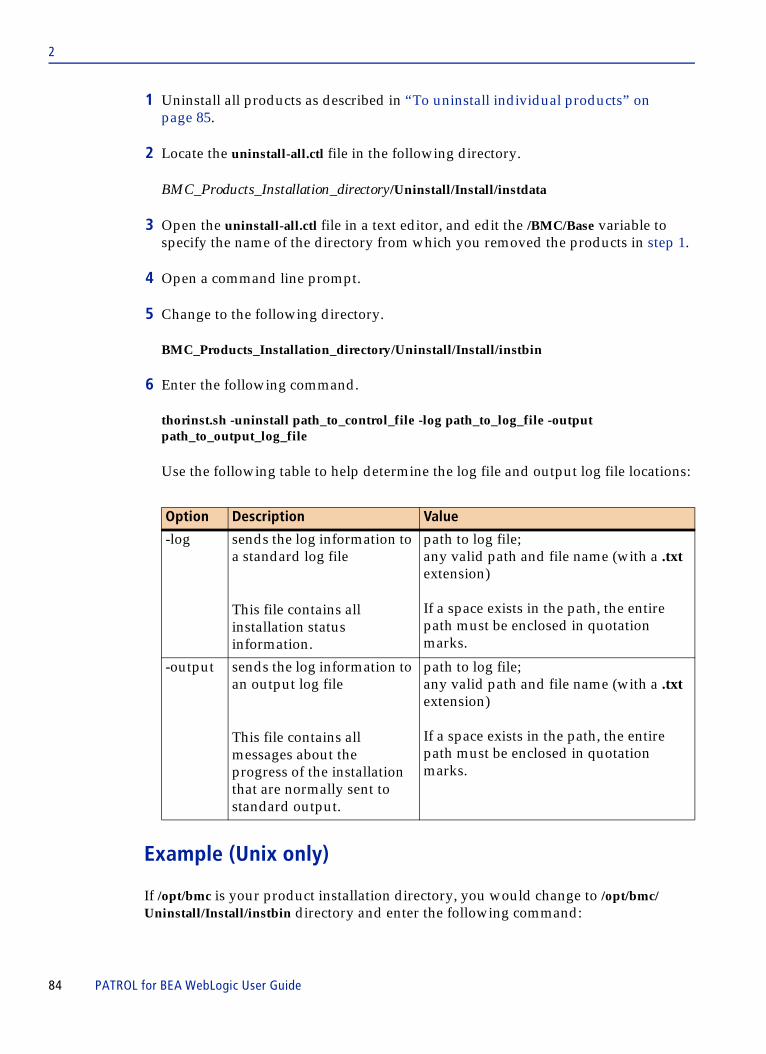
2
1 Uninstall all products as described in “To uninstall individual products” on page 85.
2 Locate the uninstall-all.ctl file in the following directory.
BMC_Products_Installation_directory/Uninstall/Install/instdata
3 Open the uninstall-all.ctl file in a text editor, and edit the /BMC/Base variable to specify the name of the directory from which you removed the products in step 1.
4 Open a command line prompt.
5 Change to the following directory.
BMC_Products_Installation_directory/Uninstall/Install/instbin
6 Enter the following command.
thorinst.sh -uninstall path_to_control_file -log path_to_log_file -output path_to_output_log_file
Use the following table to help determine the log file and output log file locations:
Example (Unix only)
If /opt/bmc is your product installation directory, you would change to /opt/bmc/Uninstall/Install/instbin directory and enter the following command:
Option Description Value
-log sends the log information to a standard log file
This file contains all installation status information.
path to log file;any valid path and file name (with a .txt extension)
If a space exists in the path, the entire path must be enclosed in quotation marks.
-output sends the log information to an output log file
This file contains all messages about the progress of the installation that are normally sent to standard output.
path to log file;any valid path and file name (with a .txt extension)
If a space exists in the path, the entire path must be enclosed in quotation marks.
84 PATROL for BEA WebLogic User Guide

2
This action would remove all installation files and directories. The files that were used to perform the uninstallation will be marked for deletion and will be removed when the computer on which the products were uninstalled is rebooted.
Uninstalling PATROL for BEA WebLogic on Windows
You can use the option that is appropriate for what you want to uninstall to uninstall PATROL for BEA WebLogic. The following procedures describe how to uninstall products from a Windows environment and all related log files.
To uninstall individual products
1 From the Uninstall directory in your BMC Software product installation directory, double-click uninstall.exe to launch the installation utility in uninstall mode.
If you are uninstalling from a Windows 2000 with Citrix Metaframe environment, perform the following steps to launch the installation utility in uninstall mode:
A From a command line, change to the Uninstall directory and enter the following command to start the installation Web server:
setup.exe -serveronly
A message box is displayed that shows the URL to use to connect to the installation Web server.
B On another computer with a browser, start the browser.
C Connect to the installation Web server from the browser to start the installation utility by using the URL that is displayed in the message box.
The Welcome window is displayed. Click Next.
thorinst.sh -uninstall “/opt/bmc/Uninstall/Install/instdata/uninstall-all.ctl” -log /var/logs/NetworkLogs/MyLogs.txt -output /var/adm/NetworkLogs/MyLogs.out
NOTE As an option, you can launch the installation utility in uninstall mode by choosing Start => Settings => Control Panel => Add/Remove Programs and double-clicking BMC Software Tools in the Add/Remove Programs Properties dialog box.
Chapter 2 Installing and migrating PATROL for BEA WebLogic 85

2
2 Select the installation directory from which you want to remove a product, and click Next.
3 Select the product or products that you want to uninstall, and click Next.
4 Review your selections and click Uninstall.
After the uninstallation is complete, a window is displayed that tells you whether the uninstallation was successful.
Uninstalling all products on Windows preserving customizations
This task describes how to uninstall the PATROL product but retain log files, which contain history for future analysis, and configuration files for redeployment.
1 Uninstall all products as described in “To uninstall individual products” on page 85.
2 Locate the uninstall.ctl file in the following directory.
BMC_Products_Installation_directory\Uninstall\Install\instdata
3 Open the uninstall.ctl file in a text editor, and edit the /BMC/Base variable to specify the name of the directory from which you removed the products in step 1.
4 Open a command line prompt.
5 Change to the following directory.
BMC_Products_Installation_directory\Uninstall\Install\ instbin
6 Enter the following command.
thorinst.exe -uninstall path_to_control_file -log path_to_log_file -output path_to_output_log_file
86 PATROL for BEA WebLogic User Guide

2
Use the following table to help determine the log file and output log file locations:
Example (Windows only)
If C:\Program Files\BMC Software is your product installation directory, you would change to the C:\Program Files\BMC Software\Uninstall\ Install\instbin directory and enter the following command:
This action would remove all installation files and directories except those that are used by the utility at the time the uninstallation was performed. Log files, configuration files, and user-modified files would also be retained.
Uninstalling all products on Windows without preserving customizations
This task describes how to remove all PATROL products and related log files and configuration files from your Unix computer. Once these files have been removed, you cannot recover them unless you have made a back-up copy of the installation.
Option Description Value
-log sends the log information to a standard log file
This file contains all installation status information.
path to log file;any valid path and file name (with a .txt extension)
If a space exists in the path, the entire path must be enclosed in quotation marks.
-output sends the log information to an output log file
This file contains all messages about the progress of the installation that are normally sent to standard output.
path to output log file;any valid path and file name (with a .txt extension)
If a space exists in the path, the entire path must be enclosed in quotation marks.
thorinst.exe -uninstall “C:\Program Files\BMC Software\Uninstall\Install\instdata\uninstall.ctl” -log Z:\NetworkLogs\MyLogs.txt -output Z:\NetworkLogs\MyLogs.out
Chapter 2 Installing and migrating PATROL for BEA WebLogic 87

2
1 Uninstall all products as described in “To uninstall individual products” on page 85.
2 Locate the uninstall-all.ctl file in the following directory.
(Windows only) BMC_Products_Installation_directory\Uninstall\Install\instdata
3 Open the uninstall-all.ctl file in a text editor, and edit the /BMC/Base variable to specify the name of the directory from which you removed the products in step 1.
4 Open a command line prompt.
5 Change to the following directory.
(Windows only) BMC_Products_Installation_directory\Uninstall\Install\instbin
6 Enter the following command.
(Windows only) thorinst.exe -uninstall path_to_control_file -log path_to_log_file -output path_to_output_log_file
Use the following table to help determine the log file and output log file locations:
Example (Windows only)
If C:\Program Files\BMC Software is your product installation directory, you would change to the C:\Program Files\BMC Software\Uninstall\ Install\instbin directory and enter the following command:
Option Description Value
-log sends the log information to a standard log file
This file contains all installation status information.
path to log file;any valid path and file name (with a .txt extension)
If a space exists in the path, the entire path must be enclosed in quotation marks.
-output sends the log information to an output log file
This file contains all messages about the progress of the installation that are normally sent to standard output.
path to log file;any valid path and file name (with a .txt extension)
If a space exists in the path, the entire path must be enclosed in quotation marks.
88 PATROL for BEA WebLogic User Guide
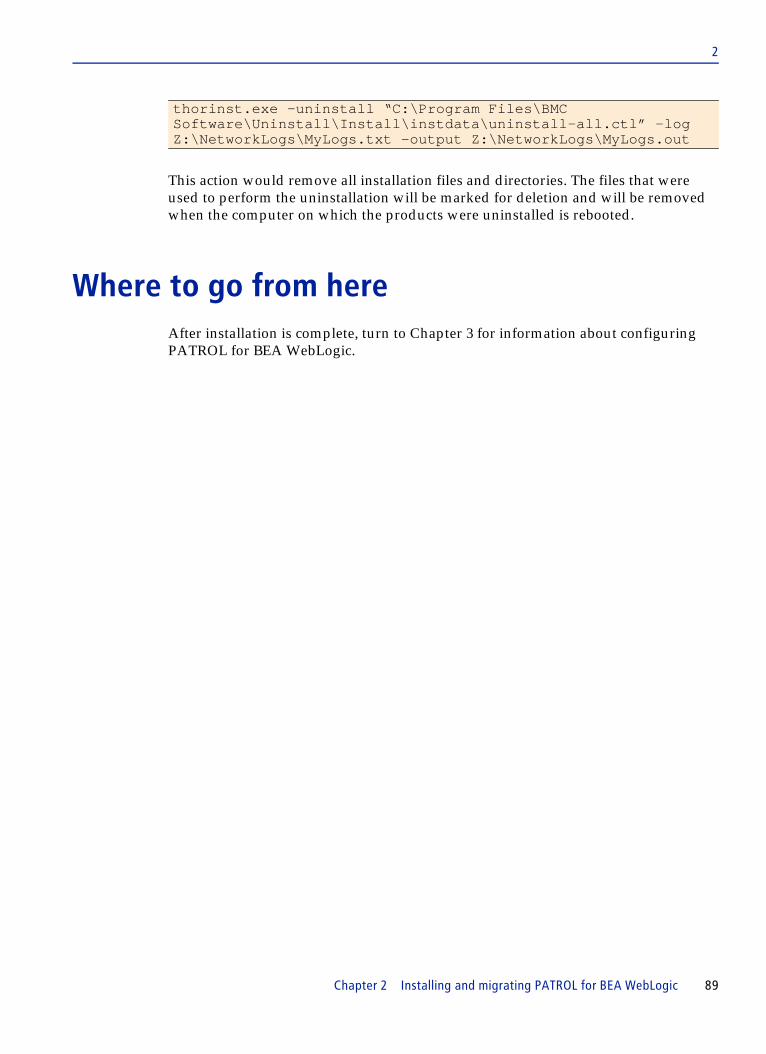
2
This action would remove all installation files and directories. The files that were used to perform the uninstallation will be marked for deletion and will be removed when the computer on which the products were uninstalled is rebooted.
Where to go from hereAfter installation is complete, turn to Chapter 3 for information about configuring PATROL for BEA WebLogic.
thorinst.exe -uninstall “C:\Program Files\BMC Software\Uninstall\Install\instdata\uninstall-all.ctl” -log Z:\NetworkLogs\MyLogs.txt -output Z:\NetworkLogs\MyLogs.out
Chapter 2 Installing and migrating PATROL for BEA WebLogic 89

2
90 PATROL for BEA WebLogic User Guide

C h a p t e r 3
3 Configuring PATROL for BEA WebLogicAfter you have installed PATROL for BEA WebLogic, you can load the Knowledge Modules (KMs) into the PATROL Console and configure the product.
This chapter describes the following topics.
Loading PATROL for BEA WebLogic. . . . . . . . . . . . . . . . . . . . . . . . . . . . . . . . . . . . . . . . 92Configuring the KM. . . . . . . . . . . . . . . . . . . . . . . . . . . . . . . . . . . . . . . . . . . . . . . . . . . . . . . 93
Registering a server . . . . . . . . . . . . . . . . . . . . . . . . . . . . . . . . . . . . . . . . . . . . . . . . . . . . 93Updating the registration of a server . . . . . . . . . . . . . . . . . . . . . . . . . . . . . . . . . . . . 101
Enabling and disabling instrumentation and profiling features. . . . . . . . . . . . . . . . . 106Deciding what to enable: added value by feature . . . . . . . . . . . . . . . . . . . . . . . . . 106Turning on instrumentation or JVM performance monitoring . . . . . . . . . . . . . . 111Disabling instrumentation or JVM performance monitoring . . . . . . . . . . . . . . . . 114Removing instrumentation or JVM performance monitoring . . . . . . . . . . . . . . . 115Enabling method-level profiling . . . . . . . . . . . . . . . . . . . . . . . . . . . . . . . . . . . . . . . . 116Disabling method-level profiling . . . . . . . . . . . . . . . . . . . . . . . . . . . . . . . . . . . . . . . 117Activating JVM thread objects collection. . . . . . . . . . . . . . . . . . . . . . . . . . . . . . . . . 117Deactivating JVM thread objects collection . . . . . . . . . . . . . . . . . . . . . . . . . . . . . . . 118Stopping the monitoring of classes . . . . . . . . . . . . . . . . . . . . . . . . . . . . . . . . . . . . . . 118
Verifying and troubleshooting WebLogic Server configuration. . . . . . . . . . . . . . . . . 119Where to go from here. . . . . . . . . . . . . . . . . . . . . . . . . . . . . . . . . . . . . . . . . . . . . . . . . . . . 122
Chapter 3 Configuring PATROL for BEA WebLogic 91

3
Loading PATROL for BEA WebLogicAfter you install PATROL for BEA WebLogic, you must load the product KM into the PATROL Console.
Before you begin
Before loading the product, make sure you have performed the following actions:
■ started a PATROL Console■ started a PATROL Agent and BEA WebLogic Server on each machine that you
want to monitor ■ loaded the UNIX3 or NT_BASE KMs (depending on which OS is running on your
WebLogic Server host machine)
To load PATROL for BEA WebLogic
1 Add the hosts on which BEA WebLogic Administration Server is running to the PATROL Console. From the PATROL Console menu, choose Hosts => Add.
2 Load the product knowledge files. From the PATROL Console menu, choose File => Load KM...
3 Select BEAWLS.kml, then click Open.
If you did not previously load UNIX3.kml and NT_BASE.kml, select those as well, then click Open.
4 Save your console configuration so that PATROL automatically loads the selected KMs the next time you start the PATROL Console. From the PATROL Console menu, choose File => Save Configuration.
After PATROL for BEA WebLogic is loaded into the PATROL Console, a setup application instance icon is created. This icon is labeled BEAWLS_SETUP. Use this icon to configure the product.
Where to go from here
After you load the KM files, proceed with “Configuring the KM.”
NOTE If the Unix and NT KMs are not loaded, the BEAWLS_OS application class will not be able to monitor any WebLogic JVM processes.
92 PATROL for BEA WebLogic User Guide

3
Configuring the KMYou must provide configuration information that defines your WebLogic environment to the PATROL monitoring environment. This information includes the server name, the location of WebLogic software on your system, and an administrator account name and password that PATROL can use to perform system management operations. This process is referred to as registering a server.
Registering a server
Perform the following steps to register an Admin or Managed server.
To register a WebLogic Server
1 Right-click the BEAWLS_SETUP icon.
2 Choose KM Commands => Register WebLogic Server.
The WebLogic Server Registration (Step 1) dialog box opens, as shown in the following figure (note that the following screenshots are from the PATROL Classic Console):
NOTE Entering a valid administrator account is a mandatory configuration task. If you omit this account or enter an account that is not valid, you cannot complete the configuration nor use the product.
Chapter 3 Configuring PATROL for BEA WebLogic 93

3
3 Complete the fields on the dialog box as follows:
■ Select the Type of Server to Register — select whether you are registering an administration server that covers an entire domain, or whether you want to register only one specific Managed Server, without monitoring components on the Admin server nor discovering other WebLogic servers in the environment
■ Select the Version of Server to be Monitored—select the version of the WebLogic server that you are monitoring
NOTE When you register a Managed Server only, any features that pertain to domain wide functionality, such as checking domain consistency, will not be available.
94 PATROL for BEA WebLogic User Guide

3
■ Monitor Option—select one of the following monitoring options:
— Full—monitor all parameters other than those that require activation of non-standard options; this is the default setting
— Basic—monitor only a subset of key parameters; select this option if performance is an issue; see Table 9 on page 107 to identify which parameters will be available at this level
■ Authentication Type—select one of the following authentication options:
— Username/Password—authentication via username and password; this is the default setting
— Digital Certificate—for WebLogic Servers 9.0 and above you can specify authentication using 2-way SSL via Digital Certificate
4 Click Next.
The WebLogic Server Registration (Step 2) dialog box opens.
The fields that appear in this dialog box vary depending on the authentication type you are using. Figure 5 shows this screen as it appears when using username and password for authentication; Figure 6 shows the screen as it appears when using a digital certificate for authentication.
Figure 5 WebLogic Server Registration (Step 2) with username/password authentication
Chapter 3 Configuring PATROL for BEA WebLogic 95
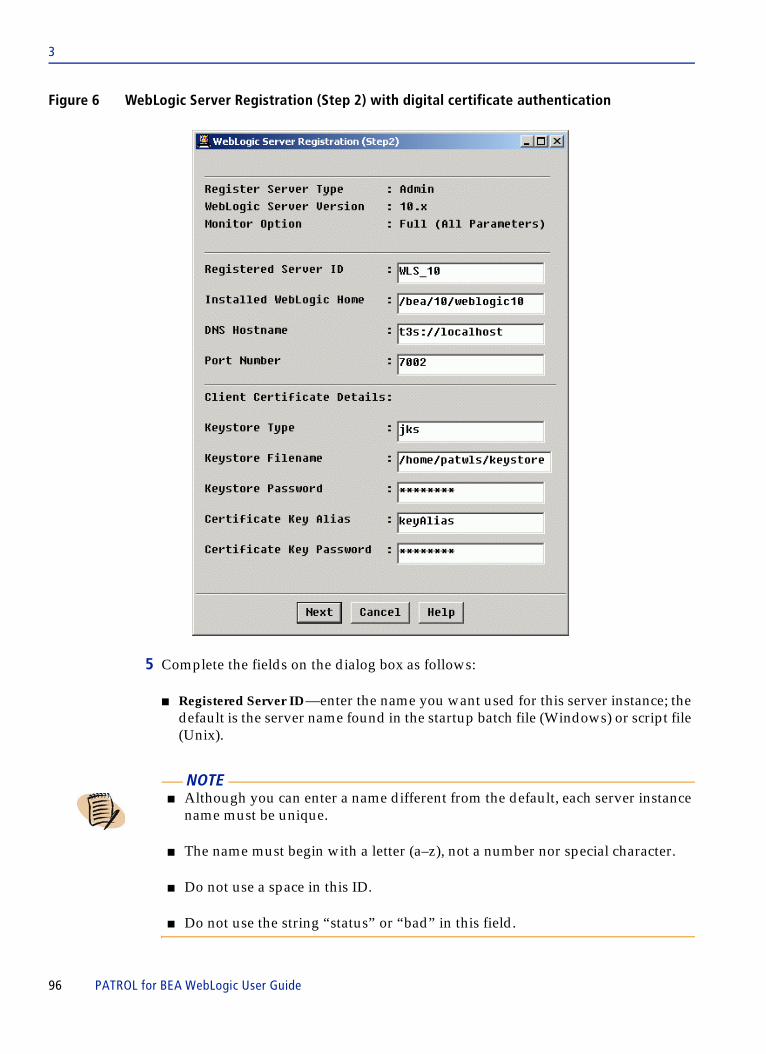
3
Figure 6 WebLogic Server Registration (Step 2) with digital certificate authentication
5 Complete the fields on the dialog box as follows:
■ Registered Server ID—enter the name you want used for this server instance; the default is the server name found in the startup batch file (Windows) or script file (Unix).
NOTE ■ Although you can enter a name different from the default, each server instance
name must be unique.
■ The name must begin with a letter (a–z), not a number nor special character.
■ Do not use a space in this ID.
■ Do not use the string “status” or “bad” in this field.
96 PATROL for BEA WebLogic User Guide

3
■ Installed WebLogic Home—enter full directory path where the local WebLogic Server application is installed.
This is not the same as WebLogic Commerce Server; this is the value in $WL_HOME, for example, d:\bea70\weblogic700, d:\weblogic700, c:\bea\weblogic81, or c:\bea910\weblogic91.
When registering a remote managed server, the value used in this field must be valid local to that server.
■ DNS Hostname—enter the DNS hostname on which the WebLogic server is running.
If you selected username and password for authentication:
— This name will usually be t3://localhost, except when clustering is used; t3 is the WebLogic communication protocol. The t3s protocol can be used for secure servers, in which case the DNS hostname will take the form t3s://...
— If clustering is used, the IP address should be specified rather than a logical host name, for example: t3://192.66.83.283.
— If the administration port is enabled, the t3s protocol must be used.
— If the t3s protocol is used, all servers in the WebLogic domain must have the SSL Listen Port enabled.
If you selected digital certificate for authentication:
— This name will usually be t3s://localhost, except when clustering is used; t3s is the WebLogic secure communication protocol.
— If clustering is used, the IP address should be specified rather than a logical host name, for example: t3://192.66.83.283.
■ Port Number—enter the port number on which the WebLogic Server is listening.
NOTE ■ If you are registering a Managed Server only, this field should reflect the
name of the Managed Server, not its Admin Server.
■ The t3s protocol is supported for WebLogic Server version 7.0 if the administration port is disabled. This protocol is not supported for version 7.0 if the administration port is enabled.
■ The t3s protocol is supported for WebLogic Server versions 8.1, 9.x, and 10.x whether the administration port is enabled or not.
Chapter 3 Configuring PATROL for BEA WebLogic 97

3
The default port number is 7001 and the port number is listed in the config.xml file. Use the administration port if it is enabled in the BEA WebLogic Domain.
The following fields appear if you selected username and password for authentication:
■ Administrator Username—enter the WebLogic “system” ID; this may or may not also be an operating system account. The “system” ID must have full administrative rights within WebLogic; this ID must be included in the “Administrators“ security group within the WebLogic application server.
■ Administrator Password—enter the password for the username specified in the previous field.
The following fields appear if you selected digital certificate for authentication:
■ Keystore Type—enter the Keystore type; the standard is jks: Java Key Store
■ Keystore Filename—enter the directory and filename of the Keystore where the client certificate resides
■ Keystore Password—enter the password of the Keystore
■ Certificate Key Alias—enter the alias of the client certificate which will be sent to the server
■ Certificate Key Password—enter the password of the client certificate which will be sent to the server
NOTE The PATROL for BEA WebLogic Java collector will be using the specified DNS hostname and port number to connect to the monitored WebLogic Admin server; for example, t3://xyz.com:7001.
NOTE The OS account (not necessarily the “system” ID) under which the PATROL agent runs must have the following permissions:
■ read for the WebLogic home directory and all subdirectories■ read-execute for the Java home and all subdirectories
NOTE Passwords that contain special characters (such as < or >) may cause error messages and unpredictable results when you use the commands in the BEAWLS_PROBE application class.
98 PATROL for BEA WebLogic User Guide

3
6 Click Next.
The WebLogic Server Registration (Step 3) dialog box opens, as shown in the following figure:
If, in Step 5, you specified a DNS Hostname using the t3s protocol, the dialog box for Step 3 will include an additional field for the SSL KeyStore, as shown in the following figure.
7 Complete the fields on the dialog box as follows:
■ JDK Path—enter the full directory path where the Java Developer Kit is installed
This should reflect the JDK version supported by BEA for your platform. This field is populated by default if the environment variable JAVA_HOME is set.
When registering a remote managed server, the value used in this field should be local to the remote managed server (not the Admin server).
If JAVA_HOME is not set, this field will default to the subdirectory of the shipped JDK lib toolkit under the installed WebLogic application directory, for example, d:\bea\jdk130.
Chapter 3 Configuring PATROL for BEA WebLogic 99

3
You can optionally specify the path to an installed JRE, for example, if your Java executables are under /usr/weblogic51/jre1_2/jre/bin, you would enter the path to the directory above bin, /usr/weblogic51/jre1_2/jre.
The default class path includes the weblogic.jar, the weblogic_sp.jar, and the Java collector path.
If your environment requires specific JVM arguments (such as security arguments) to connect to the WebLogic servers, use the BEAWLS_SETUP => Define Additional JVM Arguments menu command to add JVM Arguments (such as security arguments) to all Java Collector command lines. The arguments you are adding will take effect after the Java Collector is restarted. You can add these arguments before registering your environment. If you have already registered your environment, update the registration to restart the Java Collector.
■ Additional Java Class Path—(optional) You do not need to change this field unless BMC Software Customer Support directs you to specify additional paths.
The value in this field is used by the collector.
■ Use SSL Custom Trust KeyStore (Enter File Name with Path)—if you store private keys and certificates in a file, enable this field and enter the complete file name, including path
■ Use SSL Trust KeyStore — if an SSL keystore provider is available and you want to use it as your key provider, enable this option
8 Click OK.
Where to go from here
Before using the product, take a few minutes to verify that it is correctly configured and that key parts of your WebLogic environment are being discovered and monitored correctly. See “Verifying and troubleshooting WebLogic Server configuration” on page 119.
NOTE The Java Class Path field must include paths for any WebLogic service packs that you have installed. If you apply additional service packs after registering your server, you will need to update the Java Class Path field by using the KM menu command Update Registered Server; for more information, see “Updating the registration of a server” on page 101.
If t3s:// is entered as the DNS Hostname, an additional field is displayed on the Setup Java Environment dialog box to select the type of SSL to use.
100 PATROL for BEA WebLogic User Guide
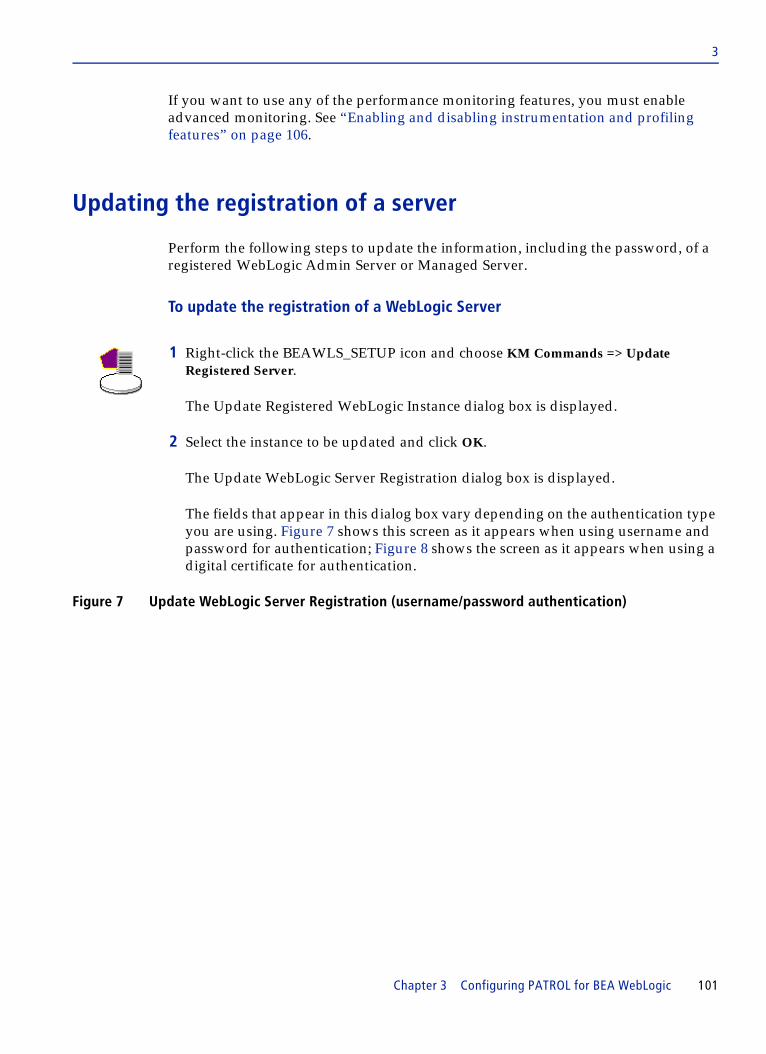
3
If you want to use any of the performance monitoring features, you must enable advanced monitoring. See “Enabling and disabling instrumentation and profiling features” on page 106.
Updating the registration of a server
Perform the following steps to update the information, including the password, of a registered WebLogic Admin Server or Managed Server.
To update the registration of a WebLogic Server
1 Right-click the BEAWLS_SETUP icon and choose KM Commands => Update Registered Server.
The Update Registered WebLogic Instance dialog box is displayed.
2 Select the instance to be updated and click OK.
The Update WebLogic Server Registration dialog box is displayed.
The fields that appear in this dialog box vary depending on the authentication type you are using. Figure 7 shows this screen as it appears when using username and password for authentication; Figure 8 shows the screen as it appears when using a digital certificate for authentication.
Figure 7 Update WebLogic Server Registration (username/password authentication)
Chapter 3 Configuring PATROL for BEA WebLogic 101
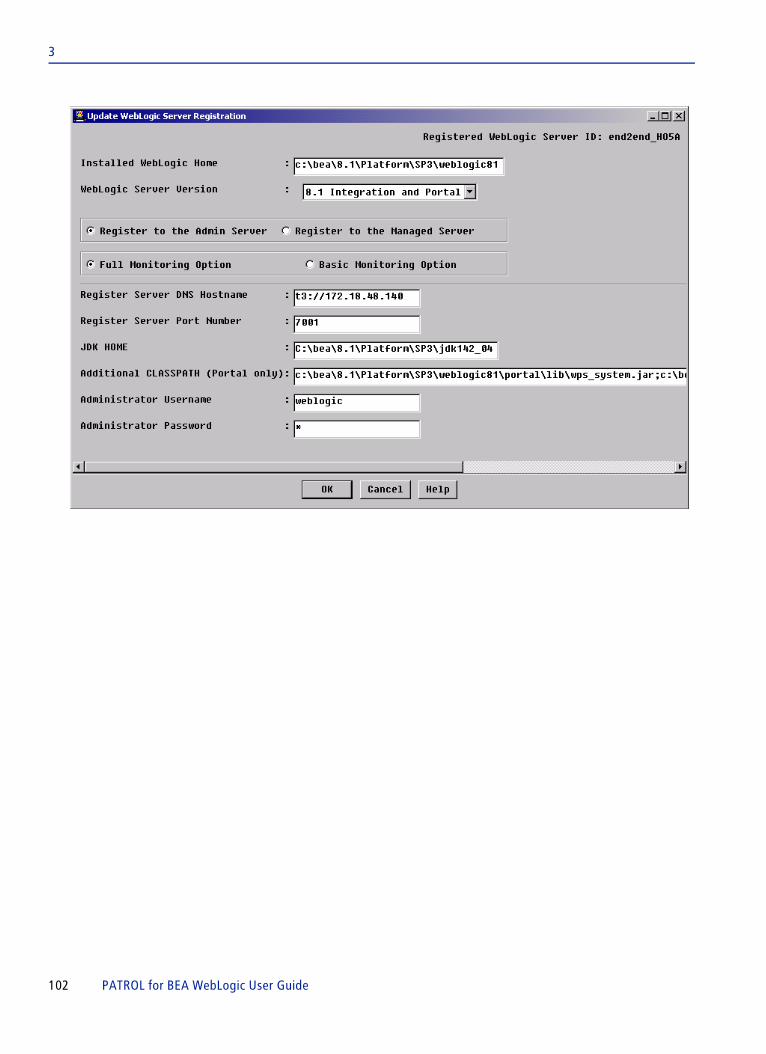
3
102 PATROL for BEA WebLogic User Guide

3
Figure 8 Update WebLogic Server Registration (digital certificate authentication)
3 Complete the fields on the dialog box as follows:
■ Installed WebLogic Home—enter full directory path where the local WebLogic Server application is installed
This is not the same as WebLogic Commerce Server; this is the value in $WL_HOME, for example, d:\bea70\weblogic700 or d:\weblogic700.
■ WebLogic Server Version—select the version of the WebLogic server that you are monitoring
Chapter 3 Configuring PATROL for BEA WebLogic 103
3
■ Register to the Admin Server or Register to the Managed Server — select whether you want to monitor a WebLogic domain consisting of the Admin Server and all of the Managed Servers discovered running from it, or whether you want to monitor only a single, specific Managed Server without relying on the availability of the Admin Server
■ Monitoring Options—select one of the following monitoring options:
— Full—monitor all parameters; this is the default setting— Basic—monitor only the key parameters if performance is an issue
■ Register Server DNS Hostname—enter the DNS hostname on which the WebLogic Admin or Managed server is running
This name will usually be t3://localhost, except when clustering is used; t3 is the WebLogic communication protocol.
■ Register Server Port Number—enter the port number on which the WebLogic Server is listening; the default port number is 7001; the port number is listed in config.xml
■ JDK HOME—enter the full directory path where the Java Developer Kit is installed
This should reflect the JDK version supported by BEA for your platform.
This field is populated by default if the environment variable JAVA_HOME is set. If JAVA_HOME is not set, this field will default to the subdirectory of the shipped JDK lib toolkit under the installed WebLogic application directory, for example, d:\bea\jdk130.
You can optionally specify the path to an installed JRE, for example, if your Java executables are under /usr/weblogic51/jre1_2/jre/bin, you would enter the path to the directory above bin, /usr/weblogic51/jre1_2/jre.
NOTE The PATROL for BEA WebLogic Java collector will be using the specified DNS hostname and port number to connect to the monitored WebLogic Admin or Managed server; for example, t3://xyz.com:7001.
NOTE To enable instrumentation or JVM profiling (see “Turning on instrumentation or JVM performance monitoring” on page 111), JDK HOME must be defined as the JDK Home of the WebLogic server, and not a different JDK.
104 PATROL for BEA WebLogic User Guide

3
■ Additional CLASSPATH (Portal only)—enter the additional portal classes from which the PATROL PatcolWebLogic java process can retrieve the BEA WebLogic Portal JMX information
The following fields appear if you are using username and password for authentication (see Figure 7):
■ Administrator Username—enter the WebLogic “system” ID; this may or may not also be an operating system account
■ Administrator Password—enter the password for the username specified in the previous field
The following fields appear if you are using digital certificate for authentication (see Figure 8):
■ Keystore Type—enter the Keystore type; the standard is jks: Java Key Store
■ Keystore Filename—enter the directory and filename of the Keystore where the client certificate resides
■ Keystore Password—enter the password of the Keystore
■ Certificate Key Alias—enter the alias of the client certificate which will be sent to the server
■ Certificate Key Password—enter the password of the client certificate which will be sent to the server
4 Click OK.
NOTE The account under which the PATROL agent runs must have the following permissions:
■ read for the WebLogic home directory and all subdirectories■ read-execute for the Java home and all subdirectories
NOTE Passwords that contain special characters (such as < or >) may cause error messages and unpredictable results when you use the commands in the BEAWLS_PROBE application class.
Chapter 3 Configuring PATROL for BEA WebLogic 105

3
Enabling and disabling instrumentation and profiling features
PATROL for BEA WebLogic provides extensive and flexible features to monitor all aspects of a WebLogic environment at a very detailed level. Many users will not need to monitor such granular data, and to optimize performance, most of these features are turned off by default.
This section explains how to enable and disable advanced monitoring features.
Deciding what to enable: added value by feature
A basic configuration of PATROL for BEA WebLogic monitors most critical components of a WebLogic environment and is appropriate for most production environments. Enabling additional features provides more detailed information and enables additional application classes. Table 9 shows which parameters are enabled at each level. This information is also available in a more expanded form in Appendix B, “Parameter reference.” This information can help you decide if you need to turn on advanced monitoring options for your WebLogic environment.
NOTE The J2EE instrumentation and profiling features are available only on servers on which a PATROL Agent is running (servers identified by the BEAWLS_LOCAL_MANAGED and BEAWLS_SERVER icons).
TIP Most production environments will not want instrumentation, profiling, and method-level data to be collected regularly. BMC Software recommends enabling the advanced instrumentation and profiling features only when you have a need for them and are comfortable with the added resource overhead that they require.
106 PATROL for BEA WebLogic User Guide
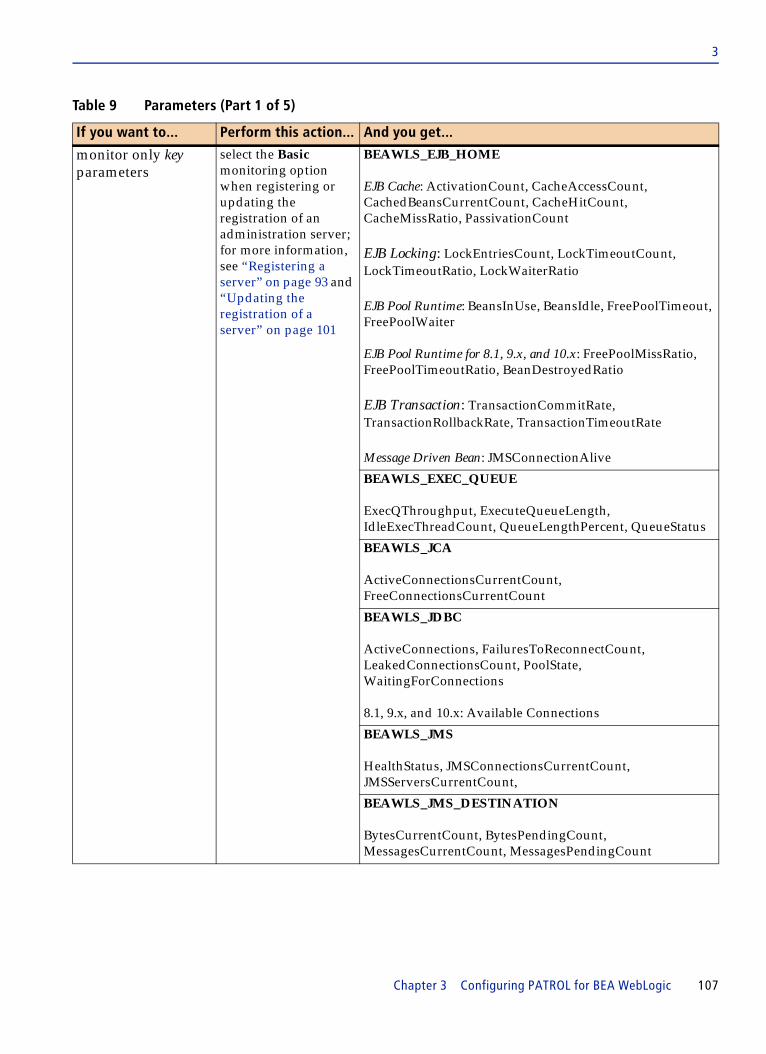
3
Table 9 Parameters (Part 1 of 5)
If you want to... Perform this action... And you get...
monitor only key parameters
select the Basic monitoring option when registering or updating the registration of an administration server; for more information, see “Registering a server” on page 93 and “Updating the registration of a server” on page 101
BEAWLS_EJB_HOME
EJB Cache: ActivationCount, CacheAccessCount, CachedBeansCurrentCount, CacheHitCount, CacheMissRatio, PassivationCount
EJB Locking: LockEntriesCount, LockTimeoutCount, LockTimeoutRatio, LockWaiterRatio
EJB Pool Runtime: BeansInUse, BeansIdle, FreePoolTimeout, FreePoolWaiter
EJB Pool Runtime for 8.1, 9.x, and 10.x: FreePoolMissRatio, FreePoolTimeoutRatio, BeanDestroyedRatio
EJB Transaction: TransactionCommitRate, TransactionRollbackRate, TransactionTimeoutRate
Message Driven Bean: JMSConnectionAlive
BEAWLS_EXEC_QUEUE
ExecQThroughput, ExecuteQueueLength, IdleExecThreadCount, QueueLengthPercent, QueueStatus
BEAWLS_JCA
ActiveConnectionsCurrentCount, FreeConnectionsCurrentCount
BEAWLS_JDBC
ActiveConnections, FailuresToReconnectCount, LeakedConnectionsCount, PoolState, WaitingForConnections
8.1, 9.x, and 10.x: Available Connections
BEAWLS_JMS
HealthStatus, JMSConnectionsCurrentCount, JMSServersCurrentCount,
BEAWLS_JMS_DESTINATION
BytesCurrentCount, BytesPendingCount, MessagesCurrentCount, MessagesPendingCount
Chapter 3 Configuring PATROL for BEA WebLogic 107

3
monitor only key parameters (continued)
select the Basic monitoring option (continued)
BEAWLS_JMSSERVER
BytesCurrentCount, BytesPendingCount, HealthStatus, MessagesCurrentCount, MessagesPendingCount
BEAWLS_JROCKIT
8.1, 9.x, and 10.x: AllProcAvgLoad, JVMProcLoad, FreePhyMemory, NumGCCount, LastGCDuration
BEAWLS_LOG
LogDiskFreeSpace, LogEvent, LogIncreaseRate
BEAWLS_SERVER
ConnectionStatus, HealthStatus, NumOpenConnections, NumOpenSockets, PatrolCollectorStatus, MainDiscovery, LicenseStatus
BEAWLS_MANAGED
ConnectionStatus, HealthStatus, NumOpenConnections, NumOpenSockets
Cluster Servers: MulticastMsgLost, ResentRequests
BEAWLS_MESSAGING_BRIDGE
8.1, 9.x, and 10.x: State
BEAWLS_OS
ActiveProcesses, NumActiveJVMProcesses, NumHighCpuJVMProcesses, ServerJVMsCpuUtil, ServerJVMsMemUsage
Node Manager: NodeStatus
BEAWLS_PROBE
AvgConnTime, AvgPingTime
BEAWLS_SAF
9.x and 10.x: HealthStatus
BEAWLS_SAFAGENT
9.x and 10.x: BytesCurrentCount, BytesPendingCount, FailedMessagesTotal, HealthStatus, MessagesCurrentCount, MessagesPendingCount
Table 9 Parameters (Part 2 of 5)
If you want to... Perform this action... And you get...
108 PATROL for BEA WebLogic User Guide

3
monitor only key parameters (continued)
select the Basic monitoring option (continued)
BEAWLS_SERVLET
ExecutionTimeAverage, InvocationCount
BEAWLS_WEBAPP
OpenSessionsCount
BEAWLS_WS (WebService)
HighestHdlTotReqFail, HighestHdlTotRespFail, NumHighestInvocation, NumHomePageHit, NumMalformedRequest, NumWSDLHit, SlowestOpAvgDisp, SlowestOpAvgExec, SlowestOpAvgResp
BEAWLS_WS_HDL (WebService Handler)
NumReqError, NumReqTermination, NumRespError, NumRespTermination, NumReqSOAPFault, NumRespSOAPFault
BEAWLS_WS_OPER (WebService Operation)
AvgDispTime, AvgExecTime, AvgRespTime, HandlerReqErrorCount, HandlerRespErrorCount, NumInvocation, NumRespError
monitor the full set of default parameters
select the Full monitoring option when registering or updating the registration of an administration server; for more information, see “Registering a server” on page 93 and “Updating the registration of a server” on page 101
all parameters that do not require bytecode instrumentation or advanced profiling to be enabled; this is the default setting
for more information on parameters, see Appendix B, “Parameter reference.”
monitor instrumented performance data on WebLogic components
select the Enable Component Performance Data Collection option on the Configure Advanced Monitoring dialog box; for more information, see “Turning on instrumentation or JVM performance monitoring” on page 111
everything you get at the Full level, plus...
BEAWLS_DBURL
AvgResponseTime, HighestInvocationCount, LongestSQLAvgRespTime, LongestSQLTotalRespTime, TotalInvocationCount, TotalResponseTime
Table 9 Parameters (Part 3 of 5)
If you want to... Perform this action... And you get...
Chapter 3 Configuring PATROL for BEA WebLogic 109

3
monitor instrumented performance data on WebLogic components (continued)
turn on instrumentation or profiling options (continued)
BEAWLS_EJB_HOME
AvgResponseTime, InvocationCount, InvocationRate, LongestEJBAvgRespTime, LongestEJBTotalRespTime, MostInvocationEJB, TotalResponseTime
BEAWLS_EJB_METHOD
AvgResponseTime, InvocationCount, InvocationRate, TotalResponseTime
BEAWLS_LOCAL_MANAGED
_EJBRespColl, _SQLRespColl, _WebAppRespColl
BEAWLS_SERVER
_EJBRespColl, _SQLRespColl, _WebAppRespColl
BEAWLS_SERVLET_METHOD
AvgResponseTime, InvocationCount, InvocationRate, TotalResponseTime
BEAWLS_SQL
AvgResponseTime, InvocationCount, InvocationRate, TotalResponseTime, _SQLResponseCollector
BEAWLS_WEBAPP
AvgResponseTime, InvocationCount, InvocationRate, LongestServletAvgRespTime, LongestServletTotalRespTime, MostInvocationServlet, TotalResponseTime
monitor JVM performance profiling
select the Enable JVM Performance Data Collecting, include GC Time, Threads Detail, and Memory Usage option on the Configure Advanced Monitoring dialog box; for more information, see “Turning on instrumentation or JVM performance monitoring” on page 111
everything you get at the Full level, plus...
BEAWLS_JVMPROFILER
AvgGCTime, CPUUSage, GCCount, GCTime, MemoryUsage,ThreadHighestCPUTime, TotalHeapSize, TotalThreadCPU, UsedHeadByAllThreads, VmemoryUsage
BEAWLS_LOCAL_MANAGED
_JVMProfColl
BEAWLS_SERVER
_JVMProfColl
Table 9 Parameters (Part 4 of 5)
If you want to... Perform this action... And you get...
110 PATROL for BEA WebLogic User Guide
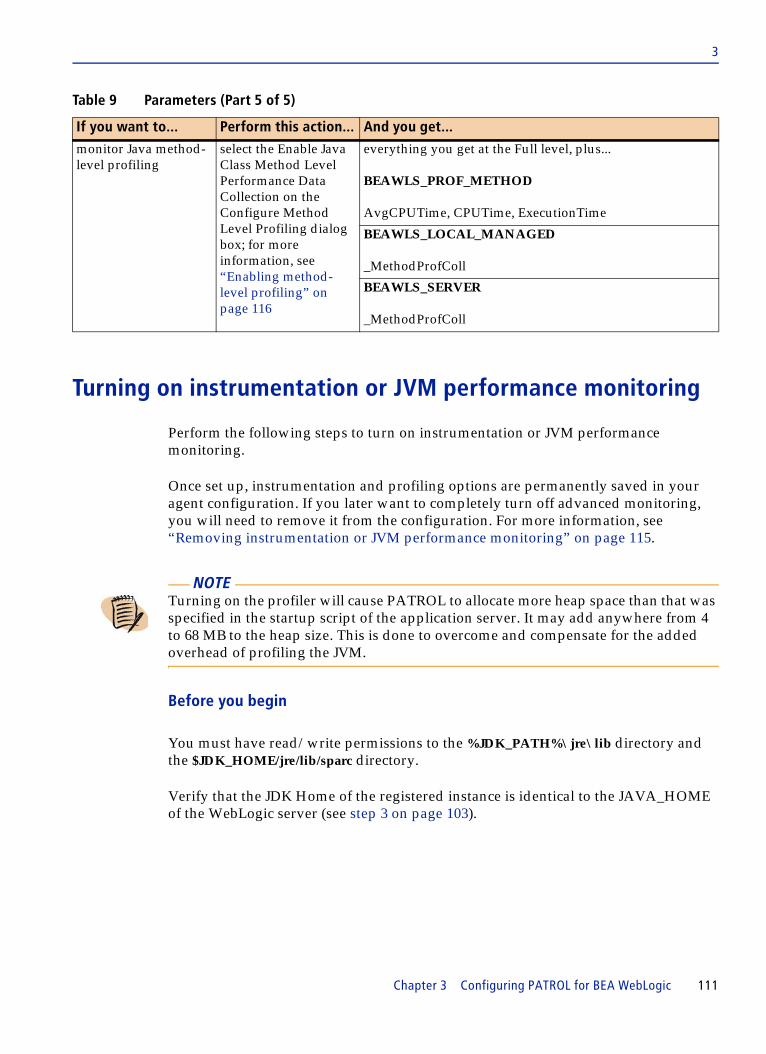
3
Turning on instrumentation or JVM performance monitoring
Perform the following steps to turn on instrumentation or JVM performance monitoring.
Once set up, instrumentation and profiling options are permanently saved in your agent configuration. If you later want to completely turn off advanced monitoring, you will need to remove it from the configuration. For more information, see “Removing instrumentation or JVM performance monitoring” on page 115.
Before you begin
You must have read/write permissions to the %JDK_PATH%\jre\lib directory and the $JDK_HOME/jre/lib/sparc directory.
Verify that the JDK Home of the registered instance is identical to the JAVA_HOME of the WebLogic server (see step 3 on page 103).
monitor Java method-level profiling
select the Enable Java Class Method Level Performance Data Collection on the Configure Method Level Profiling dialog box; for more information, see “Enabling method-level profiling” on page 116
everything you get at the Full level, plus...
BEAWLS_PROF_METHOD
AvgCPUTime, CPUTime, ExecutionTime
BEAWLS_LOCAL_MANAGED
_MethodProfColl
BEAWLS_SERVER
_MethodProfColl
NOTE Turning on the profiler will cause PATROL to allocate more heap space than that was specified in the startup script of the application server. It may add anywhere from 4 to 68 MB to the heap size. This is done to overcome and compensate for the added overhead of profiling the JVM.
Table 9 Parameters (Part 5 of 5)
If you want to... Perform this action... And you get...
Chapter 3 Configuring PATROL for BEA WebLogic 111

3
To turn on instrumentation or JVM performance monitoring
1 Right-click the local managed server instance icon.
or
Right-click the Admin server instance icon.
2 Choose KM Commands => Advance Monitoring => Configure.
The Configure Advance Monitoring dialog box is displayed, as shown in the following figure:
3 Select items in the dialog box to select the types of components for which you want to collect advanced monitoring (instrumented performance) data.
Enabling each type turns on additional collector parameters and creates additional application classes in your PATROL console. These collectors require additional memory and CPU resources and may cause noticeable performance decreases on less robust agent hosts.
■ Enable Component Performance Data Collection—select this option to turn on method level performance data collection for EJBs and servlets, and for database SQL performance
This option enables the BEAWLS_EJB_METHOD, BEAWLS_SERVLET_METHOD, BEAWLS_SQL, BEAWLS_DBURL application classes.
■ Enable JVM Performance Data Collection—select this option to turn on Java Virtual Machine (JVM) performance data collection
This option enables the BEAWLS_JVMPROFILER application class.
■ Perform Debug for this Advance Monitoring Feature—select this option to collect detailed run-time information about the advanced monitoring collectors; the information can be used to troubleshoot some types of problems.
112 PATROL for BEA WebLogic User Guide

3
■ Remove this Advance Monitoring Feature—select this option to remove instrumentation and profiling; for more information, see “Removing instrumentation or JVM performance monitoring” on page 115.
4 Click OK.
A dialog box is displayed, listing the potential performance impacts of turning on advanced monitoring features and telling you to restart the server.
5 Click OK.
A message is displayed, stating the results of the operation.
6 Click OK.
7 Reboot the server. To do this, right-click the server instance icon and select KM Commands => Admin => Shutdown Server, then choose KM Commands => Admin => Boot Server. (You can also restart the server using a script file.)
NOTE This option should be used only under the direction of BMC Software support personnel.
Chapter 3 Configuring PATROL for BEA WebLogic 113

3
Disabling instrumentation or JVM performance monitoring
Follow these steps to disable instrumentation or JVM performance monitoring.
To disable instrumentation or JVM performance monitoring
1 Right-click the local managed server instance icon.
or
Right-click the Admin server instance icon.
2 Choose KM Commands => Advance Monitoring => Configure.
The Configure Advance Monitoring dialog box is displayed.
3 Unselect the type of advanced monitoring that you want turned off.
4 Click OK.
NOTE When using the Advance Monitoring features, the WebLogic KM copies components as follows:
1. A new directory patrol will be created in the %JDK_PATH%\jre\lib directory. This new directory contains:
■ the uninstall script■ the conf directory, which contains the templates for the property files■ the bin directory, which contains four .jar files and two profiling files in a
directory named targetValue■ the server directory, which contains directories of the properties files for the
specific Application Server for which Advanced Monitoring feature was enabled
2. If the Component Performance Data option is enabled, two jar files (BMCJ2eeExt.jar and BMCSvrExt.jar) are copied under the %JDK_PATH%\jre\lib\ext directory.
3. If the JVM Performance Data Collection option is selected, the BMCProfiler.dll or libBMCProfiler.so shared library file is copied under the %JDK_PATH%\jre\bin directory.
4. $JDK_HOME/lib/sparc is also updated and needs to be made readable/writable.
114 PATROL for BEA WebLogic User Guide
3
5 Click OK.
A message is displayed, stating the results of the operation.
6 Click OK.
7 Reboot the server. To do this, right-click the server instance icon and select KM Commands => Admin => Shutdown Server, then choose KM Commands => Admin => Boot Server. (You can also restart the server using a script file.)
Removing instrumentation or JVM performance monitoring
Follow these steps to remove instrumentation or JVM performance monitoring from your setup.
To remove instrumentation or JVM performance monitoring
1 Right-click the Admin server instance icon.
2 Choose KM Commands => Advance Monitoring => Configure.
The Configure Advance Monitoring dialog box is displayed.
3 Select the checkbox labeled Remove this Advance Monitoring Feature.
4 Click OK.
A confirmation message is displayed, asking you to confirm the removal of the feature.
5 Click Yes to remove the feature. Otherwise, click No.
NOTE When you change the instrumentation monitoring mode the first time, you must restart the WebLogic server. After the first time, you can change the monitoring mode on and off for instrumentation without restarting the WebLogic server.
NOTE When you select Remove This Advance Monitoring Feature, all enabled advanced monitoring features will be removed. They can not be selectively removed.
Chapter 3 Configuring PATROL for BEA WebLogic 115

3
6 Reboot the server. To do this, right-click the server instance icon and select KM Commands => Admin => Shutdown Server, then choose KM Commands => Admin => Boot Server. (You can also restart the server using a script file.)
Enabling method-level profiling
Perform the following steps to enable method-level profiling.
Method level data collection can be dynamically enabled if the JVM Performance Monitoring is turned on (see “Turning on instrumentation or JVM performance monitoring” on page 111. It does not require a reboot of the system, WebLogic, nor PATROL, and once enabled, it runs until you disable it (see “To disable method-level profiling” on page 117).
To enable method-level profiling
1 Right-click the server instance icon.
2 Choose KM Commands => Advance Monitoring => Configure Method Profiling.
3 Complete the fields on the Configure Method Level Profiling dialog box as follows:
■ Enable Java Class Method Level Performance Data Collection—select this checkbox to enable data collection. If the box is not selected, method-level profiling will not be turned on.
■ Enter Java Class Name—type the name of the Java class that you want to monitor.
NOTE Removing an advanced monitoring feature deletes certain files on your server that are used only for the profiling and instrumentation features of this product. In some cases, file sharing mechanisms may prevent the files from being deleted. If this happens, you must manually delete the files listed in Table 5 on page 57.
NOTE The components that monitor Java method-level profiling are resource intensive and intended only for use by application developers. Method-level profiling will perform slowly on host machines with CPUs slower than 1 GHz and with less than 1 GB of memory. These features are not recommended for regular use in production environments.
Method level profiling cannot be enabled for the JRE classes, since this can have a significant impact on performance.
116 PATROL for BEA WebLogic User Guide

3
4 Select Add.
5 Click OK.
6 Select Exit from the list of actions, then click OK to close the dialog.
Disabling method-level profiling
Perform the following steps to disable method-level profiling.
To disable method-level profiling
Follow the steps in “To enable method-level profiling” on page 116, but in Step 2, unselect the check box for Enable Java Class Method Level Performance Data Collection.
Activating JVM thread objects collection
Perform the following steps to activate JVM thread objects collection.
To activate JVM thread objects collection
1 Right-click the BEAWLS_SERVER icon or the BEAWLS_LOCAL_MANAGED icon.
2 From the KM Commands menu, choose Advance Monitoring => Activate JVM Thread Objects Collection.
After activating the JVM thread objects collection, the following information is available:
■ The total number of thread objects is displayed in the Total Thread Objects field of the BEAWLS_JVMPROFILER InfoBox.
■ The amount of memory used is displayed in the Memory Used column of the Thread Detail Report.
NOTE Profiling must be on for this feature to work.
Chapter 3 Configuring PATROL for BEA WebLogic 117
3
Deactivating JVM thread objects collection
Perform the following steps to deactivate JVM thread objects collection.
To deactivate JVM thread objects collection
1 Right-click the BEAWLS_SERVER icon or the BEAWLS_LOCAL_MANAGED icon.
2 From the KM Commands menu, choose Advance Monitoring => Deactivate JVM Thread Objects Collection.
The collection of JVM thread objects is stopped.
Stopping the monitoring of classes
Perform the following steps to stop the monitoring of classes.
To stop the monitoring of classes
1 Right-click the server instance icon.
2 Choose KM Commands => Advance Monitoring => Configure Method Profiling.
The Configure Method Level Profiling dialog box is displayed.
3 From the list of monitored classes, select the class for which you want monitoring disabled. Click on an unhighlighted class name to select it.
4 Select Delete from the list of actions.
5 Click OK.
6 Select Exit from the list of actions, then click OK to close the dialog.
118 PATROL for BEA WebLogic User Guide
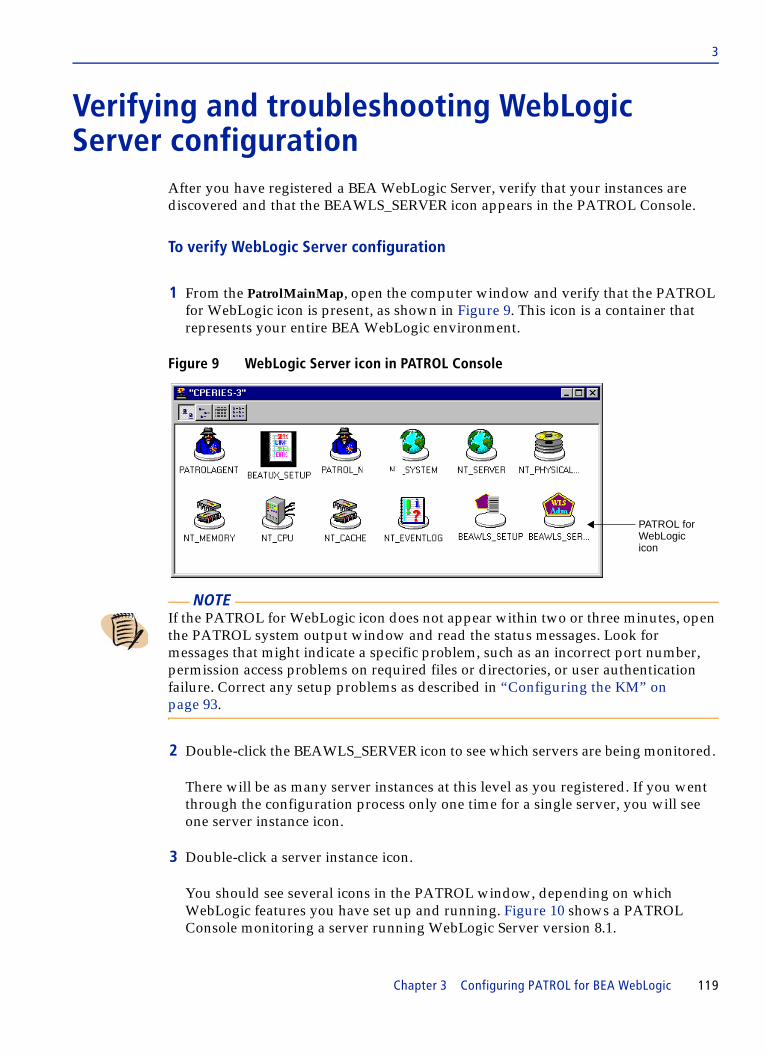
3
Verifying and troubleshooting WebLogic Server configuration
After you have registered a BEA WebLogic Server, verify that your instances are discovered and that the BEAWLS_SERVER icon appears in the PATROL Console.
To verify WebLogic Server configuration
1 From the PatrolMainMap, open the computer window and verify that the PATROL for WebLogic icon is present, as shown in Figure 9. This icon is a container that represents your entire BEA WebLogic environment.
Figure 9 WebLogic Server icon in PATROL Console
2 Double-click the BEAWLS_SERVER icon to see which servers are being monitored.
There will be as many server instances at this level as you registered. If you went through the configuration process only one time for a single server, you will see one server instance icon.
3 Double-click a server instance icon.
You should see several icons in the PATROL window, depending on which WebLogic features you have set up and running. Figure 10 shows a PATROL Console monitoring a server running WebLogic Server version 8.1.
NOTE If the PATROL for WebLogic icon does not appear within two or three minutes, open the PATROL system output window and read the status messages. Look for messages that might indicate a specific problem, such as an incorrect port number, permission access problems on required files or directories, or user authentication failure. Correct any setup problems as described in “Configuring the KM” on page 93.
WebLogic icon
PATROL for
Chapter 3 Configuring PATROL for BEA WebLogic 119

3
Figure 10 Example of monitored WebLogic 8.1 Server
PATROL for BEA WebLogic discovers environment configuration information in four stages:
1. The MainDiscovery parameter discovers and creates instances for all components monitored in the registered WebLogic Server or domain; this includes CLUSTER, SERVER, EXEC_QUEUE, EJB, WEBAPP, JDBC, JMSSERVER, JCA, and JOLT. The process runs every 60 seconds (depending on the schedule).
MainDiscovery runs when you first configure the product, but it does not run on a regular schedule because configuration of servers and components is generally stable. MainDiscovery does, however, run under the following conditions:
■ When a new domain is initially setup.■ When a server’s status changes (such as from admin to managed server).■ When the PATROL Agent restarts.■ When PATROL’s Java Collector for WebLogic restarts.■ When you run the KM menu command Force Objects Discovery from the
BEAWLS_SERVER application class.
2. Attribute Discovery retrieves configuration and runtime information for all components discovered by Main Discovery. It runs every 10 minutes by default.
NOTE It may take several minutes for a server to be fully monitored because some application classes are discovered on different schedules. Not all application classes or parameters will exist on every system.
120 PATROL for BEA WebLogic User Guide

3
3. Servlet Discovery finds information about the monitored servlets of specified web applications). It runs every 10 minutes by default.
4. Log Discovery retrieves information for the four WebLogic Server default log files. It runs every 23 hours by default (about once per day).
If application class icons do not appear in the console window within 10 minutes, check the following:
■ WebLogic configuration—icons for monitoring some WebLogic components will not appear if there is nothing for the KM to monitor. Check your WebLogic configuration to verify that the component being monitored by a “missing” application class is actually enabled.
■ Advanced monitoring—icons for many of the application classes that monitor and instrument performance will not appear unless Advance Monitoring is specifically enabled. These icons include EJB_METHOD, SERVLET_METHOD, SQL, JVMPROFILE, PROF_CLASS, and PROF_METHOD. See “Enabling and disabling instrumentation and profiling features” on page 106.
■ Product configuration—icons may not appear if the KM configuration information was incorrect (for example, if an incorrect Java path was specified). The BEAWLS_OS icon will not appear if the required operating system .kml files were not loaded. See “Configuring the KM” on page 93.
Which icons should you see?
The set of application class and parameter icons that are shown for any given environment will vary greatly depending on which features you have enabled in PATROL, which WebLogic components are configured and active in your environment, and which version of WebLogic you are running.
There are only a few icons that will always be present in every monitored environment. These are:
■ BEAWLS_SETUP
■ BEAWLS_SERVER
■ BEAWLS_EXEC_QUEUE
■ BEAWLS_OS (although parameters may be offline if you do not have the Unix or Windows KMs loaded)
■ BEAWLS_PROBE (although the icon may appear at a different level if you are monitoring a remote Managed Server)
Chapter 3 Configuring PATROL for BEA WebLogic 121

3
■ BEAWLS_LOG (although the icon will disappear if you specifically stop monitoring every log in an environment, the LOG instance is always initially created)
If you do not see an instance of an application class, check the following:
■ Your WebLogic Version: Some component application classes are relevant only for specific WebLogic versions, for example, the BEAWLS_JROCKIT class is only supported for WebLogic 8.1 or higher.
■ Your WebLogic Configuration: Component application classes are active only when they have something to monitor. For example, if you have no configured Jolt connection pools deployed in your environment, you will not see an instance of the BEAWLS_JOLT class.
■ Your PATROL Configuration: Some classes support features that most users will not need in a basic monitoring environment. These must be activated, and sometimes configured after the PATROL for BEA WebLogic product is installed and configured. For example, some features require activation of bytecode instrumentation or JVM profiling.
If you do not see a parameter that you expect, check the following:
■ Your WebLogic Version: Some parameters are relevant only for features of specific WebLogic versions, see Appendix B, “Parameter reference” for details on individual parameters.
■ Your PATROL Monitoring Level: Only a core set of basic parameters are always active. Some parameters are active only when you enable a higher monitoring level than you initially configured. Other parameters may require activation of specific features, such as bytecode instrumentation or JVM profiling. See Appendix B, “Parameter reference” for details.
Where to go from hereAfter verifying that PATROL has discovered your server and has instantiated application instances, see Chapter 4, “Managing the BEA WebLogic environment,” to begin configuring and using the product monitoring features.
122 PATROL for BEA WebLogic User Guide

C h a p t e r 4
4 Managing the BEA WebLogic environmentThis chapter explains how to effectively manage a BEA WebLogic environment using PATROL for BEA WebLogic.
The following topics are discussed:
Monitoring a WebLogic environment. . . . . . . . . . . . . . . . . . . . . . . . . . . . . . . . . . . . . . . 124Working with parameters . . . . . . . . . . . . . . . . . . . . . . . . . . . . . . . . . . . . . . . . . . . . . . . . . 124
Top parameters for BEA WebLogic . . . . . . . . . . . . . . . . . . . . . . . . . . . . . . . . . . . . . 124Working with events . . . . . . . . . . . . . . . . . . . . . . . . . . . . . . . . . . . . . . . . . . . . . . . . . . . . . 125
Managing event triggers to work with other products . . . . . . . . . . . . . . . . . . . . . 126Managing events using PEM . . . . . . . . . . . . . . . . . . . . . . . . . . . . . . . . . . . . . . . . . . . 127
Estimating response times . . . . . . . . . . . . . . . . . . . . . . . . . . . . . . . . . . . . . . . . . . . . . . . . 128Testing file transfer rate . . . . . . . . . . . . . . . . . . . . . . . . . . . . . . . . . . . . . . . . . . . . . . . 129Testing web page response . . . . . . . . . . . . . . . . . . . . . . . . . . . . . . . . . . . . . . . . . . . . 129Administering Probe. . . . . . . . . . . . . . . . . . . . . . . . . . . . . . . . . . . . . . . . . . . . . . . . . . 130
Generating reports . . . . . . . . . . . . . . . . . . . . . . . . . . . . . . . . . . . . . . . . . . . . . . . . . . . . . . . 131
Chapter 4 Managing the BEA WebLogic environment 123
4
Monitoring a WebLogic environmentPATROL for BEA WebLogic relies on features of the PATROL Console for much of its ability to help you improve the reliability and performance of your WebLogic environment. Every user of PATROL for BEA WebLogic should understand how the basic Console features and commands work together. This chapter explains how to exploit some key PATROL features to effectively use PATROL for BEA WebLogic. If any step seems too advanced, see the online Help for your Console by clicking Help. The Console Help and the PATROL Event Manager Help explain basic concepts.
Working with parametersWhen you first install PATROL for BEA WebLogic, take some time to open windows and double-click application class icons to see parameters. The parameters contain the actual data about your system’s performance and configuration.
Top parameters for BEA WebLogic
While all of the parameters in the product will probably be important to some users at some times, only a small number are of critical importance to almost every environment.
These parameters are the top parameters to monitor in order to assure the availability of your WebLogic environment. BMC Software sets alarms on many of them by default. You may also want to monitor them through the Event Manager and set e-mail notifications or recovery actions on some.
■ PatrolCollectorStatus (BEAWLS_SERVER, page 281)
If PatrolCollectorStatus goes into alarm, PATROL is not receiving updated data and your monitoring is offline. This and ConnectionStatus are the two most critical parameters to assure availability of your WebLogic environment.
■ ConnectionStatus (BEAWLS_LOCAL_MANAGED, page 270; BEAWLS_MANAGED, page 272; BEAWLS_SERVER, page 279)
This parameter indicates that the PATROL collector cannot communicate with the server. You may need to restart the WebLogic server.
■ AvailableClusterServers (BEAWLS_CLUSTER, page 254)
This parameter indicates whether a clustered server is up or down.
124 PATROL for BEA WebLogic User Guide

4
■ HealthStatus (BEAWLS_JMSSERVER, page 266; BEAWLS_LOCAL_MANAGED, page 271; BEAWLS_MANAGED, page 273; BEAWLS_SERVER, page 280)
There are four of these parameters for different types of servers. Each indicates an assessment of the health of the server.
■ TransactionTimeoutRate (BEAWLS_EJB_HOME, page 259):
This parameter sets alarm values to flag abnormally high numbers of timeouts, which may indicate a problem with your EJB pool or may indicate another problem that is preventing EJBs from completing fast enough to free up connections.
■ ExecuteQueueLength (BEAWLS_EXEC_QUEUE, page 260)
This parameter sets alarm values to flag abnormally long queues.
■ PoolState (BEAWLS_JDBC, page 263)
This parameter indicates whether pool is available, or has been shutdown or suspended.
Reporting values
Since some parameters always increase for a given application server, the KM reports only changes that occured in the last collection cycle, which is usually three to five minutes. This enables you to set alarm ranges and boundaries, which would not be possible if the value always increased.
For example, the FailuresToReconnectCount parameter is a cumulative count since the application server was restarted.
However, the KM only reports the change in this parameter since the last collection cycle. This allows for the setting of boundary ranges and alarm ranges, which would not be possible for a parameter that always increases.
Working with eventsSome features in PATROL for BEA WebLogic (such as log file sniffing and JMX MBean monitoring) are intended to be used in conjunction with PATROL events. This section provides a brief look at how events can be managed using related PATROL products.
Chapter 4 Managing the BEA WebLogic environment 125

4
Managing event triggers to work with other products
If you use other PATROL products, such as the PATROL Configuration Manager (PCM) or the PATROL Event Management KM, to manage configurations or events, you will need to suspend the custom events trigger.
Normally, PATROL for BEA WebLogic controls the triggering of events via the AttrDiscovery parameter. By default, AttrDiscovery triggers an event whenever it finds that the state has changed on any of the server HealthStatus parameters or on the JDBC PoolState parameter.
You can suspend the event triggers for all these parameters, which will allow you to work with PCM or the Event Management KM.
To suspend event triggers
1 Right-click the BEAWLS_SERVER icon.
2 From the KM Commands menu, choose KM Administration => Suspend Custom Events Triggering for Objects Discovery.
Event triggers are now off and can be controlled with PCM or other products.
Events will be triggered when the state of the following parameters first changes to WARN or ALARM/CRITICAL/FAILED:
■ BEAWLS_SERVER/HealthStatus, ■ BEAWLS_JMS/HealthStatus ■ BEAWLS_JMSSERVER/HealthStatus ■ BEAWLS_JDBC/PoolState
If Advanced Monitoring is enabled, events will be triggered when the state of the following parameters first changes to the WARN or ALARM/CRITICAL/FAILED:
■ InvocationCount ■ InvocationRate ■ AvgResponseTime ■ TotalResponseTime
NOTE All the preceding parameters are found in multiple classes. All these parameters can trigger events.
126 PATROL for BEA WebLogic User Guide

4
These parameters are controlled by the pre-defined alarm thresholds. You can use PCM to reset them.
Use the command KM Administration => Resume Custom Events Triggering for Objects Discovery to turn the triggers back on.
Managing events using PEM
Use the PEM to monitor WebLogic events, including those generated by defined JMX conditions.
The PEM is a powerful feature of every PATROL Console. Using the PEM, you can view and manage various types of events—everything from disk failures to stopped critical processes. You can define the behavior of events for your system, establish recovery actions, or use Diary features to log events.
To monitor events with the PATROL Event Manager
1 Choose Event Manager from the Tools menu of your PATROL Console.
The PATROL Event Manager window appears, as shown in the following figure:
2 Right-click an event to see details, as shown in the following figure:
Help providesmore detailsabout PEM
Chapter 4 Managing the BEA WebLogic environment 127
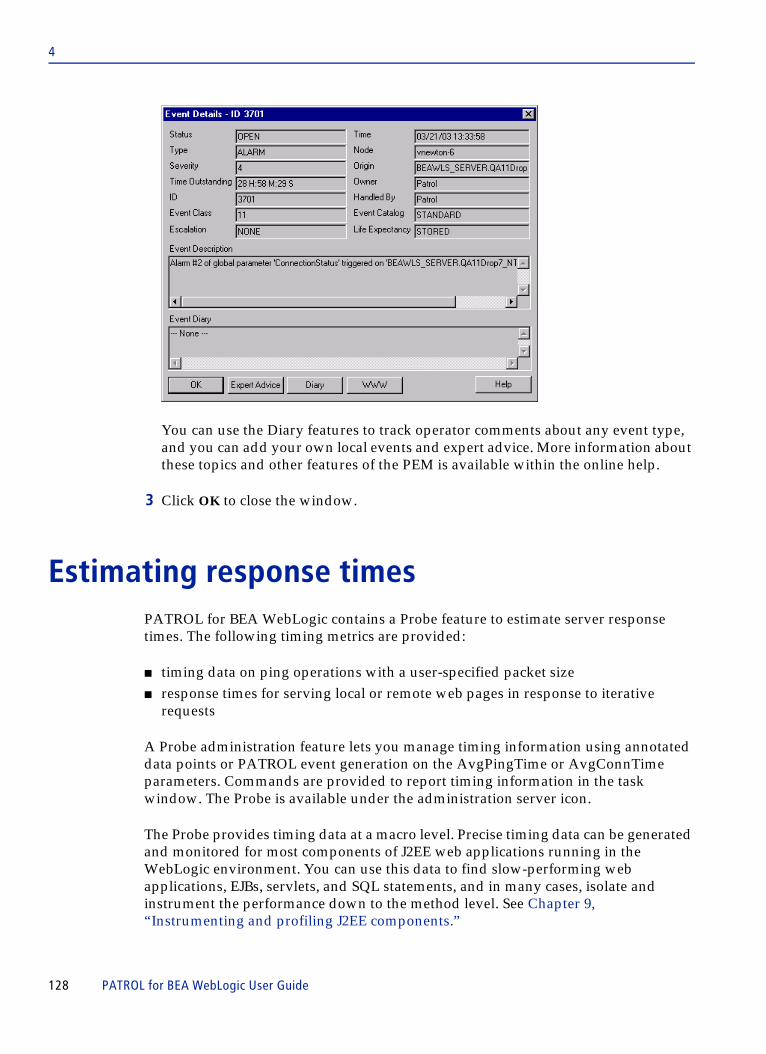
4
You can use the Diary features to track operator comments about any event type, and you can add your own local events and expert advice. More information about these topics and other features of the PEM is available within the online help.
3 Click OK to close the window.
Estimating response timesPATROL for BEA WebLogic contains a Probe feature to estimate server response times. The following timing metrics are provided:
■ timing data on ping operations with a user-specified packet size■ response times for serving local or remote web pages in response to iterative
requests
A Probe administration feature lets you manage timing information using annotated data points or PATROL event generation on the AvgPingTime or AvgConnTime parameters. Commands are provided to report timing information in the task window. The Probe is available under the administration server icon.
The Probe provides timing data at a macro level. Precise timing data can be generated and monitored for most components of J2EE web applications running in the WebLogic environment. You can use this data to find slow-performing web applications, EJBs, servlets, and SQL statements, and in many cases, isolate and instrument the performance down to the method level. See Chapter 9, “Instrumenting and profiling J2EE components.”
128 PATROL for BEA WebLogic User Guide

4
This section describes how to use the Probe feature.
Testing file transfer rate
Perform these steps to time data transfer rates from a WebLogic Server.
This performs a ping operation, sending a packet of data of a size that you specify, and returning the number of milliseconds elapsed between the time of the request and the time of the response. If the connection fails, the system output window shows a series of messages that may help you isolate the cause.
To time transfer rates
1 Right-click the BEAWLS_PROBE application icon.
2 Choose KM Commands => Ping Server.
3 Specify the file size that you want tested.
4 Click OK.
Testing web page response
Perform these steps to send web page requests to a remote or local web server and produce timing information on the number of milliseconds needed to receive a response.
You can set a number of iterations to send multiple requests, which can provide a range of response times.
To test response times
1 Right-click the BEAWLS_PROBE application icon.
2 Choose KM Commands => Test Web Page Response.
NOTE
Probe features are not active when monitoring a remote managed server.
Chapter 4 Managing the BEA WebLogic environment 129

4
3 Specify the address (URL) of the web page you want timed.
4 Use the slide bar to set the number of consecutive requests you want sent.
5 Click OK.
Administering Probe
Perform these steps to turn on or off annotations for Probe parameters and to turn on or off event generation for Probe timing data.
Annotations apply to the AvgPingTime and AvgConnTime parameters and include information about the time each data point was collected and the value of the timing data parameter. Event generation sends timing information to the PEM when the parameter status is in WARNING or ALARM. Use PEM to manage event data.
To use the Probe Administration dialog box
1 Right-click the BEAWLS_PROBE application icon.
2 Choose KM commands => Administration.
The Probe Administration dialog box is displayed, as shown in the following figure:
select this box togenerate events when
AvgPingTime is inWARNING or ALARM
select this box togenerate events when
AvgConnTime is inWARNING or ALARM
use slider bars toset number of ping messages,
size of ping requests, andnumber of connections
130 PATROL for BEA WebLogic User Guide

4
3 Click checkboxes to turn individual features on or off. A check indicates that the feature is turned on. The fields on the dialog box are defined as follows:
■ Annotation for Ping Time Data—check this box to produce annotated data points for the AvgPingTime parameter; annotations include timestamps for each collection cycle and the time (in milliseconds) needed to complete a ping operation
■ Annotation for Connection Time Data—check this box to produce annotated data points for the AvgConnTime parameter; annotations include timestamps for each collection cycle and the number of milliseconds needed to establish a connection
■ Event Trigger for Ping Status—check this box to generate a PATROL event when the parameter status is WARNING or ALARM; event data can be monitored through the PEM
■ Event Trigger for Connection Status—check this box to generate a PATROL event each time connection data is collected
4 Use slider bars to set higher or lower testing standards. You can more accurately reflect real-world conditions by increasing the number of requests (times to ping), the size of a message packet, or the number of connection requests that the weblogic.Admin utility will make to the server instance.
5 Click OK.
Generating reportsPATROL for BEA WebLogic provides a number of reporting functions to list various configuration settings and performance metrics. These reports are always displayed in a system output window.
Table 10 lists the basic types of reports you can generate and describes what type of information is produced by each. If you enable the advanced monitoring instrumentation and profiling features, additional reports on J2EE object performance will be available. For more information, see Chapter 9, “Instrumenting and profiling J2EE components.”
Most of these reports provide basic metrics or configuration settings on basic WebLogic components. If you are unsure about what any of the report information represents, or how the components are used and configured, see the documentation provided by BEA at http://e-docs.bea.com/.
Chapter 4 Managing the BEA WebLogic environment 131

4
Table 10 Reports in PATROL for BEA WebLogic (Part 1 of 3)
Report nameFrom instance icon of class... Contents
App. Component Response
BEAWLS_J2EE_ APPS
displays a report that lists all the application component responses
Note: Advanced monitoring and byte-code instrumentation is required.
App. Views Summary
BEAWLI_INTEGRATION
defines the usage of an adapter for business-focused interfaces to an EIS
Behavior Tracking BEAWLP_PORTAL
displays a report on the maximum size of the event buffer, which holds events until the events are persisted to the database, and lists the interval, in seconds, at which the buffers should be checked to see whether events in the buffer must be persisted
Connection Leak BEAWLS_JDBC displays the connection leak profile, including stack trace at the time the connection was created
Deployment Configuration
BEAWLS_WEBAPP
creates a report containing the deployment configuration for this web application
Doc. Content Pool Info.
BEAWLP_PORTAL
displays a report that lists the maximum capacity of the pool, the login timeout of the pool, the JDBC driver name, and other properties of the pool
Execute Threads Report
BEAWLS_EXEC_QUEUE
displays a report that lists the usage and activity information for all threads in an execution pool, including current request, last request, number of requests served, current user, and a flag indicating whether the thread is idle
Health Statistics BEAWLI_INTEGRATION
displays an overview of the integration system health
JMS Server Components
BEAWLS_SERVER displays configurable reports on JMS runtime data, such as connection factories, templates, destination keys, file store, JDBC store, or servers
JNDI Report BEAWLS_SERVER displays directory mapping information for various aspects of the WebLogic system, such as file system, EJB, JDBC, server, RMI, JMS, transaction, and common
JTA Information BEAWLS_SERVER displays statistics on the Java Transaction subsystem, including total transactions and total rollbacks
JTA Transaction BEAWLS_SERVER displays transaction information, such as number of transactions committed, rolled back, heuristics, organized by name, resource, or current transactions (in-flight)
132 PATROL for BEA WebLogic User Guide

4
License Information
BEAWLS_SERVER displays information about the product name (database), the IP address of the host that is licensed to run the product (if any), the license expiration date (if any), the number of hosts that can simultaneously run the product, and the license key value
Managed Server Response
BEAWLS_PROBE displays statistical information about response performance for a managed server (not relevant for remote managed servers)
Message Channels Info.
BEAWLI_INTEGRATION
displays a report on all the message channels of a message broker
Prepared Statement Cache
BEAWLS_JDBC displays cache snapshots stored externally for later analysis
Process Instance Summary
BEAWLI_INTEGRATION
displays a summary of the business process instance
Process Statistics BEAWLI_INTEGRATION
displays a report that lists business process information, including process instance ID, status, completion date and time for a completed process, termination date and time for a process that has been terminated, and pending activity
Realm Information BEAWLS_SERVER for each class in the realm, lists the class names and the permissions granted to groups or ACLs for that realm
Report of Registered Instance
BEAWLS_SETUP displays a report on all registered WebLogic application servers, including server instance names, settings for their WebLogic and Java paths, and other details
Report on Pool Connection Setting
BEAWLS_JDBC displays a report on the connection pool setting
Report on Thresholds & Overrides Settings
BEAWLS_JMS_ DESTINATION
displays a report on the thresholds for message and bytes, overrides settings, and redeliver settings for this JMS destination
Security Information
BEAWLS_SERVER for each server in the domain, lists the security information for ACLs, groups, and users
Server Configuration
BEAWLS_SERVER displays a report about the WebLogic server configuration attributes
Server Connections
BEAWLS_SERVER displays a report about the network configuration attributes such as HTTP settings, SSL settings, tuning parameters, and protocol information
Server Performance Setting
BEAWLS_SERVER displays a report about the server level performance-related settings
SQL Roundtrip BEAWLS_JDBC displays the SQL text, execution time, start and end time, and transaction name
Table 10 Reports in PATROL for BEA WebLogic (Part 2 of 3)
Report nameFrom instance icon of class... Contents
Chapter 4 Managing the BEA WebLogic environment 133
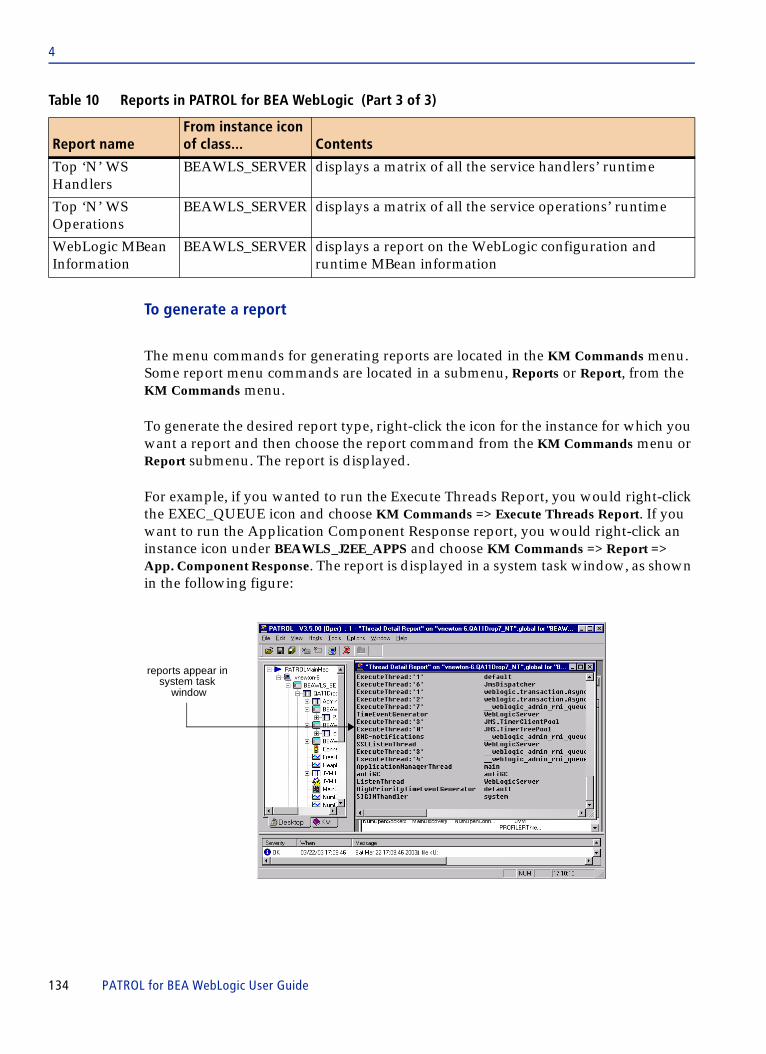
4
To generate a report
The menu commands for generating reports are located in the KM Commands menu. Some report menu commands are located in a submenu, Reports or Report, from the KM Commands menu.
To generate the desired report type, right-click the icon for the instance for which you want a report and then choose the report command from the KM Commands menu or Report submenu. The report is displayed.
For example, if you wanted to run the Execute Threads Report, you would right-click the EXEC_QUEUE icon and choose KM Commands => Execute Threads Report. If you want to run the Application Component Response report, you would right-click an instance icon under BEAWLS_J2EE_APPS and choose KM Commands => Report => App. Component Response. The report is displayed in a system task window, as shown in the following figure:
Top ‘N’ WS Handlers
BEAWLS_SERVER displays a matrix of all the service handlers’ runtime
Top ‘N’ WS Operations
BEAWLS_SERVER displays a matrix of all the service operations’ runtime
WebLogic MBean Information
BEAWLS_SERVER displays a report on the WebLogic configuration and runtime MBean information
Table 10 Reports in PATROL for BEA WebLogic (Part 3 of 3)
Report nameFrom instance icon of class... Contents
reports appear in system task
window
134 PATROL for BEA WebLogic User Guide

4
Chapter 4 Managing the BEA WebLogic environment 135

4
136 PATROL for BEA WebLogic User Guide

C h a p t e r 5
5 Managing clusters and serversThis chapter explains how to manage the servers on which you run BEA WebLogic, including administrative, managed, and local managed servers.
The following topics are discussed:
Managing WebLogic Servers . . . . . . . . . . . . . . . . . . . . . . . . . . . . . . . . . . . . . . . . . . . . . . 138Booting a WebLogic Server . . . . . . . . . . . . . . . . . . . . . . . . . . . . . . . . . . . . . . . . . . . . 138Shutting down a WebLogic Server . . . . . . . . . . . . . . . . . . . . . . . . . . . . . . . . . . . . . . 139Locking or unlocking a server . . . . . . . . . . . . . . . . . . . . . . . . . . . . . . . . . . . . . . . . . . 140Performing Java garbage collection . . . . . . . . . . . . . . . . . . . . . . . . . . . . . . . . . . . . . 141Tuning a server configuration . . . . . . . . . . . . . . . . . . . . . . . . . . . . . . . . . . . . . . . . . . 141Identifying processes with high CPU usage . . . . . . . . . . . . . . . . . . . . . . . . . . . . . . 143
Monitoring and managing a single managed server . . . . . . . . . . . . . . . . . . . . . . . . . . 144Managing the node manager . . . . . . . . . . . . . . . . . . . . . . . . . . . . . . . . . . . . . . . . . . . . . . 146
Chapter 5 Managing clusters and servers 137

5
Managing WebLogic ServersPATROL for BEA WebLogic allows you to configure and manage WebLogic servers.
As of version 2.4.00, PATROL for BEA WebLogic will continue to collect data and monitor a managed server even when the associated Admin Server is offline. If the Admin Server of a monitored environment goes offline for any reason, the KM will continue to collect configuration and runtime data without intervention. In addition, it is possible to monitor only a Managed Server, without also monitoring its Admin Server (see “Monitoring and managing a single managed server” on page 144).
Booting a WebLogic Server
Perform these steps to shut down and then restart a WebLogic Server.
Reboot commands are available for both administration and managed servers. If an administration server goes down while managed servers are running, you do not need to restart the managed servers in order to recover management of the domain. If you restart the administration server with the discover attribute turned on, the administration server can discover managed servers and recover management. (See the WebLogic Server Administration document, available from BEA.)
You cannot boot a Remote Managed Server (the command will be disabled).
Discovery is turned on by the following setting in the startup script:
-Dweblogic.management.discover=true
Proceed to one of the following sections:
■ “To boot a WebLogic Administration Server” on page 138■ “To boot a WebLogic Local Managed Server” on page 139
To boot a WebLogic Administration Server
1 Right-click the instance icon of the server you want to re-boot.
2 Choose KM Commands => Admin => Boot Server.
3 In the Boot Server dialog box, specify the boot command to be run. If you are booting a Unix server, this is the full path to a pre-written script that can start the server, and the script argument as needed. The server should be booted in a non-interactive mode (the password should be read from password.ini or boot.properties, not from the command line).
138 PATROL for BEA WebLogic User Guide

5
4 Click OK.
To boot a WebLogic Local Managed Server
1 Right-click the instance icon of the server you want to re-boot.
2 Choose KM Commands => Admin => Boot Server.
3 Fill in the Boot Server dialog box fields as follows:
4 Click OK.
Shutting down a WebLogic Server
Perform these steps to completely shut down (turn off) a WebLogic Server.
To shut down a server
1 Right-click the instance icon of the administration or managed server that you want to shut down.
2 Choose KM Commands => Admin => Shutdown Server.
The Shut Down Server dialog box is displayed.
Table 11 Boot Server dialog box fields
Field Description
Boot Command (script) Specify the boot command to be run.
If you are booting a Unix server, this is the full path to a pre-written script that can start the server, and the script argument as needed. The server should be booted in a non-interactive mode (the password should be read from password.ini or boot.properties, not from the command line).
PATROL Agent Hostname
Host name of the PATROL Agent machine.
PATROL Agent Port Number
Port number of the PATROL Agent.
OS Username to Login to Remote Agent
Operating system user name which will run the above script.
OS Password for Login Password for the above user.
Chapter 5 Managing clusters and servers 139

5
3 Slide the grace period selector to set the number of seconds to wait before shutting down.
4 Type a message that will be sent to active users.
5 Click OK.
Locking or unlocking a server
Perform these steps to lock or unlock a WebLogic Server.
This can be done on either an administration or a managed server. When a server is locked, no user other than an administrator can log in until the server is unlocked.
To lock a WebLogic Server
1 Right-click the instance icon of the server you want to lock.
2 Choose KM Commands => Admin => Lock Server.
The Lock Server dialog box is displayed, as shown in the following figure:
3 Enter a message to be displayed to any user who tries to log in during the lock period.
4 Click OK.
To unlock a WebLogic Server
1 Right-click the instance icon of the server you want to lock.
2 Choose KM Commands => Admin => Unlock Server.
3 Click OK.
140 PATROL for BEA WebLogic User Guide

5
Performing Java garbage collection
Perform these steps to instruct the Java Virtual Machine (JVM) to begin garbage collection.
Garbage collection can be done on either an administration or a managed server. JVM garbage collection reclaims memory by discarding unused objects.
To begin garbage collection
1 Right-click the instance icon of the server on which you want to collect garbage.
2 Choose KM Commands => Admin => Garbage Collection.
Tuning a server configuration
Perform these steps to tune server configuration attributes.
Tuning can be done on either an administration, managed, or local managed server. The configuration attributes control how a server manages its connections and process threads.
To tune a server configuration
1 Right-click the instance icon of the managed server or administration server that you want to tune.
2 Choose KM Commands => Admin => Server Configuration Tuning.
Chapter 5 Managing clusters and servers 141

5
The Server Tuning dialog box is displayed, as shown in the following figure:
3 Complete the fields on the dialog box as follows to adjust the tunneling, timeout, and thread attributes:
■ Tunneling Enabled—check this box to enable tunneling
Tunneling is a method of establishing a state-based connection via the HTTP protocol and is often used to create a stateful HTTP connection through a firewall. Tunneling decreases your WebLogic performance; use it only when necessary.
A better option is to use the t3 protocol on port 80 (if your firewall is able to pass IP packets through port 80).
■ Tunneling Client Ping Seconds—enter the number of seconds between pings
When a tunnel connection is created, the server periodically checks the state (up or down) of the remote client; 45 seconds is the optimum default value for the ping interval; the valid range is 20 to 900 seconds.
■ Tunneling Client Timeout Seconds—enter the number of seconds that must elapse from the last response from a client before a connection is considered “dead”
If a client does not respond to a request or ping within the timeout period, the WebLogic Server closes the HTTP tunnel connection; 40 seconds is the optimum default value; the valid range is 10 to 900 seconds.
■ Login Timeout (ms)—enter the number of seconds in which a login must complete from the time it is initiated
If a correct username/password combination is not entered and the login process completed within this time, the login process will be terminated
142 PATROL for BEA WebLogic User Guide

5
■ Thread Pool Socket Readers (Percent)—enter the percentage of execute threads that can be used as socket readers; the default value is 33; the allowable range is 1 to 99
4 Click OK.
Identifying processes with high CPU usage
Perform the following steps to define a high CPU threshold and identify processes exceeding that limit.
To define a high CPU threshold
1 Right-click the OS icon:
2 Choose KM Commands => Setup High CPU Threshold.
The Setup High CPU dialog box is displayed.
3 Enter the number of milliseconds that you consider to be the maximum reasonable time for a single WebLogic Server JVM process. If you want to see the current value of this threshold, right-click the BEAWLS_OS icon and choose InfoBox.
4 Click OK.
To use the high CPU threshold
1 Double-click the BEAWLS_OS icon to display its parameters.
2 Look at the NumHighCpuJVMProcesses parameter. This indicates the number of WebLogic Server JVM processes resident in this local host of the monitored domain (i.e., the Admin server and any local managed servers) that exceed the threshold you set. You can set alarms on this parameter if you want to be notified about processes consuming excess CPU time.
3 Look at the ActiveProcesses parameter. This identifies specific processes running in your JVM.
Chapter 5 Managing clusters and servers 143
5
Monitoring and managing a single managed server
PATROL for BEA WebLogic can monitor and manage a specific WebLogic server on a standalone basis, that is, without also monitoring its parent Admin Server and its sibling Managed Servers. This capability is enabled when you select the Managed Server option when registering a server for monitoring; see Step 3 of “To register a WebLogic Server” on page 93.
When you monitor a single Managed Server on a standalone basis, some of the application classes, parameters, menu commands, and InfoBoxes will behave somewhat differently to reflect the different management paradigm and other features will be inactive.
From the console perspective, the standalone server will look similar to a normal monitoring environment that consists of a single server under an Admin Server (the SERVER instance). The single Managed Server that you register will be a server instance icon (of either the BEAWLS_MANAGED or BEAWLS_LOCAL_MANAGED class) that appears under a SERVER icon representing the Admin Server—but that Admin Server instance will have limited functionality and will not provide the full range of parameters and performance metrics that you would have in a default monitoring environment. Table 12 describes how the Admin Server (BEAWLS_SERVER instance) will behave when used with a single Managed Server.
Most features of the MANAGED or LOCAL_MANAGED instance will behave as they are described in this user guide and the online help, but with a few exceptions:
■ Features provided by BEAWLI_INTEGRATION and BEAWLP_PORTAL (and any of their child class instances) will not be available.
■ The BEAWLS_OS class will monitor the managed server only along with any Node Manager process associated with the managed server.
■ The Admin_PROBE instance of BEAWLS_PROBE will be created to monitor the availability of the Admin server.
144 PATROL for BEA WebLogic User Guide
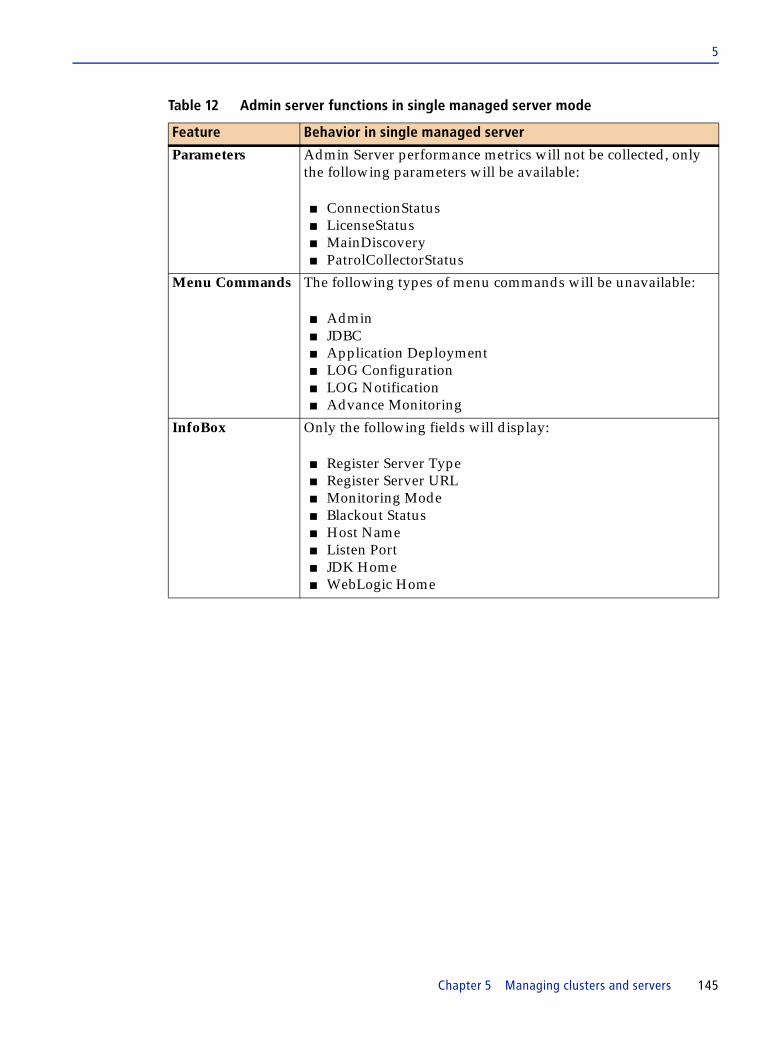
5
Table 12 Admin server functions in single managed server mode
Feature Behavior in single managed server
Parameters Admin Server performance metrics will not be collected, only the following parameters will be available:
■ ConnectionStatus■ LicenseStatus■ MainDiscovery■ PatrolCollectorStatus
Menu Commands The following types of menu commands will be unavailable:
■ Admin■ JDBC■ Application Deployment■ LOG Configuration■ LOG Notification■ Advance Monitoring
InfoBox Only the following fields will display:
■ Register Server Type■ Register Server URL■ Monitoring Mode■ Blackout Status■ Host Name■ Listen Port■ JDK Home■ WebLogic Home
Chapter 5 Managing clusters and servers 145
5
Managing the node managerPATROL for BEA WebLogic can monitor and manage the Node Manager process. Node Manager features are available via the BEAWLS_OS application class. The NodeStatus parameter indicates whether the Node Manager’s Java process is active for the monitored domain. You can also stop or start monitoring of the Node Manager process, or view a report showing configuration information about the Node Manager.
To suspend monitoring of the node manager
1 Right-click the OS icon:
2 Choose KM Commands => Node Manager Administration => Suspend Node Manager Monitoring.
The Node Manager process is removed from the list of active Java processes monitored for this domain.
To resume monitoring of the node manager
1 Right-click the OS icon.
2 Choose KM Commands => Node Manager Administration => Resume Node Manager Monitoring.
The Node Manager process is added to the list of active Java processes monitored for this domain.
To display the node manager configuration report
1 Right-click the OS icon.
2 Choose KM Commands => Node Manager Administration => Report on Node Manager Configuration.
NOTE To monitor a remote Node Manager, you must have a PATROL Agent and the KM running on the remote host. You must also have registered the server as a Managed Server, as described in Chapter 3. See “Registering a server” on page 93.
146 PATROL for BEA WebLogic User Guide

5
A report will be displayed. The report will show basic configuration information, such as the listen port and address, and information about SSL certificates. If you would like to know more about what the information in this report represents, see the WebLogic product documentation, available at: http://edocs.bea.com/
When this report is run on an Admin Server, it reports on all Node Managers running within its domain. When the report is run on a single Managed Server, it reports only on the Node Manager resident on that Managed Server.
Chapter 5 Managing clusters and servers 147

5
148 PATROL for BEA WebLogic User Guide

C h a p t e r 6
6 Managing portal serversThis chapter explains how to manage BEA WebLogic portal servers.
The following topics are discussed:
Managing WebLogic portal servers . . . . . . . . . . . . . . . . . . . . . . . . . . . . . . . . . . . . . . . . 150Tuning a cache . . . . . . . . . . . . . . . . . . . . . . . . . . . . . . . . . . . . . . . . . . . . . . . . . . . . . . . 150Flushing a cache. . . . . . . . . . . . . . . . . . . . . . . . . . . . . . . . . . . . . . . . . . . . . . . . . . . . . . 151Suspending cache monitoring . . . . . . . . . . . . . . . . . . . . . . . . . . . . . . . . . . . . . . . . . . 151Resuming cache monitoring . . . . . . . . . . . . . . . . . . . . . . . . . . . . . . . . . . . . . . . . . . . 152
Chapter 6 Managing portal servers 149

6
Managing WebLogic portal serversPATROL for BEA WebLogic allows you to tune and monitor Portal servers in the WebLogic system.
Tuning a cache
Perform the following steps to tune a cache.
To tune a cache
1 Right-click the instance icon of the Portal server whose cache you want to resume monitoring.
2 Choose KM Commands => Cache Tuning.
The Cache Tuning dialog box is displayed, as shown in the following figure:
3 Complete the fields in the dialog box as follows:
■ Max Entries—enter the maximum number of entries allowed in the cache
■ Time to Live—enter the time to live for elements added to the cache
150 PATROL for BEA WebLogic User Guide

6
■ Cache Mode?—select one of the following options:
— True—the portal cache service is available— False—the portal cache service is not available
■ Annotate Change Information—select one of the following options:
— Yes—annotation is turned on and annotating data is shown in the PATROL parameter data point under the CacheMode parameter of BEAWLP_CACHE
— No—annotation is not turned on
■ Performance Tuning Advisory for Cache—this field is informational only and can contain advice for tuning the selected cache
4 Click OK.
Flushing a cache
Perform these steps to flush a cache.
To flush a cache
1 Right-click the instance icon of the Portal server whose cache you want to resume monitoring.
2 Choose KM Commands => Flush Cache.
The results message is displayed in the system output window.
Suspending cache monitoring
Perform these steps to suspend the monitoring of a cache.
To suspend cache monitoring
1 Right-click the instance icon of the Portal server whose cache you want to suspend monitoring.
2 Choose KM Commands => Suspend Monitoring.
Chapter 6 Managing portal servers 151

6
Resuming cache monitoring
Perform these steps to resume the monitoring of a cache for which monitoring has been suspended.
To resume cache monitoring
1 Right-click the instance icon of the Portal server whose cache you want to resume monitoring.
2 Choose KM Commands => Resume Cache Monitoring.
The Resume Cache Monitoring dialog box is displayed, listing the caches that are suspended.
3 Select the suspended cache.
4 Click OK to resume monitoring.
152 PATROL for BEA WebLogic User Guide

C h a p t e r 7
7 Managing WebLogic components and servicesThis chapter explains how to effectively manage the component pieces of a WebLogic environment. Reports are available on some of these components. For more information, see “Generating reports” on page 131.
The following topics are discussed:
Configuring WebLogic components . . . . . . . . . . . . . . . . . . . . . . . . . . . . . . . . . . . . . . . . 154Configuring the JTA . . . . . . . . . . . . . . . . . . . . . . . . . . . . . . . . . . . . . . . . . . . . . . . . . . 154Configuring the JMS . . . . . . . . . . . . . . . . . . . . . . . . . . . . . . . . . . . . . . . . . . . . . . . . . . 155
Managing JDBC pools . . . . . . . . . . . . . . . . . . . . . . . . . . . . . . . . . . . . . . . . . . . . . . . . . . . . 157Creating a JDBC pool . . . . . . . . . . . . . . . . . . . . . . . . . . . . . . . . . . . . . . . . . . . . . . . . . 157Removing a JDBC pool . . . . . . . . . . . . . . . . . . . . . . . . . . . . . . . . . . . . . . . . . . . . . . . . 160Administering JDBC pools. . . . . . . . . . . . . . . . . . . . . . . . . . . . . . . . . . . . . . . . . . . . . 160Enabling or disabling JDBC profiling. . . . . . . . . . . . . . . . . . . . . . . . . . . . . . . . . . . . 162Generating JDBC profiling reports . . . . . . . . . . . . . . . . . . . . . . . . . . . . . . . . . . . . . . 162Configuring the JDBC . . . . . . . . . . . . . . . . . . . . . . . . . . . . . . . . . . . . . . . . . . . . . . . . . 163
Monitoring web services . . . . . . . . . . . . . . . . . . . . . . . . . . . . . . . . . . . . . . . . . . . . . . . . . . 164Resetting statistics . . . . . . . . . . . . . . . . . . . . . . . . . . . . . . . . . . . . . . . . . . . . . . . . . . . . 164Monitoring service operations. . . . . . . . . . . . . . . . . . . . . . . . . . . . . . . . . . . . . . . . . . 165Monitoring operation handlers . . . . . . . . . . . . . . . . . . . . . . . . . . . . . . . . . . . . . . . . . 165Stopping the monitoring of handlers or operations . . . . . . . . . . . . . . . . . . . . . . . . 166
Managing applications . . . . . . . . . . . . . . . . . . . . . . . . . . . . . . . . . . . . . . . . . . . . . . . . . . . 166Automatically deploying domain applications . . . . . . . . . . . . . . . . . . . . . . . . . . . 167Deploying and undeploying applications to servers . . . . . . . . . . . . . . . . . . . . . . . 168Selecting a servlet to monitor. . . . . . . . . . . . . . . . . . . . . . . . . . . . . . . . . . . . . . . . . . . 169Stopping the monitoring of a servlet . . . . . . . . . . . . . . . . . . . . . . . . . . . . . . . . . . . . 170
Chapter 7 Managing WebLogic components and services 153

7
Configuring WebLogic componentsPATROL for BEA WebLogic allows you to perform the following actions to configure and manage key components of the WebLogic system:
■ configure the Java Transaction API (JTA) to set timeout and threshold limits■ configure the Java Database Connection (JDBC) pool to set initial and maximum
numbers of connections, and to set a login delay to avoid potential logjams in the connection creation process
■ configure the Java Message Service (JMS) to set quotas and thresholds
Configuring the JTA
Perform these steps to configure the JTA, setting time limits for transactions to complete and commit.
To configure the JTA
1 Right-click the instance icon of the administrative server:
2 Choose KM Commands => Admin => JTA Configuration.
The JTA Configuration dialog box is displayed, as shown in the following figure:
3 Complete the fields on the dialog box as follows to specify threshold values to set limits on how quickly a transaction must complete:
■ Timeout Seconds—specify the maximum number of seconds that a transaction will be allowed to run before it is rolled back
154 PATROL for BEA WebLogic User Guide
7
■ Abandon Timeout Seconds—specify the maximum number of seconds in which a transaction must be committed before it is abandoned and rolled back
■ Before Completion Iteration Limit—specify the maximum number of iterations (callbacks) that a transaction can perform before being rolled back
■ Max Transactions—set the maximum number of transactions that can be simultaneously in progress
■ Max Unique Name Statistics—set the maximum number of unique transaction names for which statistics will be maintained
■ Forgot Heuristics—check this box to discard heuristically determined transaction data or uncheck the box to retain the data
Heuristics are used to define whether and how transactions are completed and committed autonomously by the WebLogic server (for example, if a client-server connection is broken before a transaction can be committed).
4 Click OK.
Configuring the JMS
Perform these steps to configure the JMS.
To configure the JMS
1 Right-click the instance icon of the JMS Server:
2 Choose KM Commands => Configuration.
The JMS Threshold and Quota dialog box is displayed, as shown in the following figure:
Chapter 7 Managing WebLogic components and services 155

7
3 Complete the fields on the dialog box as follows to specify threshold values to set limits on how many bytes and messages should be retained on the message server:
■ Bytes Maximum—set the maximum number of bytes to be retained on the JMS server
■ Bytes Threshold High—set a number of bytes that will constitute the upper threshold level; when the number of bytes stored on the server exceeds this threshold level, a message is triggered
■ Bytes Threshold Low—set a number of bytes that will constitute the lower threshold level; when the number of bytes stored on the server drops below this threshold level, a message is triggered
■ Messages Maximum—set the maximum number of messages to be retained by the JMS server
■ Messages Threshold High—set a number of messages that constitute the upper threshold level; when the number of messages stored on the server exceeds this threshold level, a message is triggered
■ Messages Threshold Low—set a number of messages that constitute the lower threshold level; when the number of messages stored on the server drops below this threshold level, a message is triggered
4 Click OK.
156 PATROL for BEA WebLogic User Guide

7
Managing JDBC pools PATROL for BEA WebLogic allows you to perform the following actions to manage JDBC pools:
■ create JDBC pools■ delete JDBC pools■ enable or disable profiling■ generate profile reports
Creating a JDBC pool
Perform these steps to create a new JDBC connection pool.
To create a JDBC pool
1 Right-click the WebLogic admin server icon:
2 Choose KM Commands => JDBC => Create JDBC Pool.
The Create New JDBC Pool dialog box is displayed, as shown in the following figure:
NOTE
Creating or removing a JDBC Pool is not supported for WebLogic 8.1 or higher.
Chapter 7 Managing WebLogic components and services 157

7
3 Complete the fields on the dialog box as follows to specify the configuration information:
■ Pool Name—name of the pool used within WebLogic; this name must be unique, for example, NewJDBCpool
■ URL—address used to locate the database to which the pool connects; there are three parts to this URL (example, jdbc:cloudscape:demo):
— protocol— database type— database name
■ JDBC Driver—the name of the driver specific to your database type; this is supplied by the JDBC driver vendor (see vendor documentation for details)
■ Properties—the list of properties passed to the 2-tier JDBC driver for use in creating database connections (such as username and server)
158 PATROL for BEA WebLogic User Guide

7
■ ACL Name—the name of the ACL used to control access to this connection pool
■ Password—the password for connecting to the database
■ Initial Capacity—the number of physical database connections to create in a new pool
■ Max Capacity—maximum number of physical database connections in the pool; different JDBC drivers and database servers may limit this number
■ Capacity Increment—the number of connections to add when the pool size is increased
■ Login Delay Seconds—the number of seconds to delay before creating each connection in the pool; this delay occurs on initial creation and throughout the lifetime of the pool whenever a database connection is created
■ Allow Shrinking?—the flag indicating that JDBC pool is allowed to shrink to InitialCapacity
■ Shrink Period Minutes—the number of minutes to wait before shrinking an incremented pool
■ Refresh Period Minutes—the connection refresh interval; number of minutes between testing connections using TestTableName; failed connections are reopened; if TestTableName is not set, the test is not performed
■ Support Local Transaction—the flag indicating whether XA driver supports SQL with no global transactions; this is ignored for non-XA drivers
■ Prepared Statement Cache Size—the size of the prepared statement cache; number of prepared statements from a connection stored for future use; set to 0 to disable
■ Test Reserved Conn.—the flag indicating whether connections in the pool should be tested; the WebLogic Server tests a connection after giving it to the client, adding a small delay in serving connection requests but ensuring that clients receive working connections (assuming database is available and accessible
■ Test Released Conn.—the flag indicating whether connections should be tested before being returned to the pool; if all connections are in use and a client is waiting for connections, this will cause a slightly longer delay as the connection is tested
■ Test Table Name—the name of a database table used to test connections in the pool
■ Targets—target servers for this deployment
Chapter 7 Managing WebLogic components and services 159

7
4 Click Accept.
Removing a JDBC pool
Perform these steps to remove an existing JDBC connection pool.
To remove a JDBC pool
1 Right-click the WebLogic admin server icon:
2 Choose KM Commands => JDBC => Destroy JDBC Pool.
The Destroy JDBC Pool dialog box is displayed.
3 Click on the pool you want removed from the list of existing pools.
4 Click Accept.
The JDBC connection pool will be disconnected immediately, forcing removal of any connections that may exist to the pool.
Administering JDBC pools
Perform these steps to enable, reset, disable, shrink, or shut down a JDBC connection pool.
To administer JDBC pools
1 Right-click the instance icon of the pool you want to administer:
2 Choose KM Commands => Pool Administration.
The Pool Administration dialog box is displayed, as shown in the following figure:
NOTE
Creating or removing a JDBC Pool is not supported for WebLogic 8.1 or higher.
160 PATROL for BEA WebLogic User Guide

7
3 Click one of the following buttons next to the function you want performed on this pool:
■ Enable Pool—enable a previously disabled connection pool
■ Reset Pool—reset each connection in a connection pool
■ Shrink Pool—shrink the size of a connection pool, releasing resources allocated to unused database connections
■ Disable Pool by Dropping—disable a connection pool preventing client access, any active user operations are cancelled and current transactions are rolled back
■ Disable Pool by Freezing—disable a connection pool preventing client access, any active connections are suspended until the pool is re-enabled although disconnect operations are permitted to continue
■ Soft Shutdown—shut down a connection pool but allow jobs in progress to complete before destroying the connection, connections are closed as they are released back to the pool
■ Hard Shutdown—immediately shut down a JDBC connection pool, disconnecting any jobs in progress
4 Click OK.
Chapter 7 Managing WebLogic components and services 161

7
Enabling or disabling JDBC profiling
Perform these steps to turn on or off the collection of various types of JDBC profile information.
Three types of profile information can be collected:
■ Statement profiling—generates details about all SQL statements and their execution data
■ Connection leak profiling—if connection leaks occur, detailed information about the occurrence is saved
■ Prepared statement profiling—generates details about the usage of cached prepared SQL statements
To turn on or turn off profiling
1 Right-click the instance icon of the pool for which you want profile information turned on or off:
2 Choose KM Commands => Profile Settings.
3 Choose the command to enable or disable the collection of a type of profile data.
Generating JDBC profiling reports
Perform these steps to generate a report of JDBC profile data.
Three types of profile report can be generated:
■ Statement profile—reports the details about all SQL statements and their execution data
■ Connection leak profile—if connection leaks occur, reports the detailed information about the occurrence
■ Prepared statement profile—reports the details about the usage of cached prepared SQL statements
NOTE Collecting statement profile or prepared statement profile information is resource intensive and will degrade system performance if used excessively. Profiling should be disabled when not needed for diagnostic purposes.
162 PATROL for BEA WebLogic User Guide

7
To run the profile reports
1 Right-click the instance icon of the pool for which you want profile reports:
2 From the KM Commands menu, choose the command that reports on the type of profiling data in which you are interested. The commands are:
■ Profiling Reports => SQL Roundtrip■ Profiling Reports => Connection Leak■ Profiling Reports => Prepared Statement Cache
The report is displayed in a task output window.
Configuring the JDBC
Perform these steps to configure the JDBC pool.
You can set initial number of connections in a new pool, the maximum number of connections that can be maintained in a pool, and a pause interval to prevent overrunning the database server with multiple simultaneous login requests.
To set the initial number of connections in a pool
1 Right-click the instance icon of the JDBC pool you want to configure:
2 Choose KM Commands => Pool Tuning => Set Initial Pool Capacity.
The Set Initial Pool Capacity dialog is displayed.
3 Specify the number of connections that this pool should establish when it is initialized.
4 Click OK.
NOTE Generating JDBC profile reports requires that profiling be enabled. See “Enabling or disabling JDBC profiling” on page 162.
Chapter 7 Managing WebLogic components and services 163

7
To set the maximum number of connections in a pool
1 Right-click the instance icon of the JDBC pool you want to configure.
2 Choose KM Commands => Pool Tuning => Set Max Pool Capacity.
The Set Max Pool Capacity dialog is displayed.
3 Specify a limit for the maximum number of simultaneous connections that this JDBC pool should establish.
4 Click OK.
To set the login delay
1 Right-click the instance icon of the JDBC pool you want to configure.
2 Choose KM Commands => Pool Tuning => Set Login Delay.
The Set Login Delay dialog is displayed.
3 Specify the number of milliseconds that WebLogic should wait before establishing each login connection to the database server.
4 Click OK.
Monitoring web servicesPATROL for BEA WebLogic allows you to monitor the deployed web services, operations, and service-level JAX-RPC handlers of the WebLogic server.
Resetting statistics
Perform these steps to reset all of the failure statistics that have been gathered for this web service, web service handler, or web service operation.
164 PATROL for BEA WebLogic User Guide

7
To reset statistics
1 Right-click the instance icon of the web service, web service handler, or web service operation for which you want to reset statistics.
2 Choose KM Commands => Reset Statistics.
The statistics are reset.
Monitoring service operations
PATROL for BEA WebLogic automatically discovers all web services to monitor. You can choose to monitor an operation for specific web service for more in-depth information.
Perform the following steps to select specific web service operations to monitor.
To monitor service operations
1 Right-click the instance icon of the web service for which you want to monitor service operations.
2 Choose KM Commands => Monitor Service Operations.
The Specify Monitoring Web Service Operations by Statistic dialog box is displayed.
3 Select the operation to monitor and click OK.
A message is displayed in the system output window.
Monitoring operation handlers
PATROL for BEA WebLogic automatically discovers all web services to monitor. You can choose to monitor an operation handler for specific web service for more in-depth information.
Perform the following steps to select specific web service operation handlers to monitor.
Chapter 7 Managing WebLogic components and services 165

7
To monitor operation handlers
1 Right-click the instance icon of the web service for which you want to monitor operation handlers.
2 Choose KM Commands => Monitor Operation Handlers.
The Specify Monitoring Web Service Handlers by Statistic dialog box is displayed.
3 Select the handler to monitor and click OK.
A message is displayed in the system output window.
Stopping the monitoring of handlers or operations
Perform the following steps to stop the monitoring of web service handlers or web service operations.
To stop monitoring handlers or operations
1 Right-click the icon for the handler or operation instance.
2 Choose KM Commands => Stop Monitoring.
The icon for the handler or operation is removed and the PATROL collector will not gather data for the instance.
Managing applicationsPATROL for BEA WebLogic allows you to perform the following actions to monitor web applications and selected servlets from one or more applications:
■ from the administration server, control whether applications are automatically deployed and the frequency at which the server checks for applications to be auto-deployed
■ from the administration server, deploy applications to specific servers
■ from a web application, select which servlets will be monitored
166 PATROL for BEA WebLogic User Guide

7
Automatically deploying domain applications
Perform these steps to enable applications to be automatically deployed.
Applications are deployed automatically only from the directory /config/mydomain/applications of the installed WebLogic home directory. If the application you want deployed is not in that directory, you must copy it there to have it deployed automatically.
To enable automatic deployment of Applications
1 Right-click the icon representing your administration server:
2 Choose KM Commands => Admin => Domain Applications.
The Configure Domain Applications dialog box is displayed, as shown in the following figure:
3 Complete the fields on the dialog box as follows:
■ Auto Deployment Enabled—check the box to enable auto-deployment
■ Auto Update Interval (ms)—change the update interval if desired; the time is in milliseconds
4 Click OK.
TIP Servlets can also be monitored at the method level by using PATROL’s instrumentation and profiling features, as can EJBs and SQL statements. See Chapter 9, “Instrumenting and profiling J2EE components.”
frequency at which theserver checks for newauto-deployed applications
Chapter 7 Managing WebLogic components and services 167

7
Deploying and undeploying applications to servers
Perform these steps to deploy an application to a WebLogic server.
Any web application can be deployed to one or more WebLogic servers in your environment. You can later update deployment information to roll out the application to different servers, and you can undeploy an application from within the PATROL environment.
To Deploy an application
1 Right-click the icon representing your administration server:
2 Choose KM Commands => Application Deployment => Deploy Application.
The Domain Applications dialog box is displayed, as shown in the following figure:
3 Complete the fields on the dialog box as follows:
■ Application Name—type a unique instance name for the application
■ Application File Location—type the complete path and file name to the application
■ Target Servers—select one or more servers to which the application will be deployed
4 Click OK.
frequency at which theserver checks for newauto-deployed applications
168 PATROL for BEA WebLogic User Guide
7
To update application deployment information
1 Right-click the icon representing your administration server.
2 Choose KM Commands => Application Deployment => Update Application.
The Update Applications dialog box is displayed, which is functionally identical to the Deploy Applications dialog box.
3 Update the deployment information as needed.
4 Click OK.
To undeploy an application
1 Right-click the icon representing your administration server.
2 Choose KM Commands => Application Deployment => Undeploy Application.
The Undeploy Applications dialog box is displayed.
3 If your application appear in the list of deployed applications, click its name; otherwise you can type the application name.
4 Click OK.
Selecting a servlet to monitor
Perform these steps to select servlets packaged inside this web application that you want to monitor.
To select a servlet to monitor
1 Double-click the BEAWLS_WEBAPP container:
2 Right-click a WEBAPP instance icon.
NOTE
The Undeploy Application command is supported only for WebLogic 7.0.
Chapter 7 Managing WebLogic components and services 169

7
3 Choose KM Commands => Monitor Servlets.
4 From the list of available servlets, click the name of each servlet you want to monitor.
5 Click OK.
Stopping the monitoring of a servlet
Perform these steps to stop the monitoring of servlets packaged inside this web application.
To Stop the Monitoring of Servlets
1 Double-click the BEAWLS_WEBAPP container:
2 Double-click a WEBAPP instance icon.
3 Right-click the servlet that you do not want to monitor.
4 Choose KM Commands => Stop Monitoring.
The servlet is removed from the list.
170 PATROL for BEA WebLogic User Guide
C h a p t e r 8
8 Managing integration serversThis chapter explains how to manage BEA WebLogic Integration servers.
The following topics are discussed:
Managing processes. . . . . . . . . . . . . . . . . . . . . . . . . . . . . . . . . . . . . . . . . . . . . . . . . . . . . . 172Specifying a monitoring Java Process Definition (JPD) . . . . . . . . . . . . . . . . . . . . . 172Forcing archiving. . . . . . . . . . . . . . . . . . . . . . . . . . . . . . . . . . . . . . . . . . . . . . . . . . . . . 173Configuring an SLA for a business process. . . . . . . . . . . . . . . . . . . . . . . . . . . . . . . 173Administering a process. . . . . . . . . . . . . . . . . . . . . . . . . . . . . . . . . . . . . . . . . . . . . . . 174Stopping the monitoring of a process. . . . . . . . . . . . . . . . . . . . . . . . . . . . . . . . . . . . 175
Chapter 8 Managing integration servers 171

8
Managing processesPATROL for BEA WebLogic allows you to manage business processes in your WebLogic environment.
Specifying a monitoring Java Process Definition (JPD)
Perform the following steps to specify a monitoring JPD.
To specify a monitoring JPD
1 Right-click the instance icon of the Integration server.
2 Choose KM Commands => Specify Monitoring Process.
The Specify Monitoring Process by Runtime Statistics dialog box is displayed, as shown in the following figure:
3 Select the JPD to monitor.
4 Click OK.
A status message is displayed in the system output window.
172 PATROL for BEA WebLogic User Guide

8
Forcing archiving
Perform the following steps to force the archiver process to run immediately, rather than the next scheduled time.
To Force Archiving
1 Right-click the instance icon of the Integration server.
2 Choose KM Commands => Perform BPM archiver.
A results message is displayed.
Configuring an SLA for a business process
Perform the following steps to configure a service level agreement (SLA) for a business process. When the process execution time or percentage reaches the value set for a defined business process, PATROL for BEA WebLogic sends an event to the PATROL Event Manager (PEM).
To configure a process SLA
1 Right-click the instance icon of the Integration server process.
2 Choose KM Commands => Configure Process SLA.
The Configure Process SLA dialog box is displayed, as shown in the following figure:
Chapter 8 Managing integration servers 173
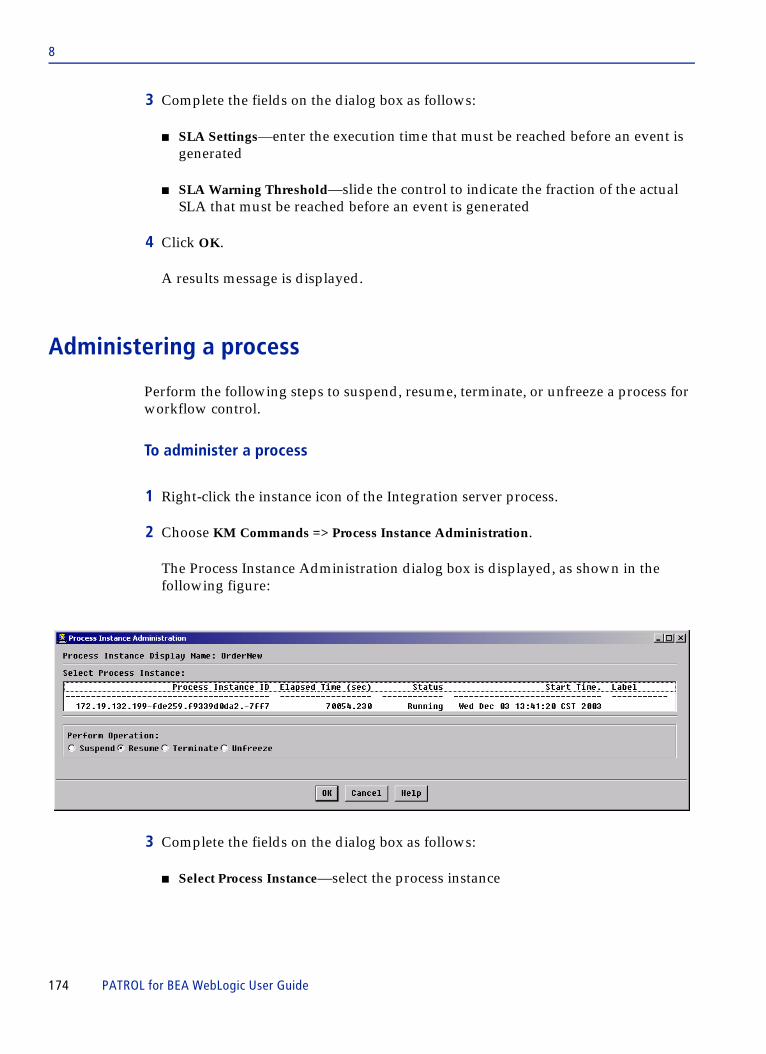
8
3 Complete the fields on the dialog box as follows:
■ SLA Settings—enter the execution time that must be reached before an event is generated
■ SLA Warning Threshold—slide the control to indicate the fraction of the actual SLA that must be reached before an event is generated
4 Click OK.
A results message is displayed.
Administering a process
Perform the following steps to suspend, resume, terminate, or unfreeze a process for workflow control.
To administer a process
1 Right-click the instance icon of the Integration server process.
2 Choose KM Commands => Process Instance Administration.
The Process Instance Administration dialog box is displayed, as shown in the following figure:
3 Complete the fields on the dialog box as follows:
■ Select Process Instance—select the process instance
174 PATROL for BEA WebLogic User Guide

8
■ Perform Operation—select one of the following options:
— Suspend—temporarily halt a process— Resume—resume the work of a process— Terminate—finish the operation in progress and then complete the process
without executing subsequent nodes— Unfreeze—resume the process from the point where it failed
4 Click OK.
A results message is displayed in the system output window.
Stopping the monitoring of a process
Perform the following steps to stop the monitoring of a process.
To stop the monitoring of a process
1 Right-click the instance icon of the Integration server process.
2 Choose KM Commands => Stop Monitoring.
The process is removed.
Chapter 8 Managing integration servers 175

8
176 PATROL for BEA WebLogic User Guide

C h a p t e r 9
9 Instrumenting and profiling J2EE componentsThis chapter explains how to use PATROL for BEA WebLogic to monitor performance of low-level objects, such as individual SQL statements, EJBs, and servlet methods.
The following topics are described:
Instrumenting and profiling J2EE objects. . . . . . . . . . . . . . . . . . . . . . . . . . . . . . . . . . . . 178Using instrumentation to monitor the most critical SQL objects . . . . . . . . . . . . . . . . 178
Running the Top N SQL report . . . . . . . . . . . . . . . . . . . . . . . . . . . . . . . . . . . . . . . . . 178Monitoring SQL objects . . . . . . . . . . . . . . . . . . . . . . . . . . . . . . . . . . . . . . . . . . . . . . . 180
Using instrumentation monitor the most critical EJBs . . . . . . . . . . . . . . . . . . . . . . . . . 181Running the Top N EJB or Top N EJB Methods report . . . . . . . . . . . . . . . . . . . . . 181Monitoring EJB methods . . . . . . . . . . . . . . . . . . . . . . . . . . . . . . . . . . . . . . . . . . . . . . 183
Using instrumentation to monitor the most critical application servlets . . . . . . . . . 184Running the Top N WebApps report . . . . . . . . . . . . . . . . . . . . . . . . . . . . . . . . . . . . 184Running the Top N Servlets report. . . . . . . . . . . . . . . . . . . . . . . . . . . . . . . . . . . . . . 186Monitoring servlets to the method level . . . . . . . . . . . . . . . . . . . . . . . . . . . . . . . . . 187
Profiling the Java virtual machine . . . . . . . . . . . . . . . . . . . . . . . . . . . . . . . . . . . . . . . . . . 188Running a thread detail report . . . . . . . . . . . . . . . . . . . . . . . . . . . . . . . . . . . . . . . . . 188
NOTE The features described in this chapter are not active in a default product configuration. They become available only when specifically enabled. See “Enabling and disabling instrumentation and profiling features” on page 106.
Chapter 9 Instrumenting and profiling J2EE components 177

9
Instrumenting and profiling J2EE objectsPATROL for BEA WebLogic allows you to discover detailed performance metrics and monitor your WebLogic components to a very granular level. Using tools provided in the product, you can find which SQL statements, EJBs, and web application servlets are the most resource intensive in your environment, and you can monitor the performance of these components to proactively isolate potential service problems before they become noticeable to end users.
You can also use these features together to characterize performance of J2EE components and to use this information to modify your Java code so as to optimize performance as you develop and roll out new web applications. To do this, you would iteratively use most of the instrumentation and method-level profiling features described in this chapter.
Using instrumentation to monitor the most critical SQL objects
By using the instrumentation features of PATROL for BEA WebLogic, you can generate a report showing which SQL objects are most expensive in your environment and you can monitor their performance.
After you know which SQL objects are most critical and you identify their associated DBURLs, you can also make modifications to your WebLogic configuration to optimize performance. For example, if you notice a pattern of slow performance from a particular DBURL, you may want to look at components that could affect its performance, such as the number of connections in its associated JDBC pool, and perhaps increase the maximum pool size to reduce the likelihood of waiters.
Running the Top N SQL report
Perform the following steps to run a report to identify which SQL statements are used most often on your WebLogic servers.
You can use this information to decide which SQL objects should be watched more closely, and you can identify web applications, servlets, and methods that call your most used or most resource-intensive SQL.
You can run the report for one specific database URL by using the command from the DBURL icon, or you can run the report to obtain data for all database URLs on the server by using the command from the server instance icon.
178 PATROL for BEA WebLogic User Guide

9
To Run the Top N SQL Report
1 Right-click the server instance icon or the DBURL instance icon.
2 Choose KM Commands => Advance Monitoring => Report Top N SQL.
The Report Top ‘N’ SQL Data Collection dialog box is displayed, as shown in the following figure:
3 Complete the fields on the dialog box as follows:
■ Response Data Collection Category—select one of the checkbox for the criterion you want used to determine “top” SQL:
— Average Response Time—select this checkbox to use average response time— Total Response Time—select this checkbox to use total response time— Total Invocation Count—select this checkbox to use total invocation count
■ Specify Top ‘N’ Category—slide the control to indicate the number of results you want
4 Click OK.
The report is displayed in a report task window. This report shows which statements respond slowest or are most often called. Using information from the report, you can start monitoring selected SQL and define alarm thresholds or alerts to be generated if performance degrades to unacceptable levels.
Chapter 9 Instrumenting and profiling J2EE components 179

9
The most useful information is the SQL call tracing section. This information shows what objects (web applications, servlets, methods, or EJBs) are calling the SQL (stack trace). Information contains the calling sequence of an SQL statement executed from the web application to the JSP or servlet to EJB. The calling stack trace will only be available form the Top N Average Response Times.
While you may want to monitor the SQL itself, you may also want to look more closely at objects identified in the stack trace to determine how well they are performing, and possibly monitor them as well.
Where to go from here
You can select SQL objects for monitoring (page 180), and you can further investigate and monitor methods and servlets related to your top SQL.
Monitoring SQL objects
Perform the following steps to monitor SQL objects.
SQL objects are not monitored by default because there are far too many of them and the objects of critical importance are specific to your own environment. If you are unsure which SQL objects are most important in your environment, start with the objects with the slowest performance or those most called by applications running in your environment. See “Running the Top N SQL report” on page 178 to find these SQL.
To Monitor SQL
1 Right-click a DBURL instance icon:
2 Choose KM Commands => Select SQL for Monitoring.
The Specify Top SQL dialog box is displayed.
3 Click the box next to the criteria you want to use for determining “top” SQL, then slide the bar to the number of responses you want
are responsetimes too slow?
180 PATROL for BEA WebLogic User Guide

9
4 Click OK.
The Select the SQL dialog is displayed, as shown in the following figure:
5 Complete the fields on the dialog box as follows:
■ Select SQL to monitor from the Top Average Response Time List—select the SQL you want monitored from the list of “top” SQL objects
■ Label for the selected SQL—type a label name. This label is used to create an instance icon in the PATROL Console.
6 Click OK.
Where to go from here
You can now monitor your selected SQL and can set alarm thresholds if you want to be alerted to significant performance changes in this SQL.
Using instrumentation monitor the most critical EJBs
In addition to showing you which EJBs are the most resource intensive in your environment, PATROL for BEA WebLogic provides a deeper level to delve into the EJBs themselves and identify which specific methods are most critical.
Running the Top N EJB or Top N EJB Methods report
Perform the following steps to run a report to identify which EJBs run slowest and are used most often on your WebLogic servers, then run another report to find which specific methods in those EJBs are slowest and most frequently called.
Chapter 9 Instrumenting and profiling J2EE components 181
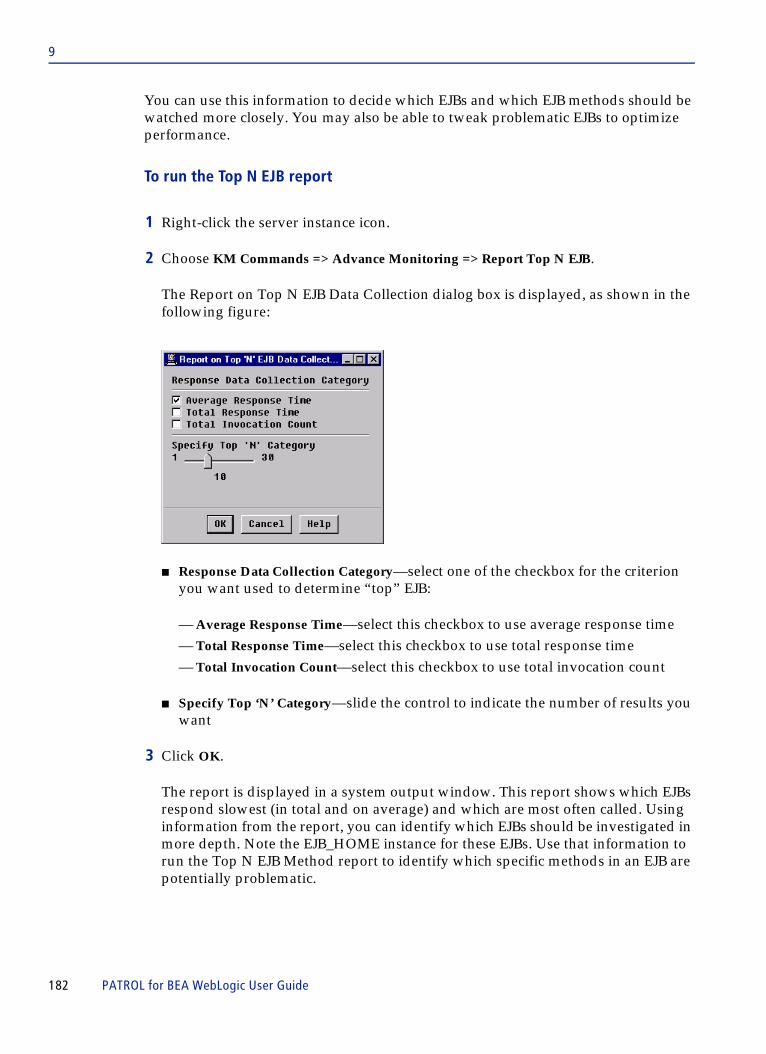
9
You can use this information to decide which EJBs and which EJB methods should be watched more closely. You may also be able to tweak problematic EJBs to optimize performance.
To run the Top N EJB report
1 Right-click the server instance icon.
2 Choose KM Commands => Advance Monitoring => Report Top N EJB.
The Report on Top N EJB Data Collection dialog box is displayed, as shown in the following figure:
■ Response Data Collection Category—select one of the checkbox for the criterion you want used to determine “top” EJB:
— Average Response Time—select this checkbox to use average response time— Total Response Time—select this checkbox to use total response time— Total Invocation Count—select this checkbox to use total invocation count
■ Specify Top ‘N’ Category—slide the control to indicate the number of results you want
3 Click OK.
The report is displayed in a system output window. This report shows which EJBs respond slowest (in total and on average) and which are most often called. Using information from the report, you can identify which EJBs should be investigated in more depth. Note the EJB_HOME instance for these EJBs. Use that information to run the Top N EJB Method report to identify which specific methods in an EJB are potentially problematic.
182 PATROL for BEA WebLogic User Guide

9
To run the Top N EJB method report
1 Right-click the EJB_HOME instance icon.
2 Choose KM Commands => Advance Monitoring => Report Top N EJB Method.
The report appears in a system output window. This report shows which specific methods in an EJB are most often called and which have the slowest total and average response rates.
Where to go from here
You can select EJBs for monitoring; for more information, see “Monitoring SQL objects” on page 180.
You can also further investigate and monitor methods and servlets related to your top EJB.
Monitoring EJB methods
Perform the following steps to monitor EJB methods.
By default, no EJB methods are monitored because there are far too many of them, the information is far too detailed for most users, and the objects of critical importance are specific to each individual WebLogic environment.
If you are unsure which EJB objects are most important in your environment, start by locating EJBs with the slowest performance or those most called by applications running in your environment, and then run a report on Top N EJB Methods to isolate the methods that are most likely to be important to you. For more information, see “Running the Top N EJB or Top N EJB Methods report” on page 181 to find these objects.
To monitor EJB methods
1 Right-click an EJB_HOME instance icon (running the Top N EJB Report will tell you which EJB_HOME instance to use).
2 Choose KM Commands => Monitor EJB Method.
Chapter 9 Instrumenting and profiling J2EE components 183

9
To stop monitoring an EJB method
1 Right-click the instance icon of the EJB method that you want to stop monitoring:
2 Choose KM Commands => Stop Monitoring.
Where to go from here
You can now monitor your selected EJB method and can set alarm thresholds if you want to be alerted to significant performance changes in this method.
Using instrumentation to monitor the most critical application servlets
You can use the instrumentation features in PATROL for BEA WebLogic to identify the following items:
■ which web applications are most used■ which servlets in those applications are most critical■ which specific methods are most critical to those servlets.
Running the Top N WebApps report
Perform the following steps to run a report to identify which web applications are used most often and have the longest response rates on your WebLogic servers.
You can use this information to decide which web applications should be watched more closely, and you can identify servlets for deeper profiling.
To run the Top N WebApp report
1 Right-click the server instance.
2 Choose KM Commands => Advance Monitoring => Report Top N WebApp.
The Configure Top N WebApp Data Collection dialog box is displayed, as shown in the following figure:
184 PATROL for BEA WebLogic User Guide
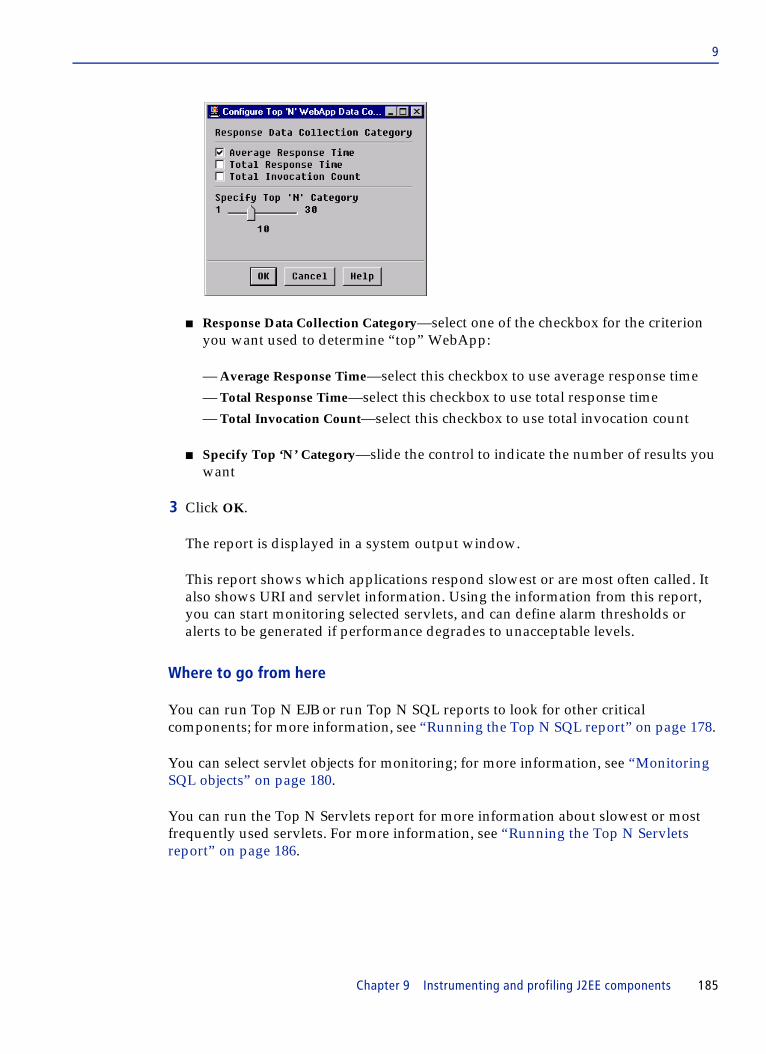
9
■ Response Data Collection Category—select one of the checkbox for the criterion you want used to determine “top” WebApp:
— Average Response Time—select this checkbox to use average response time— Total Response Time—select this checkbox to use total response time— Total Invocation Count—select this checkbox to use total invocation count
■ Specify Top ‘N’ Category—slide the control to indicate the number of results you want
3 Click OK.
The report is displayed in a system output window.
This report shows which applications respond slowest or are most often called. It also shows URI and servlet information. Using the information from this report, you can start monitoring selected servlets, and can define alarm thresholds or alerts to be generated if performance degrades to unacceptable levels.
Where to go from here
You can run Top N EJB or run Top N SQL reports to look for other critical components; for more information, see “Running the Top N SQL report” on page 178.
You can select servlet objects for monitoring; for more information, see “Monitoring SQL objects” on page 180.
You can run the Top N Servlets report for more information about slowest or most frequently used servlets. For more information, see “Running the Top N Servlets report” on page 186.
Chapter 9 Instrumenting and profiling J2EE components 185

9
Running the Top N Servlets report
Perform the following steps to run a report to identify which servlets are used most often and have the longest response rates on your WebLogic servers.
You can use this information to decide which servlets should be selected for monitoring.
To run the Top N Servlet report
1 Right-click the WEBAPP instance icon.
2 Choose KM Commands => Report Top N Servlet.
The Configure Top N Servlet Data Collection dialog box is displayed, as shown in the following figure:
■ Response Data Collection Category—select one of the checkbox for the criterion by which servlet information will be sorted:
— Average Response Time—select this checkbox to sort by average response time— Total Response Time—select this checkbox to sort by total response time— Total Invocation Count—select this checkbox to sort by total invocation count
■ Specify Top ‘N’ Category—slide the control to indicate the number of results you want
3 Click OK.
The report is displayed in a system output window.
186 PATROL for BEA WebLogic User Guide

9
This report shows which servlets respond slowest or are most often called. Using the information from this report, you can start monitoring selected servlets, and can define alarm thresholds or alerts to be generated if performance degrades to unacceptable levels.
Where to go from here
You can select servlet objects for monitoring; for more information, see “Monitoring SQL objects” on page 180.
You can run the Top N SQL or the Top N EJB reports to look for other critical components; for more information, see “Running the Top N SQL report” on page 178 and “Running the Top N EJB or Top N EJB Methods report” on page 181 respectively.
Monitoring servlets to the method level
Perform the following steps to monitor selected servlets and produce and analyze method-level performance data.
Servlets are not monitored by default because there are far too many of them and the objects of critical importance are specific to your own environment. If you are unsure which servlets are most important in your environment, start with the objects with the slowest performance or those most called by applications running in your environment. See “Running the Top N Servlets report” on page 186 to find these servlets.
To monitor servlets
1 Right-click a WEBAPP instance icon:
2 Choose KM Commands => Monitor Servlets.
3 From the list of available servlets, click the name of each servlet you want to monitor.
4 Click OK.
5 Run the Methods Response Report from the newly created SERVLET icon to see how well individual methods within the servlet are performing.
Chapter 9 Instrumenting and profiling J2EE components 187

9
To Run the Methods Response Report
1 Right-click a SERVLET instance icon:
2 Choose KM Commands => Methods Response Report.
The report is displayed in a system output window. Using the report, you can identify performance characteristics (response rates) of every method in the servlet. You may be able to modify the Java code of identified poorly performing methods to optimize response rates.
Where to go from here
You can monitor and analyze performance data for other J2EE components to further optimize overall application performance. For more information, see “Running the Top N SQL report” on page 178.
Profiling the Java virtual machineThe BEAWLS_JVMPROFILER application class provides a way for system administrators to look inside the Java Virtual Machine to see how system resources are being used. Parameters provide various statistics on memory usage, CPU usage, and processes and threads, as well as timing details on garbage collection cycles.
Running a thread detail report
Perform the following steps to generate a report showing resource usage by threads on this WebLogic Server JVM. You can identify costly threads and trace their parentage to see what processes spawn them.
NOTE Only the doGet, doPut, doPost, and doDelete methods are monitored for each servlet. The product will automatically create the SERVLET_METHOD instance icon when the report is executed.
NOTE This KM used the PATROL Operating System key toolkit to monitor the JVM process for the system process level.
188 PATROL for BEA WebLogic User Guide

9
To run the thread detail report
1 Right-click the JVMPROFILER icon:
2 Choose KM Commands => Thread Detail Report.
The report appears in a system output window. Performance data include CPU usage and memory usage (in bytes).
Chapter 9 Instrumenting and profiling J2EE components 189

9
190 PATROL for BEA WebLogic User Guide

C h a p t e r 10
10 Managing JMX-instrumented applicationsThis chapter explains how to effectively monitor and manage applications that are instrumented with Java Management Extensions (JMX). The following topics are discussed:
Monitoring JMX MBeans . . . . . . . . . . . . . . . . . . . . . . . . . . . . . . . . . . . . . . . . . . . . . . . . . 192Instrumenting your application with JMX . . . . . . . . . . . . . . . . . . . . . . . . . . . . . . . 192The PATROL for BEA WebLogic MBean interface . . . . . . . . . . . . . . . . . . . . . . . . 193Activating JMX monitoring . . . . . . . . . . . . . . . . . . . . . . . . . . . . . . . . . . . . . . . . . . . . 193Setting default e-mail address for notifications . . . . . . . . . . . . . . . . . . . . . . . . . . . 194Defining conditions for monitoring JMX MBeans . . . . . . . . . . . . . . . . . . . . . . . . . 195Adding automatic actions . . . . . . . . . . . . . . . . . . . . . . . . . . . . . . . . . . . . . . . . . . . . . 200Adding e-mail notifications . . . . . . . . . . . . . . . . . . . . . . . . . . . . . . . . . . . . . . . . . . . . 202
Advanced features for JMX monitoring . . . . . . . . . . . . . . . . . . . . . . . . . . . . . . . . . . . . . 203Manually registering an MBean . . . . . . . . . . . . . . . . . . . . . . . . . . . . . . . . . . . . . . . . 204Defining conditions for an unregistered MBean. . . . . . . . . . . . . . . . . . . . . . . . . . . 205Setting JMX debug flags . . . . . . . . . . . . . . . . . . . . . . . . . . . . . . . . . . . . . . . . . . . . . . . 206
Understanding condition settings and the ConditionDef configuration variable . . 207
NOTE Error messages for the JMX component (those containing the letters JMX in the error message number) are documented in the PATROL JMX Component Help. To view these messages, select Help => Help Topics. The PATROL Console Help dialog box is displayed, with the Contents tab on top. Double-click the PATROL Knowledge Modules book, then double-click the PATROL JMX Component Help to view the PATROL JMX Component Help. Then you can either view the messages using the Contents tab or the Index tab.
Chapter 10 Managing JMX-instrumented applications 191

10
Monitoring JMX MBeansPATROL for BEA WebLogic allows you to perform the following actions to monitor Java MBeans used in a JMX-managed WebLogic Server:
■ select which MBeans you want to monitor ■ define attributes that determine which MBeans are monitored, that trigger
automatic alerts, and that can take automatic actions based on your monitoring criteria
In any WebLogic environment, thousands of MBeans may exist, and any of them could be monitored by this product, but in most environments, only a small number of those MBeans will be important for monitoring purposes. To effectively use this product, you will need to set up some configuration options and to identify those MBeans that you want monitored. PATROL calls this process of identifying and specifying MBeans for monitoring as defining a condition.
After a condition is defined, you can implement automatic recovery actions that will take place whenever a condition occurs. Each condition can also automatically send e-mail notifications and can generate PATROL events that you can monitor with the PATROL Event Manager or other tools.
The following sequence of steps shows an implementation of JMX MBean monitoring in a typical WebLogic environment. Additional information is in the online Help.
1. Set up default e-mail notification.
2. Define conditions.
3. Add automatic actions.
4. Add e-mail notifications.
Instrumenting your application with JMX
JMX is a universal open technology for management and monitoring of Java applications and systems. Information about the JMX specification, including how to instrument your application with JMX, is at http://java.sun.com/products/JavaManagement.
The BEA WebLogic Server is instrumented with JMX, and it includes everything you need to add JMX management capabilities to your applications. The WebLogic JMX environment is accessible using the weblogic.management.MBeanHome class, provided by BEA. You can access MBeanHome by using JNDI to look up
192 PATROL for BEA WebLogic User Guide

10
MBeanHome.ADMIN.JNDI.NAME or MBeanHome.JNDI_NAME+”.”+serverName. After you access MBeanHome, use the getMBeanServer method to access WebLogic’s MBean server, then use the standard JMX methods to register MBeans. For more information, see the documentation provided by BEA.
The PATROL for BEA WebLogic MBean interface
In PATROL for BEA WebLogic, you can view MBeans with their components, set MBean attributes, invoke MBean operations, and monitor MBean attributes and notifications. These capabilities are available from the instance icon for the JMX_SERVER class (the icon labeled “MBeans on server”) or from instances of JMX_DOMAIN that appear under the server instance.
Some domains are recognized as being provided and controlled by BEA for the purpose of managing WebLogic. For MBeans in these domains, you will not be able to change attributes nor invoke operations. You will, however, be able to view MBeans, attributes, operations, notifications, and constructors, and you will be able to monitor attributes and notifications for these MBeans.
Activating JMX monitoring
The features described in this section are visible in the PATROL Console only after being enabled. To enable JMX Monitoring for your environment:
1 Right-click the instance icon representing the server on which you want to enable JMX monitoring.
2 From the KM Commands menu, choose Custom MBean Monitoring => Activate.
NOTE In some cases, WebLogic Server 7.0 may cause a security exception when an application attempts to create an MBean. If this happens, include the following line in the script that starts your server: -Dweblogic.diableMBeanAuthorization=true
Chapter 10 Managing JMX-instrumented applications 193
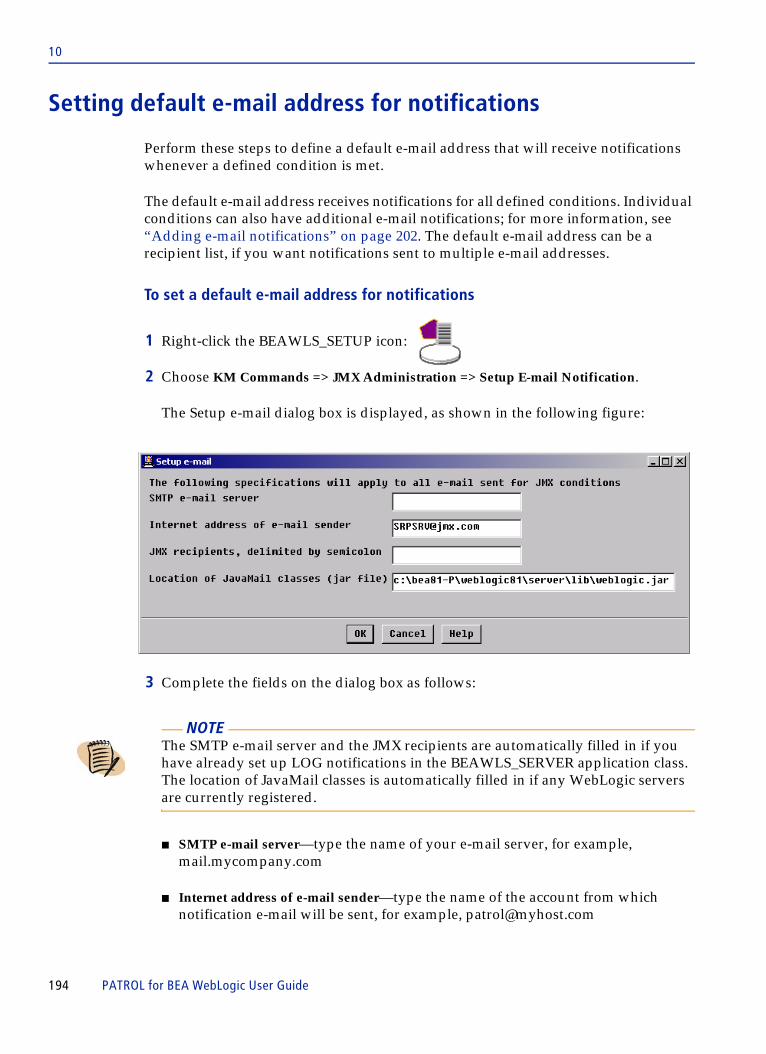
10
Setting default e-mail address for notifications
Perform these steps to define a default e-mail address that will receive notifications whenever a defined condition is met.
The default e-mail address receives notifications for all defined conditions. Individual conditions can also have additional e-mail notifications; for more information, see “Adding e-mail notifications” on page 202. The default e-mail address can be a recipient list, if you want notifications sent to multiple e-mail addresses.
To set a default e-mail address for notifications
1 Right-click the BEAWLS_SETUP icon:
2 Choose KM Commands => JMX Administration => Setup E-mail Notification.
The Setup e-mail dialog box is displayed, as shown in the following figure:
3 Complete the fields on the dialog box as follows:
■ SMTP e-mail server—type the name of your e-mail server, for example, mail.mycompany.com
■ Internet address of e-mail sender—type the name of the account from which notification e-mail will be sent, for example, [email protected]
NOTE The SMTP e-mail server and the JMX recipients are automatically filled in if you have already set up LOG notifications in the BEAWLS_SERVER application class. The location of JavaMail classes is automatically filled in if any WebLogic servers are currently registered.
194 PATROL for BEA WebLogic User Guide

10
■ JMX recipients—type the e-mail address(es) that are to receive notifications whenever a condition occurs; separate multiple addresses with semicolons
■ Location of JavaMail classes—type the full directory path and file name to the .jar file that contains the JavaMail classes, for example, d:\bea\weblogic91\server\lib\weblogic.jar
4 Click OK.
Where to go from here
Define the criteria for monitoring JMX MBeans. For more information, see the following section, “Defining conditions for monitoring JMX MBeans.”
Defining conditions for monitoring JMX MBeans
Perform these steps to define conditions for monitoring JMX MBeans.
When you define conditions, you establish the criteria for PATROL to monitor one or more MBeans, create icons in the console, and establish thresholds that are used to set the status of the instance, execute actions in the JMX server, generate PATROL events, and generate e-mail notifications.
To define conditions
1 Right-click a JMX server icon or a JMX domain icon under which the MBean is registered:
2 Choose one of the following menu commands:
■ KM Commands => Manage MBeans => Select MBeans to select specific MBeans.
The Select property key(s) for narrowing MBean selection dialog box is displayed, as shown in Figure 11 on page 196. Go to step 3 on page 196.
■ KM Commands => Manage MBeans => All MBeans to select all MBeans.
The MBeans Management dialog box is displayed. Go to step 5 on page 197.
NOTE The JMX server icon is not displayed in the Console unless Custom MBean Monitoring has been activated. See “Activating JMX monitoring” on page 193.
Chapter 10 Managing JMX-instrumented applications 195

10
Figure 11 Select property key(s) for narrowing MBean selection dialog box
3 Select the property keys for the MBean to narrow the range of registered MBeans based on object name properties.
4 Click Select.
The dialog boxes that are displayed next depend on the number of MBeans and values for the property keys selected. If you selected a property key with several MBeans and values, a series of dialog boxes are displayed through which you can narrow the MBean selection. After you complete all of the dialog boxes, the MBean matching pattern dialog box is displayed.
If you selected a property key with just one MBean and one value, the MBean Management dialog box is displayed, as shown in the following figure:
NOTE
You can select multiple property keys by highlighting each item.
196 PATROL for BEA WebLogic User Guide

10
5 Complete the fields on the dialog box as follows:
A Click the Manage MBeans button in the Action on select area.
B Click an MBean to select it.
Optionally, you can filter the list of MBeans by completing the fields shown in Table 13 on page 198.
For example, if you wanted to find all MBeans whose type is not Runtime or Config, you would
■ enter the word Type in the Attribute field■ use the drop-down list to select does not end with
■ enter the string &Config;Runtime in the Value field
click Manage MBeans
click an MBeanto select, clickagain to deselect
click Selectwhen finished,or click Exitto cancel allchanges
Chapter 10 Managing JMX-instrumented applications 197
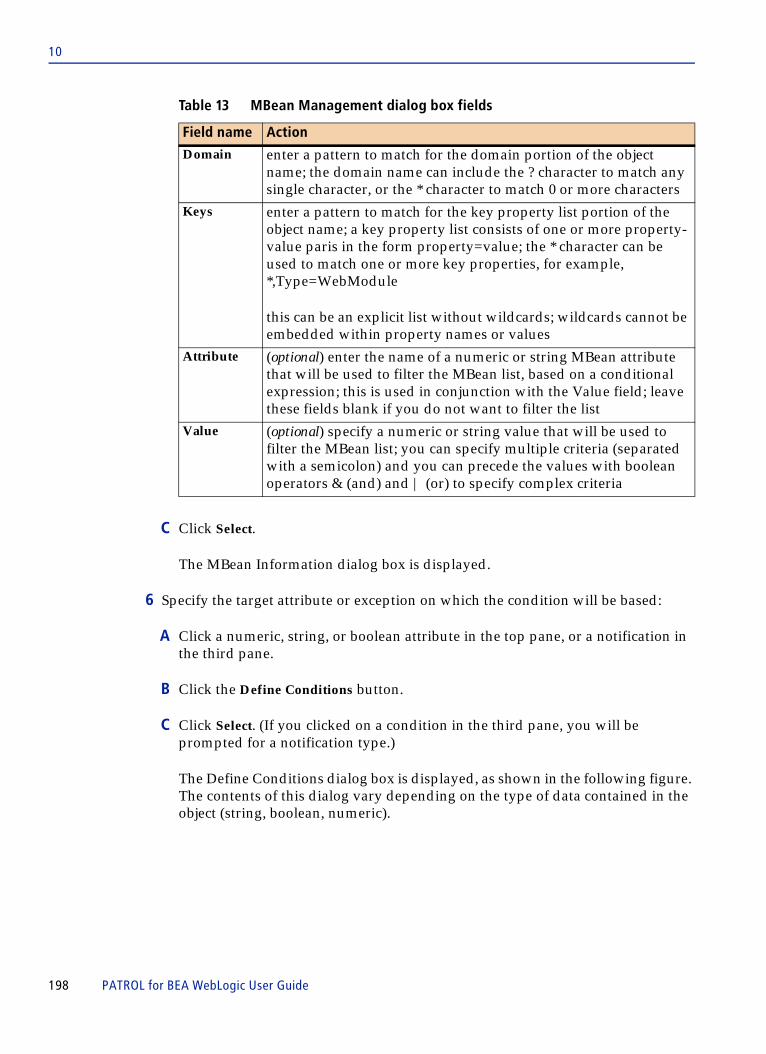
10
C Click Select.
The MBean Information dialog box is displayed.
6 Specify the target attribute or exception on which the condition will be based:
A Click a numeric, string, or boolean attribute in the top pane, or a notification in the third pane.
B Click the Define Conditions button.
C Click Select. (If you clicked on a condition in the third pane, you will be prompted for a notification type.)
The Define Conditions dialog box is displayed, as shown in the following figure. The contents of this dialog vary depending on the type of data contained in the object (string, boolean, numeric).
Table 13 MBean Management dialog box fields
Field name Action
Domain enter a pattern to match for the domain portion of the object name; the domain name can include the ? character to match any single character, or the * character to match 0 or more characters
Keys enter a pattern to match for the key property list portion of the object name; a key property list consists of one or more property-value paris in the form property=value; the * character can be used to match one or more key properties, for example, *,Type=WebModule
this can be an explicit list without wildcards; wildcards cannot be embedded within property names or values
Attribute (optional) enter the name of a numeric or string MBean attribute that will be used to filter the MBean list, based on a conditional expression; this is used in conjunction with the Value field; leave these fields blank if you do not want to filter the list
Value (optional) specify a numeric or string value that will be used to filter the MBean list; you can specify multiple criteria (separated with a semicolon) and you can precede the values with boolean operators & (and) and | (or) to specify complex criteria
198 PATROL for BEA WebLogic User Guide

10
7 Complete the condition definition:
A Type a name for the condition. This name will be used as an instance name for icons created in the PATROL Console, and it will be used to refer to this condition if you need to perform future updates.
B You can change the object name to monitor a different object, or you can optionally use wildcard characters (? or *) to monitor multiple MBeans for the same condition.
C If you want to apply this definition to other servers and PATROL Agents, set Scope of definition to Servers managed by this PATROL agent. (See below.)
set scope to “Servers managed by this PATROL agent”if you plan to export the definition
Chapter 10 Managing JMX-instrumented applications 199

10
D Complete the remaining fields, which vary depending on the type of element you selected. Click the Help button at the bottom of the dialog for information about the fields on this dialog.
8 Click OK.
Where to go from here
You can add automatic actions to your condition. These actions will occur whenever the condition is met. See “Adding automatic actions” on page 200. You can change the list of recipients to be notified whenever a condition is met. See “Adding e-mail notifications” on page 202.
Adding automatic actions
Perform these steps to add or change automatic actions that occur when a defined condition is met. This process assumes that you have already defined conditions. See “Defining conditions for monitoring JMX MBeans” on page 195.
Automatic actions can be specified while you define a new condition, or you can define the condition, and then add the action later. Actions can include setting MBean attributes, invoking MBean operations, or generating PATROL events.
To add automatic actions to a defined condition
1 Right-click the JMX server instance icon:
2 Choose KM Commands => Define Condition.
The Defined Conditions dialog box is displayed.
TIP When you define a condition, you can specify that it apply to all servers managed by the PATROL Agent by setting the Scope of Definition. If you do so, you can also use the PATROL Configuration Manager to copy the key /JMX/ConditionDef/ALL-SERVERS to other PATROL agents.
If you copy a condition definition to all servers across all agents, monitoring will occur only for servers on which the target MBean exists. You can limit instance creation to applicable servers by setting the “Create PATROL object” field in the condition definition to a value other than “Always”.
200 PATROL for BEA WebLogic User Guide

10
3 Click the name of the condition to which you want to add notifications.
4 Click the Modify button.
5 Click Select.
The Define Condition dialog box is displayed, as shown in the following figure:
6 In the list of actions, click the action you want to modify.
7 Click the Modify/Enable button to set an automatic action. If you want to remove an automatic action, click the Disable button.
8 Click OK.
A series of dialog boxes will allow you to define how the automatic action is to take place. These dialog boxes vary considerably, depending on the type of data being used by your MBean. Click the Help buttons on each screen if you are unsure about how to use the dialog or what information is expected in the different fields.
Where to go from here
You can change the list of recipients to be notified whenever a condition is met. See “Adding e-mail notifications” on page 202.
automatic actionsare set from this pane
Chapter 10 Managing JMX-instrumented applications 201
10
Adding e-mail notifications
You can add e-mail addresses for notifications to any defined condition.
This process assumes that you have already defined conditions. See “Defining conditions for monitoring JMX MBeans” on page 195.
To add automatic actions to a defined condition
1 Right-click the JMX server instance icon.
2 Choose KM Commands => Define Condition.
The Defined Conditions dialog box is displayed.
3 Click the name of the condition to which you want to add notifications.
4 Click the Modify button.
5 Click Select.
The Define Condition dialog box is displayed, as shown in the following figure:
202 PATROL for BEA WebLogic User Guide

10
6 If you want the default e-mail address(es) to receive the notification, click the check box. This can be either in addition to or in place of any other e-mail addresses you specify.
7 Type additional e-mail addresses in the specified field. Multiple addresses must be separated by a semicolon.
8 Click OK.
Where to go from here
You can add automatic actions to your condition. These actions will occur whenever the condition is met. See “Adding automatic actions” on page 200.
Advanced features for JMX monitoringThe following JMX features in PATROL for BEA WebLogic are provided for advanced users or for troubleshooting purposes only:
■ manually registering an MBean—typically, you will use your application to programmatically register MBeans that manage it; you may occasionally want to register an MBean for testing purposes
E-mail notificationsare set from this pane
Chapter 10 Managing JMX-instrumented applications 203
10
■ defining conditions for MBeans that are not registered—this may be useful, for example, for defining conditions on MBeans that are in development or that support currently uninstalled applications; this feature requires a deep knowledge of the MBean and how it will be implemented
■ setting debug flags—debugging information is not generally useful except when troubleshooting specific problems
These features are unlikely to be needed for routine setup and monitoring.
Manually registering an MBean
You can register and monitor any Java object that complies with JMX MBean specifications, including those that are not automatically registered as part of the applications they manage. Perform these steps to register an object.
To Manually Register an MBean
1 Right-click a JMX server instance icon (represented by the application name).
2 Choose KM Commands => Register MBean.
The Create New MBean dialog box is displayed.
3 Enter the required object and class information. Click the Help button if you need more information.
4 Click OK.
Where to go from here
You can define conditions to monitor your newly registered MBean. See “Defining conditions for monitoring JMX MBeans” on page 195.
NOTE This process requires knowledge of object and class information. You do not need to use this process to monitor MBeans that are part of most Java applications because they are automatically registered for you.
204 PATROL for BEA WebLogic User Guide
10
Defining conditions for an unregistered MBean
Perform these steps to define conditions for monitoring a JMX MBean that is not yet registered.
This feature may be useful for web application developers who would like to roll out the ability to monitor MBeans before the managed applications are registered.
To define conditions for an MBean that is not registered
1 Right-click a JMX server instance icon (represented by the application name).
2 Choose KM Commands => Define Conditions.
If at least one other condition is defined, the Defined Conditions dialog box is displayed, otherwise, the Define Conditions dialog box is displayed. If the Defined Conditions dialog box is displayed, click the Add button, then click Select. This will display the Defined Conditions dialog.
3 Start defining the condition:
A Type a name for the condition. This name will be used as an instance label on the icon that appears in your console window. It will also be used to identify the condition if you make future updates.
B Type the object name. You can use wildcards (? or *) to specify multiple MBeans to be monitored for the condition.
C Click a button to indicate the type of attribute (numeric, string, boolean).
D Type the name of the notification or attribute on which the monitoring will be based.
E Click Next.
The Define Condition dialog box is displayed.
NOTE This feature requires detailed information about object names and attributes. This capability is intended for advanced users. BMC Software does not recommend this process for most users. Instead, roll out the web application, register the MBeans, and follow the process described in “Defining conditions for monitoring JMX MBeans” on page 195.
Chapter 10 Managing JMX-instrumented applications 205
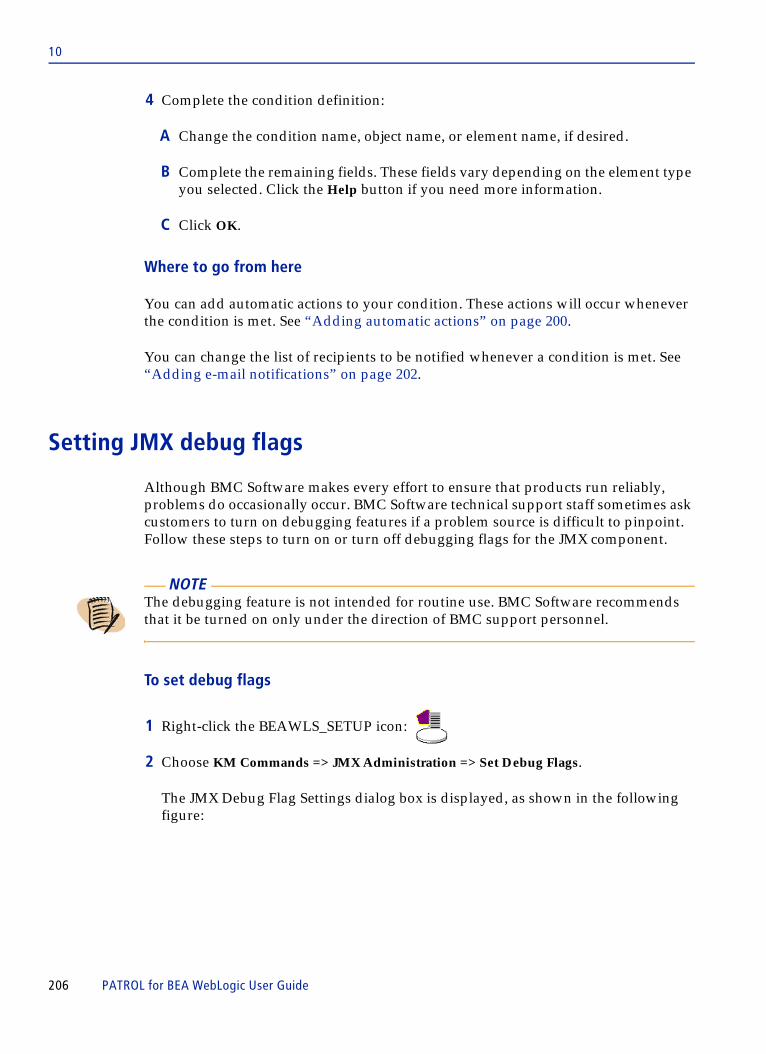
10
4 Complete the condition definition:
A Change the condition name, object name, or element name, if desired.
B Complete the remaining fields. These fields vary depending on the element type you selected. Click the Help button if you need more information.
C Click OK.
Where to go from here
You can add automatic actions to your condition. These actions will occur whenever the condition is met. See “Adding automatic actions” on page 200.
You can change the list of recipients to be notified whenever a condition is met. See “Adding e-mail notifications” on page 202.
Setting JMX debug flags
Although BMC Software makes every effort to ensure that products run reliably, problems do occasionally occur. BMC Software technical support staff sometimes ask customers to turn on debugging features if a problem source is difficult to pinpoint. Follow these steps to turn on or turn off debugging flags for the JMX component.
To set debug flags
1 Right-click the BEAWLS_SETUP icon:
2 Choose KM Commands => JMX Administration => Set Debug Flags.
The JMX Debug Flag Settings dialog box is displayed, as shown in the following figure:
NOTE The debugging feature is not intended for routine use. BMC Software recommends that it be turned on only under the direction of BMC support personnel.
206 PATROL for BEA WebLogic User Guide

10
3 Click a line to turn a flag on. Click it again to turn it off.
4 Click the File button and enter a file name and directory path in which to save debugging information.
5 Click Select.
Understanding condition settings and the ConditionDef configuration variable
JMX conditions are defined using dialogs (see “Defining conditions for monitoring JMX MBeans” on page 195). When you create a condition definition, the attributes and values that you define are stored in a PATROL configuration (pconfig) variable that could be used with the PATROL Configuration Manager.
The pconfig variable is: /JMX/ConditionDef/ALL^SERVERS/ConditionName.
Figure 12 on page 208 shows an example of creating a condition definition called ExtremeWeather. Table 14 on page 208 explains the attributes comprising the ExtremeWeather ConditionDef variable.
file location tosave debug data
each line is a flagclick to toggle on or off
Chapter 10 Managing JMX-instrumented applications 207
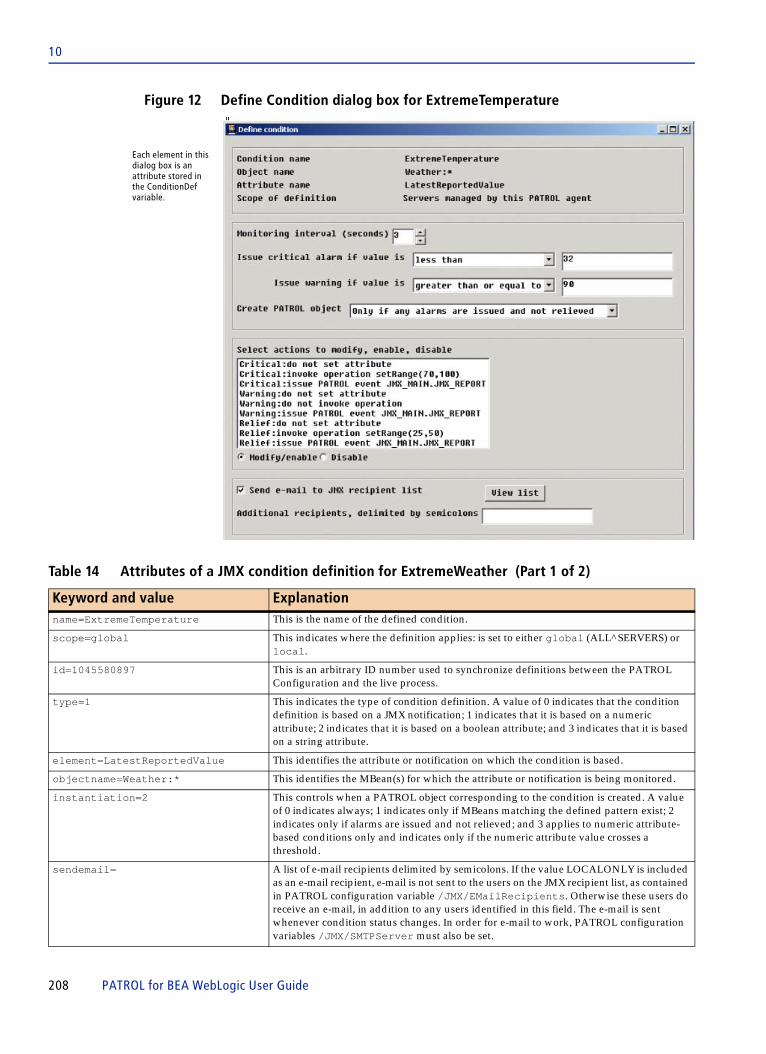
10
Figure 12 Define Condition dialog box for ExtremeTemperature
Table 14 Attributes of a JMX condition definition for ExtremeWeather (Part 1 of 2)
Keyword and value Explanationname=ExtremeTemperature This is the name of the defined condition.
scope=global This indicates where the definition applies: is set to either global (ALL^SERVERS) or local.
id=1045580897 This is an arbitrary ID number used to synchronize definitions between the PATROL Configuration and the live process.
type=1 This indicates the type of condition definition. A value of 0 indicates that the condition definition is based on a JMX notification; 1 indicates that it is based on a numeric attribute; 2 indicates that it is based on a boolean attribute; and 3 indicates that it is based on a string attribute.
element=LatestReportedValue This identifies the attribute or notification on which the condition is based.
objectname=Weather:* This identifies the MBean(s) for which the attribute or notification is being monitored.
instantiation=2 This controls when a PATROL object corresponding to the condition is created. A value of 0 indicates always; 1 indicates only if MBeans matching the defined pattern exist; 2 indicates only if alarms are issued and not relieved; and 3 applies to numeric attribute-based conditions only and indicates only if the numeric attribute value crosses a threshold.
sendemail= A list of e-mail recipients delimited by semicolons. If the value LOCALONLY is included as an e-mail recipient, e-mail is not sent to the users on the JMX recipient list, as contained in PATROL configuration variable /JMX/EMailRecipients. Otherwise these users do receive an e-mail, in addition to any users identified in this field. The e-mail is sent whenever condition status changes. In order for e-mail to work, PATROL configuration variables /JMX/SMTPServer must also be set.
Each element in this dialog box is an attribute stored in the ConditionDef variable.
208 PATROL for BEA WebLogic User Guide

10
frequency=3 For attribute-based conditions, establishes how frequently (in seconds) the attribute value will be checked.
status=1 For all condition types except numeric attribute-based, this controls the severity of the alarm condition. A value of 1 indicates a warning, 2 indicates a critical alarm.
resettype=1 For a notification-based condition, this indicates how an alarm based on notification will be reset. A value of 0 indicates it can only be reset by console command; a value of 1 indicates it can be relieved by subsequent notification; a value of 2 indicates it can be relieved based on attribute value.
resetobjectspecified=0;resetelement=weather.not.raining
For a notification-based condition, resetelement identifies the notification or attribute that will reset the condition that is in alarm status. If resetobjectspecified is 1, the notification or attribute that causes an alarm to be relieved must come from a specific MBean indicated by resetobject; otherwise, the notification or attribute must come from the same MBean that generated the alarm.
warnthresh=90; alarmthres=32; warncompare=1; alarmcompare=0
For a numeric attribute-based condition, these fields identify thresholds that determine the condition status based on the current value of the attribute. For warncompare and alarmcompare, a value of 0 indicates “less than”; 1 indicates “greater than or equal to”.
value=0 For a boolean attribute-based condition, a value of 0 means the condition is in alarm if the attribute is false; a value of 1 causes the alarm to occur if the attribute is true.
stringmatch=0;value=xxx
For a string attribute-based condition, stringmatch=0 indicates that if the attribute is equal to value, an alarm results. stringmatch=1 indicates that if the attribute is not equal to value, an alarm results.
Note: The keywords below control the ability to set JMX attributes, invoke JMX operations, and issue PATROL events based on a change in state of the condition. Conditions that are based on JMX notifications, boolean attributes, and string attributes can be in one of two states: OK or alarm. Conditions that are based on numeric attributes can be in one of three states: OK, warning, or critical. Each keyword described below is presented in the form that would be used to control actions for the critical state (numeric attribute-based condition) or the alarm state (other types of conditions). It is also possible to prefix each keyword below with “OK” to indicate an action that will be taken for the OK state (any condition) or with “WARN” to indicate an action that will be taken for the warning state (numeric attribute-based condition only).
setattribute=0 A value of 0 sets no alarm.
setattribute=1; setattributename=ChanceOfRain;setattributevalue=0;
A value of 1 for setattribute indicates that an MBean attribute will be set when the critical alarm condition occurs. The attribute name and value are provided.
setattributeobjectspecified=0;setattributeobject=;setattributeurls=;
If setattributeobjectspecified is 0, the attribute that has been defined will be set on the same MBean that originated the alarm. If setattributeobjectspecified is 1, the attribute that has been defined will be set on the MBean indicated by invokeoperationobject. setattributeurls allows you to specify values for attributes of non-standard type (e.g., not Integer, String, etc.).
issueevent=1eventdefinition= JMX_MAIN.JMX_REPORT
A value of 1 for issueevent indicates that a PATROL event will be issued when the critical alarm condition occurs. The event definition indicates the KM containing a message catalog with the event, and the name of the defined event. JMX_REPORT is an event defined in the event catalog for JMX_MAIN.
invokeoperation=1; invokeoperationname=setRange; invokeoperationarguments=70&100; invokeoperationsignature= java.lang.Integer&java.lang. Integer;
A value of 1 for invokeoperation indicates that an operation will be invoked when the critical alarm condition occurs. In this case the operation name is provided, arguments are provided delimited by ampersand (&), and the operation signature (set of java classes corresponding to the arguments) is passed in the same way.
invokeoperationobjectspecified=0; invokeoperationobject=;
If invokeoperationobjectspecified is 0, the operation that has been defined will be invoked on the same MBean that originated the alarm. If invokeoperationobjectspecified is 1, the operation that has been defined will be invoked on the MBean indicated by invokeoperationobject.
Table 14 Attributes of a JMX condition definition for ExtremeWeather (Part 2 of 2)
Keyword and value Explanation
Chapter 10 Managing JMX-instrumented applications 209

10
210 PATROL for BEA WebLogic User Guide

C h a p t e r 11
11 Working with log filesThis chapter explains how to effectively manage WebLogic log files using PATROL for BEA WebLogic.
The following topics are discussed:
Understanding logs . . . . . . . . . . . . . . . . . . . . . . . . . . . . . . . . . . . . . . . . . . . . . . . . . . . . . . 212Rotation. . . . . . . . . . . . . . . . . . . . . . . . . . . . . . . . . . . . . . . . . . . . . . . . . . . . . . . . . . . . . 212Severity . . . . . . . . . . . . . . . . . . . . . . . . . . . . . . . . . . . . . . . . . . . . . . . . . . . . . . . . . . . . . 212
Managing log files . . . . . . . . . . . . . . . . . . . . . . . . . . . . . . . . . . . . . . . . . . . . . . . . . . . . . . . 213Selecting a log file for monitoring. . . . . . . . . . . . . . . . . . . . . . . . . . . . . . . . . . . . . . . 213Configuring the domain log. . . . . . . . . . . . . . . . . . . . . . . . . . . . . . . . . . . . . . . . . . . . 214Configuring the server log . . . . . . . . . . . . . . . . . . . . . . . . . . . . . . . . . . . . . . . . . . . . . 215Configuring the JDBC log . . . . . . . . . . . . . . . . . . . . . . . . . . . . . . . . . . . . . . . . . . . . . 216Configuring the HTTP log . . . . . . . . . . . . . . . . . . . . . . . . . . . . . . . . . . . . . . . . . . . . . 217Configuring the transaction log. . . . . . . . . . . . . . . . . . . . . . . . . . . . . . . . . . . . . . . . . 219Defining sniff patterns . . . . . . . . . . . . . . . . . . . . . . . . . . . . . . . . . . . . . . . . . . . . . . . . 220Stopping the monitoring of a log file . . . . . . . . . . . . . . . . . . . . . . . . . . . . . . . . . . . . 222Viewing a log file . . . . . . . . . . . . . . . . . . . . . . . . . . . . . . . . . . . . . . . . . . . . . . . . . . . . . 223Watching a log file. . . . . . . . . . . . . . . . . . . . . . . . . . . . . . . . . . . . . . . . . . . . . . . . . . . . 224Viewing sniff patterns. . . . . . . . . . . . . . . . . . . . . . . . . . . . . . . . . . . . . . . . . . . . . . . . . 225Turning off and restarting sniff patterns . . . . . . . . . . . . . . . . . . . . . . . . . . . . . . . . . 225Changing the sniff type . . . . . . . . . . . . . . . . . . . . . . . . . . . . . . . . . . . . . . . . . . . . . . . 226Updating a log file location . . . . . . . . . . . . . . . . . . . . . . . . . . . . . . . . . . . . . . . . . . . . 226Registering for log notification messages . . . . . . . . . . . . . . . . . . . . . . . . . . . . . . . . 227Unregistering for log notification messages . . . . . . . . . . . . . . . . . . . . . . . . . . . . . . 228
Chapter 11 Working with log files 211

11
Understanding logsAll messages generated by component subsystems are written to log files on the local server. The most critical of these are also written to the domain-wide log files on the administration server. Monitoring the domain log file is a good way to develop an overall performance view of your entire WebLogic environment.
Rotation
Some log files (including domain and server logs) are periodically archived and a new log file initiated for current messages. The process of retiring a log file and re-initiating it is called rotation. Rotation can be done periodically, or whenever the log file reaches a certain size. Use rotation to keep log files from reaching unmanageable sizes.
Severity
All WebLogic messages contain a severity code. You can use these codes when viewing logs or defining sniff patterns to isolate those messages that you want most to see. You can also have these messages trigger events that can be managed through the PATROL Event Manager.
There are 7 severity levels, ranging from Informational (normal operational messages), to Emergency (severe system failure). The levels are:
■ Informational■ Warning■ Error■ Notice■ Critical■ Alert■ Emergency
NOTE File rotation may conflict with sniff patterns. You will usually need to choose one function or the other for a particular log file.
212 PATROL for BEA WebLogic User Guide

11
The top two levels (Emergency and Alert) both indicate severe problems from which WebLogic can probably not automatically recover. Messages at these top two levels should always be logged in the domain-wide log and should trigger PATROL events. The default is usually to send everything with a severity of Error or higher to the domain log.
Managing log filesYou can use PATROL for BEA WebLogic to manage log files.
Selecting a log file for monitoring
Perform these steps to define a non-default log file that you want monitored.
The four default WebLogic log files are monitored by default in PATROL for BEA WebLogic—they do not need to be specifically selected. You can monitor additional logs, such as the WebLogic KM debug log.
To select a log file for monitoring
1 Right-click the icon of a log file instance (for example, HTTP, DOMAIN, JDBC, or SERVER):
2 Choose KM Commands => Administration => Monitor Another Log.
The Monitor Another Log dialog box is displayed, as shown in the following figure:
NOTE A log file icon may not appear if the file is at zero length or has not changed recently. The JDBC icon will not appear if the log was not enabled on the WebLogic server.
Chapter 11 Working with log files 213

11
3 Complete the fields on the dialog box as follows to set up a new log file instance:
■ Log Name Alias—enter a unique alias name for the log file; this will be used as the instance name
■ Log File with Full Path—enter complete directory path and file name of the log you want monitored
■ File Access User Name—enter the username of an account with permissions to read the log file
■ File Access Password—enter the password for the account
4 Click OK.
Configuring the domain log
Perform these steps to manage the domain-wide log file.
The domain-wide log file includes the most important messages generated by all managed servers in a WebLogic environment. You can use the configuration commands to view current log configuration settings retrieved from the administration server, and you can define new settings. When you configure the domain log, you can set how often new log files are initiated and you can define which message severity levels to log.
To configure the domain log
1 Right-click the administration server instance icon:
2 Choose KM Commands => LOG Configuration => Domain Log.
The Domain Log Setting dialog box is displayed, as shown in the following figure:
214 PATROL for BEA WebLogic User Guide
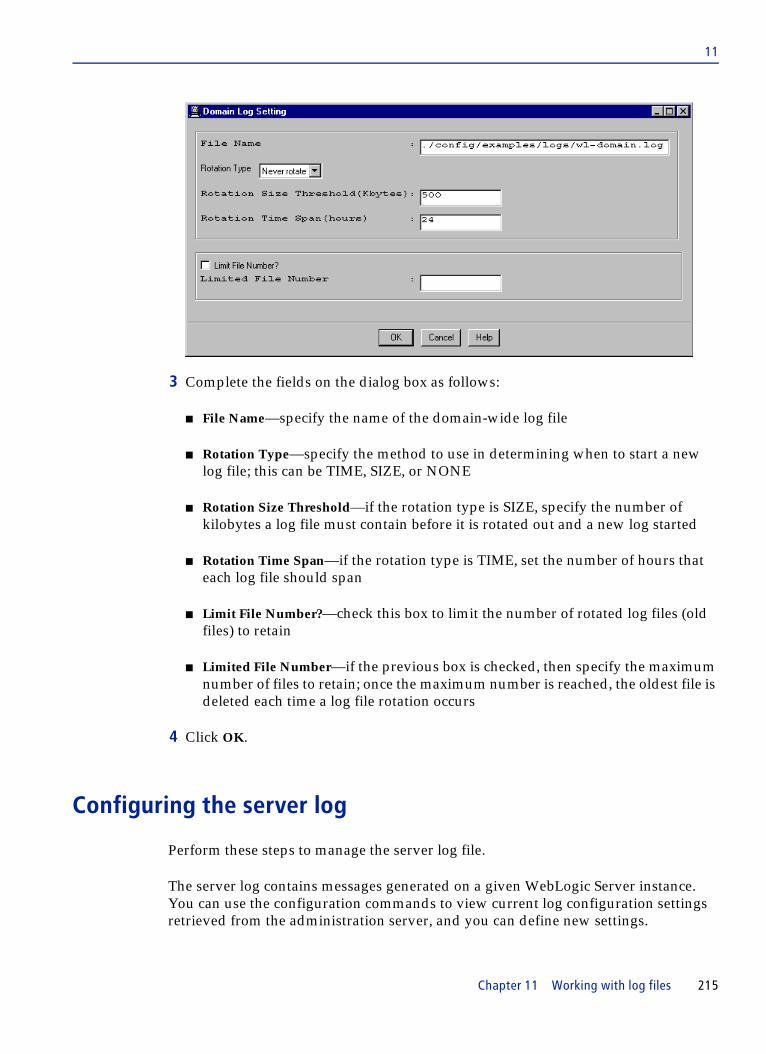
11
3 Complete the fields on the dialog box as follows:
■ File Name—specify the name of the domain-wide log file
■ Rotation Type—specify the method to use in determining when to start a new log file; this can be TIME, SIZE, or NONE
■ Rotation Size Threshold—if the rotation type is SIZE, specify the number of kilobytes a log file must contain before it is rotated out and a new log started
■ Rotation Time Span—if the rotation type is TIME, set the number of hours that each log file should span
■ Limit File Number?—check this box to limit the number of rotated log files (old files) to retain
■ Limited File Number—if the previous box is checked, then specify the maximum number of files to retain; once the maximum number is reached, the oldest file is deleted each time a log file rotation occurs
4 Click OK.
Configuring the server log
Perform these steps to manage the server log file.
The server log contains messages generated on a given WebLogic Server instance. You can use the configuration commands to view current log configuration settings retrieved from the administration server, and you can define new settings.
Chapter 11 Working with log files 215

11
To configure the server log
1 Right-click the administration server instance icon:
2 Choose KM Commands => LOG Configuration => Server Log.
The Server Selection dialog box is displayed.
3 From the list of available servers, select the server whose log you want to configure.
4 Click OK.
The Server Log Setting dialog box is displayed.
5 Specify a file name and various rotation parameters for determining how and when new log files are automatically created and old ones retired.
The dialog box fields are the same as those described in step 3 on page 215, with the addition of a checkbox to enable logging to be sent to the Domain Log.
6 Click OK.
Configuring the JDBC log
Perform these steps to manage the JDBC log file.
The JDBC log contains messages related to database connections. You can use the configuration commands to view current log configuration settings retrieved from the administration server, and you can define new settings.
To configure the JDBC log
1 Right-click the administration server instance icon:
2 Choose KM Commands => LOG Configuration => JDBC Log.
NOTE To monitor logs on a managed server when the managed server is running on a different host machine than the administration server, the managed server log files must be on a disk that is accessible to the administrative server (mounted or mapped to the admin server). See Updating a log file location to point to the mapped file path.
216 PATROL for BEA WebLogic User Guide
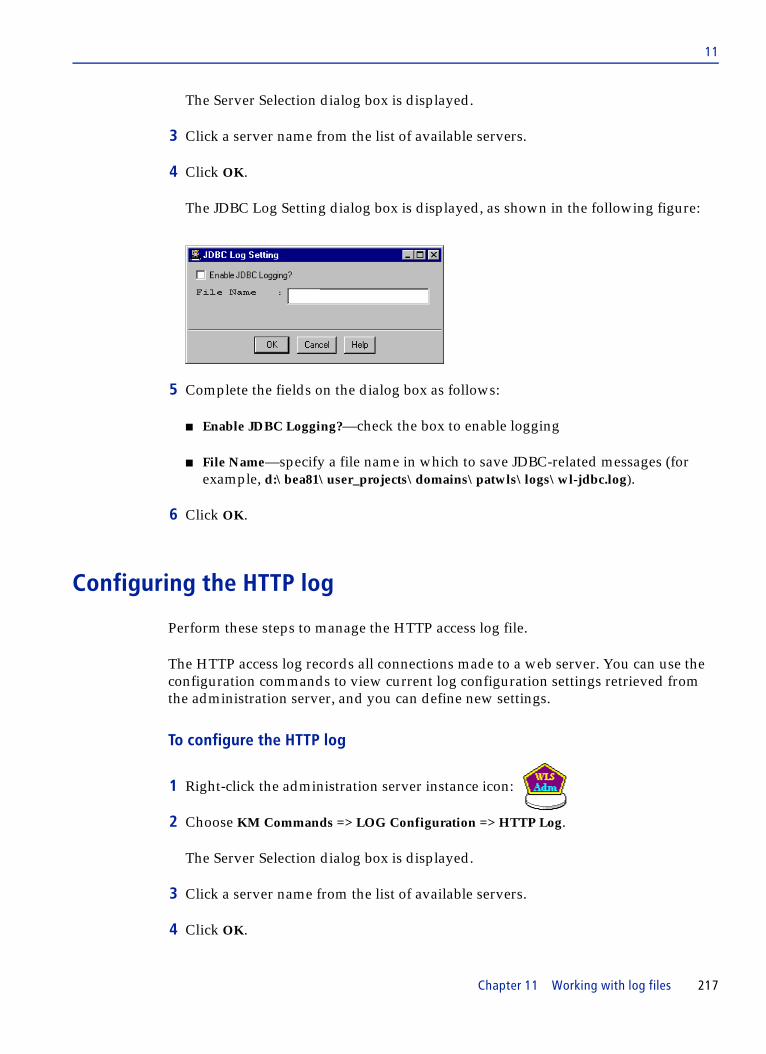
11
The Server Selection dialog box is displayed.
3 Click a server name from the list of available servers.
4 Click OK.
The JDBC Log Setting dialog box is displayed, as shown in the following figure:
5 Complete the fields on the dialog box as follows:
■ Enable JDBC Logging?—check the box to enable logging
■ File Name—specify a file name in which to save JDBC-related messages (for example, d:\bea81\user_projects\domains\patwls\logs\wl-jdbc.log).
6 Click OK.
Configuring the HTTP log
Perform these steps to manage the HTTP access log file.
The HTTP access log records all connections made to a web server. You can use the configuration commands to view current log configuration settings retrieved from the administration server, and you can define new settings.
To configure the HTTP log
1 Right-click the administration server instance icon:
2 Choose KM Commands => LOG Configuration => HTTP Log.
The Server Selection dialog box is displayed.
3 Click a server name from the list of available servers.
4 Click OK.
Chapter 11 Working with log files 217
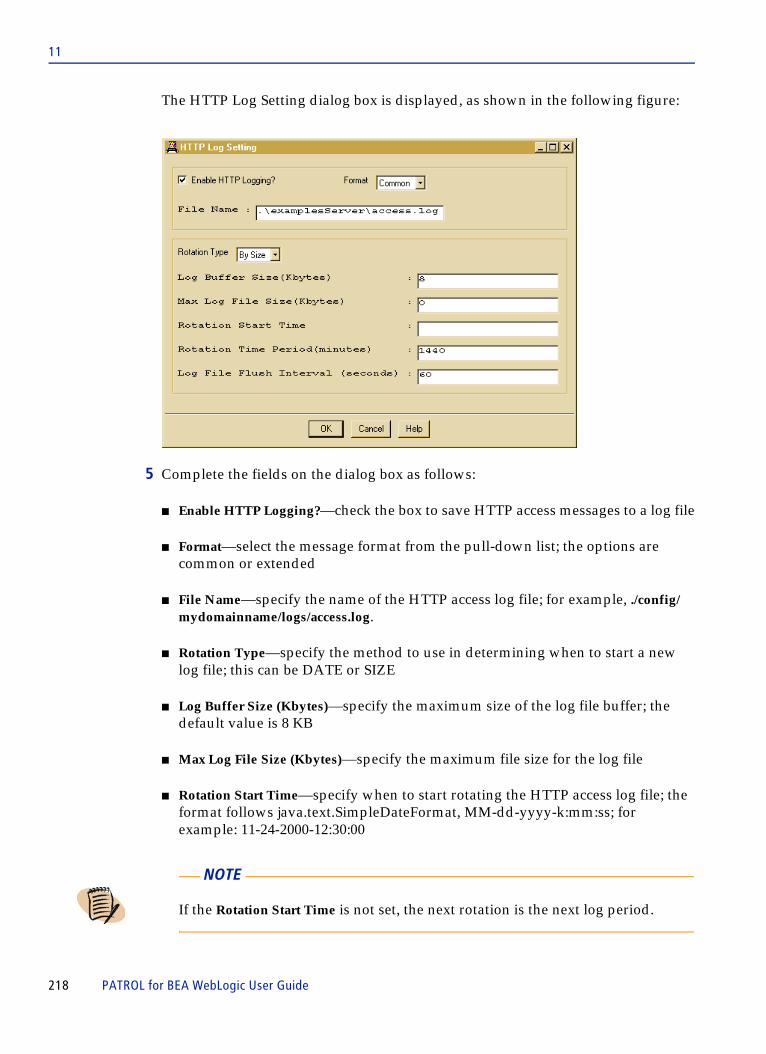
11
The HTTP Log Setting dialog box is displayed, as shown in the following figure:
5 Complete the fields on the dialog box as follows:
■ Enable HTTP Logging?—check the box to save HTTP access messages to a log file
■ Format—select the message format from the pull-down list; the options are common or extended
■ File Name—specify the name of the HTTP access log file; for example, ./config/mydomainname/logs/access.log.
■ Rotation Type—specify the method to use in determining when to start a new log file; this can be DATE or SIZE
■ Log Buffer Size (Kbytes)—specify the maximum size of the log file buffer; the default value is 8 KB
■ Max Log File Size (Kbytes)—specify the maximum file size for the log file
■ Rotation Start Time—specify when to start rotating the HTTP access log file; the format follows java.text.SimpleDateFormat, MM-dd-yyyy-k:mm:ss; for example: 11-24-2000-12:30:00
NOTE
If the Rotation Start Time is not set, the next rotation is the next log period.
218 PATROL for BEA WebLogic User Guide
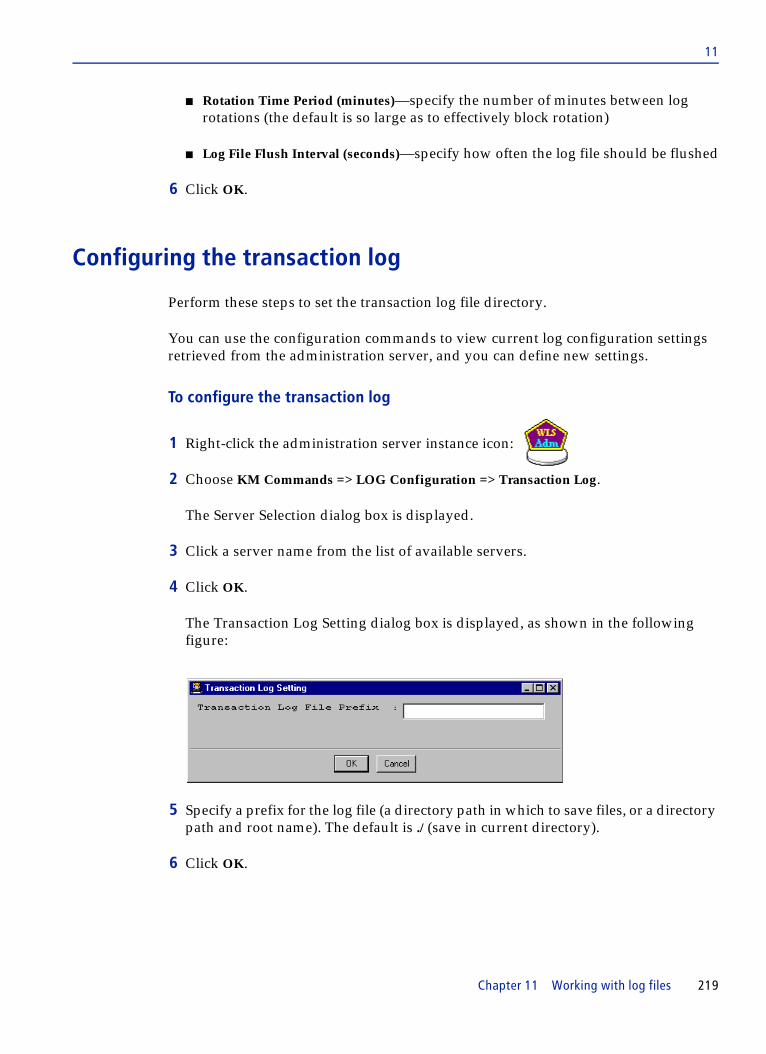
11
■ Rotation Time Period (minutes)—specify the number of minutes between log rotations (the default is so large as to effectively block rotation)
■ Log File Flush Interval (seconds)—specify how often the log file should be flushed
6 Click OK.
Configuring the transaction log
Perform these steps to set the transaction log file directory.
You can use the configuration commands to view current log configuration settings retrieved from the administration server, and you can define new settings.
To configure the transaction log
1 Right-click the administration server instance icon:
2 Choose KM Commands => LOG Configuration => Transaction Log.
The Server Selection dialog box is displayed.
3 Click a server name from the list of available servers.
4 Click OK.
The Transaction Log Setting dialog box is displayed, as shown in the following figure:
5 Specify a prefix for the log file (a directory path in which to save files, or a directory path and root name). The default is ./ (save in current directory).
6 Click OK.
Chapter 11 Working with log files 219

11
Defining sniff patterns
Perform these steps to define new sniff patterns and their associated properties. You can also change existing sniff patterns, or delete a sniff pattern.
The sniff pattern is a string that is used as a pattern-matching template when working with log files. When the text string defined in the sniff pattern occurs in a log error message, the KM generates an event in the event log and creates annotations, if configured to do so.
To define or update a sniff pattern
1 Right-click the instance icon of the log file for which you want to define or update a sniff pattern:
2 Choose KM Commands => Log Sniffing => Edit Sniff Pattern.
The Log Sniff Setup dialog box is displayed, as shown in the following figure:
3 Perform one of the following actions:
■ Click Add if you want to define a new sniff pattern. ■ Highlight a registered string and click Update if you want to change a
previously defined sniff pattern.
4 Click Take Action.
Either the Add New Log Sniff Pattern or the Update Log Sniff Pattern dialog box is displayed, as shown in the following figure (the dialog boxes are functionally identical):
220 PATROL for BEA WebLogic User Guide

11
5 Complete the fields on the dialog box as follows:
■ Sniff Pattern—text string that you want matched; this can be any text string or PATROL regular expression
■ Event Type—pull-down list of PATROL event types: ERROR, INFORMATION, or WARNING
■ PATROL Event Trigger—if checked, events are logged in the PATROL event log and can be monitored through the PATROL Event Manager
■ Annotate Information—if checked, annotated data points will be generated on parameter graphs
■ PATROL Event Class—class used to identify error type when working with PATROL events; you can define your own event class or use defaults of ERROR_PATTERN, WARNING_PATTERN, and INFORMATION_PATTERN; an administrator can use a PATROL Developer Console to create customized event classes so that recovery actions can be properly associated to certain string patterns
6 Click OK.
To delete a sniff pattern
1 Right-click the instance icon of the log file for which you want to delete a sniff pattern.
2 Choose KM Commands => Log Sniffing => Edit Sniff Pattern.
The Log Sniff Setup dialog box is displayed, as shown in the following figure:
text string to be
by triggering events, youcan manage WebLogicevents using thePATROL Event Manager
matched (regularexpression syntax
Chapter 11 Working with log files 221
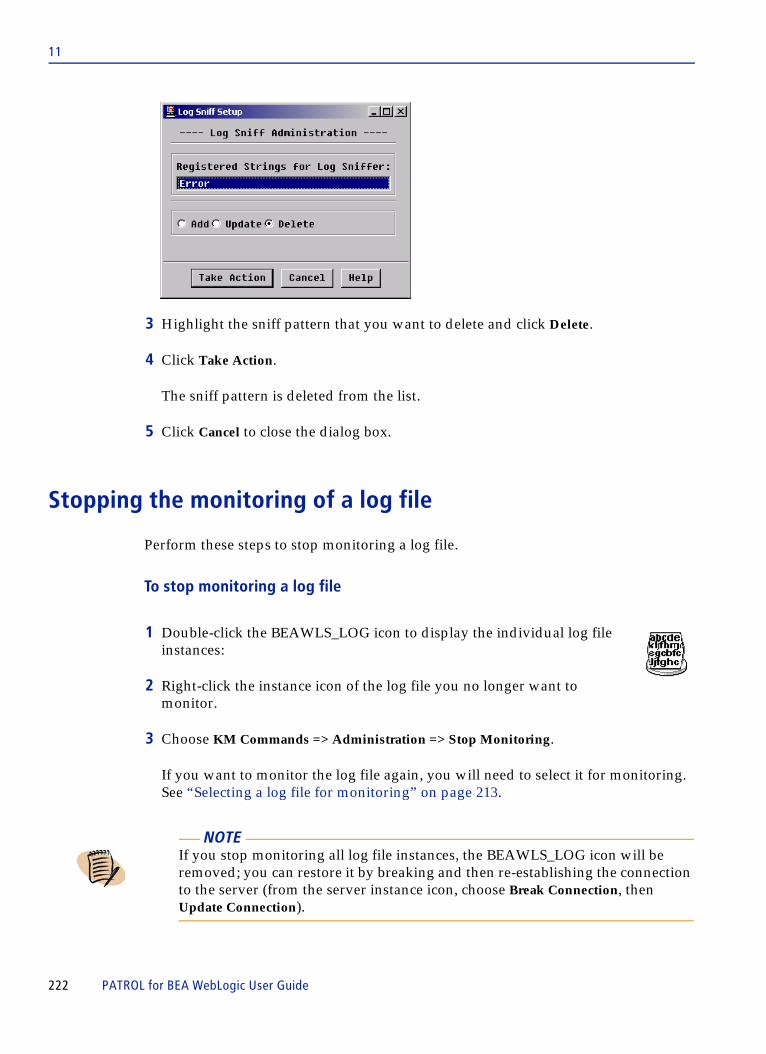
11
3 Highlight the sniff pattern that you want to delete and click Delete.
4 Click Take Action.
The sniff pattern is deleted from the list.
5 Click Cancel to close the dialog box.
Stopping the monitoring of a log file
Perform these steps to stop monitoring a log file.
To stop monitoring a log file
1 Double-click the BEAWLS_LOG icon to display the individual log file instances:
2 Right-click the instance icon of the log file you no longer want to monitor.
3 Choose KM Commands => Administration => Stop Monitoring.
If you want to monitor the log file again, you will need to select it for monitoring. See “Selecting a log file for monitoring” on page 213.
NOTE If you stop monitoring all log file instances, the BEAWLS_LOG icon will be removed; you can restore it by breaking and then re-establishing the connection to the server (from the server instance icon, choose Break Connection, then Update Connection).
222 PATROL for BEA WebLogic User Guide

11
Viewing a log file
Perform these steps to view the contents of a log file.
You can view either only the currently active log file, or the entire log file. The entire log file includes all rotated (archived) files.
To view only the currently active log file
1 Double-click the BEAWLS_LOG icon to display the individual log file instances:
2 Right-click the instance icon of the log file you want to view.
3 Choose KM Commands => View => View Current Log File.
One of the following dialog boxes is displayed:
■ If you are viewing a JDBC or HTTP log, the Search Pattern dialog box allows you to specify a text string to be matched.
■ If you are viewing a DOMAIN or SERVER logs, the Message Filter dialog box allows you to specify a wide range of criteria including subsystem components, severity level, date, server and host names, user IDs, and message IDs.
Figure 13 Message Filter dialog box for DOMAIN or SERVER
Chapter 11 Working with log files 223

11
4 Specify which types of messages you want displayed. Click the Help button if you need additional descriptions.
5 Click OK.
To view the entire log file (including rotated files)
1 Double-click the BEAWLS_LOG icon to display the individual log file instances.
2 Right-click the instance icon of the log file you want to view.
3 Choose KM Commands => View => View Entire Log File.
The Message Filter dialog box is displayed.
4 Specify which types of messages you want displayed.
5 Click OK.
Messages from the log are displayed in groups of 500. After each 500 messages are displayed, a confirmation box asks you if you want to continue displaying messages. Click Yes to display more messages or No to stop viewing log messages.
Watching a log file
Perform these steps to watch a log file as messages are written to it.
When you begin watching a file, the last 10 lines of the log are displayed to an output window. As new messages are spooled to the end of the log file as errors occur, they are simultaneously displayed in the output window.
To watch a log file
1 Double-click the BEAWLS_LOG icon to display the individual log file instances:
2 Right-click the instance icon of the log file you want to watch.
3 Choose KM Commands => View => Watch Log File.
224 PATROL for BEA WebLogic User Guide

11
Viewing sniff patterns
Perform these steps to see information about the pattern matching strings that are currently being applied to the log file.
Listed information includes the name of the log file, whether it is being actively monitored, the string pattern being matched, the event category and class, and whether annotation of data points is currently turned on.
To view registered sniff patterns
1 Double-click the BEAWLS_LOG icon to display the individual log file instances:
2 Right-click the instance icon of the log file for which you want to see sniff pattern information.
3 Choose KM Commands => Log Sniffing => View Registered Patterns.
Information about current patterns is displayed in a system output window.
Turning off and restarting sniff patterns
Perform these steps to stop applying pattern matching strings to log file entries. You can later resume monitoring a log using the sniff pattern.
To turn off sniff pattern matching
1 Double-click the BEAWLS_LOG icon to display the individual log file instances:
2 Right-click the instance icon of the log file for which you want to turn off sniff patterns.
3 Choose KM Commands => Log Sniffing => Stop Pattern Sniffing.
To resume previously turned-off sniff pattern matching
1 Double-click the BEAWLS_LOG icon to display the individual log file instances.
2 Right-click the instance icon of the log file for which you want to see sniff pattern information.
Chapter 11 Working with log files 225

11
3 Choose KM Commands => Log Sniffing => Restart Pattern Sniffing.
Changing the sniff type
Perform these steps to change the way in which log file sniff patterns are applied.
You can choose to match sniff patterns with log file messages on either a periodic or on a real-time basis. By default, log files are monitored periodically, which means they are applied when the LogEvent parameter collects data. Real-time monitoring continuously matches patterns but leaves the file open, which may conflict with other processes.
To change the sniff type
1 Double-click the BEAWLS_LOG icon to display the individual log file instances:
2 Right-click the instance icon of the log file for which you want to change the sniff type.
3 Choose KM Commands => Log Sniffing => Setup Sniffing Type.
The Sniffing Type Setup dialog box is displayed, as shown in the following figure:
4 Choose either Periodic or Real Time sniffing. Specify periodic if log file rotation is turned on.
5 Click OK.
Updating a log file location
Perform these steps to change the PATROL log file monitoring instance when a log file location changes from that of the server.
226 PATROL for BEA WebLogic User Guide

11
To update location information
1 Right-click the instance icon of the log file you want to update:
2 Choose KM Commands => Administration => Update Log File Location.
3 Change the directory path or file name to reflect the new path.
4 Click OK.
Registering for log notification messages
Perform these steps to get notifications whenever error messages of type Emergency, Critical, or Alert are written to the WebLogic server log file.
To subscribe to log file notification
1 Right-click the administration server instance icon:
2 Choose KM Commands => LOG Notification => Register.
The Register Log Notification dialog box is displayed, as shown in the following figure:
3 Select a notification method. You can be notified via e-mail messages, via alerts sent to the PATROL Event Manager, or both.
4 Specify an outgoing mail server and the e-mail address to which you want alerts sent.
Chapter 11 Working with log files 227

11
5 Click OK.
Unregistering for log notification messages
Perform these steps to stop notifications from being sent when error messages of a certain type are written to the log file.
To unsubscribe to log file notification
1 Right-click the administration server instance icon:
2 Choose KM Commands => LOG Notification => Unregister.
A confirmation dialog box is displayed, as shown in the following figure:
3 Click Yes.
228 PATROL for BEA WebLogic User Guide

C h a p t e r 12
12 Administering the KMThis chapter explains how to manage PATROL for BEA WebLogic itself, rather than using the product to manage WebLogic. The following topics are discussed:
Monitoring WebLogic across the enterprise . . . . . . . . . . . . . . . . . . . . . . . . . . . . . . . . . 230Tuning KM performance . . . . . . . . . . . . . . . . . . . . . . . . . . . . . . . . . . . . . . . . . . . . . . . . . 230
Selecting servers for monitoring . . . . . . . . . . . . . . . . . . . . . . . . . . . . . . . . . . . . . . . . 231Deselecting servers from monitoring . . . . . . . . . . . . . . . . . . . . . . . . . . . . . . . . . . . . 232Selecting components for monitoring . . . . . . . . . . . . . . . . . . . . . . . . . . . . . . . . . . . 233Deselecting components from monitoring . . . . . . . . . . . . . . . . . . . . . . . . . . . . . . . 234Scheduling PATROL parameter discovery for configured WebLogic objects . . 235Scheduling blackout periods . . . . . . . . . . . . . . . . . . . . . . . . . . . . . . . . . . . . . . . . . . . 235Restarting PATROL’s Java collector . . . . . . . . . . . . . . . . . . . . . . . . . . . . . . . . . . . . . 237
Troubleshooting and debugging . . . . . . . . . . . . . . . . . . . . . . . . . . . . . . . . . . . . . . . . . . . 237Setting PSL debug flag . . . . . . . . . . . . . . . . . . . . . . . . . . . . . . . . . . . . . . . . . . . . . . . . 238Setting debug status for a server . . . . . . . . . . . . . . . . . . . . . . . . . . . . . . . . . . . . . . . . 240Setting debug status for Java collector . . . . . . . . . . . . . . . . . . . . . . . . . . . . . . . . . . . 241Recording data . . . . . . . . . . . . . . . . . . . . . . . . . . . . . . . . . . . . . . . . . . . . . . . . . . . . . . . 241Gathering information for support . . . . . . . . . . . . . . . . . . . . . . . . . . . . . . . . . . . . . . 242
Chapter 12 Administering the KM 229

12
Monitoring WebLogic across the enterprisePATROL for BEA WebLogic contains several commands in the BEAWLS_SERVER application class that are initiated from the administration server icon but that affect how PATROL monitors your entire WebLogic environment. These commands include:
■ Tuning Knowledge Module (KM) performance—this release introduces KM performance tuning, which allows you to select the servers and components to be monitored. By using only those collectors that are most critical to your monitoring needs and turning off others, you can improve overall PATROL performance and more easily scale to larger monitoring environments.
■ Scheduling blackout periods—you can suspend PATROL alerts for periods of time when you shut down parts of your WebLogic environment. Routine maintenance shutdowns or backups might ordinarily trigger PATROL alerts, but you can suspend those alerts temporarily by scheduling a blackout period.
■ Start Java collector—you may occasionally need to restart your PATROL collector after routine maintenance shutdowns, or when the collector status shows that it is not operating correctly.
Tuning KM performanceBy default, all servers in a domain are monitored. To tune the performance of PATROL for BEA WebLogic, you can perform the following actions:
■ select the servers that need to be monitored and remove less important servers that do not need to be monitored; for more information, see “Selecting servers for monitoring” on page 231 and “Deselecting servers from monitoring” on page 232
By default, all the servers in the domain are monitored.
■ select the components that need to be monitored and remove less important components that do not need to be monitored
Besides SERVER, CLUSTER, and EXECQ, all other supported components that are being monitoring are selectable. This includes: EJB, JDBC, WEBAPP, SERVLE, JMS JCA, JOLTJ2EE_APPS, and WS. For more information, see “Selecting components for monitoring” on page 233 and “Deselecting components from monitoring” on page 234
230 PATROL for BEA WebLogic User Guide

12
■ select one of the following discovery schedules for PATROL parameters for configured WebLogic objects:
— Discover Only When the Server State Changes, Default Setting (Recommended)—only the server states discovery is performed at MainDiscovery cycle and full discovery is performed only when server states have been changed; this option is helpful for a production system or a stabilized system for which no new objects are deployed or created frequently
— Perform Full Discovery at Every Interval of the MainDiscovery Parameter (of BEAWLS_SERVER KM) Schedule—for large systems for which the actual time needed to complete the AttrDiscovery is longer than the default schedule setting for AttrDiscovery parameter (three minutes), adjust the schedule to the actual parameter updating interval.
— Keep Original Setting and Perform Object Discovery Now
For more information, see “Scheduling PATROL parameter discovery for configured WebLogic objects” on page 235
■ select whether you want to monitor all parameters (Full) or just key parameters (Basic)
This monitoring option can be initially set at the time the server is registered; for more information, see “Registering a server” on page 93. It can be reset by following the steps in “Updating the registration of a server” on page 101.
The default setting is “Full”.
Selecting servers for monitoring
Perform the following steps to select servers for monitoring.
To select servers for monitoring
1 Right-click the server icon.
2 Choose KM Commands => KM Performance Tuning => Select Monitoring Servers.
The Select Monitoring Servers dialog box is displayed, as shown in the following figure:
Chapter 12 Administering the KM 231

12
3 To select servers for monitoring, highlight the server in Available Servers, click Add, then click Action.
The server is listed in Servers to Monitor and is monitored.
4 Click Exit to close the dialog box.
Deselecting servers from monitoring
Perform the following steps to deselect servers that you do not want to monitor anymore.
To deselect servers from monitoring
1 Right-click the server icon.
2 Choose KM Commands => KM Performance Tuning => Select Monitoring Servers.
The Select Monitoring Servers dialog box is displayed.
3 To deselect servers for monitoring, highlight the server in Servers to Monitor and click Remove, then click Action.
The server is listed in Available Servers and is no longer monitored.
4 Click Exit to close the dialog box.
NOTE If you are monitoring a cluster, it is recommended that you select all its servers for monitoring. If you do not select all its servers, the cluster parameters (such as AliveServerCount and AvailableClusterServers) will have meaningless values.
232 PATROL for BEA WebLogic User Guide

12
Selecting components for monitoring
Perform the following steps to select components for monitoring.
To select components for monitoring
1 Right-click the server icon.
2 Choose KM Commands => KM Performance Tuning => Select Monitoring Components.
The Select Monitoring Components dialog box is displayed, as shown in the following figure:
3 To monitor a component, leave the check box selected. If the check box is not selected for the component to be monitored, select it.
4 Click Accept.
Chapter 12 Administering the KM 233
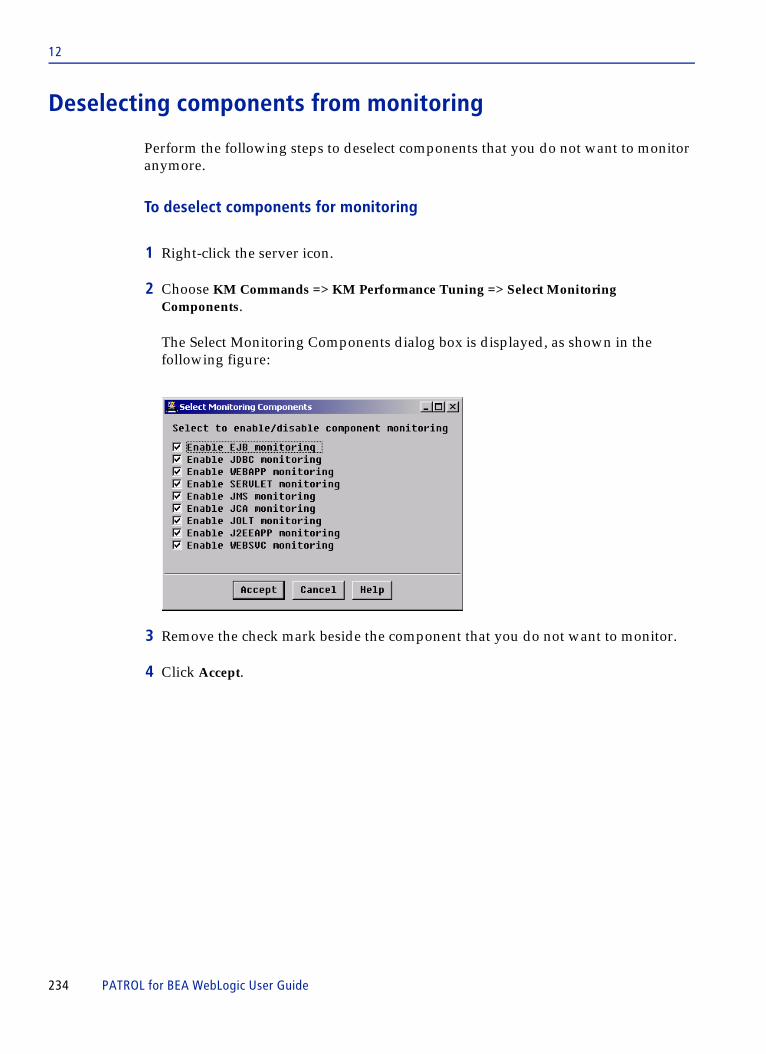
12
Deselecting components from monitoring
Perform the following steps to deselect components that you do not want to monitor anymore.
To deselect components for monitoring
1 Right-click the server icon.
2 Choose KM Commands => KM Performance Tuning => Select Monitoring Components.
The Select Monitoring Components dialog box is displayed, as shown in the following figure:
3 Remove the check mark beside the component that you do not want to monitor.
4 Click Accept.
234 PATROL for BEA WebLogic User Guide

12
Scheduling PATROL parameter discovery for configured WebLogic objects
Perform the following steps to schedule the discovery of PATROL parameters for configured WebLogic objects.
To schedule PATROL parameter discovery for configured WebLogic objects
1 Right-click the Monitored Server icon.
2 From the KM Commands menu, choose KM Performance Tuning => Configure Objects Discovery Schedule. The Configure Objects Discovery Schedule dialog box is displayed.
3 Enable one of the following options to set the PATROL parameter discovery schedule for configured WebLogic objects:
■ Discover Only When the Server State Changes, Default Setting (Recommended)—only the server states discovery is performed at MainDiscovery cycle and full discovery is performed only when server states have been changed
■ Perform Full Discovery at Every Interval of the MainDiscovery Parameter (of BEAWLS_SERVER KM) Schedule
■ Keep Original Setting and Perform Object Discovery Now
When Auto discovery is selected, a full discovery will be performed at every MainDiscovery parameter interval.
Scheduling blackout periods
Perform these steps to specify one or more blackout periods, or to remove (delete) a currently defined blackout period. During blackout periods, PATROL continues to monitor the WebLogic server environment but does not report object state changes nor generate warnings or alarms. This feature is useful for temporarily suspending warnings and alarms during scheduled maintenance and planned system downtime.
To schedule a blackout period
1 Right-click the administration server instance icon:
2 Choose KM Commands => KM Administration => Schedule Blackout Periods.
Chapter 12 Administering the KM 235

12
The Schedule Blackout Periods dialog box is displayed, as shown in the following figure:
3 Complete the fields on the dialog box as follows:
■ Select Add a Blackout Period.
■ Blackout Start Time Day of Week—select the day of the week that you want to begin blackout
■ Blackout Start Time—use the arrow keys to select the hour or click the minutes or seconds field and type a value on the keypad to enter more precise times that you want to begin the blackout; time values must be entered in a 24-hour format, for example, 8:30pm should be entered as 20:30:00 hours
■ Blackout Duration—type a number in the field and use the pull-down list to choose the units (the default is hours) to set the length of time you want the blackout to last
4 Click Apply.
To remove the blackout period
1 Right-click the server instance icon.
2 Choose KM Commands => KM Administration => Schedule Blackout Periods.
236 PATROL for BEA WebLogic User Guide
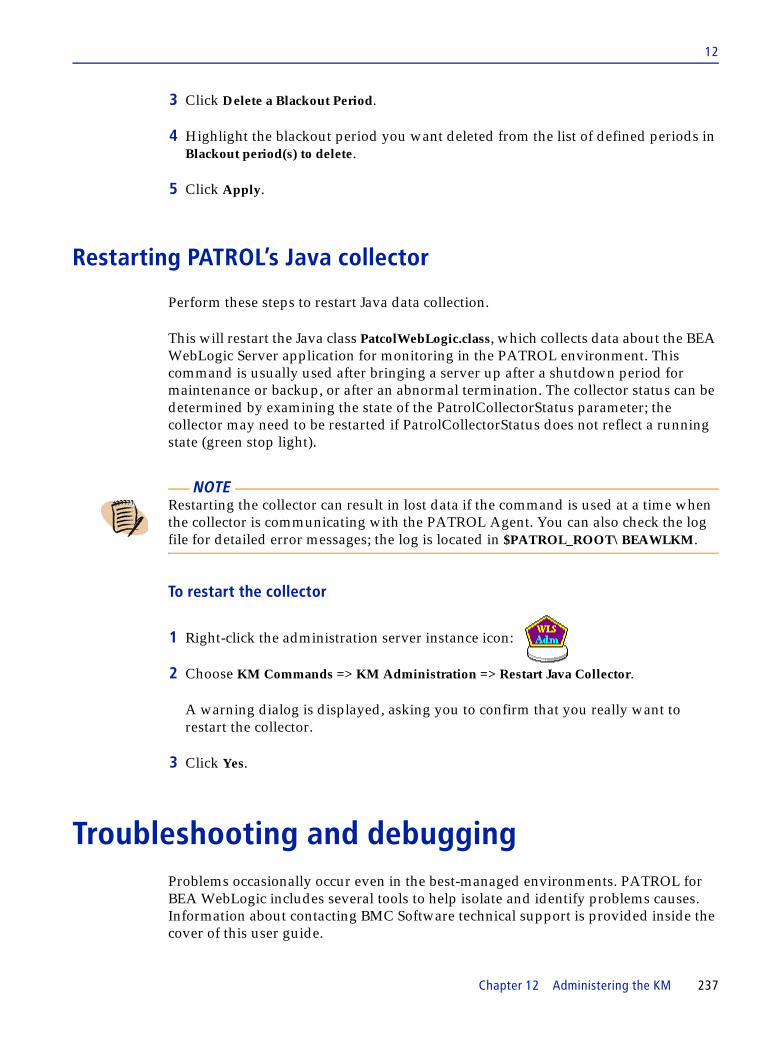
12
3 Click Delete a Blackout Period.
4 Highlight the blackout period you want deleted from the list of defined periods in Blackout period(s) to delete.
5 Click Apply.
Restarting PATROL’s Java collector
Perform these steps to restart Java data collection.
This will restart the Java class PatcolWebLogic.class, which collects data about the BEA WebLogic Server application for monitoring in the PATROL environment. This command is usually used after bringing a server up after a shutdown period for maintenance or backup, or after an abnormal termination. The collector status can be determined by examining the state of the PatrolCollectorStatus parameter; the collector may need to be restarted if PatrolCollectorStatus does not reflect a running state (green stop light).
To restart the collector
1 Right-click the administration server instance icon:
2 Choose KM Commands => KM Administration => Restart Java Collector.
A warning dialog is displayed, asking you to confirm that you really want to restart the collector.
3 Click Yes.
Troubleshooting and debuggingProblems occasionally occur even in the best-managed environments. PATROL for BEA WebLogic includes several tools to help isolate and identify problems causes. Information about contacting BMC Software technical support is provided inside the cover of this user guide.
NOTE Restarting the collector can result in lost data if the command is used at a time when the collector is communicating with the PATROL Agent. You can also check the log file for detailed error messages; the log is located in $PATROL_ROOT\BEAWLKM.
Chapter 12 Administering the KM 237

12
PATROL for BEA WebLogic provides the following troubleshooting tools:
■ setting PSL debug flags ■ setting the debug status for the server ■ recording collector data ■ setting debug flags for JMX
Additionally, troubleshooting information is provided in the online Help for this product.
If you are unable to solve a problem with PATROL for BEA WebLogic, you may need to contact BMC Software technical support; contact information is provided inside the front cover of this manual. When contacting BMC Software technical support, please perform the steps listed and provide the information requested in << >>.
Setting PSL debug flag
Perform these steps to turn on or off debug information logging for PATROL Script Language (PSL) code.
PSL generates various types of error and tracing information that you can log by setting flags.
To set debug flags
1 Right-click the administration server instance icon:
2 Choose KM Commands => KM Administration => Set PSL Debug.
The Set PSL DEBUG Flag dialog box is displayed, listing the types of debugging information that you can record, as shown in the following figure:
NOTE Error messages for the JMX component (those containing the letters JMX in the error message number) are documented in the PATROL JMX Component Help. To view these messages, select Help => Help Topics. The PATROL Console Help dialog box is displayed, with the Contents tab on top. Double-click the PATROL Knowledge Modules book and double-click the PATROL JMX Component Help to view the PATROL JMX Component Help. Then you can either view the messages using the Contents tab or the Index tab.
238 PATROL for BEA WebLogic User Guide

12
3 Click checkboxes next to the types of debugging information you want enabled. A check indicates that the option is turned on. Click the box again to turn the option off (uncheck). The fields are defined as follows:
■ Enable run-time error checking—sets all error checking flag bits
■ Enable function call tracing—reports which functions are called, but does not return information about arguments
■ Enable function argument tracing—reports the arguments passed to all user-defined or built-in functions
■ Enable function return value tracing—reports the value returned by calls to all user-defined or built-in functions
■ Enable variable assignment tracing—reports the variable name (if available) and the value assigned to it
■ Enable errno tracing—reports any nonzero values stored in the PSL errno variable
■ Enable PSL lock tracing—reports the interprocess actions that occur during lock() and unlock() function processing, including the granting, denying, and releasing of locks
4 Click OK.
Chapter 12 Administering the KM 239

12
Setting debug status for a server
Perform these steps to turn debugging on or off for a server instance.
When turning debugging on, you can set the level of detail you want, and you can choose whether to save the information to a file or display it on screen. You can also use this dialog to get debugging information for setup.
To set the debug status
1 Right-click the instance icon for the server for which you want debug information. Or right-click the BEAWLS_SETUP icon if you want setup debug information:
2 Choose KM Commands => KM Administration => KM Debugging.
3 Complete the fields as follows to choose the level of information and output destination:
■ Debug Level—select how much debug information you want: none, all, or for selected items only; all is the setting that BMC Software Technical Support will usually need if they ask you to collect debug data
■ Debug Selected Items—if you want debug information on selected items only, you can turn debugging on or off for the following items:
— flow—records procedure entry and exit points and parameters— data—records data being read and written— critical information—records other key information
■ Output Destination—select whether you want debug information to be displayed on screen in the system output window, or written to a file
■ File Name—if you chose to send debug output information to a file, specify the full directory path and file name
4 Click OK.
240 PATROL for BEA WebLogic User Guide

12
Setting debug status for Java collector
Perform these steps to turn debugging on or off for the PATROL Java collector.
To set the debug status
1 Right-click the administration server instance icon.
2 Choose KM Commands => KM Administration => Debug KM Java Collector.
The Debug KM Java Collector dialog box is displayed, as shown in the following figure:
3 To turn on debugging, select Turn On Debug, then click Accept.
To turn off debugging, select Turn Off Debug, then click Accept.
Recording data
Perform these steps to create a log file of collector data.
The collector log file is often used for troubleshooting.
NOTE This command is not intended for use in normal operations, but may be requested by BMC Software technical support as part of the troubleshooting process. The collector log file can be used to re-create the data and console settings in effect at a certain time.
Chapter 12 Administering the KM 241

12
To record collector data
1 Right-click a server instance icon:
2 Choose KM Commands => KM Administration => Start Recording.
3 Enter the path and file name in which to record data.
4 Click OK.
5 Click OK.
Gathering information for support
Before contacting BMC Software Customer Support, perform the following tasks:
■ describe your configuration■ verify permissions■ collect the following diagnostic information and parameter files:
— the Registered Instances report— the Server Configuration report— the output of the MainDiscovery text parameter— all the *.log files in $PATROL_HOME/../BEAWLKM
— the latest PATROL Agent error log— the PATROL Agent change variables— the WebLogic Server configuration files— any messages from the PATROL system output window
To describe your configuration
To describe your configuration, answer the following questions:
1. What version of the KM are you installing?
2. Is it a new installation or an upgrade of an existing installation?
NOTE When you are done recording data, choose KM Command => KM Administration => Stop Recording.
242 PATROL for BEA WebLogic User Guide
12
3. What is the version of WebLogic Server in use?
4. What is the version and type of the operating system of the WebLogic host machine?
5. What version of Patrol Agent is being used?
6. What type of Patrol Console is being used (NT, UNIX)?
7. Have you been able to start the WebLogic Admin console using the same login parameters as in the WebLogic KM registration screen?
8. Is the WebLogic Admin server instance up and running?
9. Has the KM been installed on BOTH the Patrol console machine AND the WebLogic Admin server?
To verify permissions
To characterize your configuration, answer the following questions:
1. Have you verified that PATROL has recursive read access to the entire WebLogic and JDK installation trees?
2. Have you verified that the files in $PATROL_HOME/../BEAWLKM are recursively readable for the world?
3. Have you verified that the subdirectory $PATROL_HOME/../BEAWLKM is writable to the world?
To collect diagnostics and parameter files
Collect the following diagnostics and parameter files:
■ the Registered Instances report
To view and save the report, right-click BEAWLS_SETUP and select KM Commands => Report of Registered Instances. The report is displayed in the system output window.
■ the Server Configuration report
To view and save the report, right-click the instance icon of the Admin server and select KM Commands => Reports => Server Configuration. The report is displayed in the system output window.
Chapter 12 Administering the KM 243

12
■ the output of the MainDiscovery text parameter
Cut and paste the information to a text file.
■ all the *.log files in $PATROL_HOME/../BEAWLKM
■ the latest PATROL Agent error log
This file has a path name format of <PATROL_HOME>/log/PatrolAgent-<hostname>-<port>.errs
where <hostname> is the console host and <port> is the IP services socket. Use the version whose filename does not include any tilde (~) characters.
■ the PATROL Agent change variables
The PATROL Agent change variables have the format of$ pconfig -p <port> +get > /tmp/bmcagent.txt
where <port> is the Patrol Agent's assigned port.
■ all of the config.xml files in the WebLogic installation tree, tagging them by directory location
For example, when collecting all config.xml files for a given host, follow these steps:
1. Login as a WebLogic authorized user
2. Type the following commands:
$ cd /opt/WebLogic$ find . -type f -name 'config.xml' -print > /tmp/file.list$ tar cf /tmp/host1files.tar -I /tmp/file.list
3. Send the *.tar files created for each host.
244 PATROL for BEA WebLogic User Guide

C h a p t e r A
A Accessing menu commands, InfoBoxes, and online HelpBMC Software offers several PATROL consoles from which you can view a PATROL Knowledge Module (KM). Because of the different environments in which these consoles run, each one uses a different method to display and access information in the KM. This appendix provides instructions for accessing the KM menu commands, InfoBoxes, and online Help on each of the PATROL consoles. See the PATROL for BEA WebLogic online Help for more detailed information about navigation in the PATROL Consoles.
Accessing KM commands and InfoBoxes . . . . . . . . . . . . . . . . . . . . . . . . . . . . . . . . . . . 246Accessing online Help . . . . . . . . . . . . . . . . . . . . . . . . . . . . . . . . . . . . . . . . . . . . . . . . . . . . 247
Chapter A Accessing menu commands, InfoBoxes, and online Help 245

A
Accessing KM commands and InfoBoxesTable 15 provides information about how to access KM commands and InfoBoxes from the various PATROL consoles.
Table 15 Accessing KM commands and InfoBoxes
ConsoleTo access menu commands
To accessInfoBoxes
PATROL Console for Microsoft Windows Servers
In either the Desktop tree tab or work area, right-click a computer or application icon and choose KM Commands from the pop-up menu.
In either the Desktop tree tab or the work area, right-click an application class or parameter icon and choose InfoBox from the pop-up menu.
PATROL Console for Unix In the work area, right-click a computer or application icon to display a pop-up menu that contains KM-specific commands.
With the middle mouse button, click an application class or parameter icon.
PATROL Central Operator - Windows Edition
In the navigation pane, right-click a managed system or application icon and choose Knowledge Module Commands from the pop-up menu.
In the navigation pane, right-click a PATROL object and choose InfoBox from the pop-up menu.
PATROL Central Operator - Web Edition
In the tree view area, right-click an application icon and choose Knowledge Module Commands from the pop-up menu.
In the tree view area, right-click a PATROL object and choose Infobox from the pop-up menu.
246 PATROL for BEA WebLogic User Guide

A
Accessing online HelpTable 16 provides information about how to access Help from each console.
NOTE If you are trying to access Help from a Unix console, see the PATROL Installation Reference Manual for specific instructions about installing and setting up a browser in the Unix environment.
Table 16 Accessing online Help (Part 1 of 2)
ConsoleTo access product help
To access application class help
To access parameter help
PATROL Console for Microsoft Windows Servers
■ Right-click the PATROL for BEA WebLogic application icon and choose KM Commands => Product Help.
■ From the console menu bar, choose Help => Help Topics => PATROL Knowledge Modules.
Double-click an application class in the KM tab of the console. From the Application Properties dialog box, click the Help tab. Then click Show Help.
■ Right-click a parameter icon and choose Help On from the pop-up menu.
■ Double-click a parameter icon; click the ? icon or Help button in the parameter display window.
■ Double-click a parameter in the KM tab of the console; from the properties dialog box, click the Help tab; then click Show Help.
PATROL Console for Unix
■ Right-click the PATROL for BEA WebLogic application icon and choose KM Commands => Product Help.
■ From the console menu bar, choose Help On => Knowledge Modules.
Choose Attributes => Application Classes and double-click the application name. Click Show Help in the Application Definition dialog box.
Right-click a parameter icon and click Help On.
Chapter A Accessing menu commands, InfoBoxes, and online Help 247

A
PATROL Central Operator - Windows Edition
From the console menu bar, choose Help => Help Topics. In the Contents tab, click the name of your product.
In the Operator tab of the navigation pane, select an application icon and press F1.
In the Operator tab of the navigation pane, select a parameter icon and press F1.
PATROL Central Operator - Web Edition
In the upper right corner of PATROL Central, click Help and choose PATROL KM Help.
In the tree view, right-click an application class and choose Help.
In the tree view, right-click a parameter and choose Help.
Table 16 Accessing online Help (Part 2 of 2)
ConsoleTo access product help
To access application class help
To access parameter help
248 PATROL for BEA WebLogic User Guide

C h a p t e r B
B Parameter referencePATROL for BEA WebLogic uses parameters to provide statistical information about resources, operating status, and performance.
This appendix describes the following topics.
Parameters for a WebLogic environment. . . . . . . . . . . . . . . . . . . . . . . . . . . . . . . . . . . . 249Column headings defined . . . . . . . . . . . . . . . . . . . . . . . . . . . . . . . . . . . . . . . . . . . . . 250Abbreviations defined . . . . . . . . . . . . . . . . . . . . . . . . . . . . . . . . . . . . . . . . . . . . . . . . 252
Collector-consumer dependencies. . . . . . . . . . . . . . . . . . . . . . . . . . . . . . . . . . . . . . . . . . 292
Parameters for a WebLogic environmentTable 17 lists descriptions and default values for those parameters that are available when monitoring a BEA WebLogic 7.0 through 8.1 environment.
Table 18 lists descriptions and default values for parameters that monitor JMX components in a BEA WebLogic 7.0 through 8.1 environment. More information is available in the online Help.
Chapter B Parameter reference 249

B
Column headings defined
Column headings in Table 17 and Table 18 are defined as follows:
Column Heading Description
Description states the parameter name and describes the parameter’s function; for consumer parameters, lists the collector parameters that gather the data displayed by this parameter
WebLogic Server indicates the version of the WebLogic Server that the parameter supports
“All” indicates that the parameter is supported on all WebLogic server versions listed in the Release Notes for this version.
Required Configuration indicates the configuration level at which a parameter becomes active; many parameters require that advanced monitoring options be enabled (see “Enabling and disabling instrumentation and profiling features” on page 106); parameters become active at the following levels:
■ Basic: parameter is active by default in all configurations; there are two “basic” levels, full and key, by default all basic-level parameters are active, but a user can configure the product to display only a minimal set of the key basic parameters
■ Inst: parameter is only active if instrumentation configuration was enabled (on the Configure Advance Monitoring dialog, choose “Enable Component Performance Data Collection”)
■ Prof: parameter is only active if JVM performance was configured (on the Configure Advance Monitoring dialog, choose “Enable JVM Performance Data Collecting, including GC Time, Threads Detail, and Memory Usage”)
■ Meth: parameter is only active if Java method level profiling was configured (on the Specify Java Class for Method Level Profiling dialog, choose “Enable Advance Java Class Method Level CPU Utilization Analysis”)
250 PATROL for BEA WebLogic User Guide
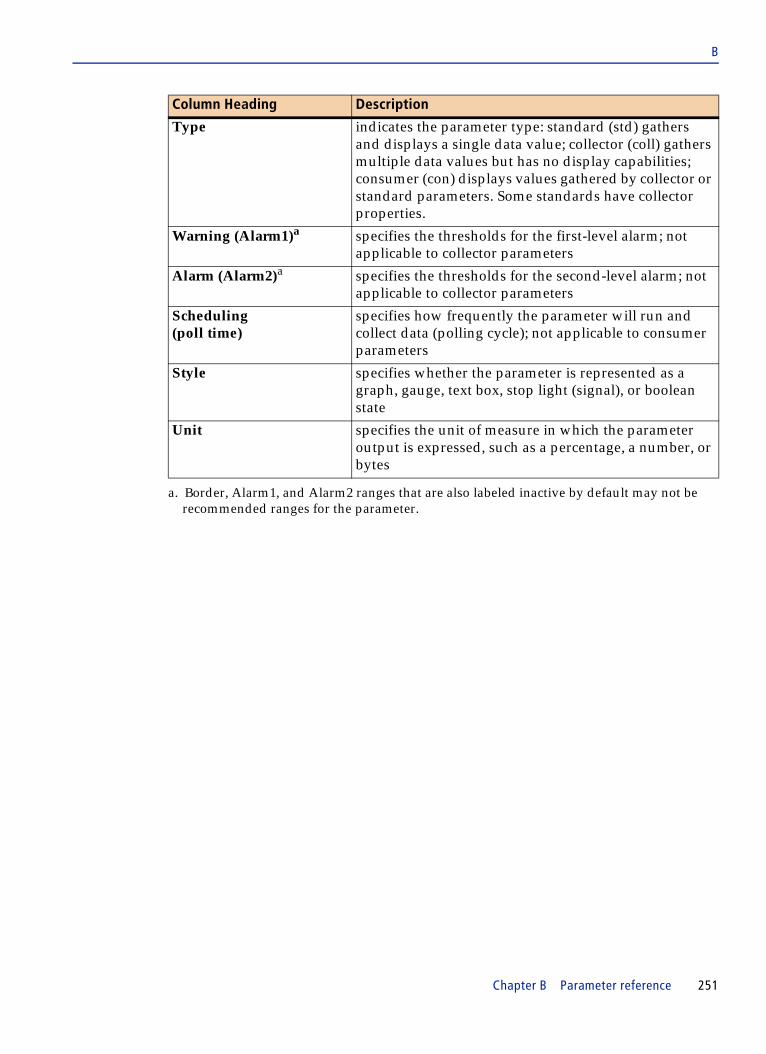
B
Type indicates the parameter type: standard (std) gathers and displays a single data value; collector (coll) gathers multiple data values but has no display capabilities; consumer (con) displays values gathered by collector or standard parameters. Some standards have collector properties.
Warning (Alarm1)a specifies the thresholds for the first-level alarm; not applicable to collector parameters
Alarm (Alarm2)a specifies the thresholds for the second-level alarm; not applicable to collector parameters
Scheduling(poll time)
specifies how frequently the parameter will run and collect data (polling cycle); not applicable to consumer parameters
Style specifies whether the parameter is represented as a graph, gauge, text box, stop light (signal), or boolean state
Unit specifies the unit of measure in which the parameter output is expressed, such as a percentage, a number, or bytes
a. Border, Alarm1, and Alarm2 ranges that are also labeled inactive by default may not be recommended ranges for the parameter.
Column Heading Description
Chapter B Parameter reference 251
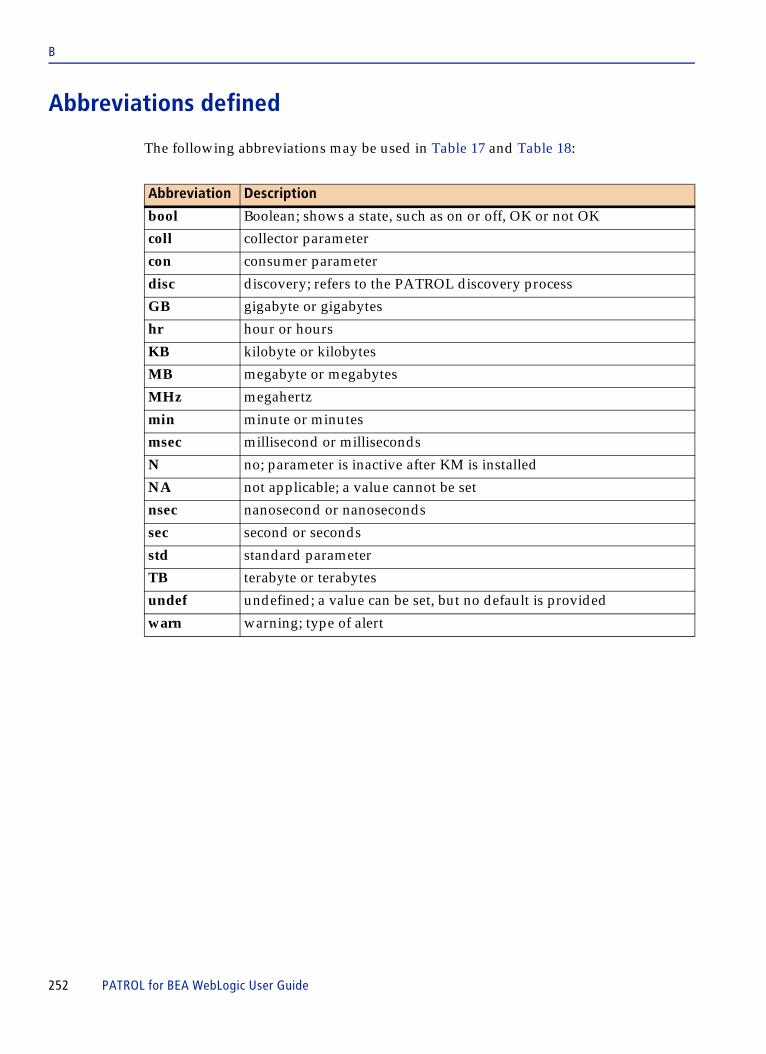
B
Abbreviations defined
The following abbreviations may be used in Table 17 and Table 18:
Abbreviation Description
bool Boolean; shows a state, such as on or off, OK or not OK
coll collector parameter
con consumer parameter
disc discovery; refers to the PATROL discovery process
GB gigabyte or gigabytes
hr hour or hours
KB kilobyte or kilobytes
MB megabyte or megabytes
MHz megahertz
min minute or minutes
msec millisecond or milliseconds
N no; parameter is inactive after KM is installed
NA not applicable; a value cannot be set
nsec nanosecond or nanoseconds
sec second or seconds
std standard parameter
TB terabyte or terabytes
undef undefined; a value can be set, but no default is provided
warn warning; type of alert
252 PATROL for BEA WebLogic User Guide
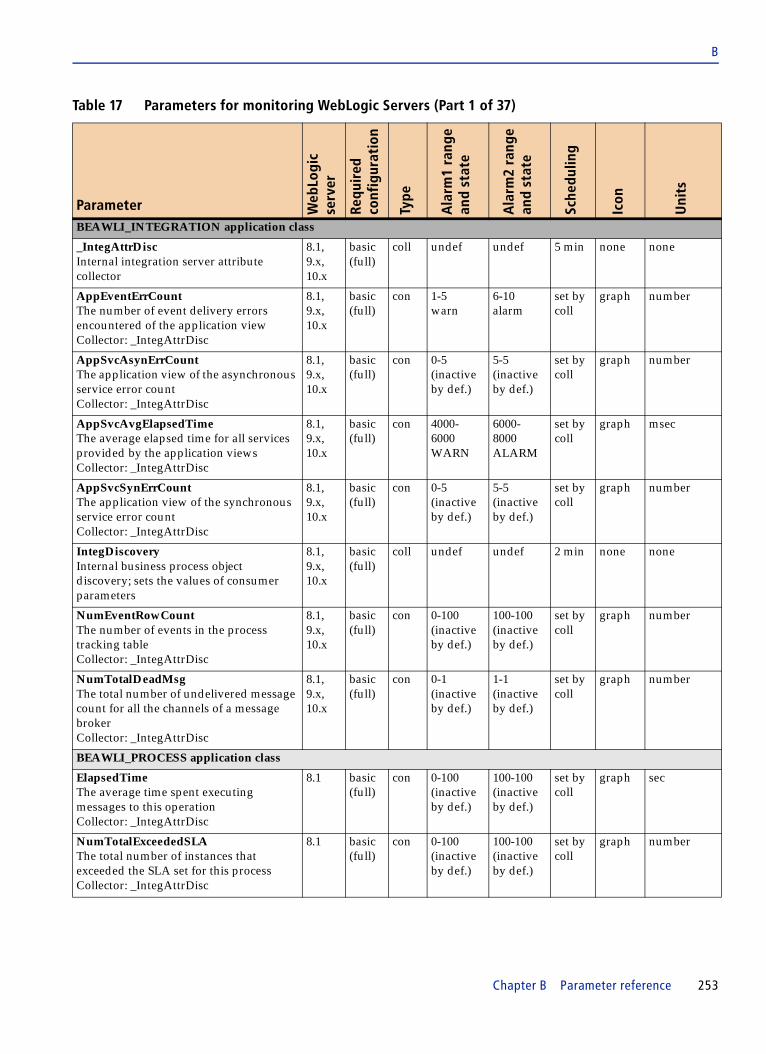
B
Table 17 Parameters for monitoring WebLogic Servers (Part 1 of 37)
Parameter Web
Logi
cse
rver
Requ
ired
conf
igur
atio
n
Type
Ala
rm1
rang
ean
d st
ate
Ala
rm2
rang
ean
d st
ate
Sche
dulin
g
Icon
Uni
ts
BEAWLI_INTEGRATION application class
_IntegAttrDiscInternal integration server attribute collector
8.1, 9.x, 10.x
basic (full)
coll undef undef 5 min none none
AppEventErrCountThe number of event delivery errors encountered of the application viewCollector: _IntegAttrDisc
8.1, 9.x, 10.x
basic (full)
con 1-5warn
6-10alarm
set by coll
graph number
AppSvcAsynErrCountThe application view of the asynchronous service error countCollector: _IntegAttrDisc
8.1, 9.x, 10.x
basic (full)
con 0-5 (inactive by def.)
5-5 (inactive by def.)
set by coll
graph number
AppSvcAvgElapsedTimeThe average elapsed time for all services provided by the application viewsCollector: _IntegAttrDisc
8.1, 9.x, 10.x
basic (full)
con 4000-6000 WARN
6000-8000 ALARM
set by coll
graph msec
AppSvcSynErrCountThe application view of the synchronous service error countCollector: _IntegAttrDisc
8.1, 9.x, 10.x
basic (full)
con 0-5 (inactive by def.)
5-5 (inactive by def.)
set by coll
graph number
IntegDiscoveryInternal business process object discovery; sets the values of consumer parameters
8.1, 9.x, 10.x
basic (full)
coll undef undef 2 min none none
NumEventRowCountThe number of events in the process tracking tableCollector: _IntegAttrDisc
8.1, 9.x, 10.x
basic (full)
con 0-100(inactive by def.)
100-100(inactive by def.)
set by coll
graph number
NumTotalDeadMsgThe total number of undelivered message count for all the channels of a message brokerCollector: _IntegAttrDisc
8.1, 9.x, 10.x
basic (full)
con 0-1(inactive by def.)
1-1(inactive by def.)
set by coll
graph number
BEAWLI_PROCESS application class
ElapsedTimeThe average time spent executing messages to this operationCollector: _IntegAttrDisc
8.1 basic (full)
con 0-100(inactive by def.)
100-100(inactive by def.)
set by coll
graph sec
NumTotalExceededSLAThe total number of instances that exceeded the SLA set for this processCollector: _IntegAttrDisc
8.1 basic (full)
con 0-100(inactive by def.)
100-100(inactive by def.)
set by coll
graph number
Chapter B Parameter reference 253

B
ProcessThroughputThe percentage of the number of “completed” process instances divided by the number of all process instances Collector: _IntegAttrDisc
8.1 basic (full)
con 0-100(inactive by def.)
100-100(inactive by def.)
set by coll
graph percentage
BEAWLP_CACHE application class
CacheModeThe enabled mode of this cache.Collector: PortalDiscovery
8.1 basic (full)
con 0-0 warn
1-1 OK
set by coll
state bool.
0-False; 1-True
BEAWLP_PORTAL application class
PortalDiscoveryInternal collector for WebLogic portal data.
8.1 basic (full)
coll undef undef 15 min none none
BEAWLS_CLUSTER application class
AliveServerCount Graph indicating the number of servers in the cluster that are alive. This parameter counts the lowest number of servers configured to run as cluster members that do not know about all the other servers running in the cluster.Collector: AvailableClusterServers
all basic (key)
con 0-1 ALARM
2-3 WARN
set by coll
graph Number
AvailableClusterServersStop light icon indicating whether or not the clustered server is available.The value of this parameter actually reflects the total number of servers responding in a cluster.Collector: AttrDiscovery
all basic (full)
std 0-0alarm
1-1warn
set by coll
stop light
number
MulticastTrafficHealthMonitors the multicast routing between the BEA Weblogic server boundaries.Collector: AvailableClusterServers
all basic (full)
con 1-1alarm
N/A set by coll
stop light
0=OK1=critical
BEAWLS_DBURL application class
AvgResponseTimeAverage response time, in milliseconds, for all SQL statements with this database URL that have been executed.Collector: _SQLRespColl
7.0, 8.1
inst con 800-900 warn
900-1000 alarm
set by coll
graph msec
HighestInvocationCountNumber of times that the SQL statement most often requested during the previous polling cycle was invoked. Collector: _SQLRespColl
7.0, 8.1
inst con 4000- 6000 warn
6000- 10000 alarm
set by coll
graph number of requests
Table 17 Parameters for monitoring WebLogic Servers (Part 2 of 37)
Parameter Web
Logi
cse
rver
Requ
ired
conf
igur
atio
n
Type
Ala
rm1
rang
ean
d st
ate
Ala
rm2
rang
ean
d st
ate
Sche
dulin
g
Icon
Uni
ts
254 PATROL for BEA WebLogic User Guide

B
InvocationRateFrequency at which a database URL is called.Collector: _SQLRespColl
7.0, 8.1
inst con 0-100 (inactive by def.)
100-100 (inactive by def.)
set by coll
graph calls per second
LongestSQLAvgRespTimeTime (in ms) needed to run the SQL statement with the slowest average response time. Collector: _SQLRespColl
7.0, 8.1
inst con 800-900 warn
900-1000 alarm
set by coll
graph msec
LongestSQLTotalRespTimeTime (in ms) needed to run the SQL statement with the slowest total response time. Collector: _SQLRespColl
7.0, 8.1
inst con 1000- 2000 warn
2000- 3000 alarm
set by coll
graph msec
TotalInvocationCountNumber of invocations of all SQL statements executed during the most recent polling cycle.Collector: _SQLRespColl
7.0, 8.1
inst con 4000- 6000 warn
6000- 10000 alarm
set by coll
graph number
TotalResponseTimeTotal response time for all SQL statements with the monitored URL over the most recent polling cycle. Collector: _SQLRespColl
7.0, 8.1
inst con 1000-2000 warn
2000-3000 alarm
set by coll
graph msec
BEAWLS_EJB_HOME application class
ActivationCount Number of beans that needed to be activated to satisfy a client request. An EJB is activated if a suitable EJB cannot be found in the cache. This parameter does not apply to stateless session EJBs.Collector: EJBAttrDiscovery
all basic (key)
con 0-100 (inactive by def.)
100-100 (inactive by def.)
set by coll
graph number of beans
AvgResponseTimeAverage response time during previous polling cycle, of the EJB across all methods. Collector: _EJBRespColl
all inst con 800-900 warn
900-1000 alarm
set by coll
graph msec
BeanAccessCountThe total number of times an attempt was made to get an instance from the free pool. Collector: EJBAttrDiscovery
8.1, 9.x, 10.x
basic (full)
con 0-100 (inactive by def.)
100-100 (inactive by def.)
set by coll
graph number of beans
Table 17 Parameters for monitoring WebLogic Servers (Part 3 of 37)
Parameter Web
Logi
cse
rver
Requ
ired
conf
igur
atio
n
Type
Ala
rm1
rang
ean
d st
ate
Ala
rm2
rang
ean
d st
ate
Sche
dulin
g
Icon
Uni
ts
Chapter B Parameter reference 255
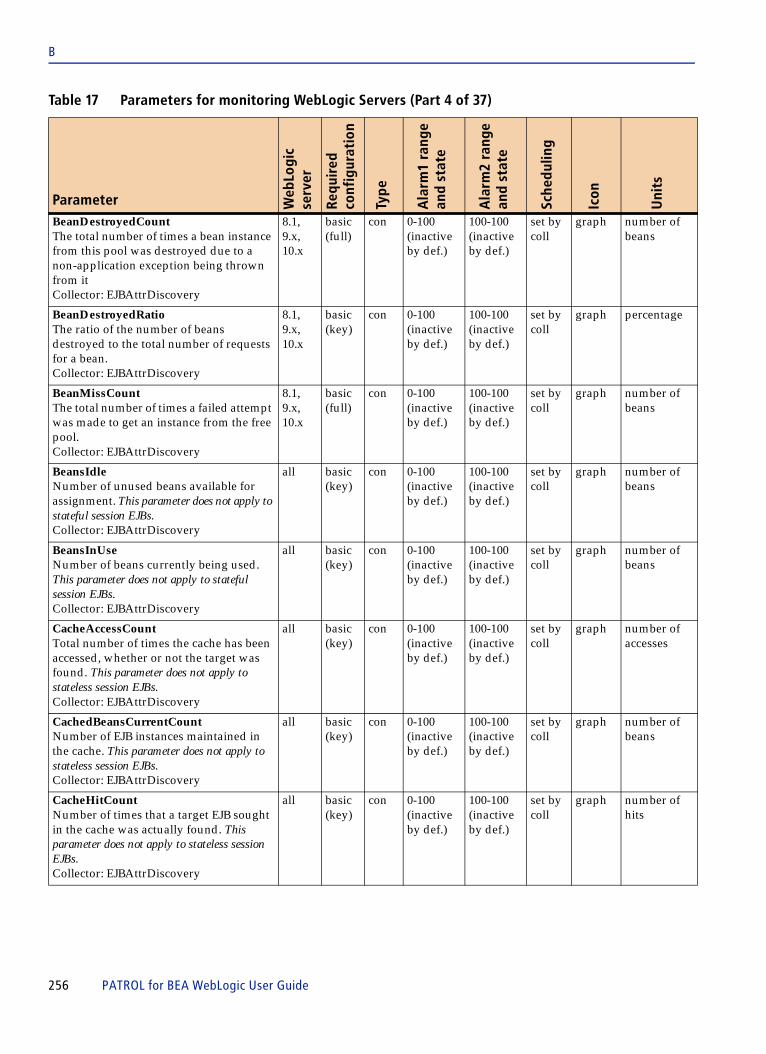
B
BeanDestroyedCountThe total number of times a bean instance from this pool was destroyed due to a non-application exception being thrown from itCollector: EJBAttrDiscovery
8.1, 9.x, 10.x
basic (full)
con 0-100 (inactive by def.)
100-100 (inactive by def.)
set by coll
graph number of beans
BeanDestroyedRatioThe ratio of the number of beans destroyed to the total number of requests for a bean. Collector: EJBAttrDiscovery
8.1, 9.x, 10.x
basic (key)
con 0-100 (inactive by def.)
100-100 (inactive by def.)
set by coll
graph percentage
BeanMissCountThe total number of times a failed attempt was made to get an instance from the free pool. Collector: EJBAttrDiscovery
8.1, 9.x, 10.x
basic (full)
con 0-100 (inactive by def.)
100-100 (inactive by def.)
set by coll
graph number of beans
BeansIdle Number of unused beans available for assignment. This parameter does not apply to stateful session EJBs.Collector: EJBAttrDiscovery
all basic (key)
con 0-100 (inactive by def.)
100-100 (inactive by def.)
set by coll
graph number of beans
BeansInUse Number of beans currently being used. This parameter does not apply to stateful session EJBs.Collector: EJBAttrDiscovery
all basic (key)
con 0-100 (inactive by def.)
100-100 (inactive by def.)
set by coll
graph number of beans
CacheAccessCount Total number of times the cache has been accessed, whether or not the target was found. This parameter does not apply to stateless session EJBs.Collector: EJBAttrDiscovery
all basic (key)
con 0-100 (inactive by def.)
100-100 (inactive by def.)
set by coll
graph number of accesses
CachedBeansCurrentCountNumber of EJB instances maintained in the cache. This parameter does not apply to stateless session EJBs.Collector: EJBAttrDiscovery
all basic (key)
con 0-100 (inactive by def.)
100-100 (inactive by def.)
set by coll
graph number of beans
CacheHitCount Number of times that a target EJB sought in the cache was actually found. This parameter does not apply to stateless session EJBs.Collector: EJBAttrDiscovery
all basic (key)
con 0-100 (inactive by def.)
100-100 (inactive by def.)
set by coll
graph number of hits
Table 17 Parameters for monitoring WebLogic Servers (Part 4 of 37)
Parameter Web
Logi
cse
rver
Requ
ired
conf
igur
atio
n
Type
Ala
rm1
rang
ean
d st
ate
Ala
rm2
rang
ean
d st
ate
Sche
dulin
g
Icon
Uni
ts
256 PATROL for BEA WebLogic User Guide

B
CacheMissRatioThe Cache Miss Count divided by the Cache Access Count.This parameter is shown only if the EJB type is an Entity bean.Collector: EJBAttrDiscovery
all basic (key)
con 0-100 (inactive by def.)
100-100 (inactive by def.)
set by coll
graph percent
FreePoolMissRatioThe ratio of the number of times a request was made to get a bean from the pool when no beans were available divided by the total number of requests for a bean made to the pool.Collector: EJBAttrDiscovery
8.1, 9.x, 10.x
basic (key)
con 0-100 (inactive by def.)
100-100 (inactive by def.)
set by coll
graph percentage
FreePoolTimeout Number of beans that timed out waiting for the free pool. If this number is other than zero, it indicates that transactions failed due to insufficient beans in the free pool; you may want to allocate additional EJBs to the pool. This parameter does not apply to stateful session beans. Collector: EJBAttrDiscovery
all basic (key)
con 0-100 (inactive by def.)
100-100 (inactive by def.)
set by coll
graph number of beans
FreePoolTimeoutRatioThe ratio of the number of requests that have timed out waiting for a bean from the pool divided by the total number of requests made.Collector: EJBAttrDiscovery
8.1, 9.x, 10.x
basic (key)
con 0-100 (inactive by def.)
100-100 (inactive by def.)
set by coll
graph percentage
FreePoolWaiter Number of beans waiting for the free pool. If this number is growing, you may want to allocate additional EJBs to the pool (see the online Help). This parameter does not apply to stateful session EJBs.Collector: EJBAttrDiscovery
all basic (key)
con 0-100 (inactive by def.)
100-100 (inactive by def.)
set by coll
graph number of beans
InvocationCountNumber of times the EJB was invoked during the previous polling cycle (across all methods).Collector: _EJBRespColl
all inst con 4000- 6000 warn
6000- 10000 alarm
set by coll
graph number of calls
InvocationRateNumber of times per millisecond (frequency rate) that the EJB was invoked during the previous polling cycle (across all methods).Collector: _EJBRespColl
all inst con 0-100 (inactive by def.)
100-100 (inactive by def.)
set by coll
graph number of calls per second
Table 17 Parameters for monitoring WebLogic Servers (Part 5 of 37)
Parameter Web
Logi
cse
rver
Requ
ired
conf
igur
atio
n
Type
Ala
rm1
rang
ean
d st
ate
Ala
rm2
rang
ean
d st
ate
Sche
dulin
g
Icon
Uni
ts
Chapter B Parameter reference 257

B
JMSConnectionAliveStatus of JMS connection (up or down).Collector: EJBAttrDiscovery
all basic (key)
con 0-100 (inactive by def.)
100-100 (inactive by def.)
set by coll
state bool
none
LockEntriesCount Number of currently locked entries.Collector: EJBAttrDiscovery
all basic (key)
con 0-100 (inactive by def.)
100-100 (inactive by def.)
set by coll
graph number of entries
LockManagerAccessCount Number of times the lock manager was accessed.Collector: EJBAttrDiscovery
all basic (full)
con 0-100 (inactive by def.)
100-100 (inactive by def.)
set by coll
graph number of accesses
LockTimeoutCount Number of times an access to the lock manager timed out.Collector: EJBAttrDiscovery
all basic (full)
con 0-100 (inactive by def.)
100-100 (inactive by def.)
set by coll
graph number of accesses
LockTimeoutRatioThe LockTimeoutCount divided by the LockAccessCount.Collector: EJBAttrDiscovery
all basic (key)
con 0-100 (inactive by def.)
100-100 (inactive by def.)
set by coll
graph percentage
LockWaiterCount Number of beans currently waiting for service from the lock manager.Collector: EJBAttrDiscovery
all basic (full)
con 0-100 (inactive by def.)
100-100 (inactive by def.)
set by coll
graph number of beans
LockWaiterRatio The LockWaiterCount divided by the LockAccessCount.Collector: EJBAttrDiscovery
all basic (key)
con 0-100 (inactive by def.)
100-100 (inactive by def.)
set by coll
graph percentage
LongestEJBAvgRespTimeLongest average response time of any method executed for this specific EJB‘ during the previous polling cycle.Collector: _EJBRespColl
7.0, 8.1
inst con 4000-6000 warn
6000-8000 alarm
set by coll
graph msec
LongestEJBTotalRespTimeLongest total response time of any method, during the previous polling cycle.Collector: _EJBRespColl
7.0, 8.1
inst con 8000- 10000 warn
10000- 10000 alarm
set by coll
graph msec
MDBStatus The status of the Message Driven Bean has been suspended. Collector: _EJBRespColl
9.x, 10.x
basic (key)
con 1-2 WARN
2-2 (inactive)
set by coll
graph 0 - Process-ing; 1 - Paused
MostInvocationEJBHighest invocation count for any method executed by the EJB during the previous polling cycle.Collector: _EJBRespColl
all inst con 4000- 6000 warn
6000- 10000 alarm
set by coll
graph number of calls
Table 17 Parameters for monitoring WebLogic Servers (Part 6 of 37)
Parameter Web
Logi
cse
rver
Requ
ired
conf
igur
atio
n
Type
Ala
rm1
rang
ean
d st
ate
Ala
rm2
rang
ean
d st
ate
Sche
dulin
g
Icon
Uni
ts
258 PATROL for BEA WebLogic User Guide

B
PassivationCountNumber of beans passivated since last cycle. An EJB is passivated either because the cache is full or because the bean was not accessed over a long period of time.Collector: EJBAttrDiscovery
all basic (key)
con 0-100 (inactive by def.)
100-100 (inactive by def.)
set by coll
graph number of beans
ProcessedMsgCount The total number of messages processed by this Message Driven Bean. Collector: _EJBRespColl
9.x, 10.x
basic (key)
con 0-100 inactive
100-100 inactive
set by coll
graph Number
SuspendCount The total number of times this Message Driven Bean has been suspended. Collector: _EJBRespColl
9.x, 10.x
basic (key)
con 0-100 inactive
100-100 inactive
set by coll
graph Number
TotalResponseTimeCumulative response time of the EJB across all methods during the previous polling cycle.Collector: _EJBRespColl
all inst con 8000- 10000 warn
10000- 10000 alarm
set by coll
graph msec
TransactionCommitRate Rate at which transactions are committed. This is measured as number of commits per discovery cycle. Collector: EJBAttrDiscovery
all basic (key)
con 0-100 (inactive by def.)
100-100 (inactive by def.)
set by coll
graph number of commits
TransactionRollbackRateNumber of transaction rollback operations performed by this EJB per discovery cycle.Collector: EJBAttrDiscovery
all basic (key)
con 0-100 (inactive by def.)
100-100 (inactive by def.)
set by coll
graph number of rollbacks
TransactionTimeoutRate Number of transactions that failed per discovery cycle because they could not complete within a satisfactory time.Collector: EJBAttrDiscovery
all basic (key)
con 0-100 (inactive by def.)
100-100 (inactive by def.)
set by coll
graph number of timeouts
BEAWLS_EJB_METHOD application class
AvgResponseTimeAverage response time of the method during previous polling cycle.Collector: _EJBRespColl (LOCAL_MANAGED)
7.0, 8.1
inst con 4000-6000 warn
6000-8000 alarm
set by coll
graph msec
InvocationCountNumber of times the method was invoked during the previous polling cycle.Collector: _EJBRespColl (LOCAL_MANAGED)
7.0, 8.1
inst con 4000- 6000 warn
6000- 10000 alarm
set by coll
graph number of calls
Table 17 Parameters for monitoring WebLogic Servers (Part 7 of 37)
Parameter Web
Logi
cse
rver
Requ
ired
conf
igur
atio
n
Type
Ala
rm1
rang
ean
d st
ate
Ala
rm2
rang
ean
d st
ate
Sche
dulin
g
Icon
Uni
ts
Chapter B Parameter reference 259
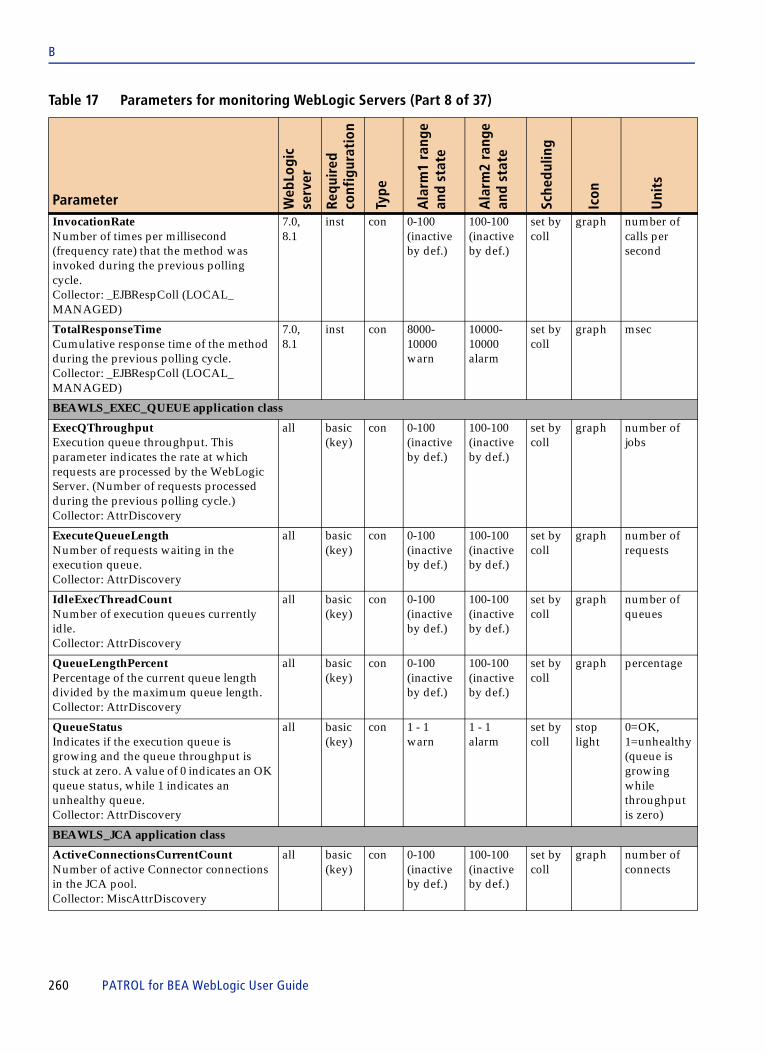
B
InvocationRateNumber of times per millisecond (frequency rate) that the method was invoked during the previous polling cycle.Collector: _EJBRespColl (LOCAL_MANAGED)
7.0, 8.1
inst con 0-100 (inactive by def.)
100-100 (inactive by def.)
set by coll
graph number of calls per second
TotalResponseTimeCumulative response time of the method during the previous polling cycle.Collector: _EJBRespColl (LOCAL_MANAGED)
7.0, 8.1
inst con 8000- 10000 warn
10000- 10000 alarm
set by coll
graph msec
BEAWLS_EXEC_QUEUE application class
ExecQThroughputExecution queue throughput. This parameter indicates the rate at which requests are processed by the WebLogic Server. (Number of requests processed during the previous polling cycle.)Collector: AttrDiscovery
all basic (key)
con 0-100 (inactive by def.)
100-100 (inactive by def.)
set by coll
graph number of jobs
ExecuteQueueLengthNumber of requests waiting in the execution queue.Collector: AttrDiscovery
all basic (key)
con 0-100 (inactive by def.)
100-100 (inactive by def.)
set by coll
graph number of requests
IdleExecThreadCountNumber of execution queues currently idle. Collector: AttrDiscovery
all basic (key)
con 0-100 (inactive by def.)
100-100 (inactive by def.)
set by coll
graph number of queues
QueueLengthPercentPercentage of the current queue length divided by the maximum queue length.Collector: AttrDiscovery
all basic (key)
con 0-100 (inactive by def.)
100-100 (inactive by def.)
set by coll
graph percentage
QueueStatusIndicates if the execution queue is growing and the queue throughput is stuck at zero. A value of 0 indicates an OK queue status, while 1 indicates an unhealthy queue.Collector: AttrDiscovery
all basic (key)
con 1 - 1 warn
1 - 1 alarm
set by coll
stop light
0=OK, 1=unhealthy (queue is growing while throughput is zero)
BEAWLS_JCA application class
ActiveConnectionsCurrentCountNumber of active Connector connections in the JCA pool.Collector: MiscAttrDiscovery
all basic (key)
con 0-100 (inactive by def.)
100-100 (inactive by def.)
set by coll
graph number of connects
Table 17 Parameters for monitoring WebLogic Servers (Part 8 of 37)
Parameter Web
Logi
cse
rver
Requ
ired
conf
igur
atio
n
Type
Ala
rm1
rang
ean
d st
ate
Ala
rm2
rang
ean
d st
ate
Sche
dulin
g
Icon
Uni
ts
260 PATROL for BEA WebLogic User Guide

B
ActiveConnectionsHighCountHighest number of active Connector connections in the JCA pool (highwater mark) since the pool was established.Collector: MiscAttrDiscovery
all basic (full)
con 0-100 (inactive by def.)
100-100 (inactive by def.)
set by coll
graph number of connects
AverageActiveUsageRunning average of connections that are active in the connection pool since it was last shrunk.Collector: MiscAttrDiscovery
all basic (full)
con 0-100 (inactive by def.)
100-100 (inactive by def.)
set by coll
graph number of connects
ConnectionIdleProfileCountNumber of idle leak connection profiles stored for this JCA pool.Collector: MiscAttrDiscovery
all basic (full)
con 0-100 (inactive by def.)
100-100 (inactive by def.)
set by coll
graph number of connects
ConnectionLeakProfileCountNumber of leak connection profiles stored for this JCA pool.Collector: MiscAttrDiscovery
all basic (full)
con 0-100 (inactive by def.)
100-100 (inactive by def.)
set by coll
graph number of connects
CreatedConnectionsTotalCountTotal number of connections created in this Connector connection pool since the pool was created. Collector: MiscAttrDiscovery
all basic (full)
con 0-100 (inactive by def.)
100-100 (inactive by def.)
set by coll
graph number of connects
DestroyedConnectionsTotalCountTotal number of connections destroyed in this Connector connection pool since the pool was created. Collector: MiscAttrDiscovery
all basic (full)
con 0-100 (inactive by def.)
100-100 (inactive by def.)
set by coll
graph number of connects
FreeConnectionsCurrentCountTotal number of currently free connections in the JCA connector pool. Collector: MiscAttrDiscovery
all basic (key)
con 0-100 (inactive by def.)
100-100 (inactive by def.)
set by coll
graph number of connects
FreeConnectionsHighCountHighest number of currently free connections in the JCA connector pool since the pool was created (high water mark). Collector: MiscAttrDiscovery
all basic (full)
con 0-100 (inactive by def.)
100-100 (inactive by def.)
set by coll
graph number of connects
IdleConnectionsTotalCountTotal number of idle connections detected in the lifetime of this pool.Collector: MiscAttrDiscovery
all basic (full)
con 0-100 (inactive by def.)
100-100 (inactive by def.)
set by coll
graph number of connects
LeakedConnectionsTotalCountTotal number of leaked connections detected over the lifetime of this pool. Collector: MiscAttrDiscovery
all basic (full)
con 0-100 (inactive by def.)
100-100 (inactive by def.)
set by coll
graph number of connects
Table 17 Parameters for monitoring WebLogic Servers (Part 9 of 37)
Parameter Web
Logi
cse
rver
Requ
ired
conf
igur
atio
n
Type
Ala
rm1
rang
ean
d st
ate
Ala
rm2
rang
ean
d st
ate
Sche
dulin
g
Icon
Uni
ts
Chapter B Parameter reference 261

B
MatchedConnectionsTotalCountTotal number of times since the pool was created that a request for a connection was satisfied by using an existing connection from the pool. Collector: MiscAttrDiscovery
all basic (full)
con 0-100 (inactive by def.)
100-100 (inactive by def.)
set by coll
graph number of connects
PoolState The state of the pool. Collector: MiscAttrDiscovery
9.x, 10.x
basic (key)
con 0-100 (inactive by def.)
100-100 (inactive by def.)
set by coll
graph 0 - Running; 1 - Suspend-ed
RecycledTotalCountTotal number of connections recycled during the previous polling cycle.Collector: MiscAttrDiscovery
all basic (full)
con 0-100 (inactive by def.)
100-100 (inactive by def.)
set by coll
graph number of connects
RejectedConnectionsTotalCountTotal number of rejected requests for a connection since the pool was created. Collector: MiscAttrDiscovery
all basic (full)
con 0-100 (inactive by def.)
100-100 (inactive by def.)
set by coll
graph number of connects
BEAWLS_JDBC application class
ActiveConnectionsNumber of active database connections held by a JDBC pool. If this number is at or close to the maximum capacity (shown in the InfoBox), consider increasing the maximum number of connections to decrease the amount of time that requests will have to wait for a connection.Collector: JDBCAttrDiscovery
all basic (key)
con 0-100 (inactive by def.)
100-100 (inactive by def.)
set by coll
graph number of connects
AvailableConnectionsThe number of available connections in this pool.Collector: JDBCAttrDiscovery
8.1, 9.x, 10.x
basic (key)
con 0-100 (inactive by def.)
100-100 (inactive by def.)
set by coll
graph number
ConnectionDelayTime Average time (in milliseconds) needed to get a connection from the database connection pool.Collector: JDBCAttrDiscovery
all basic (full)
con 0-100 (inactive by def.)
100-100 (inactive by def.)
set by coll
graph msec
ConnectionLeakProfileCount Number of connection leak profiles. Connection leaks occur when a pool is closed without an explicit close() statement and is then scooped up during garbage collection. Use the Connection Leak Report to view a stack trace with details.Collector: JDBCAttrDiscovery
all basic (full)
con 0-100 (inactive by def.)
100-100 (inactive by def.)
set by coll
graph number of profiles
Table 17 Parameters for monitoring WebLogic Servers (Part 10 of 37)
Parameter Web
Logi
cse
rver
Requ
ired
conf
igur
atio
n
Type
Ala
rm1
rang
ean
d st
ate
Ala
rm2
rang
ean
d st
ate
Sche
dulin
g
Icon
Uni
ts
262 PATROL for BEA WebLogic User Guide
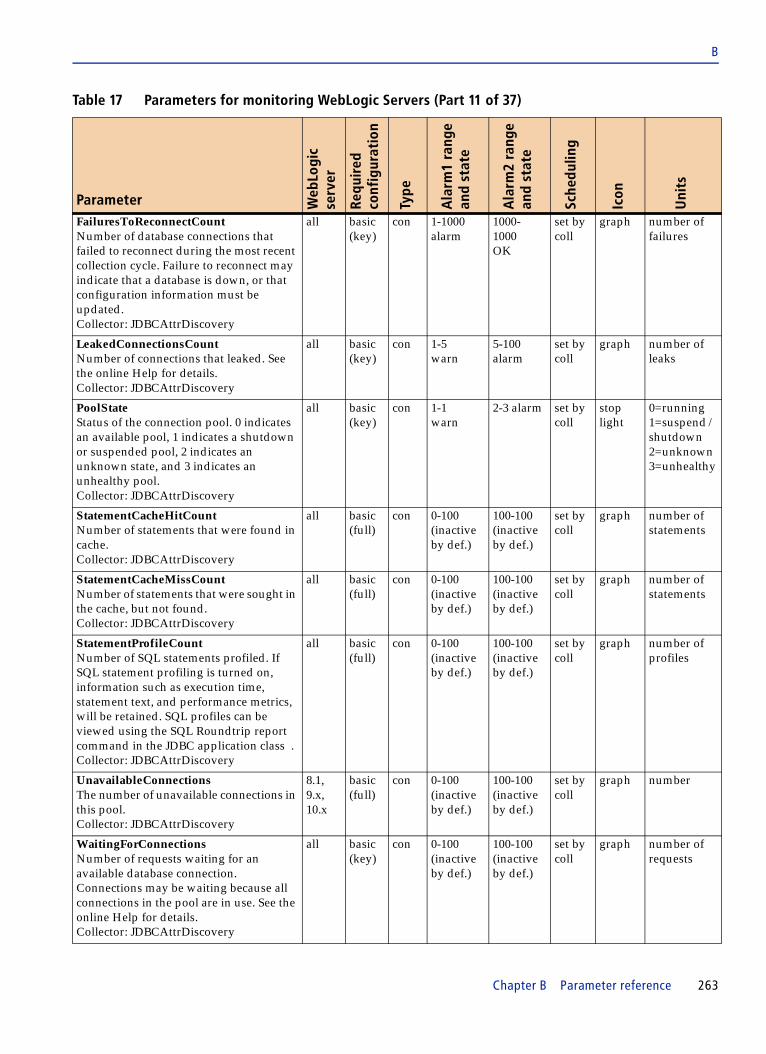
B
FailuresToReconnectCount Number of database connections that failed to reconnect during the most recent collection cycle. Failure to reconnect may indicate that a database is down, or that configuration information must be updated.Collector: JDBCAttrDiscovery
all basic (key)
con 1-1000 alarm
1000- 1000 OK
set by coll
graph number of failures
LeakedConnectionsCount Number of connections that leaked. See the online Help for details.Collector: JDBCAttrDiscovery
all basic (key)
con 1-5warn
5-100alarm
set by coll
graph number of leaks
PoolStateStatus of the connection pool. 0 indicates an available pool, 1 indicates a shutdown or suspended pool, 2 indicates an unknown state, and 3 indicates an unhealthy pool.Collector: JDBCAttrDiscovery
all basic (key)
con 1-1warn
2-3 alarm set by coll
stop light
0=running1=suspend / shutdown2=unknown3=unhealthy
StatementCacheHitCountNumber of statements that were found in cache.Collector: JDBCAttrDiscovery
all basic (full)
con 0-100 (inactive by def.)
100-100 (inactive by def.)
set by coll
graph number of statements
StatementCacheMissCount Number of statements that were sought in the cache, but not found.Collector: JDBCAttrDiscovery
all basic (full)
con 0-100 (inactive by def.)
100-100 (inactive by def.)
set by coll
graph number of statements
StatementProfileCount Number of SQL statements profiled. If SQL statement profiling is turned on, information such as execution time, statement text, and performance metrics, will be retained. SQL profiles can be viewed using the SQL Roundtrip report command in the JDBC application class .Collector: JDBCAttrDiscovery
all basic (full)
con 0-100 (inactive by def.)
100-100 (inactive by def.)
set by coll
graph number of profiles
UnavailableConnectionsThe number of unavailable connections in this pool.Collector: JDBCAttrDiscovery
8.1, 9.x, 10.x
basic (full)
con 0-100 (inactive by def.)
100-100 (inactive by def.)
set by coll
graph number
WaitingForConnectionsNumber of requests waiting for an available database connection. Connections may be waiting because all connections in the pool are in use. See the online Help for details.Collector: JDBCAttrDiscovery
all basic (key)
con 0-100 (inactive by def.)
100-100 (inactive by def.)
set by coll
graph number of requests
Table 17 Parameters for monitoring WebLogic Servers (Part 11 of 37)
Parameter Web
Logi
cse
rver
Requ
ired
conf
igur
atio
n
Type
Ala
rm1
rang
ean
d st
ate
Ala
rm2
rang
ean
d st
ate
Sche
dulin
g
Icon
Uni
ts
Chapter B Parameter reference 263

B
BEAWLS_JMS application class
HealthStatusThe health status of the JMS service.Collector: JMSAttrDiscovery
all basic (key)
con 1-3 warn
3-3 alarm
set by coll
stop light
0=ok 1=warn 2=critical 3=failed/ unknown
JMSConnectionsCurrentCount The current number of connections to this WebLogic Server.Collector: JMSAttrDiscovery
all basic (key)
con 0-100 (inactive by def.)
100-100 (inactive by def.)
set by coll
graph number
JMSServersCurrentCount The current number of JMS servers that are deployed on this WebLogic Server instance.Collector: JMSAttrDiscovery
all basic (key)
con 0-100 (inactive by def.)
100-100 (inactive by def.)
set by coll
graph number
BEAWLS_JMS_DESTINATION application class
BytesCurrentCount The current number of bytes stored in the destination, not including the pending bytes.Collector: JMSAttrDiscovery
all basic (key)
con 0-100 (inactive by def.)
100-100 (inactive by def.)
set by coll
graph number
BytesPendingCount The number of pending bytes (bytes for pending messages) stored in the destination.Collector: JMSAttrDiscovery
all basic (key)
con 0-100 (inactive by def.)
100-100 (inactive by def.)
set by coll
graph number
BytesReceivedCount The number of bytes received in this destination since the last reset.Collector: JMSAttrDiscovery
all basic (full)
con 0-100 (inactive by def.)
100-100 (inactive by def.)
set by coll
graph number
BytesThresholdTime The amount of time in the threshold condition since the last reset.Collector: JMSAttrDiscovery
all basic (full)
con 0-100 (inactive by def.)
100-100 (inactive by def.)
set by coll
graph msec
ConsumersCurrentCount The current number of consumers accessing this destination.Collector: JMSAttrDiscovery
all basic (full)
con 0-100 (inactive by def.)
100-100 (inactive by def.)
set by coll
graph number
MessagesCurrentCount The current number of messages in the destination. This does not include pending messages.Collector: JMSAttrDiscovery
all basic (key)
con 0-100 (inactive by def.)
100-100 (inactive by def.)
set by coll
graph number
Table 17 Parameters for monitoring WebLogic Servers (Part 12 of 37)
Parameter Web
Logi
cse
rver
Requ
ired
conf
igur
atio
n
Type
Ala
rm1
rang
ean
d st
ate
Ala
rm2
rang
ean
d st
ate
Sche
dulin
g
Icon
Uni
ts
264 PATROL for BEA WebLogic User Guide
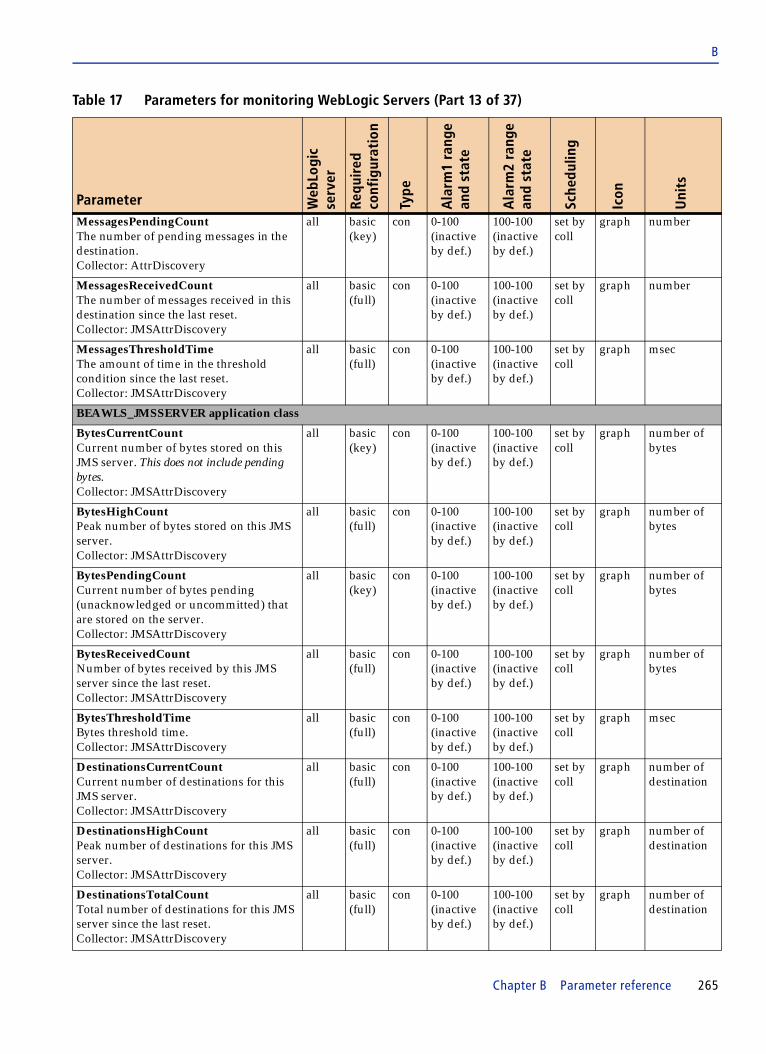
B
MessagesPendingCount The number of pending messages in the destination.Collector: AttrDiscovery
all basic (key)
con 0-100 (inactive by def.)
100-100 (inactive by def.)
set by coll
graph number
MessagesReceivedCount The number of messages received in this destination since the last reset.Collector: JMSAttrDiscovery
all basic (full)
con 0-100 (inactive by def.)
100-100 (inactive by def.)
set by coll
graph number
MessagesThresholdTime The amount of time in the threshold condition since the last reset.Collector: JMSAttrDiscovery
all basic (full)
con 0-100 (inactive by def.)
100-100 (inactive by def.)
set by coll
graph msec
BEAWLS_JMSSERVER application class
BytesCurrentCount Current number of bytes stored on this JMS server. This does not include pending bytes.Collector: JMSAttrDiscovery
all basic (key)
con 0-100 (inactive by def.)
100-100 (inactive by def.)
set by coll
graph number of bytes
BytesHighCount Peak number of bytes stored on this JMS server.Collector: JMSAttrDiscovery
all basic (full)
con 0-100 (inactive by def.)
100-100 (inactive by def.)
set by coll
graph number of bytes
BytesPendingCount Current number of bytes pending (unacknowledged or uncommitted) that are stored on the server.Collector: JMSAttrDiscovery
all basic (key)
con 0-100 (inactive by def.)
100-100 (inactive by def.)
set by coll
graph number of bytes
BytesReceivedCount Number of bytes received by this JMS server since the last reset.Collector: JMSAttrDiscovery
all basic (full)
con 0-100 (inactive by def.)
100-100 (inactive by def.)
set by coll
graph number of bytes
BytesThresholdTimeBytes threshold time.Collector: JMSAttrDiscovery
all basic (full)
con 0-100 (inactive by def.)
100-100 (inactive by def.)
set by coll
graph msec
DestinationsCurrentCountCurrent number of destinations for this JMS server.Collector: JMSAttrDiscovery
all basic (full)
con 0-100 (inactive by def.)
100-100 (inactive by def.)
set by coll
graph number of destination
DestinationsHighCountPeak number of destinations for this JMS server.Collector: JMSAttrDiscovery
all basic (full)
con 0-100 (inactive by def.)
100-100 (inactive by def.)
set by coll
graph number of destination
DestinationsTotalCount Total number of destinations for this JMS server since the last reset.Collector: JMSAttrDiscovery
all basic (full)
con 0-100 (inactive by def.)
100-100 (inactive by def.)
set by coll
graph number of destination
Table 17 Parameters for monitoring WebLogic Servers (Part 13 of 37)
Parameter Web
Logi
cse
rver
Requ
ired
conf
igur
atio
n
Type
Ala
rm1
rang
ean
d st
ate
Ala
rm2
rang
ean
d st
ate
Sche
dulin
g
Icon
Uni
ts
Chapter B Parameter reference 265
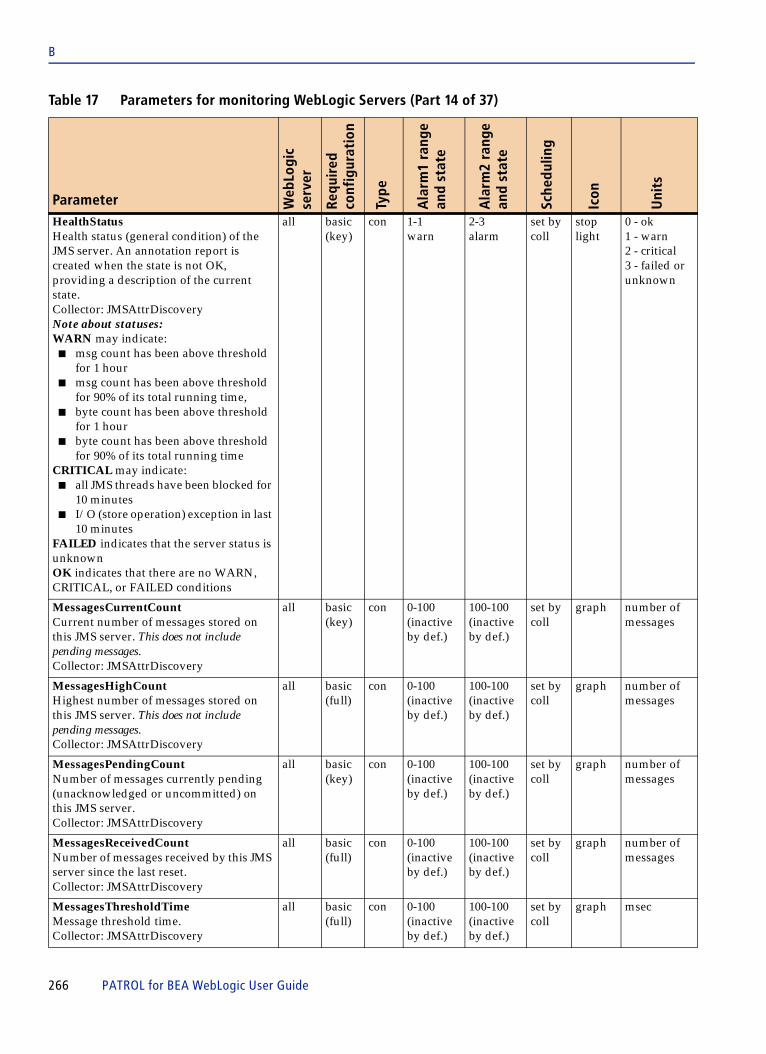
B
HealthStatusHealth status (general condition) of the JMS server. An annotation report is created when the state is not OK, providing a description of the current state.Collector: JMSAttrDiscoveryNote about statuses:WARN may indicate:
■ msg count has been above threshold for 1 hour
■ msg count has been above threshold for 90% of its total running time,
■ byte count has been above threshold for 1 hour
■ byte count has been above threshold for 90% of its total running time
CRITICAL may indicate:■ all JMS threads have been blocked for
10 minutes■ I/O (store operation) exception in last
10 minutesFAILED indicates that the server status is unknownOK indicates that there are no WARN, CRITICAL, or FAILED conditions
all basic (key)
con 1-1warn
2-3alarm
set by coll
stop light
0 - ok1 - warn2 - critical3 - failed or unknown
MessagesCurrentCount Current number of messages stored on this JMS server. This does not include pending messages.Collector: JMSAttrDiscovery
all basic (key)
con 0-100 (inactive by def.)
100-100 (inactive by def.)
set by coll
graph number of messages
MessagesHighCount Highest number of messages stored on this JMS server. This does not include pending messages.Collector: JMSAttrDiscovery
all basic (full)
con 0-100 (inactive by def.)
100-100 (inactive by def.)
set by coll
graph number of messages
MessagesPendingCountNumber of messages currently pending (unacknowledged or uncommitted) on this JMS server.Collector: JMSAttrDiscovery
all basic (key)
con 0-100 (inactive by def.)
100-100 (inactive by def.)
set by coll
graph number of messages
MessagesReceivedCount Number of messages received by this JMS server since the last reset.Collector: JMSAttrDiscovery
all basic (full)
con 0-100 (inactive by def.)
100-100 (inactive by def.)
set by coll
graph number of messages
MessagesThresholdTime Message threshold time.Collector: JMSAttrDiscovery
all basic (full)
con 0-100 (inactive by def.)
100-100 (inactive by def.)
set by coll
graph msec
Table 17 Parameters for monitoring WebLogic Servers (Part 14 of 37)
Parameter Web
Logi
cse
rver
Requ
ired
conf
igur
atio
n
Type
Ala
rm1
rang
ean
d st
ate
Ala
rm2
rang
ean
d st
ate
Sche
dulin
g
Icon
Uni
ts
266 PATROL for BEA WebLogic User Guide

B
SessionPoolsCurrentCountCurrent number of session pools running on this JMS server. Collector: AttrDiscovery
all basic (full)
con 0-100 (inactive by def.)
100-100 (inactive by def.)
set by coll
graph number of pools
SessionPoolsHighCount Peak number of session pools running on this JMS server.Collector: JMSAttrDiscovery
all basic (full)
con 0-100 (inactive by def.)
100-100 (inactive by def.)
set by coll
graph number of pools
SessionPoolsTotalCountTotal number of session pools on this JMS server.Collector: JMSAttrDiscovery
all basic (full)
con 0-100 (inactive by def.)
100-100 (inactive by def.)
set by coll
graph number of pools
BEAWLS_JROCKIT application class
AllProcAvgLoadDisplays a snapshot of the average load of all processors in the host computer. A value of 100 percent reflects a fully loaded systems with no idle time while 0 reflects an idle system with no load.Collector: MiscAttrDiscovery
8.1, 9.x, 10.x
basic (key)
con 0-100 (inactive by def.)
100-100 (inactive by def.)
set by coll
graph percent
JVMProcLoadDisplays a snapshot of the load for this JRockit JVM processor. Collector: MiscAttrDiscovery
8.1, 9.x, 10.x
basic (key)
con 0-100 (inactive by def.)
100-100 (inactive by def.)
set by coll
graph percent
FreePhyMemoryAmount of physical memory (MB) that is currently free on the host computer.Collector: MiscAttrDiscovery
8.1, 9.x, 10.x
basic (key)
con 0-100 (inactive by def.)
100-100 (inactive by def.)
set by coll
graph MB
NumGCCountNumber of garbage collection runs during the past garbage collection cycle.Collector: MiscAttrDiscovery
8.1, 9.x, 10.x
basic (key)
con 0-100 (inactive by def.)
100-100 (inactive by def.)
set by coll
graph number
LastGCDurationTime spent on the last garbage collection cycle, in milliseconds.Collector: MiscAttrDiscovery
8.1, 9.x, 10.x
basic (key)
con 0-100 (inactive by def.)
100-100 (inactive by def.)
set by coll
graph msec
BEAWLS_JVMPROFILER application class
AvgGCTimeAverage time spent on garbage collection during the previous polling cycle. Collector: _JVMProfColl
7.0, 8.1
prof con 0-100 (inactive by def.)
100-100 (inactive by def.)
set by coll
graph sec
CPUUsageTotal amount of CPU time used by the Java Virtual Machine.Collector: _JVMProfColl
7.0, 8.1
prof con 0-100 (inactive by def.)
100-100 (inactive by def.)
set by coll
graph sec
Table 17 Parameters for monitoring WebLogic Servers (Part 15 of 37)
Parameter Web
Logi
cse
rver
Requ
ired
conf
igur
atio
n
Type
Ala
rm1
rang
ean
d st
ate
Ala
rm2
rang
ean
d st
ate
Sche
dulin
g
Icon
Uni
ts
Chapter B Parameter reference 267

B
GCCountNumber of times that garbage collection was performed during the previous polling cycle.Collector: _JVMProfColl
7.0, 8.1
prof con 0-100 (inactive by def.)
100-100 (inactive by def.)
set by coll
graph number of times
GCTimeAmount of CPU usage spent on garbage collection during the previous polling cycle.Collector: _JVMProfColl
7.0, 8.1
prof con 0-100 (inactive by def.)
100-100 (inactive by def.)
set by coll
graph sec
MemoryUsageTotal amount of real memory allocated by the Java Virtual Machine.Collector: _JVMProfColl
7.0, 8.1
prof con 1-100 (inactive by def.)
100-100 (inactive by def.)
set by coll
graph MB
ThreadHighestCPUTimeHighest CPU time used by one JVM thread in seconds (this parameter can be used as an indicator to look for stuck threads).Collector: _JVMProfColl
7.0, 8.1
prof con 0-100 (inactive by def.)
100-100 (inactive by def.)
set by coll
graph seconds
TotalHeapSizeTotal amount of memory allocated to heap.Collector: _JVMProfColl
7.0, 8.1
prof con 0-100 (inactive by def.)
100-100 (inactive by def.)
set by coll
graph MB
TotalThreadCPUTotal CPU time used by all JVM threads.Collector: _JVMProfColl
7.0, 8.1
prof con 0-100 (inactive by def.)
100-100 (inactive by def.)
set by coll
graph seconds
UsedHeapByAllThreadsTotal amount of memory used by all thread objects during the previous collection cycle.Collector: _JVMProfColl
7.0, 8.1
prof con 0-100 (inactive by def.)
100-100 (inactive by def.)
set by coll
graph MB
VMemoryUsageTotal virtual memory used by the Java Virtual Machine.Collector: _JVMProfColl
7.0, 8.1
prof con 0-100 (inactive by def.)
100-100 (inactive by def.)
set by coll
graph MB
BEAWLS_J2EE_APPS application class
LongestEJBAvgRespTimeThe longest EJB average response time of this application; advanced monitoring setting and byte-code instrumentation is requiredCollector: _EJBRespColl
8.1 inst con 0-100 (inactive by def.)
100-100 (inactive by def.)
set by coll
graph msec
Table 17 Parameters for monitoring WebLogic Servers (Part 16 of 37)
Parameter Web
Logi
cse
rver
Requ
ired
conf
igur
atio
n
Type
Ala
rm1
rang
ean
d st
ate
Ala
rm2
rang
ean
d st
ate
Sche
dulin
g
Icon
Uni
ts
268 PATROL for BEA WebLogic User Guide

B
LongestWebAppAvgRespTimeThe longest web application average response time of this application; advanced monitoring setting and byte-code instrumentation is required Collector: _WebAppRespColl
8.1 inst con 0-100 (inactive by def.)
100-100 (inactive by def.)
set by coll
graph msec
NumMaxCompReqMinConst The maximum number of completed requests due to the minimum threads constraint of all the configured workload managers for this application. Collector: J2EEAttrDiscovery
8.1, 9.x, 10.x
basic (key)
con 0-100 (inactive by def.)
100-100 (inactive by def.)
set by coll
graph Number
NumMaxDeferredRequests The number of requests that are denied a thread for execution due to the maximum th reads constraint of all the configured workload managers for this application. Collector: J2EEAttrDiscovery
8.1, 9.x, 10.x
basic (key)
con 0-100 (inactive by def.)
100-100 (inactive by def.)
set by coll
graph Number
NumMaxExeReqMaxConst The maximum number of requests that are currently executing due to the maximum threads constraint of all the configured workload managers for this application. Collector: J2EEAttrDiscovery
8.1, 9.x, 10.x
basic (key)
con 0-100 (inactive by def.)
100-100 (inactive by def.)
set by coll
graph Number
NumMaxExeReqMinConst The maximum number of requests that are currently executing due to the minimum threads constraint of all the configured workload managers for this application. Collector: J2EEAttrDiscovery
8.1, 9.x, 10.x
basic (key)
con 0-100 (inactive by def.)
100-100 (inactive by def.)
set by coll
graph Number
NumMaxMustRunCount The number of requests that must be executed to satisfy the minimum threads constraint of all the configured workload managers for this application. Collector: J2EEAttrDiscovery
8.1, 9.x, 10.x
basic (key)
con 0-100 (inactive by def.)
100-100 (inactive by def.)
set by coll
graph Number
NumMaxPendingReq The maximum number of pending requests waiting for an available thread due to the minimum threads constraint of all the configured workload managers for this application. Collector: J2EEAttrDiscovery
8.1, 9.x, 10.x
basic (key)
con 0-100 (inactive by def.)
100-100 (inactive by def.)
set by coll
graph Number
Table 17 Parameters for monitoring WebLogic Servers (Part 17 of 37)
Parameter Web
Logi
cse
rver
Requ
ired
conf
igur
atio
n
Type
Ala
rm1
rang
ean
d st
ate
Ala
rm2
rang
ean
d st
ate
Sche
dulin
g
Icon
Uni
ts
Chapter B Parameter reference 269

B
BEAWLS_LOCAL_MANAGED application class
_EJBRespCollCollector parameter for EJB instrumentation and reporting.
all inst coll none none 2 min text none
_JVMProfCollCollector parameter for JVM profiling and reporting.
all prof coll none none 3 min text none
_MethodProfCollCollector parameter for method level profiling and reporting.
all meth coll none none 5 min text none
_SQLRespCollCollector parameter for SQL instrumentation and reporting.
all inst coll none none 2 min text none
_WebAppRespCollCollector parameter to get servlet response data.
all inst coll none none 2 min text none
ConnectionStatus WebLogic server client connection status, based on ping and connect commands. An alarm condition means that the Patrol collector cannot connect to the server, usually because WebLogic is not running. Restarting WebLogic will usually clear an alarm within two minutes.Collector: AttrDiscovery
all basic (key)
con 2-3 warn
3-4alarm
set by coll
stop light
1=OK2=suspend4=offline
ForeignFragmentsDroppedNumber of foreign fragments dropped. A foreign fragment is one that originates in a domain or cluster using a different multicast address. Collector: AttrDiscovery
all basic (full)
con 0-100 (inactive by def.)
100-100 (inactive by def.)
set by coll
graph number of fragments
FragmentsReceivedNumber of multicast messages received on this server from within the cluster. Collector: AttrDiscovery
all basic (full)
con 0-100 (inactive by def.)
100-100 (inactive by def.)
set by coll
graph number of fragments
FragmentsSentNumber of multicast messages sent from this server onto the cluster. Collector: AttrDiscovery
all basic (full)
con 0-100 (inactive by def.)
100-100 (inactive by def.)
set by coll
graph number of fragments
Table 17 Parameters for monitoring WebLogic Servers (Part 18 of 37)
Parameter Web
Logi
cse
rver
Requ
ired
conf
igur
atio
n
Type
Ala
rm1
rang
ean
d st
ate
Ala
rm2
rang
ean
d st
ate
Sche
dulin
g
Icon
Uni
ts
270 PATROL for BEA WebLogic User Guide

B
FreeHeapPercentage of allocated JVM heap space currently available for use.Use this parameter in conjunction with HeapUsed, which shows the percentage of heap in use. Additional information about JVM heap space configuration and utilization is provided by parameters in the BEAWLS_JVMPROFILER application class and in the InfoBoxes for the BEAWLS_SERVER, BEAWLS_ MANAGED, and BEAWLS_ LOCAL_ MANAGED application class es. Collector: AttrDiscovery
all basic (full)
con 0-5 alarm
5-10warn
set by coll
graph percent
HealthStatusHealth status (general condition) of the managed server.Collector: AttrDiscovery
all basic (key)
con 1-1warn
2-3alarm
set by coll
stop light
0=OK1=warn2=critical3=failed or unknown
HeapUsed Percent of Java heap space in use.Use this parameter in conjunction with FreeHeap, which shows the percentage of heap available.Additional information about JVM heap space configuration and utilization is provided by parameters in the BEAWLS_JVMPROFILER application class and in the InfoBoxes for the BEAWLS_SERVER, BEAWLS_ MANAGED, and BEAWLS_ LOCAL_ MANAGED application class es. Collector: AttrDiscovery
all basic (full)
con 90-95 warn
95-100 alarm
set by coll
graph percent
MulticastMsgLostTotal number of incoming multicast messages onto the cluster that were lost according to the server. Collector: AttrDiscovery
all basic (key)
con 5-100 warn
100-100 alarm
set by coll
graph number of messages
NumOpenConnectionsNumber of connections to this server.Collector: AttrDiscovery
all basic (key)
con 0-100 (inactive by def.)
100-100 (inactive by def.)
set by coll
graph number of connects
NumOpenSocketsNumber of open sockets on the managed server.Collector: AttrDiscovery
all basic (key)
con 0-100 (inactive by def.)
100-100 (inactive by def.)
set by coll
graph number of sockets
Table 17 Parameters for monitoring WebLogic Servers (Part 19 of 37)
Parameter Web
Logi
cse
rver
Requ
ired
conf
igur
atio
n
Type
Ala
rm1
rang
ean
d st
ate
Ala
rm2
rang
ean
d st
ate
Sche
dulin
g
Icon
Uni
ts
Chapter B Parameter reference 271

B
ResentRequestsNumber of state-change (delta) messages that were resent because a receiving server in the cluster missed a message. Collector: AttrDiscovery
all basic (key)
con 5-100 (warn)
100-100 (inactive by def.)
set by coll
graph number of messages
BEAWLS_LOG application class
LogDiskFreeSpace Percentage of free space on the disk where the log file is located.
all basic (key)
std 0-100 (inactive by def.)
100-100 (inactive by def.)
600 sec gauge percent
LogEventNumber of events matching sniff pattern since the sniff pattern was registered for the log file. Only the first occurrence of a sniff pattern in a line is counted. Parameter annotation reflects the text that matched the registered pattern. This parameter is inactive if sniffing has not been defined.
all basic (key)
std 0-100 (inactive by def.)
100-100 (inactive by def.)
600 sec graph number of events
LogIncreaseRateRate of increase in the log file size since the last collection cycle. Set the alarm range to flag abnormally fast increases in log file size.
all basic (key)
std 0-100 (inactive by def.)
100-100 (inactive by def.)
600 sec graph percent
BEAWLS_MANAGED application class
ConnectionStatus WebLogic server client connection status, based on ping and connect commands. An alarm condition means that the Patrol collector cannot connect to the server, usually because WebLogic is not running. Restarting WebLogic will usually clear an alarm within two minutes.Collector: AttrDiscovery
all basic (full)
con 2-3warn
3-4alarm
set by coll
stop light
1=OK2=suspend4=offline
ForeignFragmentsDroppedNumber of foreign fragments dropped. A foreign fragment is one that originates in a domain or cluster using a different multicast address. Collector: AttrDiscovery
all basic (full)
con 0-100 (inactive by def.)
100-100 (inactive by def.)
set by coll
graph number of fragments
FragmentsReceivedNumber of multicast messages received on this server from within the cluster. Collector: AttrDiscovery
all basic (full)
con 0-100 (inactive by def.)
100-100 (inactive by def.)
set by coll
graph number of fragments
Table 17 Parameters for monitoring WebLogic Servers (Part 20 of 37)
Parameter Web
Logi
cse
rver
Requ
ired
conf
igur
atio
n
Type
Ala
rm1
rang
ean
d st
ate
Ala
rm2
rang
ean
d st
ate
Sche
dulin
g
Icon
Uni
ts
272 PATROL for BEA WebLogic User Guide

B
FragmentsSentNumber of multicast messages sent from this server onto the cluster. Collector: AttrDiscovery
all basic (full)
con 0-100 (inactive by def.)
100-100 (inactive by def.)
set by coll
graph number of fragments
FreeHeapPercentage of allocated JVM heap space currently available for use.Additional information about JVM heap space configuration and utilization is provided by parameters in the BEAWLS_JVMPROFILER application class and in the InfoBoxes for the BEAWLS_SERVER, BEAWLS_ MANAGED, and BEAWLS_ LOCAL_ MANAGED application class es. Collector: AttrDiscovery
all basic (full)
con 0-5 alarm
5-10warn
set by coll
graph percent
HealthStatusHealth status (general condition) of the managed server.Collector: AttrDiscovery
all basic (full)
con 1-1warn
2-3alarm
set by coll
stop light
0=OK1=warn2=critical3=failed or unknown
HeapUsed Percent of Java heap space in use.Additional information about JVM heap space configuration and utilization is provided by parameters in the BEAWLS_JVMPROFILER application class and in the InfoBoxes for the BEAWLS_SERVER, BEAWLS_ MANAGED, and BEAWLS_ LOCAL_ MANAGED application class es. Collector: AttrDiscovery
all basic (full)
con 90-95warn
95-100alarm
set by coll
graph percent
MulticastMsgLostTotal number of incoming multicast messages that were lost according to the server. Collector: AttrDiscovery
all basic (full)
con 5-100 (warn)
100-100 (inactive by def.)
set by coll
graph number of messages
NumOpenConnectionsNumber of connections to this server.Collector: AttrDiscovery
all basic (full)
con 0-100 (inactive by def.)
100-100 (inactive by def.)
set by coll
graph number of connects
NumOpenSocketsNumber of open sockets on the managed server.Collector: AttrDiscovery
all basic (full)
con 0-100 (inactive by def.)
100-100 (inactive by def.)
set by coll
graph number of sockets
Table 17 Parameters for monitoring WebLogic Servers (Part 21 of 37)
Parameter Web
Logi
cse
rver
Requ
ired
conf
igur
atio
n
Type
Ala
rm1
rang
ean
d st
ate
Ala
rm2
rang
ean
d st
ate
Sche
dulin
g
Icon
Uni
ts
Chapter B Parameter reference 273

B
ResentRequestsNumber of state-change (delta) messages that were resent because a receiving server in the cluster missed a message. Collector: AttrDiscovery
all basic (full)
con 5-100 (warn)
100-100 (inactive by def.)
set by coll
graph number of messages
BEAWLS_MESSAGING_BRIDGE application class
StateState of the Messaging Bridge. An annotation report is created when the state is not Active, providing a description of the current state.Collector: JMSAttrDiscovery
8.1,9.x, 10.x
basic (key)
con 1-2 (alarm)
inactive set by coll
stop light
0=active1=inactive2=unknown
BEAWLS_OS application class
_ProcColl Collector parameter to discover performance information at the local operating system level and to populate parameter data in the OS application class.
all basic (key)
coll 0-100 (inactive by def.)
100-100 (inactive by def.)
5 min text none
ActiveProcesses List of currently active JVM processes running on a monitored server. Collector: _ProcColl
all basic (key)
con 0-100 (inactive by def.)
100-100 (inactive by def.)
set by coll
text none
NodeStatusIndicates the availability of the node manager Java process. This parameter will be inactive if the node manager is not configured for the monitored domain under this machine. Collector: _ProcColl
all basic (key)
con 0-100 (inactive by def.)
100-100 (inactive by def.)
set by coll
stop light
0=OK, 1=Offline
NumActiveJVMProcessesNumber of currently active JVM processes running on a monitored server. Collector: _ProcColl
all basic (key)
con 0-100 (inactive by def.)
100-100 (inactive by def.)
set by coll
graph number of processes
NumHighCpuJVMProcessesNumber of processes on the monitored server that exceed the threshold established by the system administrator to define a “high CPU” process.Collector: _ProcColl
all basic (key)
con 0-1 (inactive by def.)
1-1 (inactive by def.)
set by coll
graph number of processes
ServerJVMsCpuUtilPercentage of a machine’s CPU utilization attributed to a WebLogic server JVM.Collector: _ProcColl
all basic (key)
con 0-100 (inactive by def.)
100-100 (inactive by def.)
set by coll
gauge percentage
Table 17 Parameters for monitoring WebLogic Servers (Part 22 of 37)
Parameter Web
Logi
cse
rver
Requ
ired
conf
igur
atio
n
Type
Ala
rm1
rang
ean
d st
ate
Ala
rm2
rang
ean
d st
ate
Sche
dulin
g
Icon
Uni
ts
274 PATROL for BEA WebLogic User Guide

B
ServerJVMsMemUsageTotal memory being used by a monitored WebLogic server’s JVM processes.Collector: _ProcColl
all basic (key)
con 0-100 (inactive by def.)
100-100 (inactive by def.)
set by coll
graph megabytes
BEAWLS_PROBE application class
AvgConnTime Average connection time for a client to connect through the WebLogic Server to the applications. See the Help for recommended alarm ranges.
all basic (key)
std 9500- 9999warn
9999- 10000alarm
180 sec graph msec
AvgPingTimeAverage ping time. This indicates the average time needed to query the status of a server.
all basic (key)
std 60-90warn
90-1000alarm
120 sec graph msec
BEAWLS_PROF_METHOD application class
AvgCPUTime Average CPU time used by methods during the previous polling cycle.Collector: _MethodProfColl
7.0, 8.1
meth con 0-100 (inactive by def.)
100-100 (inactive by def.)
set by coll
graph seconds
CPUTime Total CPU time used by methods during the previous polling cycle.Collector: _MethodProfColl
7.0, 8.1
meth con 0-100 (inactive by def.)
100-100 (inactive by def.)
set by coll
graph seconds
ExecutionTime Total method execution time during the previous polling cycle.Collector: _MethodProfColl
7.0, 8.1
meth con 0-100 (inactive by def.)
100-100 (inactive by def.)
set by coll
graph seconds
BEAWLS_SAF application class
HealthStatusStatus of the Store-and-Forward (SAF) service.Collector: JMSAttrDiscovery
9.x, 10.x
basic (key)
con 1-1 (warn)
2-3(alarm)
set by coll
stop light
0=OK1=warn2=critical3=failed/unknown
BEAWLS_SAFAGENT application class
BytesCurrentCount Current number of bytes. This does not include pending bytes.Collector: JMSAttrDiscovery
9.x, 10.x
basic (key)
con 0-100 (inactive by def.)
100-100 (inactive by def.)
set by coll
graph number of bytes
BytesHighCount Peak number of bytes since the last reset.Collector: JMSAttrDiscovery
9.x, 10.x
basic (full)
con 0-100 (inactive by def.)
100-100 (inactive by def.)
set by coll
graph number of bytes
BytesPendingCount Current number of bytes pending (beyond the current number of bytes).Collector: JMSAttrDiscovery
9.x, 10.x
basic (key)
con 0-100 (inactive by def.)
100-100 (inactive by def.)
set by coll
graph number of bytes
Table 17 Parameters for monitoring WebLogic Servers (Part 23 of 37)
Parameter Web
Logi
cse
rver
Requ
ired
conf
igur
atio
n
Type
Ala
rm1
rang
ean
d st
ate
Ala
rm2
rang
ean
d st
ate
Sche
dulin
g
Icon
Uni
ts
Chapter B Parameter reference 275
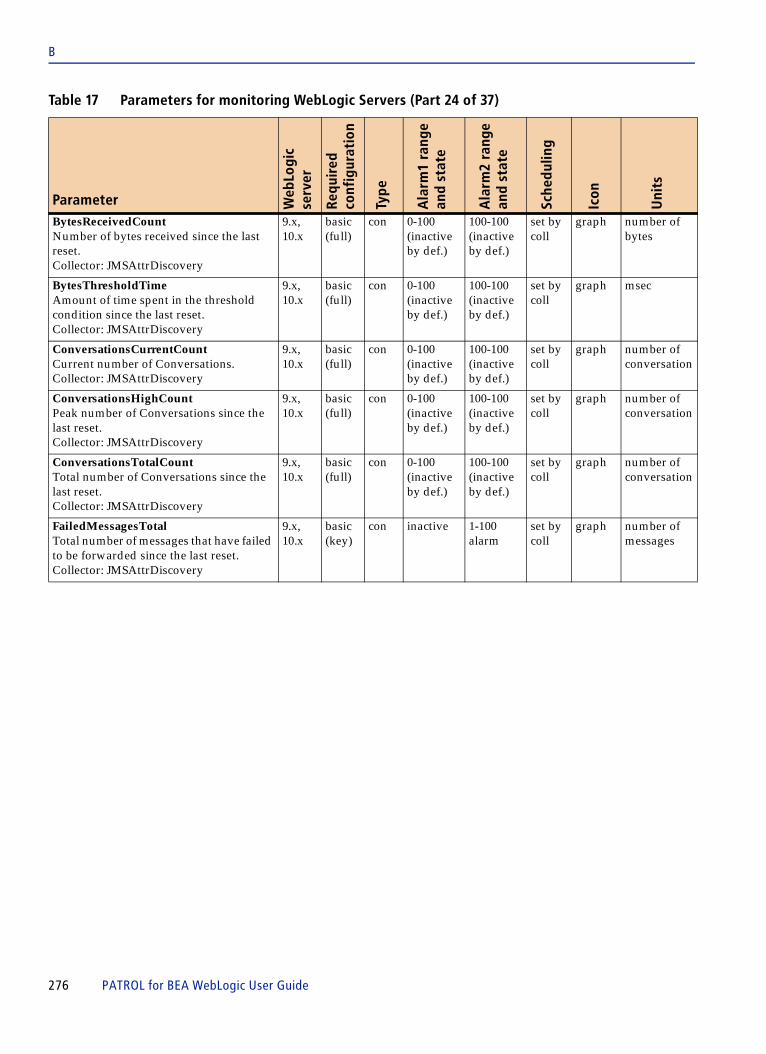
B
BytesReceivedCount Number of bytes received since the last reset.Collector: JMSAttrDiscovery
9.x, 10.x
basic (full)
con 0-100 (inactive by def.)
100-100 (inactive by def.)
set by coll
graph number of bytes
BytesThresholdTimeAmount of time spent in the threshold condition since the last reset.Collector: JMSAttrDiscovery
9.x, 10.x
basic (full)
con 0-100 (inactive by def.)
100-100 (inactive by def.)
set by coll
graph msec
ConversationsCurrentCountCurrent number of Conversations.Collector: JMSAttrDiscovery
9.x, 10.x
basic (full)
con 0-100 (inactive by def.)
100-100 (inactive by def.)
set by coll
graph number of conversation
ConversationsHighCountPeak number of Conversations since the last reset.Collector: JMSAttrDiscovery
9.x, 10.x
basic (full)
con 0-100 (inactive by def.)
100-100 (inactive by def.)
set by coll
graph number of conversation
ConversationsTotalCount Total number of Conversations since the last reset.Collector: JMSAttrDiscovery
9.x, 10.x
basic (full)
con 0-100 (inactive by def.)
100-100 (inactive by def.)
set by coll
graph number of conversation
FailedMessagesTotalTotal number of messages that have failed to be forwarded since the last reset.Collector: JMSAttrDiscovery
9.x, 10.x
basic (key)
con inactive 1-100alarm
set by coll
graph number of messages
Table 17 Parameters for monitoring WebLogic Servers (Part 24 of 37)
Parameter Web
Logi
cse
rver
Requ
ired
conf
igur
atio
n
Type
Ala
rm1
rang
ean
d st
ate
Ala
rm2
rang
ean
d st
ate
Sche
dulin
g
Icon
Uni
ts
276 PATROL for BEA WebLogic User Guide

B
HealthStatusHealth status (general condition) of the SAF Service. An annotation report is created when the state is not OK, providing a description of the current state. (Supported only for WebLogic Server 9.x and 10.x.)Collector: JMSAttrDiscoveryNote about statuses:WARN may indicate:
■ msg count has been above threshold for 1 hour
■ msg count has been above threshold for 90% of its total running time,
■ byte count has been above threshold for 1 hour
■ byte count has been above threshold for 90% of its total running time
CRITICAL may indicate:■ all SAF threads have been blocked for
10 minutes■ I/O (store operation) exception in last
10 minutesFAILED indicates that the server status is unknownOK indicates that there are no WARN, CRITICAL, or FAILED conditions
9.x, 10.x
basic (key)
con 1-1warn
2-3alarm
set by coll
stop light
0 - ok1 - warn2 - critical3 - failed or unknown
MessagesCurrentCount Current number of messages. This includes pending messages.Collector: JMSAttrDiscovery
9.x, 10.x
basic (key)
con 0-100 (inactive by def.)
100-100 (inactive by def.)
set by coll
graph number of messages
MessagesHighCount Peak number of messages since the last reset.Collector: JMSAttrDiscovery
9.x, 10.x
basic (full)
con 0-100 (inactive by def.)
100-100 (inactive by def.)
set by coll
graph number of messages
MessagesPendingCountNumber of pending messages (beyond the current number of messages). A pending message has either been sent in a transaction and not committed, or forwarded but not acknowledged.Collector: JMSAttrDiscovery
9.x, 10.x
basic (key)
con 0-100 (inactive by def.)
100-100 (inactive by def.)
set by coll
graph number of messages
MessagesReceivedCount Number of messages received since the last reset.Collector: JMSAttrDiscovery
9.x, 10.x
basic (full)
con 0-100 (inactive by def.)
100-100 (inactive by def.)
set by coll
graph number of messages
Table 17 Parameters for monitoring WebLogic Servers (Part 25 of 37)
Parameter Web
Logi
cse
rver
Requ
ired
conf
igur
atio
n
Type
Ala
rm1
rang
ean
d st
ate
Ala
rm2
rang
ean
d st
ate
Sche
dulin
g
Icon
Uni
ts
Chapter B Parameter reference 277

B
MessagesThresholdTime Amount of time spent in the threshold condition since the last reset.Collector: JMSAttrDiscovery
9.x, 10.x
basic (full)
con 0-100 (inactive by def.)
100-100 (inactive by def.)
set by coll
graph msec
RemoteEndpointsCurrentCountCurrent number of remote endpoints to which this SAF agent has been storing and forwarding messages. Collector: AttrDiscovery
9.x, 10.x
basic (full)
con 0-100 (inactive by def.)
100-100 (inactive by def.)
set by coll
graph number of remote endpoints
RemoteEndpointsHighCount Peak number of remote endpoints to which this SAF agent has been storing and forwarding messages since last reset.Collector: JMSAttrDiscovery
9.x, 10.x
basic (full)
con 0-100 (inactive by def.)
100-100 (inactive by def.)
set by coll
graph number of remote endpoints
RemoteEndpointsTotalCountTotal number of remote endpoints to which this SAF agent has been storing and forwarding messages since last reset.Collector: JMSAttrDiscovery
9.x, 10.x
basic (full)
con 0-100 (inactive by def.)
100-100 (inactive by def.)
set by coll
graph number of remote endpoints
BEAWLS_SERVER application class
_EJBRespCollCollector parameter for EJB instrumentation and reporting.
all inst coll none none 120 sec text none
_JVMProfCollCollector parameter for JVM profiling and reporting.
all prof coll none none 180 sec text none
_MethodProfCollCollector parameter for method level profiling and reporting.
all meth coll none none 300 sec text none
_SQLRespCollCollector parameter for SQL instrumentation and reporting.
all inst coll none none 2 min text none
_WebAppRespCollCollector parameter to get servlet response data.
all inst coll none none 120 sec text none
AttrDiscovery Collector parameter to discover server configuration attributes.
all basic (full)
coll none none 2 min text none
CheckNotificationCollector parameter that checks JMX notification log and creates notification messages and events for PATROL Event Manager.
all basic (full)
coll none none 10 sec text none
Table 17 Parameters for monitoring WebLogic Servers (Part 26 of 37)
Parameter Web
Logi
cse
rver
Requ
ired
conf
igur
atio
n
Type
Ala
rm1
rang
ean
d st
ate
Ala
rm2
rang
ean
d st
ate
Sche
dulin
g
Icon
Uni
ts
278 PATROL for BEA WebLogic User Guide
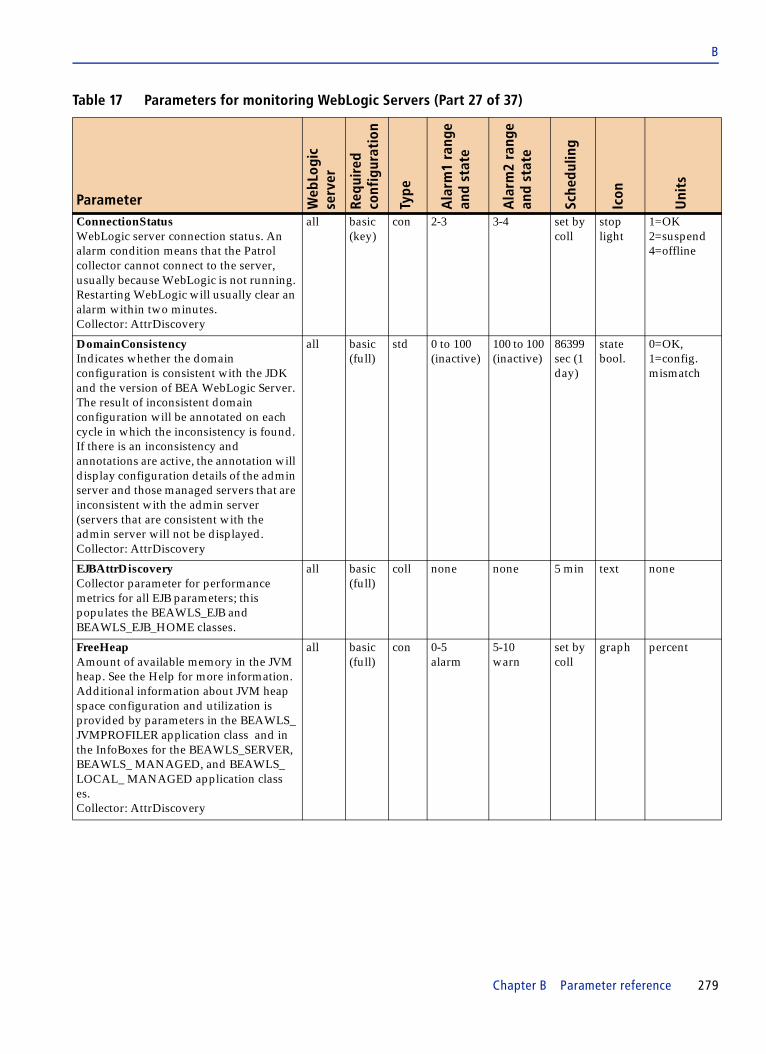
B
ConnectionStatus WebLogic server connection status. An alarm condition means that the Patrol collector cannot connect to the server, usually because WebLogic is not running. Restarting WebLogic will usually clear an alarm within two minutes.Collector: AttrDiscovery
all basic (key)
con 2-3 3-4 set by coll
stop light
1=OK2=suspend4=offline
DomainConsistencyIndicates whether the domain configuration is consistent with the JDK and the version of BEA WebLogic Server. The result of inconsistent domain configuration will be annotated on each cycle in which the inconsistency is found. If there is an inconsistency and annotations are active, the annotation will display configuration details of the admin server and those managed servers that are inconsistent with the admin server (servers that are consistent with the admin server will not be displayed. Collector: AttrDiscovery
all basic (full)
std 0 to 100 (inactive)
100 to 100 (inactive)
86399 sec (1 day)
state bool.
0=OK, 1=config. mismatch
EJBAttrDiscoveryCollector parameter for performance metrics for all EJB parameters; this populates the BEAWLS_EJB and BEAWLS_EJB_HOME classes.
all basic (full)
coll none none 5 min text none
FreeHeapAmount of available memory in the JVM heap. See the Help for more information.Additional information about JVM heap space configuration and utilization is provided by parameters in the BEAWLS_JVMPROFILER application class and in the InfoBoxes for the BEAWLS_SERVER, BEAWLS_ MANAGED, and BEAWLS_ LOCAL_ MANAGED application class es. Collector: AttrDiscovery
all basic (full)
con 0-5 alarm
5-10warn
set by coll
graph percent
Table 17 Parameters for monitoring WebLogic Servers (Part 27 of 37)
Parameter Web
Logi
cse
rver
Requ
ired
conf
igur
atio
n
Type
Ala
rm1
rang
ean
d st
ate
Ala
rm2
rang
ean
d st
ate
Sche
dulin
g
Icon
Uni
ts
Chapter B Parameter reference 279

B
HealthStatusHealth status (general condition) of the server.Collector: AttrDiscoveryNote about statuses:WARN may indicate:
■ memory is too low■ capacity of the Execute Queue
exceeded its threshold■ number of open sockets exceeded its
thresholdCRITICAL may indicate stuck execute threadsFAILED indicates that the server status is unknownOK indicates that there are no WARN, CRITICAL, or FAILED conditions
all basic (key)
con 1-1warn
2-3alarm
set by coll
stop light
0 - ok1 - warn2 - critical3 - failed
HeapUsed Percentage of Java heap space used in use. This reflects memory used by both applications and the WebLogic Server. See the online Help for details.Additional information about JVM heap space configuration and utilization is provided by parameters in the BEAWLS_JVMPROFILER application class and in the InfoBoxes for the BEAWLS_SERVER, BEAWLS_ MANAGED, and BEAWLS_ LOCAL_ MANAGED application class es. Collector: AttrDiscovery
all basic (full)
con 90-95 95-100 set by coll
graph percent
J2EEAttrDiscovery Collector parameter for J2EE parameters; populates the classes BEAWLS_EJB_HOME, BEAWLS_J2EE_APPS, and BEAWLS_ JMS_DESTINATION.
all basic (key)
coll none none 3 min text none
JDBCAttrDiscovery Collector parameter for JDBC performance metrics; this parameter populates the BEAWLS_JDBC class.
all basic (full)
coll none none 5 min text none
JMSAttrDiscovery Collector parameter for JMS parameters; this populates the classes BEAWLS_JMS, BEAWLS_JMS_SERVER, and BEAWLS_ JMS_DESTINATION.
all basic (full)
coll none none 8 min text none
LicenseStatusIndicates the number of days remaining until the BEA WebLogic license expires.
all basic (key)
std 0 to 10alarm
10 to 100warn
23 hr 59 min
graph number of days
Table 17 Parameters for monitoring WebLogic Servers (Part 28 of 37)
Parameter Web
Logi
cse
rver
Requ
ired
conf
igur
atio
n
Type
Ala
rm1
rang
ean
d st
ate
Ala
rm2
rang
ean
d st
ate
Sche
dulin
g
Icon
Uni
ts
280 PATROL for BEA WebLogic User Guide

B
LogDiscoveryCollector parameter that determines the availability of log files.
all basic (full)
coll none none 23 hr text none
MainDiscovery Discovers configuration information for a registered server and creates instances of application class es.Discovered configuration information is readable if you open the parameter. Each discovered component is listed on a line with component attributes separated by the pipe character (|). This information may be useful for debugging purposes.
all basic (full)
std none none 60 sec text none
MiscAttrDiscovery Collector parameter for JCA, JOLT, and JRockit performance metrics.
all basic (full)
coll none none 10 min text none
NumOpenConnectionsNumber of connections to this server.Collector: AttrDiscovery
all basic (key)
con 0-100 (inactive by def.)
100-100 (inactive by def.)
set by coll
graph number of connects
NumOpenSockets Number of open sockets on the server.Collector: AttrDiscovery
all basic (key)
con 0-100 (inactive by def.)
100-100 (inactive by def.)
set by coll
graph number of sockets
PatrolCollectorStatus Logon status of the Java collector for WebLogic Server. If PatrolCollectorStatus is in alarm, check the ConnectionStatus parameter; if it is also in alarm, restart WebLogic Server, otherwise, use the Update Registered Server command to verify server attributes. See the online Help.
all basic (key)
std 3-4alarm
4-4(inactive by def.)
15 sec stop light
1=OK4=failed
ServletDiscoveryCollector for servlet information.
all basic (full)
coll none none 10 min text none
WEBAPPAttrDiscovery Collector parameter for Web application and Web service performance metrics; this populates the classes BEAWLS_ WEBAPP, BEAWLS_WS_OPER, BEAWSL_WS, and BEAWLS_WS_HDL.
all basic (full)
coll none none 5 min text none
BEAWLS_SERVLET application class
ExecutionTimeAverage Average execution time for this servlet. This is calculated as ExecutionTimeTotal divided by InvocationCount.Collector: ServletDiscovery
all basic (key)
con 2000-3000 warn
3000-4000 alarm
set by coll
graph msec
Table 17 Parameters for monitoring WebLogic Servers (Part 29 of 37)
Parameter Web
Logi
cse
rver
Requ
ired
conf
igur
atio
n
Type
Ala
rm1
rang
ean
d st
ate
Ala
rm2
rang
ean
d st
ate
Sche
dulin
g
Icon
Uni
ts
Chapter B Parameter reference 281

B
ExecutionTimeHighLongest execution time for this servlet. This is the slowest run time since the servlet was created.Collector: ServletDiscovery
all basic (full)
con 0-100 (inactive by def.)
100-100 (inactive by def.)
set by coll
graph msec
ExecutionTimeLowShortest execution time for this servlet. Collector: ServletDiscovery
all basic (full)
con 0-100 (inactive by def.)
100-100 (inactive by def.)
set by coll
graph msec
ExecutionTimeTotal Total execution time for this servlet.Collector: ServletDiscovery
all basic (full)
con 4000-5000 warn
5000-8000 alarm
set by coll
graph msec
InvocationCountNumber of times a servlet has been invoked.Collector: ServletDiscovery
all basic (key)
con 4000- 6000 warn
6000- 10000 alarm
set by coll
graph number of times
BEAWLS_SERVLET_METHOD application class
AvgResponseTime Average response time for this servlet to execute.Collector: _WebAppRespColl
all inst con 4000-6000 warn
6000-8000 alarm
set by coll
graph msec
InvocationCount Number of times this servlet was invoked during the previous collection cycle.Collector: _WebAppRespColl
all inst con 4000- 6000 warn
6000- 10000 alarm
set by coll
graph number of calls
InvocationRate Frequency at which the servlet method was invoked during the previous collection cycle (number of calls per millisecond).Collector: _WebAppRespColl
all inst con 0-100 (inactive by def.)
100-100 (inactive by def.)
set by coll
graph calls per millisecond
TotalResponseTime Total response time for this servlet method during the previous collection cycle. Collector: _WebAppRespColl
all inst con 8000- 10000 warn
10000- 10000 alarm
set by coll
graph msec
BEAWLS_SETUP application class
_monitorRegisterServer Collector that discovers WebLogic instances. This runs only five times after initialization.
all basic (full)
coll none none 20 min text none
AboutThe information about the product.
all basic (full)
std 0-100 (inactive by def.)
100-100 (inactive by def.)
10 min (600 sec)
text none
Table 17 Parameters for monitoring WebLogic Servers (Part 30 of 37)
Parameter Web
Logi
cse
rver
Requ
ired
conf
igur
atio
n
Type
Ala
rm1
rang
ean
d st
ate
Ala
rm2
rang
ean
d st
ate
Sche
dulin
g
Icon
Uni
ts
282 PATROL for BEA WebLogic User Guide

B
BEAWLS_SQL application class
_SQLResponseColl Collector that discovers SQL response rate data and populates all consumer parameters for the SQL application class .
7.0, 8.1
inst coll none none 1 min text none
AvgResponseTime Average response time for this SQL statement to execute.Collector: _SQLResponseColl
7.0, 8.1
inst con 4000-6000 warn
6000-8000 alarm
set by coll
graph msec
InvocationCount Number of times this SQL was invoked during the previous collection cycle.Collector: _SQLResponseColl
7.0, 8.1
inst con 4000-6000 warn
6000- 10000 alarm
set by coll
graph number of calls
InvocationRate Frequency at which the SQL was invoked during the previous collection cycle (number of calls per millisecond).Collector: _SQLResponseColl
7.0, 8.1
inst con 0-100 (inactive by def.)
100-100 (inactive by def.)
set by coll
graph calls per millisecond
TotalResponseTime Total response time for this SQL during the previous collection cycle. Collector: _SQLResponseColl
7.0, 8.1
inst con 8000- 10000 warn
10000- 16000 alarm
set by coll
graph msec
BEAWLS_THREADPOOL
HealthStatus Server Thread Pool health status Collector: AttrDiscovery
9.x, 10.x
basic (key)
con 2-3 inactive
1-1 WARN
set by coll
stop light
0=OK 1=WARN 2=CRITICAL 3=FAILED/UNKNOWN
HoggingThreadCnt The number of threads being hogged (monopolized) by a request. Collector: AttrDiscovery
9.x, 10.x
basic (key)
con 0-100 (inactive)
100-100 (inactive)
set by coll
graph Number
NumCompletedRequest The number of completed requests in the priority queue. Collector: AttrDiscovery
9.x, 10.x
basic (key)
con 0-100 (inactive)
100-100 (inactive)
set by coll
graph Number
NumExecThreadIdle The number of idle threads in the pool. Collector: AttrDiscovery
9.x, 10.x
basic (full)
con 0-100 (inactive)
100-100 (inactive)
set by coll
graph Number
NumPendingUserReq The number of pending user requests in the priority queue. Collector: AttrDiscovery
9.x, 10.x
basic (key)
con 0-100 (inactive)
100-100 (inactive)
set by coll
graph Number
Table 17 Parameters for monitoring WebLogic Servers (Part 31 of 37)
Parameter Web
Logi
cse
rver
Requ
ired
conf
igur
atio
n
Type
Ala
rm1
rang
ean
d st
ate
Ala
rm2
rang
ean
d st
ate
Sche
dulin
g
Icon
Uni
ts
Chapter B Parameter reference 283

B
NumStandbyThread The number of threads in the standby pool. Collector: AttrDiscovery
9.x, 10.x
basic (full)
con 0-100 (inactive)
100-100 (inactive)
set by coll
graph Number
QueueLength The number of pending requests in the priority pool. Collector: AttrDiscovery
9.x, 10.x
basic (full)
con 0-100 (inactive)
100-100 (inactive)
set by coll
graph Number
ReqThroughput The number of requests completed per second. Collector: AttrDiscovery
9.x, 10.x
basic (full)
con 0-100 (inactive)
100-100 (inactive)
set by coll
graph Number
BEAWLS_TUXEDO_CONNECTOR
ServiceStatus WebLogic Tuxedo Connector service status Collector: MiscAttrDiscovery
9.1, 10.x
basic (key)
con 1-1warn
2-3alarm
set by coll
stop light
0=Available1=Suspend.2=Unavail.3=Unknown
BEAWLS_WEBAPP application class
AvgResponseTime Average response time for this web application to execute.Collector: _WebAppRespColl
all inst con 4000-6000 warn
6000-8000 alarm
set by coll
graph msec
InvocationCount Number of times this web application was invoked during the previous collection cycle.Collector: _WebAppRespColl
all inst con 4000-6000 warn
6000- 10000 alarm
set by coll
graph number of calls
InvocationRate Frequency at which the web application was invoked during the previous collection cycle (number of calls per millisecond).Collector: _WebAppRespColl
all inst con 0-100 (inactive by def.)
100-100 (inactive by def.)
set by coll
graph calls per millisecond
LongestServletAvgRespTime Average response time of the slowest servlet in this web application.Collector: _WebAppRespColl
all inst con 4000-6000 warn
6000-8000 alarm
set by coll
graph msec
LongestServletTotalRespTime Longest total response time for any given servlet in a web application.Collector: _WebAppRespColl
all inst con 8000- 10000 warn
10000- 160000 alarm
set by coll
graph msec
MostInvocationServlet Highest number of servlet invocations over a user-selected time range. Collector: _WebAppRespColl
all inst con 4000- 6000 warn
6000- 10000 alarm
set by coll
graph number of calls
Table 17 Parameters for monitoring WebLogic Servers (Part 32 of 37)
Parameter Web
Logi
cse
rver
Requ
ired
conf
igur
atio
n
Type
Ala
rm1
rang
ean
d st
ate
Ala
rm2
rang
ean
d st
ate
Sche
dulin
g
Icon
Uni
ts
284 PATROL for BEA WebLogic User Guide

B
OpenSessionsCountNumber of sessions currently open for this application or component.Collector: WEBAPPAttrDiscovery
all basic (key)
con 0-100 (inactive by def.)
100-100 (inactive by def.)
set by coll
graph number of sessions
OpenSessionsHighCountHigh water mark of concurrently open sessions. Collector: WEBAPPAttrDiscovery
all basic (full)
con 0-100 (inactive by def.)
100-100 (inactive by def.)
set by coll
graph number of sessions
TotalOpenedSessions Total number of open sessions.Collector: WEBAPPAttrDiscovery
all basic (full)
con 0-100 (inactive by def.)
100-100 (inactive by def.)
set by coll
graph number of sessions
TotalResponseTime Total response time for this web application to execute.Collector: _WebAppRespColl
all inst con 8000- 10000 warn
10000- 16000 alarm
set by coll
graph msec
BEAWLS_WORKLOAD application class
NumCompletedReq The number of requests that have been processed.Collector: J2EEAttrDiscovery
9.x, 10.x
basic (key)
con 0-100 (inactive by def.)
100-100 (inactive by def.)
set by coll
graph number
NumDeferredReqs The number of requests that were denied a thread for execution because the constraint on the maximum number of concurrent threads that can be allocated was exceeded. Collector: J2EEAttrDiscovery
9.x, 10.x
basic (key)
con 0-100 (inactive by def.)
100-100 (inactive by def.)
set by coll
graph number
NumMustRun The number of requests that must be executed to satisfy the constraint.Collector: J2EEAttrDiscovery
9.x, 10.x
basic (key)
con 0-100 (inactive by def.)
100-100 (inactive by def.)
set by coll
graph number
NumPendingReq The number of waiting requests in the queue for this application.Collector: J2EEAttrDiscovery
9.x, 10.x
basic (key)
con 0-100 (inactive by def.)
100-100 (inactive by def.)
set by coll
graph number
BEAWLS_WS application class
HighestHdlTotReqFail The highest number of total failed request including SOAP faults, errors, and terminations.Collector: WEBAPPAttrDiscovery
8.1, 9.x, 10.x
basic (key)
con 0-100 (inactive by def.)
100-100 (inactive by def.)
set by coll
graph number
HighestHdlTotRespFail The highest number of total failed responses including SOAP faults, errors, and terminations.Collector: WEBAPPAttrDiscovery
8.1, 9.x, 10.x
basic (key)
con 0-100 (inactive by def.)
100-100 (inactive by def.)
set by coll
graph number
Table 17 Parameters for monitoring WebLogic Servers (Part 33 of 37)
Parameter Web
Logi
cse
rver
Requ
ired
conf
igur
atio
n
Type
Ala
rm1
rang
ean
d st
ate
Ala
rm2
rang
ean
d st
ate
Sche
dulin
g
Icon
Uni
ts
Chapter B Parameter reference 285
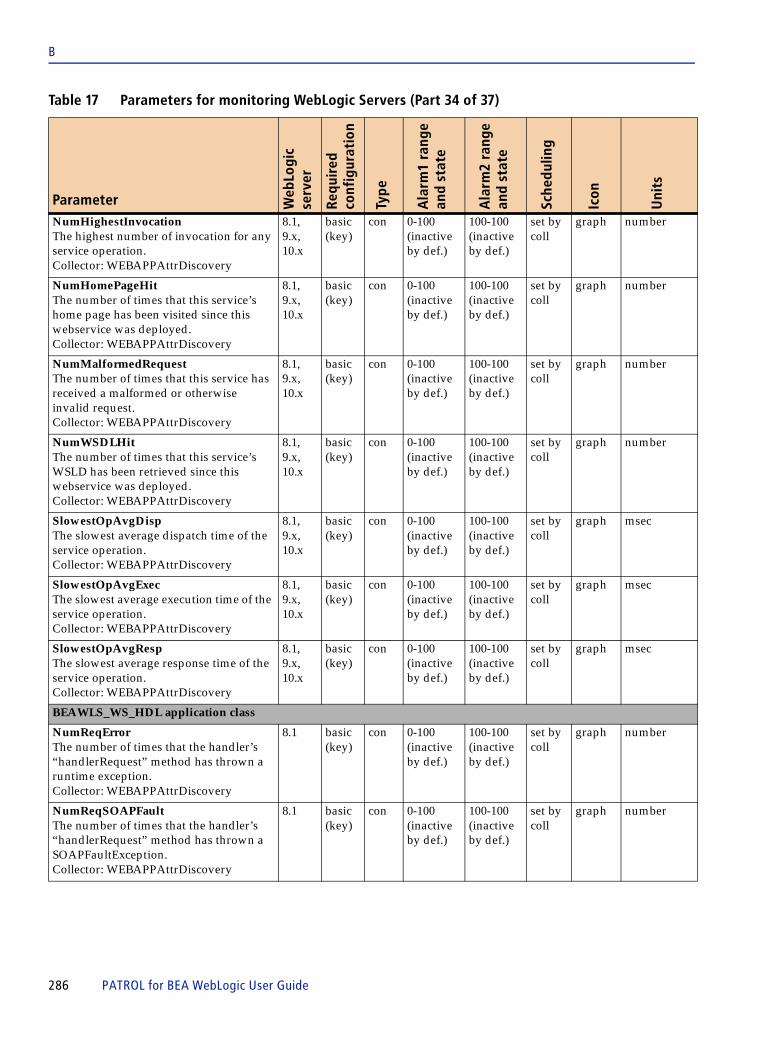
B
NumHighestInvocation The highest number of invocation for any service operation.Collector: WEBAPPAttrDiscovery
8.1, 9.x, 10.x
basic (key)
con 0-100 (inactive by def.)
100-100 (inactive by def.)
set by coll
graph number
NumHomePageHit The number of times that this service’s home page has been visited since this webservice was deployed.Collector: WEBAPPAttrDiscovery
8.1, 9.x, 10.x
basic (key)
con 0-100 (inactive by def.)
100-100 (inactive by def.)
set by coll
graph number
NumMalformedRequest The number of times that this service has received a malformed or otherwise invalid request.Collector: WEBAPPAttrDiscovery
8.1, 9.x, 10.x
basic (key)
con 0-100 (inactive by def.)
100-100 (inactive by def.)
set by coll
graph number
NumWSDLHitThe number of times that this service’s WSLD has been retrieved since this webservice was deployed.Collector: WEBAPPAttrDiscovery
8.1, 9.x, 10.x
basic (key)
con 0-100 (inactive by def.)
100-100 (inactive by def.)
set by coll
graph number
SlowestOpAvgDisp The slowest average dispatch time of the service operation.Collector: WEBAPPAttrDiscovery
8.1, 9.x, 10.x
basic (key)
con 0-100 (inactive by def.)
100-100 (inactive by def.)
set by coll
graph msec
SlowestOpAvgExec The slowest average execution time of the service operation.Collector: WEBAPPAttrDiscovery
8.1, 9.x, 10.x
basic (key)
con 0-100 (inactive by def.)
100-100 (inactive by def.)
set by coll
graph msec
SlowestOpAvgResp The slowest average response time of the service operation.Collector: WEBAPPAttrDiscovery
8.1, 9.x, 10.x
basic (key)
con 0-100 (inactive by def.)
100-100 (inactive by def.)
set by coll
graph msec
BEAWLS_WS_HDL application class
NumReqErrorThe number of times that the handler’s “handlerRequest” method has thrown a runtime exception.Collector: WEBAPPAttrDiscovery
8.1 basic (key)
con 0-100 (inactive by def.)
100-100 (inactive by def.)
set by coll
graph number
NumReqSOAPFaultThe number of times that the handler’s “handlerRequest” method has thrown a SOAPFaultException.Collector: WEBAPPAttrDiscovery
8.1 basic (key)
con 0-100 (inactive by def.)
100-100 (inactive by def.)
set by coll
graph number
Table 17 Parameters for monitoring WebLogic Servers (Part 34 of 37)
Parameter Web
Logi
cse
rver
Requ
ired
conf
igur
atio
n
Type
Ala
rm1
rang
ean
d st
ate
Ala
rm2
rang
ean
d st
ate
Sche
dulin
g
Icon
Uni
ts
286 PATROL for BEA WebLogic User Guide

B
NumReqTerminationThe number of times that the handler’s “handlerRequest” method has returned false.Collector: WEBAPPAttrDiscovery
8.1 basic (key)
con 0-100 (inactive by def.)
100-100 (inactive by def.)
set by coll
graph number
NumRespErrorThe number of times that the handler’s “handlerResponse” method has thrown a runtime exception.Collector: WEBAPPAttrDiscovery
8.1 basic (key)
con 0-100 (inactive by def.)
100-100 (inactive by def.)
set by coll
graph number
NumRespSOAPFaultThe SOAPFaultException that was most recently thrown by the handler’s “handlerResponse” method, or null if none has been thrown.Collector: WEBAPPAttrDiscovery
8.1 basic (key)
con 0-100 (inactive by def.)
100-100 (inactive by def.)
set by coll
graph number
NumRespTerminationThe number of times that the handler’s “handlerResponse” method has returned false.Collector: WEBAPPAttrDiscovery
8.1 basic (key)
con 0-100 (inactive by def.)
100-100 (inactive by def.)
set by coll
graph number
BEAWLS_WS_OPER application class
AvgDispTimeThe average amount of time spent dispatching a single message to this operation.Collector: WEBAPPAttrDiscovery
8.1, 9.x, 10.x
basic (key)
con 0-100 (inactive by def.)
100-100 (inactive by def.)
set by coll
graph msec
AvgExecTimeThe average amount of time spent on a single execution of this operation.Collector: WEBAPPAttrDiscovery
8.1, 9.x, 10.x
basic (key)
con 0-100 (inactive by def.)
100-100 (inactive by def.)
set by coll
graph msec
AvgRespTimeThe average amount of time spent sending a single response from this operation.Collector: WEBAPPAttrDiscovery
8.1, 9.x, 10.x
basic (key)
con 0-100 (inactive by def.)
100-100 (inactive by def.)
set by coll
graph msec
HandlerReqErrorCountThe number of handler’s request method error count.Collector: WEBAPPAttrDiscovery
8.1, 9.x, 10.x
basic (key)
con 0-100 (inactive by def.)
100-100 (inactive by def.)
set by coll
graph number
HandlerRespErrorCountThe number of the handler’s response method error count.Collector: WEBAPPAttrDiscovery
8.1, 9.x, 10.x
basic (key)
con 0-100 (inactive by def.)
100-100 (inactive by def.)
set by coll
graph number
Table 17 Parameters for monitoring WebLogic Servers (Part 35 of 37)
Parameter Web
Logi
cse
rver
Requ
ired
conf
igur
atio
n
Type
Ala
rm1
rang
ean
d st
ate
Ala
rm2
rang
ean
d st
ate
Sche
dulin
g
Icon
Uni
ts
Chapter B Parameter reference 287

B
HighestDispTimeThe largest amount of time spent dispatching a single message to this operation.Collector: WEBAPPAttrDiscovery
8.1, 9.x, 10.x
basic (full)
con 0-100 (inactive by def.)
100-100 (inactive by def.)
set by coll
graph msec
HighestExecTimeThe largest amount of time spent on a single execution of this operation.Collector: WEBAPPAttrDiscovery
8.1, 9.x, 10.x
basic (full)
con 0-100 (inactive by def.)
100-100 (inactive by def.)
set by coll
graph msec
HighestRespTimeThe largest amount of time spent sending a single response from this operation.Collector: WEBAPPAttrDiscovery
8.1, 9.x, 10.x
basic (full)
con 0-100 (inactive by def.)
100-100 (inactive by def.)
set by coll
graph msec
LowestDispTimeThe smallest amount of time spent dispatching a single message to this operation.Collector: WEBAPPAttrDiscovery
8.1, 9.x, 10.x
basic (full)
con 0-100 (inactive by def.)
100-100 (inactive by def.)
set by coll
graph msec
LowestExecTimeThe smallest amount of time spent on a single execution of this operation.Collector: WEBAPPAttrDiscovery
8.1, 9.x, 10.x
basic (full)
con 0-100 (inactive by def.)
100-100 (inactive by def.)
set by coll
graph msec
LowestRespTimeThe smallest amount of time spent spending a single response from this operation.Collector: WEBAPPAttrDiscovery
8.1, 9.x, 10.x
basic (full)
con 0-100 (inactive by def.)
100-100 (inactive by def.)
set by coll
graph msec
NumInvocationThe number of times that this operation has been invoked since the webservice was deployed.Collector: WEBAPPAttrDiscovery
8.1, 9.x, 10.x
basic (key)
con 0-100 (inactive by def.)
100-100 (inactive by def.)
set by coll
graph number
NumRespErrorThe number of errors that were encountered sending responses from this operation.Collector: WEBAPPAttrDiscovery
8.1, 9.x, 10.x
basic (key)
con 0-100 (inactive by def.)
100-100 (inactive by def.)
set by coll
graph number
TotalDispTimeThe total time spent dispatching messages to this operation.Collector: WEBAPPAttrDiscovery
8.1, 9.x, 10.x
basic (full)
con 0-100 (inactive by def.)
100-100 (inactive by def.)
set by coll
graph msec
Table 17 Parameters for monitoring WebLogic Servers (Part 36 of 37)
Parameter Web
Logi
cse
rver
Requ
ired
conf
igur
atio
n
Type
Ala
rm1
rang
ean
d st
ate
Ala
rm2
rang
ean
d st
ate
Sche
dulin
g
Icon
Uni
ts
288 PATROL for BEA WebLogic User Guide

B
Table 18 lists descriptions and default values for parameters that monitor JMX components by using the JMX application classes.
TotalExecTimeThe total amount of time spent executing this operation.Collector: WEBAPPAttrDiscovery
8.1, 9.x, 10.x
basic (full)
con 0-100 (inactive by def.)
100-100 (inactive by def.)
set by coll
graph msec
TotalRespTimeThe total amount of time spent sending responses from this operation.Collector: WEBAPPAttrDiscovery
8.1, 9.x, 10.x
basic (full)
con 0-100 (inactive by def.)
100-100 (inactive by def.)
set by coll
graph msec
Table 18 JMX parameters when monitoring WebLogic Servers (Part 1 of 3)
Parameter Web
Logi
c se
rver
Requ
ired
conf
igur
atio
n
Type
War
ning
(Ala
rm1)
Ala
rm(A
larm
2)
Sche
dulin
g
Icon
Uni
ts
JMX_CONDITION application class
AnnotatedStatusTracks the status of a condition. The numeric value indicates the status of the condition. When the status changes or actions are taken, the graph is annotated.Collector: JMX Discoverya
all basic con 1-3 warn
3-5alarm
set by coll
stop light
flag value: 0 = OK2 = warn4 = critical
BooleanFalseCountDisplays the number of monitored MBeans for which the current value of the attribute is “false”.Collector: JMX Discoverya
all basic con 0-100 (inactive by def.)
100-100 (inactive by def.)
set by coll
graph number of MBeans
BooleanTrueCountDisplays the number of monitored MBeans for which the current value of the attribute is “true”.Collector: JMX Discoverya
all basic con 0-100 (inactive by def.)
100-100 (inactive by def.)
set by coll
graph number of MBeans
MBeanCountDisplays the number of MBeans being monitored by this condition.Collector: JMX Discoverya
all basic con 0-100 (inactive by def.)
100-100 (inactive by def.)
set by coll
graph number of MBeans
Table 17 Parameters for monitoring WebLogic Servers (Part 37 of 37)
Parameter Web
Logi
cse
rver
Requ
ired
conf
igur
atio
n
Type
Ala
rm1
rang
ean
d st
ate
Ala
rm2
rang
ean
d st
ate
Sche
dulin
g
Icon
Uni
ts
Chapter B Parameter reference 289

B
StatusCriticalCountDisplays the number of monitored MBeans for which the current status is “alarm”, as defined by notifications or attribute values. Collector: JMX Discoverya
all basic con 1-10000 alarm
10000- 10000 (OK, inactive by def.)
set by coll
graph number of MBeans
StatusOKCountDisplays the number of monitored MBeans for which the current status is “OK”, as defined by notifications or attribute values. Collector: JMX Discoverya
all basic con 0-100 (inactive by def.)
100-100 (inactive by def.)
set by coll
graph number of MBeans
StatusWarningCountDisplays the number of monitored MBeans for which the current status is “warning”, as defined by notifications or attribute values. Collector: JMX Discoverya
all basic con 1-10000 warn
10000- 10000 (OK, inactive by def.)
set by coll
graph number of MBeans
StringMatchCountDisplays the number of monitored MBeans for which the current value of the string matches the specified value. Collector: JMX Discoverya
all basic con 0-100 (inactive by def.)
100-100 (inactive by def.)
set by coll
graph number of MBeans
StringNoMatchCountDisplays the number of monitored MBeans for which the current value of the string does not match the specified value. Collector: JMX Discoverya
all basic con 0-100 (inactive by def.)
100-100 (inactive by def.)
set by coll
graph number of MBeans
ValueAverageDisplays the average attribute value across all MBeans being monitored by this condition.Collector: JMX Discoverya
all basic con 0-100 (inactive by def.)
100-100 (inactive by def.)
set by coll
graph number
ValueMaximumDisplays the highest value in any MBean being monitored by this condition.Collector: JMX Discoverya
all basic con 0-100 (inactive by def.)
100-100 (inactive by def.)
set by coll
graph number
ValueMinimumDisplays the lowest value in any MBean being monitored by this condition.Collector: JMX Discoverya
all basic con 0-100 (inactive by def.)
100-100 (inactive by def.)
set by coll
graph number
ValueSumDisplays the total value of all MBeans being monitored by this condition. Collector: JMX Discoverya
all basic con 0-100 (inactive by def.)
100-100 (inactive by def.)
set by coll
graph number
Table 18 JMX parameters when monitoring WebLogic Servers (Part 2 of 3)
Parameter Web
Logi
c se
rver
Requ
ired
conf
igur
atio
n
Type
War
ning
(Ala
rm1)
Ala
rm(A
larm
2)
Sche
dulin
g
Icon
Uni
ts
290 PATROL for BEA WebLogic User Guide

B
JMX_DOMAIN application class
MBeanCountTracks the number of MBeans registered in an MBean domain.Collector: JMX Discoverya
all basic con 0-100 (inactive by def.)
100-100 (inactive by def.)
set by coll
graph number of MBeans
JMX_MAIN application class
SetupRequiredIndicates that setup is required for the KM.Collector: JMX Discoverya
all basic con 0-100 (inactive by def.)
100-100 (inactive by def.)
set by coll
text none
JMX_SERVER application class
AvailabilityDisplays the availability of the registered server (up or down). This parameter triggers an alarm if the server is down or if the JMX client is unable to connect to the server. A value of 0 indicates a server is unavailable, a value of 1 indicates available.Collector: JMX Discoverya
all basic con 0 to 0warn
1-1(OK, inactive by def.)
set by coll
bool 0=unavail.1=available
MBeanCountDisplays the number of MBeans registered in the MBean server.Collector: JMX Discoverya
all basic con 0-100 (inactive by def.)
100-100 (inactive by def.)
set by coll
graph number of MBeans
a. JMX Discovery runs a thread that updates parameter values on a flexible schedule, as needed.
Table 18 JMX parameters when monitoring WebLogic Servers (Part 3 of 3)
Parameter Web
Logi
c se
rver
Requ
ired
conf
igur
atio
n
Type
War
ning
(Ala
rm1)
Ala
rm(A
larm
2)
Sche
dulin
g
Icon
Uni
ts
Chapter B Parameter reference 291

B
Collector-consumer dependenciesA consumer parameter depends on a collector parameter, or a standard parameter that is used as a collector, to set its value or to feed it information. If you disable a collector parameter, you also disable its corresponding consumer parameters. To update consumer parameter values, you must update its collector.
Table 19 lists the collector parameters and their dependent consumer parameters.
Consumer parameters for JMX classes are not listed because they are not based on relationships with collector parameters. JMX consumer parameters are populated on an as-needed basis using a process thread spawned by JMX discovery.
.x
Table 19 PATROL for BEA WebLogic collector-consumer dependencies (Part 1 of 15)
Consumer parameter (Application class )
_EJB
Res
pC
oll
_In
tegA
ttrD
isc
_JV
MP
rofC
oll
_Met
hod
Pro
fCol
l
Ava
ilab
leC
lust
erS
erve
rs
_Pro
cCol
l
_SQ
LR
esp
Col
l
_SQ
LR
esp
onse
Col
l
_Web
Ap
pR
esp
Col
l
Att
rDis
cove
ry
Ch
eck
Not
ific
atio
n
EJB
Att
rDis
cove
ry
J2E
EA
ttrD
isco
very
Log
Dis
cove
ry
JDB
CA
ttrD
isco
very
JMS
Att
rDis
cove
ry
Mis
cAtt
rDis
cove
ry
Por
talD
isco
very
Ser
vlet
Dis
cove
ry
WE
BA
PP
Att
rDis
cove
ry
Default poll time (h = hour, m = minute, s = second)
2 m 07 s
5 m 11 s
2 m53s
4 m43s
1 m 01 s
4 m53s
1m43s
1 m 11 s
1 m49 s
1 m53s
10 s
5 m13 s
3 m 01s
23 h
5 m 7s
7 m01s
10 m 59s
15 m 07s
9 m59s
4 m41s
ActivationCount (BEAWLS_EJB_HOME)
X
ActiveConnections (BEAWLS_JDBC)
X
ActiveConnectionsCurrentCount (BEAWLS_JCA)
X
ActiveConnectionsHighCount (BEAWLS_JCA)
X
ActiveProcesses (BEAWLS_OS) X
AliveServerCount (BEAWLS_CLUSTER)
X
AllProcAvgLoad (BEAWLS_JROCKIT)
X
AppEventErrCount (BEAWLI_INTEGRATION)
X X
AppSvcAsynErrCount (BEAWLI_INTEGRATION)
X
AppSvcAvgElapsedTime (BEAWLI_INTEGRATION)
X
292 PATROL for BEA WebLogic User Guide

B
AppSvcSynErrCount (BEAWLI_INTEGRATION)
X
AvailableClusterServers (BEAWLS_CLUSTER)
X
AvailableConnections (BEAWLS_JDBC)
X
AverageActiveUsage (BEAWLS_JCA)
X X
AvgCPUTime (BEAWLS_PROF_METHOD)
X
AvgDispTime (BEAWLS_WS_OPER)
X
AvgExecTime (BEAWLS_WS_OPER)
X
AvgGCTime (BEAWLS_JVMPROFILER)
X
AvgResponseTime (BEAWLS_DBURL)
X
AvgResponseTime (BEAWLS_EJB_HOME, BEAWLS_EJB_METHOD)
X
AvgResponseTime (BEAWLS_SERVLET_METHOD) (BEAWLS_WEBAPP)
X
AvgResponseTime (BEAWLS_SQL)
X
AvgRespTime (BEAWLS_WS_OPER)
X
BeanAccessCount (BEAWLS_EJB_HOME)
X
BeanDestroyedCount (BEAWLS_EJB_HOME)
X
BeanDestroyedRatio (BEAWLS_EJB_HOME)
X
Table 19 PATROL for BEA WebLogic collector-consumer dependencies (Part 2 of 15)
Consumer parameter (Application class )
_EJB
Res
pC
oll
_In
tegA
ttrD
isc
_JV
MP
rofC
oll
_Met
hod
Pro
fCol
l
Ava
ilab
leC
lust
erS
erve
rs
_Pro
cCol
l
_SQ
LR
esp
Col
l
_SQ
LR
esp
onse
Col
l
_Web
Ap
pR
esp
Col
l
Att
rDis
cove
ry
Ch
eck
Not
ific
atio
n
EJB
Att
rDis
cove
ry
J2E
EA
ttrD
isco
very
Log
Dis
cove
ry
JDB
CA
ttrD
isco
very
JMS
Att
rDis
cove
ry
Mis
cAtt
rDis
cove
ry
Por
talD
isco
very
Ser
vlet
Dis
cove
ry
WE
BA
PP
Att
rDis
cove
ry
Default poll time (h = hour, m = minute, s = second)
2 m 07 s
5 m 11 s
2 m53s
4 m43s
1 m 01 s
4 m53s
1m43s
1 m 11 s
1 m49 s
1 m53s
10 s
5 m13 s
3 m 01s
23 h
5 m 7s
7 m01s
10 m 59s
15 m 07s
9 m59s
4 m41s
Chapter B Parameter reference 293

B
BeanMissCount (BEAWLS_EJB_HOME)
X
BeansIdle (BEAWLS_EJB_HOME)
X
BeansInUse (BEAWLS_EJB_HOME)
X
BytesCurrentCount (BEAWLS_JMS_DESTINATION, BEAWLS_JMSSERVER, BEAWLS_SAFAGENT)
X
BytesHighCount (BEAWLS_JMSSERVER, BEAWLS_SAFAGENT)
X
BytesPendingCount (BEAWLS_JMS_DESTINATION, BEAWLS_JMSSERVER, BEAWLS_SAFAGENT)
X
BytesReceivedCount (BEAWLS_JMS_DESTINATION, BEAWLS_JMSSERVER, BEAWLS_SAFAGENT)
X
BytesThresholdTime (BEAWLS_JMS_DESTINATION, BEAWLS_JMSSERVER, BEAWLS_SAFAGENT)
X
CacheAccessCount (BEAWLS_EJB_HOME)
X
CachedBeansCurrentCount (BEAWLS_EJB_HOME)
X
CacheHitCount (BEAWLS_EJB_HOME)
X
CacheMissRatio (BEAWLS_EJB_HOME)
X
CacheMode (BEAWLP_CACHE) X
Table 19 PATROL for BEA WebLogic collector-consumer dependencies (Part 3 of 15)
Consumer parameter (Application class )
_EJB
Res
pC
oll
_In
tegA
ttrD
isc
_JV
MP
rofC
oll
_Met
hod
Pro
fCol
l
Ava
ilab
leC
lust
erS
erve
rs
_Pro
cCol
l
_SQ
LR
esp
Col
l
_SQ
LR
esp
onse
Col
l
_Web
Ap
pR
esp
Col
l
Att
rDis
cove
ry
Ch
eck
Not
ific
atio
n
EJB
Att
rDis
cove
ry
J2E
EA
ttrD
isco
very
Log
Dis
cove
ry
JDB
CA
ttrD
isco
very
JMS
Att
rDis
cove
ry
Mis
cAtt
rDis
cove
ry
Por
talD
isco
very
Ser
vlet
Dis
cove
ry
WE
BA
PP
Att
rDis
cove
ry
Default poll time (h = hour, m = minute, s = second)
2 m 07 s
5 m 11 s
2 m53s
4 m43s
1 m 01 s
4 m53s
1m43s
1 m 11 s
1 m49 s
1 m53s
10 s
5 m13 s
3 m 01s
23 h
5 m 7s
7 m01s
10 m 59s
15 m 07s
9 m59s
4 m41s
294 PATROL for BEA WebLogic User Guide

B
ConnectionDelayTime (BEAWLS_JDBC)
X
ConnectionIdleProfileCount (BEAWLS_JCA)
X
ConnectionLeakProfileCount (BEAWLS_JCA)
X
ConnectionLeakProfileCount (BEAWLS_JDBC)
X
ConnectionStatus (BEAWLS_LOCAL_MANAGED, BEAWLS_MANAGED, BEAWLS_SERVER)
X
ConsumersCurrentCount (BEAWLS_JMS_DESTINATION)
X
ConversationsCurrentCount (BEAWLS_SAFAGENT)
X
ConversationsHighCount (BEAWLS_SAFAGENT)
X
ConversationsTotalCount (BEAWLS_SAFAGENT)
X
CPUTime (BEAWLS_PROF_METHOD)
X
CPUUsage (BEAWLS_JVMPROFILER)
X
CreatedConnectionsTotalCount (BEAWLS_JCA)
X
DestinationsCurrentCount (BEAWLS_JMSSERVER)
X
DestinationsHighCount (BEAWLS_JMSSERVER)
X
DestinationsTotalCount (BEAWLS_JMSSERVER)
X
DestroyedConnectionsTotal Count (BEAWLS_JCA)
X
Table 19 PATROL for BEA WebLogic collector-consumer dependencies (Part 4 of 15)
Consumer parameter (Application class )
_EJB
Res
pC
oll
_In
tegA
ttrD
isc
_JV
MP
rofC
oll
_Met
hod
Pro
fCol
l
Ava
ilab
leC
lust
erS
erve
rs
_Pro
cCol
l
_SQ
LR
esp
Col
l
_SQ
LR
esp
onse
Col
l
_Web
Ap
pR
esp
Col
l
Att
rDis
cove
ry
Ch
eck
Not
ific
atio
n
EJB
Att
rDis
cove
ry
J2E
EA
ttrD
isco
very
Log
Dis
cove
ry
JDB
CA
ttrD
isco
very
JMS
Att
rDis
cove
ry
Mis
cAtt
rDis
cove
ry
Por
talD
isco
very
Ser
vlet
Dis
cove
ry
WE
BA
PP
Att
rDis
cove
ry
Default poll time (h = hour, m = minute, s = second)
2 m 07 s
5 m 11 s
2 m53s
4 m43s
1 m 01 s
4 m53s
1m43s
1 m 11 s
1 m49 s
1 m53s
10 s
5 m13 s
3 m 01s
23 h
5 m 7s
7 m01s
10 m 59s
15 m 07s
9 m59s
4 m41s
Chapter B Parameter reference 295

B
ElapsedTime (BEAWLI_PROCESS)
X
ExecQThroughput (BEAWLS_EXEC_QUEUE)
X
ExecuteQueueLength (BEAWLS_EXEC_QUEUE)
X
ExecutionTime (BEAWLS_PROF_METHOD)
X
ExecutionTimeAverage (BEAWLS_SERVLET)
X
ExecutionTimeHigh (BEAWLS_SERVLET)
X
ExecutionTimeLow (BEAWLS_SERVLET)
X
ExecutionTimeTotal (BEAWLS_SERVLET)
X
FailedMessagesTotal (BEAWLS_SAFAGENT)
X
FailuresToReconnectCount (BEAWLS_JDBC)
X
ForeignFragmentsDropped (BEAWLS_LOCAL_MANAGED) (BEAWLS_MANAGED)
X
FragmentsReceived (BEAWLS_LOCAL_MANAGED) (BEAWLS_MANAGED)
X
FragmentsSent (BEAWLS_LOCAL_MANAGED) (BEAWLS_MANAGED)
X
FreeConnectionsCurrentCount (BEAWLS_JCA)
X
FreeConnectionsHighCount (BEAWLS_JCA)
X
Table 19 PATROL for BEA WebLogic collector-consumer dependencies (Part 5 of 15)
Consumer parameter (Application class )
_EJB
Res
pC
oll
_In
tegA
ttrD
isc
_JV
MP
rofC
oll
_Met
hod
Pro
fCol
l
Ava
ilab
leC
lust
erS
erve
rs
_Pro
cCol
l
_SQ
LR
esp
Col
l
_SQ
LR
esp
onse
Col
l
_Web
Ap
pR
esp
Col
l
Att
rDis
cove
ry
Ch
eck
Not
ific
atio
n
EJB
Att
rDis
cove
ry
J2E
EA
ttrD
isco
very
Log
Dis
cove
ry
JDB
CA
ttrD
isco
very
JMS
Att
rDis
cove
ry
Mis
cAtt
rDis
cove
ry
Por
talD
isco
very
Ser
vlet
Dis
cove
ry
WE
BA
PP
Att
rDis
cove
ry
Default poll time (h = hour, m = minute, s = second)
2 m 07 s
5 m 11 s
2 m53s
4 m43s
1 m 01 s
4 m53s
1m43s
1 m 11 s
1 m49 s
1 m53s
10 s
5 m13 s
3 m 01s
23 h
5 m 7s
7 m01s
10 m 59s
15 m 07s
9 m59s
4 m41s
296 PATROL for BEA WebLogic User Guide

B
FreeHeap (BEAWLS_LOCAL_MANAGED) (BEAWLS_MANAGED) (BEAWLS_SERVER)
X
FreePhyMemory (BEAWLS_JROCKIT)
X
FreePoolMissRatio (BEAWLS_EJB_HOME)
X
FreePoolTimeout (BEAWLS_EJB_HOME)
X
FreePoolTimeoutRatio (BEAWLS_EJB_HOME)
X
FreePoolWaiter (BEAWLS_EJB_HOME)
X
GCCount (BEAWLS_JVMPROFILER)
X
GCTime (BEAWLS_JVMPROFILER)
X
HandlerReqErrorCount (BEAWLS_WS_OPER)
X
HandlerRespErrorCount (BEAWLS_WS_OPER)
X
HealthStatus (BEAWLS_JMS, BEAWLS_JMSSERVER, BEAWLS_LOCAL_MANAGED, BEAWLS_MANAGED, BEAWLS_SERVER, BEAWLS_THREADPOOL)
X
HealthStatus (BEAWLS_SAF, BEAWLS_SAFAGENT)
X
HeapUsed (BEAWLS_SERVER, BEAWLS_MANAGED, BEAWLS_LOCAL_MANAGED)
X
HighestDispTime (BEAWLS_WS_OPER)
X
Table 19 PATROL for BEA WebLogic collector-consumer dependencies (Part 6 of 15)
Consumer parameter (Application class )
_EJB
Res
pC
oll
_In
tegA
ttrD
isc
_JV
MP
rofC
oll
_Met
hod
Pro
fCol
l
Ava
ilab
leC
lust
erS
erve
rs
_Pro
cCol
l
_SQ
LR
esp
Col
l
_SQ
LR
esp
onse
Col
l
_Web
Ap
pR
esp
Col
l
Att
rDis
cove
ry
Ch
eck
Not
ific
atio
n
EJB
Att
rDis
cove
ry
J2E
EA
ttrD
isco
very
Log
Dis
cove
ry
JDB
CA
ttrD
isco
very
JMS
Att
rDis
cove
ry
Mis
cAtt
rDis
cove
ry
Por
talD
isco
very
Ser
vlet
Dis
cove
ry
WE
BA
PP
Att
rDis
cove
ry
Default poll time (h = hour, m = minute, s = second)
2 m 07 s
5 m 11 s
2 m53s
4 m43s
1 m 01 s
4 m53s
1m43s
1 m 11 s
1 m49 s
1 m53s
10 s
5 m13 s
3 m 01s
23 h
5 m 7s
7 m01s
10 m 59s
15 m 07s
9 m59s
4 m41s
Chapter B Parameter reference 297

B
HighestExecTime (BEAWLS_WS_OPER)
X
HighestRespTime (BEAWLS_WS_OPER)
X
HighestHdlTotReqFail (BEAWLS_WS)
X
HighestHdlTotRespFail (BEAWLS_WS)
X
HighestInvocationCount (BEAWLS_DBURL)
X
HoggingThreadCnt (BEAWLS_THREADPOOL)
X
IdleConnectionsTotalCount (BEAWLS_JCA)
X
IdleExecThreadCount (BEAWLS__EXEC_QUEUE)
X
InvocationCount (BEAWLS_EJB_HOME)
X
InvocationCount (BEAWLS_EJB_METHOD)
X
InvocationCount (BEAWLS_SERVLET)
X
InvocationCount (BEAWLS_SERVLET_METHOD)
X
InvocationCount (BEAWLS_SQL)
X
InvocationCount (BEAWLS_WEBAPP)
X
InvocationRate (BEAWLS_DBURL)
X
InvocationRate (BEAWLS_EJB_HOME)
X
InvocationRate (BEAWLS_EJB_METHOD)
X
Table 19 PATROL for BEA WebLogic collector-consumer dependencies (Part 7 of 15)
Consumer parameter (Application class )
_EJB
Res
pC
oll
_In
tegA
ttrD
isc
_JV
MP
rofC
oll
_Met
hod
Pro
fCol
l
Ava
ilab
leC
lust
erS
erve
rs
_Pro
cCol
l
_SQ
LR
esp
Col
l
_SQ
LR
esp
onse
Col
l
_Web
Ap
pR
esp
Col
l
Att
rDis
cove
ry
Ch
eck
Not
ific
atio
n
EJB
Att
rDis
cove
ry
J2E
EA
ttrD
isco
very
Log
Dis
cove
ry
JDB
CA
ttrD
isco
very
JMS
Att
rDis
cove
ry
Mis
cAtt
rDis
cove
ry
Por
talD
isco
very
Ser
vlet
Dis
cove
ry
WE
BA
PP
Att
rDis
cove
ry
Default poll time (h = hour, m = minute, s = second)
2 m 07 s
5 m 11 s
2 m53s
4 m43s
1 m 01 s
4 m53s
1m43s
1 m 11 s
1 m49 s
1 m53s
10 s
5 m13 s
3 m 01s
23 h
5 m 7s
7 m01s
10 m 59s
15 m 07s
9 m59s
4 m41s
298 PATROL for BEA WebLogic User Guide

B
InvocationRate (BEAWLS_SERVLET_METHOD)
X
InvocationRate (BEAWLS_SQL) X
InvocationRate (BEAWLS_WEBAPP)
X
JMSConnectionAlive (BEAWLS_EJB_HOME)
X
JMSConnectionsCurrentCount (BEAWLS_JMS)
X
JMSServersCurrentCount (BEAWLS_JMS)
X
JVMProcLoad (BEAWLS_JROCKIT)
X
LastGCDuration (BEAWLS_JROCKIT)
X
LeakedConnectionsCount (BEAWLS_JDBC)
X
LeakedConnectionsTotalCount (BEAWLS_JCA)
X
LockEntriesCount (BEAWLS_EJB_HOME)
X
LockManagerAccessCount (BEAWLS_EJB_HOME)
X
LockTimeoutCount (BEAWLS_EJB_HOME)
X
LockTimeoutRatio (BEAWLS_EJB_HOME)
X
LockWaiterCount (BEAWLS_EJB_HOME)
X
LockWaiterRatio (BEAWLS_EJB_HOME)
X
LongestEJBAvgRespTime (BEAWLS_EJB_HOME)
X
Table 19 PATROL for BEA WebLogic collector-consumer dependencies (Part 8 of 15)
Consumer parameter (Application class )
_EJB
Res
pC
oll
_In
tegA
ttrD
isc
_JV
MP
rofC
oll
_Met
hod
Pro
fCol
l
Ava
ilab
leC
lust
erS
erve
rs
_Pro
cCol
l
_SQ
LR
esp
Col
l
_SQ
LR
esp
onse
Col
l
_Web
Ap
pR
esp
Col
l
Att
rDis
cove
ry
Ch
eck
Not
ific
atio
n
EJB
Att
rDis
cove
ry
J2E
EA
ttrD
isco
very
Log
Dis
cove
ry
JDB
CA
ttrD
isco
very
JMS
Att
rDis
cove
ry
Mis
cAtt
rDis
cove
ry
Por
talD
isco
very
Ser
vlet
Dis
cove
ry
WE
BA
PP
Att
rDis
cove
ry
Default poll time (h = hour, m = minute, s = second)
2 m 07 s
5 m 11 s
2 m53s
4 m43s
1 m 01 s
4 m53s
1m43s
1 m 11 s
1 m49 s
1 m53s
10 s
5 m13 s
3 m 01s
23 h
5 m 7s
7 m01s
10 m 59s
15 m 07s
9 m59s
4 m41s
Chapter B Parameter reference 299

B
LongestEJBAvgRespTime (BEAWLS_J2EE_APPS)
X
LongestEJBTotalRespTime (BEAWLS_J2EE_APPS)
X
LongestServletAvgRespTime (BEAWLS_WEBAPP)
X
LongestServletTotalRespTime (BEAWLS_WEBAPP)
X
LongestSQLAvgRespTime (BEAWLS_DBURL)
X
LongestSQLTotalRespTime (BEAWLS_DBURL)
X
LongestWebAppAvgRespTime (BEAWLS_J2EE_APPS)
X
LowestDispTime (BEAWLS_WS_OPER)
X
LowestExecTime (BEAWLS_WS_OPER)
X
LowestRespTime (BEAWLS_WS_OPER)
X
MatchedConnectionsTotalCount (BEAWLS_JCA)
X
MDBStatus (BEAWLS_EJB_HOME)
X
MemoryUsage (BEAWLS_JVMPROFILER)
X
MessagesCurrentCount (BEAWLS_JMS_DESTINATION)
X
MessagesCurrentCount (BEAWLS_JMSSERVER, BEAWLS_SAFAGENT)
X
MessagesHighCount (BEAWLS_JMSSERVER, BEAWLS_SAFAGENT)
X
Table 19 PATROL for BEA WebLogic collector-consumer dependencies (Part 9 of 15)
Consumer parameter (Application class )
_EJB
Res
pC
oll
_In
tegA
ttrD
isc
_JV
MP
rofC
oll
_Met
hod
Pro
fCol
l
Ava
ilab
leC
lust
erS
erve
rs
_Pro
cCol
l
_SQ
LR
esp
Col
l
_SQ
LR
esp
onse
Col
l
_Web
Ap
pR
esp
Col
l
Att
rDis
cove
ry
Ch
eck
Not
ific
atio
n
EJB
Att
rDis
cove
ry
J2E
EA
ttrD
isco
very
Log
Dis
cove
ry
JDB
CA
ttrD
isco
very
JMS
Att
rDis
cove
ry
Mis
cAtt
rDis
cove
ry
Por
talD
isco
very
Ser
vlet
Dis
cove
ry
WE
BA
PP
Att
rDis
cove
ry
Default poll time (h = hour, m = minute, s = second)
2 m 07 s
5 m 11 s
2 m53s
4 m43s
1 m 01 s
4 m53s
1m43s
1 m 11 s
1 m49 s
1 m53s
10 s
5 m13 s
3 m 01s
23 h
5 m 7s
7 m01s
10 m 59s
15 m 07s
9 m59s
4 m41s
300 PATROL for BEA WebLogic User Guide
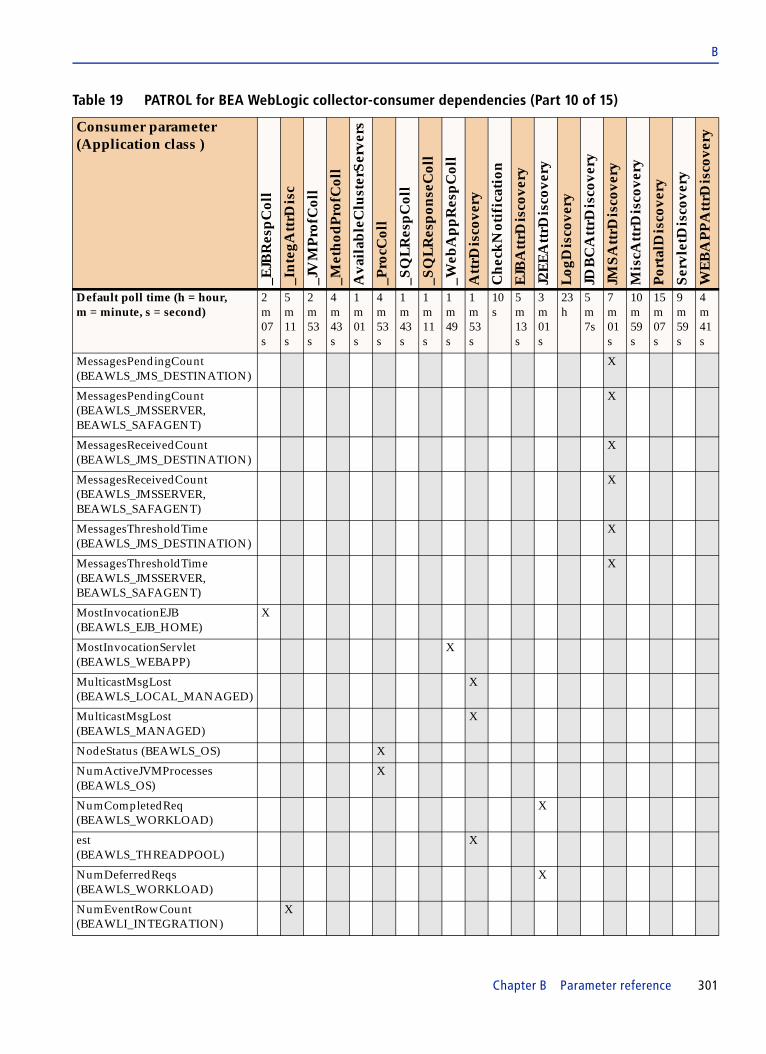
B
MessagesPendingCount (BEAWLS_JMS_DESTINATION)
X
MessagesPendingCount (BEAWLS_JMSSERVER, BEAWLS_SAFAGENT)
X
MessagesReceivedCount (BEAWLS_JMS_DESTINATION)
X
MessagesReceivedCount (BEAWLS_JMSSERVER, BEAWLS_SAFAGENT)
X
MessagesThresholdTime (BEAWLS_JMS_DESTINATION)
X
MessagesThresholdTime (BEAWLS_JMSSERVER, BEAWLS_SAFAGENT)
X
MostInvocationEJB (BEAWLS_EJB_HOME)
X
MostInvocationServlet (BEAWLS_WEBAPP)
X
MulticastMsgLost (BEAWLS_LOCAL_MANAGED)
X
MulticastMsgLost (BEAWLS_MANAGED)
X
NodeStatus (BEAWLS_OS) X
NumActiveJVMProcesses (BEAWLS_OS)
X
NumCompletedReq (BEAWLS_WORKLOAD)
X
est (BEAWLS_THREADPOOL)
X
NumDeferredReqs (BEAWLS_WORKLOAD)
X
NumEventRowCount (BEAWLI_INTEGRATION)
X
Table 19 PATROL for BEA WebLogic collector-consumer dependencies (Part 10 of 15)
Consumer parameter (Application class )
_EJB
Res
pC
oll
_In
tegA
ttrD
isc
_JV
MP
rofC
oll
_Met
hod
Pro
fCol
l
Ava
ilab
leC
lust
erS
erve
rs
_Pro
cCol
l
_SQ
LR
esp
Col
l
_SQ
LR
esp
onse
Col
l
_Web
Ap
pR
esp
Col
l
Att
rDis
cove
ry
Ch
eck
Not
ific
atio
n
EJB
Att
rDis
cove
ry
J2E
EA
ttrD
isco
very
Log
Dis
cove
ry
JDB
CA
ttrD
isco
very
JMS
Att
rDis
cove
ry
Mis
cAtt
rDis
cove
ry
Por
talD
isco
very
Ser
vlet
Dis
cove
ry
WE
BA
PP
Att
rDis
cove
ry
Default poll time (h = hour, m = minute, s = second)
2 m 07 s
5 m 11 s
2 m53s
4 m43s
1 m 01 s
4 m53s
1m43s
1 m 11 s
1 m49 s
1 m53s
10 s
5 m13 s
3 m 01s
23 h
5 m 7s
7 m01s
10 m 59s
15 m 07s
9 m59s
4 m41s
Chapter B Parameter reference 301

B
NumExecThreadIdle (BEAWLS_THREADPOOL)
X
NumGCCount (BEAWLS_JROCKIT)
X
NumHighCpuJVMProcesses (BEAWLS_OS)
X
NumHighestInvocation (BEAWLS_WS)
X
NumHomePageHit (BEAWLS_WS)
X
NumInvocation (BEAWLS_WS_OPER)
X
NumMalformedRequest (BEAWLS_WS)
X
NumMaxCompReqMinConst (BEAWLS_J2EE_APPS)
X
NumMaxDeferredRequests (BEAWLS_J2EE_APPS)
X
NumMaxExeReqMaxConst (BEAWLS_J2EE_APPS)
X
NumMaxExeReqMinConst (BEAWLS_J2EE_APPS)
X
NumMaxMustRunCount (BEAWLS_WORKLOAD)
X
NumMustRun (BEAWLS_WORKLOAD)
X
NumMaxPendingReq (BEAWLS_J2EE_APPS)
X
NumOpenConnections (BEAWLS_LOCAL_MANAGED)
X
NumOpenConnections (BEAWLS_MANAGED)
X
NumOpenConnections (BEAWLS_SERVER)
X
Table 19 PATROL for BEA WebLogic collector-consumer dependencies (Part 11 of 15)
Consumer parameter (Application class )
_EJB
Res
pC
oll
_In
tegA
ttrD
isc
_JV
MP
rofC
oll
_Met
hod
Pro
fCol
l
Ava
ilab
leC
lust
erS
erve
rs
_Pro
cCol
l
_SQ
LR
esp
Col
l
_SQ
LR
esp
onse
Col
l
_Web
Ap
pR
esp
Col
l
Att
rDis
cove
ry
Ch
eck
Not
ific
atio
n
EJB
Att
rDis
cove
ry
J2E
EA
ttrD
isco
very
Log
Dis
cove
ry
JDB
CA
ttrD
isco
very
JMS
Att
rDis
cove
ry
Mis
cAtt
rDis
cove
ry
Por
talD
isco
very
Ser
vlet
Dis
cove
ry
WE
BA
PP
Att
rDis
cove
ry
Default poll time (h = hour, m = minute, s = second)
2 m 07 s
5 m 11 s
2 m53s
4 m43s
1 m 01 s
4 m53s
1m43s
1 m 11 s
1 m49 s
1 m53s
10 s
5 m13 s
3 m 01s
23 h
5 m 7s
7 m01s
10 m 59s
15 m 07s
9 m59s
4 m41s
302 PATROL for BEA WebLogic User Guide

B
NumOpenSockets (BEAWLS_LOCAL_MANAGED)
X
NumOpenSockets (BEAWLS_MANAGED)
X
NumOpenSockets (BEAWLS_SERVER)
X
NumPendingReq (BEAWLS_WORKLOAD)
X
NumPendingUserReq (BEAWLS_THROUGHPUT)
X
NumReqError (BEAWLS_WS_HDL)
X
NumReqSOAPFault (BEAWLS_WS_HDL)
X
NumReqTermination (BEAWLS_WS_HDL)
X
NumRespError (BEAWLS_WS_HDL)
X
NumRespError (BEAWLS_WS_OPER)
X
NumRespSOAPFault (BEAWLS_WS_HDL)
X
NumRespTermination (BEAWLS_WS_HDL)
X
NumStandbyThread (BEAWLS_THREADPOOL)
X
NumTotalDeadMsg (BEAWLI_INTEGRATION)
X
NumTotalExceededSLA (BEAWLI_PROCESS)
X
NumWSDLHit (BEAWLS_WS) X
OpenSessionsCount (BEAWLS_WEBAPP)
X
Table 19 PATROL for BEA WebLogic collector-consumer dependencies (Part 12 of 15)
Consumer parameter (Application class )
_EJB
Res
pC
oll
_In
tegA
ttrD
isc
_JV
MP
rofC
oll
_Met
hod
Pro
fCol
l
Ava
ilab
leC
lust
erS
erve
rs
_Pro
cCol
l
_SQ
LR
esp
Col
l
_SQ
LR
esp
onse
Col
l
_Web
Ap
pR
esp
Col
l
Att
rDis
cove
ry
Ch
eck
Not
ific
atio
n
EJB
Att
rDis
cove
ry
J2E
EA
ttrD
isco
very
Log
Dis
cove
ry
JDB
CA
ttrD
isco
very
JMS
Att
rDis
cove
ry
Mis
cAtt
rDis
cove
ry
Por
talD
isco
very
Ser
vlet
Dis
cove
ry
WE
BA
PP
Att
rDis
cove
ry
Default poll time (h = hour, m = minute, s = second)
2 m 07 s
5 m 11 s
2 m53s
4 m43s
1 m 01 s
4 m53s
1m43s
1 m 11 s
1 m49 s
1 m53s
10 s
5 m13 s
3 m 01s
23 h
5 m 7s
7 m01s
10 m 59s
15 m 07s
9 m59s
4 m41s
Chapter B Parameter reference 303

B
OpenSessionsHighCount (BEAWLS_WEBAPP)
X
PassivationCount (BEAWLS_EJB_HOME)
X
PoolState (BEAWLS_JCA) X
PoolState (BEAWLS_JDBC) X
ProcessedMsgCount (BEAWLS_EJB_HOME)
X
ProcessThroughput (BEAWLI_PROCESS)
X
QueueLength (BEAWLS_THREADPOOL)
X
QueueLengthPercent (BEAWLS_EXEC_QUEUE)
QueueStatus (BEAWLS_EXEC_QUEUE
X
RecycledTotalCount (BEAWLS_JCA)
X
RejectedConnectionsTotalCount (BEAWLS_JCA)
X
RemoteEndpointsCurrentCount (BEAWLS_SAFAGENT)
X
RemoteEndpointsHighCount (BEAWLS_SAFAGENT)
X
RemoteEndpointsTotalCount (BEAWLS_SAFAGENT)
X
ReqThroughput (BEAWLS_THREADPOOL)
X
ResentRequests (BEAWLS_LOCAL_MANAGED, BEAWLS_MANAGED)
X
ServerJVMsCpuUtil (BEAWLS_OS)
X
Table 19 PATROL for BEA WebLogic collector-consumer dependencies (Part 13 of 15)
Consumer parameter (Application class )
_EJB
Res
pC
oll
_In
tegA
ttrD
isc
_JV
MP
rofC
oll
_Met
hod
Pro
fCol
l
Ava
ilab
leC
lust
erS
erve
rs
_Pro
cCol
l
_SQ
LR
esp
Col
l
_SQ
LR
esp
onse
Col
l
_Web
Ap
pR
esp
Col
l
Att
rDis
cove
ry
Ch
eck
Not
ific
atio
n
EJB
Att
rDis
cove
ry
J2E
EA
ttrD
isco
very
Log
Dis
cove
ry
JDB
CA
ttrD
isco
very
JMS
Att
rDis
cove
ry
Mis
cAtt
rDis
cove
ry
Por
talD
isco
very
Ser
vlet
Dis
cove
ry
WE
BA
PP
Att
rDis
cove
ry
Default poll time (h = hour, m = minute, s = second)
2 m 07 s
5 m 11 s
2 m53s
4 m43s
1 m 01 s
4 m53s
1m43s
1 m 11 s
1 m49 s
1 m53s
10 s
5 m13 s
3 m 01s
23 h
5 m 7s
7 m01s
10 m 59s
15 m 07s
9 m59s
4 m41s
304 PATROL for BEA WebLogic User Guide

B
ServerJVMsMemUsage (BEAWLS_OS)
X
SessionPoolsCurrentCount (BEAWLS_JMSSERVER)
X
SessionPoolsHighCount (BEAWLS_JMSSERVER)
X X
SessionPoolsTotalCount (BEAWLS_JMSSERVER)
X X
SlowestOpAvgDisp (BEAWLS_WS)
X
SlowestOpAvgExec (BEAWLS_WS)
X
SlowestOpAvgResp (BEAWLS_WS)
X
State (BEAWLS_MESSAGING_BRIDGE)
X
StatementCacheHitCount (BEAWLS_JDBC)
X
StatementCacheMissCount (BEAWLS_JDBC)
X
StatementProfileCount (BEAWLS_JDBC)
X
SuspendCount (BEAWLS_EJB_HOME)
X
ThreadHighestCPUTime (BEAWLS_JVMPROFILER)
X
TotalDispTime (BEAWLS_WS_OPER)
X
TotalExecTime (BEAWLS_WS_OPER)
X
TotalHeapSize (BEAWLS_JVMPROFILER)
X
TotalInvocationCount (BEAWLS_DBURL)
X
Table 19 PATROL for BEA WebLogic collector-consumer dependencies (Part 14 of 15)
Consumer parameter (Application class )
_EJB
Res
pC
oll
_In
tegA
ttrD
isc
_JV
MP
rofC
oll
_Met
hod
Pro
fCol
l
Ava
ilab
leC
lust
erS
erve
rs
_Pro
cCol
l
_SQ
LR
esp
Col
l
_SQ
LR
esp
onse
Col
l
_Web
Ap
pR
esp
Col
l
Att
rDis
cove
ry
Ch
eck
Not
ific
atio
n
EJB
Att
rDis
cove
ry
J2E
EA
ttrD
isco
very
Log
Dis
cove
ry
JDB
CA
ttrD
isco
very
JMS
Att
rDis
cove
ry
Mis
cAtt
rDis
cove
ry
Por
talD
isco
very
Ser
vlet
Dis
cove
ry
WE
BA
PP
Att
rDis
cove
ry
Default poll time (h = hour, m = minute, s = second)
2 m 07 s
5 m 11 s
2 m53s
4 m43s
1 m 01 s
4 m53s
1m43s
1 m 11 s
1 m49 s
1 m53s
10 s
5 m13 s
3 m 01s
23 h
5 m 7s
7 m01s
10 m 59s
15 m 07s
9 m59s
4 m41s
Chapter B Parameter reference 305
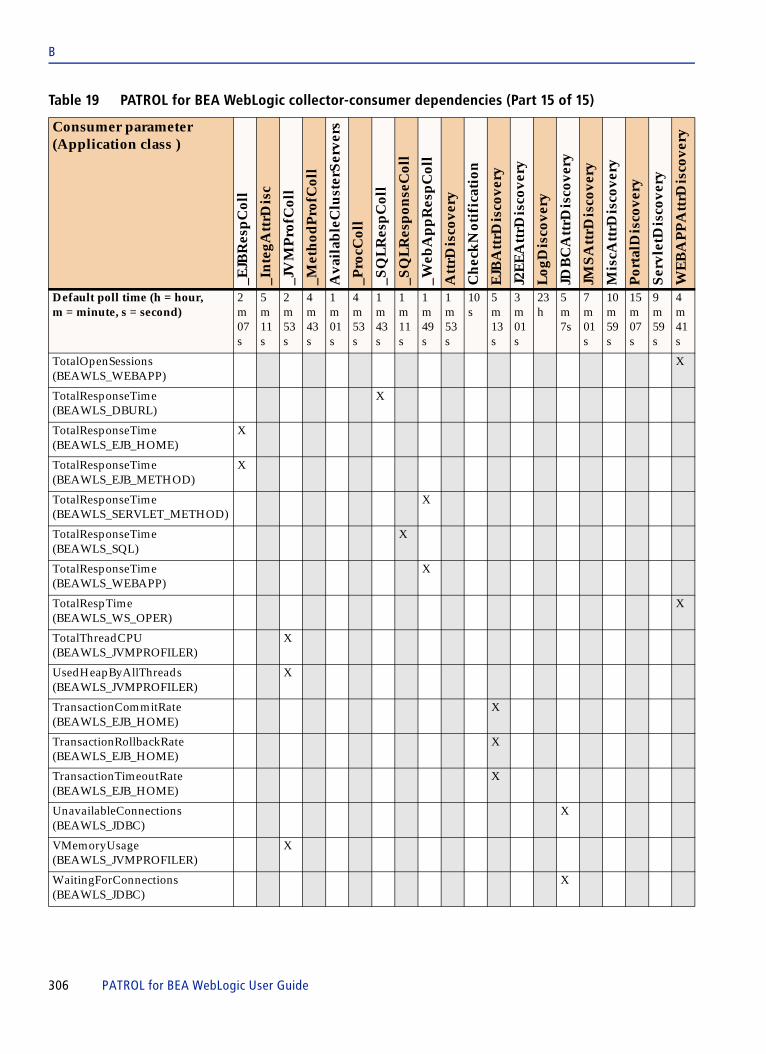
B
TotalOpenSessions (BEAWLS_WEBAPP)
X
TotalResponseTime (BEAWLS_DBURL)
X
TotalResponseTime (BEAWLS_EJB_HOME)
X
TotalResponseTime (BEAWLS_EJB_METHOD)
X
TotalResponseTime (BEAWLS_SERVLET_METHOD)
X
TotalResponseTime (BEAWLS_SQL)
X
TotalResponseTime (BEAWLS_WEBAPP)
X
TotalRespTime (BEAWLS_WS_OPER)
X
TotalThreadCPU (BEAWLS_JVMPROFILER)
X
UsedHeapByAllThreads (BEAWLS_JVMPROFILER)
X
TransactionCommitRate (BEAWLS_EJB_HOME)
X
TransactionRollbackRate (BEAWLS_EJB_HOME)
X
TransactionTimeoutRate (BEAWLS_EJB_HOME)
X
UnavailableConnections (BEAWLS_JDBC)
X
VMemoryUsage (BEAWLS_JVMPROFILER)
X
WaitingForConnections (BEAWLS_JDBC)
X
Table 19 PATROL for BEA WebLogic collector-consumer dependencies (Part 15 of 15)
Consumer parameter (Application class )
_EJB
Res
pC
oll
_In
tegA
ttrD
isc
_JV
MP
rofC
oll
_Met
hod
Pro
fCol
l
Ava
ilab
leC
lust
erS
erve
rs
_Pro
cCol
l
_SQ
LR
esp
Col
l
_SQ
LR
esp
onse
Col
l
_Web
Ap
pR
esp
Col
l
Att
rDis
cove
ry
Ch
eck
Not
ific
atio
n
EJB
Att
rDis
cove
ry
J2E
EA
ttrD
isco
very
Log
Dis
cove
ry
JDB
CA
ttrD
isco
very
JMS
Att
rDis
cove
ry
Mis
cAtt
rDis
cove
ry
Por
talD
isco
very
Ser
vlet
Dis
cove
ry
WE
BA
PP
Att
rDis
cove
ry
Default poll time (h = hour, m = minute, s = second)
2 m 07 s
5 m 11 s
2 m53s
4 m43s
1 m 01 s
4 m53s
1m43s
1 m 11 s
1 m49 s
1 m53s
10 s
5 m13 s
3 m 01s
23 h
5 m 7s
7 m01s
10 m 59s
15 m 07s
9 m59s
4 m41s
306 PATROL for BEA WebLogic User Guide

C h a p t e r C
C Menu summaryThis chapter describes only the menu commands that are part of PATROL for BEA WebLogic. For descriptions of console menu commands, see the appropriate PATROL user guide for your console.
The following topics are discussed in this chapter:
About menu commands . . . . . . . . . . . . . . . . . . . . . . . . . . . . . . . . . . . . . . . . . . . . . . . . . . 309BEAWLI_INTEGRATION application menu . . . . . . . . . . . . . . . . . . . . . . . . . . . . . . . . 309BEAWLI_PROCESS application menu . . . . . . . . . . . . . . . . . . . . . . . . . . . . . . . . . . . . . . 310BEAWLP_CACHE application menu . . . . . . . . . . . . . . . . . . . . . . . . . . . . . . . . . . . . . . . 310BEAWLP_PORTAL application menu . . . . . . . . . . . . . . . . . . . . . . . . . . . . . . . . . . . . . . 311BEAWLS_DBURL application menu . . . . . . . . . . . . . . . . . . . . . . . . . . . . . . . . . . . . . . . 311BEAWLS_EJB_HOME application menu . . . . . . . . . . . . . . . . . . . . . . . . . . . . . . . . . . . . 312BEAWLS_EJB_METHOD application menu . . . . . . . . . . . . . . . . . . . . . . . . . . . . . . . . . 312BEAWLS_EXEC_QUEUE application menu . . . . . . . . . . . . . . . . . . . . . . . . . . . . . . . . . 313BEAWLS_JDBC application menu . . . . . . . . . . . . . . . . . . . . . . . . . . . . . . . . . . . . . . . . . 313BEAWLS_JMS_DESTINATION application menu. . . . . . . . . . . . . . . . . . . . . . . . . . . . 315BEAWLS_JMSSERVER application menu . . . . . . . . . . . . . . . . . . . . . . . . . . . . . . . . . . . 316BEAWLS_JROCKIT application menu . . . . . . . . . . . . . . . . . . . . . . . . . . . . . . . . . . . . . . 316BEAWLS_JVMPROFILER application menu. . . . . . . . . . . . . . . . . . . . . . . . . . . . . . . . . 317BEAWLS_J2EE_APPS application menu . . . . . . . . . . . . . . . . . . . . . . . . . . . . . . . . . . . . 317BEAWLS_LOCAL_MANAGED application menu . . . . . . . . . . . . . . . . . . . . . . . . . . . 318BEAWLS_LOG application menu . . . . . . . . . . . . . . . . . . . . . . . . . . . . . . . . . . . . . . . . . . 320BEAWLS_MANAGED application menu . . . . . . . . . . . . . . . . . . . . . . . . . . . . . . . . . . . 321BEAWLS_PROBE application menu. . . . . . . . . . . . . . . . . . . . . . . . . . . . . . . . . . . . . . . . 322BEAWLS_PROF_CLASS application menu. . . . . . . . . . . . . . . . . . . . . . . . . . . . . . . . . . 323BEAWLS_OS application menu. . . . . . . . . . . . . . . . . . . . . . . . . . . . . . . . . . . . . . . . . . . . 323BEAWLS_SERVER application menu. . . . . . . . . . . . . . . . . . . . . . . . . . . . . . . . . . . . . . . 324BEAWLS_SERVLET application menu. . . . . . . . . . . . . . . . . . . . . . . . . . . . . . . . . . . . . . 329BEAWLS_SETUP application menu . . . . . . . . . . . . . . . . . . . . . . . . . . . . . . . . . . . . . . . . 329BEAWLS_SQL application menu . . . . . . . . . . . . . . . . . . . . . . . . . . . . . . . . . . . . . . . . . . 330BEAWLS_THREADPOOL application menu . . . . . . . . . . . . . . . . . . . . . . . . . . . . . . . . 331BEAWLS_WEBAPP application menu . . . . . . . . . . . . . . . . . . . . . . . . . . . . . . . . . . . . . . 332BEAWLS_WS application menu . . . . . . . . . . . . . . . . . . . . . . . . . . . . . . . . . . . . . . . . . . . 332BEAWLS_WS_HDL application menu . . . . . . . . . . . . . . . . . . . . . . . . . . . . . . . . . . . . . . 333
Chapter C Menu summary 307

C
BEAWLS_WS_OPER application menu . . . . . . . . . . . . . . . . . . . . . . . . . . . . . . . . . . . . . 333JMX_CONDITION application menu . . . . . . . . . . . . . . . . . . . . . . . . . . . . . . . . . . . . . . . 334JMX_DOMAIN application menu . . . . . . . . . . . . . . . . . . . . . . . . . . . . . . . . . . . . . . . . . . 334JMX_MAIN application menu . . . . . . . . . . . . . . . . . . . . . . . . . . . . . . . . . . . . . . . . . . . . . 335JMX_SERVER application menu . . . . . . . . . . . . . . . . . . . . . . . . . . . . . . . . . . . . . . . . . . . 336
308 PATROL for BEA WebLogic User Guide

C
About menu commandsWhen a PATROL KM file is loaded, its associated menu commands are added to the KM area of a menu. However, not all PATROL KM application classes have menu commands.
The KM menu commands that are available depend on which version of BEA WebLogic Server is installed in your environment.
In addition, some application classes may appear only if certain features are enabled in your environment or configured for your PATROL monitoring environment. (See “Application classes and icons” on page 28 and “Verifying and troubleshooting WebLogic Server configuration” on page 119).
The application menu commands are accessed in different ways based on the type of PATROL console that you are using. Explanations of how to access menu commands are available in the online help and in Appendix A, “Accessing menu commands, InfoBoxes, and online Help”of this user guide.
BEAWLI_INTEGRATION application menuTable 20 lists the menu commands for the BEAWLI_INTEGRATION application class. These menu commands are available when monitoring WebLogic 8.1, 9.x, and 10.x environments.
Table 20 BEAWLI_INTEGRATION menu commands
Menu command Action
Reports
Process Statistics generate a report on the business process information
Health Statistics generate a report that describes an overview of integration system health
Message Channels Info. generate a report on all the message channels of a message broker
App. Views Summary generate a summary report on the application views
Specify Monitoring Process... select a particular integration process to monitor
Perform BPM archiver force the archiver process to run as soon as possible instead of waiting for the next scheduled time
Chapter C Menu summary 309

C
BEAWLI_PROCESS application menuTable 21 lists the menu commands for the BEAWLI_PROCESS application class. These menu commands are available when monitoring WebLogic 8.1 environments.
BEAWLP_CACHE application menuTable 22 lists the menu commands for the BEAWLP_CACHE application class. These menu commands are available when monitoring WebLogic 8.1 environments.
Table 21 BEAWLI_PROCESS menu commands
Menu command Action
Process Instance Summary generate a summary report for the process instance
Process Instance Administration... suspend, resume, terminate, or unfreeze a specified process a
a. These menu commands may change configuration and runtime settings of the BEA WebLogic Application Servers. To execute these commands you must enter the BEA WebLogic Administrator username and password. To disable this feature, add the pconfig variable /BEAWLS_SERVER/authenticationDisabled with the value true.
Configure Process SLA... configure the SLA for this business processa
Stop Monitoring stop the monitoring of this integration process
Table 22 BEAWLP_CACHE menu commands
Menu command Action
Cache Tuning... set the maximum number of entries allowed in the cache, the default time-to-live in milliseconds for elements added to the cache, and the enabled mode of this cache a
a. This menu command may change configuration and runtime settings of the BEA WebLogic Application Servers. To execute this command you must enter the BEA WebLogic Administrator username and password. To disable this feature, add the pconfig variable /BEAWLS_SERVER/authenticationDisabled with the value true.
Flush Cache clear the cache contents for this cache in the cluster or just a single instance if not running in a cluster
Suspend Monitoring stop the monitoring of this cache service
310 PATROL for BEA WebLogic User Guide

C
BEAWLP_PORTAL application menuTable 23 lists the menu commands for the BEAWLP_PORTAL application class. These menu commands are available when monitoring WebLogic 8.1 environments.
BEAWLS_DBURL application menuTable 24 lists the menu commands for the BEAWLS_DBURL application class. These menu commands are available when monitoring WebLogic 7.0 and 8.1 environments.
Table 23 BEAWLP_PORTAL menu commands
Menu Command Action
Reports
Behavior Tracking generate a report that lists the maximum size of the event buffer, which holds events until the events are persisted to the database and, and the interval, in seconds, at which to check the buffers to see whether events in the buffer must be persisted and other information
Doc. Content Pool Info generate a report that lists the maximum capacity of the pool, the login timeout of the pool, the JDBC driver name, and other properties of the pool
Resume Cache Monitoring resume the monitoring of the suspended cache
Table 24 BEAWLS_DBURL menu commands
Menu command Action
Report on Top ‘N’ SQL identify the most resource-intensive SQL statements (the number of results returned can be set from 1 to 30); this query returns a list of SQL queries with the longest average response time, the longest total response time, and most often used (highest number of invocations); this command reports results for only a specific database URL, if you want results to span URLs, run this command from the SERVER or LOCAL_MANAGED icon
Select SQL for Monitoring select specific SQL queries (up to 30 instances) for monitoring; you can define a unique label (alias) that will be used as the name for a spawned instance of the BEAWLS_SQL class
Chapter C Menu summary 311

C
BEAWLS_EJB_HOME application menuTable 25 lists the menu commands for the BEAWLS_EJB_HOME application class. These menu commands are available when monitoring WebLogic 7.0, 8.1, 9.x, and 10.x environments.
BEAWLS_EJB_METHOD application menuTable 26 lists the menu commands for the BEAWLS_EJB_METHOD application class. These menu commands are available when monitoring WebLogic 7.0 and 8.1 environments.
Table 25 BEAWLS_EJB_HOME menu commands
Menu command Action
Report Top ‘N’ EJB Method... generate a report based on user-specified categories of statistical information, including top N average response times, top N total response times, and the number of times the EJB was invoked
Monitor EJB Method... select which methods should be used to filter response data (such as top N average response time, top N total response time, or invocation count); this command is available only if you have enabled EJB performance collection using the Advance Monitoring => Configuration command in the BEAWLS_SERVER class
a list of EJB methods that have been invoked from previous collection cycles will be populated for the selection
Table 26 BEAWLS_EJB_METHOD menu commands
Menu command Action
Stop Monitoring stop monitoring this EJB method instance and remove its associated icon from the console
312 PATROL for BEA WebLogic User Guide
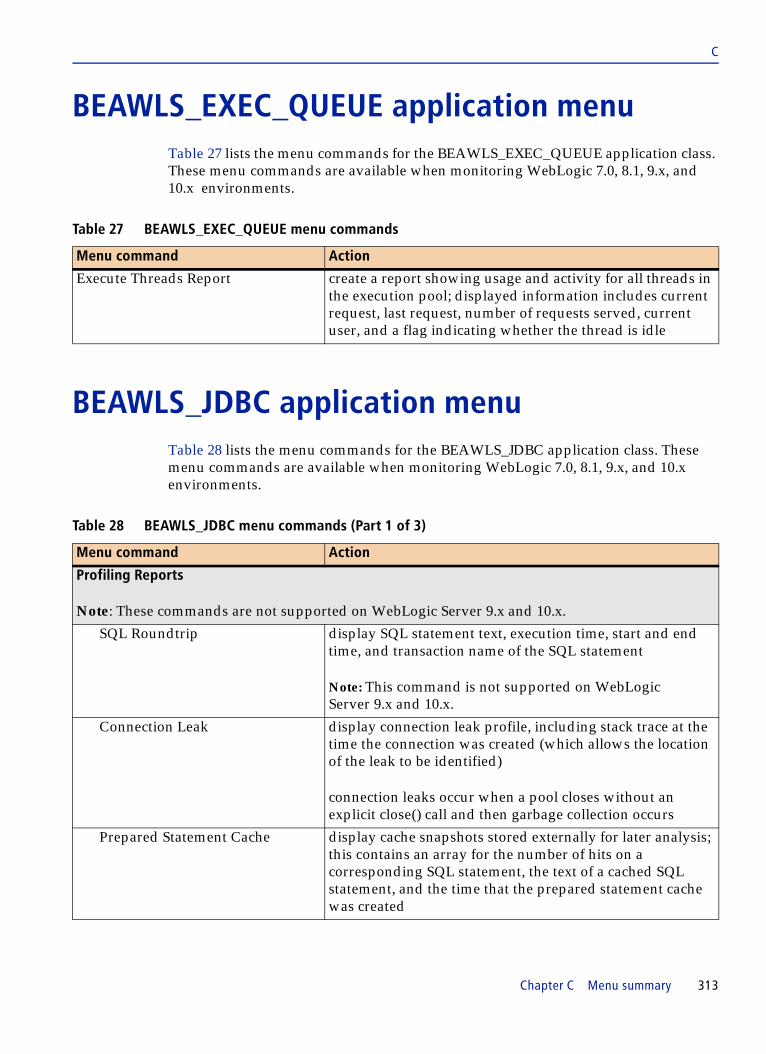
C
BEAWLS_EXEC_QUEUE application menuTable 27 lists the menu commands for the BEAWLS_EXEC_QUEUE application class. These menu commands are available when monitoring WebLogic 7.0, 8.1, 9.x, and 10.x environments.
BEAWLS_JDBC application menuTable 28 lists the menu commands for the BEAWLS_JDBC application class. These menu commands are available when monitoring WebLogic 7.0, 8.1, 9.x, and 10.x environments.
Table 27 BEAWLS_EXEC_QUEUE menu commands
Menu command Action
Execute Threads Report create a report showing usage and activity for all threads in the execution pool; displayed information includes current request, last request, number of requests served, current user, and a flag indicating whether the thread is idle
Table 28 BEAWLS_JDBC menu commands (Part 1 of 3)
Menu command Action
Profiling Reports
Note: These commands are not supported on WebLogic Server 9.x and 10.x.
SQL Roundtrip display SQL statement text, execution time, start and end time, and transaction name of the SQL statement
Note: This command is not supported on WebLogic Server 9.x and 10.x.
Connection Leak display connection leak profile, including stack trace at the time the connection was created (which allows the location of the leak to be identified)
connection leaks occur when a pool closes without an explicit close() call and then garbage collection occurs
Prepared Statement Cache display cache snapshots stored externally for later analysis; this contains an array for the number of hits on a corresponding SQL statement, the text of a cached SQL statement, and the time that the prepared statement cache was created
Chapter C Menu summary 313
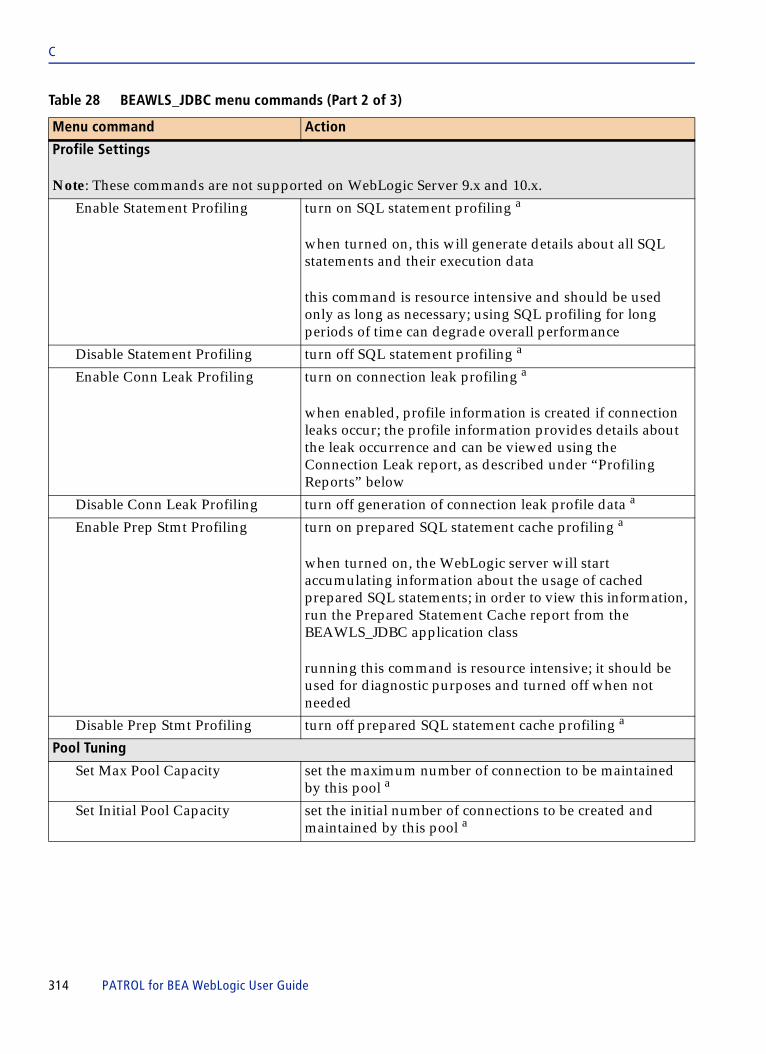
C
Profile Settings
Note: These commands are not supported on WebLogic Server 9.x and 10.x.
Enable Statement Profiling turn on SQL statement profiling a
when turned on, this will generate details about all SQL statements and their execution data
this command is resource intensive and should be used only as long as necessary; using SQL profiling for long periods of time can degrade overall performance
Disable Statement Profiling turn off SQL statement profiling a
Enable Conn Leak Profiling turn on connection leak profiling a
when enabled, profile information is created if connection leaks occur; the profile information provides details about the leak occurrence and can be viewed using the Connection Leak report, as described under “Profiling Reports” below
Disable Conn Leak Profiling turn off generation of connection leak profile data a
Enable Prep Stmt Profiling turn on prepared SQL statement cache profiling a
when turned on, the WebLogic server will start accumulating information about the usage of cached prepared SQL statements; in order to view this information, run the Prepared Statement Cache report from the BEAWLS_JDBC application class
running this command is resource intensive; it should be used for diagnostic purposes and turned off when not needed
Disable Prep Stmt Profiling turn off prepared SQL statement cache profiling a
Pool Tuning
Set Max Pool Capacity set the maximum number of connection to be maintained by this pool a
Set Initial Pool Capacity set the initial number of connections to be created and maintained by this pool a
Table 28 BEAWLS_JDBC menu commands (Part 2 of 3)
Menu command Action
314 PATROL for BEA WebLogic User Guide
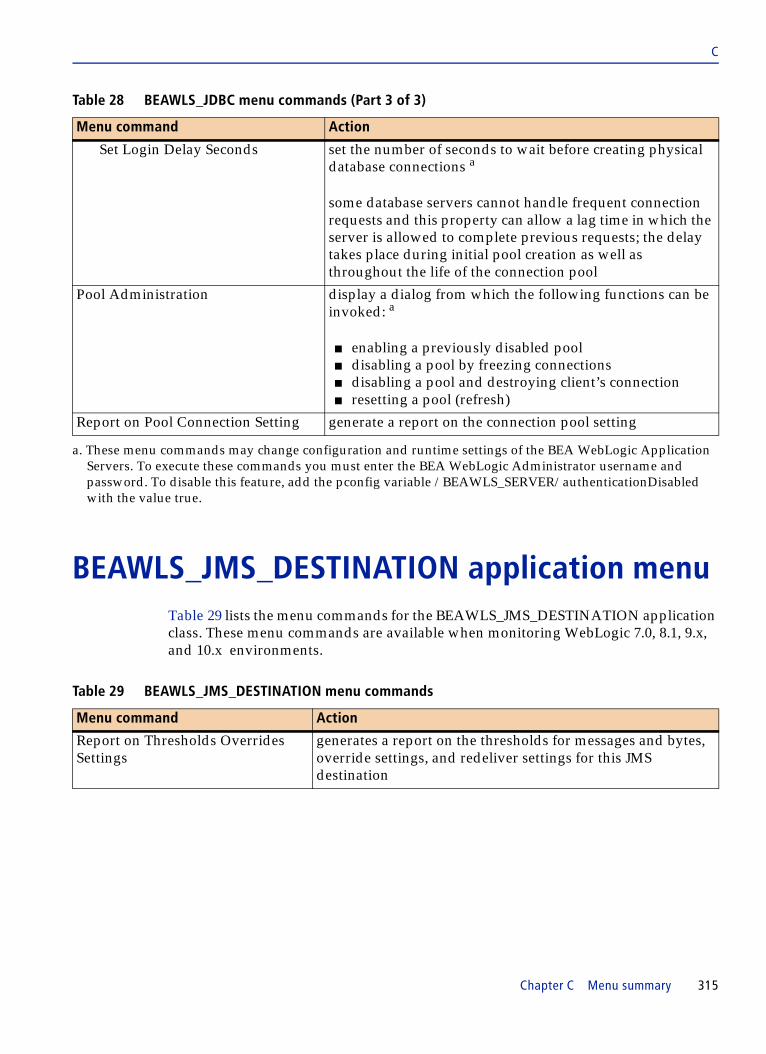
C
BEAWLS_JMS_DESTINATION application menuTable 29 lists the menu commands for the BEAWLS_JMS_DESTINATION application class. These menu commands are available when monitoring WebLogic 7.0, 8.1, 9.x, and 10.x environments.
Set Login Delay Seconds set the number of seconds to wait before creating physical database connections a
some database servers cannot handle frequent connection requests and this property can allow a lag time in which the server is allowed to complete previous requests; the delay takes place during initial pool creation as well as throughout the life of the connection pool
Pool Administration display a dialog from which the following functions can be invoked: a
■ enabling a previously disabled pool■ disabling a pool by freezing connections■ disabling a pool and destroying client’s connection■ resetting a pool (refresh)
Report on Pool Connection Setting generate a report on the connection pool setting
a. These menu commands may change configuration and runtime settings of the BEA WebLogic Application Servers. To execute these commands you must enter the BEA WebLogic Administrator username and password. To disable this feature, add the pconfig variable /BEAWLS_SERVER/authenticationDisabled with the value true.
Table 29 BEAWLS_JMS_DESTINATION menu commands
Menu command Action
Report on Thresholds Overrides Settings
generates a report on the thresholds for messages and bytes, override settings, and redeliver settings for this JMS destination
Table 28 BEAWLS_JDBC menu commands (Part 3 of 3)
Menu command Action
Chapter C Menu summary 315

C
BEAWLS_JMSSERVER application menuTable 30 lists the menu commands for the BEAWLS_JMSSERVER application class. These menu commands are available when monitoring WebLogic 7.0, 8.1, 9.x, and 10.x environments.
BEAWLS_JROCKIT application menuTable 31 lists the menu commands for the BEAWLS_JROCKIT application class. These menu commands are available when monitoring WebLogic 8.1, 9.x, and 10.x environments.
Table 30 BEAWLS_JMSSERVER menu commands
Menu command Action
Configuration display or set new configuration values for the JMS server; various threshold levels can be set, including: a
■ maximum bytes stored on a JMS server (-1 specifies no limit)
■ lower threshold for triggering events based on number of bytes on JMS server (-1 specifies no event generation)
■ upper threshold for triggering events based on number of bytes (-1 specifies no events)
■ maximum number of messages stored on JMS server (-1 specifies no limit)
■ upper threshold for triggering events based on number of messages (-1 specifies no limit)
■ lower threshold for triggering events based on number of messages (-1 specifies no limit)
a. This menu command may change configuration and runtime settings of the BEA WebLogic Application Servers. To execute this command you must enter the BEA WebLogic Administrator username and password. To disable this feature, add the pconfig variable /BEAWLS_SERVER/authenticationDisabled with the value true.
316 PATROL for BEA WebLogic User Guide

C
BEAWLS_JVMPROFILER application menuTable 32 lists the menu commands for the BEAWLS_JVMPROFILER application class. These menu commands are available when monitoring WebLogic 7.0 and 8.1 environments.
BEAWLS_J2EE_APPS application menuTable 33 lists the menu commands for the BEAWLS_J2EE_APPS application class. These menu commands are available when monitoring WebLogic 8.1, 9.x, and 10.x environments.
Table 31 BEAWLS_JROCKIT menu commands
Menu command Action
Report of Thread Stack Dump provides a stack dump report of all live threads in the Virtual Machine (VM)
The content of this report will be similar to typing CTRL-break in the shell process that is running the VM. The report will contain the information about each JVM thread ID, execution queue name of the thread, status/priority, and information on “java class stacks” associated with the thread.
Table 32 BEAWLS_JVMPROFILER menu commands
Menu command Action
Thread Detail Report generate a report showing information about thread performance, including identification of possible stuck threads that could indicate JVM problems
Table 33 BEAWLS_J2EE_APPS menu commands (Part 1 of 2)
Menu command Action
Reports
Chapter C Menu summary 317
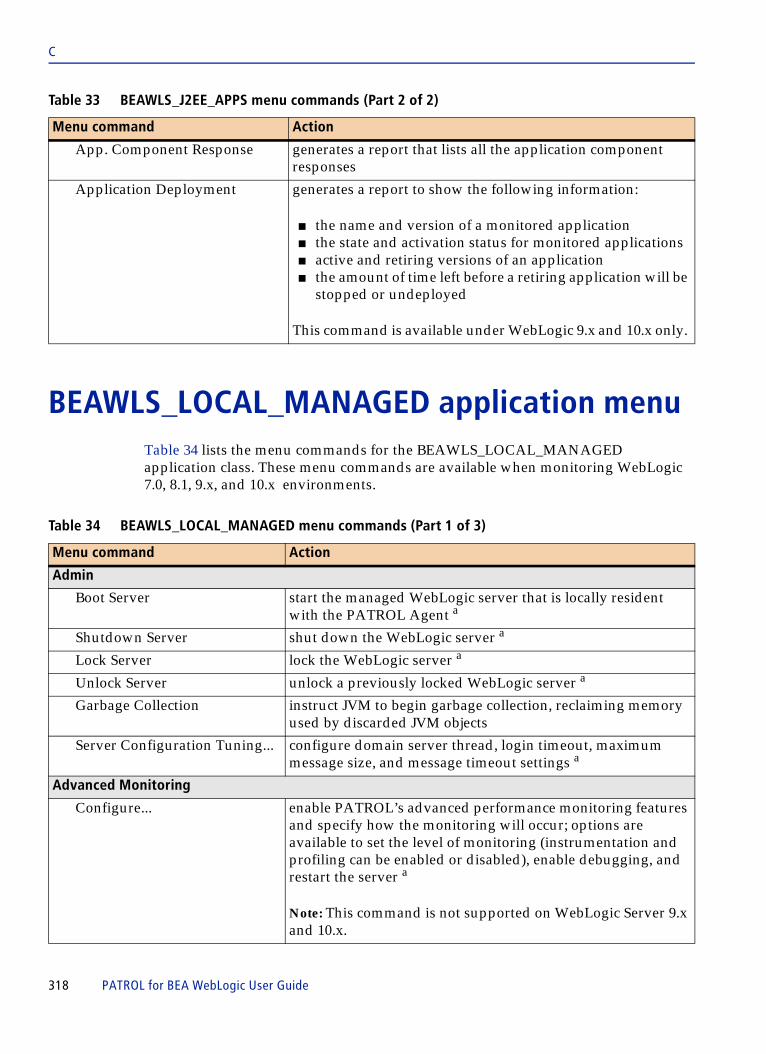
C
BEAWLS_LOCAL_MANAGED application menuTable 34 lists the menu commands for the BEAWLS_LOCAL_MANAGED application class. These menu commands are available when monitoring WebLogic 7.0, 8.1, 9.x, and 10.x environments.
App. Component Response generates a report that lists all the application component responses
Application Deployment generates a report to show the following information:
■ the name and version of a monitored application ■ the state and activation status for monitored applications ■ active and retiring versions of an application ■ the amount of time left before a retiring application will be
stopped or undeployed
This command is available under WebLogic 9.x and 10.x only.
Table 34 BEAWLS_LOCAL_MANAGED menu commands (Part 1 of 3)
Menu command Action
Admin
Boot Server start the managed WebLogic server that is locally resident with the PATROL Agent a
Shutdown Server shut down the WebLogic server a
Lock Server lock the WebLogic server a
Unlock Server unlock a previously locked WebLogic server a
Garbage Collection instruct JVM to begin garbage collection, reclaiming memory used by discarded JVM objects
Server Configuration Tuning... configure domain server thread, login timeout, maximum message size, and message timeout settings a
Advanced Monitoring
Configure... enable PATROL’s advanced performance monitoring features and specify how the monitoring will occur; options are available to set the level of monitoring (instrumentation and profiling can be enabled or disabled), enable debugging, and restart the server a
Note: This command is not supported on WebLogic Server 9.x and 10.x.
Table 33 BEAWLS_J2EE_APPS menu commands (Part 2 of 2)
Menu command Action
318 PATROL for BEA WebLogic User Guide
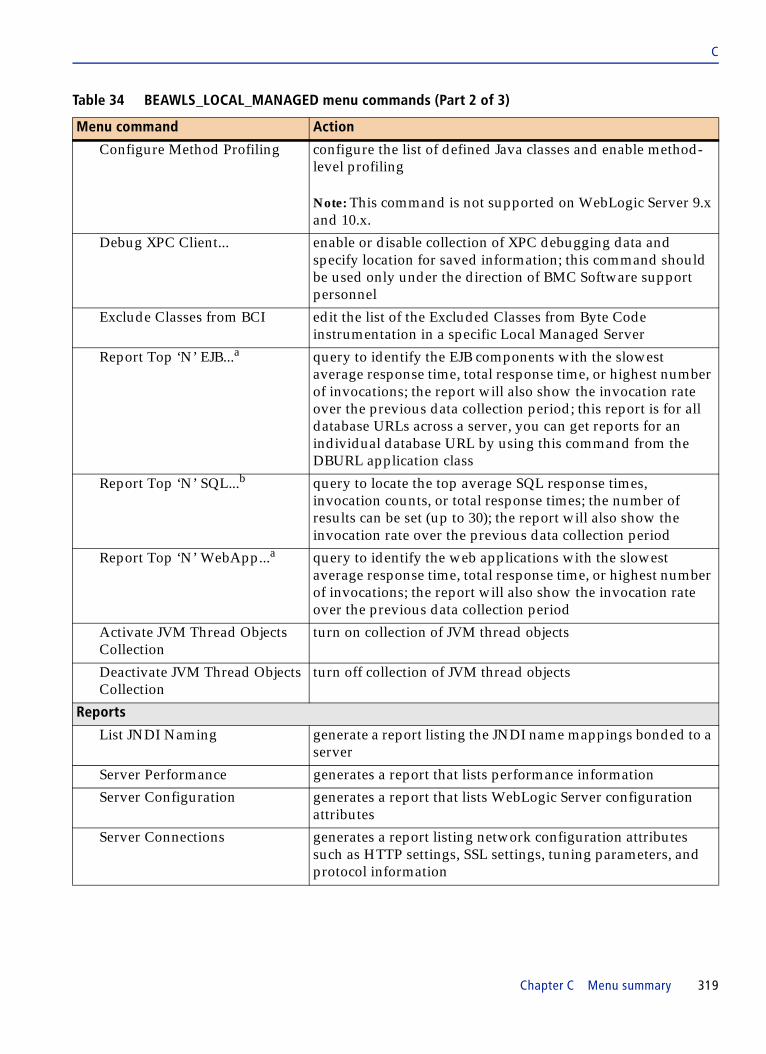
C
Configure Method Profiling configure the list of defined Java classes and enable method-level profiling
Note: This command is not supported on WebLogic Server 9.x and 10.x.
Debug XPC Client... enable or disable collection of XPC debugging data and specify location for saved information; this command should be used only under the direction of BMC Software support personnel
Exclude Classes from BCI edit the list of the Excluded Classes from Byte Code instrumentation in a specific Local Managed Server
Report Top ‘N’ EJB...a query to identify the EJB components with the slowest average response time, total response time, or highest number of invocations; the report will also show the invocation rate over the previous data collection period; this report is for all database URLs across a server, you can get reports for an individual database URL by using this command from the DBURL application class
Report Top ‘N’ SQL...b query to locate the top average SQL response times, invocation counts, or total response times; the number of results can be set (up to 30); the report will also show the invocation rate over the previous data collection period
Report Top ‘N’ WebApp...a query to identify the web applications with the slowest average response time, total response time, or highest number of invocations; the report will also show the invocation rate over the previous data collection period
Activate JVM Thread Objects Collection
turn on collection of JVM thread objects
Deactivate JVM Thread Objects Collection
turn off collection of JVM thread objects
Reports
List JNDI Naming generate a report listing the JNDI name mappings bonded to a server
Server Performance generates a report that lists performance information
Server Configuration generates a report that lists WebLogic Server configuration attributes
Server Connections generates a report listing network configuration attributes such as HTTP settings, SSL settings, tuning parameters, and protocol information
Table 34 BEAWLS_LOCAL_MANAGED menu commands (Part 2 of 3)
Menu command Action
Chapter C Menu summary 319
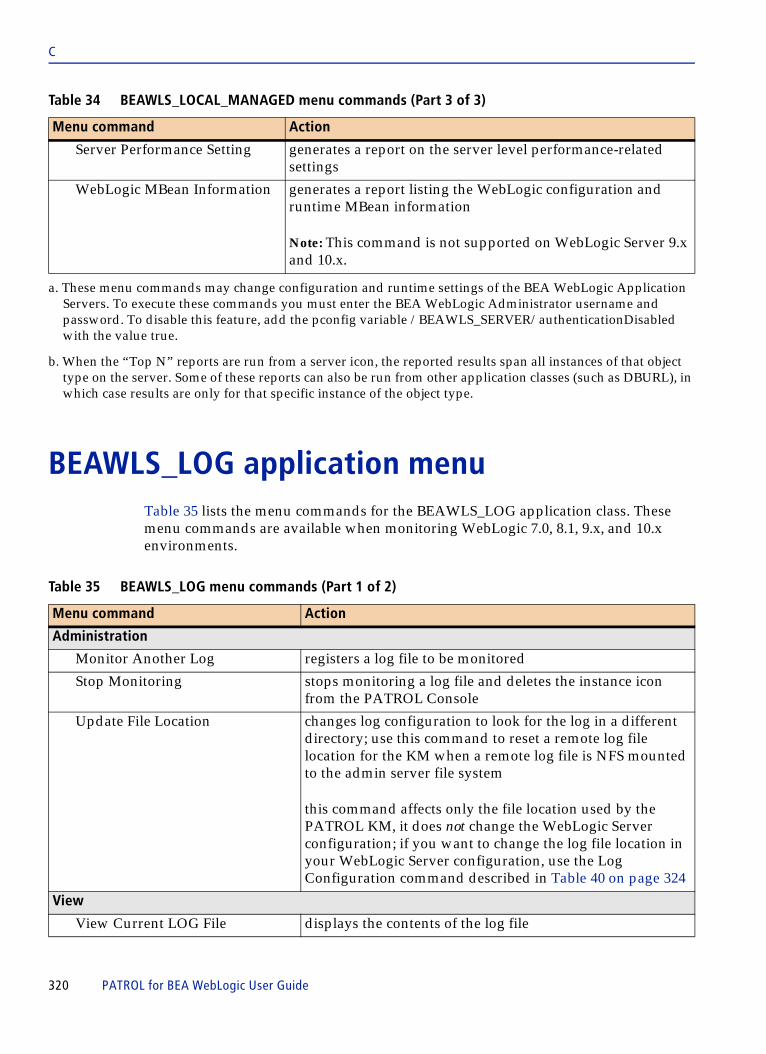
C
BEAWLS_LOG application menuTable 35 lists the menu commands for the BEAWLS_LOG application class. These menu commands are available when monitoring WebLogic 7.0, 8.1, 9.x, and 10.x environments.
Server Performance Setting generates a report on the server level performance-related settings
WebLogic MBean Information generates a report listing the WebLogic configuration and runtime MBean information
Note: This command is not supported on WebLogic Server 9.x and 10.x.
a. These menu commands may change configuration and runtime settings of the BEA WebLogic Application Servers. To execute these commands you must enter the BEA WebLogic Administrator username and password. To disable this feature, add the pconfig variable /BEAWLS_SERVER/authenticationDisabled with the value true.
b. When the “Top N” reports are run from a server icon, the reported results span all instances of that object type on the server. Some of these reports can also be run from other application classes (such as DBURL), in which case results are only for that specific instance of the object type.
Table 35 BEAWLS_LOG menu commands (Part 1 of 2)
Menu command Action
Administration
Monitor Another Log registers a log file to be monitored
Stop Monitoring stops monitoring a log file and deletes the instance icon from the PATROL Console
Update File Location changes log configuration to look for the log in a different directory; use this command to reset a remote log file location for the KM when a remote log file is NFS mounted to the admin server file system
this command affects only the file location used by the PATROL KM, it does not change the WebLogic Server configuration; if you want to change the log file location in your WebLogic Server configuration, use the Log Configuration command described in Table 40 on page 324
View
View Current LOG File displays the contents of the log file
Table 34 BEAWLS_LOCAL_MANAGED menu commands (Part 3 of 3)
Menu command Action
320 PATROL for BEA WebLogic User Guide

C
BEAWLS_MANAGED application menuTable 36 lists the menu commands for the BEAWLS_MANAGED application class. These menu commands are available when monitoring WebLogic 7.0, 8.1, 9.x, and 10.x environments.
View Entire LOG File view contents of current and all rotated log files
Watch LOG File displays log file in real time
Log Sniffing
Edit Sniffing Pattern adds, updates, or deletes a pattern matching string used to find specific text patterns in the log file
Note: After changing the sniffing pattern, you must stop and restart sniffing.
View Registered Patterns reports information about string patterns for this monitored log file
Restart Pattern Sniffing resumes string pattern matching on a previously stopped sniff pattern
Stop Pattern Sniffing stops string pattern matching for a specific string
Setup Sniffing Type set the method used to apply sniffing; periodic sniffing matches sniff patterns to the log file when the LogEvent parameter collects data; real-time sniffing opens the file and continuously matches strings as new messages are written to the log
Table 36 BEAWLS_MANAGED menu commands (Part 1 of 2)
Menu command Action
Admin
Boot Server start a remotely managed WebLogic server
Shutdown Server shut down the WebLogic server a
Lock Server lock the WebLogic server a
Unlock Server unlock a previously locked WebLogic server a
Garbage Collection instruct JVM to begin garbage collection, reclaiming memory used by discarded JVM objects
Server Configuration Tuning configure domain server thread, login timeout, maximum message size, and message timeout settings a
Reports
Table 35 BEAWLS_LOG menu commands (Part 2 of 2)
Menu command Action
Chapter C Menu summary 321
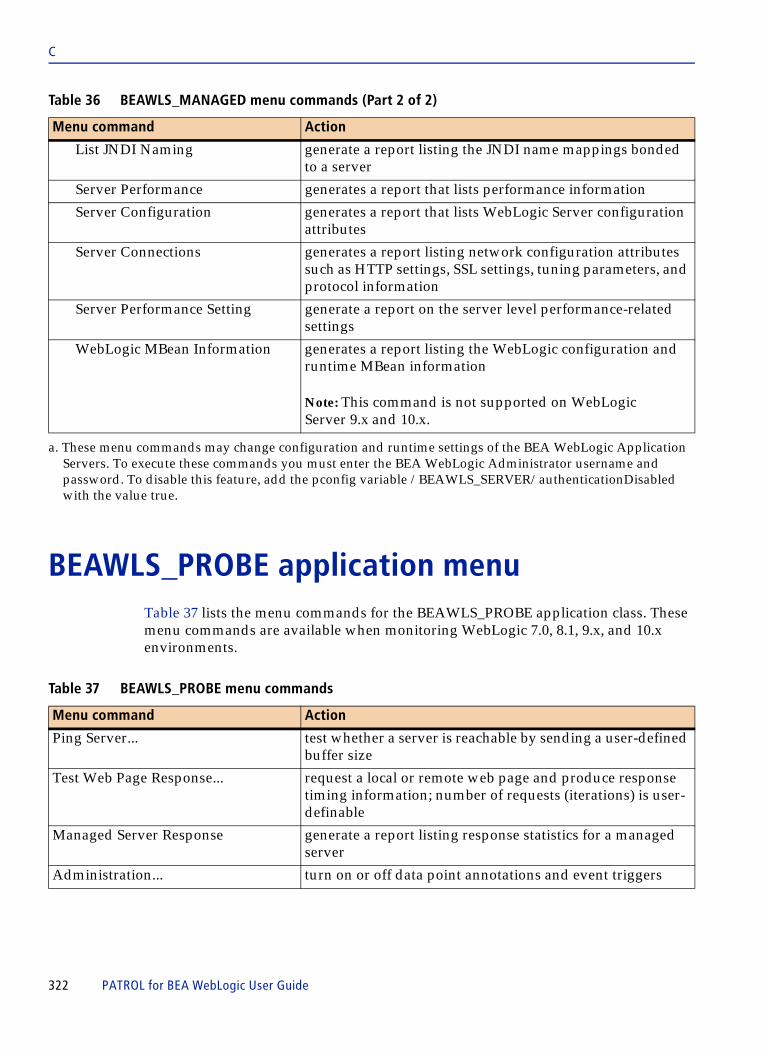
C
BEAWLS_PROBE application menuTable 37 lists the menu commands for the BEAWLS_PROBE application class. These menu commands are available when monitoring WebLogic 7.0, 8.1, 9.x, and 10.x environments.
List JNDI Naming generate a report listing the JNDI name mappings bonded to a server
Server Performance generates a report that lists performance information
Server Configuration generates a report that lists WebLogic Server configuration attributes
Server Connections generates a report listing network configuration attributes such as HTTP settings, SSL settings, tuning parameters, and protocol information
Server Performance Setting generate a report on the server level performance-related settings
WebLogic MBean Information generates a report listing the WebLogic configuration and runtime MBean information
Note: This command is not supported on WebLogic Server 9.x and 10.x.
a. These menu commands may change configuration and runtime settings of the BEA WebLogic Application Servers. To execute these commands you must enter the BEA WebLogic Administrator username and password. To disable this feature, add the pconfig variable /BEAWLS_SERVER/authenticationDisabled with the value true.
Table 37 BEAWLS_PROBE menu commands
Menu command Action
Ping Server... test whether a server is reachable by sending a user-defined buffer size
Test Web Page Response... request a local or remote web page and produce response timing information; number of requests (iterations) is user-definable
Managed Server Response generate a report listing response statistics for a managed server
Administration... turn on or off data point annotations and event triggers
Table 36 BEAWLS_MANAGED menu commands (Part 2 of 2)
Menu command Action
322 PATROL for BEA WebLogic User Guide

C
BEAWLS_PROF_CLASS application menuTable 38 lists the menu commands for the BEAWLS_PROF_CLASS application class. These menu commands are available when monitoring WebLogic 7.0, and 8.1 environments.
BEAWLS_OS application menuTable 39 lists the menu commands for the BEAWLS_OS application class. These menu commands are available when monitoring WebLogic 7.0, 8.1, 9.x, and 10.x environments.
Table 38 BEAWLS_PROF_CLASS menu commands
Menu command Action
Stop Monitoring stop collecting and monitoring profiling information for this Java class
Table 39 BEAWLS_OS menu commands
Menu Command Action
Setup High CPU Threshold... set a threshold value, above which a monitored Java process is to be considered a “high CPU user” (this is for monitoring the Java processes of the WebLogic Server and the managed servers)
Network Statistics Report generate a report on network TCP/IP statistical information
Node Manager Administration
Resume Node Manager Monitoring
add the node manager process to the list of active Java processes to be monitored for this domain
Suspend Node Manager Monitoring
remove the node manager process from the list of active Java processes to be monitored for this domain
Report on Node Manager Configuration
display a configuration report for the Node Manager process that is running on the same host as the PATROL Agent; information will include listen address and port information, and SSL certificate information
Chapter C Menu summary 323

C
BEAWLS_SERVER application menu Table 40 lists the menu commands for the BEAWLS_SERVER application class. These menu commands are available when monitoring WebLogic 7.0, 8.1, 9.x, and 10.x environments.
Table 40 BEAWLS_SERVER menu commands (Part 1 of 5)
Menu command Action
Admin
Boot Server start the WebLogic server a
Shutdown Server shut down the WebLogic server a
Lock Server lock the WebLogic server a
Unlock Server unlock a previously locked WebLogic server a
Garbage Collection instruct JVM to begin garbage collection, reclaiming memory used by discarded JVM objects
Server Configuration Tuning configure domain server thread, login timeout, maximum message size, and message timeout settings a
Domain Applications configure the auto-deployment for a target WebLogic server domain a
JTA Configuration configure the Java Transaction API to set transaction performance limits, such as timing and iteration constraints, that determine how unsuccessful transactions are handled a
Suspend Domain Consistency Checking
suspend checking and acknowledge inconsistencies in the managed WebLogic environment, this will reset the DomainConsistency parameter to clear alarms and will add an annotation of “Acknowledged” in the DomainConsistency parameter
domain consistency checking verifies that the versions of the JDK and WebLogic server are consistent across all managed servers in a domain
this command is not available when monitoring a single Managed Server
Resume Domain Consistency Checking
continue monitoring for domain consistency
this feature must be re-activated after acknowledging an inconsistency alert
this command is not available when monitoring a single Managed Server
324 PATROL for BEA WebLogic User Guide
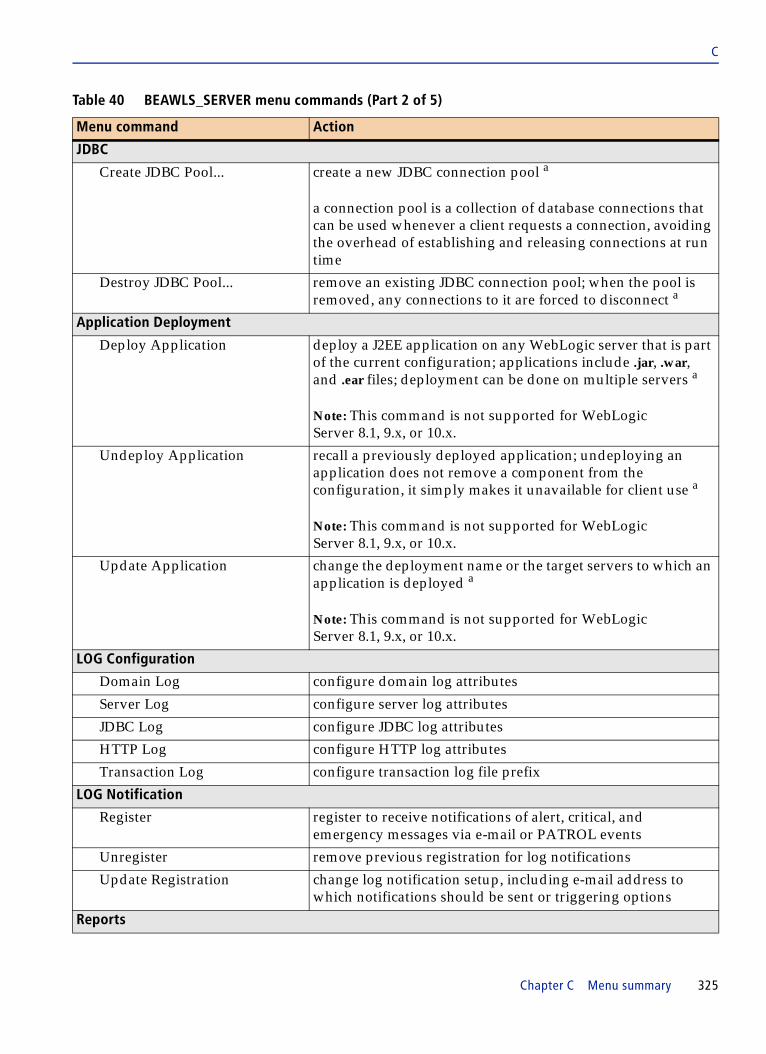
C
JDBC
Create JDBC Pool... create a new JDBC connection pool a
a connection pool is a collection of database connections that can be used whenever a client requests a connection, avoiding the overhead of establishing and releasing connections at run time
Destroy JDBC Pool... remove an existing JDBC connection pool; when the pool is removed, any connections to it are forced to disconnect a
Application Deployment
Deploy Application deploy a J2EE application on any WebLogic server that is part of the current configuration; applications include .jar, .war, and .ear files; deployment can be done on multiple servers a
Note: This command is not supported for WebLogic Server 8.1, 9.x, or 10.x.
Undeploy Application recall a previously deployed application; undeploying an application does not remove a component from the configuration, it simply makes it unavailable for client use a
Note: This command is not supported for WebLogic Server 8.1, 9.x, or 10.x.
Update Application change the deployment name or the target servers to which an application is deployed a
Note: This command is not supported for WebLogic Server 8.1, 9.x, or 10.x.
LOG Configuration
Domain Log configure domain log attributes
Server Log configure server log attributes
JDBC Log configure JDBC log attributes
HTTP Log configure HTTP log attributes
Transaction Log configure transaction log file prefix
LOG Notification
Register register to receive notifications of alert, critical, and emergency messages via e-mail or PATROL events
Unregister remove previous registration for log notifications
Update Registration change log notification setup, including e-mail address to which notifications should be sent or triggering options
Reports
Table 40 BEAWLS_SERVER menu commands (Part 2 of 5)
Menu command Action
Chapter C Menu summary 325
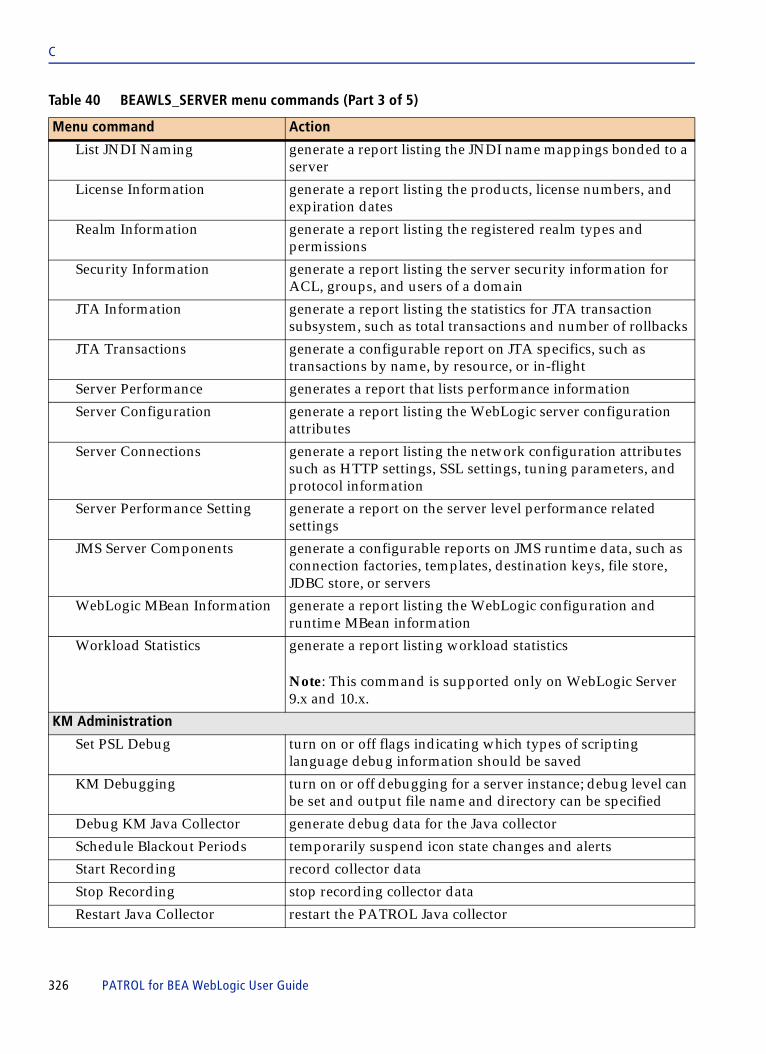
C
List JNDI Naming generate a report listing the JNDI name mappings bonded to a server
License Information generate a report listing the products, license numbers, and expiration dates
Realm Information generate a report listing the registered realm types and permissions
Security Information generate a report listing the server security information for ACL, groups, and users of a domain
JTA Information generate a report listing the statistics for JTA transaction subsystem, such as total transactions and number of rollbacks
JTA Transactions generate a configurable report on JTA specifics, such as transactions by name, by resource, or in-flight
Server Performance generates a report that lists performance information
Server Configuration generate a report listing the WebLogic server configuration attributes
Server Connections generate a report listing the network configuration attributes such as HTTP settings, SSL settings, tuning parameters, and protocol information
Server Performance Setting generate a report on the server level performance related settings
JMS Server Components generate a configurable reports on JMS runtime data, such as connection factories, templates, destination keys, file store, JDBC store, or servers
WebLogic MBean Information generate a report listing the WebLogic configuration and runtime MBean information
Workload Statistics generate a report listing workload statistics
Note: This command is supported only on WebLogic Server 9.x and 10.x.
KM Administration
Set PSL Debug turn on or off flags indicating which types of scripting language debug information should be saved
KM Debugging turn on or off debugging for a server instance; debug level can be set and output file name and directory can be specified
Debug KM Java Collector generate debug data for the Java collector
Schedule Blackout Periods temporarily suspend icon state changes and alerts
Start Recording record collector data
Stop Recording stop recording collector data
Restart Java Collector restart the PATROL Java collector
Table 40 BEAWLS_SERVER menu commands (Part 3 of 5)
Menu command Action
326 PATROL for BEA WebLogic User Guide

C
Assign Local Managed Servers override a discovered server configuration to specify whether a discovered server should be managed as a local managed server
This command is used for managing servers in a cluster environment that uses multi-homed IP addresses. In this configuration, the PATROL for BEA WebLogic discovery process cannot always differentiate a local from a remote server. Use this command to tell PATROL that a server that it thinks is remote is actually using a multicast IP address and should be treated as a local managed server.
Suspend Custom Events Trigger for Objects Discovery
suspend the special custom event triggered during the KM objects and attributes discovery cycle
By default, the KM will trigger the custom events if any of the following monitored components are in a WARNING, ERROR, or ALARM state:
■ WebLogic server execution queue health status■ JMS server health status■ JDBC connection pool state
Resume Custom Events Trigger for Objects Discovery
resume monitoring of special custom events
KM Performance Tuning
Select Monitoring Servers select the servers that are important for monitoring and remove the servers that are less important
by default, all servers in the domain are monitored
Select Monitoring Components select the types of components to monitor
in addition to SERVER and CLUSTER, all supported components are selectable, including EJB, JDBC, WEBAPP, SERVLET, JMS, JCA, and JOLT
Configure Objects Discovery Schedule
select whether objects are discovered only on server changes (recommended default) or on every MainDiscovery cycle; you can also use this command to force an immediate discovery
Table 40 BEAWLS_SERVER menu commands (Part 4 of 5)
Menu command Action
Chapter C Menu summary 327

C
Advanced Monitoring
Configure enable PATROL’s advanced performance monitoring features and specify how the monitoring will occur; options are available to set the level of monitoring (instrumentation and profiling can be enabled or disabled), enable debugging, and restart the server a
Note: This command is not supported on WebLogic Server 9.x and 10.x.
Configure Method Profiling configure the list of defined Java classes and enable the method-level profiling
Note: This command is not supported on WebLogic Server 9.x and 10.x.
Debug XPC Client enable or disable collection of XPC debugging data and specify location for saved information; this command should be used only under the direction of BMC Software support personnel
Exclude Classes from BCI edit the list of the Excluded Classes from Byte Code instrumentation in the Administration Server
Report Top ‘N’ EJBb query to identify the EJB components with the slowest average response time, total response time, or highest number of invocations; the report will also show the invocation rate over the previous data collection period
Report Top ‘N’ SQLb query to locate the top average SQL response times, invocation counts, or total response times; the number of results can be set (up to 30); the report will also show the invocation rate over the previous data collection period
Report Top ‘N’ WebAppb query to identify the web applications with the slowest average response time, total response time, or highest number of invocations; the report will also show the invocation rate over the previous data collection period
Activate JVM Thread Objects Collection
turn on collection of JVM thread objects
Deactivate JVM Thread Objects Collection
turn off collection of JVM thread objects
Custom MBean Monitoring
Activate enable the custom MBean feature (see Chapter 10, “Managing JMX-instrumented applications”)
Deactivate disable the custom MBean feature
Table 40 BEAWLS_SERVER menu commands (Part 5 of 5)
Menu command Action
328 PATROL for BEA WebLogic User Guide

C
BEAWLS_SERVLET application menuTable 41 lists the menu commands for the BEAWLS_SERVLET application class. These menu commands are available when monitoring WebLogic 7.0, 8.1, 9.x, and 10.x environments.
BEAWLS_SETUP application menuTable 42 lists the menu commands for the BEAWLS_SETUP application class. These menu commands are available when monitoring WebLogic 7.0, 8.1, 9.x, and 10.x environments.
a. These menu commands may change configuration and runtime settings of the BEA WebLogic Application Servers. To execute these commands you must enter the BEA WebLogic Administrator username and password. To disable this feature, add the pconfig variable /BEAWLS_SERVER/authenticationDisabled with the value true.
b. When the Top ‘N’ reports are run from a server icon, the reported results span all instances of that object type on the server. Some of these reports can also be run from other application classes (such as DBURL), in which case results are only for that specific instance of the object type.
Table 41 BEAWLS_SERVLET menu commands
Menu command Action
Methods Response Report... generate a report listing the response performance data on HttpServlet class methods (including doPost, doGet, doPut, and doDelete); results include average response time, total response time, and invocation rate
Stop Monitoring stop monitoring a previously monitored servlet
Table 42 BEAWLS_SETUP menu commands (Part 1 of 2)
Menu command Action
Register WebLogic Server register a new WebLogic application server instance
Update Registered Server update the information (including password) for a registered WebLogic Server instance
Unregister WebLogic Server delete a registered instance; this will stop the instance from being monitored
Report of Registered Instance generate a report on all registered WebLogic application servers
Define Additional JVM Arguments add JVM Arguments to the command line of all Java collectors
Chapter C Menu summary 329
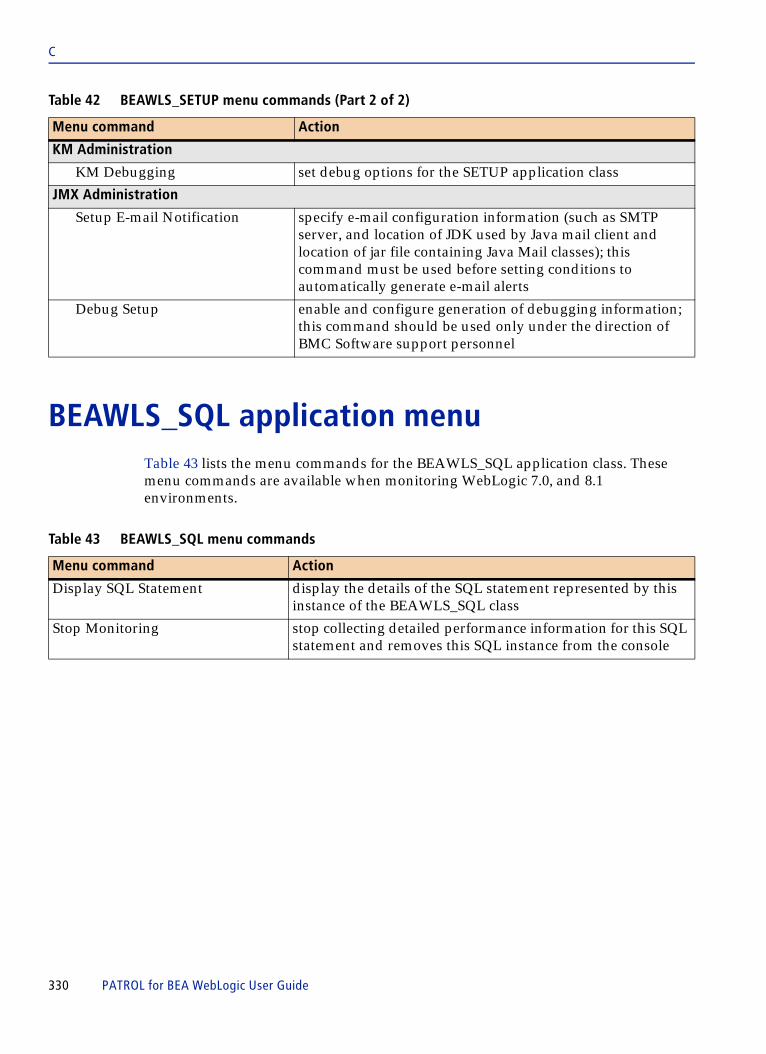
C
BEAWLS_SQL application menuTable 43 lists the menu commands for the BEAWLS_SQL application class. These menu commands are available when monitoring WebLogic 7.0, and 8.1 environments.
KM Administration
KM Debugging set debug options for the SETUP application class
JMX Administration
Setup E-mail Notification specify e-mail configuration information (such as SMTP server, and location of JDK used by Java mail client and location of jar file containing Java Mail classes); this command must be used before setting conditions to automatically generate e-mail alerts
Debug Setup enable and configure generation of debugging information; this command should be used only under the direction of BMC Software support personnel
Table 43 BEAWLS_SQL menu commands
Menu command Action
Display SQL Statement display the details of the SQL statement represented by this instance of the BEAWLS_SQL class
Stop Monitoring stop collecting detailed performance information for this SQL statement and removes this SQL instance from the console
Table 42 BEAWLS_SETUP menu commands (Part 2 of 2)
Menu command Action
330 PATROL for BEA WebLogic User Guide

C
BEAWLS_THREADPOOL application menu Table 44 lists the menu commands for the BEAWLS_THREADPOOL application class. These menu commands are available when monitoring WebLogic 9.x and 10.x environments.
Table 44 BEAWLS_THREADPOOL menu commands
Menu command Action
Thread Pool Threads Report generates a report about the executions thread details and the health state of this thread pool
The report also contains information about the following thread attributes:
■ Completed Request Count ■ Pending User Request Count ■ Hogging Thread Count ■ Throughput ■ Execute Thread Idle Count ■ Standby Thread Count ■ Queue Length ■ Execute Thread Total Count ■ Active Execute Thread
For each Execute Thread, the report also contains the following thread attributes:
■ Name ■ Thread Current Request ■ Serviced Request Total Count ■ Requested User ■ Thread Idle state
Chapter C Menu summary 331

C
BEAWLS_WEBAPP application menuTable 45 lists the menu commands for the BEAWLS_WEBAPP application class. These menu commands are available when monitoring WebLogic 7.0, 8.1, 9.x, and 10.x environments.
BEAWLS_WS application menuTable 46 lists the menu commands for the BEAWLS_WS application class. These menu commands are available when monitoring WebLogic 8.1, 9.x, and 10.x environments.
Table 45 BEAWLS_WEBAPP menu commands
Menu command Action
Monitor Servlets specify the servlet to be monitored
Servlet Performance Report produce a list of registered servlets and their properties
Report Top ‘N’ Servlet show which web application servlets have the longest average response time, longest total response time, and highest number of invocations
Report on Deployment Configuration generate a report on the deployment configuration for this web application
Table 46 BEAWLS_WS menu commands
Menu command Action
Reports
All WS Handlers generate a report that lists the service handlers runtime matrix
All WS Operations generate a report that lists the service operations runtime matrix
Monitor Service Operations select a specific web service operation for monitoring
Monitor Operation Handlers select a specific web service handler for monitoring
Note: This command is not supported on WebLogic Server 9.x and 10.x.
Reset Statistics reset all of the failure statistics that have been gathered in this web service
Note: This command is not supported on WebLogic Server 9.x and 10.x.
332 PATROL for BEA WebLogic User Guide

C
BEAWLS_WS_HDL application menuTable 47 lists the menu commands for the BEAWLS_WS_HDL application class. These menu commands are available when monitoring WebLogic 8.1 environments.
BEAWLS_WS_OPER application menuTable 48 lists the menu commands for the BEAWLS_WS_OPER application class. These menu commands are available when monitoring WebLogic 8.1, 9.x, and 10.x environments.
Table 47 BEAWLS_WS_HDL menu commands
Menu command Action
Reset Statistics reset all of the failure statistics that have been gathered in this web service handler
Stop Monitoring removes this PATROL instance
Table 48 BEAWLS_WS_OPER menu commands
Menu command Action
Reset Statistics reset all of the failure statistics that have been gathered in this web service operation
Note: This command is not supported on WebLogic Server 9.x and 10.x.
Stop Monitoring removes this PATROL instance
Chapter C Menu summary 333

C
JMX_CONDITION application menuTable 49 lists the menu commands for the JMX_CONDITION application class. These menu commands are available when monitoring WebLogic 7.0, 8.1, 9.x, and 10.x environments.
JMX_DOMAIN application menuTable 50 lists the menu commands for the JMX_DOMAIN application class. These menu commands are available when monitoring WebLogic 7.0, 8.1, 9.x, and 10.x environments.
Table 49 JMX_CONDITION menu commands
Menu command Action
View Condition Report report on all MBeans being monitored for this condition, including status of each; if notifications are enabled on an MBean, the report will include the number of outstanding notifications; attribute-based MBeans will include the attribute value
Modify Condition... change the definition of a condition, including thresholds on attributes and e-mail settings on notifications
Remove Condition remove a condition definition, stopping all monitoring and actions associated with the condition
Reset Notifications this command will clear any notifications issued by a notification-based condition and return the object to an OK state
Table 50 JMX_DOMAIN menu commands
Menu command Action
Manage MBeans
All MBeans... view and configure registered MBeans on a domain; options are provided to filter a list of MBeans, select MBeans to view, set attributes, invoke operations, and define conditions
Select MBeans... view and configure MBeans from a select subset of registered MBeans on a domain; before filtering and setting MBean options (as in the previous command), you can narrow the range of selected MBeans based on property keys and values
334 PATROL for BEA WebLogic User Guide

C
JMX_MAIN application menuTable 51 lists the menu commands for the JMX_MAIN application class. These menu commands are available when monitoring WebLogic 7.0, 8.1, 9.x, and 10.x environments.
Table 51 JMX_MAIN Menu commands
Menu command Action
Setup
Listener... define configuration information needed to start the JMX Listener application; this command must be used before you can register an MBean server
Remote Managed Hosts... define configuration information for managing remote MBean servers; this command must be used if a remote host uses a PATROL directory that is different from that used by the local agent
E-Mail... specify e-mail configuration information (such as SMTP server, and location of JDK used by Java mail client and location of jar file containing Java Mail classes); this command must be used before setting conditions to automatically generate e-mail alerts
Register MBean Server... manually register an MBean server (MBean servers used by BEA WebLogic are automatically registered, you do not need to use this command to register them)
Unregister MBean Server... unregister a server that you previously registered
Set Debug Flags... enable and configure generation of debugging information; this command should be used only under the direction of BMC Software support personnel
Chapter C Menu summary 335

C
JMX_SERVER application menuTable 52 lists the menu commands for the JMX_SERVER application class. These menu commands are available when monitoring WebLogic 7.0, 8.1, 9.x, and 10.x environments.
Table 52 JMX_SERVER menu commands
Menu command Action
Manage MBeans
All MBeans... view and configure registered MBeans on this server; options are provided to filter a list of MBeans, select MBeans to view, set attributes, invoke operations, and define conditions
Select MBeans... view and configure MBeans from a select subset of registered MBeans on this server; before filtering and setting MBean options (as in the previous command), you can narrow the range of selected MBeans based on property keys and values
Register MBean... create and register a new MBean in the server; a dialog requests information about the MBean object name, class, and a list of URLs or files to be searched for MBeans and their referenced classes
Define Conditions... view and modify conditions being monitored by this server; condition definitions include JMX notifications or attribute thresholds
336 PATROL for BEA WebLogic User Guide

C h a p t e r D
D InfoBox SummaryThis chapter summarizes InfoBoxes available in PATROL for BEA WebLogic. The following topics are discussed in this chapter:
About InfoBoxes. . . . . . . . . . . . . . . . . . . . . . . . . . . . . . . . . . . . . . . . . . . . . . . . . . . . . . . . . 339BEAWLI_INTEGRATION InfoBox . . . . . . . . . . . . . . . . . . . . . . . . . . . . . . . . . . . . . . . . . 339BEAWLI_PROCESS InfoBox . . . . . . . . . . . . . . . . . . . . . . . . . . . . . . . . . . . . . . . . . . . . . . 340BEAWLP_CACHE InfoBox . . . . . . . . . . . . . . . . . . . . . . . . . . . . . . . . . . . . . . . . . . . . . . . 341BEAWLP_PORTAL InfoBox. . . . . . . . . . . . . . . . . . . . . . . . . . . . . . . . . . . . . . . . . . . . . . . 341BEAWLS_CLUSTER InfoBox . . . . . . . . . . . . . . . . . . . . . . . . . . . . . . . . . . . . . . . . . . . . . . 341BEAWLS_DBURL InfoBox . . . . . . . . . . . . . . . . . . . . . . . . . . . . . . . . . . . . . . . . . . . . . . . . 342BEAWLS_EJB InfoBox . . . . . . . . . . . . . . . . . . . . . . . . . . . . . . . . . . . . . . . . . . . . . . . . . . . . 342BEAWLS_EJB_HOME InfoBox . . . . . . . . . . . . . . . . . . . . . . . . . . . . . . . . . . . . . . . . . . . . 343BEAWLS_EJB_METHOD InfoBox. . . . . . . . . . . . . . . . . . . . . . . . . . . . . . . . . . . . . . . . . . 343BEAWLS_EXEC_QUEUE InfoBox. . . . . . . . . . . . . . . . . . . . . . . . . . . . . . . . . . . . . . . . . . 344BEAWLS_JCA InfoBox . . . . . . . . . . . . . . . . . . . . . . . . . . . . . . . . . . . . . . . . . . . . . . . . . . . 344BEAWLS_JDBC InfoBox . . . . . . . . . . . . . . . . . . . . . . . . . . . . . . . . . . . . . . . . . . . . . . . . . . 346BEAWLS_JMS InfoBox . . . . . . . . . . . . . . . . . . . . . . . . . . . . . . . . . . . . . . . . . . . . . . . . . . . 348BEAWLS_JMS_DESTINATION InfoBox . . . . . . . . . . . . . . . . . . . . . . . . . . . . . . . . . . . . 348BEAWLS_JMSSERVER InfoBox. . . . . . . . . . . . . . . . . . . . . . . . . . . . . . . . . . . . . . . . . . . . 349BEAWLS_JROCKIT InfoBox. . . . . . . . . . . . . . . . . . . . . . . . . . . . . . . . . . . . . . . . . . . . . . . 350BEAWLS_JVMPROFILER InfoBox . . . . . . . . . . . . . . . . . . . . . . . . . . . . . . . . . . . . . . . . . 351BEAWLS_JOLT InfoBox . . . . . . . . . . . . . . . . . . . . . . . . . . . . . . . . . . . . . . . . . . . . . . . . . . 352BEAWLS_J2EE_APPS InfoBox. . . . . . . . . . . . . . . . . . . . . . . . . . . . . . . . . . . . . . . . . . . . . 353BEAWLS_LOCAL_MANAGED InfoBox . . . . . . . . . . . . . . . . . . . . . . . . . . . . . . . . . . . . 354BEAWLS_LOG InfoBox. . . . . . . . . . . . . . . . . . . . . . . . . . . . . . . . . . . . . . . . . . . . . . . . . . . 355BEAWLS_MANAGED InfoBox . . . . . . . . . . . . . . . . . . . . . . . . . . . . . . . . . . . . . . . . . . . . 356BEAWLS_MESSAGING_BRIDGE InfoBox . . . . . . . . . . . . . . . . . . . . . . . . . . . . . . . . . . 357BEAWLS_OS InfoBox . . . . . . . . . . . . . . . . . . . . . . . . . . . . . . . . . . . . . . . . . . . . . . . . . . . . 358BEAWLS_PROBE InfoBox . . . . . . . . . . . . . . . . . . . . . . . . . . . . . . . . . . . . . . . . . . . . . . . . 359BEAWLS_PROF_CLASS InfoBox . . . . . . . . . . . . . . . . . . . . . . . . . . . . . . . . . . . . . . . . . . 359BEAWLS_PROF_METHOD InfoBox . . . . . . . . . . . . . . . . . . . . . . . . . . . . . . . . . . . . . . . 359BEAWLS_SAF InfoBox . . . . . . . . . . . . . . . . . . . . . . . . . . . . . . . . . . . . . . . . . . . . . . . . . . . 360BEAWLS_SAFAGENT InfoBox . . . . . . . . . . . . . . . . . . . . . . . . . . . . . . . . . . . . . . . . . . . . 360BEAWLS_SERVER InfoBox . . . . . . . . . . . . . . . . . . . . . . . . . . . . . . . . . . . . . . . . . . . . . . . 361BEAWLS_SERVLET InfoBox . . . . . . . . . . . . . . . . . . . . . . . . . . . . . . . . . . . . . . . . . . . . . . 362BEAWLS_SERVLET_METHOD InfoBox . . . . . . . . . . . . . . . . . . . . . . . . . . . . . . . . . . . . 363
Chapter D InfoBox Summary 337

D
BEAWLS_SETUP InfoBox . . . . . . . . . . . . . . . . . . . . . . . . . . . . . . . . . . . . . . . . . . . . . . . . . 363BEAWLS_SQL InfoBox . . . . . . . . . . . . . . . . . . . . . . . . . . . . . . . . . . . . . . . . . . . . . . . . . . . 364BEAWLS_THREADPOOL InfoBox . . . . . . . . . . . . . . . . . . . . . . . . . . . . . . . . . . . . . . . . . 364BEAWLS_TUXEDO_CONNECTOR InfoBox. . . . . . . . . . . . . . . . . . . . . . . . . . . . . . . . . 364BEAWLS_WEBAPP InfoBox. . . . . . . . . . . . . . . . . . . . . . . . . . . . . . . . . . . . . . . . . . . . . . . 365BEAWLS_WORKLOAD InfoBox . . . . . . . . . . . . . . . . . . . . . . . . . . . . . . . . . . . . . . . . . . . 365BEAWLS_WS InfoBox . . . . . . . . . . . . . . . . . . . . . . . . . . . . . . . . . . . . . . . . . . . . . . . . . . . . 366BEAWLS_WS_HDL InfoBox. . . . . . . . . . . . . . . . . . . . . . . . . . . . . . . . . . . . . . . . . . . . . . . 366BEAWLS_WS_OPER InfoBox . . . . . . . . . . . . . . . . . . . . . . . . . . . . . . . . . . . . . . . . . . . . . . 367JMX_SERVER InfoBox . . . . . . . . . . . . . . . . . . . . . . . . . . . . . . . . . . . . . . . . . . . . . . . . . . . . 368JMX_CONDITION InfoBox . . . . . . . . . . . . . . . . . . . . . . . . . . . . . . . . . . . . . . . . . . . . . . . 368
338 PATROL for BEA WebLogic User Guide

D
About InfoBoxesThe InfoBoxes that are available depend on which version of BEA WebLogic Server is installed in your environment and how your WebLogic and PATROL monitoring environments are configured. Some application classes may appear only if certain features are enabled in your environment or configured for your PATROL monitoring environment. (See “Application classes and icons” on page 28 and “Verifying and troubleshooting WebLogic Server configuration” on page 119).
The InfoBoxes that you see displayed for a given server may not show all of the possible information described in this document. The information can vary depending on the WebLogic version and the monitoring level selected.
WebLogic versions
The tables in this appendix indicate which fields are displayed only for specific versions of WebLogic. Most information is shown for all WebLogic versions, but some types of information are relevant only for servers that support features of specific WebLogic versions.
Basic level
To improve performance in minimally configured servers, PATROL for BEA WebLogic can be configured in a Basic monitoring mode that provides only a bare subset of parameters and a more limited range of InfoBox fields. If you do not see an InfoBox field displayed in your monitoring environment, it may be that your configuration is set to BASIC level. You can change the configuration level as described in “Registering a server” on page 93.
BEAWLI_INTEGRATION InfoBoxTable 53 describes the non-standard InfoBox values for the BEAWLI_INTEGRATION application class. These InfoBox values are available when monitoring WebLogic 8.1, 9.x, and 10.x environments. All InfoBox fields for this class are displayed in either BASIC or FULL monitoring mode.
Table 53 BEAWLI_INTEGRATION InfoBox for WebLogic 8.1 (Part 1 of 2)
Item Description
B2B Host Name the name of the integration server
B2B Proxy Host the proxy host of the WebLogic B2B Integration server
B2B Proxy Port the proxy port of the WebLogic B2B Integration server
Chapter D InfoBox Summary 339
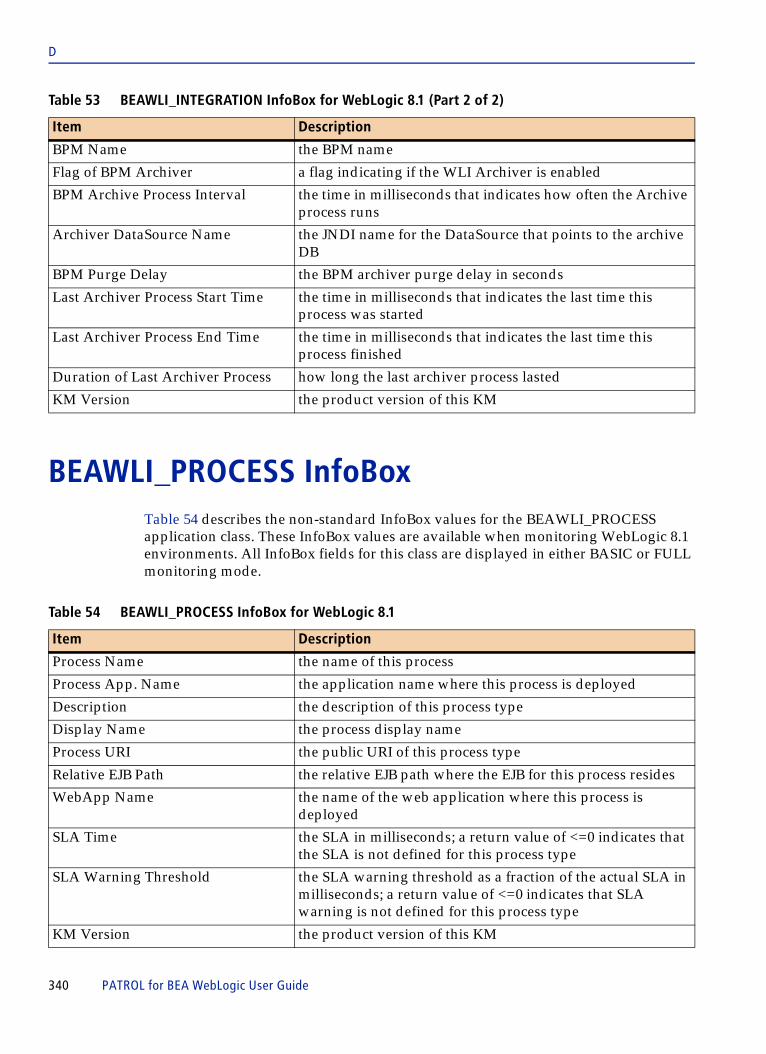
D
BEAWLI_PROCESS InfoBoxTable 54 describes the non-standard InfoBox values for the BEAWLI_PROCESS application class. These InfoBox values are available when monitoring WebLogic 8.1 environments. All InfoBox fields for this class are displayed in either BASIC or FULL monitoring mode.
BPM Name the BPM name
Flag of BPM Archiver a flag indicating if the WLI Archiver is enabled
BPM Archive Process Interval the time in milliseconds that indicates how often the Archive process runs
Archiver DataSource Name the JNDI name for the DataSource that points to the archive DB
BPM Purge Delay the BPM archiver purge delay in seconds
Last Archiver Process Start Time the time in milliseconds that indicates the last time this process was started
Last Archiver Process End Time the time in milliseconds that indicates the last time this process finished
Duration of Last Archiver Process how long the last archiver process lasted
KM Version the product version of this KM
Table 54 BEAWLI_PROCESS InfoBox for WebLogic 8.1
Item Description
Process Name the name of this process
Process App. Name the application name where this process is deployed
Description the description of this process type
Display Name the process display name
Process URI the public URI of this process type
Relative EJB Path the relative EJB path where the EJB for this process resides
WebApp Name the name of the web application where this process is deployed
SLA Time the SLA in milliseconds; a return value of <=0 indicates that the SLA is not defined for this process type
SLA Warning Threshold the SLA warning threshold as a fraction of the actual SLA in milliseconds; a return value of <=0 indicates that SLA warning is not defined for this process type
KM Version the product version of this KM
Table 53 BEAWLI_INTEGRATION InfoBox for WebLogic 8.1 (Part 2 of 2)
Item Description
340 PATROL for BEA WebLogic User Guide

D
BEAWLP_CACHE InfoBoxTable 55 describes the non-standard InfoBox values for the BEAWLP_CACHE application class. These InfoBox values are available when monitoring WebLogic 8.1 environments. All InfoBox fields for this class are displayed in either BASIC or FULL monitoring mode.
BEAWLP_PORTAL InfoBoxTable 56 describes the non-standard InfoBox values for the BEAWLP_PORTAL application class. These InfoBox values are available when monitoring WebLogic 8.1 environments. All InfoBox fields for this class are displayed in either BASIC or FULL monitoring mode.
BEAWLS_CLUSTER InfoBoxTable 57 describes the non-standard InfoBox values for the BEAWLS_CLUSTER application class. These InfoBox values are available when monitoring WebLogic 7.0, 9.x, and 10.x environments. All InfoBox fields for this class are displayed in either BASIC or FULL monitoring mode.
Table 55 BEAWLP_CACHE InfoBox for WebLogic 8.1
Item Description
Cache Name the name of this cache service
Max Entries the maximum number of entries allowed in the cache
Time To Live the default time-to-live in milliseconds for cache elements
KM Version the product version of this KM
Table 56 BEAWLP_PORTAL InfoBox for WebLogic 8.1
Item Description
Portal Name the name of this portal service
KM Version the product version of this KM
Table 57 BEAWLS_CLUSTER InfoBox for WebLogic 7.0 (Part 1 of 2)
Item Description
Cluster Name name of the cluster
Cluster Address address to be used by clients to connect to the cluster
Chapter D InfoBox Summary 341
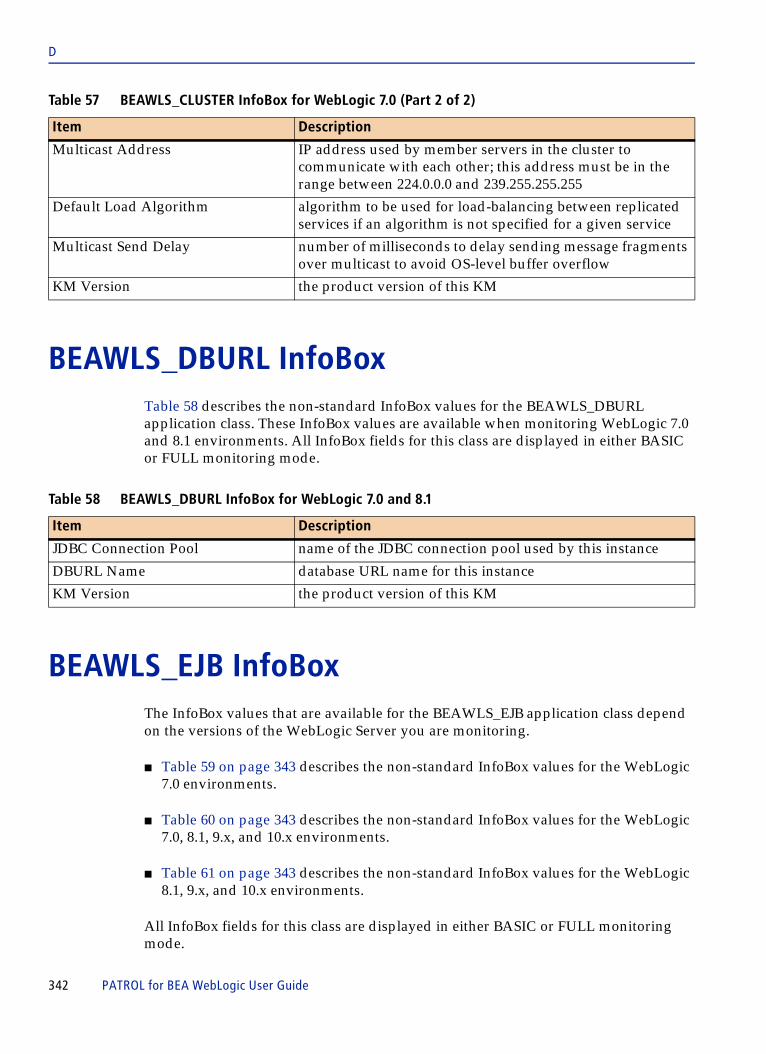
D
BEAWLS_DBURL InfoBoxTable 58 describes the non-standard InfoBox values for the BEAWLS_DBURL application class. These InfoBox values are available when monitoring WebLogic 7.0 and 8.1 environments. All InfoBox fields for this class are displayed in either BASIC or FULL monitoring mode.
BEAWLS_EJB InfoBoxThe InfoBox values that are available for the BEAWLS_EJB application class depend on the versions of the WebLogic Server you are monitoring.
■ Table 59 on page 343 describes the non-standard InfoBox values for the WebLogic 7.0 environments.
■ Table 60 on page 343 describes the non-standard InfoBox values for the WebLogic 7.0, 8.1, 9.x, and 10.x environments.
■ Table 61 on page 343 describes the non-standard InfoBox values for the WebLogic 8.1, 9.x, and 10.x environments.
All InfoBox fields for this class are displayed in either BASIC or FULL monitoring mode.
Multicast Address IP address used by member servers in the cluster to communicate with each other; this address must be in the range between 224.0.0.0 and 239.255.255.255
Default Load Algorithm algorithm to be used for load-balancing between replicated services if an algorithm is not specified for a given service
Multicast Send Delay number of milliseconds to delay sending message fragments over multicast to avoid OS-level buffer overflow
KM Version the product version of this KM
Table 58 BEAWLS_DBURL InfoBox for WebLogic 7.0 and 8.1
Item Description
JDBC Connection Pool name of the JDBC connection pool used by this instance
DBURL Name database URL name for this instance
KM Version the product version of this KM
Table 57 BEAWLS_CLUSTER InfoBox for WebLogic 7.0 (Part 2 of 2)
Item Description
342 PATROL for BEA WebLogic User Guide

D
BEAWLS_EJB_HOME InfoBoxTable 62 describes the non-standard InfoBox values for the BEAWLS_EJB_HOME application class. These InfoBox values are available when monitoring all supported WebLogic environments. All InfoBox fields for this class are displayed in either BASIC or FULL monitoring mode.
BEAWLS_EJB_METHOD InfoBoxTable 63 describes the InfoBox values for the BEAWLS_EJB_METHOD application class. These InfoBox values are available when monitoring WebLogic 7.0 and 8.1 environments. All InfoBox fields for this class are displayed in either BASIC or FULL monitoring mode.
Table 59 BEAWLS_EJB InfoBox for WebLogic 7.0
Item Description
EJB Component Name name of the application that contains this EJB (for example, ejb_bmc_wl.jar)
Table 60 BEAWLS_EJB InfoBox for WebLogic 7.0, 8.1, 9.x, and 10.x
Item Description
Deployment State the deployment state of this EJB module
Table 61 BEAWLS_EJB InfoBox for WebLogic 8.1, 9.x, and 10.x
Item Description
KM Version the product version of this KM
Table 62 BEAWLS_EJB_HOME InfoBox
Item Description
Interface Name instance name for this EJB
EJB Type type of EJB (for example, stateful session)
Transactions Committed total number of transactions committed by this specific EJB
Transactions Rolled Back total number of transactions rolled back by this EJB
Transactions Timed Out total number of transactions timed out for this EJB
KM Version the product version of this KM
Chapter D InfoBox Summary 343

D
BEAWLS_EXEC_QUEUE InfoBoxThe InfoBox values that are available for the BEAWLS_EXEC_QUEUE application class depend on the versions of the WebLogic Server you are monitoring. Table 64 describes the non-standard InfoBox values for the WebLogic 7.0 and 8.1 environments. Table 65 describes the non-standard InfoBox values for the WebLogic 7.0 and 8.1 environments. The “Mode” column indicates whether the item is displayed in BASIC or FULL monitoring level (see, “Basic level” on page 339).
BEAWLS_JCA InfoBoxThe InfoBox values that are available for BEAWLS_JCA application class depend on the versions of the WebLogic Server you are monitoring. The InfoBox commands for each version are listed in the following tables:
Table 63 BEAWLS_EJB_METHOD InfoBox for WebLogic 7.0 and 8.1
Item Description
KM Version the product version of this KM
Table 64 BEAWLS_EXEC_QUEUE InfoBox for WebLogic 7.0 and 8.1
Item Description
KM Version the product version of this KM
Table 65 BEAWLS_EXEC_QUEUE InfoBox for WebLogic 7.0 and 8.1
Item Description
Queue Length Threshold Percent the percentage of the Queue Length size that can be reached before this server indicates an overflow condition for the queue
Thread Priority the priority of the threads associated with the queue
Threads Increase the number of threads to grow when a queue is within the QueueLengthThresholdPercent of the MaxQueueLength
Threads Minimum the minimum number of threads that the WebLogic Server maintains in the queue
Threads Maximum the maximum number of threads that this execute queue can have
344 PATROL for BEA WebLogic User Guide

D
The “Mode” column indicates whether the item is displayed in BASIC or FULL monitoring level (see, “Basic level” on page 339).
WebLogic Server version 7.0, 8.1, 9.x, and 10.x
Table 66
8.1, 9.x, and 10.x Table 67
9.x and 10.x Table 68
Table 66 BEAWLS_JCA InfoBox for WebLogic 7.0, 8.1, 9.x, and 10.x
Item Description Mode
Capacity Increment number of connections added to the pool when the capacity is increased
FULL
Connection Factory Name name of the connection factory FULL
Connection Pool Name configured logical name for the connection factory using this connector connection pool
FULL
Initial Capacity initial number of connections created in the connection pool
FULL
Is Logging Enabled flag indicating whether logging is enabled for the managed connection factory or managed connection
FULL
Is Shrinking Enabled flag indicating whether the pool will attempt to shrink itself
FULL
JNDI Name JNDI name for the managed connection factory reference for the client to lookup in order to get a connection to the EIS resources
FULL
Log File Name log file used by the resource adapter for this connector connection pool
FULL
Max Capacity maximum number of connections allowed in the pool FULL
Max Idle Time the configured maximum idle time for this pool FULL
Resource Adapter Link Ref resource adapter link reference for cases where this connection factory refers to an existing resource adapter deployment
FULL
Shrink Period (Minutes) length of time to wait before shrinking the connection pool
FULL
Shrink Count Down Time runtime information about the amount of time left (in minutes) until an attempt to shrink the pool will be made
FULL
Transaction Support transaction support (none, local, or XA) FULL
KM Version the product version of this KM BASIC
Chapter D InfoBox Summary 345

D
BEAWLS_JDBC InfoBoxThe InfoBox values that are available for BEAWLS_JDBC application class depend on the versions of the WebLogic Server you are monitoring.
■ Table 69 describes the non-standard InfoBox values for the WebLogic 7.0 environments.
■ Table 70 on page 347 describes the non-standard InfoBox values for the WebLogic 7.0, 8.1, 9.x, and 10.x environments.
■ Table 71 on page 347 describes the non-standard InfoBox values for the WebLogic 8.1, 9.x, and 10.x environments.
The “Mode” column indicates whether the item is displayed in BASIC or FULL monitoring level (see, “Basic level” on page 339).
Table 67 BEAWLS_JCA InfoBox for WebLogic 8.1, 9.x, and 10.x
Item Description Mode
Deployment State the deployment status of this web application module BASIC
Table 68 BEAWLS_JCA InfoBox for WebLogic 9.x and 10.x
Item Description Mode
Inbound Connection State the state of the inbound connection for the pool instance BASIC
Table 69 BEAWLS_JDBC InfoBox for WebLogic 7.0 (Part 1 of 2)
Item Description Mode
JDBC Driver name of the JDBC driver used by the connection pool FULL
URL location of the JDBC driver used by the connection pool FULL
Shrink Flag true/false flag indicating whether the JDBC connection pool can shrink
FULL
Shrinking Period amount of idle time allowed before a JDBC connection pool starts shrinking, if the connection pool is shrinkable
FULL
Max Capacity maximum number of database connections that can be maintained by the connection pool
FULL
Initial Capacity number of connections maintained by the pool when it is first activated
FULL
346 PATROL for BEA WebLogic User Guide

D
Capacity Increment increment for the pool capacity; when the pool size is increased, this represents the number of connections added at one time
FULL
Refresh Minutes connection refresh interval FULL
Login Delay Seconds number of seconds to delay between logins when creating the pool
some database servers cannot handle multiple simultaneous connection requests
FULL
Active Connections High peak number of connections simultaneously in use FULL
Total Connections total number of connections serviced by this pool FULL
Wait Seconds High peak number of seconds that a job had to wait for a connection
FULL
Waiting for Connections High peak number of jobs waiting for connections; the number is reset when a JDBC connection pool is instantiated
FULL
Connections Leaked number of connections leaked by this pool BASIC
Statement Profile Status flag indicating whether SQL statement profiling is currently enabled for this pool
FULL
Connection Leak Profile Status flag indicating whether connection leak profiling is on FULL
Prep Stmt Cache Profiling Status
flag indicating whether prepared statement cache profiling is currently enabled for this pool
FULL
Total Failures to Reconnect Count
number of times that an attempt to connect to the database failed since the server was last started
BASIC
Table 70 BEAWLS_JDBC InfoBox for WebLogic 7.0, 8.1, 9.x, and 10.x
Item Description
KM Version the product version of this KM
Table 71 BEAWLS_JDBC InfoBox for WebLogic 8.1, 9.x, and 10.x
Item Description
Active Connections Average the average of active connections in this JDBCConnectionPool
Current Capacity the current capacity of this connection pool
Available Connections High the highest number of available connections in this pool
Unavailable Connections High the highest number of unavailable connections in this pool
Table 69 BEAWLS_JDBC InfoBox for WebLogic 7.0 (Part 2 of 2)
Item Description Mode
Chapter D InfoBox Summary 347

D
BEAWLS_JMS InfoBoxTable 76 describes the non-standard InfoBox values for the BEAWLS_JMS applicatiOn class. These InfoBox values are available when monitoring WebLogic 7.0 and 8.1 environments. These InfoBox fields are displayed only at the FULL configuration level; none of these fields will be displayed if the monitoring configuration is set to BASIC (see “Basic level” on page 339).
BEAWLS_JMS_DESTINATION InfoBoxTable 73 describes the non-standard InfoBox values for the BEAWLS_JMS applicatiOn class. These InfoBox values are available when monitoring WebLogic 7.0 and 8.1 environments. These InfoBox fields are displayed only at the FULL configuration level; none of these fields will be displayed if the monitoring configuration is set to BASIC (see “Basic level” on page 339).
Table 72 BEAWLS_JMS InfoBox for WebLogic 7.0 and 8.1
Item Description
JMS Servers High the peak number of JMS servers that were deployed on this WebLogic Server instance since the server was started
JMS Servers Total the number of JMS servers that were deployed on this WebLogic Server instance since the server was started
JMS Connections High the peak number of connections to this WebLogic Server since the last reset
JMS Connections Total the total number of connections made to this WebLogic Server since the last reset
KM Version the product version of this KM
Table 73 BEAWLS_JMS_DESTINATION InfoBox for WebLogic 7.0 and 8.1 (Part 1 of 2)
Item Description
Destination Type the type of destination: queue or topic
JNDI Name the JNDI name of the destination
JNDI Name Replicated the specification whether or not the JNDI name for the destination (if present) is replicated across the cluster
Store Enabled the specification whether or not the destination uses the backing store specified by the JMS server
Bytes High the peak number of bytes stored in the destination since the last reset
Messages High the peak number of messages in the destination since the last reset
348 PATROL for BEA WebLogic User Guide

D
BEAWLS_JMSSERVER InfoBoxThe InfoBox values that are available for BEAWLS_JMSSERVER application class depend on the versions of the WebLogic Server you are monitoring. Table 74 describes the non-standard InfoBox values for the WebLogic 7.0 environments. Table 75 describes the non-standard InfoBox values for the WebLogic 7.0 and 8.1 environments. Table 76 describes the non-standard InfoBox values for the WebLogic 8.1 environments. These InfoBox fields are displayed only at the FULL configuration level; none of these fields will be displayed if the monitoring configuration is set to BASIC (see “Basic level” on page 339).
Consumers High the peak number of consumers accessing this destination since the last reset
Consumers Total the total number of consumers accessing this destination since the last reset
KM Version the product version of this KM
Table 74 BEAWLS_JMSSERVER InfoBox for WebLogic 7.0
Item Description
Bytes Maximum highest number of bytes since last cycle
Bytes Threshold High peak number of bytes stored on the JMS server since the last reset
Bytes Threshold Low lowest number of bytes stored on the JMS server since last reset
Message Maximum configured limit for storing messages on the JMS server
Message Threshold High peak number of messages stored on the JMS server since last reset
Message Threshold Low lowest number of messages stored on the JMS server since last reset
Health Status assessment of the overall condition of the JMS server
Table 75 BEAWLS_JMSSERVER InfoBox for WebLogic 7.0 and 8.1
Item Description
KM Version the product version of this KM
Table 73 BEAWLS_JMS_DESTINATION InfoBox for WebLogic 7.0 and 8.1 (Part 2 of 2)
Item Description
Chapter D InfoBox Summary 349

D
BEAWLS_JROCKIT InfoBoxTable 77 describes the InfoBox values for the BEAWLS_JROCKIT application class. These InfoBox values are available when monitoring WebLogic 8.1, 9.x, and 10.x environments. The “Mode” column indicates whether the item is displayed in BASIC or FULL monitoring level (see, “Basic level” on page 339).
Table 76 BEAWLS_JMSSERVER InfoBox for WebLogic 8.1
Item Description
MaximumMessageSize the maximum size of a message that will be accepted from producers on this JMS server
Table 77 BEAWLS_JROCKIT InfoBox for WebLogic 8.1, 9.x, and 10.x (Part 1 of 2)
Item Description Mode
GC Concurrent indicates whether the VM garbage collector runs in a separate Java thread concurrently with the other threads
BASIC
GC Handles Compaction indicates whether the VM garbage collector compacts the Java heap; usually the heap is scattered throughout available memory, a garbage collector that compacts the heap defragments the memory space and deletes unused objects
BASIC
GC Algorithm type of garbage collection performed by the JRockit JVM, can be the following types:
■ generational copying: suitable for testing applications on a desktop machine with a small heap (less than 128MB)
■ single spaced concurrent: reduces or eliminates pauses in the VM caused by garbage collection; requires larger heap than other algorithms
■ generational concurrent: creates a nursery space within the heap; when the nursery fills, JRockit stops everything, removing dead objects, moving live objects to another space within heap, and running another thread to remove dead objects outside the nursery space
■ parallel: allocates all objects to a single heap space, when the heap fills, all Java threads are stopped and a complete garbage collection is done on the entire heap; causes longer pause times but maximizes memory throughput
BASIC
350 PATROL for BEA WebLogic User Guide

D
BEAWLS_JVMPROFILER InfoBoxTable 78 describes the non-standard InfoBox values for the BEAWLS_JVMPROFILER application class. These InfoBox values are available when monitoring WebLogic 7.0 and 8.1 environments. All InfoBox fields for this class are displayed in either BASIC or FULL monitoring mode.
Generational indicates whether the garbage collector uses a nursery space, collecting garbage from a limited range of the allocated heap
BASIC
Incremental indicates whether the JVM garbage collector collects garbage incrementally as it scans the memory space, dumping the garbage at the end of the cycle (with non-incremental GC, garbage is dumped when encountered)
BASIC
Last GC Start time that the last garbage collection cycle started BASIC
Last GC End time that the last garbage collection cycle completed BASIC
Total GC Count total number of times that garbage collection has run since the JVM started
BASIC
Total GC Time total amount of time spent on garbage collection since the JVM started
BASIC
Total Nursery Size amount of space (in bytes) allocated to the nursery area FULL
Number of Daemon Threads number of daemon threads currently running in the JVM across all processors
FULL
Total Number of Threads number of Java threads (both daemon and non-daemon) running in the JVM across all processors
FULL
Uptime number of milliseconds that the JVM has been running FULL
Number of CPUs number of processors on the Virtual Machine’s host computer
BASIC
Used Physical Memory amount (in bytes) of physical memory that is currently in use on the host computer
BASIC
KM Version version number of the .km file BASIC
Table 78 BEAWLS_JVMPROFILER InfoBox for WebLogic 7.0 and 8.1 (Part 1 of 2)
Item Description
Avg GC Time average time needed to complete garbage collection cycle
Total GC Count number of times garbage collection has run on the JVM
Total GC Time cumulative time needed for all garbage collection cycles
Table 77 BEAWLS_JROCKIT InfoBox for WebLogic 8.1, 9.x, and 10.x (Part 2 of 2)
Item Description Mode
Chapter D InfoBox Summary 351

D
BEAWLS_JOLT InfoBoxTable 79 describes the non-standard InfoBox values for the BEAWLS_JOLT application class. These InfoBox values are available when monitoring WebLogic 7.0, 8.1, 9.x, and 10.x environments. These InfoBox fields are displayed only at the FULL configuration level; none of these fields will be displayed if the monitoring configuration is set to BASIC (see “Basic level” on page 339).
Last GC Time amount of time needed to run garbage collection during the most recent execution
Last GC Start Time time stamp indicating when JVM garbage collection was last started
Last GC End Time time stamp indicating when JVM garbage collection last completed
Used Heap After Last GC total amount of heap space used by active objects after garbage collection is performed
Objects in Heap After Last GC number of objects in heap after last garbage collection was performed
Peak Memory Usage highwater mark for JVM heap space used
Peak Virtual Memory Usage highwater mark for memory requirements of all active objects
Total Number of Threads total number of threads in JVM
Total Thread Objects total number of objects for all threads
JVM OS Process ID process ID used by the operating system to identify this JVM process
Method Profiling Option flag indicating whether the method profiling option was set in the Advance Monitoring options; if the flag is TRUE, then method level profiling is enabled, if the flag is FALSE then profiling is disabled; you can change the setting using the Configure Method Profiling command of the BEAWLS_SERVER application class
Note: The Configure Method Profiling command is not supported on WebLogic Server 9.x and 10.x.
KM Version the product version of this KM
Table 78 BEAWLS_JVMPROFILER InfoBox for WebLogic 7.0 and 8.1 (Part 2 of 2)
Item Description
352 PATROL for BEA WebLogic User Guide

D
BEAWLS_J2EE_APPS InfoBoxTable 80 describes the non-standard InfoBox values for the BEAWLS_J2EE_APPS application class. These InfoBox values are available when monitoring WebLogic 8.1, 9.x, and 10.x environments. All InfoBox fields for this class are displayed in either BASIC or FULL monitoring mode.
Table 79 BEAWLS_JOLT InfoBox for WebLogic 7.0, 8.1, 9.x, and 10.x
Item Description
Max Pool Size maximum number of session pools that can be created using the pool manager name
Min Pool Size minimum number of connections configured in this session pool
Primary Address primary IP address of hostname (with the port number) for this pool
Secondary Address address or hostname (with port number) to be used in the event that the primary address fails
Recv Timeout amount of time that the JOLT connection pool is configured to wait when receiving request
KM Version the product version of this KM
Table 80 BEAWLS_J2EE_APPS InfoBox
Item Description
Application Name the name of the application
Application Version the application version of this deployed J2EE application
Note: This command is available under WebLogic 9.x and 10.x only.
Deployment Type the type of deployment, for example, EAR, EXPLODED_EAR, COMPONENT, EXPLODED_COMPONENT, or Unknown
Path the location of the original source application files on the Admin Server
Load Order the order in which the applications are loaded at server startup
KM Version the product version of this KM
Chapter D InfoBox Summary 353

D
BEAWLS_LOCAL_MANAGED InfoBox Table 81 describes the non-standard InfoBox values for the BEAWLS_LOCAL_MANAGED application class. These InfoBox values are available when monitoring WebLogic 7.0, 8.1, 9.x, and 10.x environments. “Mode” indicates whether the item is displayed in BASIC or FULL monitoring level (see, “Basic level” on page 339).
Table 81 BEAWLS_LOCAL_MANAGED InfoBox for WebLogic 7.0, 8.1, 9.x, and 10.x (Part 1 of 2)
Item Description Mode
Advance Monitoring Setting flag indicating whether advanced monitoring is turned on or off for J2EE components
BASIC
Server Type type of server (managed) BASIC
Machine Name the name assigned to the WebLogic Server BASIC
Host Name the DNS host name or IP address of the monitored server
BASIC
Host IP Address IP address of the host on which the WebLogic Server resides
FULL
Listen Port plain text (non-SSL) port number on which the server listens for requests
FULL
URL server connection protocol with listening address and listening port number
BASIC
JDK Version version number of the JDK being used on the server FULL
JDK Vendor name of the vendor for the JDK being used on the server FULL
Current Heap Size amount of memory allocated to heap BASIC
Free Heap Size amount of memory in heap that is currently unused FULL
WebLogic Version version of BEA WebLogic Server running on this managed server
FULL
Server Name monitored WebLogic managed server name (server resident on the same host as the monitored PATROL Agent)
BASIC
Activation Time time stamp indicating when the server was started FULL
Server State flag indicating whether server is available (up or down) BASIC
Health Status general assessment of the overall health of the managed server; values are OK, WARN, CRITICAL, or FAILED
BASIC
Sockets Opened Total Count the total number of registrations for socket muxing on this server
FULL
RestartsTotalCount the total number of restarts for this server since the cluster was last activated
FULL
Primary Replication Group preferred cluster instance for hosting replicas of HTTP session states used in the event of failover
FULL
354 PATROL for BEA WebLogic User Guide

D
BEAWLS_LOG InfoBoxTable 82 describes the InfoBox values for the BEAWLS_LOG application class. These InfoBox values are available when monitoring WebLogic 7.0, 8.1, 9.x, and 10.x environments. All InfoBox fields for this class are displayed in either BASIC or FULL monitoring mode.
Secondary Replication Group second-choice preferred cluster instance for hosting replicas of HTTP session states used in the event of failover
FULL
KM Version the product version of this KM FULL
Table 82 BEAWLS_LOG InfoBox for WebLogic 7.0, 8.1, 9.x, and 10.x
Item Description
LOG File Name file name and path of currently monitored log
LOG File Size file size of this log
Logging Status flag indicating whether the log is active/enabled (yes) or inactive/disabled (no)
Rotation Type type of rotation currently in use (SIZE, DATE/TIME, or NONE)
rotation is a method of switching the log file currently in use to prevent one file from becoming too large; a new log may be created when the existing log reaches a certain length (SIZE), at a certain point in time (DATE or TIME, depending on the log file type), or rotation can be disabled (NONE)
Log Files Number total number of rotation files, including the current log file
Sniffing Status flag indicating whether pattern matching is in use
Sniffing Pattern string pattern being matched for currently monitored log
Sniffing Type indicates whether sniffing is done in real time or on periodic basis
KM Version the product version of this KM
Table 81 BEAWLS_LOCAL_MANAGED InfoBox for WebLogic 7.0, 8.1, 9.x, and 10.x (Part 2 of 2)
Item Description Mode
Chapter D InfoBox Summary 355

D
BEAWLS_MANAGED InfoBoxTable 80 describes the InfoBox values for the BEAWLS_MANAGED application class. These InfoBox values are available when monitoring WebLogic 7.0, 8.1, 9.x, and 10.x environments. “Mode” indicates whether the item is displayed in BASIC or FULL monitoring level (see, “Basic level” on page 339).
Table 83 BEAWLS_MANAGED InfoBox for WebLogic 7.0, 8.1, 9.x, and 10.x (Part 1 of 2)
Item Description Mode
Server Type type of server BASIC
Machine Name monitored remote WebLogic server name BASIC
Host Name host name of the machine on which the WebLogic Server resides
FULL
Host IP Address IP address of the host on which the WebLogic Server resides
FULL
Listen Port plain text (non-SSL) port number on which the server listens for requests
FULL
URL server connection protocol with listening address and listening port number
BASIC
JDK Version version number of the JDK being used on the server FULL
JDK Vendor name of the vendor for the JDK being used on the server FULL
Current Heap Size amount of memory allocated to heap BASIC
Free Heap Size amount of memory in heap that is currently unused FULL
WebLogic Version version of BEA WebLogic Server running on this managed server
FULL
Server Name monitored WebLogic managed server name (server resident on the same host as the monitored PATROL Agent)
BASIC
Activation Time time stamp indicating when the server was started FULL
Server State flag indicating whether server is up or down BASIC
Health Status general assessment of the overall health of the managed server; values are OK, WARN, CRITICAL, or FAILED
BASIC
Sockets Opened Total Count the total number of registrations for socket muxing on this server
FULL
RestartsTotalCount the total number of restarts for this server since the cluster was last activated
FULL
Primary Replication Group preferred cluster instance for hosting replicas of HTTP session states used in the event of failover
FULL
356 PATROL for BEA WebLogic User Guide
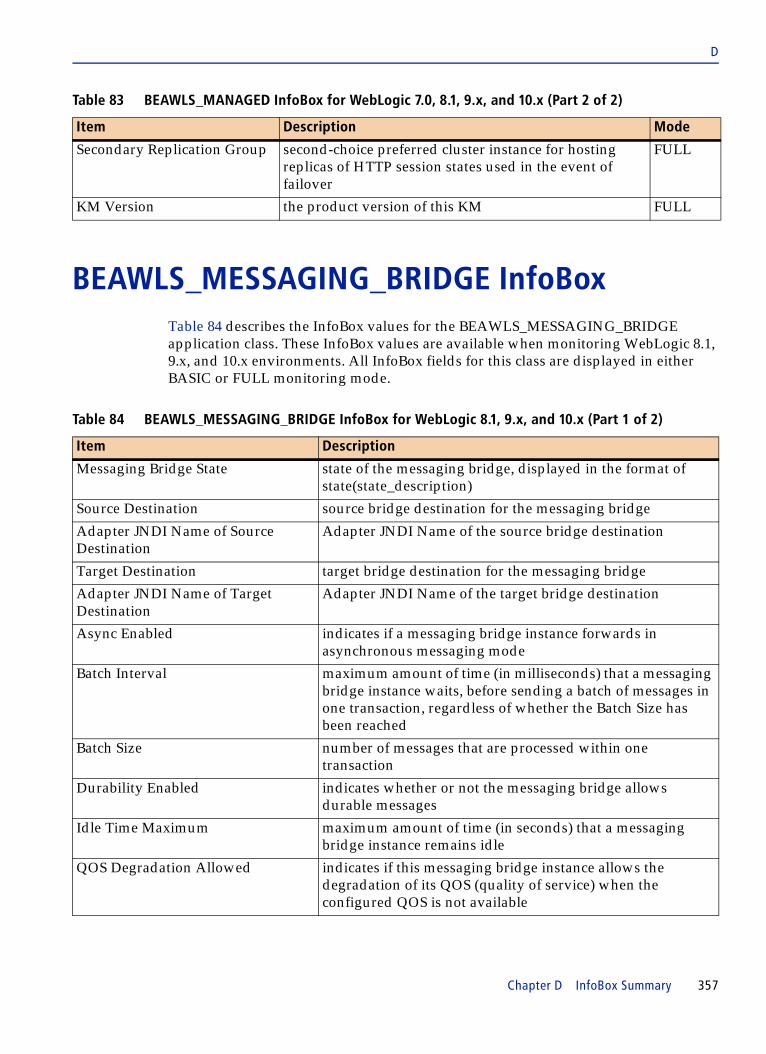
D
BEAWLS_MESSAGING_BRIDGE InfoBoxTable 84 describes the InfoBox values for the BEAWLS_MESSAGING_BRIDGE application class. These InfoBox values are available when monitoring WebLogic 8.1, 9.x, and 10.x environments. All InfoBox fields for this class are displayed in either BASIC or FULL monitoring mode.
Secondary Replication Group second-choice preferred cluster instance for hosting replicas of HTTP session states used in the event of failover
FULL
KM Version the product version of this KM FULL
Table 84 BEAWLS_MESSAGING_BRIDGE InfoBox for WebLogic 8.1, 9.x, and 10.x (Part 1 of 2)
Item Description
Messaging Bridge State state of the messaging bridge, displayed in the format of state(state_description)
Source Destination source bridge destination for the messaging bridge
Adapter JNDI Name of Source Destination
Adapter JNDI Name of the source bridge destination
Target Destination target bridge destination for the messaging bridge
Adapter JNDI Name of Target Destination
Adapter JNDI Name of the target bridge destination
Async Enabled indicates if a messaging bridge instance forwards in asynchronous messaging mode
Batch Interval maximum amount of time (in milliseconds) that a messaging bridge instance waits, before sending a batch of messages in one transaction, regardless of whether the Batch Size has been reached
Batch Size number of messages that are processed within one transaction
Durability Enabled indicates whether or not the messaging bridge allows durable messages
Idle Time Maximum maximum amount of time (in seconds) that a messaging bridge instance remains idle
QOS Degradation Allowed indicates if this messaging bridge instance allows the degradation of its QOS (quality of service) when the configured QOS is not available
Table 83 BEAWLS_MANAGED InfoBox for WebLogic 7.0, 8.1, 9.x, and 10.x (Part 2 of 2)
Item Description Mode
Chapter D InfoBox Summary 357
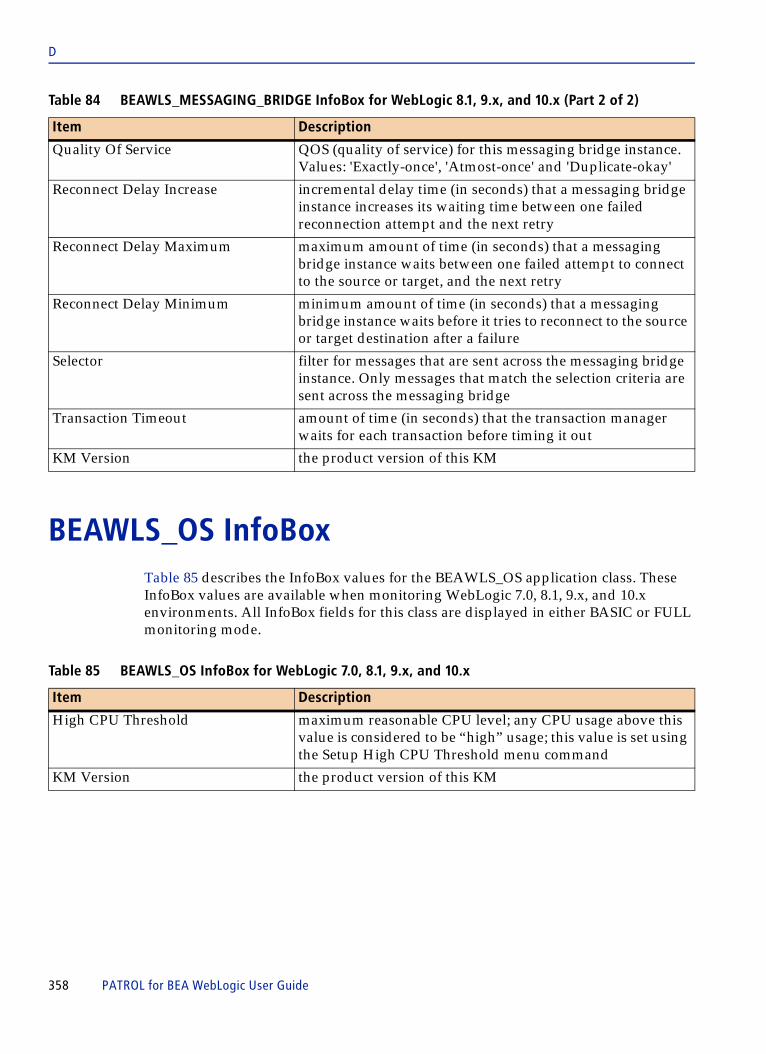
D
BEAWLS_OS InfoBoxTable 85 describes the InfoBox values for the BEAWLS_OS application class. These InfoBox values are available when monitoring WebLogic 7.0, 8.1, 9.x, and 10.x environments. All InfoBox fields for this class are displayed in either BASIC or FULL monitoring mode.
Quality Of Service QOS (quality of service) for this messaging bridge instance. Values: 'Exactly-once', 'Atmost-once' and 'Duplicate-okay'
Reconnect Delay Increase incremental delay time (in seconds) that a messaging bridge instance increases its waiting time between one failed reconnection attempt and the next retry
Reconnect Delay Maximum maximum amount of time (in seconds) that a messaging bridge instance waits between one failed attempt to connect to the source or target, and the next retry
Reconnect Delay Minimum minimum amount of time (in seconds) that a messaging bridge instance waits before it tries to reconnect to the source or target destination after a failure
Selector filter for messages that are sent across the messaging bridge instance. Only messages that match the selection criteria are sent across the messaging bridge
Transaction Timeout amount of time (in seconds) that the transaction manager waits for each transaction before timing it out
KM Version the product version of this KM
Table 85 BEAWLS_OS InfoBox for WebLogic 7.0, 8.1, 9.x, and 10.x
Item Description
High CPU Threshold maximum reasonable CPU level; any CPU usage above this value is considered to be “high” usage; this value is set using the Setup High CPU Threshold menu command
KM Version the product version of this KM
Table 84 BEAWLS_MESSAGING_BRIDGE InfoBox for WebLogic 8.1, 9.x, and 10.x (Part 2 of 2)
Item Description
358 PATROL for BEA WebLogic User Guide
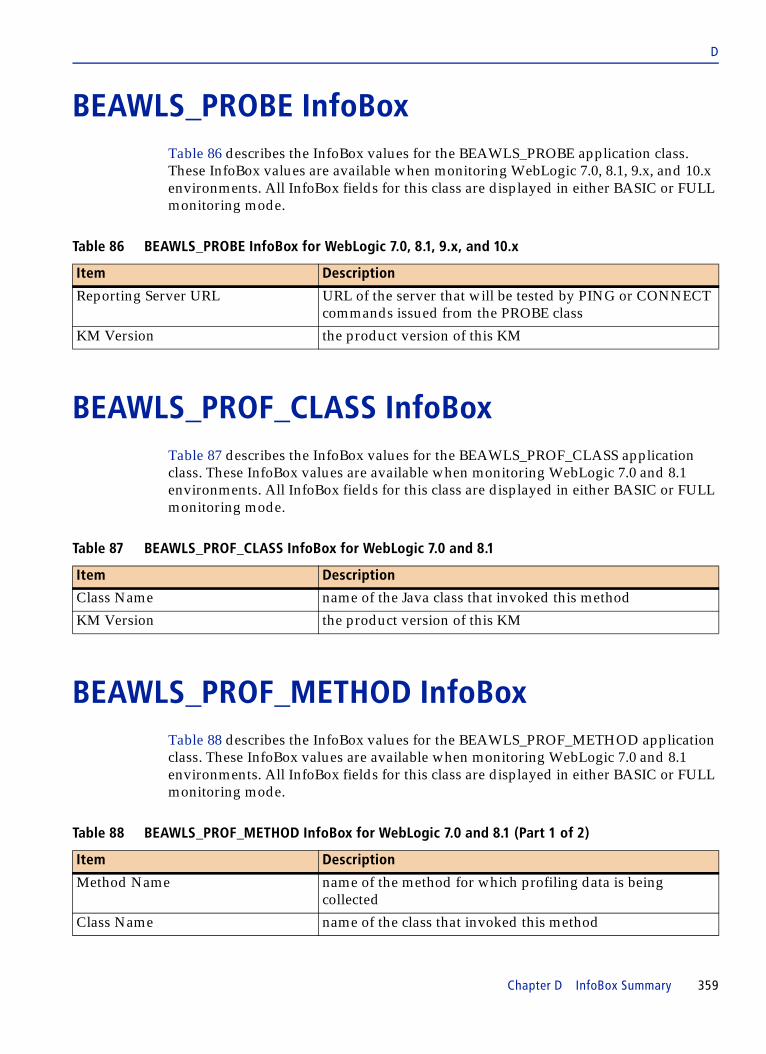
D
BEAWLS_PROBE InfoBoxTable 86 describes the InfoBox values for the BEAWLS_PROBE application class. These InfoBox values are available when monitoring WebLogic 7.0, 8.1, 9.x, and 10.x environments. All InfoBox fields for this class are displayed in either BASIC or FULL monitoring mode.
BEAWLS_PROF_CLASS InfoBoxTable 87 describes the InfoBox values for the BEAWLS_PROF_CLASS application class. These InfoBox values are available when monitoring WebLogic 7.0 and 8.1 environments. All InfoBox fields for this class are displayed in either BASIC or FULL monitoring mode.
BEAWLS_PROF_METHOD InfoBoxTable 88 describes the InfoBox values for the BEAWLS_PROF_METHOD application class. These InfoBox values are available when monitoring WebLogic 7.0 and 8.1 environments. All InfoBox fields for this class are displayed in either BASIC or FULL monitoring mode.
Table 86 BEAWLS_PROBE InfoBox for WebLogic 7.0, 8.1, 9.x, and 10.x
Item Description
Reporting Server URL URL of the server that will be tested by PING or CONNECT commands issued from the PROBE class
KM Version the product version of this KM
Table 87 BEAWLS_PROF_CLASS InfoBox for WebLogic 7.0 and 8.1
Item Description
Class Name name of the Java class that invoked this method
KM Version the product version of this KM
Table 88 BEAWLS_PROF_METHOD InfoBox for WebLogic 7.0 and 8.1 (Part 1 of 2)
Item Description
Method Name name of the method for which profiling data is being collected
Class Name name of the class that invoked this method
Chapter D InfoBox Summary 359

D
BEAWLS_SAF InfoBoxTable 89 describes the InfoBox values for the BEAWLS_SAF application class. These InfoBox values are available when monitoring WebLogic 9.x and 10.x environments. All InfoBox fields for this class are displayed in either BASIC or FULL monitoring mode.
BEAWLS_SAFAGENT InfoBoxTable 90 describes the InfoBox values for the BEAWLS_SAFAGENT application class. These InfoBox values are available when monitoring WebLogic 9.x and 10.x environments. All InfoBox fields for this class are displayed in either BASIC or FULL monitoring mode.
Total Invocation Count number of times this method was invoked
Total Execution Time total elapsed time needed to execute this method
Total CPU Time total amount of CPU time used by this method
KM Version the product version of this KM
Table 89 BEAWLS_SAF InfoBox for WebLogic 9.x and 10.x
Item Description
KM Version the product version of this KM
Table 90 BEAWLS_SAFAGENT InfoBox for WebLogic 9.x and 10.x (Part 1 of 2)
Item Description
Bytes Maximum highest number of bytes since last cycle
Bytes Threshold High peak number of bytes stored on the SAF agent since the last reset
Bytes Threshold Low lowest number of bytes stored on the SAF agent since last reset
Message Maximum configured limit for storing messages on the SAF agent
Message Threshold High peak number of messages stored on the SAF agent since last reset
Message Threshold Low lowest number of messages stored on the SAF agent since last reset
Table 88 BEAWLS_PROF_METHOD InfoBox for WebLogic 7.0 and 8.1 (Part 2 of 2)
Item Description
360 PATROL for BEA WebLogic User Guide
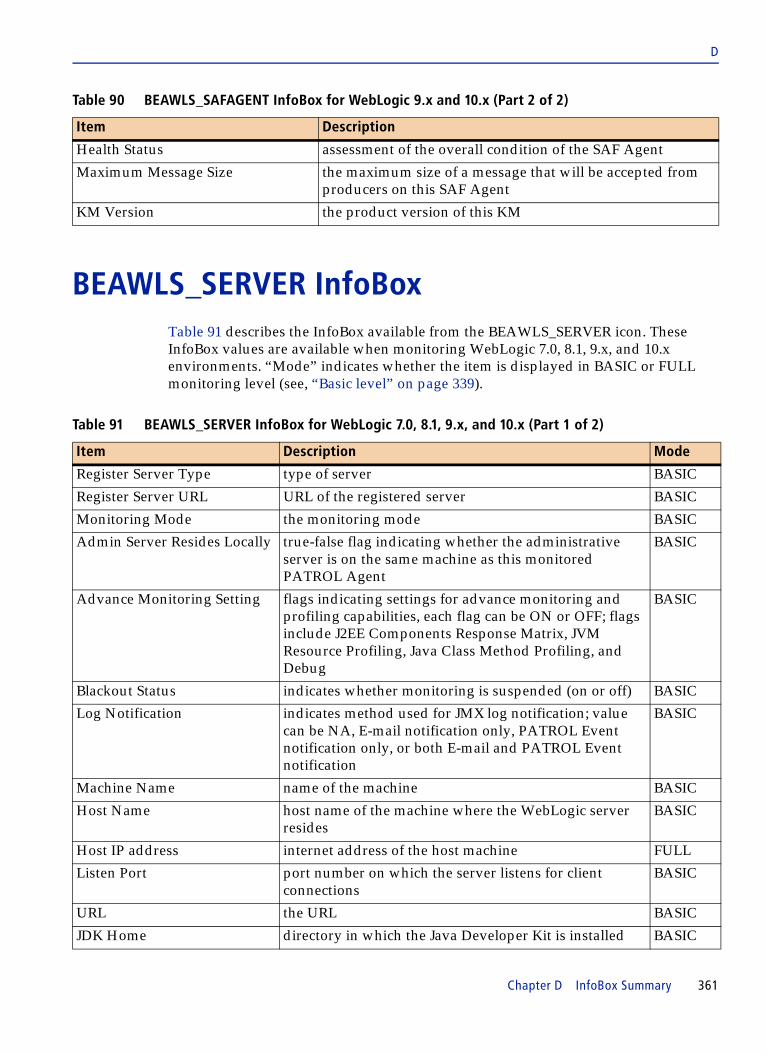
D
BEAWLS_SERVER InfoBoxTable 91 describes the InfoBox available from the BEAWLS_SERVER icon. These InfoBox values are available when monitoring WebLogic 7.0, 8.1, 9.x, and 10.x environments. “Mode” indicates whether the item is displayed in BASIC or FULL monitoring level (see, “Basic level” on page 339).
Health Status assessment of the overall condition of the SAF Agent
Maximum Message Size the maximum size of a message that will be accepted from producers on this SAF Agent
KM Version the product version of this KM
Table 91 BEAWLS_SERVER InfoBox for WebLogic 7.0, 8.1, 9.x, and 10.x (Part 1 of 2)
Item Description Mode
Register Server Type type of server BASIC
Register Server URL URL of the registered server BASIC
Monitoring Mode the monitoring mode BASIC
Admin Server Resides Locally true-false flag indicating whether the administrative server is on the same machine as this monitored PATROL Agent
BASIC
Advance Monitoring Setting flags indicating settings for advance monitoring and profiling capabilities, each flag can be ON or OFF; flags include J2EE Components Response Matrix, JVM Resource Profiling, Java Class Method Profiling, and Debug
BASIC
Blackout Status indicates whether monitoring is suspended (on or off) BASIC
Log Notification indicates method used for JMX log notification; value can be NA, E-mail notification only, PATROL Event notification only, or both E-mail and PATROL Event notification
BASIC
Machine Name name of the machine BASIC
Host Name host name of the machine where the WebLogic server resides
BASIC
Host IP address internet address of the host machine FULL
Listen Port port number on which the server listens for client connections
BASIC
URL the URL BASIC
JDK Home directory in which the Java Developer Kit is installed BASIC
Table 90 BEAWLS_SAFAGENT InfoBox for WebLogic 9.x and 10.x (Part 2 of 2)
Item Description
Chapter D InfoBox Summary 361

D
BEAWLS_SERVLET InfoBoxTable 92 describes the InfoBox values for the BEAWLS_SERVLET application class. The InfoBox values available depend on the versions of the WebLogic Server you are monitoring. These InfoBox fields are displayed only at the FULL configuration level; none of these fields will be displayed if the monitoring configuration is set to BASIC (see “Basic level” on page 339).
JVM Version version number of the Java virtual machine FULL
JVM Vendor name of the company that produced the Java virtual machine
FULL
Current Heap Size maximum size of heap space BASIC
Free Heap Size indicates the amount of memory in the allocated heap that is currently unused and available
FULL
WebLogic Home directory in which BEA WebLogic Server is installed BASIC
WebLogic Version the version of the BEA WebLogic FULL
Server Name name of the monitored WebLogic server BASIC
Date Time Started date and time the server was last started FULL
Server State flag indicating whether the server is up or down BASIC
Health Status general assessment of server condition BASIC
HTTP Enabled flag indicating whether HTTP access is enabled FULL
Domain Logger Enabled flag indicating whether messages from this server are sent to the domain wide log file
FULL
JDBC Logging Enabled true-false flag indicating whether logging is enabled for the JDBC logstream
FULL
Sockets Opened Total Count the total number of registrations for socket muxing on this server
FULL
KM Version the product version of this KM FULL
Table 92 BEAWLS_SERVLET InfoBox for WebLogic 7.0, 8.1, 9.x, and 10.x (Part 1 of 2)
Item Description
Context Path the context path of this servlet
Servlet Path the servlet path
URL the URL value
Pool Max Capacity maximum capacity of this servlet for single thread model servlets
Table 91 BEAWLS_SERVER InfoBox for WebLogic 7.0, 8.1, 9.x, and 10.x (Part 2 of 2)
Item Description Mode
362 PATROL for BEA WebLogic User Guide

D
BEAWLS_SERVLET_METHOD InfoBoxTable 94 describes the InfoBox values for the BEAWLS_SERVLET_METHOD application class. These InfoBox values are available when monitoring WebLogic 7.0 and 8.1 environments. All InfoBox fields for this class are displayed in either BASIC or FULL monitoring mode.
BEAWLS_SETUP InfoBoxTable 95 describes the InfoBox command for the BEAWLS_SETUP application class. This InfoBox command is available when monitoring WebLogic 7.0, 8.1, 9.x, and 10.x environments. All InfoBox fields for this class are displayed in either BASIC or FULL monitoring mode.
Total Reload Count number of total reloads; this is used by WebLogic to verify whether a servlet has been modified, and if so, the servlet is reloaded
KM Version the product version of this KM
Table 93 BEAWLS_SERVLET InfoBox for WebLogic 8.1
Item Description
URL Patterns the URL patterns for this servlet
Table 94 BEAWLS_SERVLET_METHOD InfoBox for WebLogic 7.0 and 8.1
Item Description
KM Version the product version of this KM
Table 95 BEAWLS_SETUP InfoBox for WebLogic 7.0, 8.1, 9.x, and 10.x
Item Description
KM version version number of the PATROL for BEA WebLogic product
Table 92 BEAWLS_SERVLET InfoBox for WebLogic 7.0, 8.1, 9.x, and 10.x (Part 2 of 2)
Item Description
Chapter D InfoBox Summary 363
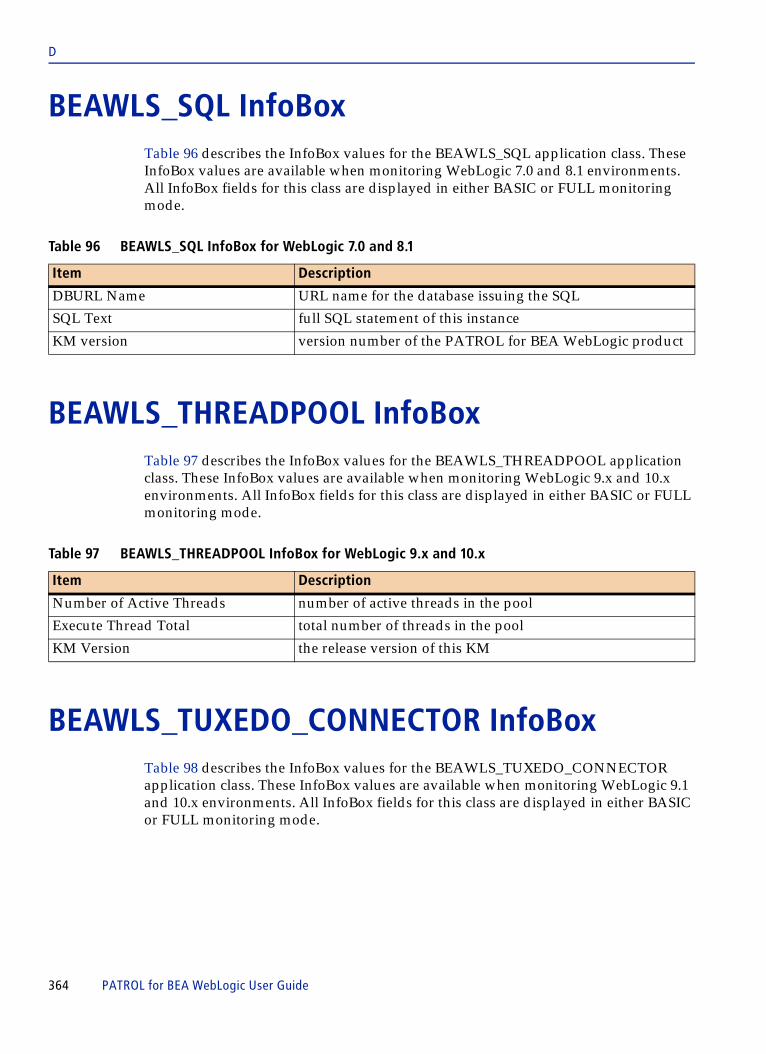
D
BEAWLS_SQL InfoBoxTable 96 describes the InfoBox values for the BEAWLS_SQL application class. These InfoBox values are available when monitoring WebLogic 7.0 and 8.1 environments. All InfoBox fields for this class are displayed in either BASIC or FULL monitoring mode.
BEAWLS_THREADPOOL InfoBox Table 97 describes the InfoBox values for the BEAWLS_THREADPOOL application class. These InfoBox values are available when monitoring WebLogic 9.x and 10.x environments. All InfoBox fields for this class are displayed in either BASIC or FULL monitoring mode.
BEAWLS_TUXEDO_CONNECTOR InfoBox Table 98 describes the InfoBox values for the BEAWLS_TUXEDO_CONNECTOR application class. These InfoBox values are available when monitoring WebLogic 9.1 and 10.x environments. All InfoBox fields for this class are displayed in either BASIC or FULL monitoring mode.
Table 96 BEAWLS_SQL InfoBox for WebLogic 7.0 and 8.1
Item Description
DBURL Name URL name for the database issuing the SQL
SQL Text full SQL statement of this instance
KM version version number of the PATROL for BEA WebLogic product
Table 97 BEAWLS_THREADPOOL InfoBox for WebLogic 9.x and 10.x
Item Description
Number of Active Threads number of active threads in the pool
Execute Thread Total total number of threads in the pool
KM Version the release version of this KM
364 PATROL for BEA WebLogic User Guide

D
BEAWLS_WEBAPP InfoBoxThe InfoBox values that are available for BEAWLS_WEBAPP application class depend on the versions of the WebLogic Server you are monitoring. Table 99 describes the non-standard InfoBox values for the WebLogic 7.0, 8.1, 9.x, and 10.x environments.
All InfoBox fields for this class are displayed in either BASIC or FULL monitoring mode.
BEAWLS_WORKLOAD InfoBox Table 100 describes the InfoBox values for the BEAWLS_WORKLOAD application class. These InfoBox values are available when monitoring WebLogic 9.x and 10.x environments. All InfoBox fields for this class are displayed in either BASIC or FULL monitoring mode.
Table 98 BEAWLS_TUXEDO_CONNECTOR InfoBox for WebLogic 9.1 and 10.x
Item Description
Local Access Point the local access point of the WebLogic Tuxedo Connector service.
Service Type the WebLogic Tuxedo Connector service type (IMPORT/EXPORT).
KM Version the release version of this KM
Table 99 BEAWLS_WEBAPP InfoBox
Item Description
Name file name with extension of the application component
Application Source name of the web application
KM Version version number of the PATROL for BEA WebLogic product
Deployment State the deployment state of this web application module
Table 100 BEAWLS_WORKLOAD InfoBox for WebLogic 9.x and 10.x
Item Description
KM Version the release version of this KM
Chapter D InfoBox Summary 365

D
BEAWLS_WS InfoBoxTable 101 describes the InfoBox values for the BEAWLS_WS application class. These InfoBox values are available when monitoring WebLogic 8.1, 9.x, and 10.x environments. All InfoBox fields for this class are displayed in either BASIC or FULL monitoring mode.
BEAWLS_WS_HDL InfoBoxTable 102 describes the InfoBox values for the BEAWLS_WS_HDL application class. These InfoBox values are available when monitoring WebLogic 8.1 environments. All InfoBox fields for this class are displayed in either BASIC or FULL monitoring mode.
Table 101 BEAWLS_WS InfoBox for WebLogic 8.1, 9.x, and 10.x
Item Description
Service Name name of this web service
URI URI of this web service
WSDL URL URL from which the WSDL for this web service can be retrieved
Home Page URL URL from which the home page for this web service can be retrieved
KM Version product version for this .km file
Table 102 BEAWLS_WS_HDL InfoBox for WebLogic 8.1
Item Description
Handler Class Name Java class name of the handler
Handler Name name of the web service handler
Operation Name web service operation associated with this handler
Last Reset Time date on which this handler was last reset, or null if it has never been reset
Flag of the Internal Handler flag to indicate whether the handler is user-defined or an internal WLS handler
KM Version product version of the KM
366 PATROL for BEA WebLogic User Guide
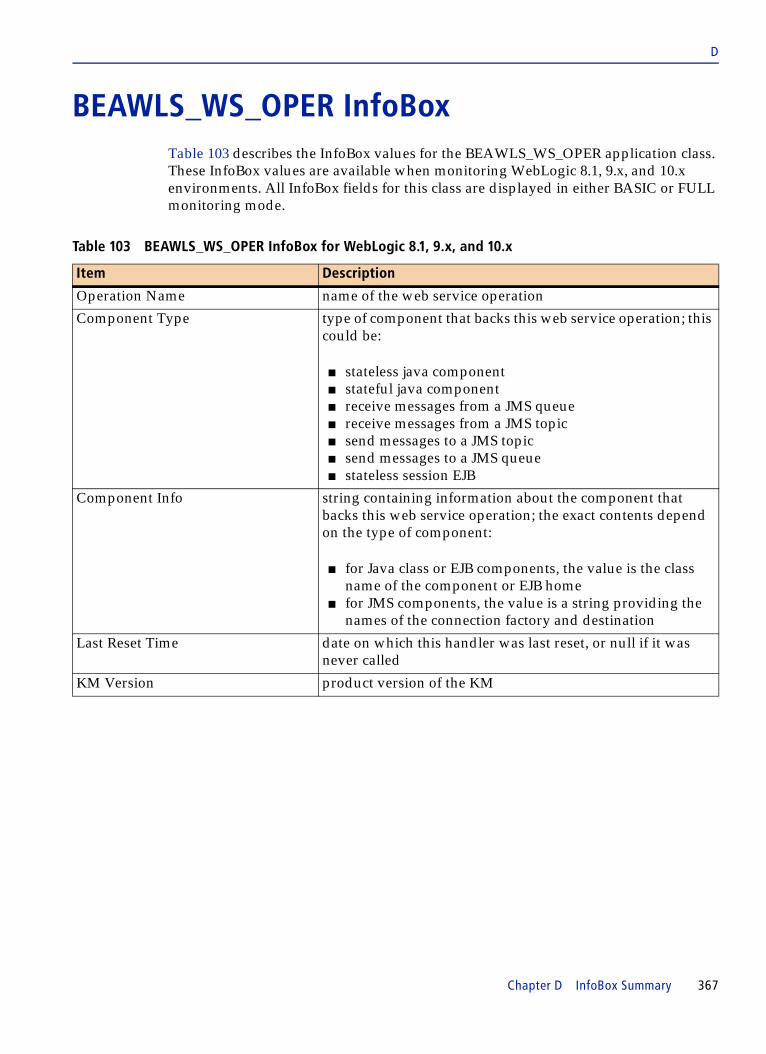
D
BEAWLS_WS_OPER InfoBoxTable 103 describes the InfoBox values for the BEAWLS_WS_OPER application class. These InfoBox values are available when monitoring WebLogic 8.1, 9.x, and 10.x environments. All InfoBox fields for this class are displayed in either BASIC or FULL monitoring mode.
Table 103 BEAWLS_WS_OPER InfoBox for WebLogic 8.1, 9.x, and 10.x
Item Description
Operation Name name of the web service operation
Component Type type of component that backs this web service operation; this could be:
■ stateless java component■ stateful java component■ receive messages from a JMS queue■ receive messages from a JMS topic■ send messages to a JMS topic■ send messages to a JMS queue■ stateless session EJB
Component Info string containing information about the component that backs this web service operation; the exact contents depend on the type of component:
■ for Java class or EJB components, the value is the class name of the component or EJB home
■ for JMS components, the value is a string providing the names of the connection factory and destination
Last Reset Time date on which this handler was last reset, or null if it was never called
KM Version product version of the KM
Chapter D InfoBox Summary 367

D
JMX_CONDITION InfoBoxTable 104 describes the InfoBox values for the JMX_CONDITION application class. These InfoBox values are available when monitoring WebLogic 7.0, 8.1, 9.x, and 10.x environments. All InfoBox fields for this class are displayed in either BASIC or FULL monitoring mode.
JMX_SERVER InfoBoxTable 105 describes the InfoBox values for the JMX_SERVER application class. These InfoBox values are available when monitoring WebLogic 7.0, 8.1, 9.x, and 10.x environments. All InfoBox fields for this class are displayed in either BASIC or FULL monitoring mode.
Table 104 JMX_CONDITION InfoBox for WebLogic 7.0, 8.1, 9.x, and 10.x
Item Description
Condition Name assigned name for this condition
Monitored MBean(s) names of one or more MBeans monitored by this condition
Monitored element part of the MBean being monitored
Monitored condition criteria for monitoring
Sampling frequency (seconds) frequency at which PATROL checks condition
PATROL instantiation label on the icon for this instance, as it appears in the PATROL Console
Table 105 JMX_SERVER InfoBox for WebLogic 7.0, 8.1, 9.x, and 10.x (Part 1 of 2)
Item Description
Client start time time that the JMX client communicating with this server was started
Client arguments arguments passed to the client at startup; the format depends on the environment under which the MBean is running
JMX implementation version version of the JMX implementation under which the MBean Server is running
JMX implementation vendor name of the vendor who provided the JMX environment
JMX implementation name name of the JMX implementation, as provided by the JMX vendor
MBean server ID unique identifier for the MBean server, as assigned by the JMX implementation when the server was initialized
368 PATROL for BEA WebLogic User Guide

D
BMC MBean version version of BMC’s MBean, in the format vrmmbb (v=version, r=release, mm=modification, bb=build)
BMC MBean condition definition file file containing definitions; these are generally in PATROL_HOME, but may vary due to permission settings and the account under which the MBean server is running
BMC MBean agent ID unique identifier for the BMC MBean; this is also used in the MBean’s object name
BMC MBean notification target destination of all notifications captured from this server; this should correspond to the local host, port number on which the JMX listener is attached
Table 105 JMX_SERVER InfoBox for WebLogic 7.0, 8.1, 9.x, and 10.x (Part 2 of 2)
Item Description
Chapter D InfoBox Summary 369

D
370 PATROL for BEA WebLogic User Guide
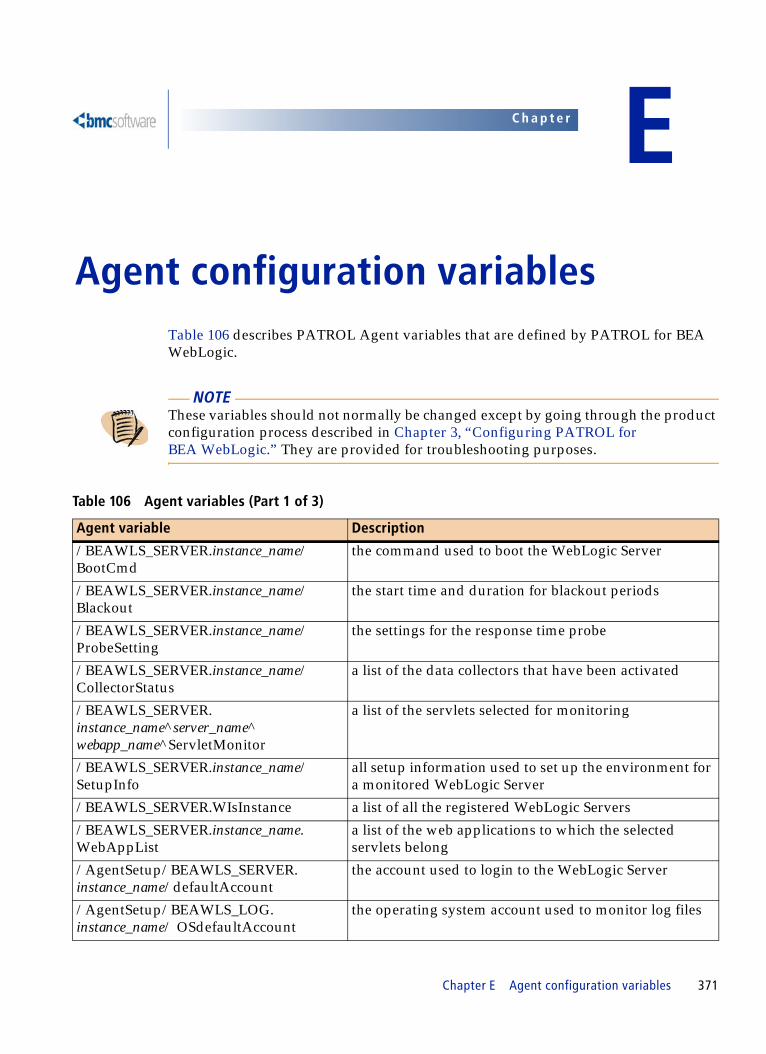
C h a p t e r E
E Agent configuration variablesTable 106 describes PATROL Agent variables that are defined by PATROL for BEA WebLogic.
NOTE These variables should not normally be changed except by going through the product configuration process described in Chapter 3, “Configuring PATROL for BEA WebLogic.” They are provided for troubleshooting purposes.
Table 106 Agent variables (Part 1 of 3)
Agent variable Description
/BEAWLS_SERVER.instance_name/BootCmd
the command used to boot the WebLogic Server
/BEAWLS_SERVER.instance_name/Blackout
the start time and duration for blackout periods
/BEAWLS_SERVER.instance_name/ProbeSetting
the settings for the response time probe
/BEAWLS_SERVER.instance_name/CollectorStatus
a list of the data collectors that have been activated
/BEAWLS_SERVER. instance_name^server_name^ webapp_name^ServletMonitor
a list of the servlets selected for monitoring
/BEAWLS_SERVER.instance_name/SetupInfo
all setup information used to set up the environment for a monitored WebLogic Server
/BEAWLS_SERVER.WIsInstance a list of all the registered WebLogic Servers
/BEAWLS_SERVER.instance_name. WebAppList
a list of the web applications to which the selected servlets belong
/AgentSetup/BEAWLS_SERVER. instance_name/defaultAccount
the account used to login to the WebLogic Server
/AgentSetup/BEAWLS_LOG. instance_name/ OSdefaultAccount
the operating system account used to monitor log files
Chapter E Agent configuration variables 371

E
/BEAWLS_SERVER/instance_name. adminURL
URL of the WebLogic Administrative server
/BEAWLS_SERVER/instance_name. ConnectionConfig
settings used by the response time probe when testing server connections via the weblogic.Admin utility
/BEAWLS_SERVER/instance_name. EnableLogNotification
a flag indicating whether the JMX log notification is enabled
/BEAWLS_SERVER/instance_name. HighCPUThreshold
the value set by the administrator as the “high” CPU usage threshold
/BEAWLS_SERVER/instance_name. LocalMgrInfo
the information about a particular local managed server, includes name, URL, and port number
/BEAWLS_SERVER/instance_name. LocalMgrList
a list of the local managed server names for this monitored domain
/BEAWLS_SERVER/instance_name. LocalMrgPJSOptions
the setup options for advance monitoring features on a local managed server
/BEAWLS_SERVER/instance_name. LogNotification
the settings and mail configuration of the JMX log notification function
/BEAWLS_SERVER/instance_name. MrgServerName
the name of the managed server as defined in the WebLogic config.xml file
/BEAWLS_SERVER/instance_name. NodeMonitor
flag indicating whether the Node Manager process is enabled for monitoring
/BEAWLS_SERVER/instance_name. PingConfig
settings (number and size of ping messages) used by the response time probe when testing server response
/BEAWLS_SERVER/instance_name. PJSOptions
the setup options for advance monitoring features
/BEAWLS_SERVER/instance_name. ServerName
the name of this Admin WebLogic Server as defined in the WebLogic config.xml file
/BEAWLS_SERVER/instance_name. ServerClusterUrlList
a list of URLs of servers in the cluster
/JMX/JavaPath used to invoke JVM for the JMX listener
/JMX/ListenPort the port number that the JMX listener will monitor (default is 3604)
/JMX/LocalHost the host name that BMC MBeans will use to connect to the JMX listener for sending notifications (default is the value of “/sid” in the PATROL Agent namespace)
/JMX/writablePath the directory path to be used by BMC MBean in logging messages and maintaining a copy of condition definitions (the default is <PATROL_INSTALL>/JMX; if an MBean is unable to write to this directory, it will attempt to use its current working directory; if unable to write to the current working directory, it will attempt to use MBean user home directory)
Table 106 Agent variables (Part 2 of 3)
Agent variable Description
372 PATROL for BEA WebLogic User Guide
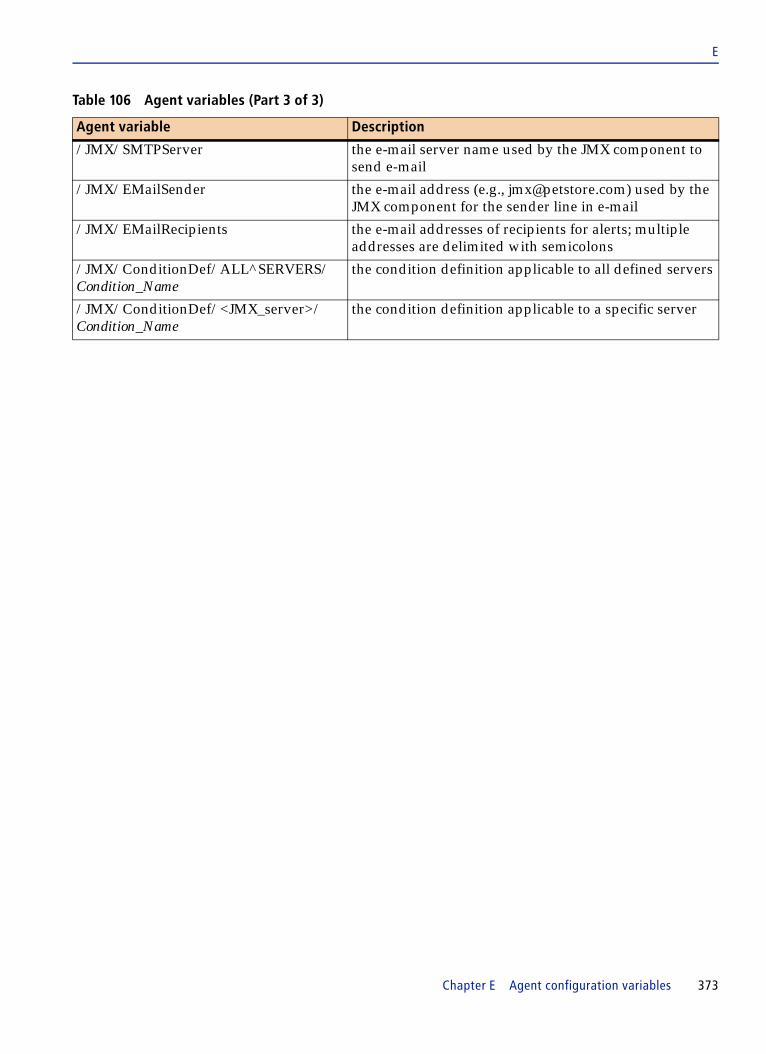
E
/JMX/SMTPServer the e-mail server name used by the JMX component to send e-mail
/JMX/EMailSender the e-mail address (e.g., [email protected]) used by the JMX component for the sender line in e-mail
/JMX/EMailRecipients the e-mail addresses of recipients for alerts; multiple addresses are delimited with semicolons
/JMX/ConditionDef/ALL^SERVERS/Condition_Name
the condition definition applicable to all defined servers
/JMX/ConditionDef/<JMX_server>/Condition_Name
the condition definition applicable to a specific server
Table 106 Agent variables (Part 3 of 3)
Agent variable Description
Chapter E Agent configuration variables 373

E
374 PATROL for BEA WebLogic User Guide
C h a p t e r F
F Installed files, directories, and system changesThis appendix describes how installing PATROL for BEA WebLogic affects the computers on which it is installed.
The appendix describes
■ directories and files installed by the product■ processes and services installed and run by the product■ modifications to the Microsoft Windows registry ■ additional files, processes, and applications required by the product
This appendix does not list files, directories, or other details for other PATROL components, such as the PATROL Agent or PATROL console.
Main file types . . . . . . . . . . . . . . . . . . . . . . . . . . . . . . . . . . . . . . . . . . . . . . . . . . . . . . . . . . 376Product objects and dependencies . . . . . . . . . . . . . . . . . . . . . . . . . . . . . . . . . . . . . . . . . 377
Directories and files. . . . . . . . . . . . . . . . . . . . . . . . . . . . . . . . . . . . . . . . . . . . . . . . . . . 377Processes and services . . . . . . . . . . . . . . . . . . . . . . . . . . . . . . . . . . . . . . . . . . . . . . . . 388Product and process dependencies. . . . . . . . . . . . . . . . . . . . . . . . . . . . . . . . . . . . . . 389
Chapter F Installed files, directories, and system changes 375
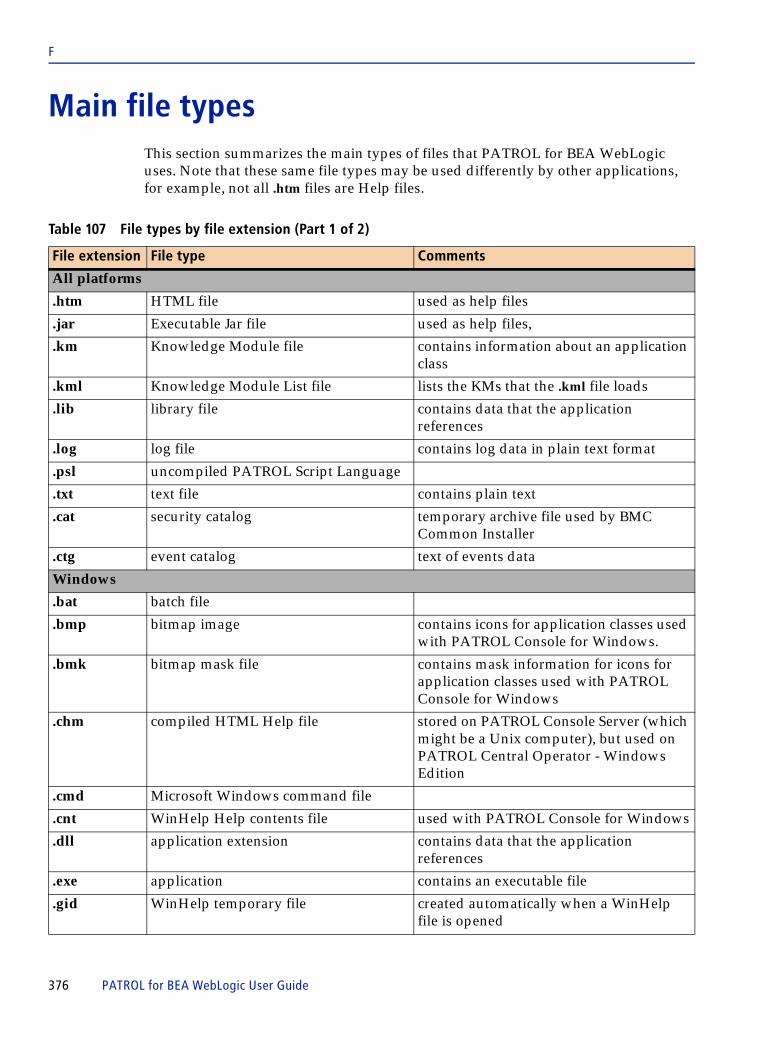
F
Main file typesThis section summarizes the main types of files that PATROL for BEA WebLogic uses. Note that these same file types may be used differently by other applications, for example, not all .htm files are Help files.
Table 107 File types by file extension (Part 1 of 2)
File extension File type Comments
All platforms
.htm HTML file used as help files
.jar Executable Jar file used as help files,
.km Knowledge Module file contains information about an application class
.kml Knowledge Module List file lists the KMs that the .kml file loads
.lib library file contains data that the application references
.log log file contains log data in plain text format
.psl uncompiled PATROL Script Language
.txt text file contains plain text
.cat security catalog temporary archive file used by BMC Common Installer
.ctg event catalog text of events data
Windows
.bat batch file
.bmp bitmap image contains icons for application classes used with PATROL Console for Windows.
.bmk bitmap mask file contains mask information for icons for application classes used with PATROL Console for Windows
.chm compiled HTML Help file stored on PATROL Console Server (which might be a Unix computer), but used on PATROL Central Operator - Windows Edition
.cmd Microsoft Windows command file
.cnt WinHelp Help contents file used with PATROL Console for Windows
.dll application extension contains data that the application references
.exe application contains an executable file
.gid WinHelp temporary file created automatically when a WinHelp file is opened
376 PATROL for BEA WebLogic User Guide

F
Product objects and dependenciesThis section describes the directories, files, services, processes, and dependencies that belong to the PATROL for BEA WebLogic files installation, including files and processes for the JVM profiling and byte-code instrumentation component and the JMX management component.
Directories and files
This section lists directories and files that are laid down when you install PATROL for BEA WebLogic. Most of these files and directories are created during installation of either the PATROL Agent or the PATROL for BEA WebLogic KM. If a directory or file is created after installation, it is noted in the comments.
Four tables are provided:
■ Files installed on the Agent computer (Table 108)■ Files installed on the Console Server computer (Table 109)■ Files installed on the Console computer (Table 110)■ Common files installed on both Agents and Consoles (Table 111)
.hlp WinHelp Help file used with PATROL Console for Windows
.sys System file for device driver or hardware configuration
.tlb Remote Automation OLE TypeLib files, Dynamic Link Library
.vbe Visual Basic script
.vbs Visual Basic for Applications script
Unix
.bin binary file
.sh shell script executes program instructions
none executable or miscellaneous other files Unix executables are not required to have an extension.
Table 107 File types by file extension (Part 2 of 2)
File extension File type Comments
Chapter F Installed files, directories, and system changes 377
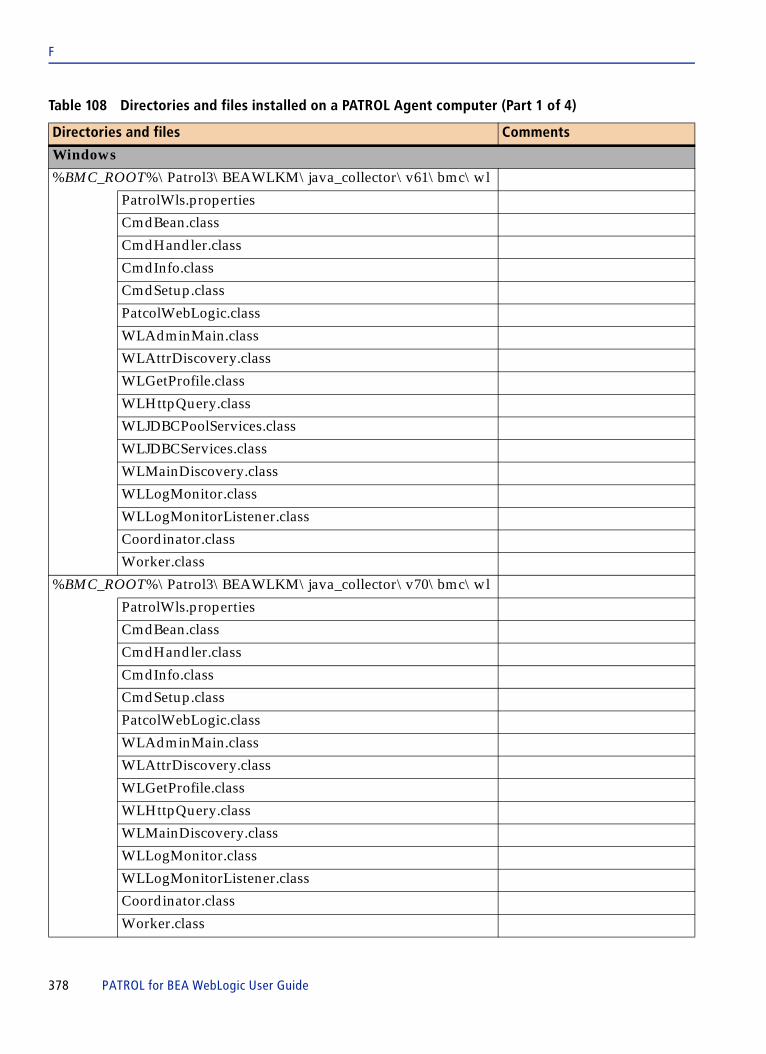
F
Table 108 Directories and files installed on a PATROL Agent computer (Part 1 of 4)
Directories and files Comments
Windows
%BMC_ROOT%\Patrol3\BEAWLKM\java_collector\v61\bmc\wl
PatrolWls.properties
CmdBean.class
CmdHandler.class
CmdInfo.class
CmdSetup.class
PatcolWebLogic.class
WLAdminMain.class
WLAttrDiscovery.class
WLGetProfile.class
WLHttpQuery.class
WLJDBCPoolServices.class
WLJDBCServices.class
WLMainDiscovery.class
WLLogMonitor.class
WLLogMonitorListener.class
Coordinator.class
Worker.class
%BMC_ROOT%\Patrol3\BEAWLKM\java_collector\v70\bmc\wl
PatrolWls.properties
CmdBean.class
CmdHandler.class
CmdInfo.class
CmdSetup.class
PatcolWebLogic.class
WLAdminMain.class
WLAttrDiscovery.class
WLGetProfile.class
WLHttpQuery.class
WLMainDiscovery.class
WLLogMonitor.class
WLLogMonitorListener.class
Coordinator.class
Worker.class
378 PATROL for BEA WebLogic User Guide

F
%BMC_ROOT%\Patrol3\BEAWLKM\java_collector\v81\bmc\wl
PatrolWls.properties
CmdBean.class
CmdHandler.class
CmdInfo.class
CmdSetup.class
PatcolWebLogic.class
WLAdminMain.class
WLAttrDiscovery.class
WLGetProfile.class
WLHttpQuery.class
WLMainDiscovery.class
WLLogMonitor.class
WLLogMonitorListener.class
WLIntegDiscovery.class
WLPortalDiscovery.class
Coordinator.class
Worker.class
Unix
$BMC_ROOT/Patrol3/BEAWLKM/java_collector/v61/bmc/wl
PatrolWls.properties
CmdBean.class
CmdHandler.class
CmdInfo.class
CmdSetup.class
PatcolWebLogic.class
WLAdminMain.class
WLAttrDiscovery.class
WLGetProfile.class
WLHttpQuery.class
WLJDBCPoolServices.class
WLJDBCServices.class
WLMainDiscovery.class
WLLogMonitor.class
WLLogMonitorListener.class
Table 108 Directories and files installed on a PATROL Agent computer (Part 2 of 4)
Directories and files Comments
Chapter F Installed files, directories, and system changes 379

F
Coordinator.class
Worker.class
$BMC_ROOT/Patrol3/BEAWLKM/java_collector/v70/bmc/wl
PatrolWls.properties
CmdBean.class
CmdHandler.class
CmdInfo.class
CmdSetup.class
PatcolWebLogic.class
WLAdminMain.class
WLAttrDiscovery.class
WLGetProfile.class
WLHttpQuery.class
WLMainDiscovery.class
WLLogMonitor.class
WLLogMonitorListener.class
Coordinator.class
Worker.class
$BMC_ROOT/Patrol3/BEAWLKM/java_collector/v81/bmc/wl
PatrolWls.properties
CmdBean.class
CmdHandler.class
CmdInfo.class
CmdSetup.class
PatcolWebLogic.class
WLAdminMain.class
WLAttrDiscovery.class
WLGetProfile.class
WLHttpQuery.class
WLMainDiscovery.class
WLLogMonitor.class
WLLogMonitorListener.class
WLIntegDiscovery.class
WLPortalDiscovery.class
Table 108 Directories and files installed on a PATROL Agent computer (Part 3 of 4)
Directories and files Comments
380 PATROL for BEA WebLogic User Guide
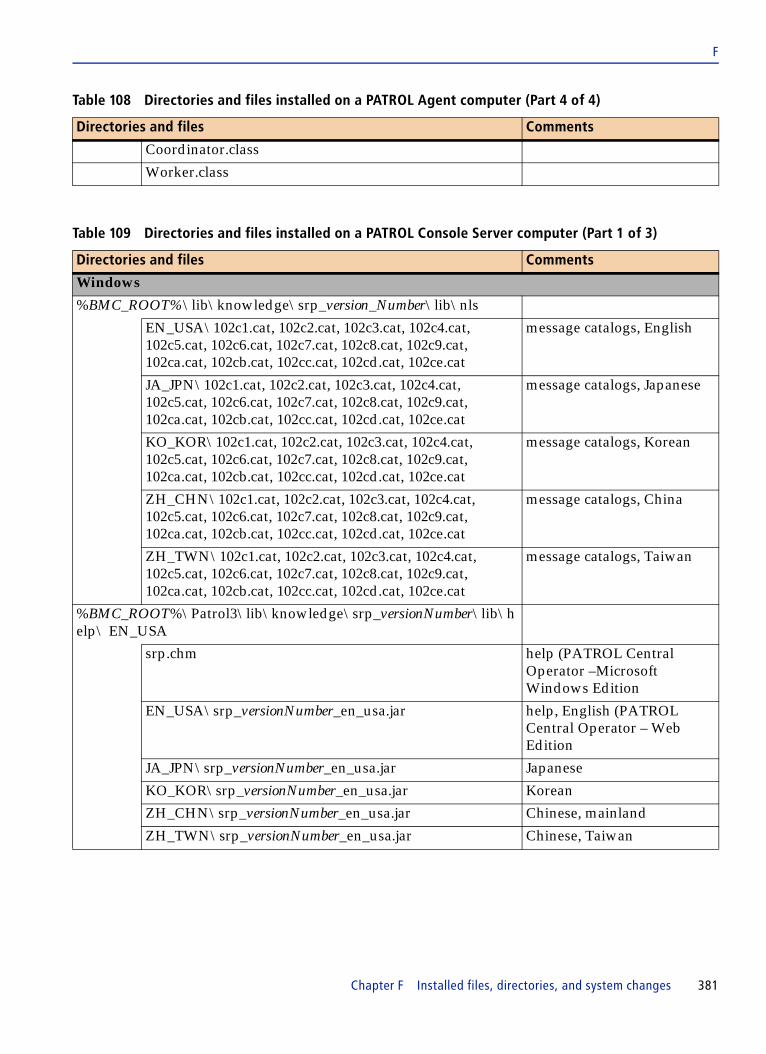
F
Coordinator.class
Worker.class
Table 109 Directories and files installed on a PATROL Console Server computer (Part 1 of 3)
Directories and files Comments
Windows
%BMC_ROOT%\lib\knowledge\srp_version_Number\lib\nls
EN_USA\102c1.cat, 102c2.cat, 102c3.cat, 102c4.cat, 102c5.cat, 102c6.cat, 102c7.cat, 102c8.cat, 102c9.cat, 102ca.cat, 102cb.cat, 102cc.cat, 102cd.cat, 102ce.cat
message catalogs, English
JA_JPN\102c1.cat, 102c2.cat, 102c3.cat, 102c4.cat, 102c5.cat, 102c6.cat, 102c7.cat, 102c8.cat, 102c9.cat, 102ca.cat, 102cb.cat, 102cc.cat, 102cd.cat, 102ce.cat
message catalogs, Japanese
KO_KOR\102c1.cat, 102c2.cat, 102c3.cat, 102c4.cat, 102c5.cat, 102c6.cat, 102c7.cat, 102c8.cat, 102c9.cat, 102ca.cat, 102cb.cat, 102cc.cat, 102cd.cat, 102ce.cat
message catalogs, Korean
ZH_CHN\102c1.cat, 102c2.cat, 102c3.cat, 102c4.cat, 102c5.cat, 102c6.cat, 102c7.cat, 102c8.cat, 102c9.cat, 102ca.cat, 102cb.cat, 102cc.cat, 102cd.cat, 102ce.cat
message catalogs, China
ZH_TWN\102c1.cat, 102c2.cat, 102c3.cat, 102c4.cat, 102c5.cat, 102c6.cat, 102c7.cat, 102c8.cat, 102c9.cat, 102ca.cat, 102cb.cat, 102cc.cat, 102cd.cat, 102ce.cat
message catalogs, Taiwan
%BMC_ROOT%\Patrol3\lib\knowledge\srp_versionNumber\lib\help\ EN_USA
srp.chm help (PATROL Central Operator –Microsoft Windows Edition
EN_USA\srp_versionNumber_en_usa.jar help, English (PATROL Central Operator – Web Edition
JA_JPN\srp_versionNumber_en_usa.jar Japanese
KO_KOR\srp_versionNumber_en_usa.jar Korean
ZH_CHN\srp_versionNumber_en_usa.jar Chinese, mainland
ZH_TWN\srp_versionNumber_en_usa.jar Chinese, Taiwan
Table 108 Directories and files installed on a PATROL Agent computer (Part 4 of 4)
Directories and files Comments
Chapter F Installed files, directories, and system changes 381
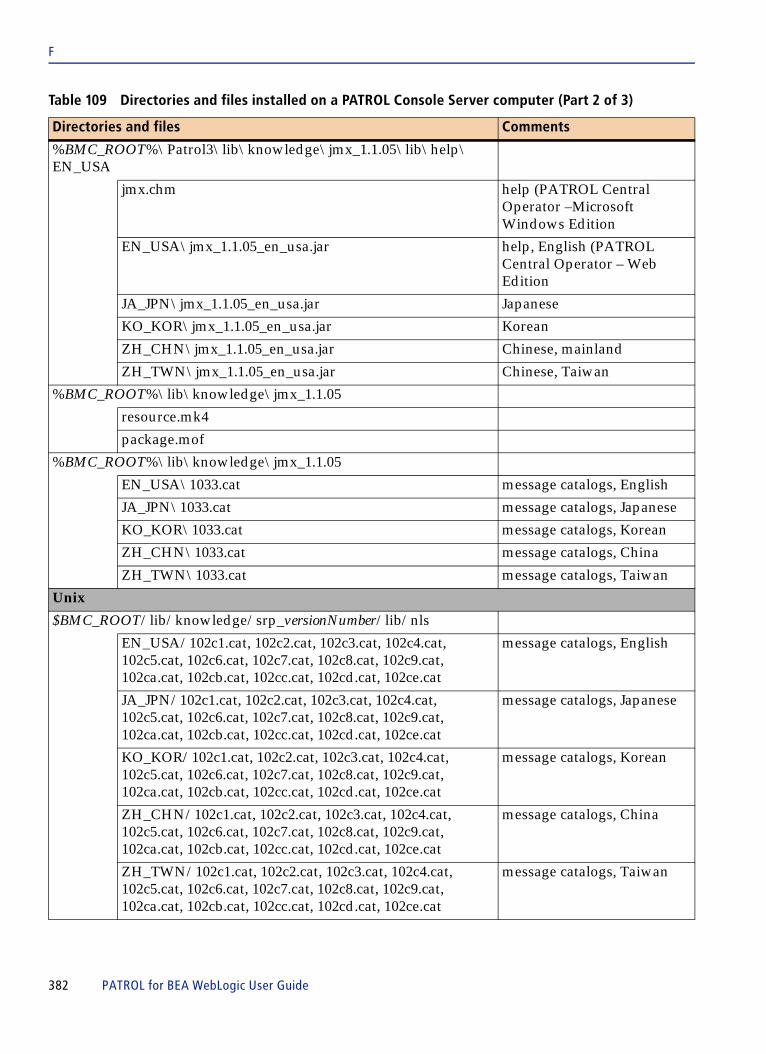
F
%BMC_ROOT%\Patrol3\lib\knowledge\jmx_1.1.05\lib\help\ EN_USA
jmx.chm help (PATROL Central Operator –Microsoft Windows Edition
EN_USA\jmx_1.1.05_en_usa.jar help, English (PATROL Central Operator – Web Edition
JA_JPN\jmx_1.1.05_en_usa.jar Japanese
KO_KOR\jmx_1.1.05_en_usa.jar Korean
ZH_CHN\jmx_1.1.05_en_usa.jar Chinese, mainland
ZH_TWN\jmx_1.1.05_en_usa.jar Chinese, Taiwan
%BMC_ROOT%\lib\knowledge\jmx_1.1.05
resource.mk4
package.mof
%BMC_ROOT%\lib\knowledge\jmx_1.1.05
EN_USA\1033.cat message catalogs, English
JA_JPN\1033.cat message catalogs, Japanese
KO_KOR\1033.cat message catalogs, Korean
ZH_CHN\1033.cat message catalogs, China
ZH_TWN\1033.cat message catalogs, Taiwan
Unix
$BMC_ROOT/lib/knowledge/srp_versionNumber/lib/nls
EN_USA/102c1.cat, 102c2.cat, 102c3.cat, 102c4.cat, 102c5.cat, 102c6.cat, 102c7.cat, 102c8.cat, 102c9.cat, 102ca.cat, 102cb.cat, 102cc.cat, 102cd.cat, 102ce.cat
message catalogs, English
JA_JPN/102c1.cat, 102c2.cat, 102c3.cat, 102c4.cat, 102c5.cat, 102c6.cat, 102c7.cat, 102c8.cat, 102c9.cat, 102ca.cat, 102cb.cat, 102cc.cat, 102cd.cat, 102ce.cat
message catalogs, Japanese
KO_KOR/102c1.cat, 102c2.cat, 102c3.cat, 102c4.cat, 102c5.cat, 102c6.cat, 102c7.cat, 102c8.cat, 102c9.cat, 102ca.cat, 102cb.cat, 102cc.cat, 102cd.cat, 102ce.cat
message catalogs, Korean
ZH_CHN/102c1.cat, 102c2.cat, 102c3.cat, 102c4.cat, 102c5.cat, 102c6.cat, 102c7.cat, 102c8.cat, 102c9.cat, 102ca.cat, 102cb.cat, 102cc.cat, 102cd.cat, 102ce.cat
message catalogs, China
ZH_TWN/102c1.cat, 102c2.cat, 102c3.cat, 102c4.cat, 102c5.cat, 102c6.cat, 102c7.cat, 102c8.cat, 102c9.cat, 102ca.cat, 102cb.cat, 102cc.cat, 102cd.cat, 102ce.cat
message catalogs, Taiwan
Table 109 Directories and files installed on a PATROL Console Server computer (Part 2 of 3)
Directories and files Comments
382 PATROL for BEA WebLogic User Guide

F
$BMC_ROOT/lib/knowledge/jmx_1.1.05
resource.mk4
package.mof
$BMC_ROOT/lib/knowledge/jmx_1.1.05
EN_USA/1033.cat message catalogs, English
JA_JPN/1033.cat message catalogs, Japanese
KO_KOR/1033.cat message catalogs, Korean
ZH_CHN/1033.cat message catalogs, China
ZH_TWN/1033.cat message catalogs, Taiwan
Table 110 Directories and files installed on a PATROL 3.x Console computer
Directories and files Comments
Windows
%BMC_ROOT%\Patrol3\lib\images
weblogic*.bmk, jmx*.bmk graphic files for icons
weblogic*.bmp, jmx*.bmp
weblogic*.msk, jmx*.msk
weblogic*.xpm, jmx*.xpm
%BMC_ROOT%\Patrol3\lib\help\WinHelp
km_help_srp, km_help_jmx help flag file
srp.cnt, jmx.cnt help table of contents
srp.hlp, jmx.hlp help (PATROL 3.x Console)
Unix
$BMC_ROOT/Patrol3/lib/images
weblogic*.bmk, jmx*.bmk for icons
weblogic*.bmp, jmx*.bmp
weblogic*.msk, jmx*.msk
weblogic*.xpm, jmx*.xpm
$BMC_ROOT/Patrol3/lib/help
srp.hlp, jmx.hlp help index files
km_help_srp, km_help_jmx help flag files
$BMC_ROOT/Patrol3/lib/help/srp
*.gif images for help
*.htm help topic files
Table 109 Directories and files installed on a PATROL Console Server computer (Part 3 of 3)
Directories and files Comments
Chapter F Installed files, directories, and system changes 383

F
NOTE The files in Table 111 are installed on both the PATROL agent and console computers. These files are called common files.
Table 111 Common directories and files installed regardless of computer role (Part 1 of 5)
Directories and files Comments
Windows)
%BMC_ROOT%\Patrol3\lib\kmmergemap
weblogic_2_5_01.map merge map file for KM migration
%BMC_ROOT%\Patrol3\lib\knowledge
BEAWLS.kml, JMX.kml KM list file
BEAWLI_*.KM, BEAWLP_*.KM, BEAWLS_*.km, JMX_*.km
knowledge module files
BEAWLS_*.ctg catalog message file
%BMC_ROOT%\Patrol3\lib\nls\C\102
1.cat, 2.cat, 3.cat, 4.cat, 5.cat, 6.cat, 7.cat, 8.cat, 9.cat, a.cat, b.cat, c.cat, d.cat, e.cat
catalog files, WebLogic
%BMC_ROOT%\Patrol3\lib\nls\C\103
3.cat catalog file, JMX
%BMC_ROOT%\Patrol3\lib\sac\
weblogic_SLM.map service level map file
384 PATROL for BEA WebLogic User Guide

F
%BMC_ROOT%\Patrol3\lib\psl
wls_integration_msg.lib PSL library files
wls_integration.lib
wls_portal_msg.lib
wls_portal.lib
wls_pjsinst.lib
wls_pjscommon.lib
wls_pjssetup.lib
wls_pjsprof_msg.lib
wls_blackout.lib
wls_common.lib
wls_debug.lib
wls_discovery.lib
wls_log.lib
wls_operations.lib
wls_recording.lib
wls_setup.lib
wls_utilities.lib
wls_debug_msg.lib
wls_blackout_msg.lib
wls_common_msg.lib
wls_discovery_msg.lib
wls_log_msg.lib
wls_operations_msg.lib
wls_recording_msg.lib
wls_setup_msg.lib
JMX_Functions.lib
JMX_Message.lib
Unix
$BMC_ROOT/Patrol3/lib/kmmergemap
weblogic_2_5_01.map merge map file for KM migration
Table 111 Common directories and files installed regardless of computer role (Part 2 of 5)
Directories and files Comments
Chapter F Installed files, directories, and system changes 385

F
$BMC_ROOT/Patrol3/lib/knowledge
BEAWLI_*.KM, BEAWLP_*.KM, BEAWLS_*.km, JMX.kml
KM list file
BEAWLS_*.km, JMX_*.km knowledge module files
BEAWLS_*.ctg catalog message file
$BMC_ROOT/Patrol3/lib/nls/C/102
1.cat, 2.cat, 3.cat, 4.cat, 5.cat, 6.cat, 7.cat, 8.cat, 9.cat, a.cat, b.cat, c.cat, d.cat, e.cat
catalog files, WebLogic
$BMC_ROOT/Patrol3/lib/nls/C/103
3.cat catalog file, JMX
$BMC_ROOT/Patrol3/lib/sac
weblogic_SLM.map service level map file
Table 111 Common directories and files installed regardless of computer role (Part 3 of 5)
Directories and files Comments
386 PATROL for BEA WebLogic User Guide

F
%BMC_ROOT%\Patrol3\lib\psl
wls_integration_msg.lib PSL library files
wls_integration.lib
wls_portal_msg.lib
wls_portal.lib
wls_pjsinst.lib
wls_pjscommon.lib
wls_pjssetup.lib
wls_pjsprof_msg.lib
wls_blackout.lib
wls_common.lib
wls_debug.lib
wls_discovery.lib
wls_log.lib
wls_operations.lib
wls_recording.lib
wls_setup.lib
wls_utilities.lib
wls_debug_msg.lib
wls_blackout_msg.lib
wls_common_msg.lib
wls_discovery_msg.lib
wls_log_msg.lib
wls_operations_msg.lib
wls_recording_msg.lib
wls_setup_msg.lib
JMX_Functions.lib
JMX_Message.lib
$BMC_ROOT/Patrol3/lib/knowledge
PMW.kml, PMW_JVM_PROFILER.kml KM list file
PMW_*.km knowledge module files
$BMC_ROOT/Patrol3/lib/nls/C/103
1.cat, 4.cat catalog file
Table 111 Common directories and files installed regardless of computer role (Part 4 of 5)
Directories and files Comments
Chapter F Installed files, directories, and system changes 387

F
Processes and services
Table 112 lists processes and services that are specific to PATROL for BEA WebLogic. It does not list other processes or services for other PATROL components, such as the PATROL Agent or PATROL console.
All processes run on the Agent computer. There are no processes specifically launched by PATROL for BEA WebLogic that are run on either Console or Console Server computers.
About JVM process names
Most of the processes launched by PATROL for BEA WebLogic are JVM processes. All of the JVM processes include a tag that begins with the strings “-Dpmw.channel” or “-Djmx.channel”. This string is followed by the PATROL Agent port number, the PSL global channel name under which the process was launched, and the process start time in seconds since January 1, 1970 0:00 GMT.
The tag follows the form:
-Dpmw.channel=<port>@<channel>@<start time>
$BMC_ROOT/Patrol3/lib/psl
PMW_PjsCommonL.lib PSL library files
PMW_PjsSQLLib.lib
PMW_PjsWebLib.lib
PMW_BlackoutLib.lib
PMW_StdLib.lib
PMW_CommonLib.lib
PMW_AppPerf.lib
Table 111 Common directories and files installed regardless of computer role (Part 5 of 5)
Directories and files Comments
388 PATROL for BEA WebLogic User Guide

F
Microsoft Windows Registry modifications
PATROL for BEA WebLogic does not modify the Windows Registry.
Product and process dependencies
For PATROL for BEA WebLogic to operate correctly, certain additional BMC Software and third-party products and processes must be installed and running in the PATROL for BEA WebLogic environment.
File and process dependencies
PATROL for BEA WebLogic requires specific release and patch levels of the Java Runtime Environment (JRE). PATROL for BEA WebLogic will not function properly without these third party files and processes. The complete list of specific JREs required for PATROL for BEA WebLogic is in Chapter 2 of this user guide.
Application dependencies
Any additional software products or components that PATROL for BEA WebLogic requires are listed in the Release Notes for this version.
Table 112 Processes run by PATROL for BEA WebLogic
Process Function
Non-JVM Processes
xmlMsgClient.xpc collects instrumentation and profiling data; exists only if these options are enabled
JVM Processes
JMX_Listener one instance is launched to handle JMX notifications and receive performance data
JMX_websphere one instance is launched if the JMX component is activated via setup; this process handles JMX management component discovery and requests
Chapter F Installed files, directories, and system changes 389

F
390 PATROL for BEA WebLogic User Guide
A B C D E F G H I J K L M N O P Q R S T U V W X Y Z
Glossary
Aaccess control list (ACL)
Security mechanism that limits access and interaction with resources to a limited range of defined users or applications.
administration serverIn a WebLogic environment (called a domain), the administration server is the one server that provides centralized management functions for the entire domain.
appletJava-based component that runs in a web browser or other application that supports applets.
application program interface (API)A set of function calls that allow an application to share data and functionality with another application. The API defines which functions are available to external programs, how they are invoked, and data types and formats that can be exchanged between the programs.
Bbean
A Java-based component. A standalone piece of Java code that can be integrated into and reused by different Java applications or components. See also enterprise Java bean.
Cclasspath
Classpath is an environment variable used by Java to locate the Java classes that are to be run. The classpath contains all directory paths that are searched for .jar files or compiled Java classes.
command line options (CLOPTS)Command line options are specified when starting a WebLogic Server.
common object request broker (CORBA)CORBA is a language independent distributed object model.
Glossary 391

A B C D E F G H I J K L M N O P Q R S T U V W X Y Z
Ddomain
A WebLogic environment. Typically consists of multiple servers: one administration server and several managed servers.
Eenterprise Java bean (EJB)
EJBs are reusable objects of Java code. The EJB encapsulates business logic in secure, transaction-oriented components.
event catalogA collection of event classes associated with a particular application. PATROL provides a standard event catalog that contains predefined standard event classes for all computer classes and application classes. You can add, customize, and delete an application event catalog only from a PATROL Developer Console.
event managerA graphical user interface for monitoring and managing events; can be used with or without the PATROL Console. There are two event managers: PATROL Event Manager (PEM) works with PATROL for Unix, and PATROLWATCH works with PATROL for Windows products.
Iinstrumentation
Process of dynamically inserting temporary code into an object at runtime so that it generates timing data that can be used for granular object monitoring and management. PATROL for BEA WebLogic provides instrumentation of EJBs, servlets, and SQL statements.
JJ2EE Connector Architecture (JCA)
JCA is a framework for linking the J2EE platform to enterprise software, including databases and ERP applications.
Java 2 Enterprise Edition (J2EE)J2EE adds capabilities of EJBs, servlets, JSP, and XML to J2SE. Information is at http://java.sun.com.
Java 2 Standard Edition (J2SE)J2SE is the core Java specification for development; it includes JDBC, CORBA, security, JMX, and more. Information is at http://java.sun.com.
Java archive (JAR)Collection of Java files in a single, platform-independent archive format. A JAR that contains EJBs is referred to as an EAR.
392 PATROL for BEA WebLogic User Guide

A B C D E F G H I J K L M N O P Q R S T U V W X Y Z
Java Database Connectivity (JDBC)Mechanism for establishing and preserving a set of reusable database connections in a collection known as a pool. When a process needs to perform a database operation, it can use a pre-established connection from the pool, reducing the overhead necessary to establish connections on demand.
Java Developer Kit (JDK)Library of Java routines used to develop a Java application.
Java Management Extensions (JMX)Java-based framework for specifying management information. Java applications embed objects called MBeans that allow clients to register, monitor, and manage the applications.
Java Messaging Service (JMS)Messaging mechanism with various service levels. JMS provides store-and-forward or point-to-point messaging with guaranteed delivery, and it provides a publish-and-subscribe event management model that can provide near-real-time information about system conditions. JMS provides an API for using heterogeneous messaging systems.
Java Naming and Directory Interface (JNDI)API that provides a directory of known resources that can be referenced by Java applications via a lookup function.
Java Server Page (JSP)JSPs are dynamic web server pages, used for functions such as personalization.
Java Transaction API (JTA)Application programming interface that allows J2EE servers to access transaction information.
Java Virtual Machine (JVM)Java run-time environment enabling platform independent code to run across heterogeneous platforms.
JoltJava-based client API that allows BEA WebLogic Server to use services provided by BEA Tuxedo. The Jolt Service Listener (JSL) is a process on the Tuxedo server that handles service requests. The Jolt API is embedded within WebLogic Server. The API can be used by any servlet or other WebLogic application.
Jolt Service Listener (JSL)Process on a BEA Tuxedo server that handles service requests from BEA WebLogic Server or other applications.
JVM Profiling Interface (JVMPI)Extensions to the JVM that provide a method for performance data related to the JVM to be passed to management applications. BEA WebLogic includes JVMPI in both supported JVM environments and this data is used by PATROL for BEA WebLogic when profiling is enabled.
Glossary 393
A B C D E F G H I J K L M N O P Q R S T U V W X Y Z
Llocal managed server
Managed server on the same host as a monitored PATROL Agent.
Mmanaged server
In a WebLogic environment (domain), all servers other than the administration server are managed servers. The managed server is configured and boots via the administration server. Managed servers typically provide applications and components that implement business logic.
In PATROL, the managed server is considered to be a remote managed server (remote from the PATROL Agent). A managed server that is resident on the same host as the PATROL Agent is referred to as a local managed server.
MBeanJava-based technology used in BEA WebLogic Server environment to embed and communicate administrative information between Java applications and management utilities.
Nnursery
An area in the Java heap that the JVM allocates to most objects. Instead of doing garbage collection on an entire heap, a generational garbage collection algorithm focuses only on the nursery area.
Ppassivation
Process of removing a Java bean from main memory.
profilingProcess of using the Java JVMPI to obtain information about the activity of a Java applications and the JVM environment in which they operate.
Rrealm
Security mechanism in which resources can be organized into protected spaces, each with their own access policies and authentication mechanisms.
remote method invocation (RMI)RMI allows remote objects to be used like local objects, providing distributed object support. One client-server connection can be shared for many RMIs.
394 PATROL for BEA WebLogic User Guide

A B C D E F G H I J K L M N O P Q R S T U V W X Y Z
Sservlet
Java program that supports a web server, adding functionality such as dynamic content.
SLAservice level agreement
standardized query language (SQL)Vendor-independent language for working with relational database systems. The language supports complex queries, reporting, database manipulation, and more.
TT3, T3S
WebLogic protocols for communicating between clients and WebLogic servers. T3 provides a framework for transaction-oriented messaging and includes all of the functions of Java Object Serialization or RMI. T3S provides the same services and is encrypted.
thread poolA collection of execution threads that are instantiated and available for use by tasks.
tunnelA stateful client-server connection through a firewall based on the stateless HTTP protocol.
Uuniform resource identifier (URI)
Label that identifies abstract or physical resource. Can be either a URL or URN.
uniform resource locator (URL)Standard method of specifying the address of a resource on the internet. A full URL includes the protocol, host name or IP address, and an optional port number.
uniform resource name (URN)Logical identifier for a resource on the internet. Does not specify absolute location, requiring a system to perform a look up function to find the resource.
Wweb application
Program written specifically for use on the internet. Typically using Java technology, but may include JSPs and non-Java technologies.
Glossary 395

A B C D E F G H I J K L M N O P Q R S T U V W X Y Z
396 PATROL for BEA WebLogic User Guide

A B C D E F G H I J K L M N O P Q R S T U V W X Y Z
Index
Symbols%PATROL_CACHE% 59%PATROL_HOME% 59_monitorRegisterServer parameter 282
AAbout parameter 282accessing KM Commands and InfoBoxes 377account requirements
Unix 43Windows 43
activating JVM thread objects collection 117ActivationCount (EJB_HOME) 255ActiveConnections (JDBC) 262ActiveConnectionsCurrentCount (JCA) 260ActiveConnectionsHighCount (JCA) 261ActiveProcesses 143ActiveProcesses (OS) 274agent
configuration variables 371installing a KM to 46
alarmsuspending 235
alert, see alarmAliveServerCount (CLUSTER) 254AllProcAvgLoad (JROCKIT) 267AnnotatedStatus (JMX_CONDITION) 289application classes
descriptions 29discovery cycles 120icons for 29instance naming convention 37organization of 25parameters 249
Application Component Response report 132application deployment 167, 168architecture
application classes 25data collection 27
archivelog files 212
archivingforcing 173
AttrDiscovery (SERVER) 278
Availability (JMX_SERVER) 291AvailableClusterServers (CLUSTER) 254AvailableConnections parameter 262AverageActiveUsage (JCA) 261AvgConnTime (PROBE) 275AvgCPUTime (PROF_METHOD) 275AvgDispTime parameter 287AvgExecTime parameter 287AvgGCTime (JVMPROFILER) 267AvgPingTime (PROBE) 275AvgResponseTime (DBURL) 254AvgResponseTime (EJB_HOME) 255AvgResponseTime (EJB_METHOD) 259AvgResponseTime (SERVLET_METHOD) 282AvgResponseTime (SQL) 283AvgResponseTime (WEBAPP) 284AvgRespTime parameter 287
Bbacking up
current installation before migration 64basic mode
InfoBox 339BeanAccessCount parameter 255BeanDestroyedCount parameter 256BeanDestroyedRatio parameter 256BeanMissCount parameter 256BeansIdle (EJB_HOME) 256BeansInUse (EJB_HOME) 256BEAWLI_INTEGRATION
commands 309described 29instance names 37parameters 253
BEAWLI_INTEGRATION application class parameters_IntegAttrDisc 253AppEventErrCount 253AppSvcAvgElapsedTime 253AppSvcSynErrCount 253IntegDiscovery 253NumEventRowCount 253NumTotalDeadMsg 253
Index 397

A B C D E F G H I J K L M N O P Q R S T U V W X Y Z
BEAWLI_PROCESScommands 310described 29instance names 37parameters 253
BEAWLI_PROCESS application class parametersElapsedTime 253NumTotalExceededSLA 253ProcessThroughput 254
BEAWLP_CACHEcommands 310described 30InfoBox 341instance names 37parameters 254
BEAWLP_CACHE application class parametersCacheMode 254
BEAWLP_PORTALcommands 311described 30InfoBox 341instance names 37parameters 254
BEAWLS.kml 92BEAWLS_ MESSAGING_BRIDGE
instance names 37BEAWLS_CLUSTER
described 29InfoBox 341parameters 254
BEAWLS_DBURLcommands 311described 30InfoBox 342parameters 254
BEAWLS_EJBdescribed 30InfoBox 342
BEAWLS_EJB_HOMEcommands 312described 30InfoBox 343instance names 37parameters 255
BEAWLS_EJB_HOME (WLS 8.1) parametersBeanAccessCount 255BeanDestroyedCount 256BeanDestroyedRatio 256BeanMissCount 256FreePoolMissRatio 257
BEAWLS_EJB_METHODcommands 312described 30InfoBox 343parameters 259
398 PATROL for BEA WebLogic User Guide
BEAWLS_EXEC_QUEUEcommands 313described 31instance names 38parameters 260
BEAWLS_EXEC_QUEUE application class 344BEAWLS_EXEC_QUEUE parameters
QueueLengthPercent 260BEAWLS_INTEGRATION
InfoBox 339BEAWLS_J2EE
instance names 38BEAWLS_J2EE_APPS
commands 317described 31InfoBox 353parameters 268
BEAWLS_J2EE_APPS application class parametersLongestEJBAvgRespTime 268LongestWebAppAvgRespTime 269
BEAWLS_JCAdescribed 31InfoBox 344, ??–346instance names 38parameters 260
BEAWLS_JDBCcommands 313–315described 31InfoBox 346instance names 38parameters 262
BEAWLS_JMSdescribed 31InfoBox 348instance names 38parameters 264
BEAWLS_JMS parametersHealthStatus 264JMSConnectionsCurrentCount 264JMSServersCurrentCount 264
BEAWLS_JMS_DESTINATIONcommands 315described 31instance names 38parameters 264
BEAWLS_JMS_DESTINATION parametersBytesCurrentCount 264BytesPendingCount 264BytesReceivedCount 264BytesThresholdTime 264ConsumersCurrentCount 264MessagesCurrentCount 264MessagesPendingCount 265MessagesReceivedCount 265MessagesThresholdTime 265

A B C D E F G H I J K L M N O P Q R S T U V W X Y Z
BEAWLS_JMSSERVERcommands 316described 31InfoBox 349instance names 38parameters 265
BEAWLS_JOLTdescribed 32instance names 38
BEAWLS_JROCKITcommands 316described 32InfoBox 350parameters 267
BEAWLS_JVMPROFILERcommands 317described 32InfoBox 351parameters 267
BEAWLS_LOCAL_MANAGEDcommands 318described 32InfoBox 354parameters 270
BEAWLS_LOGcommands 320described 32InfoBox 355instance names 38parameters 272
BEAWLS_MANAGEDcommands 321described 33InfoBox 356instance names 38parameters 272
BEAWLS_MESSAGING_BRIDGEdescribed 33InfoBox 357parameters 274
BEAWLS_OScommands 323described 33InfoBox 358parameters 274
BEAWLS_PROBEcommands 322described 33InfoBox 359instance names 38parameters 275
BEAWLS_PROCESSInfoBox 340
BEAWLS_PROF_CLASScommands 323described 34InfoBox 359instance names 38
BEAWLS_PROF_METHODInfoBox 359instance names 38parameters 275
BEAWLS_SAFdescribed 34InfoBox 360instance names 37parameters 275
BEAWLS_SAFAGENTdescribed 34InfoBox 360instance names 37parameters 275
BEAWLS_SERVER 28commands 324described 29InfoBox 352, 361instance names 38parameters 278
BEAWLS_SERVLETcommands 329described 34InfoBox 362instance names 38parameters 281
BEAWLS_SERVLET_METHODdescribed 35InfoBox 363parameters 282
BEAWLS_SETUPcommands 329configuration 93, 101described 29icon 28InfoBox 363parameters 282
BEAWLS_SETUP parameters_monitorRegisterServer 282About 282
BEAWLS_SQLcommands 330described 35InfoBox 364parameters 283
BEAWLS_THREADPOOLcommands 331described 35InfoBox 364instance names 38parameters 283
Index 399
A B C D E F G H I J K L M N O P Q R S T U V W X Y Z
BEAWLS_TUXEDO_CONNECTORdescribed 35InfoBox 364parameters 284
BEAWLS_WEBAPPcommands 332described 35InfoBox 365instance names 39parameters 284
BEAWLS_WORKLOADdescribed 36InfoBox 365instance names 39parameters 285
BEAWLS_WScommands 332described 35InfoBox 366instance names 39parameters 285
BEAWLS_WS (WLS8.1) parametersAvailableConnections 262AvgDispTime 287AvgExecTime 287AvgRespTime 287HandlerReqErrorCount 287HandlerRespErrorCount 287HighestDispTime 288HighestExecTime 288HighestHdlTotReqFail 285HighestHdlTotRespFail 285HighestRespTime 288LowestDispTime 288LowestExecTime 288LowestRespTime 288NumHighestInvocation 286NumHomePageHit 286NumInvocation 288NumMalformedRequest 286NumReqError 287, 288NumReqSOAPFault 286, 287NumReqTermination 287NumRespTermination 287NumWSDLHit 286SlowestOpAvgDisp 286SlowestOpAvgExec 286SlowestOpAvgResp 286TotalDispTime 288TotalExecTime 289TotalRespTime 289UnavailableConnections 263
400 PATROL for BEA WebLogic User Guide
BEAWLS_WS_HDLcommands 333described 36InfoBox 366instance names 39parameters for WLS 8.1 286
BEAWLS_WS_OPERcommands 333described 36InfoBox 367instance names 39parameters for WLS 8.1 287
Behavior Tracking report 132binary files 375blackout period 20, 235BMC Software, contacting 2BooleanFalseCount 289BooleanTrueCount (JMX_CONDITION) 289Boot Server command 20, 138, 139Bourne shell 79BytesCurrentCount (BEAWLS_JMS_DESTINATION)
parameter 264BytesCurrentCount (JMSSERVER) 265BytesCurrentCount (SAFAGENT) 275BytesHighCount (JMSSERVER) 265BytesHighCount (SAFAGENT) 275BytesPendingCount (BEAWLS_JMS_DESTINATION)
parameter 264BytesPendingCount (JMSSERVER) 265BytesPendingCount (SAFAGENT) 275BytesReceivedCount (BEAWLS_JMS_DESTINATION)
parameter 264BytesReceivedCount (JMSSERVER) 265BytesReceivedCount (SAFAGENT) 276BytesThresholdTime (BEAWLS_JMS_DESTINATION)
parameter 264BytesThresholdTime (JMSSERVER) 265BytesThresholdTime (SAFAGENT) 276
CC shell 79cache
flushing 151resuming monitoring 152suspending monitoring 151tuning 150
CacheAccessCount (EJB_HOME) 256CachedBeansCurrentCount (EJB_HOME) 256CacheHitCount (EJB_HOME) 256CacheMissRatio 257capabilities, see featuresCheckNotification (SERVER) 278clusters 21
parameters for monitoring 254
A B C D E F G H I J K L M N O P Q R S T U V W X Y Z
collectorJava, debug status 241
collector parameters 292collectors 27
recording data 241restarting 237tuning 20, 183, 194, 195, 200, 202
colormap option 78commands
accessing 377component
monitoring 21components
deselecting for monitoring 234removing monitoring 234selecting for monitoring 233
configuringJDBC 163JMS 155JTA 154PATROL for BEA WebLogic Server 91server attributes 141
configuring a process 173connection delay, JDBC 164connection leak profiling, JDBC 162connection leak report 132, 162ConnectionDelayTime (JDBC) 262ConnectionidleProfileCount (JCA) 261ConnectionLeakProfileCount (JCA) 261ConnectionLeakProfileCount (JDBC) 262ConnectionStatus (LOCAL_MANAGED) 270ConnectionStatus (MANAGED) 272ConnectionStatus (SERVER) 279console
installing a KM to 46saving the settings 92
console systemsoverview 46
consumer parameters 292ConsumersCurrentCount
(BEAWLS_JMS_DESTINATION) parameter 264contacting support
collecting diagnostics and parameter files 243describing your configuration 242verifying permissions 243
containers, application 28conventions, for naming application instances 37ConversationsCurrentCount (SAFAGENT) 276ConversationsHighCount (SAFAGENT) 276ConversationsTotalCount (SAFAGENT) 276CPU
usage, defining 143CPUTime (PROF_METHOD) 275CPUUsage (JVMPROFILER) 267CreatedConnectionsTotalCount (JCA) 261custom installation option 48customer support 3
customizationsmigrating 64migrating manually 73
customized PSLmigrating 74
Ddata collection, see collectorsdata flow, collection 27database URL
parameters for monitoring 254date, text sniff pattern 22deactivating JVM thread objects collection 118debug flag, setting 238debug status, setting for Java collector 241debug status, setting for server 240debugging 237default login shell 49default values
parameters 249deleting old version 73demonstration license 43deploying applications 168deselecting components for monitoring 234deselecting servers from monitoring 232DestinationsCurrentCount (JMSSERVER) 265DestinationsHighCount (JMSSERVER) 265DestinationsTotalCount (JMSSERVER) 265DestroyedConnectionsTotalCount (JCA) 261directories 375discovery
schedules 120verifying 119
Doc. Content Pool Info report 132domain log 214DomainConsistency (SERVER) 279, 324
EEJB
identifying most critical 181methods, monitoring 183parameters for monitoring 255, 259top EJB report
EJBtop EJB methods report 181
EJBAttrDiscovery (SERVER) 279_EJBRespColl (LOCAL_MANAGED) 270_EJBRespColl (SERVER) 278environment variable
PATROL_CACHE 59PATROL_HOME 59
Index 401
A B C D E F G H I J K L M N O P Q R S T U V W X Y Z
environment variablesLANG 78, 79PATH 78, 79PATROL_BROWSER 79setting for Help browser 78setting for the browser 78
error messagesJMX 238notification 227, 228
eventsmanaging 23Probe 23
eXceed 78ExecQThroughput (EXEC_QUEUE) 260executables 375execute threads report 132ExecuteQueueLength (EXEC_QUEUE) 260execution queue
parameters for monitoring 260ExecutionTime (PROF_METHOD) 275ExecutionTimeAverage (SERVLET) 281ExecutionTimeHigh (SERVLET) 282ExecutionTimeLow (SERVLET) 282ExecutionTimeTotal (SERVLET) 282extension, file name 376
FFailedMessagesTotal (SAFAGENT) 276FailuresToReconnectCount (JDBC) 263features 20file transfer time 129files
installed by product 375type 376
first-time installlationtypical installation option 48
flushing a cache 151forcing archiving 173ForeignFragmentsDropped (LOCAL_MANAGED) 270ForeignFragmentsDropped (MANAGED) 272FragmentsReceived (LOCAL_MANAGED) 270FragmentsReceived (MANAGED) 272FragmentsSent (LCCAL_MANAGED) 270FragmentsSent (MANAGED) 273FreeConnectionsCurrentCount (JCA) 261FreeConnectionsHighCount (JCA) 261FreeHeap (LOCAL_MANAGED) 271FreeHeap (MANAGED) 273FreeHeap (SERVER) 279FreePhyMemory (JROCKIT) 267FreePoolMissRatio parameter 257FreePoolTimeout (EJB_HOME) 257FreePoolWaiter (EJB_HOME) 257
402 PATROL for BEA WebLogic User Guide
Ggarbage collection 141GCCount (JVMPROFILER) 268GCTime (JVMPROFILER) 268
HHandlerReqErrorCount parameter 287HandlerRespErrorCount parameter 287HealthStatus (JMSSERVER) 266HealthStatus (LOCAL_MANAGED) 271HealthStatus (MANAGED) 273HealthStatus (SAF) 275HealthStatus (SAFAGENT) 277HealthStatus (SERVER) 280HealthStatus (THREADPOOL) 283HealthStatus parameter 264HeapUsed (LOCAL_MANAGED) 271HeapUsed (MANAGED) 273HeapUsed (SERVER) 280hierarchy
application classes 25HighestDispTime parameter 288HighestExecTime parameter 288HighestHdlTotReqFail parameter 285HighestHdlTotRespFail parameter 285HighestInvocationCount 254HighestInvocationCount (DBURL) 254HighestRespTime parameter 288HoggingThreadCnt (THREADPOOL) 283host
text sniff pattern 22HTTP log file 217
Iicon 28icons
defined 29naming conventions 37setup 28WebLogic Server 28
IdleConnectionsTotalCount (JCA) 261IdleExecThreadCount (EXEC_QUEUE) 260
A B C D E F G H I J K L M N O P Q R S T U V W X Y Z
InfoBoxbasic mode 339BEAWLS_EJB_METHOD application class 343BEAWLS_J2EE_APPS application class 353BEAWLS_JCA application class ??–346BEAWLS_JROCKIT application class 350BEAWLS_SERVLET_METHOD application class 363BEAWLS_THREADPOOL application class 364BEAWLS_TUXEDO_CONNECTOR application class
364BEAWLS_WORKLOAD application class 365BEAWLS_WS application class 366BEAWLS_WS_HDL application class 366BEAWLS_WS_OPER application class 367
InfoBox (WebLogic 7.0 and 8.1 environments)BEAWLP_EXEC_QUEUE application class 344BEAWLS_JMS application class 348BEAWLS_JOLT application class 352BEAWLS_JVMPROFILER application class 351BEAWLS_LOCAL_MANAGED application class 354BEAWLS_MANAGED application class 356BEAWLS_OS application class 358BEAWLS_PROBE application class 359BEAWLS_PROF_CLASS application class 359BEAWLS_PROF_METHOD application class 359BEAWLS_SERVER application class 361BEAWLS_SERVLET application class 362BEAWLS_SETUP application class 363BEAWLS_SQL application class 364BEAWLS_WEBAPP application class 365JMX_CONDITION application class 368JMX_SERVER application class 368
InfoBox (WebLogic 7.0 environments)BEAWLP_CLUSTER application class 341BEAWLP_DBURL application class 342BEAWLS_EJB _HOME application class 343BEAWLS_EJB application class 342BEAWLS_JCA application class 344BEAWLS_JDBC application class 346BEAWLS_JMSSERVER application class 349
InfoBox (WebLogic 8.1 environment)BEAWLP_EJB application class 342
InfoBox (WebLogic 8.1 environments)BEAWLP_CACHE application class 341BEAWLP_PORTAL application class 341BEAWLS_INTEGRATION application class 339BEAWLS_JCA application class 344BEAWLS_JDBC application class 346BEAWLS_JMSSERVER application class 349BEAWLS_PROCESS application class 340BEAWLS_SERVLET application class 362BEAWLS_WEBAPP application class 365
InfoBox (WebLogic 8.1, 9.x, and 10.x environments)BEAWLS_MESSAGING_BRIDGE application class
357
InfoBox (WebLogic 9.x and 10.x environments)BEAWLS_SAF application class 360BEAWLS_SAFAGENT application class 360
InfoBoxes, accessing 377installation
backing up before migration 64custom option 48quick start overview 52typical option 48Unix account requirements 43Windws account requirements 43
installation utilityversion 45
installingclearing cache 73
instance naming convention 37instrumentation
J2EE 21integration server
configuring a process 173forcing archiving 173specifying a monitoring process 172stopping the monitoring of a process 175suspending a process 174
InvocationCount (EJB_HOME) 257InvocationCount (EJB_METHOD) 259InvocationCount (SERVLET) 282InvocationCount (SERVLET_METHOD) 282InvocationCount (SQL) 283InvocationCount (WEBAPP) 284InvocationRate (DBURL) 255InvocationRate (EJB_HOME) 257InvocationRate (EJB_METHOD) 260InvocationRate (SERVLET_METHOD) 282InvocationRate (SQL) 283InvocationRate (WEBAPP) 284
JJ2EE
instrumentation 21J2EEAttrDiscovery (SERVER) 280Java
method performance 21Java collector
debug status 241Java garbage collection 141Java Process Definition 172JCA
management features 24parameters for monitoring 260
Index 403

A B C D E F G H I J K L M N O P Q R S T U V W X Y Z
JDBCadministering 160configuration 163connection login delay 164log file 216management features 24parameters for monitoring 262pool, creating 157, 160pool, disabling 160pool, enabling 160pool, resetting 160pool, shutting down 160profile reports 162profiling 162
JDBCAttrDiscovery (SERVER) 280JMS
configuration 155management features 24parameters for monitoring 265
JMS server components report 132JMS thresholds 155JMSAttrDiscovery (SERVER) 280JMSConnectionAlive (EJB_HOME) 258JMSConnectionsCurrentCount parameter 264JMSServersCurrentCount parameter 264JMX
activating 193condition 207error messages 238monitoring, described 22
JMX error messages 238JMX_CONDITION
commands 334described 37InfoBox 368instance names 39parameters 289
JMX_DOMAINcommands 334described 36instance names 39parameters 291
JMX_MAINcommands 335described 36parameters 291
JMX_SERVERcommands 336described 36InfoBox 368instance names 39parameters 291
JNDI report 132JPD 172JRockit
parameters for monitoring 267
404 PATROL for BEA WebLogic User Guide
JTAconfiguration 154management features 24
JTA information report 132JTA transaction report 132JVM
OS-level parameters 274parameters for monitoring 267process names 388profiling, described 22profiling, using 188
JVM thread objectsactivating collection 117deactivating collection 118
JVMProcLoad (JROCKIT) 267_JVMProfColl (LOCAL_MANAGED) 270_JVMProfColl (SERVER) 278
KKM
loading 92see also application classestuning performance 231, 232, 233, 234
KM customizationsmigrating manually 73
KMsdetermining if migratable 58installing individual 48installing QuickStart packages 48
Korn shell 79
Llabel
instance naming conventions 37LANG environment variable 79LastGCDuration (JROCKIT) 267LeakedConnectionsCount (JDBC) 263LeakedConnectionsTotalCount (JCA) 261license
demonstration 43permanent 43
license information report 133LicenseStatus (SERVER) 280load KM 92local managed server
parameters 270lock server 140LockEntriesCount (EJB_HOME) 258LockManagerAccessCount (EJB_HOME) 258LockTimeoutCount (EJB_HOME) 258LockTimeoutRatio (EJB_HOME) 258LockWaiterCount (EJB_HOME) 258LockWaiterRatio (EJB_HOME) 258
A B C D E F G H I J K L M N O P Q R S T U V W X Y Z
log filesdescribed 22domain log 214event management 23HTTP log 217JDBC 216location, updating 226notification, subscribing 227notification, unsubscribing 228parameters for monitoring 272rotation 212selecting 213server log 215severity 212sniff patterns 22, 225sniff type 226stop monitoring 222transaction log 219view contents 223
LogDiscovery (SERVER) 281LogDiskFreeSpace 272LogEvent (LOG) 272login delay, setting JDBC pool delay 164login shell
default 49LogIncreaseRate (LOG) 272LongestEJBAvgRespTime (EJB_HOME) 258LongestEJBTotalRespTime (EJB_HOME) 258LongestServletAvgRespTime (WEBAPP) 284LongestServletTotalRespTime (WEBAPP) 284LongestSQLAvgRespTime (DBURL) 255LongestSQLTotalRespTime (DBURL) 255LowestDispTime parameter 288LowestExecTime parameter 288LowestRespTime parameter 288
MMainDiscovery 120MainDiscovery (SERVER) 281maintenance shutdown
blackout period 20, 235managed server response report 133managed systems
overview 46parameters 272
manualmigration of KM customizations 73
MatchedConnectionsTotalCount (JCA) 262MBeanCount (JMX_CONDITION) 289MBeanCount (JMX_DOMAIN) 291MBeanCount (JMX_SERVER) 291MDBStatus (EJB_HOME) 258MemoryUsage (JVMPROFILER) 268
menu commandsBEAWLS_J2EE_APPS application class 317BEAWLS_JDBC application class 313–315BEAWLS_THREADPOOL application class 331
menu commands (WebLogic 7.0 and 8.1 environments)BEAWLS_DBURL application class 311BEAWLS_EJB_HOME application class 312BEAWLS_EJB_METHOD application class 312BEAWLS_EXEC_QUEUE application class 313BEAWLS_JMS_DESTINATION application class 315BEAWLS_JMSSERVER application class 316BEAWLS_JVMPROFILER application class 317BEAWLS_LOCAL_MANAGED application class 318BEAWLS_LOG application class 320BEAWLS_MANAGED application class 321BEAWLS_OS application class 323BEAWLS_PROBE application class 322BEAWLS_PROF_CLASS application class 323BEAWLS_SERVER application class 324BEAWLS_SERVLET application class 329BEAWLS_SETUP application class 329BEAWLS_SQL application class 330BEAWLS_WEBAPP application class 332JMS_DOMAIN application class 334JMX_CONDITION application class 334JMX_MAIN application class 335JMX_SERVER application class 336
menu commands (WebLogic 8.1 environments)BEAWLI_INTEGRATION application class 309BEAWLI_PROCESS application class 310BEAWLP_CACHE application class 310BEAWLP_PORTAL application class 311BEAWLS_JROCKIT application class 316BEAWLS_WS application class 332BEAWLS_WS_HDL application class 333BEAWLS_WS_OPER 333
merge map file 68, 71Message Channels Info. report 133message severity
log files 212MessagesCurrentCount (BEAWLS_JMS_DESTINATION)
parameter 264MessagesCurrentCount (JMSSERVER) 266MessagesCurrentCount (SAFAGENT) 277MessagesHighCount 266MessagesHighCount (SAFAGENT) 277MessagesPendingCount (BEAWLS_JMS_DESTINATION)
parameter 265MessagesPendingCount (JMSSERVER) 266MessagesPendingCount (SAFAGENT) 277MessagesReceivedCount (BEAWLS_JMS_DESTINATION)
parameter 265MessagesReceivedCount (JMSSERVER) 266MessagesReceivedCount (SAFAGENT) 277MessagesThresholdTime (BEAWLS_JMS_DESTINATION)
parameter 265MessagesThresholdTime (JMSSERVER) 266
Index 405

A B C D E F G H I J K L M N O P Q R S T U V W X Y Z
MessagesThresholdTime (SAFAGENT) 278Messaging Bridge
parameters 274method
EJB, finding top 181EJB, monitoring 183EJB, parameters 259profiling parameters 275servlet, monitoring 187
_MethodProfColl (LOCAL_MANAGED) 270_MethodProfColl (SERVER) 278migrating
customizations 64customized PSL 74determining if KM is migratable 58KM customizations manually 73
migrationbacking up current installation before 64
MiscAttrDiscovery (SERVER) 281monitoring components 233monitoring servers 231MostInvocationEJB (EJB_HOME) 258MostInvocationServlet (WEBAPP) 284MulticastMsgLost (LOCAL_MANAGED) 271MulticastMsgLost (MANAGED) 273
Nnaming conventions for application instances 37Netscape Navigator 78new PATROL users
easy install option 48Node Manager
configuration report 146log 146monitoring 146restarting 146suspending 146
NodeStatus 146NodeStatus (OS) 274notification, error messages 227NumActiveJVMProcesses (OS) 274NumCompletedReq (WORKLOAD) 285NumCompletedRequest (THREADPOOL) 283NumDeferredReqs (WORKLOAD) 285NumExecThreadIdle (THREADPOOL) 283NumGCCount (JROCKIT) 267NumHighCpuJVMProcesses 143NumHighCpuJVMProcesses (OS) 274NumHighestInvocation parameter 286NumHomePageHit parameter 286NumInvocation parameter 288NumMalformedRequest parameter 286NumMaxCompReqMinConst (J2EE_APPS) 269NumMaxDeferredRequests (J2EE_APPS) 269NumMaxExeReqMaxConst (J2EE_APPS) 269
406 PATROL for BEA WebLogic User Guide
NumMaxExeReqMinConst (J2EE_APPS) 269NumMaxMustRunCount (J2EE_APPS) 269NumMaxPendingReq (J2EE_APPS) 269NumMustRun (WORKLOAD) 285NumOpenConnections (LOCAL_MANAGED) 271NumOpenConnections (MANAGED) 273NumOpenConnections (SERVER) 281NumOpenSockets (LOCAL_MANAGED) 271NumOpenSockets (MANAGED) 273NumOpenSockets (SERVER) 281NumPendingReq (WORKLOAD) 285NumPendingUserReq (THREADPOOL) 283NumReqError parameter 287
BEAWLS_WS_OPER 288NumReqSOAPFault parameter 286, 287NumReqTermination parameter 287NumRespTermination parameter 287NumStandbyThread (THREADPOOL) 284NumWSDLHit parameter 286
Oonline Help
installing 46OpenSessionsCount (WEBAPP) 285OpenSessionsHighCount (WEBAPP) 285overview
of product 20
A B C D E F G H I J K L M N O P Q R S T U V W X Y Z
Pparameters
_IntegAttrDisc 253_monitorRegisterServer 282About 282AppEventErrCount 253AppSvcAvgElapsedTime 253AppSvcSynErrCount 253AvailableConnections 262AvgDispTime 287AvgExecTime 287AvgRespTime 287BeanAccessCount 255BeanDestroyedCount 256BeanDestroyedRatio 256BeanMissCount 256BytesCurrentCount (BEAWLS_JMS_DESTINATION)
264BytesPendingCount (BEAWLS_JMS_DESTINATION)
264BytesReceivedCount
(BEAWLS_JMS_DESTINATION) 264BytesThresholdTime
(BEAWLS_JMS_DESTINATION) 264CacheMode 254collector-consumer dependencies 292–??ConsumersCurrentCount
(BEAWLS_JMS_DESTINATION) 264default values 249ElapsedTime 253FreePoolMissRatio 257HandlerReqErrorCount 287HandlerRespErrorCount 287HealthStatus 264HighestDispTime 288HighestExecTime 288HighestHdlTotReqFail 285HighestHdlTotRespFail 285HighestRespTime 288IntegDiscovery 253JMSConnectionsCurrentCount 264JMSServersCurrentCount 264LongestEJBAvgRespTime 268LongestWebAppAvgRespTime 269LowestDispTime 288LowestExecTime 288LowestRespTime 288MessagesCurrentCount
(BEAWLS_JMS_DESTINATION) 264MessagesPendingCount
(BEAWLS_JMS_DESTINATION) 265MessagesReceivedCount
(BEAWLS_JMS_DESTINATION) 265MessagesThresholdTime
(BEAWLS_JMS_DESTINATION) 265NumEventRowCount 253
NumHighestInvocation 286NumHomePageHit 286NumInvocation 288NumMalformedRequest 286NumReqError 287NumReqError (BEAWLS_WS_OPER) 288NumReqSOAPFault 286, 287NumReqTermination 287NumRespTermination 287NumTotalDeadMsg 253NumTotalExceededSLA 253NumWSDLHit 286ProcessThroughput 254QueueLengthPercent 260SlowestOpAvgDisp 286SlowestOpAvgExec 286SlowestOpAvgResp 286TotalDispTime 288TotalExecTime 289TotalRespTime 289UnavailableConnections 263
PassivationCount (EJB_HOME) 259patcol, see collectorsPATH environment variable 79PATROL Agent
installing a KM to 46variables 371
PATROL Central Operator - Web Editioninstalling 46
PATROL Consoleand Netscape Navigator 78installing a KM to 46saving the configuration 92
PATROL Event Manager 23PATROL for BEA WebLogic Server
configuring 91description of 20features 20loading 92parameters 249
PATROL_BROWSERvariable 79
PATROL_BROWSER environment variable 79PATROL_CACHE 59, 73PATROL_HOME 59PatrolCollectorStatus (SERVER) 281performance
Java component 21tuning KM 231, 232, 233, 234
performance, collector tuning 20periodic pattern matching 226permanent license 43ping time 129pool capacity, JDBC 163Pool Connection Setting report 133PoolState (JCA) 262PoolState (JDBC) 263
Index 407

A B C D E F G H I J K L M N O P Q R S T U V W X Y Z
portal serverflushing a cache 151resuming monitoring of a cache 152suspending cache monitoring 151tuning a cache 150
prepared statement cache report 133, 162prepared statement profiling, JDBC 162Probe
administering 130described 128events 23parameters 275
_ProcColl (OS) 274Process Instance Summary report 133Process Statistics report 133ProcessedMsgCount (EJB_HOME) 259processes 375product description 20product support 3products
uninstalling in Unix environments 81uninstalling in Windows environments 85
profilingJVM 22
PSLmigrating 74
PSL debug flag 238
Qqueue
execution, parameters 260QueueLength (THREADPOOL) 284QueueLengthPercent parameter 260QueueStatus (EXEC_QUEUE) 260quota
JMS 155
Rreal time pattern matching 226realm information report 133recording collector data 241RecycledTotalCount (JCA) 262RejectedConnectionsTotalCount (JCA) 262RemoteEndpointsCurrentCount (SAFAGENT) 278RemoteEndpointsHighCount (SAFAGENT) 278RemoteEndpointsTotalCount (SAFAGENT) 278removing monitoring from components 234removing monitoring of a server 232report
Pool Connection Setting 133Server Performance Setting 133Thresholds & Overrides Settings 133
report of registered instance 133
408 PATROL for BEA WebLogic User Guide
Report on Thresholds & Overrides Settings 133reports
types of 131ReqThroughput (THREADPOOL) 284requirements
Unix account 43Windows account 43
ResentRequests (LOCAL_MANAGED) 272ResentRequests (MANAGED) 274resource, text sniff pattern 22response time
described 128file transfer 129parameters 275web page 129
resuming monitoring of a cache 152rotation
log 212
SSAF
parameters 275SAF Agent
parameters for monitoring 275security
PATROL settings 49security information report 133security requirements 44selecting components for monitoring 233selecting servers for monitoring 231server
boot 138configuration tuning 141debug status 240JMS, parameters 265local managed, parameters 270locking 140log file 215managed, parameters 272management 20parameters 278shutdown 139
server configuration report 133server connection report 133Server Performance Setting report 133ServerJVMsCpuUtil (OS) 274ServerJVMsMemUsage (OS) 275servers
deselecting from monitoring 232removing monitoring of a server 232selecting for monitoring 231
service, text sniff pattern 22ServiceStatus (TUXEDO_CONNECTOR) 284

A B C D E F G H I J K L M N O P Q R S T U V W X Y Z
servletfinding most critical 184method, parameters 282monitoring methods 187parameters for monitoring 281
servlet, selecting 169, 170ServletDiscovery (SERVER) 281SessionPoolsCurrentCount (JMSSERVER) 267SessionPoolsHighCount (JMSSERVER) 267SessionPoolsTotalCount (JMSSERVER) 267setting environment variables for Help browser 78setup
icon 28SetupRequired (JMX_MAIN) 291severity
log files 212severity, text sniff pattern 22shell
default login 49shells
Bourne 79C 79Korn 79
SlowestOpAvgDisp parameter 286SlowestOpAvgExec parameter 286SlowestOpAvgResp parameter 286sniff pattern
defining 220described 22see also log filesturning off 225type 226viewing available 225
specifying a monitoring process 172SQL
call tracing 180finding most critical 178monitoring objects 180parameters 283top N report 178
SQL roundtrip report 133, 162_SQLRespColl (LOCAL_MANAGED) 270_SQLRespColl (SERVER) 278_SQLResponseColl (SQL) 283State (MESSAGING_BRIDGE) 274statement profiling, JDBC 162StatementCacheHitCount (JDBC) 263StatementCacheMissCount (JDBC) 263StatementProfileCount (JDBC) 263StatusCriticalCount (JMX_CONDITION) 290StatusOKCount (JMX_CONDITION) 290StatusWarningCount (JMX_CONDITION) 290stopping the monitoring of a process 175StringMatchCount (JMX_CONDITION) 290StringNoMatchCount (JMX_CONDITION) 290
supportcollecting diagnostics and parameter files 243describing your configuration 242verifying permissions 243
support, customer 3suspend monitoring 20SuspendCount (EJB_HOME) 259suspending a process 174suspending cache monitoring 151system roles
console systems 46managed systems 46
Ttechnical support 3text string, see sniff patternThreadHighestCPUTime (JVMPROFILER) 268threads 143threshold
JMS 155timing, collector tuning 20Top ’N’ WS Handlers report 134Top ’N’ WS Operations report 134TotalDispTime parameter 288TotalExecTime parameter 289TotalHeapSize (JVMPROFILER) 268TotalInvocationCount 255TotalOpenedSessions (WEBAPP) 285TotalResponseTime 255TotalResponseTime (DBURL) 255TotalResponseTime (EJB_HOME) 259TotalResponseTime (EJB_METHOD) 260TotalResponseTime (SERVLET_METHOD) 282TotalResponseTime (SQL) 283TotalResponseTime (WEBAPP) 285TotalRespTime parameter 289TotalThreadCPU (JVMPROFILER) 268TotalThreadSize (JVMPROFILER) 268transaction log 219TransactionCommitRate (EJB_HOME) 259TransactionRollbackRate (EJB_HOME) 259TransactionTimeoutRate (EJB_HOME) 259transfer time, file 129troubleshooting 237
collecting diagnostics and parameter files 243describing your configuration 242verifying permissions 243
tuneling 142tuning a cache 150tuning KM performance 231, 232, 233, 234typical installation option 48
Index 409

A B C D E F G H I J K L M N O P Q R S T U V W X Y Z
UUnavailableConnections parameter 263uninstalling products
in Unix environments 81in Windows environments 85
Unixaccount requirements 43
unlock server 140upgrading
backing up current installation before 64choosing a procedure 59
user account 79
VValueAverage (JMX_CONDITION) 290ValueMaximum (JMX_CONDITION) 290ValueMinimum (JMX_CONDITION) 290ValueSum (JMX_CONDITION) 290variable
PATROL_BROWSER 79variables
Agent configuration 371version, installation utility 45VMemoryUsage (JVMPROFILER) 268
WWaitingForConnections (JDBC) 263warning, see alarmweb application
parameters 284web page response 129WEBAPPAttrDiscovery (SERVER) 281_WebAppRespColl (LOCAL_MANAGED) 270_WebAppRespColl (SERVER) 278WebLogic
server, see serverstarting as NT service 20
WebLogic MBean information report 134WebLogic Server Registration (Step 1) dialog box 93WebLogic Server Registration (Step 2) dialog box 95WebLogic Server Registration (Step 3) dialog box 99Windows
account requirements 43registry 375
410 PATROL for BEA WebLogic User Guide

Notes

*88276**88276**88276**88276*
*88276*