webinar series 1 supporting the inclusion of young children with disabilities session 2: state...
TRANSCRIPT
Webinar Series1
Supporting the Inclusion of Young Children with Disabilities
Session 2: State Strategies to Promote Inclusive Practices
February 17th, 2015
Jim CoylePatti Wirick
Vivian JamesRobin Rooney
Participants will:
1. Understand how two states (PA & NC) are implementing strategies to support local early childhood special education programs to promote the use of inclusive practices.
2. Have opportunities to pose questions and generate ideas with colleagues.
Objectives

Pennsylvania’s Inclusion Support
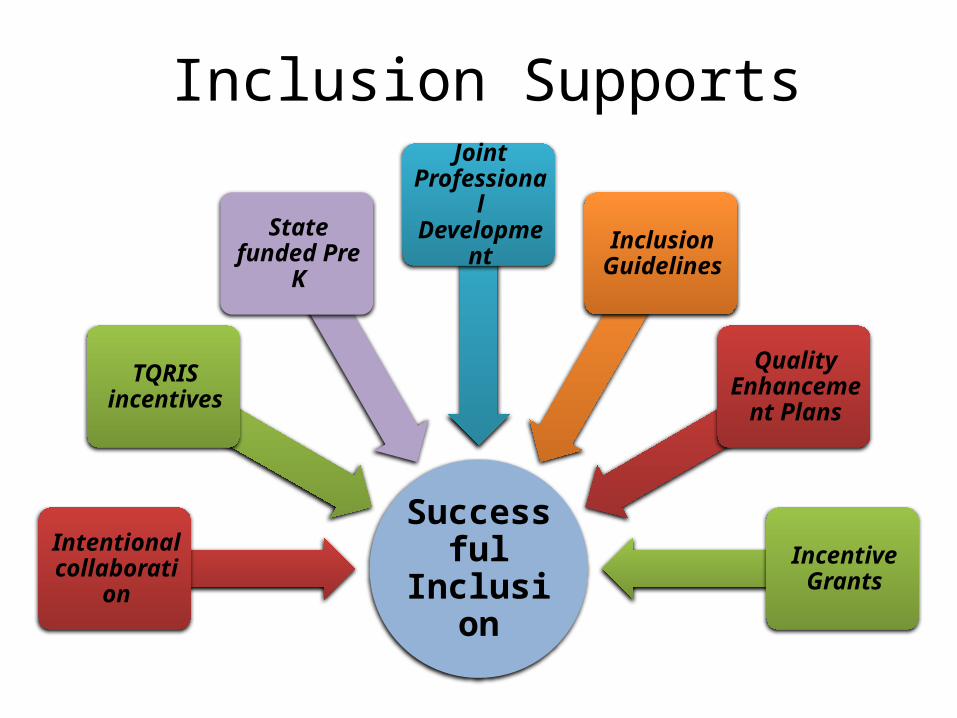
Inclusion Supports
Successful Inclusion
Intentional collaboration
TQRIS incentives
State funded Pre K
Joint Professional
Development Inclusion Guidelines
Quality Enhancement
Plans
Incentive Grants

Inclusion Performance Grants
Offered to low performing early intervention preschool programs since 2008
BEIS and EITA review LRE data for all preschool early intervention programs
Selected programs whose data fell significantly below the state average
Utilized LRE categories of % of children served in Head Start and/or Early Childhood as well as Early Childhood Special Education settings

Inclusion Performance GrantApplication Requirements
Targets for increasing % of
children served in EC/HS settings
Targets for decreasing % of
children served in ECSS settings
Increase community
program partnerships
Designate internal
and external coaches
Professional Development Sustainability

Inclusion Performance GrantPBIS Option
• Beginning in 2014, programs could elect to implement PBIS as a strategy to support inclusion

Inclusion Performance GrantPBIS Option Requirements
• Identify at least one EC partner for implementation
• Commit to multi-year process• Complete “Commitment to
Fidelity Implementation”• Identify a PBIS Facilitator• Participate in on-going
trainings
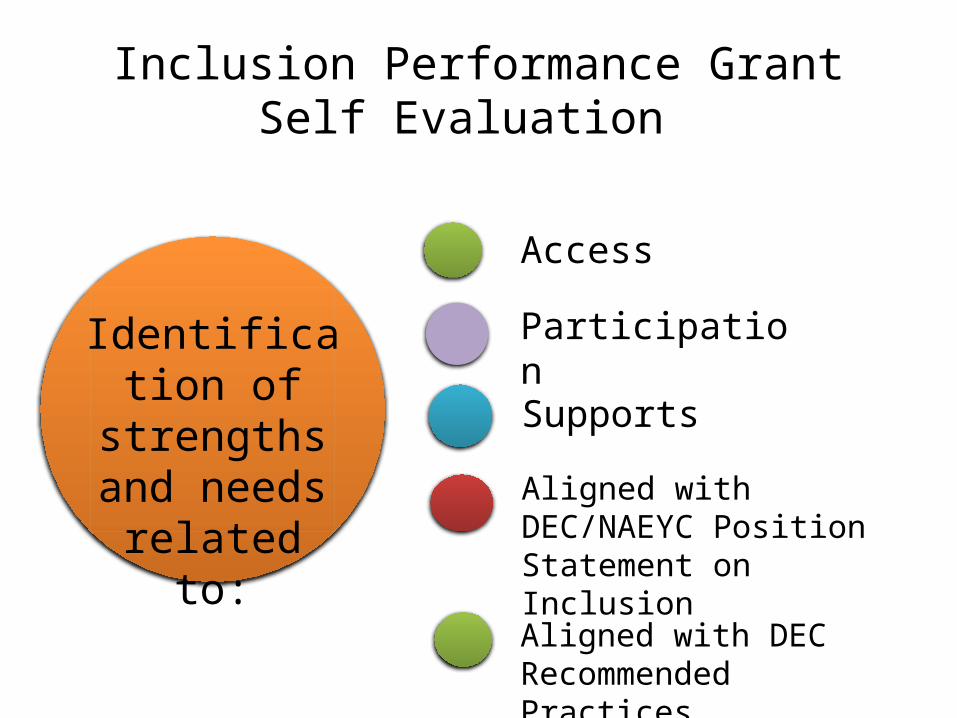
Inclusion Performance GrantSelf Evaluation
Identification of strengths and needs related to:
Access
Participation
Supports
Aligned with DEC/NAEYC Position Statement on Inclusion
Aligned with DEC Recommended Practices

Inclusion Performance GrantSelf Evaluation

Inclusion Performance GrantAction Plan
Based on results of self assessment
Activities for implementation
Team member’s responsibilities
Timelines
Resources needed
Evaluation/data
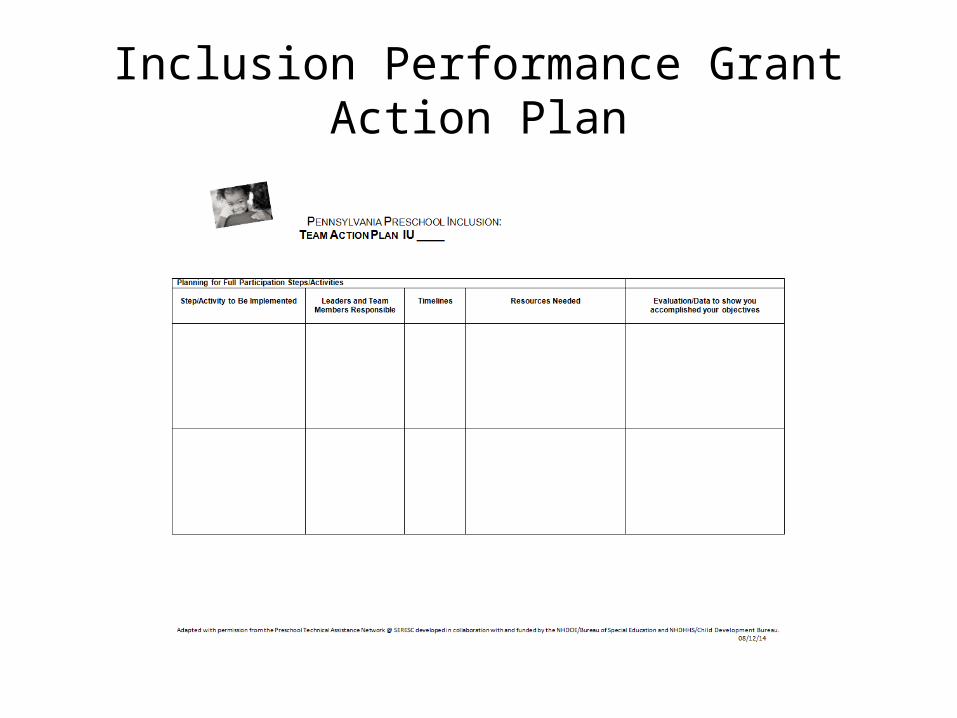
Inclusion Performance GrantAction Plan
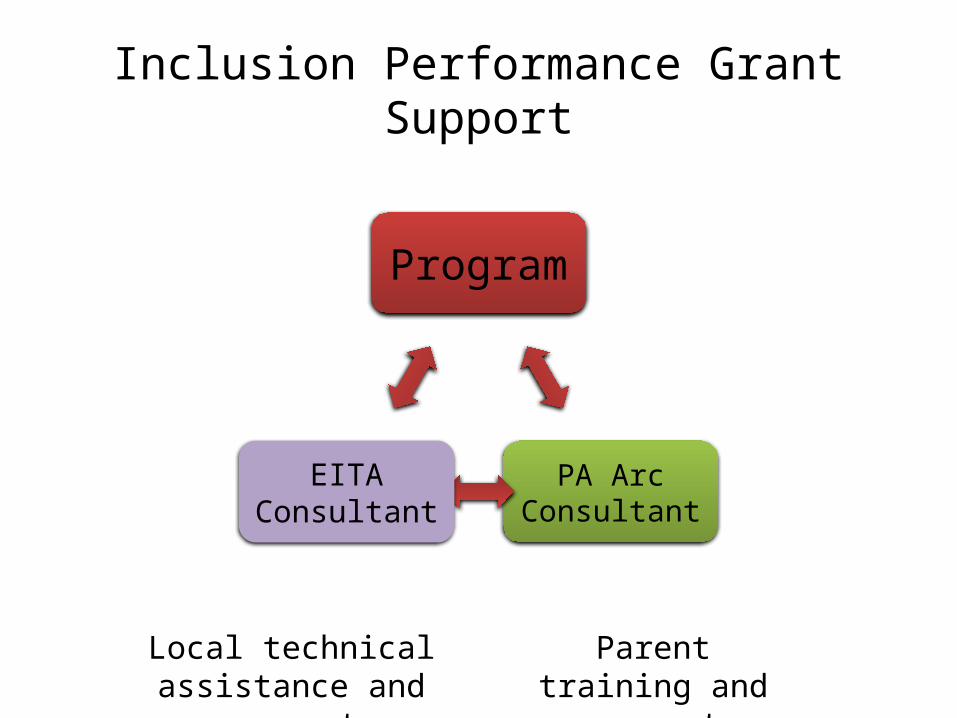
Program
PA Arc Consultant
EITA Consultant
Inclusion Performance GrantSupport
Local technical assistance and support
Parent training and support

• Quarterly meetings
• Quarterly reports
• Monthly
data reports
• Monthl
y EITA
Consultant contact
s
Inclusion Performance GrantOngoing Support


Inclusion Performance GrantResults•Majority of programs met targets
•Sharing of strategies across programs helps sustainability
•Programs strengthened PBIS
•Partnering with PA Arc strengthened family engagement

Inclusion Performance GrantData

Inclusion Performance GrantData

Inclusion Performance GrantData

Questions?

NC EARLY LEARNING NETWORK IS A JOINT PROJECT OF THE NC DEPARTMENT OF PUBLIC INSTRUCTION, OFFICE OF EARLY LEARNING
AND UNC FRANK PORTER GRAHAM CHILD DEVELOPMENT INSTITUTE
Resources to Promote Inclusion
North Carolina Preschool Exceptional Children Program

NC Least Restrictive Environment (LRE) Data

Reporting Indicator 6Summary Statements Actual FFY 2012
Total Headcount N= 18,665(% and # of children)
Actual FFY 2013Total HeadcountN= 18, 801(% and # of children)
Target FFY 2012
6A. Regular early childhood program and receiving the majority of special education and related services in the regular early childhood program
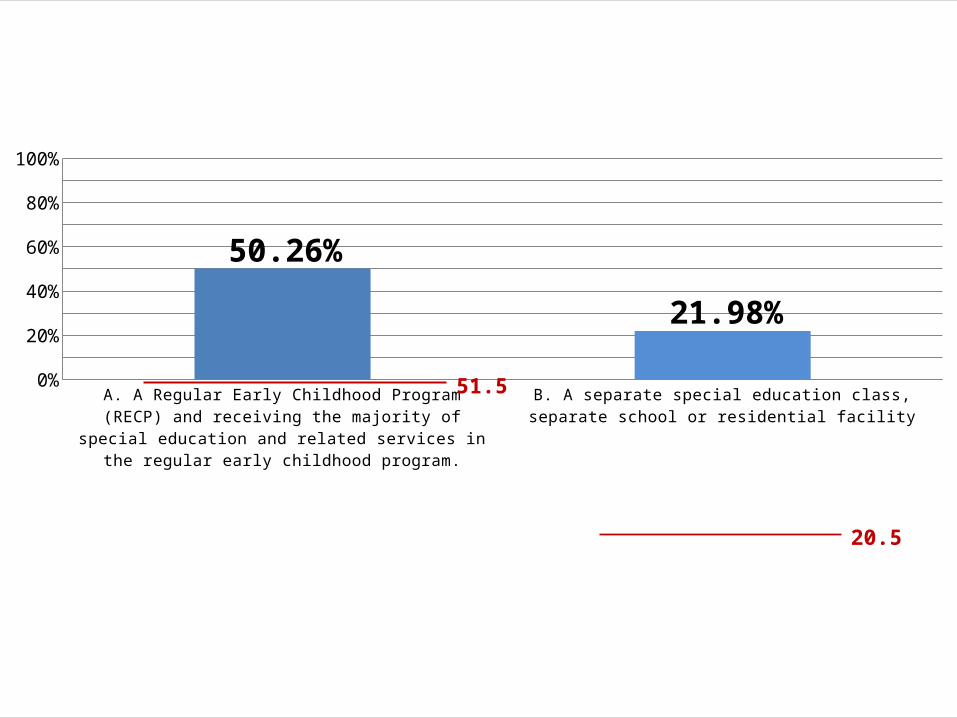
49.9% (N=9.322) 50.26% (N=9.450) 51.5%
6B. Separate special education class, separate school or residential facility
21.2% (N=3,962) 21.98% (N=4,132) 20.5%
0%10%20%30%40%50%60%70%80%90%
100%
50.26%
21.98%
North CarolinaEducational Environments Ages 3-5, December 1, 2013All Children 3-5 Including 5 year olds in Kindergarten
Indicator 6, Percent of Children:
51.5
20.5

0%10%20%30%40%50%60%70%80%90%
100%
38.58%23.79%
North CarolinaEducational Environments Ages 3-5, December 1, 2013
Children in Pre-K Excluding Children in KindergartenPercent of Children:

MTSS
in
NC
Inclusion Initiative
PreK IEP Training (TOT), Early Learning & Development
Standard Training (TOT), NC SEFEL Initiative
Preschool Coordinator Orientation, Regional Meetings and/or Webinars, Representatives/Mentors , Annual
Institute, National Inclusion Institute, Listserv, Guiding Practice Documents, Questions & Answers DocumentDiffer
entiat
ed Co
reSu
pplem
enta
l Sup
port
Inte
nsive
Supp
ort
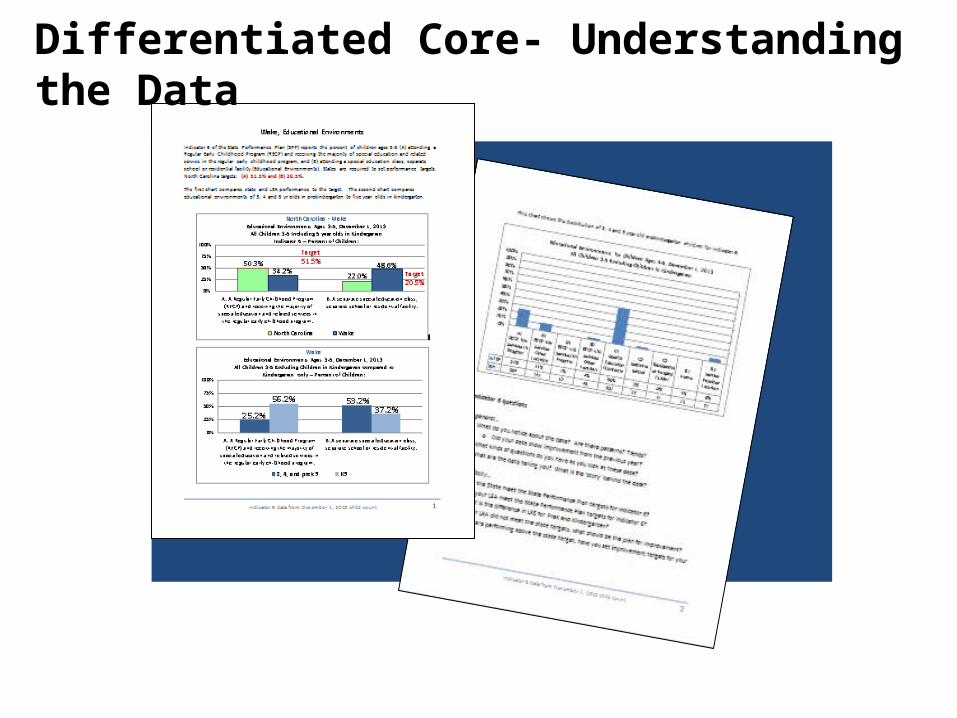
Differentiated Core- Understanding the Data
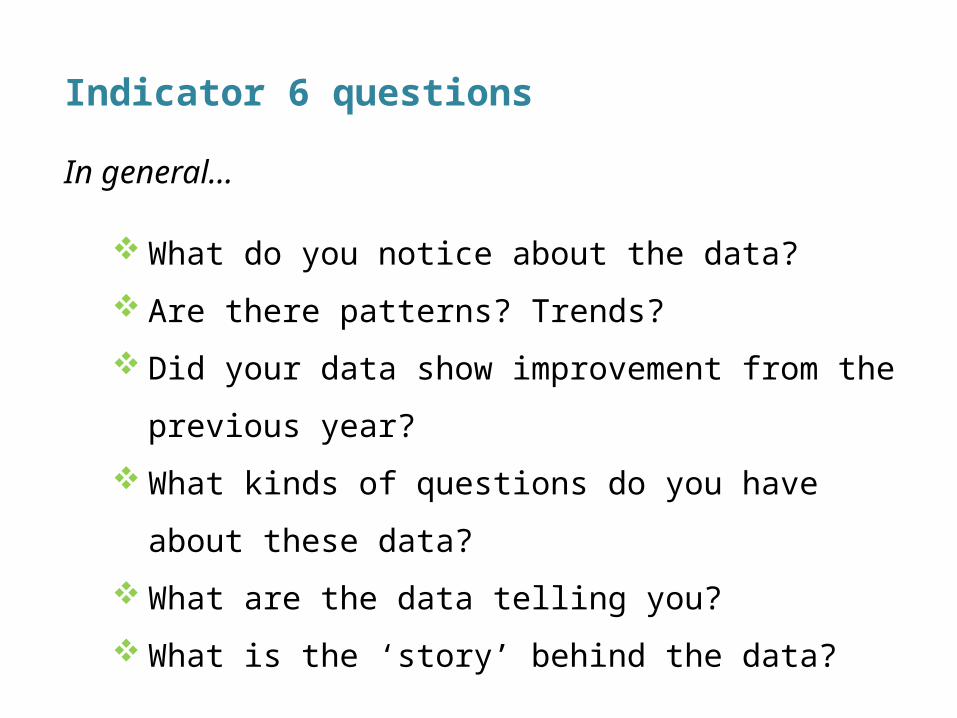
Indicator 6 questions In general…
What do you notice about the data?
Are there patterns? Trends?
Did your data show improvement from the previous year?
What kinds of questions do you have about these data?
What are the data telling you?
What is the ‘story’ behind the data?

Indicator 6 questions
Specifically…
Did the State meet targets for Indicator 6?
Did your LEA meet targets for Indicator 6?
What is the difference in LRE for PreK and Kindergarten? If your LEA did not meet the state targets, what should be
the plan for improvement? If you are performing above the state target, have you set
improvement targets for your LEA?
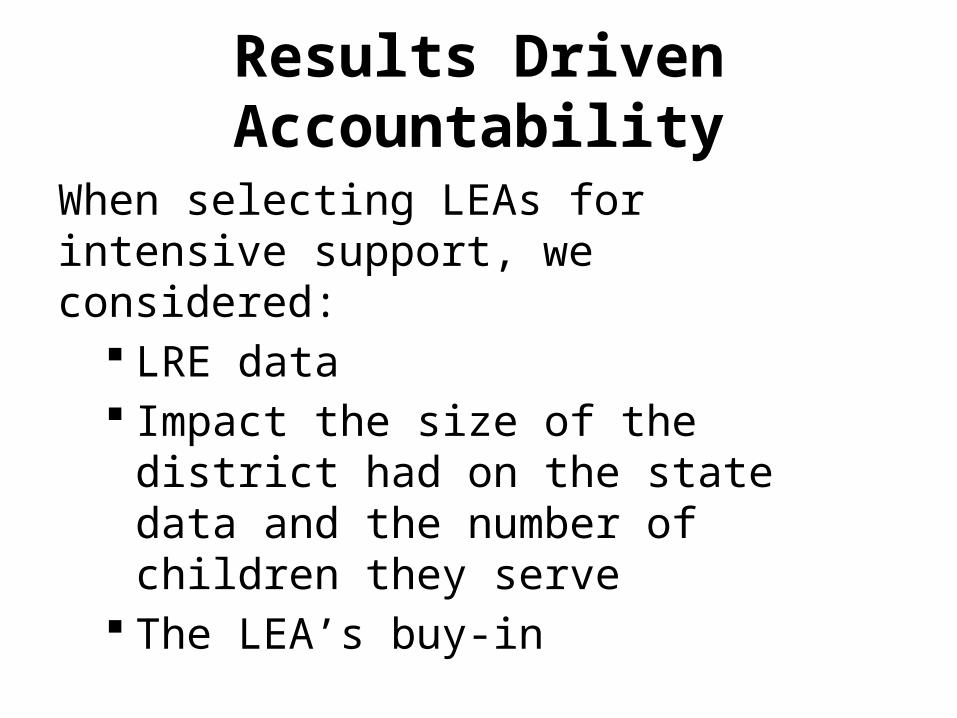
Results Driven Accountability
When selecting LEAs for intensive support, we considered:
LRE data Impact the size of the district had on the
state data and the number of children they serve
The LEA’s buy-in

Inclusion Initiative- Intensive Support
SEA and LEAAgreement
(Assurances)
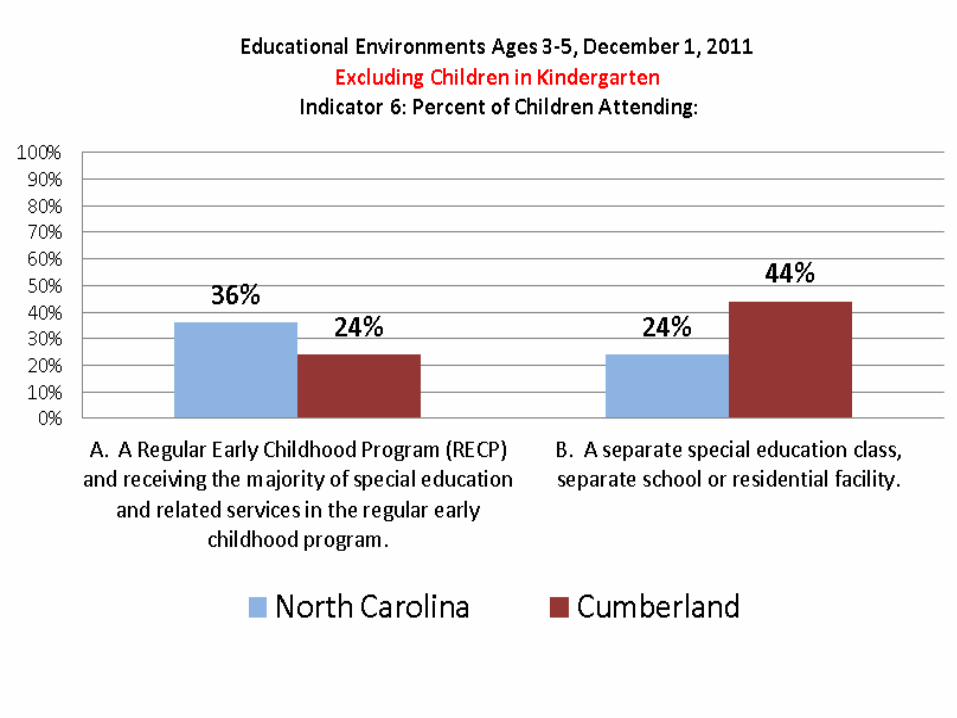

A. A Regular Early Childhood Program (RECP) and receiv-ing the majority of special education and related services
in the regular early childhood program.
B. A separate special education class, separate school or residential facility.
0%
10%
20%
30%
40%
50%
60%
70%
80%
90%
100%
39%
24%
52%
33%
Educational Environments Ages 3-5, December 1, 2013Excluding Children in Kindergarten
Indicator 6: Percent of Children Attending:
North Carolina Cumberland
DRAFT


Questions?

New Resources! http://ectacenter.org/topics/inclusion/default.asp
1. TA Project and National Association Professional Development Resources to Support Inclusion
2. State Professional Development Resources to Support Inclusion
3. Supporting Inclusive Practices: Professional Development Resources
Have you come up with one new idea from today’s call
that you would like to explore further? If so, what is it?
Contact Information
James Coyle: [email protected] Wirick: [email protected]
Vivian James: [email protected] Rooney: [email protected]
Shelley de Fosset: [email protected] Vihn: [email protected]
Katy McCullough: [email protected]

Thank you for your attention!
Resources related to this webinar and other presentations are available at the following URL:
http://ectacenter.org/webinars.asp