webinar housekeeping - forum newsforumfyi.org/files/what do you want to take stock of gallup...
TRANSCRIPT

Webinar Housekeeping
If you have not done so, please call in for the audio portion of the call.
1-800-679-0308
Slides were e-mailed and are uploaded to the Forum website:
http://www.forumfyi.org/content/what-do-you-want-take-
Due to the format of today’s webinar, your lines will be
muted. We will take questions via the Chat feature located at the lower left hand side of your screen.

®
What Do You Want to Take Stock Of?
Exploring the Gallup Student Poll
November 29, 2011 Presented by Kiley Bednar, the Forum for Youth Investment Kris Minor, the Forum for Youth Investment Polly Lusk Page, Northern Kentucky Education Council

• Be familiar with the Forum for Youth Investment and the Ready by 21 National Partnership
• Understand a tool that can help you spark discussion and make decisions about data in your community
• Be aware of how the Gallup Student Poll can help you better understand the social and emotional outcomes of young people
• Understand next steps you can take as a leader to improve the odds for children and youth
After this webinar, you will

Ready by 21 National Partnership
Founder & Managing Partner
Signature Partner
Mobilization Partners Technical Partners
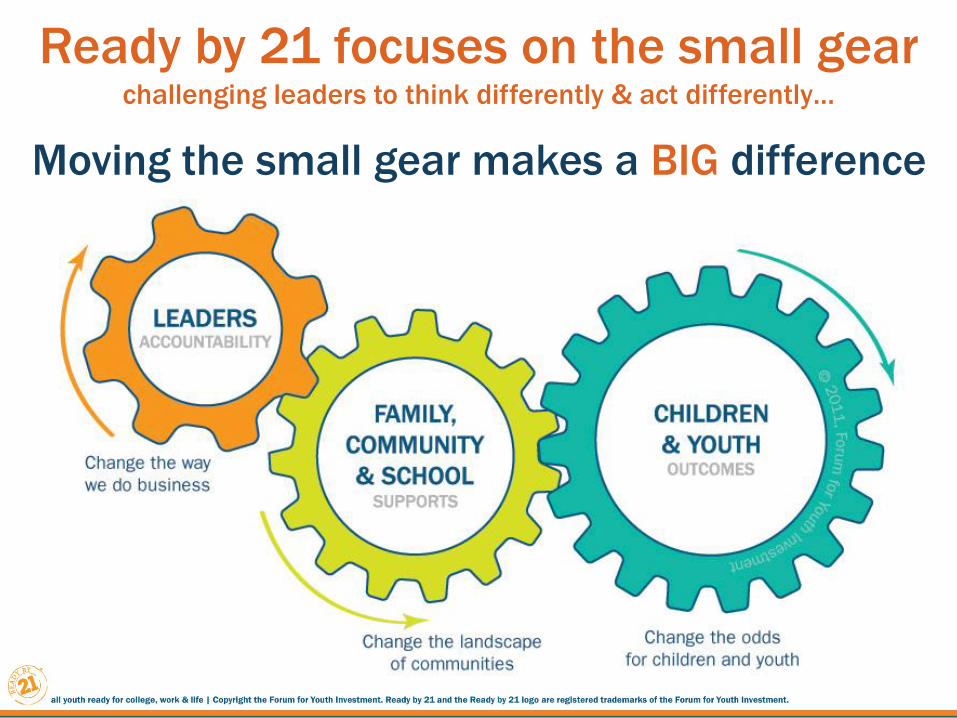
Ready by 21 focuses on the small gear challenging leaders to think differently & act differently…
Moving the small gear makes a BIG difference

Building Blocks of Effective Change

Ready by 21
Leadership Capacity Standard
• Collect complete data
about youth outcomes,
community supports,
and leadership actions
– to inform collective
efforts and demonstrate
the link to improved
outcomes.

What do you want to take stock of?

Do you have data about youth outcomes,
community supports and leadership
actions?
• Yes/No
In which area would you like to collect
more data?
• Youth outcomes
• Community supports
• Leadership actions

Take Aim: Ready Children & Youth

Youth Competencies Survey
• Importance?
• Information?

Take Aim: Socially & Civically
Connected


Copyright Standards
This document contains proprietary research, copyrighted materials, and literary property of Gallup, Inc. It is for the
guidance of your company only and is not to be copied, quoted, published, or divulged to others outside of your
organization. Gallup® and Gallup Consulting® are trademarks of Gallup, Inc. All other trademarks are the property of
their respective owners.
This document is of great value to both your organization and Gallup, Inc. Accordingly, international and domestic
laws and penalties guaranteeing patent, copyright, trademark, and trade secret protection protect the ideas, concepts,
and recommendations related within this document.
No changes may be made to this document without the express written permission of Gallup, Inc.
Copyright © 2010 Gallup, Inc. All rights reserved. 15

Gallup Student Poll Overview
The Gallup Student Poll is a 20-item measure of hope, engagement, and
wellbeing. Gallup researchers targeted these three variables because they
met the following criteria:
- They can be reliably measured
- They have a meaningful relationship with or impact on
educational outcomes
- They are malleable and can be enhanced through deliberate action
- They are not measured directly by another large-scale survey
- They are not associated with a student’s FARL status or parent’s
household income.
Hope | ideas and energy we have for the future | Double Hope
Engagement | involvement in/enthusiasm for school | Build Engaged Schools
Wellbeing | how we think about and experience our lives | Boost Wellbeing
16
Copyright © 2010 Gallup, Inc. All rights reserved.
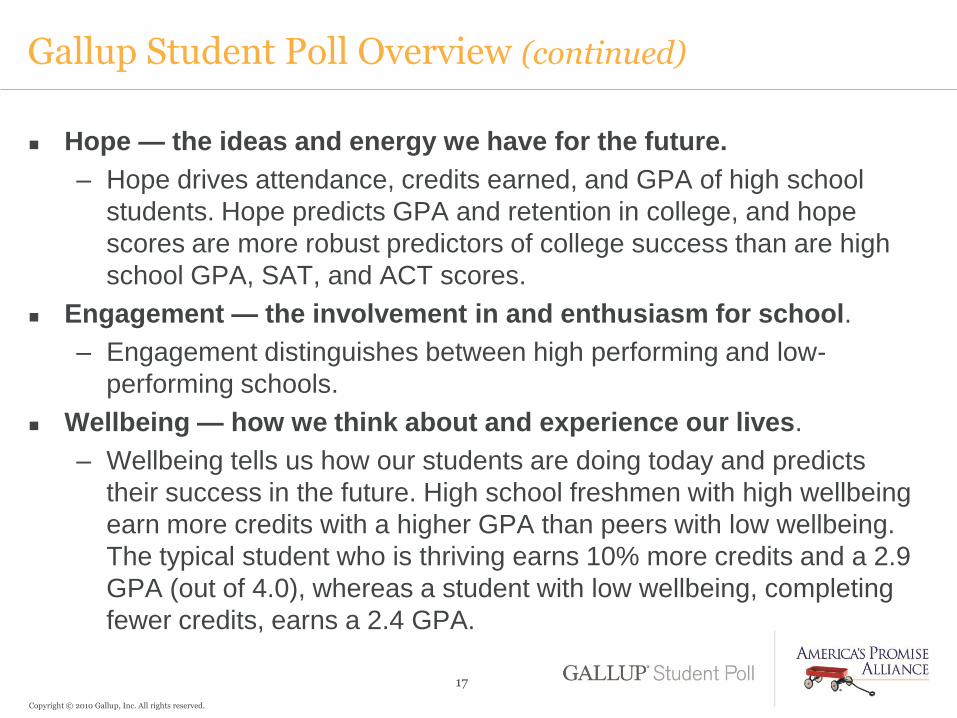
Gallup Student Poll Overview (continued)
Hope — the ideas and energy we have for the future.
– Hope drives attendance, credits earned, and GPA of high school
students. Hope predicts GPA and retention in college, and hope
scores are more robust predictors of college success than are high
school GPA, SAT, and ACT scores.
Engagement — the involvement in and enthusiasm for school.
– Engagement distinguishes between high performing and low-
performing schools.
Wellbeing — how we think about and experience our lives.
– Wellbeing tells us how our students are doing today and predicts
their success in the future. High school freshmen with high wellbeing
earn more credits with a higher GPA than peers with low wellbeing.
The typical student who is thriving earns 10% more credits and a 2.9
GPA (out of 4.0), whereas a student with low wellbeing, completing
fewer credits, earns a 2.4 GPA.
17
Copyright © 2010 Gallup, Inc. All rights reserved.

The 20 Elements of Hopeful, Engaged, and Thriving Students
Q01. On which step of the ladder would you say you personally feel you
stand at this time? On which step do you think you will stand about
five years from now?*
Q02. I know I will graduate from high school.
Q03. There is an adult in my life who cares about my future.
Q04. I can think of many ways to get good grades.
Q05. I energetically pursue my goals.
Q06. I can find lots of ways around any problem.
Q07. I know I will find a good job after I graduate.
Q08. I have a best friend at school.
Q09. I feel safe in this school.
Q10. My teachers make me feel my schoolwork is important.
*This is an abbreviated text of the Cantril Self-Anchoring Striving Scale. For full text, see slide 63.
18 Copyright © 2010 Gallup, Inc. All rights reserved.
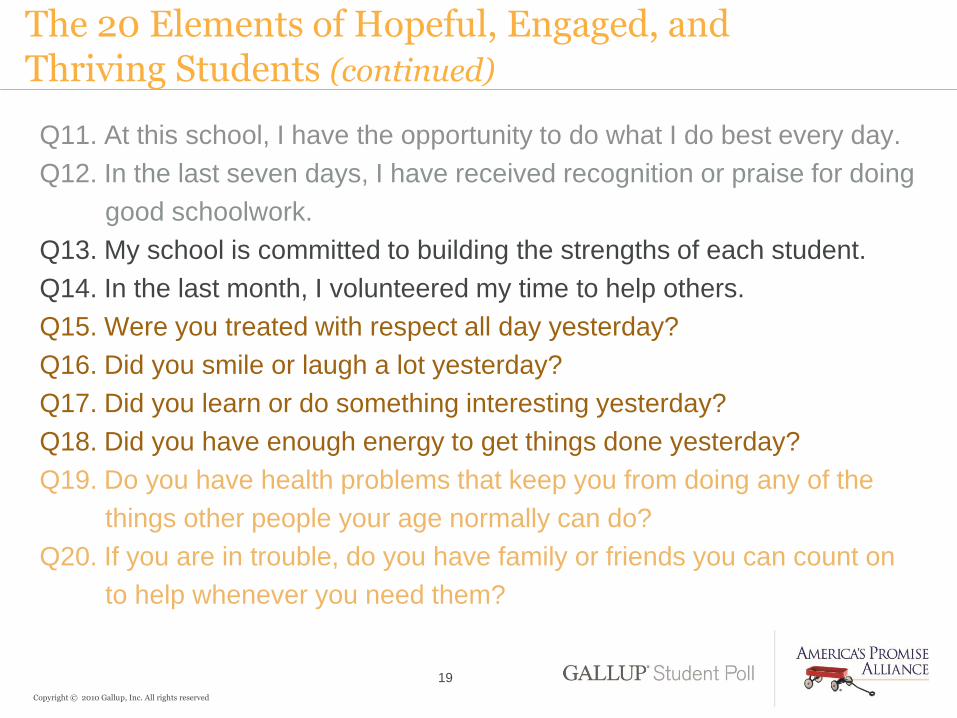
The 20 Elements of Hopeful, Engaged, and Thriving Students (continued)
Q11. At this school, I have the opportunity to do what I do best every day.
Q12. In the last seven days, I have received recognition or praise for doing
good schoolwork.
Q13. My school is committed to building the strengths of each student.
Q14. In the last month, I volunteered my time to help others.
Q15. Were you treated with respect all day yesterday?
Q16. Did you smile or laugh a lot yesterday?
Q17. Did you learn or do something interesting yesterday?
Q18. Did you have enough energy to get things done yesterday?
Q19. Do you have health problems that keep you from doing any of the
things other people your age normally can do?
Q20. If you are in trouble, do you have family or friends you can count on
to help whenever you need them?
19
Copyright © 2010 Gallup, Inc. All rights reserved

By using responses to the Hope items, Gallup can place students in three groups: Hopeful –These students have numerous ideas and abundant energy for the future. They
are skilled at goal-directed thinking and perceive they can navigate pathways to
achieve their goals. They are more likely to be engaged at school.
Stuck –These students have few ideas about the future and lack the requisite motivation
to achieve goals.
Discouraged –These students have few ideas and possess negative conceptualizations of the
future. They lack goal orientation and the skills needed to navigate pathways to
achieve their goals. They are more likely to be actively disengaged at school.
http://www.gallupstudentpoll.com/149936/
Gallup-Student-Success-Model.aspx

By using responses to the Engagement items, Gallup can place students in three groups: Engaged –These students are highly involved with and enthusiastic about school. They
contribute to the learning process and likely involve their peers in the learning
process as well. They are psychologically committed to school and have most
needs met by the learning environment.
Not Engaged –These students are present in the classroom, but they are not psychologically
connected to school or the learning process. These students have some but not
all needs met in the learning environment.
Actively Disengaged –These students are not involved with the learning process and may be
undermining that process for themselves and their peers. They are unhappy in
school and will share that unhappiness with others.
http://www.gallupstudentpoll.com/149936/
Gallup-Student-Success-Model.aspx

By using responses to the evaluative Wellbeing item, Gallup can place students in three groups: Thriving –These students have positive perceptions of their lives. They not only perceive their
present life as good, but they are likely to see the future as even better. These
students likely have their basic needs met. They tend to be in good health and have
strong social support. They are well-positioned for academic success and are more
likely to be engaged with school.
Struggling –These students with lower well-being do not have positive thoughts about their
present and future lives. They may lack basic needs and have weak social support.
Suffering –These students have negative perceptions of their lives. They lack adequate
personal and social resources and are more likely to be actively disengaged with
school.
Copyright ©
http://www.gallupstudentpoll.com/149936/
Gallup-Student-Success-Model.aspx

Copyright © 2010 Gallup, Inc. All rights reserved.
Gallup Student Poll
Gallup Student Poll (basic)
- free for all public schools and districts for grades 5-12
Enhancements available

Northern Kentucky
• Polly Lusk Page, Executive Director of the
Northern Kentucky Education Council

Enhanced Gallup Student Poll
• Northern Kentucky selected as national pilot
site by the Ready by 21 National Partnership
• The Northern Kentucky Education Council
serves as the lead agency for coordination
and administration of the two-year pilot
– In partnership with United Way of Greater
Cincinnati and Vision 2015

Enhanced Gallup Student Poll
• The Enhanced Poll allows communities to: – Administer the poll outside of school
– Track individual progress over time
– Opportunity to integrate with existing individual student data
• Tracks individual progress around a composite hope, engagement and wellbeing score called ―Ready for the Future‖. – Students who are Ready for the Future are hopeful
for the future, engaged at school and thriving in life

Enhanced Gallup Student Poll
• Included the 20 core items, an 11 item, Healthcare Access and Habits Index and demographics
• Administered in 49 schools representing 13 Northern Kentucky public school districts, one Cincinnati public high school and the Brighton Center
• A total of 21,239 students participated in the Poll
– 20,552 students in Northern Kentucky alone
– Students in grades 5 through 12 participated

Northern Kentucky Hope, Engagement, and
Wellbeing by School Level
School
Level
Total
n Hopeful Stuck
Discou-
raged Engaged
Not
Engaged
Actively
Dis-
engaged
Thriving Struggling Suffering
Elementary
School 1,441 52 31 17 73 18 9 69 29 2
Middle
School 9,669 55 30 15 59 26 15 71 28 1
High School 10,115 55 32 13 47 33 20 67 32 1
Note: Due to rounding, percentages may add up to 100% +1%

Northern Kentucky Hope, Engagement, and
Wellbeing by County
County Total
n Hopeful Stuck
Discou-
raged Engaged
Not
Engaged
Actively
Dis-
engaged
Thriving Struggling Suffering
Boone 5,281 56 30 14 57 28 15 71 28 1
Campbell 3,731 54 33 13 55 29 16 69 30 1
Gallatin 795 51 33 16 50 31 19 66 33 1
Grant 444 56 30 14 62 26 12 65 34 1
Hamilton 687 54 37 9 47 36 17 70 30 0
Kenton 9,060 55 31 14 53 29 18 68 31 1
Pendleton 1,227 52 32 16 53 29 18 67 32 1
30
Note: Due to rounding, percentages may add up to 100% +1%

Northern Kentucky Schools — Spring 2011
Item Means and Percentage of 5s by School Level Northern Kentucky
Schools Overall (n=20,552)
Elementary (n=1,441)
Middle (n=9,669)
High (n=10,115)
GM %5s GM %5s GM %5s GM %5s
Hope GrandMean 4.43 4.45 4.43 4.43
Engagement GrandMean 4.04 4.35 4.10 3.93
Graduate 4.82 89 4.74 82 4.80 87 4.86 92
Adult Cares 4.82 90 4.83 91 4.84 91 4.81 89
Get Good Grades 4.38 57 4.36 55 4.35 55 4.41 60
Pursue Goals 4.16 43 4.26 50 4.16 43 4.15 42
Ways Around Problem 3.93 34 3.77 32 3.88 32 4.00 35
Find a Good Job 4.40 60 4.60 73 4.48 64 4.30 54
Best Friend 4.64 81 4.77 87 4.73 85 4.50 74
Feel Safe 4.10 48 4.29 61 4.07 48 4.09 46
Schoolwork Important 4.09 46 4.49 70 4.19 52 3.94 37
Opportunity to Do Best 3.91 39 4.24 56 3.96 42 3.83 35
Recognition 3.43 31 3.91 43 3.51 33 3.28 26
Committed to Strengths* 3.89 39 4.42 65 4.05 45 3.67 29
Volunteered Time* 3.53 32 3.80 38 3.53 32 3.49 32
*Items not included in GrandMean or index calculations.

Northern Kentucky — Spring 2011
Healthcare Access and Habits Index Percentage of Yes
Responses
Doctor
Dentist
Safe Place
Health
Insurance
Personal
Doctor
%Yes %Yes %Yes %Yes %Yes
Overall 74 77 98 95 67
Boone 79 82 99 96 68
Campbell 73 78 98 95 65
Gallatin 63 68 97 92 68
Grant 64 80 99 96 71
Kenton 74 76 98 95 67
Pendleton 64 70 97 95 66
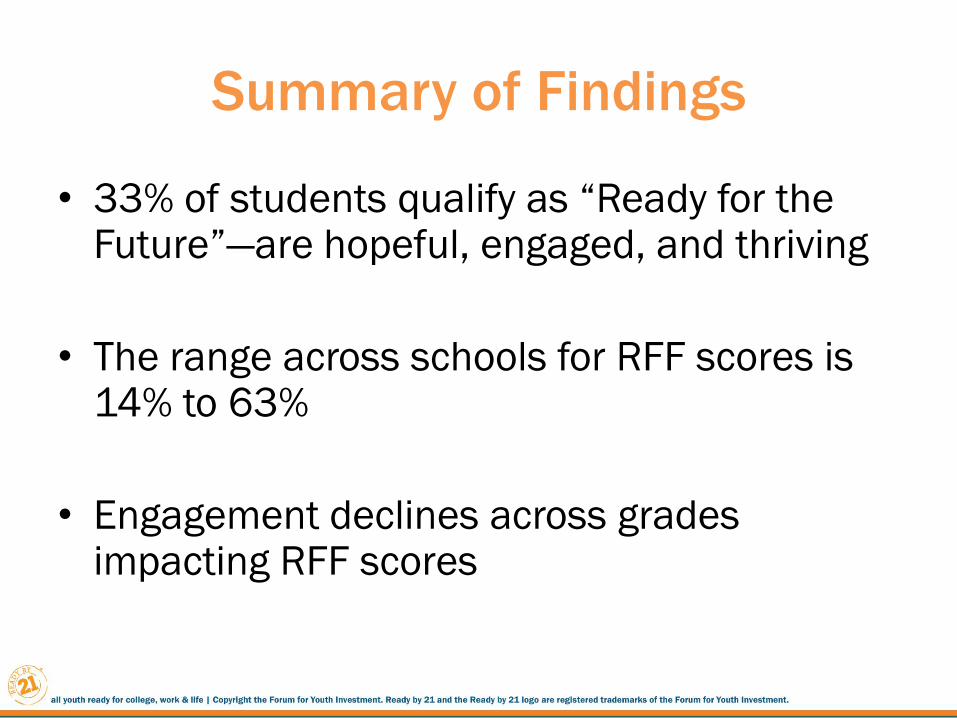
Summary of Findings
• 33% of students qualify as ―Ready for the Future‖—are hopeful, engaged, and thriving
• The range across schools for RFF scores is 14% to 63%
• Engagement declines across grades impacting RFF scores

How NKY School Districts Are Using
the Data
• Individual student goal setting
• Needs assessments at the school and district level
• Mentoring
• Individual Learning Plans (Grades 6-12)
• Counseling
• Increasing service learning opportunities
• Triangulating cognitive and noncognitive data for Response to Intervention

How NKY School Districts are
Triangulating the Data
• Gallup Enhanced Student Poll
• Academic Data
• Persistence to Graduation Tool
• TELL Teacher Surveys

Next Steps in NKY
• Conduct school district ―best practice‖
survey
• Create ―Northern Kentucky Promising
Practices‖ guide
• Provide training
• Finalize Program Landscape Map
• Administer Year 2

Questions and Discussion

Our Offerings
• Ready by 21 Webinars
– Email [email protected]
• Technical Assistance & our New Leader Network
– Readyby21.org
– Email [email protected]
• Field Services
– Email [email protected]

Next steps….
• Webinar Evaluation, please. Thank you!
• Ready by 21 Monthly Webinar
– December 13, 2011 at 3:00 PM (ET)
• Sign up for our newsletters
– Go to Forumfyi.org and sign up in the top right-hand
corner
• Sign up to take the Gallup Student Poll next fall
– gallupstudentpoll.com
– For more info on the GSPi, contact the Forum for
Youth Investment.
