webcast 1q09 br gaap
TRANSCRIPT

1
ALMIR GUILHERME BARBASSA CFO and Investor Relations Officer
May 13, 2009
Conference Call / WebcastRESULTS ANNOUCEMENT
1st Quarter 2009(Brazilian Corporate Law)
2
The presentation may contain forecasts about future events. Such forecasts merely reflect the expectations of the Company's management. Such terms as "anticipate", "believe", "expect", "forecast", "intend", "plan", "project", "seek", "should", along with similar or analogous expressions, are used to identify such forecasts. These predictions evidently involve risks and uncertainties, whether foreseen or not by the Company. Therefore, the future results of operations may differ from current expectations, and readers must not base their expectations exclusively on the information presented herein. The Company is not obliged to update the presentation/such forecasts in light of new information or future developments.
CAUTIONARY STATEMENT FOR US INVESTORS
The United States Securities and Exchange Commission permits oil and gas companies, in their filings with the SEC, to disclose only proved reserves that a company has demonstrated by actual production or conclusive formation tests to be economically and legally producible under existing economic and operating conditions. We use certain terms in this presentation, such as oil and gas resources, that the SEC’s guidelines strictly prohibit us from including in filings with the SEC.
DisclaimerDisclaimer

3
DOMESTIC OIL, NGL & NATURAL GAS PRODUCTION – 1Q09 VS 4Q08
Th
ou
s. b
pd
Oil and Natural Gas Average Domestic Production
Record for daily production of oil in Brazil (05.04.2009) 2,059,063 barrels
2,1952,261+3%
2,120
7%
1Q08 4Q08 1Q09
• 3% increase in production due to:
• production increase in platforms P-52 and P-54 (Roncador) ;
• start-up of P-51, in Marlim Sul, P-53, in Marlim Leste, and FPSO Cidade de Niterói, in Marlim Leste;
• Due to a decline in the domestic market demand, natural gas production decreased 6%. We currently have installed capacity to produce an additional 87 thousand boed of natural gas if the market demands.
1.816 1.865 1.952
304 330 309
Oil and NGL Natural Gas
3

4
NEW PRODUCTION SYSTEMS STATUS
P-51P-53 FPSO Cidade de Niterói
99
12
34
53
AVERAGE 1Q09
(thous. bpd)
9 producers (oil) e 1 producer (gas)
2 producers1st well: 33 kbpd
02/26/2009100FPSO Cidade de Niterói / /Marlim Leste
-
01/24/2009
11/30/2008
FIRST OIL
-
10 producers and 9 injectors
13 producers and 8 injectors
EXPECTED WELLS
-
2 producers e 2 injectors
6 producers
WELLS
460
180
180
CAPACITY
(thous. bpd)
Total
P-51 / Marlim Sul
P-53 / Marlim Leste
PLATFORM / FIELD

LARGE PROJECTS STARTING UP IN 2009
MANATIexpansão
5
PARQUE DAS CONCHAS
3Q09
2Q09
START-UP
35%
30%
PETROBRAS’ SHARE
100 thous. bpd
100 thous. bpd
CAPACITY
Parque das Conchas²
Frade¹
FIELD
FRADE
FPSO FradeFPSO Espírito Santo
¹ Operated by Chevron² Operated by Shell

LDA: 2.200m
FPSO BW Cidade de São Vicente
6
PHASE 2POÇO P1
6 MONTHS
PHASE 1POÇO 3-RJS-646
6 MONTHS
PHASE 3POÇO 3-RJS-646
3 MONTHS
DRILL WELL P1
Challenges:
•Special coating for well and flexible risers to support aggressive fluid and high pressure;
•Supplementary recovery with alternating water and gas injection*;
•Reinjection of CO2 associated with the fluids produced in the reservoir*;
•Wet Christmas trees at water depths never used in Brazil*;
•High resolution seismic acquisition in some areas to identify reservoirs;
•Completion of wells in an environment with high pressure;
(*) expected for the Pilot Project in 2010
Extended Well Test:•Capacity: 30,000 bpd
•Duration: 15 months
•API: 28-30o
Main information to be collected during the EWT:
• long-term behavior of producing reservoir;
• fluids flowage and drainage during production;
• subsea outflow;
• geometry of final wells.
CHALLENGES AND GOALS: TUPI DEVELOPMENT
LINERELOCATION
6
77
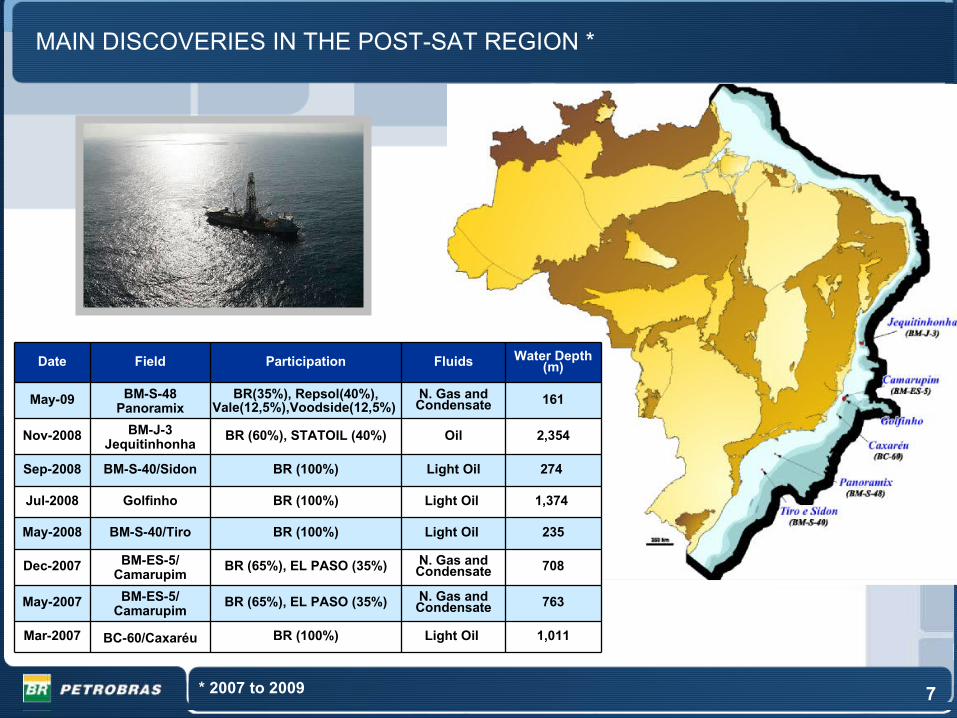
MAIN DISCOVERIES IN THE POST-SAT REGION *
* 2007 to 2009
161N. Gas andCondensate
BR(35%), Repsol(40%),Vale(12,5%),Voodside(12,5%)
BM-S-48Panoramix
May-09
1,011
763
708
235
1,374
274
2,354
Water Depth (m)
Light Oil
N. Gas andCondensate
N. Gas and Condensate
Light Oil
Light Oil
Light Oil
Oil
Fluids
BR (100%)
BR (65%), EL PASO (35%)
BR (65%), EL PASO (35%)
BR (100%)
BR (100%)
BR (100%)
BR (60%), STATOIL (40%)
Participation
BC-60/CaxaréuMar-2007
BM-ES-5/Camarupim
May-2007
BM-ES-5/Camarupim
Dec-2007
BM-S-40/TiroMay-2008
GolfinhoJul-2008
BM-S-40/SidonSep-2008
BM-J-3Jequitinhonha
Nov-2008
FieldDate
8
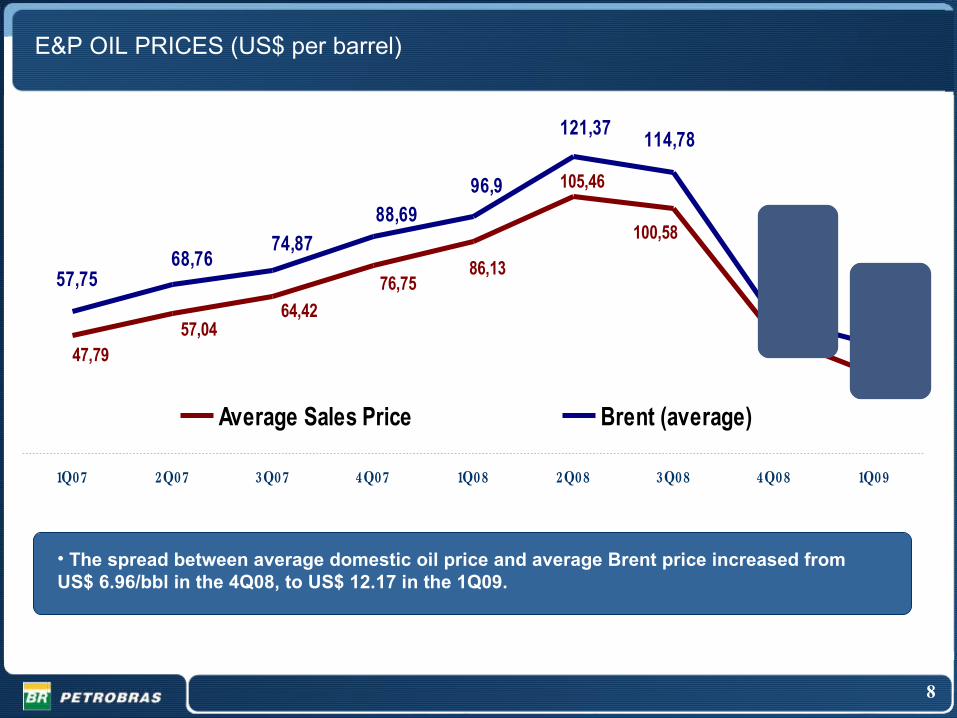
E&P OIL PRICES (US$ per barrel)
47,7957,04
64,42
76,7586,13
105,46
100,58
47,95
32,23
44,40
54,91
114,78121,37
96,9
88,69
74,8768,76
57,75
1 07Q 2 07Q 3 07Q 4 07Q 1 08Q 2 08Q 3 08Q 4 08Q 1 09Q
Average Sales Price Brent (average)
Average 4Q08
Average 1Q09
• The spread between average domestic oil price and average Brent price increased from US$ 6.96/bbl in the 4Q08, to US$ 12.17 in the 1Q09.

9
LIFTING COST IN BRAZIL
15.16 16.34 17.61 19.09 17.91
28.0434.80 36.79
22.3916.33
0
10
20
30
40
50
60
70
80
1Q08 2Q08 3Q08 4Q08 1Q09
Lifting Cost (R$) Govr. Take (R$)
8.66 9.88 10.21 8.24 7.82
16.1621.20 20.06
9.87 6.87
96.90
121.37114.78
44.4054.91
0
10
20
30
40
50
60
70
80
1Q08 2Q08 3Q08 4Q08 1Q09
0
20
40
60
80
100
120
140
Lifting Cost (US$) Govr. Take (US$) Brent
US$/barrel R$/barrel
24.8231.08 30.27
18.11
43.2051.14
54.40
41.48
14.69
34.24
• Lifting cost without government take, both in Reais and in Dollar, have been decreasing, following international oil prices;
• 3 new units launched recently ( producing 25% of the capacity) contributed to increase this cost, besides reduction of 6% of natural gas production.
10
0
20
40
60
80
100
120
140
160
Dec-06 Mar-07 Jun-07 Sep-07 Dec-07 Mar-08 Jun-08 Sep-08 Dec-08 Mar-09
ARP EUA ARP Petrobras
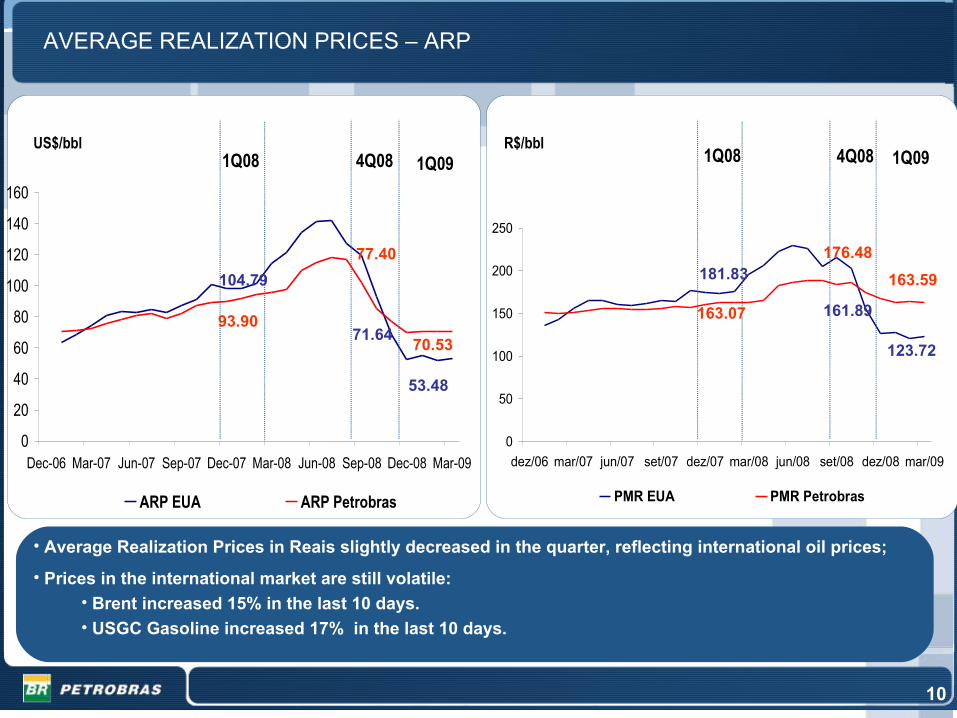
AVERAGE REALIZATION PRICES – ARP
10
US$/bbl R$/bbl
0
50
100
150
200
250
dez/06 mar/07 jun/07 set/07 dez/07 mar/08 jun/08 set/08 dez/08 mar/09
PMR EUA PMR Petrobras
71.64
161.89
77.40 176.48
163.59
123.7270.53
53.48
4Q08 1Q09 4Q08 1Q091Q081Q08
104.79
93.90
181.83
163.07
• Average Realization Prices in Reais slightly decreased in the quarter, reflecting international oil prices;
• Prices in the international market are still volatile:• Brent increased 15% in the last 10 days.• USGC Gasoline increased 17% in the last 10 days.

11
IMPORTAÇÃO E EXPORTAÇÃO DE PETRÓLEO E DERIVADOS
6% decrease in diesel sales volume due to:
Reduced sales to thermo plants;
Increase of the percentage of biodiesel (2% to 3%);
Decrease in industrial production.
2% increase in gasoline sales, due to the expressive increase in the vehicles fleet.
29% decrease in natural gas sales volume due to:
Reduction of the non-thermal market consumption (economic slowdown / FO substitution);
Decrease in thermal demand (reservoirs at a higher level in the Southeast region).
SALES VOLUME IN THE DOMESTIC MARKET – OIL PRODUCTS AND NATURAL GAS
* Others: Coke, Asphalt, Propene, Lubricants, other liquefied gases and other oil products. Biggest decrease when compared to the 1Q08 was lubricants and other gases and oil products.
Th
ou
s. b
arre
ls/d
ay
215302
1T08 1T09
1,6091,703 -6%
-29%
Th
ou
san
d b
oe
d
Oil ProductsNatural Gas
297 303
198 195
167 152
75 76
166128
658702
9798
1T08 1T09
Others*Fuel OilJet FuelNaphthaLPGGasolineDiesel

12
Th
ou
s. b
pd
IMPORTAÇÃO E EXPORTAÇÃO DE PETRÓLEO E DERIVADOS
314 352
259228
Exports Imports Net Imports
573 580
(7)
451 426
215
140
Exports Imports Net Exports
666
566
100
Financial Deficit 1Q08US$ 775 Million
Financial Deficit 1Q09US$ 150 Million
OIL AND OIL PRODUCTS IMPORTS AND EXPORTS
Oil Oil Products
Positive net exports driven by the increase in domestic production;
Financial deficit resulting from the light x heavy spread between exported products (heavy) and imported products (light);
Investments in refining to maximize the processing of national oil and capture this margin.

13
OPERATING INCOME CHANGE – R$ MILLION – 1Q09 VS 4Q08
1,9523,257
11,801
4,703 (9,541)
10,220
• Lower Net Operating Revenues, due to decrease in sales volume and lower prices;
• Decrease in COGS reflects lower costs with oil and oil products imports and the decrease in the government participation;
• Reduction in Operating Expenses due to the absence of impairment and adjustments in inventories, which occurred in the 4Q08;
• Decrease in recurring items in Sales expenses (freight reduction) and in General and Administrative expenses (decrease in expenditures with consultancies and data processing).
4T08Operating Income Revenues COGS
Operating Expenses
1Q09Operating Income

14
6,189
735
5,517 (3,254)
(1,081)(2,290)
5,816
4Q08Net Income
1Q09Net Income
Financial Result
Taxes
• Decrease in financial result due to FX losses in the 1Q09 (-R$ 298) in comparison with the gain in the 4Q08 (R$ 2.258); and absence of gain with hedge , which occurred in the 4Q08 (R$ 620);
• Equity Income was impacted by the provision for the acquisition of Pasadena refinery (R$ 341);
• Higher income tax payment due to the absence of fiscal benefit for the provision of Interest on Own Capital, as occurred in the 4Q08, and higher operating income;
• Increase in Minority Interest due to the negative result of SPCs in the 4Q08, due to the FX effect on debts.
Equity Income
Operating Income
NET INCOME CHANGE – R$ MILLION – 1Q09 VS 4Q08
Minority Interest

15
EXPLORATION AND PRODUCTION – CHANGE IN OPERATING INCOME (R$ MILLION – 1Q09 VS 4Q08)
4Q08Oper. Profit
Price Effect on revenues
Volume Effect on revenues
Operational Expenses
1Q09Oper. Profit
Cost Effecton average
COGS
15
• Decrease in domestic oil price (from US$ 47 in 4Q08 to US$ 32 in 1Q09);
• Reduction of volumes sold is explained by an increase in oil inventory;
• Lower lifting cost and government take contributed to a decrease in COGS;
• Lower operational expenses due to impairment in the 4Q08.
7,818 5,839
1,675 1,909
889591 3,693
Volume Effecton COGS

16
SUPPLY - CHANGE IN OPERATING INCOME (R$ MILLION – 1Q09 VS 4Q08)
16
• Maintenance of diesel and gasoline prices policy kept average realization prices relatively stable in an environment of reduced oil prices;
• COGS reduction were explained by lower inventory retention costs and lower oil acquisition prices;
• Net effect of lower sales volume had an minimal impact on supply result;
(1,397) 3,827
2.652
11,925
2,555 511 7,115
4Q08Oper. Loss
Price Effect on revenues
Volume Effect on revenues
Operational Expenses
1Q09Oper. Profit
Cost Effecton average
COGS
Volume Effecton COGS

1717
• Improved operating result due to a reduction in the acquisition cost of power and lower natural gas import price;
• Partially offset by the reduction in volumes sold.
• Growing production in Nigeria (Agbami and Akpo);
• Lower exploratory costs;
• Absence of impairment and lower provision for devaluation of inventories than in 4Q08.
Operating Result:1Q09
(R$ 99 milion)4Q08
(R$ 235 million)VS.
Operating Result:1Q09
R$ 25 million4Q08
(R$ 2,243 million)VS.
Operating Result:1Q09
R$ 386 million4Q08
R$ 379 millionVS.
GAS & ENERGY, INTERNATIONAL and DISTRIBUTION (1Q09 VS 4Q08)G
as
& E
ne
rgy
Inte
rna
tio
na
lD
istr
ibu
tio
n
• Lower margins due to lower prices;
• Partially offset by a decrease in SG&A expenses;
• Increase in market share.

18
INVESTIMENTS BY BUSINESS AREA
Supply
E&P
Gas & Energy
International
Corporate
Distribution
Others
13,423 14,183
1Q09 1Q08
EBITDA (R$ million)
Increase in the Company’s investments
supported by a strong cash generation
Investments in 1Q09 – R$ 14.4 billion
2.2
3.0
0.1 0.4
7.3
0.4
1.0 1.3
1.2 5.1
0,3
2.0
Investments in 1Q08 – R$ 10.2 billion
0,10.2

19
R$ million 03/31/2009 * 12/31/2008*
Short Term Debt 15.609 13.859Long Term Debt 54.698 50.854
Total Debt 70.307 64.713
Cash and Cash Equivalents 19.532 15.889
Short Term Debt 50.775 48.824
Capital Structure 49% 50%
LEVERAGE
US$ million 03/31/2009 * 12/31/2008*
Total Debt 30.368 27.691
*After adjustments of Law 11.638/07(1) Total Debt- cash
• Increase of our debt level to meet our investment needs.
• Global Notes due 2019: US$ 1.5 billion issued in February 2009.
• Increasing debt but keeping the strength of credit ratios .
¹ The short term debt includes the long term debt amortization schedule for the next year.