… · web viewnow gis could become far more collaborative through crowdsourcing. crowdsourcing...
TRANSCRIPT
Teaching resources
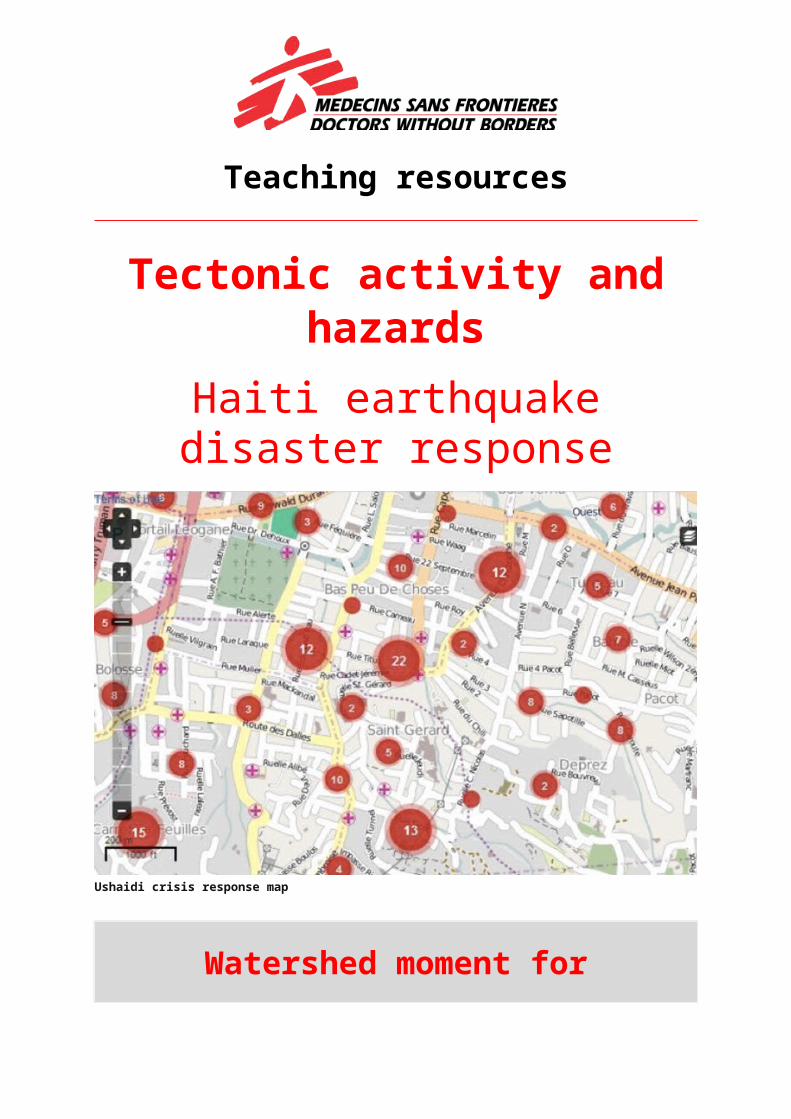
Tectonic activity and hazardsHaiti earthquake disaster
response
Ushaidi crisis response map
Watershed moment for
crowd-sourced disaster response
Teaching resources: Tectonic activity and hazards
Putting the world’s most vulnerable communities on the map
How do you get a map where there was none? How can the humanitarian medical organisation Médecins Sans Frontières / Doctors Without Borders (MSF) map and process large amounts of relevant information from the ground immediately to guide its disaster response?
The Haiti 2010 earthquake response changed disaster management models, drawing on new technologies and collaborating with an online disaster community.
The 2010 Haiti earthquake was a terrible disaster, but without technological and sociological advances such as cell phones and volunteer mappers, the disaster would likely have been far worse. This session will trace the journey from non-existent or incomplete maps to GIS (Geographic Information System), crowdsourcing and the Missing Maps collaboration.
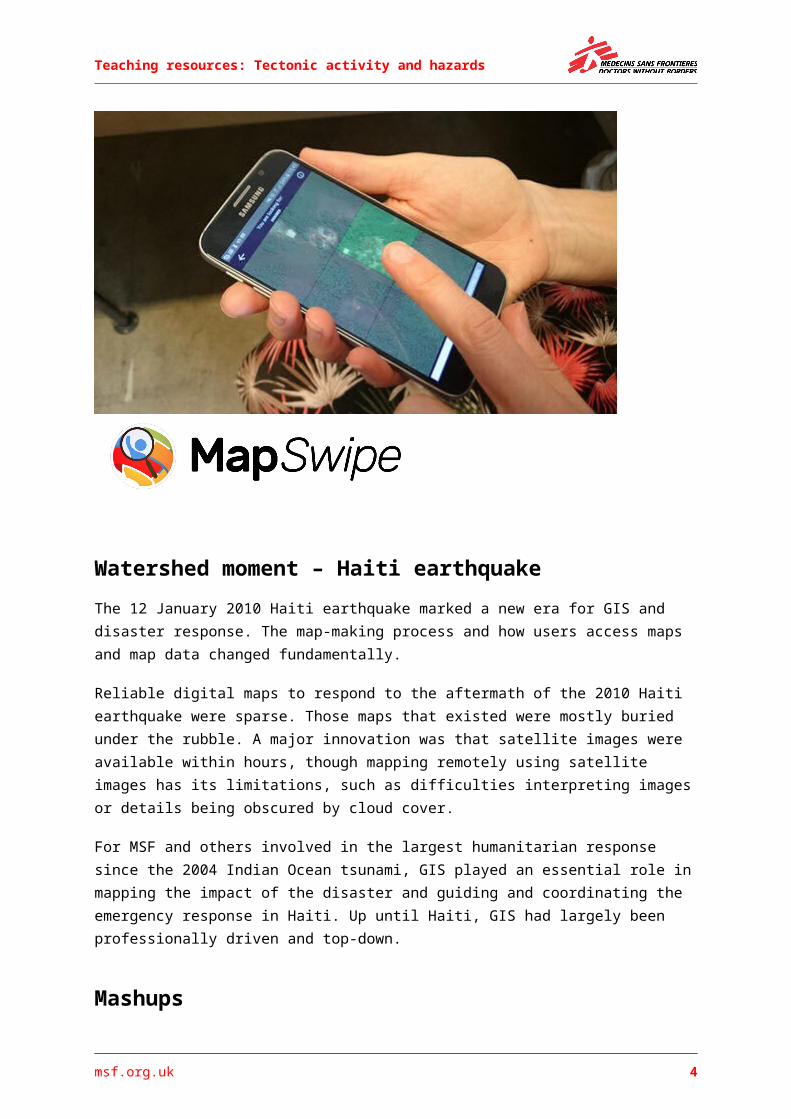
It starts at the end with the latest app and ends with hand-drawn maps. Watch the video on MapSwipe: MapSwipe/Mapping the world a swipe at a time: https://www.youtube.com/watch?v=mwRdtnfFcUw
msf.org.uk 2
Teaching resources: Tectonic activity and hazards
Watershed moment – Haiti earthquake The 12 January 2010 Haiti earthquake marked a new era for GIS and disaster response. The map-making process and how users access maps and map data changed fundamentally.
Reliable digital maps to respond to the aftermath of the 2010 Haiti earthquake were sparse. Those maps that existed were mostly buried under the rubble. A major innovation was that satellite images were available within hours, though mapping remotely using satellite images has its limitations, such as difficulties interpreting images or details being obscured by cloud cover.
For MSF and others involved in the largest humanitarian response since the 2004 Indian Ocean tsunami, GIS played an essential role in mapping the impact of the disaster and guiding and coordinating the emergency response in Haiti. Up until Haiti, GIS had largely been professionally driven and top-down.
MashupsPrior to the earthquake, there were a number of significant advances in technology. Massively distributed and hyperlinked datasets, mashups and opensource tools significantly augmented the mapping process. Mashups mix hybrid web applications from multiple sources, combining satellite imagery with maps and geospatial data to provide local data.
CrowdsourcingNow GIS could become far more collaborative through crowdsourcing. Crowdsourcing is a way of gathering information through a global digital network and can include people locally and remotely. Anyone with a connected device anywhere in the world can contribute useful and timely geographic knowledge. In this way, users were able to play a role in redefining GIS.
Real-timeIn Haiti, the crowdsourced online disaster community was larger, more democratic and more far-reaching than ever before. Its ability to report and map was much faster than ever before.
While it is usual for sensational emergencies such as the Haiti earthquake to draw in scores of volunteers alongside the international news coverage, the rate of database content generated with their help was new.
msf.org.uk 3
Teaching resources: Tectonic activity and hazards
Some cell towers remained intact after the earthquake and others were restored within days, so people could use cell phones to send in large volumes of text messages, tweets and photos in real time.
Popular networking sites such as Facebook, Twitter and Google – the social media most commonly used for connecting with friends, relatives and employees – informed people around the world about the earthquake and helped those affected by it to build resilience and reduce vulnerability in real time.
Relief agencies were not used to these tools being used in these ways, so how did they process the large amount of relevant information from the ground as fast as possible and without being overwhelmed?
SMS gatewayThe online communication and micro-blogging site Twitter played a particularly large role, as it could efficiently relay disaster-related information. A cell phone messaging system, an SMS gateway, with a standard number – 4636 – was sourced from Digicel within 48 hours to channel information. It was short code such as the 999 number we use to access police, ambulance or fire.
The number and its purpose were spread through all available media channels and word of mouth. In terms of privacy and protection concerns of the personal identifiers made public on the map, those sending information in the messages knew how content would be used, so their consent was implied.
UshahidiPatrick Meier started a project that crowdsourced translation and geo-location of incoming text messages onto the Ushahidi platform. An Ushahidi colleague customised a web-based interface using the free and open source mapping technology from Africa.
Meier recruited the help of mostly expatriate Haitian translators as well as mapping volunteers at Tufts University in the US. Remote volunteers mapped the locations of reported victims and filled in the maps. Local volunteers added details, such as health facilities, to the maps.
msf.org.uk 4
Teaching resources: Tectonic activity and hazards
Around 80,000 SMS messages were processed and triaged in the days, weeks and months following the earthquake.
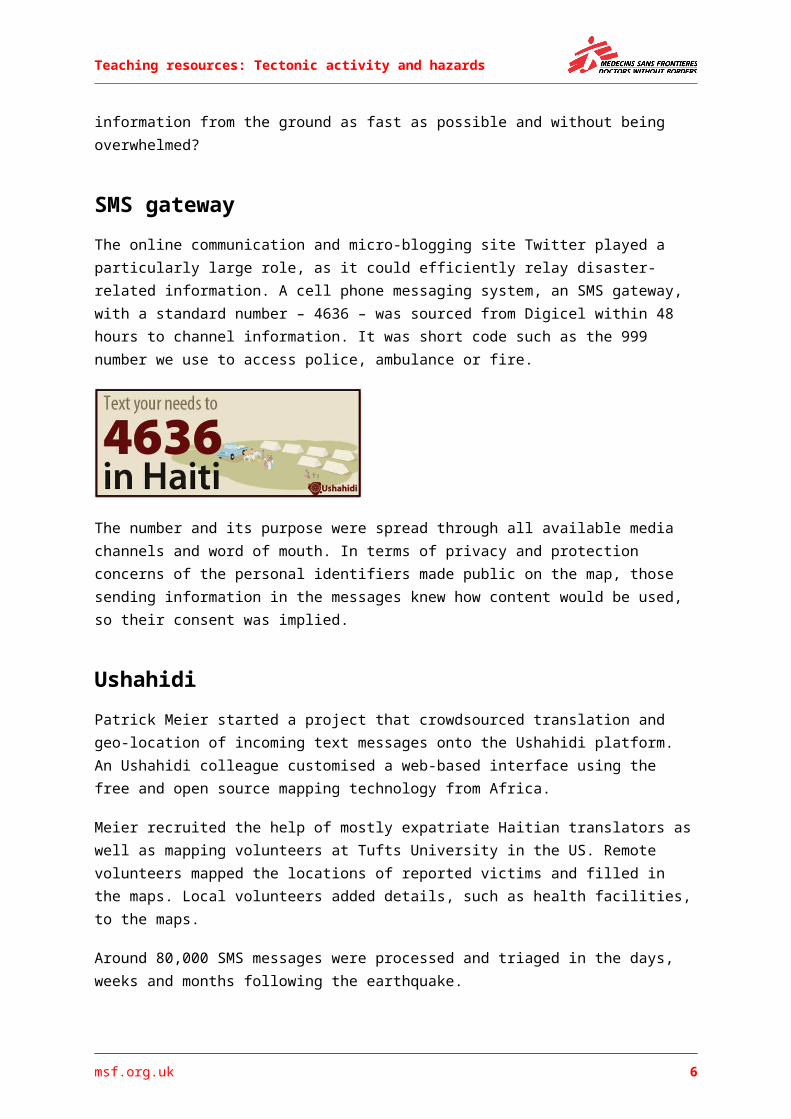
Ushahidi Haiti Crisis MapThe Ushahidi Haiti Crisis Map guided MSF and others to the areas with the most damage and the most people affected. Here are some of the most urgent life-and-death messages mapped on the Ushahidi website.
OpenStreetMap (OSM)
msf.org.uk 5
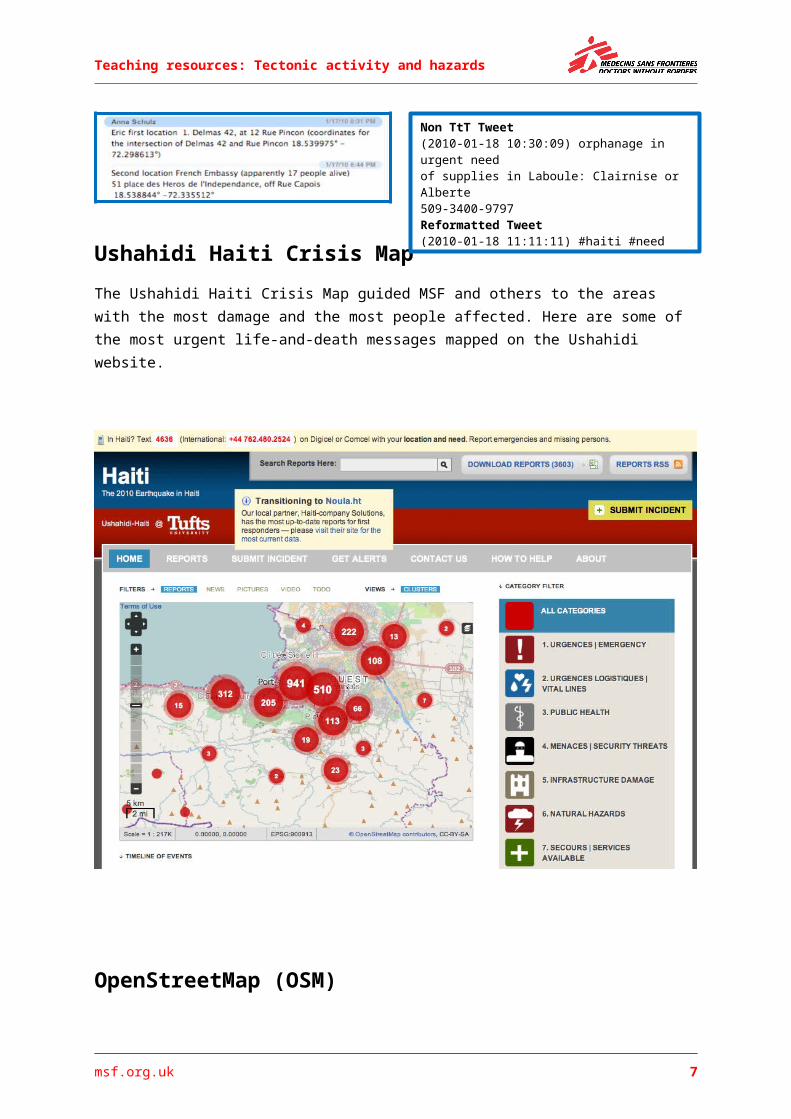
Non TtT Tweet(2010-01-18 10:30:09) orphanage in urgent need of supplies in Laboule: Clairnise or Alberte509-3400-9797Reformatted Tweet(2010-01-18 11:11:11) #haiti #need supplies#name orphanage #loc Laboule #contact clairnise orAlberte 509.3400.9797 #rescuemehaiti
Teaching resources: Tectonic activity and hazards
At the same time, the online mapping collective OSM, a free and editable world map (found at www.openstreetmap.org), played a more central and pivotal role than in any previous disaster response, overcoming resistance from some members of the voluntary and technical community and gaining a new level of credibility.
Participatory mapping in Haiti marked a shift from content created by organisations or companies in a
centralised, top-down way, to content uploaded by interested members of the public. The OSM community consists of crowdsourced project volunteer mappers who resemble users on sites such as YouTube or Flickr in that they add content through interaction, blogs, tagging and content aggregation.
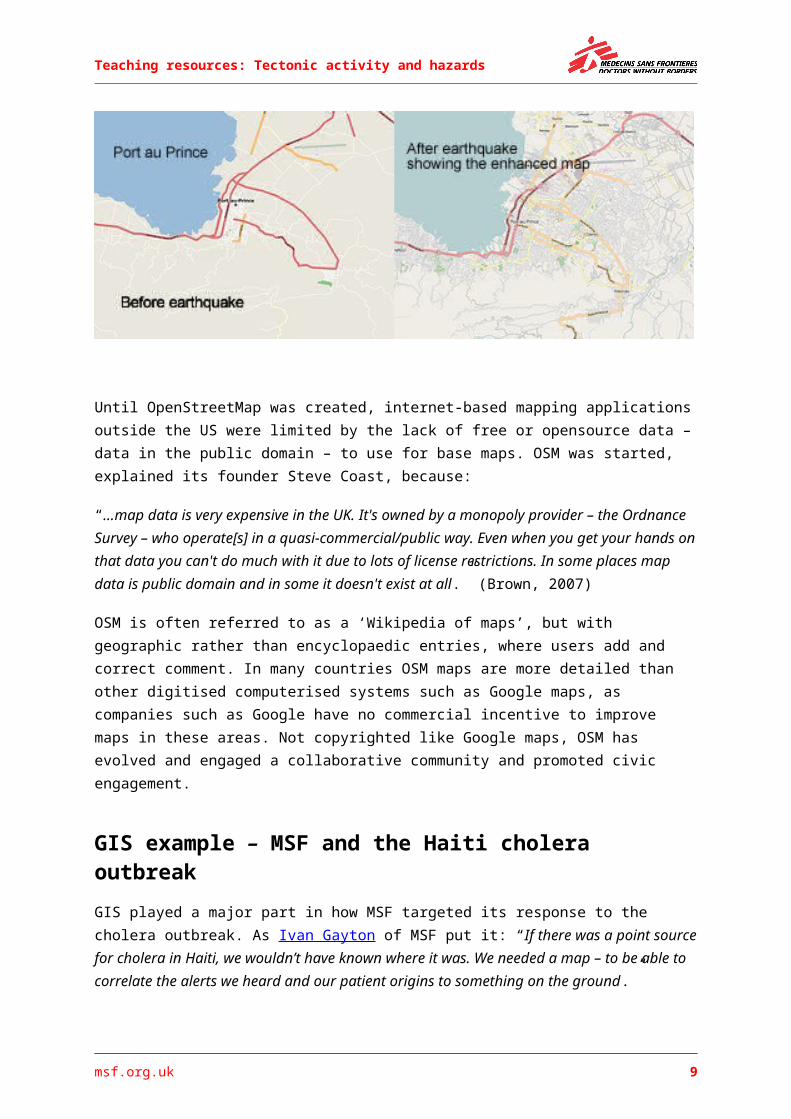
Within minutes of the earthquake, the OSM community, the Humanitarian OSM team (HOT) and local citizens and relief workers started creating a digital street map of Port-au-Prince and other areas affected by the earthquake by enhancing base data that was already available.
To an unprecedented extent and at a speed never known before, crisis mappers filled in information on neighbourhoods and sub-neighbourhoods at the granular level through easy-to-use interfaces. Those on the ground could add attributes such as road conditions, locations of camps for displaced people and damage to buildings.
The database provided the de-facto base maps for major relief agencies such as MSF.
Until OpenStreetMap was created, internet-based mapping applications outside the US were limited by the lack of free or opensource data – data in the public
msf.org.uk 6
Teaching resources: Tectonic activity and hazards
domain – to use for base maps. OSM was started, explained its founder Steve Coast, because:
“…map data is very expensive in the UK. It's owned by a monopoly provider – the Ordnance Survey – who operate[s] in a quasi-commercial/public way. Even when you get your hands on that data you can't do much with it due to lots of license restrictions. In some places map data is public domain and in some it doesn't exist at all.” (Brown, 2007)
OSM is often referred to as a ‘Wikipedia of maps’, but with geographic rather than encyclopaedic entries, where users add and correct comment. In many countries OSM maps are more detailed than other digitised computerised systems such as Google maps, as companies such as Google have no commercial incentive to improve maps in these areas. Not copyrighted like Google maps, OSM has evolved and engaged a collaborative community and promoted civic engagement.
GIS example – MSF and the Haiti cholera outbreak GIS played a major part in how MSF targeted its response to the cholera outbreak. As Ivan Gayton of MSF put it: “If there was a point source for cholera in Haiti, we wouldn’t have known where it was. We needed a map – to be able to correlate the alerts we heard and our patient origins to something on the ground.”
GIS maps can pinpoint the location a patient comes from as quickly and as accurately as possible by answering:
What? Case definition
Who? Person
When? Time
Where? Place
How many? Measures of occurrence
This information is essential as it helps identify the people with whom a patient has been in contact and enables health workers to provide people living in the neighbourhood with essential information about how to protect themselves from an infection passed from human to human.
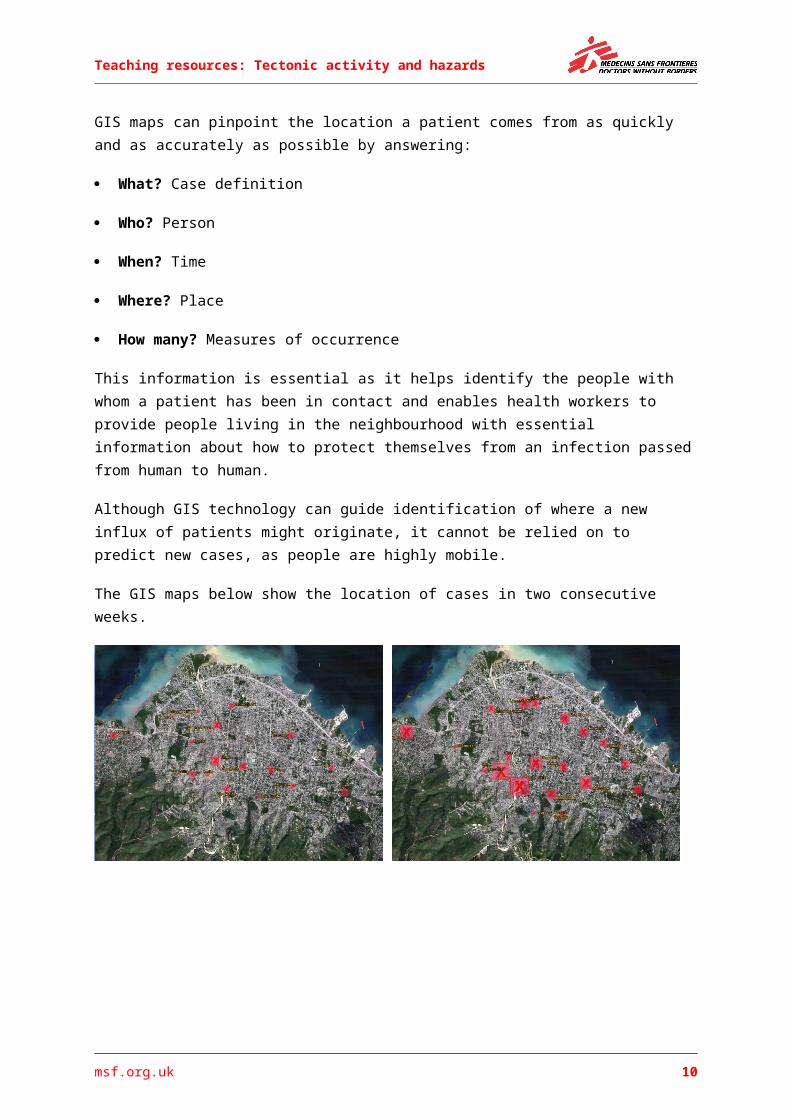
Although GIS technology can guide identification of where a new influx of patients might originate, it cannot be relied on to predict new cases, as people are highly mobile.
The GIS maps below show the location of cases in two consecutive weeks.
msf.org.uk 7
Teaching resources: Tectonic activity and hazards
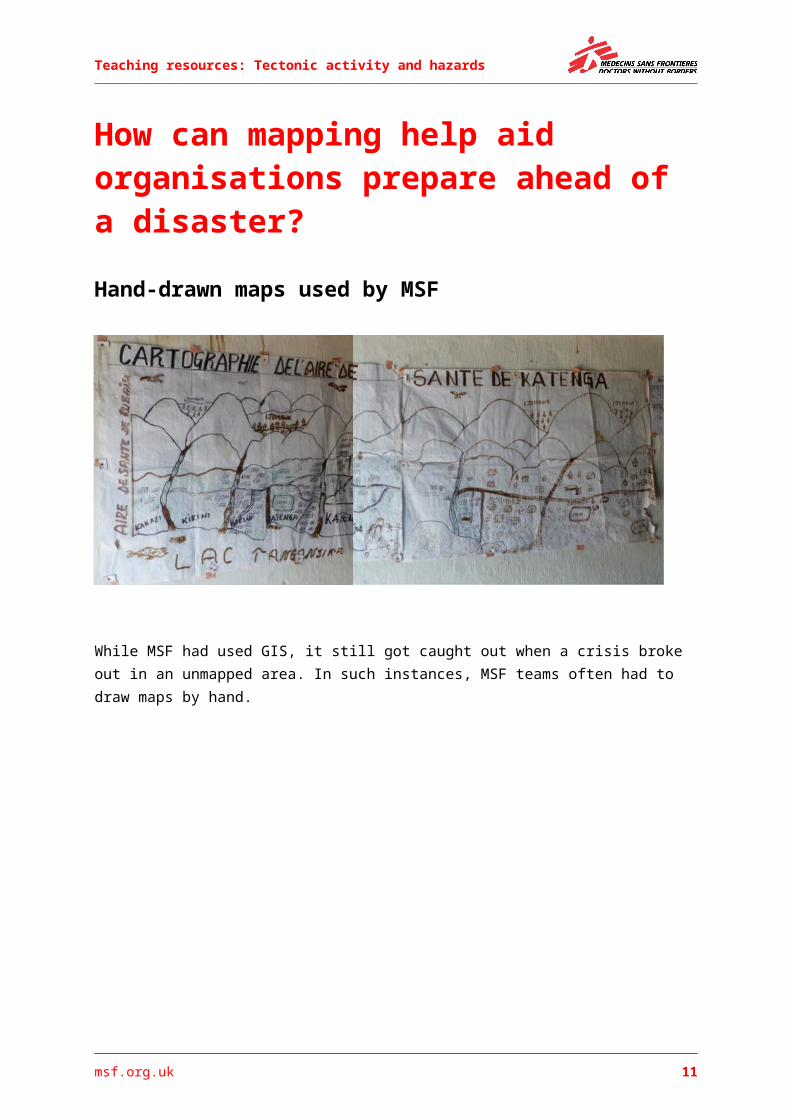
How can mapping help aid organisations prepare ahead of a disaster?
Hand-drawn maps used by MSF
While MSF had used GIS, it still got caught out when a crisis broke out in an unmapped area. In such instances, MSF teams often had to draw maps by hand.
msf.org.uk 8
Teaching resources: Tectonic activity and hazards
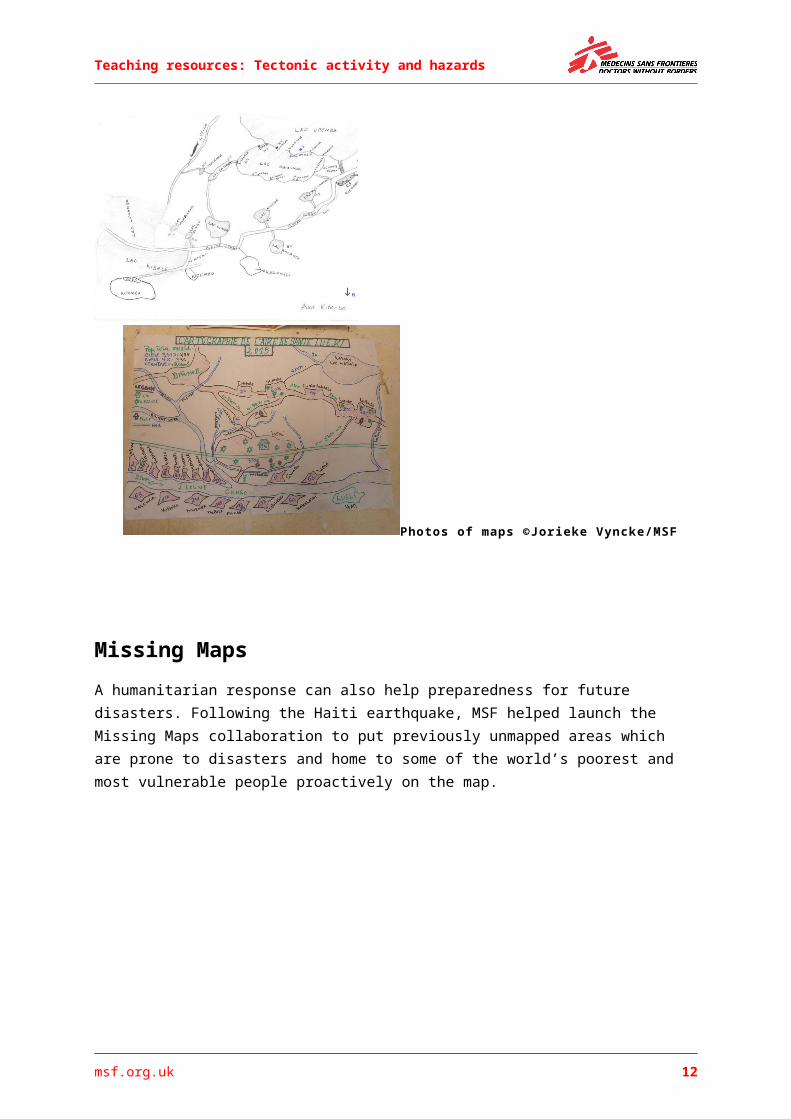
Photos of maps ©Jorieke Vyncke/MSF
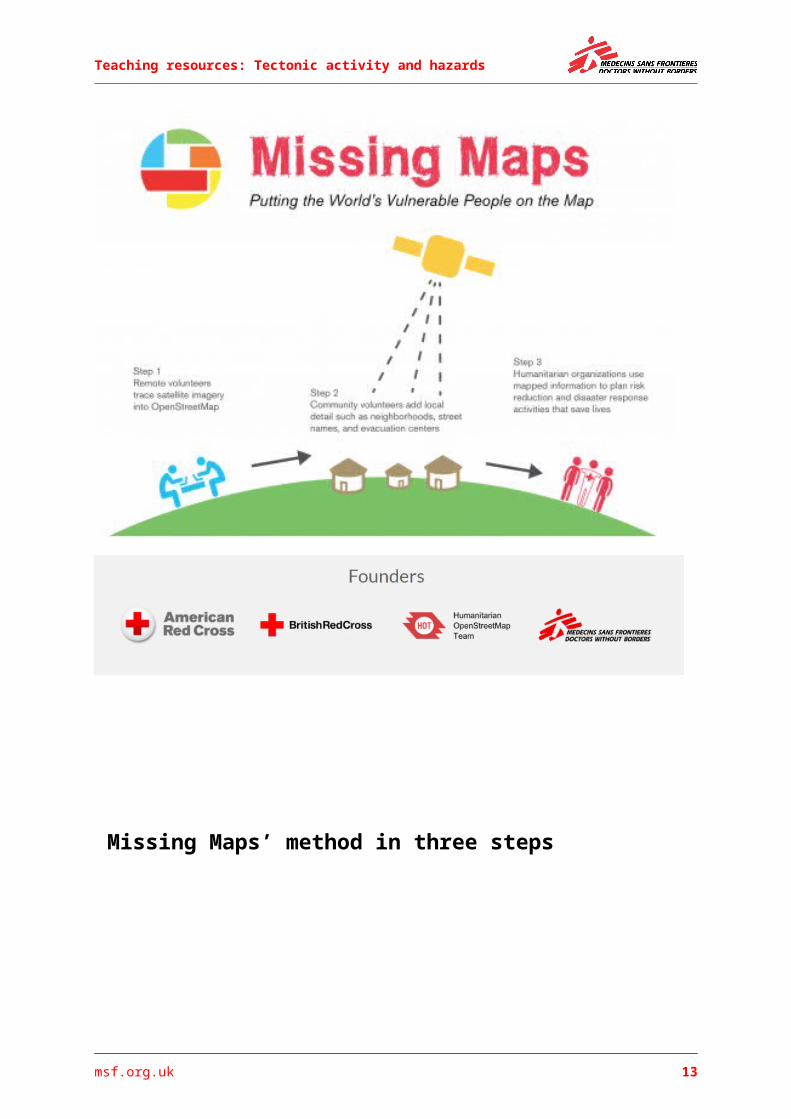
Missing MapsA humanitarian response can also help preparedness for future disasters. Following the Haiti earthquake, MSF helped launch the Missing Maps collaboration to put previously unmapped areas which are prone to disasters and home to some of the world’s poorest and most vulnerable people proactively on the map.
msf.org.uk 9
Teaching resources: Tectonic activity and hazards
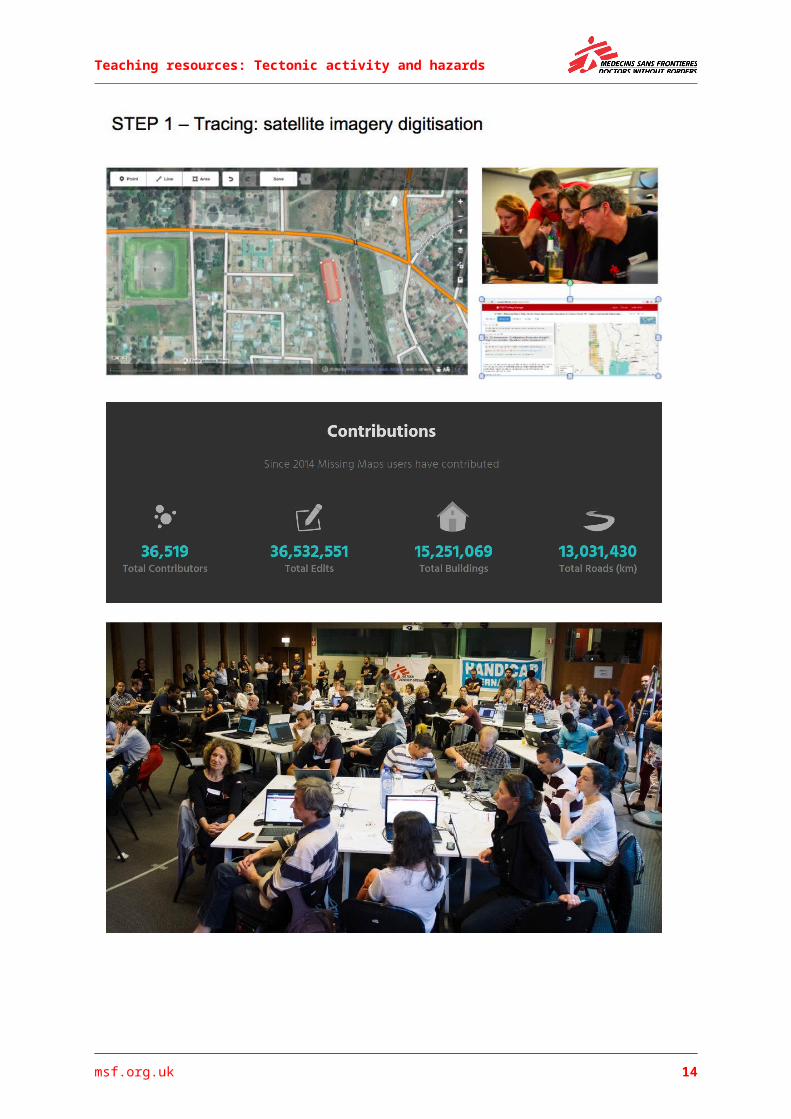
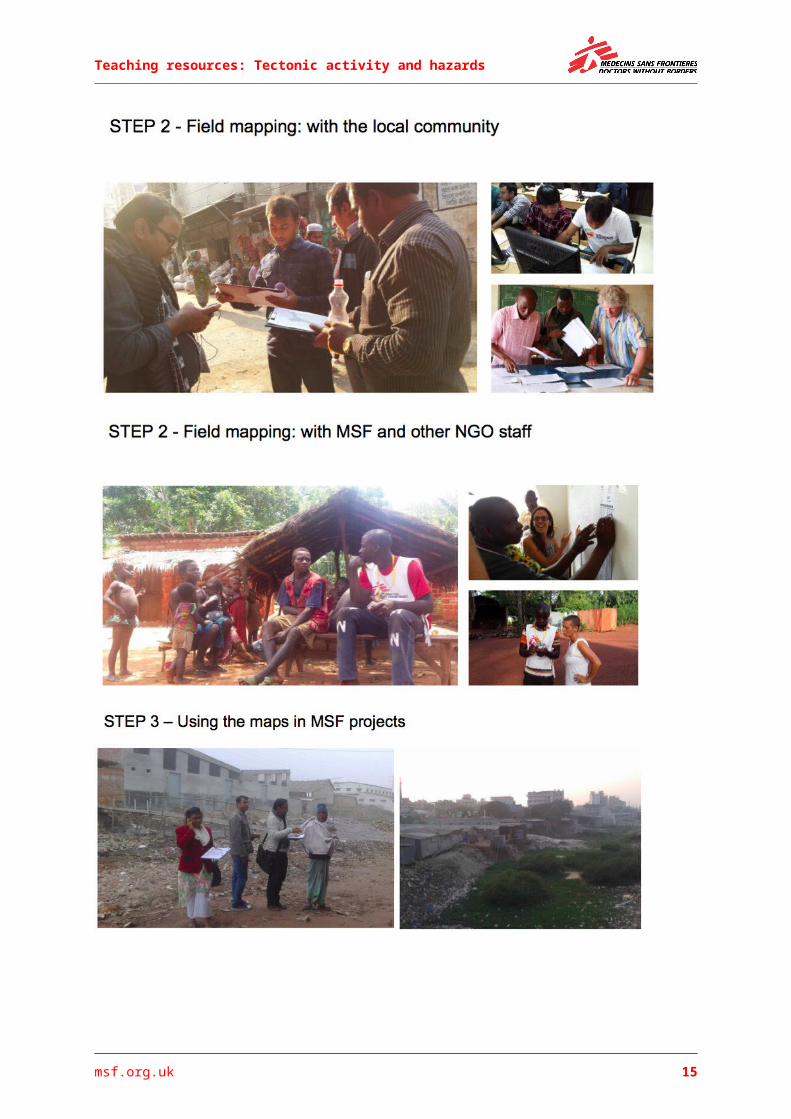
Missing Maps’ method in three steps
msf.org.uk 10
Teaching resources: Tectonic activity and hazards
msf.org.uk 11
Teaching resources: Tectonic activity and hazards
msf.org.uk 12
Teaching resources: Tectonic activity and hazards
Possible activities A year of edits video: https://www.theguardian.com/cities/2014/oct/06/missing-maps-human-genome-project-unmapped-cities
Maps Save Lives video: https://www.youtube.com/watch?v=XxW_e9o0lA
GIS mapping exercise: http://www.esriuk.com/~/media/esri-uk/Schools/3Earthquakes%20volcanoes%20and%20plate%20tectonics%20in%20ArcGIS%20Online.pdf?la=en
Creative piece of work: a video, presentation or poster to show understanding of how GIS became a game changer in Haiti. Use a programme such as moviemaker or software or apps such as iMovie, PPT, emaze or prezi.
Essay: The Haiti disaster response has been considered a ‘watershed moment’ for GIS. Using the information included here, explain what this means and how this helped the disaster response. Include mapping the impact of the disaster, guiding and coordinating the emergency response, and the role of new technologies.
© Pete Masters/MSF
msf.org.uk 13
Teaching resources: Tectonic activity and hazards
SourcesArcNews, ESRI International User Conference Issue, ESRI, Summer 2010, Vol. 32, No. 2
Anderson-Tarver, C. (Spring 2015). “Crises mapping the 2010 Earthquake in Open Street Map Haiti”, University of Colorado at Boulder http://scholar.colorado.edu/cgi/viewcontent.cgi?article=1081&context=geog_gradetds
Medecins Sans Frontieres (September 2015). “GIS support for the Ebola response in Libera, New Guinea and Sierra Leone” http://emergency.copernicus.eu/mapping/sites/default/files/citations/GIS%20Support%20Ebola%202015_EN.pdf
Meier, Patrick (July 2012). “How Crisis Mapping Saved Lives in Haiti” http://voices.nationalgeographic.com/2012/07/02/crisis-mapping-haiti/ National Geographic website
Syracruse University Libraries. “GIS (Geographical Information Systems”, Geospatial Data: Types of GIS Data” http://researchguides.library.syr.edu/c.php?g=258118&p=1723814 Syracruse University Libraries website
International Red Cross and Red Crescent Societies (June 2017). “Data: a vital tool for disaster response” https://media.ifrc.org/innovation/2017/06/08/data-a-vital-tool-for-disaster-response/
Humanitarian OpenStreetMap Team website https://www.hotosm.org/projects/haiti-2)
AcknowledgementsMSF London, and especially the author Severa von Wentzel, would like to thank Mary Doherty for her expert guidance and generous support.
msf.org.uk 14
Teaching resources: Tectonic activity and hazards
Further information
msf.org.uk 15