web viewmodule 3 • trend and variation analysis. module 4 • data relationship analysis....
TRANSCRIPT

Budget Analysis Budget Analysis WorkshopWorkshop
Workbook, Version 5.0
BUDG8100-W

Graduate School USA
Washington, DC 20024
(888) 744-GRAD
www.graduateschool.edu
Copyright © 2003—2012 by FedTrain, Inc.

Portions of this manuscript, exclusive of public domain materials, are protected by an additional copyright. All rights reserved to those portions by FedTrain, Inc. 2451 Cumberland Pkwy, MS 3698, Atlanta, GA 30339. No portion of this manuscript may be reproduced or utilized in any form or by any means, electronic or mechanical, including photocopying, recording, or by any information storage or retrieval system without the permission in writing from FedTrain, Inc. Said permission is conveyed, herein, exclusively to the Graduate School USA.
This manuscript has been reprinted by the Graduate School USA for use in BUDG8100D with permission of FedTrain, Inc.
Workbook
Table of Contents
Organization ChartsFederal Service Center Regional Organization 2
Federal Service Center Headquarters Staff Offices 3
Management Analysis Teams Structure 4
Data Displays—Federal Service CenterPrior Year Data 5
Five Year Data—HQ—Appropriated Funds 6
Five Year Data—Regions—Revolving Funds 7
Prior Year Workload Accomplished 8
Regions—Consolidated Service Rates (CSR) 11
ExercisesPerformance Measurement 13
Trend and Variation Analysis 19
Data Relationship Analysis 27
Cost Analysis 43
© Graduate School USA 1 Budget Analysis Workshop© 2012, FedTrain, Inc.

Workbook
Budget Analysis Workshop 2 © Graduate School USA© 2012, FedTrain, Inc.
Char
t 1

Workbook
© Graduate School USA 3 Budget Analysis Workshop© 2012, FedTrain, Inc.
Char
t 2

Workbook
Budget Analysis Workshop 4 © Graduate School USA© 2012, FedTrain, Inc.
Char
t 3

Workbook
© Graduate School USA 5 Budget Analysis Workshop© 2012, FedTrain, Inc.
Char
t 4

Workbook
Budget Analysis Workshop 6 © Graduate School USA© 2012, FedTrain, Inc.
Char
t 5

Workbook
© Graduate School USA 7 Budget Analysis Workshop© 2012, FedTrain, Inc.
Char
t 6

Workbook
Budget Analysis Workshop 8 © Graduate School USA© 2012, FedTrain, Inc.
Char
t 7

Workbook
© Graduate School USA 9 Budget Analysis Workshop© 2012, FedTrain, Inc.
Char
t 8

Workbook
Budget Analysis Workshop 10 © Graduate School USA© 2012, FedTrain, Inc.
Char
t 9

Workbook
© Graduate School USA 11 Budget Analysis Workshop© 2012, FedTrain, Inc.
Char
t 10

Module 2Module 2Performance MeasurementPerformance Measurement
Exercise
13

Exercise 2-1—Analyzing US Gross Domestic Product, Federal Outlays,
Federal Debt, Employment and Crude Oil Prices
Item 1960 1970 1980 1990 2000 2010 Est.
1. Gross GDP ($ Bil) 1/ $ 518.9 $ 1,012.7 $ 2,724.2 $ 5,734.5 $ 9,821.0 $ 14,623.9
a. Percent Change—GDP (.00)
95.16 % 169.00 % 110.50%
2. Federal Outlays ($Bil) 2/ $ 111.6 $ 195.6 $ 590.9 $ 1,253.0 $ 1,789.0 $ 3,720.7
a. Percent Change—Outlays (.00)
75.27 % 202.10% 112.05%
3. Federal Debt ($Bil) 3/ $ 286.3 $ 370.9 $ 907.8 $ 3,233.2 $ 5,674.3 $ 13,786.0
a. Percent Change—Outlays (.00)
29.55 % 144.76% 256.16%
4. Employment Levels 4/ (Mil)
89.4 119.8 156.8 195.3 238.8 246.4
a. Percent Change—Employment (.00)
34.00% 30.88% 24.55 %
5. World Oil Prices 5/ ($ per barrel)
$ 16.78 $ 14.10 $ 13.41 $ 24.06 $ 20.38 $ 79.47
a. Percent Change—Oil Prices (.00)
-16.97 % -4.89 % 79.42%
6. Outlays percent of GDP (.00)
21.51% 19.31% 21.69% 21.85%
7. Debt percent of GDP (.00)
55.17% 36.62% 33.32% 56.38%
1. FY 2011 U.S. Budget, Table 10.1 (As of the end of the calendar year);2. FY 2011 U.S. Budget, Table 3.2 (For the fiscal year ending) 3. www.usgovernmentdebt.us/index.php (For the fiscal year ending);4. www.bls.gov (As of the end of the calendar year)
14

Module 2 • Performance Measurement
This page intentionally left blank
© Graduate School USA 15 Budget Analysis Workshop© 2012, FedTrain, Inc.

Module 2 • Performance Measurement
Exercise 2-2—Performance Measurement
Workload and Resource Consumption Data
Management Analysis Teams
Item Description PY-3 PY-2 PY-1 PY CY Est
Enter the FY in the blank spaces to the right
Workload Data
1. Number of MAT studies conducted 35 33 31 30 29
2. Number of fulltime equivalents (FTEs) under study 349,860 329,868 340,876 336,210 319,400
3. Average cost per FTE under study (OCC 10.0) $34,184 $34,747 $35,456 $36,106 $36,789
4. Total dollars under study (OCC 10.0) ($MIL) 11,959.6 11,461.9 12,086.1 12,139.2 11,750.4
5. Number of FTEs validated on-site 336,215 317,003 328,979 320,408 300,879
6. Number of FTEs restored after appeal 3,934 3,392 2,987 6,953 9,967
7. Net final number of FTEs validated 340,149 320,395 331,966 327,361 310,846
8. Net final number of FTEs invalidated 9,711 9,473 8,910 8,849 8,554
Resource Consumption
9. Number of MAT Mandays Consumed in the Studies 10,045 9,009 8,029 7,665 7,207
Budget Analysis Workshop 16 © Graduate School USA© 2012, FedTrain, Inc.

Module 2 • Performance Measurement
10. Direct Obligations of Operations (All OCCs) 4,088,318 3,757,016 3,409,984 3,232,102 3,048,162
11. Indirect Obligations of Operations 369,876 339,646 314,598 301,631 293,485
12. Overhead Obligations to Support Operations 449,715 450,842 409,198 387,852 365,779
13. Total Obligations for MAT Study Operations (All OCCs)
4,907,908 4,547,503 4,133,780 3,921,585 3,707,427
© Graduate School USA 17 Budget Analysis Workshop© 2012, FedTrain, Inc.

Module 2 • Performance Measurement
Exercise 2-2—Performance Measurement (cont.)
Management Analysis Teams
Analysis of the Data PY-3 PY-2 PY-1 PY CY Est
Enter the FY in the blank spaces to the right
Determine the following:
14. Gross $$ Savings per Invalidated FTE ($000) 8 x 3 $331,955 $329,155 $315,898 $319,502
14.1 Percent Saved 14/4 2.8% 2.9% 2.6% 2.6%
15. Percent FTE’s invalidated 8/2 2.8% 2.9% 2.6% 2.6%
16. Gross Study Obligations per FTE Invalidated 13/8 $505 $480 $464 $443
16.1 Percent Change -5.0% -3.4% -4.5%
17. Direct Study Obligations per FTE Invalidated 10/8 $421 $397 $383 $365
17.1 Percent Change -5.7% -3.5% -4.7%
18. Gross Obligations per Study 13/1 $140,226 $137,803 $133,348 $130,720
18.1 Percent Change -1.7% -3.2% -2.0%
19. Percent Change in Gross Study Obligations Per Year (Ln 13)
-7.3% -9.1% -5.1%
Budget Analysis Workshop 18 © Graduate School USA© 2012, FedTrain, Inc.

Module 3Module 3Trend and Variation Trend and Variation AnalysisAnalysis
Exercises
19

Practice Exercise 3-1—Trend Analysis: Project the Labor Dollars for FY-5
($000)
Item FY-1 FY-2 FY-3FY-4
EstimateFY-5
Projected
1. Salary Obligations $1,421.2 $1,492.3 $1,565.9 $1,757.8
2. Rate of Change 5.0% 4.9%
3. Percent of Total Obligations
82.5% 82.6% 82.5%
4. Benefits Obligations $301.3 $315.1 $331,4 $362.6
5. Rate of Change 4.6% 5.2%
6. Percent of Total Obligations
17.5% 17.4% 17.5%
7. Total Civilian Pay Obligations
$1,722.50 $1,807.4 $1,897.3 $2,120.4
8. Rate of Change 4.9% 5.0%
Students will begin the analysis by calculating the values in column FY 4 Estimate. You should not attempt to complete FY 5 until you have answered the questions in the Participant Guide—and—have received additional information from your instructor.
20
Module 3 • Trend and Variation Analysis
This page intentionally left blank
© Graduate School USA 21 Budget Analysis Workshop© 2012, FedTrain, Inc.

Module 3 • Trend and Variation Analysis
Exercise 3-2—Trend Analysis
Management Analysis Division
Object Classification: 21.00 Travel and Transportation of PersonsSub-Object Classification: 21.63 MAT Study Team Annual Program
Workload FYPY-3 FYPY-2 FYPY-1 FYPYFYCYEst.*
FYBYEst.
Enter the FY in the blank space to the right
1. Number MAT Studies Planned
37 36 35 33 32 36
2. Number MAT Studies Accomplished
35 33 31 30 29
STAFFING DATA
3. Number of MA Teams 5 5 5 4 4 4
4. Average Number of Persons per MAT
8.2 7.8 7.4 7.3 7.1 7.1
TRIP DATA
5. Number of Study Days on Site 5,740 5,148 4,588 4,380 4,176
OBLIGATION DATA
6. Dollars Obligated ($000) $ 1,398 $ 1,307 $1,211 $ 1,200 $ 1,186
*FYCY data are accurate through this point in FYCY.
Budget Analysis Workshop 22 © Graduate School USA© 2012, FedTrain, Inc.

Module 3 • Trend and Variation Analysis
Exercise 3-2—Trend Analysis (cont.)
Management Analysis Division
Object Classification: 21.00 Travel and Transportation of PersonsSub-Object Classification: 21.63 MAT Study Team Annual Program
Workload FYPY-3
FYPY-2
FYPY-1
FYPYFYCY Est.*
FYBY Est.
Enter the FY in the blank space to the right
ANALYSIS
7. What is the relationship for the following?
7.1 Percent MAT studies accomplished (2/1)
94.6 91.7 88.6 90.9 90.6
7.2 Number of MAT studies per team/year. (2/3)
7.0 6.6 6.2 7.5 7.3
7.3 Number of days on site per study (5/2) 164.0 156.0 148.0 146.0 144.0
7.4 Travel obligations per study (6/2) 39,942 39,606 39,065 40,000 40,897
7.5. Travel obligs. per day on site (6/5) 243.55 253.89 263.95 273.97 284.00
*FYCY data are accurate through this point in FYCY.
© Graduate School USA 23 Budget Analysis Workshop© 2012, FedTrain, Inc.

Module 3 • Trend and Variation Analysis
Exercise 3-3—Variation Analysis The student will not be required to conduct this analysis due to time limits for the course. Instead, the instructor will present these materials on the projection screen and lecture on the benefits of conducting variation analysis. The following charts were designed to show the intricacies and benefits of ‘drilling down’ in the data to develop a more precise analysis. This module builds on the macro analysis completed in the first part of Module 3.
1. FYPY-3 ( ) Cumulative Data
Item 1st Qtr 2nd Qtr 3rd Qtr 4th Qtr (Note 1)
Planned Studies 8 17 26 37Accomplished 6 14 24 35Percent Accomplished 75.0% 82.4% 92.3% 94.6%Total Days Accumulated 1,378 2,540 4,490 5,740Days per Study 230 181 187 164Dollars Obligated (000) $293.1 $615.1 $1,006.6 $1,398.0 Dollars per Day $213 $242 $224 $244
2. FYPY-2 ( )
Item 1st Qtr 2nd Qtr 3rd Qtr 4th Qtr (Note 1)
Planned Studies 8 14 23 36Accomplished 7 14 21 33Percent Accomplished 87.5% 100.0% 91.3% 88.6%Total Days Accumulated 1,133 2,409 3,924 5,148Days per Study 162 172 187 156Dollars Obligated (000) 352.9 605.8 980.3 1,307.0Dollars per Day $311 $251 $250 $254
3. FYPY-1 ( )
Item 1st Qtr 2nd Qtr 3rd Qtr 4th Qtr (Note 1)
Planned Studies 7 15 22 33Accomplished 6 13 23 31Percent Accomplished 85.7% 86.7% 104.5% 93.9%Total Days Accumulated 1,147 2,180 3,533 4,588Days per Study 191 168 154 148
Budget Analysis Workshop 24 © Graduate School USA© 2012, FedTrain, Inc.

Module 3 • Trend and Variation Analysis
Dollars Obligated (000) $314.9 $569.2 $892.5 $1,211.0Dollars per Day $275 $261 $253 $264 (Note 1: All data are cumulative)
© Graduate School USA 25 Budget Analysis Workshop© 2012, FedTrain, Inc.

Module 3 • Trend and Variation Analysis
Exercise 3-3—Variation Analysis (cont.)
Budget Analysis Workshop 26 © Graduate School USA© 2012, FedTrain, Inc.

27
4. Last Year ( )
Item 1st Qtr 2nd Qtr 3rd Qtr 4th Qtr (Note 1)
Planned Studies 7 15 22 33Accomplished 7 15 20 30Percent Accomplished 100.0% 100.0% 90.9% 90.9%Total Days Accumulated 1,051 2,098 3,426 4,380Days per Study 150 140 171 146Dollars Obligated (000) $312.0 $564.0 $972.0 $1,200.0Dollars per Day $297 $269 $284 $274
5. Prior Year Totals ( )
Item 1st Qtr 2nd Qtr 3rd Qtr 4th Qtr (Note 1)
Planned Studies 30 61 93 139Accomplished 26 56 88 129Percent Accomplished 86.7% 91.8% 94.6% 92.8%Total Days Accumulated 4,709 9,227 15,373 19,856Days per Study 181 165 175 154Dollars Obligated (000) $1,272.9 $2,354.1 $3,851.4 $5,116.0Dollars per Day $270 $255 $251 $258
6. This Year Y-T-D ( )
Item 1st Qtr 2nd Qtr 3rd Qtr 4th Qtr (Note 1)
Planned Studies 7 16 24 32Accomplished 7 16
Percent Accomplished 100% 100%
Total Days Accumulated 1,136 2,464
Days per Study 162 154
Dollars Obligated (000) $342.90 $710.00
Dollars per Day $302 $288
(Note 1: All data are cumulative)

Module 4Module 4Data Relationship AnalysisData Relationship Analysis
Study Quiz and Exercises
28

Module 4 • Data Relationship Analysis
Module 4 Study Quiz
Directions: The following questions relate to Mr. Johnson’s assignment, Mrs. Arck’s memo and Sam’s handwritten notes. Circle the correct answer(s).
1. The budget you are to prepare is for only the incremental costs of the Government Purchase Card Audit Team (GPCAT), not for the entire budget for the headquarters.
a. True
b. False
2. The budget control figure stated by OMB is:
a. $250,000 for this year
b. $325,000 for next year
c. $575,000 for all 18 months
d. All of the above
3. The hire plan envisions they will hire 10 persons in pay period 8.
a. True
b. False
4. The rest of the team will be hired in pay period 13.
a. True
b. False
5. The workstations are to be purchased this year.
a. True (In the baseline estimate.)
b. False
6. The GPCAT will need fewer phones and phone lines than other elements of the HQ.
a. True
b. False
7. All 22 new hires will go to training in Washington, DC.
a. True
b. False
© Graduate School USA 29 Budget Analysis Workshop© 2012, FedTrain, Inc.

Module 4 • Data Relationship Analysis
8. The training is for 10 days, but the travel duty will be for 12 days.
a. True
b. False
9. The employee immediately reports for training after being hired.
a. True
b. False
10. After training, the employee hangs around at the HQ awaiting a full team to be formed before conducting GPCAT audit travel.
a. True
b. False
11. All new employees will travel doing audits except the GS-8.
a. True
b. False
12. Each team member is expected to travel _____ pay periods in year 2.
a. 22
b. 26
c. 20
d. None of the above
13. Each team member will travel _____ days per pay period conducting audits.
a. 6
b. 4
c. 8
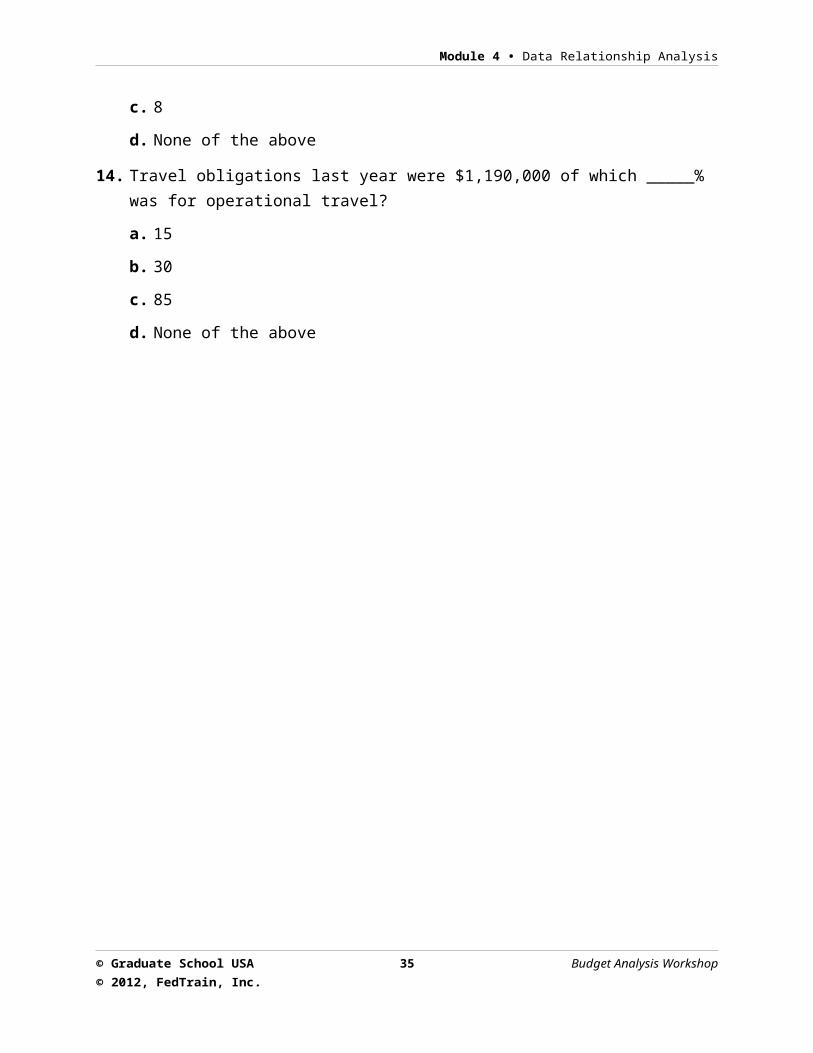
d. None of the above
14. Travel obligations last year were $1,190,000 of which _____% was for operational travel?
a. 15
b. 30
c. 85
d. None of the above
Budget Analysis Workshop 30 © Graduate School USA© 2012, FedTrain, Inc.

Module 4 • Data Relationship Analysis
15. OCC 26.0 is for supplies. Operating supplies are a part of the account. How much of the obligations are for operating supplies?
a. $43,000 last year
b. $22,800 this year
c. Both a. and b.
d. None of the above
16. If the cost of an item went up 5% from last year to this year, then you should estimate that next year’s costs would likewise go up 5% above this year’s cost.
a. True
b. False
17. To balance the final budget to the OMB guidance, you can plan for the GS-8 to stay at the HQ if needed to save travel dollars.
a. True
b. False
18. You can also consider leasing equipment in lieu of purchase if it is cheaper.
a. True
b. False
19. The number of people in the HQ:
a. 204 last year
b. 206 last year
c. Both a. and b.
d. None of the above
20. The number of workstations in the HQ increased by 9 from last year.
a. True
b. False
21. The number of training days completed in the HQ last year vs. this year:
a. Are comparable
b. Are not comparable because one number is for a whole year and the other is for six months
c. Are greater this year than last© Graduate School USA 31 Budget Analysis Workshop© 2012, FedTrain, Inc.

Module 4 • Data Relationship Analysis
d. None of the above
Budget Analysis Workshop 32 © Graduate School USA© 2012, FedTrain, Inc.

Module 4 • Data Relationship Analysis
22. The purchase price of laptop computers went up from last year to this year.
a. True
b. False
23. There are _____ more telephone lines in the HQ this year than last year.
a. 15
b. 30
c. 85
d. None of the above
24. When calculating percentages, you should round to the nearest one decimal point. The correct rounding is as follows:
a. 5.001% is rounded to 5.1%
b. 17.449% is rounded to 17.5%
c. 11.681% is rounded to 11.7%
d. None of the above
25. Your final products due to Mr. Johnson are:
a. A baseline estimate for 18 months
b. A baseline estimate and alternative if the baseline exceeds $575,000
c. Are greater this year than last
d. None of the above
© Graduate School USA 33 Budget Analysis Workshop© 2012, FedTrain, Inc.
Module 4 • Data Relationship Analysis
Chart 11Module 4—FSC Obligations ($000) (Estimated Through Mar 31, CY)
Title OCC Last Year (PY) This Year (CY)
Salaries 11.0 $ 9,353 $ 5,004
Benefits 12.0 1,964 1,101
Travel 21.0 1,190 509
Transportation 22.0 19 11
Rent & Utilities 23.0 428 229
Communications 23.0 102 60
Printing 24.0 143 84
Services 25.0 550 330
Supplies 26.0 215 115
Equipment 31.0 282 165
Total Obligations $ 14,246 $ 7,608
Budget Analysis Workshop 34 © Graduate School USA© 2012, FedTrain, Inc.

Module 4 • Data Relationship Analysis
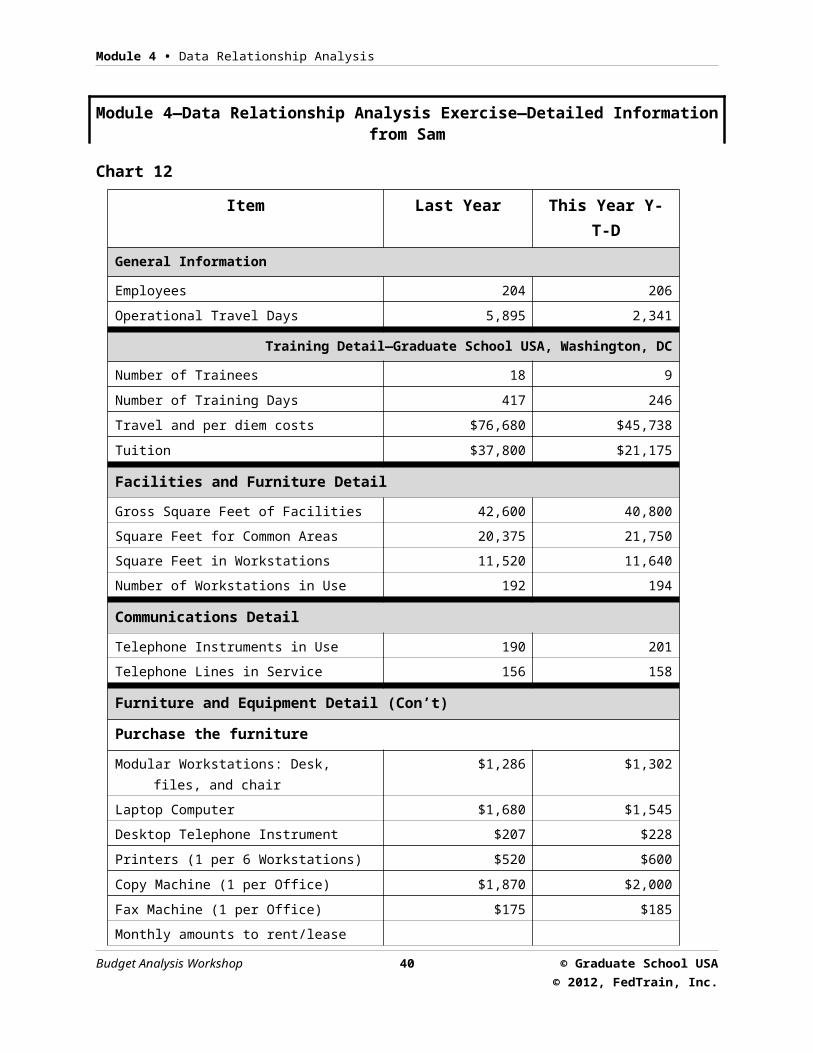
Module 4—Data Relationship Analysis Exercise—Detailed Information from Sam
Chart 12
Item Last Year This Year Y-T-D
General Information
Employees 204 206
Operational Travel Days 5,895 2,341
Training Detail—Graduate School USA, Washington, DC
Number of Trainees 18 9
Number of Training Days 417 246
Travel and per diem costs $76,680 $45,738
Tuition $37,800 $21,175
Facilities and Furniture DetailGross Square Feet of Facilities 42,600 40,800
Square Feet for Common Areas 20,375 21,750
Square Feet in Workstations 11,520 11,640
Number of Workstations in Use 192 194
Communications DetailTelephone Instruments in Use 190 201
Telephone Lines in Service 156 158
Furniture and Equipment Detail (Con’t)Purchase the furnitureModular Workstations: Desk, files, and chair $1,286 $1,302
Laptop Computer $1,680 $1,545
Desktop Telephone Instrument $207 $228
Printers (1 per 6 Workstations) $520 $600
Copy Machine (1 per Office) $1,870 $2,000
Fax Machine (1 per Office) $175 $185
Monthly amounts to rent/lease the equipment
Modular Workstations: Desk, files, and chair $32 $35
Computer $99 $106
Telephone Instrument NA Na
Printers (1 per 6 Workstations) $29 $35
Copy Machine (1 per Office) $94 $103
© Graduate School USA 35 Budget Analysis Workshop© 2012, FedTrain, Inc.

Module 4 • Data Relationship Analysis
Fax Machine (1 per Office) NA NA
Budget Analysis Workshop 36 © Graduate School USA© 2012, FedTrain, Inc.

Module 4 • Data Relationship Analysis
Exercise 4-1—Data Drivers Computation Use the following computational aids to assist you in developing the Data Drivers required to compute values to be entered on Schedule A. Student should round the amounts to the nearest whole number unless otherwise instructed. (Some students will benefit as the instructor completes these tables on the projection screen along with them. Others may want to work ahead.)
1. Determining the Data Driver and Schedule A Baseline Requirement for Training Travel:The obligations per day for Training Travel
Item Last Year
This Year
NextYear
Calculating historical data:
1. Travel and per diem costs (Chart 12) –
2. Training days (Chart 12) –
3. Travel and per diem costs per training day. (Data Driver) DDDD
Calculating the Schedule A Requirement
4. Number of travelers to classes—Washington, DC (Arck Memo)
–
5. Number of travel days each will be TDY –
6. Total travel days required –
7. Dollar Requirement—Schedule A. (Line 3 x Line 6) –
2. Determining the Data Driver and Schedule A Baseline Requirement for Training Tuition:The obligations per student for Training Tuition
Item Last Year
ThisYear
Next Year
8. Number of trainees going to classes—Washington, DC (Arck Memo) (Line 4, Table 1 above)
–
9. Tuition charge per trainee (Arck Memo) DDDD –
10. Dollar Requirement—Schedule A. (Line 8 x Line 9) –
© Graduate School USA 37 Budget Analysis Workshop© 2012, FedTrain, Inc.

Module 4 • Data Relationship Analysis
Budget Analysis Workshop 38 © Graduate School USA© 2012, FedTrain, Inc.
Module 4 • Data Relationship Analysis
Exercise 4-1—Data Drivers Computation (cont.)
3. Determining the Data Driver and Schedule A Baseline Requirement for GPCAT (Operational) Travel: The obligations per GPCAT Audit Travel day
Item LastYear
ThisYear
NextYear
Calculating historical data:
11. Travel and per diem Obligations (Chart 11) –
12. Less 15 percent for non-operational travel(Sam’s notes) (Line 11 – 15%)
–
13. Number of Operational travel days completed (Chart 12)
–
14. Travel obligations per travel day. (Line 12 ÷ Line 13) Next year increases by the inflation factor per Sam’s notes DDDD
15. Number of GPCAT travel days to be performed (Arck Memo)
–
16. Dollar requirement for GPCAT Audit Travel—Schedule A. (Lines 14 x 15)
–
© Graduate School USA 39 Budget Analysis Workshop© 2012, FedTrain, Inc.

Module 4 • Data Relationship Analysis
Exercise 4-1—Data Drivers Computation (cont.)
4. Determining the Data Driver and Schedule A Baseline Requirement for Rent and Utilities: The obligations per square foot per month for GSA rent.
Item LastYear
This Year
NextYear
Calculating Historical Data:
17. Total square feet rented now. (Chart 12) –
18. Total square feet for workstations now. (Chart 12) –
19. Number of workstations in use now. (Chart 12) –
20. Square feet per workstation (Lines 18 ÷ 19) DDDD –
21. Obligations for rent and utilities (Obligation Chart 11) –
22. Cost per square foot for rent and utilities (Lines 21 ÷ 17) DDDD
Calculating the Schedule A Requirement:
23. Number GPCAT workstations required (Arck Memo) –
24. Total square feet required for workstations. (Lines 20 x 23)
–
25. Total square feet required for common areas (Arck Memo)
–
26. Total GPCAT square feet to be rented from GSA (Lines 24 + 25)
–
27. Dollar requirement for GPCAT rent and utilities—Schedule A (Line 26 x 22) (Note: this year divide answer in half—representing the six months rent.)
–
Budget Analysis Workshop 40 © Graduate School USA© 2012, FedTrain, Inc.

Module 4 • Data Relationship Analysis
Exercise 4-1—Data Drivers Computation (cont.)
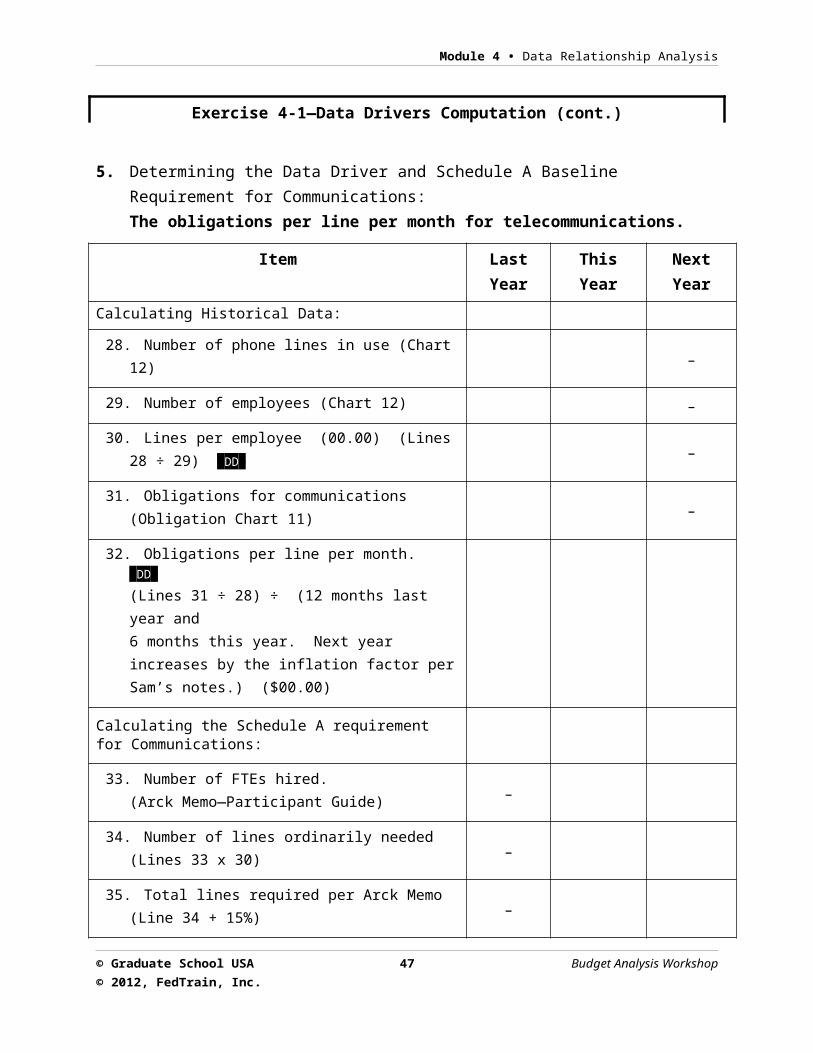
5. Determining the Data Driver and Schedule A Baseline Requirement for Communications: The obligations per line per month for telecommunications.
Item Last Year This Year Next Year
Calculating Historical Data:
28. Number of phone lines in use (Chart 12) –
29. Number of employees (Chart 12) –
30. Lines per employee (00.00) (Lines 28 ÷ 29) DDDD –
31. Obligations for communications (Obligation Chart 11) –
32. Obligations per line per month. DDDD
(Lines 31 ÷ 28) ÷ (12 months last year and 6 months this year. Next year increases by the inflation factor per Sam’s notes.) ($00.00)
Calculating the Schedule A requirement for Communications:
33. Number of FTEs hired.(Arck Memo—Participant Guide) –
34. Number of lines ordinarily needed (Lines 33 x 30) –
35. Total lines required per Arck Memo (Line 34 + 15%) –
36. Dollar requirement for GPCAT communications costs—Schedule A (Lines 35 x 32) x (6 months this year and 12 months next year)
–
Calculating the Telephone Instrument Requirement:
37. Cost to purchase a desktop phone. (Chart 12) – –
38. Dollar requirement for GPCAT desktop telephone purchase—Schedule A (Lines 37 x 33) – –
© Graduate School USA 41 Budget Analysis Workshop© 2012, FedTrain, Inc.

Module 4 • Data Relationship Analysis
Exercise 4-1—Data Drivers Computation (cont.)
6. Determining the Data Driver and Schedule A Baseline Requirement for Operating Supplies:
The obligations per employee per month for operating supplies.
Item LastYear
ThisYear
Next Year
Calculating historical data:
39. Total obligations for Supplies (Obligation chart 11). –
40. Obligations for Operating Supplies at 20% per Sam’s note (Line 39 x 20%). –
41. Number of employees (Chart 12). –
42. Obligations per employee per month for operating supplies (00.00) (Lines 40 ÷ 41) ÷ (12 months last year and 6 months this year. Next year increases by the inflation factor per Sam’s note.) DDDD
Calculating the Schedule A requirement for Supplies:
43. Number of supply months required (Arck memo and Sam’s note.) (Also see note below) –
44. Dollar requirement for GPCAT supplies—Schedule A (Lines 43 x 42) x (6 months this year and 12 months next year)
–
Note: A supply month is one month (or fraction thereof) of supplies for one person. For example: 6 persons hired for six months will require 36 months of supplies (6 x 6 = 36); Similarly, 3 persons hired for 5 months will require 15 months of supplies. The two groups together will require 51 months of supplies (36 + 15)
Budget Analysis Workshop 42 © Graduate School USA© 2012, FedTrain, Inc.

Module 4 • Data Relationship Analysis
Exercise 4-1—Data Drivers Computation (cont.)
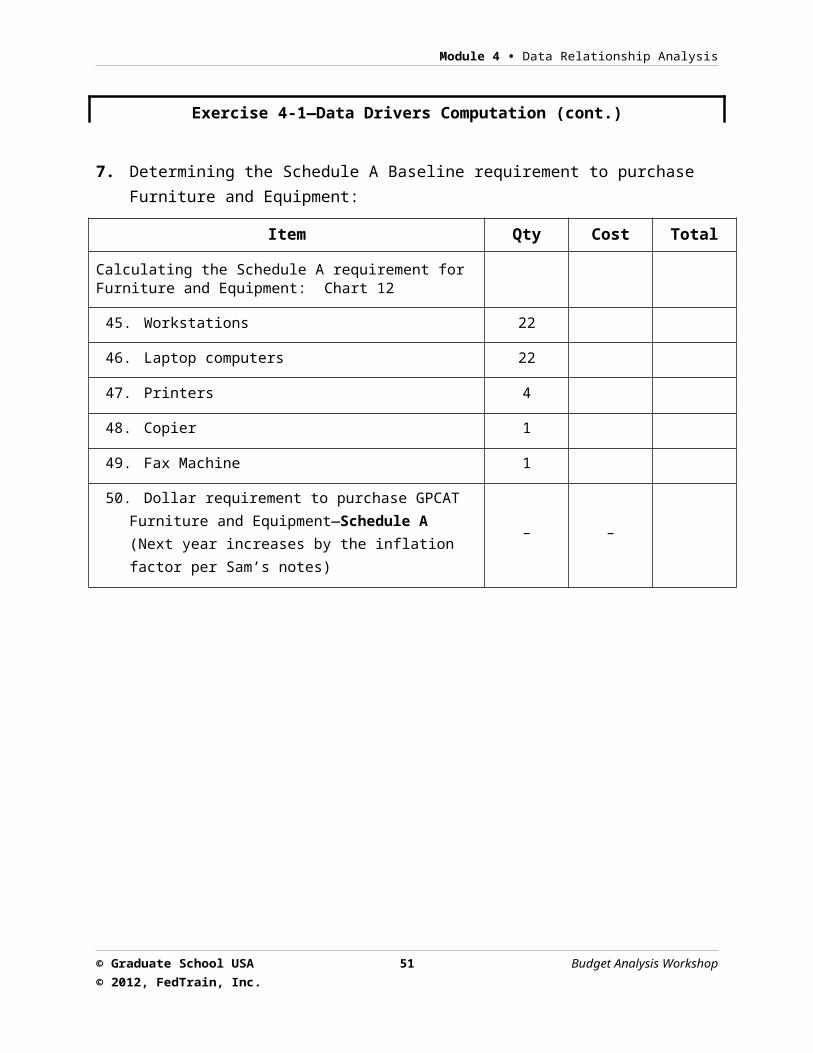
7. Determining the Schedule A Baseline requirement to purchase Furniture and Equipment:
Item Qty Cost Total
Calculating the Schedule A requirement for Furniture and Equipment: Chart 12
45. Workstations 22
46. Laptop computers 22
47. Printers 4
48. Copier 1
49. Fax Machine 1
50. Dollar requirement to purchase GPCAT Furniture and Equipment—Schedule A (Next year increases by the inflation factor per Sam’s notes)
– –
© Graduate School USA 43 Budget Analysis Workshop© 2012, FedTrain, Inc.

Module 4 • Data Relationship Analysis
Module 4—Computing the Data Drivers
Chart 13Determine the following amounts:
Data Drivers Last Year This Year Next Year
1. Dollars per day for training travel N/C
2. Tuition dollars per participant N/A N/C
3. Operational travel obligations per travel day
4. Square feet per work station N/C
5. Obligations per square foot for rent & utilities ($00.00)
6. Number of phone lines per person (.00)
N/C
7. Obligations per phone line per month ($00.00)
8. Obligations per person per month for operating supplies ($00.00)
Your instructor will assist you in completing this table. However, the following data tables may be used to assist the student in computing the Data Driver amounts (above) and the resulting values to be entered on the succeeding Schedule A—GPCAT Baseline Estimated Requirements.
Budget Analysis Workshop 44 © Graduate School USA© 2012, FedTrain, Inc.

Module 4 • Data Relationship Analysis
Module 4—Data Relationships Exercise
Chart 14
Table Number:___________
Schedule A—GPCAT Baseline Estimate for the FSC
Worksheet Estimate ($ Whole)
Items OCC This Year Next Year Total
1. Training Travel 21.0
2. GPCAT Audit Travel 21.0
3. Rent and Utilities 23.0
4. Communications 23.0
5. Training Tuition 25.0
6. Operating Supplies 26.0
7. Furniture and Equipment 31.0
8. Telephone Purchase 31.0
9. Initial Baseline Estimate
© Graduate School USA 45 Budget Analysis Workshop© 2012, FedTrain, Inc.
Module 4 • Data Relationship Analysis
Module 4—Data Relationships Exercise
Chart 15
Table Number _____
Schedule B—Alternate to the Baseline Estimate for the FSC ($ Whole)
Items This Year Next Year Total
Initial Baseline Estimate (Schedule A—Chart 14)
Adjustments to the Baseline
Budget Analysis Workshop 46 © Graduate School USA© 2012, FedTrain, Inc.

Module 4 • Data Relationship Analysis
© Graduate School USA 47 Budget Analysis Workshop© 2012, FedTrain, Inc.

Module 5Module 5Cost AnalysisCost Analysis
Exercises
49

Module 5—Cost Analysis Exercise—Present Value
Chart 16Table AThe present value of a single payment of $1 paid or received in the future
Project Year 3% Factors Project Year 4.5% Factors Project Year 8.0% Factors
1 0.9709 1 0.9569 1 0.9259
2 0.9426 2 0.9157 2 0.8573
3 0.9151 3 0.8762 3 0.7938
4 0.8885 4 0.8385 4 0.7351
5 0.8626 5 0.8024 5 0.6805
6 0.8375 6 0.7678 6 0.6301
7 0.8131 7 0.7348 7 0.5834
8 0.7894 8 0.7031 8 0.5402
9 0.7664 9 0.6729 9 0.5002
10 0.7441 10 0.6439 10 0.4631
50
Module 5 • Cost Analysis
Chart 17Table BThe present value of a series of equal payment of $1 paid or received in the future
Project Year 3% Factors Project Year 4.5% Factors Project Year 8.0% Factors
1 0.9709 1 0.9569 1 0.9259
2 1.9134 2 1.8726 2 1.7832
3 2.8286 3 2.7489 3 2.5771
4 3.7171 4 3.5875 4 3.3121
5 4.5797 5 4.3899 5 3.9927
6 5.4171 6 5.1578 6 4.5228
7 6.2302 7 5.8927 7 5.2063
8 7.0197 8 6.5958 8 5.7466
9 7.7861 9 7.2687 9 6.2468
10 8.5302 10 7.9127 10 6.7101
© Graduate School USA 51 Budget Analysis Workshop© 2012, FedTrain, Inc.

Module 5 • Cost Analysis
Cost Analysis Exercise—Calculates the Present Value of the Money Left in Your Savings
Chart 181. Assumes your existing savings remain untouched as a part of this action.
Examples: Option 1—Keep Clunker; Option 3—Finance; and Option 4—Lease
Computations for interest earned on $18,500 retained in your investment
account AmountInterestat 6%
Inflation Discount
at 3%PresentValue
Beginning balance first year 18,500 1,110 0.9709 1,078
Next year 19,610 1,177 0.9426 1,109
Next year 20,787 1,247 0.9151 1,141
Next year 22,034 1,322 0.8885 1,175
Next year 23,356 1,401 0.8626 1,209
Gross Interest Earned $6,257
Discounted Interest for 5 Years $5,712
2. Assume the $1,850 for the down payment comes from the $3,200 for Clunker. The remaining $1,350 goes to your savings.
Examples: Option 3 Finance
Computations for interest earned on $1,350 retained in your investment account Amount
Interestat 6%
Inflation Discount
at 3%PresentValue
Beginning balance first year 1,350 81 0.9709 79
Next year 1,431 86 0.9426 81
Next year 1,517 91 0.9151 83
Next year 1,608 96 0.8885 85
Next year 1,704 102 0.8626 88
Gross Interest Earned $456
Budget Analysis Workshop 52 © Graduate School USA© 2012, FedTrain, Inc.

Module 5 • Cost Analysis
Discounted Interest for 5 Years $416
© Graduate School USA 53 Budget Analysis Workshop© 2012, FedTrain, Inc.

Module 5 • Cost Analysis
3. Assumes the entire amount received for Clunker is added to your savings.
Examples: Option 2—Cash and Option 4—Lease
Computations for interest earned on $3,200 retained in your investment account Amount
Interestat 6%
Inflation Discount
at 3%PresentValue
Beginning balance first year 3,200 192 0.9709 186
Next year 3,392 204 0.9426 192
Next year 3,596 216 0.9151 197
Next year 3,811 229 0.8885 203
Next year 4,040 243 0.8626 210
Gross Interest Earned $1,083
Discounted Interest for 5 Years $988
Budget Analysis Workshop 54 © Graduate School USA© 2012, FedTrain, Inc.
Module 5 • Cost Analysis
Exercise 5-6—Cost AnalysisDecision: Keep “Clunker” or acquire a new car
Option 1. Keep “Clunker” for 60 months Amount P.V. TableP.V.
Factor P.V.
1. Annual Operating Expenses
2. Residual Value in 5th Year
3. Discounted Earnings on $18,500 savings
Net present Value (5 Years) – – –
Option 2. Purchase for Cash from Investments Amount P.V. Table
P.V. Factor P.V.
1. Cash Payment
2. Annual Operating Expenses
3. Residual Value (Year 5)
4. Sell “Clunker”
5. Discounted lost earnings on $18,500 savings
6. Discounted earnings on savings from “Clunker”
Net Present Value (5 Years) – – –
Option 3. Finance—10% Down Amount P.V. TableP.V.
Factor P.V.
1. Down Payment (Purchase Price of $18,500)
2. Annual Car Payments
3. Annual Operating Expenses
4. Residual Value (5th Year)
5. Sell “Clunker”
© Graduate School USA 55 Budget Analysis Workshop© 2012, FedTrain, Inc.

Module 5 • Cost Analysis
6. Discounted earnings on savings
Net Present Value (5 Years) – – –
Exercise 5-6—Cost Analysis (cont.)
Decision: Keep “Clunker” or acquire a new car
Option 4. Keep “Clunker” or acquire a new car Amount P.V. Table
P.V. Factor P.V.
1. Annual Lease Payments
2. Annual Operating Expenses
3. Excess Mileage Charges (at lease end)
4. Sell “Clunker”
5. Discounted earnings on savings
Net Present Value (5 Years) – – –
Compare the monthly costs to commute to work under the four options
Comparison of Options (P.V. Analysis) P.V. @ 40% Monthly
Option 1. Keep “Clunker” for 60 Months
Option 2. Purchase for Cash from Investments
Option 3. Finance—10% Down
Option 4. Lease for 60 Months
Budget Analysis Workshop 56 © Graduate School USA© 2012, FedTrain, Inc.

Module 5 • Cost Analysis
Exercise 5-7—Maxi-Mail Decision
Decision: Acquire a machine or keep 4 FTPs
Option 1. As Is Amount P.V. TableP.V.
Factor P.V.
1. Personnel costs (4 FTEs)
2. Annual Equipment and Supplies Costs
Net Present Value (5 Years) – – –
Option 2. Purchase Outright Amount P.V. TableP.V.
Factor P.V.
1. Purchase Price
2. Annual Maintenance Contract
3. Personnel and Equipment Savings
4. Residual Value
Net Present Value (5 Years) – – –
Option 3. Lease to Ownership Amount P.V. TableP.V.
Factor P.V.
1. Annual lease to ownership payments
2. Annual Maintenance Contract
3. Personnel and Equipment Savings – – –
4. Residual Value
Net Present Value (5 Years)
© Graduate School USA 57 Budget Analysis Workshop© 2012, FedTrain, Inc.

Module 5 • Cost Analysis
Exercise 5-7—Maxi-Mail Decision (cont.)
Decision: Acquire a machine or keep 4 FTPs
Option 4. Straight Lease Amount P.V. TableP.V.
Factor P.V.
1. Annual Lease (Including Maintenance Contract)
2. Personnel and Equipment Savings
Net Present Value (5 Years) – – –
Present Value at 3.0% Table A Table B
Project Year 1 0.9709 0.9709
Project Year 2 0.9426 1.9134
Project Year 3 0.9151 2.8286
Project Year 4 0.8885 3.7171
Project Year 5 0.8626 4.5797
Budget Analysis Workshop 58 © Graduate School USA© 2012, FedTrain, Inc.