web viewmensuration. it is derived from latin word mensura which ... and the true value of the...
TRANSCRIPT

Forest MensurationLecture Notes
B.Sc Forestry 2nd Year 2nd Semester
Prepared byBishnu P Devkota
LecturerInstitute of Forestry
Pokhara, Nepal
October 2012

Unit-1: Introduction
Forest Mensuration, Dasometrics or Dendrometrics, deals with the quantification of forests, trees, and forest products. We can distinguish in it techniques for direct or indirect measurement, estimation procedures using statistical relationships, and methods of prediction where the variable time takes part.
Measurement (Direct, Indirect)
Estimation (Statistical)
Prediction (Over Time)
Logs (Products)
Length, diameterCubiccation (Volume)Log rulesDefect, Quality
Volume functionsSawn timber conversionStacked wood
Trees DBH, height, barkCubication Stem analysis
Volume functionsTaper functionsBark functionsProduct assortment
Stands Stand tables Height-DBHDBH distributionsVolume functionsInventories
Site qualityGrowthMortality
1.1 Definition and scope of forest mensuration
Forest An area set aside for the production of timber and other forest product. A plant community predominantly of trees and other woody vegetation usually with a
closed canopy (Glossary). Forests are the lands of more than 0.5 ha with a tree canopy cover of more than 10%
which are not primarily under agricultural or urban land use (FAO, 2000).
Mensuration It is derived from Latin word mensura which means measure. It means measurement of
length, mass and time etc. It is an art and science of locating, measuring and calculating the length of lines, areas of
planes, and volumes of solids It is that branch of mathematics which is concerned with the determination of lengths,
areas and volumes.
Forest Mensuration Forest Mensuration deals with the determination of the volume of logs, trees, and stands,
and with the study of increment and yield (Graves, 1906). Forest Mensuration is that branch of forestry which deals with the determination of
dimensions (eg. Diameter, height, volume etc), form, age and increment of single trees, stands or whole woods, either standing or after felling ( Chaturvedi and Khanna, 1986)
Lecture notes on Forest Mensuration by Bishnu P Devkota, Institute of Forestry, Pokhara, 2012 1

Forest Mensuration is the determination of dimensions, form, weight, growth, and age of trees individually or collectively, and of the dimensions of their products (Helms, 1998).
It is a tool that provides facts about the forest crops or individual trees to sellers, buyers, planners, managers and researchers.
ObjectivesForest mensuration provides quantitative information regarding forest resources that will allow making reasonable decisions on its density, use and management.Forest mensuration serves the following objects
Basis for sale Basis for management Measurement for research Measurement for planning
Scope It is the branch of forestry which provides foundations of measurement principles
applicable to any forest management problems (figure 1) Has a wide scope. Involves all stakeholders i.e. Labors, buyers, sellers, contractors, planners,
managers/foresters and researchers. Applicable to any forest measurement problems of wildlife management, watershed
management, insect and disease incidence, recreation, tourism and in fact, many of the mensurational aspects of multiple use forestry.
Forest Mensuration is the application of measurement principles to obtain quantifiable information for forest management decision making.
The application of statistical theory and use of electronic computer for data processing have brought about revolutionary changes in forest measurement problems.
Forest mensuration should make full use of these tools but its principles must be based on sound biological knowledge.
Figure 1: Scope of forest mensuration
Lecture notes on Forest Mensuration by Bishnu P Devkota, Institute of Forestry, Pokhara, 2012 2
Forest Mensuration
Individual trees
Sampling
Stands and forests
Tools
Measurement theory Manager’s information needs Errors
Forest change
Monitoring change
What is in the forest now?
Individual trees Stands and forests

Importance of Forest MensurationIt is the keystone in the foundation of forestry. Forestry in the broadest sense is a management activity involving forestland, the plants and animals on the land, and the human as they use the land. Forest mensuration solves the following questions which justifies its importance in forestry.
What silvicultural treatment will result in best regeneration and growth? What species is most suitable for reforestation? Is there sufficient timber to supply a forest industry and for an economic harvesting
operation? What is the value of timber and land? What is the recreational potential? What is the wildlife potential? What is the status of biodiversity on the area? What is the status of the forest as a carbon sink? What is the status of forest now? How is the forest changing? What can we do to manage the forest properly? How can it be assessed? And for what purpose?It helps to answer all these questions and concepts involved in forest management. “You can’t efficiently make, manage, or study anything if you don’t locate and measure”.
If you cannot measure it, you cannot manage it and good management decisions require good data; thus mensuration has vital role in forest management. Forest mensuration is concerned with the obtaining of information about forest resources. The ultimate objective of forest mensuration is to provide quantitative information regarding this resource that will allow making reasonable decisions on its density, use and management.
1.2 Bias, accuracy and precision
The difference between a measurement and the true value of the quantity measured is the true error of the measurement, and is never known since the true value of the quantity is never known.
A discrepancy is the difference between two measured values of the same quantity, it is not an error.
Sources of errors(i) Instrumental(ii) Personal(iii) Natural- temperature, humidity, gravity, wind, magnetic declination
Kinds of errors(a) Mistake(b) Systematic errors (cumulative errors)(c) Accidental errors (compensating errors)
Lecture notes on Forest Mensuration by Bishnu P Devkota, Institute of Forestry, Pokhara, 2012 3

Bias It refers to the systematic errors that may result from faulty measurements
procedures, instrumental errors, flaws in the sampling procedure, errors in the computations, mistakes in recording and so on.
Common sources of bias Flaw in measurement instrument or tool, e.g. survey tape 50 cm short Flaw in the method of selecting a sample, e.g. some observers always count the
boundary trees while others always exclude it Flaw in the technique of estimating a parameter, e.g. stand volume: using a
volume function or model in a forest without prior check of its suitability for application in that forest; inappropriate assumptions about the formulae and
Subjectivity of operators etc.How to minimize bias
Continual check of instruments and assumptions Meticulous training Care in the use of instruments and application of methods
Accuracy Accuracy is the degree of perfection obtained. It is the closeness of a
measurement to the true value. It is the success of estimating the true value of a quantity It refers to the size of the deviation of a simple estimate from the true population The ultimate objective is to obtain accurate measurement.
Accuracy depends on Precise instruments Precise methods Good planning
Precision Precision is the degree of perfection used in the instruments, the methods and the
observations. It is the degree of agreement in a series of measurements. It is the closeness of a measurement to the average value It refers to the deviation of sample values about their mean. It is also used to describe the resolving power of a measuring instrument or the
smallest unit in observing a measurement. In this sense, the more decimal places used in a measurement, the more precise the measurement.
In sampling, accuracy refers to the size of the deviation of a sample estimate from the true population value. Precision, expressed as a standard deviation, refers to the deviation of sample values about their mean, which, if biased, does not correspond to the true population value. It is possible to have a very precise estimate in that the deviations from the sample mean are very small; yet at the same time, the estimate may not be accurate if it differs from the true value due to bias.
For example: One might carefully measure a tree diameter repeatedly to the nearest millimeter, with a caliper that reads about 5mm low. The results of this series of measurements are precise because there is little variation between readings, but they are biased and inaccurate because of faulty adjustment of the instrument. The relation between accuracy A, bias B, and precision P can be expressed as A2 =B2+P2. This means that if we reduce B2 to zero, accuracy equals precision
Lecture notes on Forest Mensuration by Bishnu P Devkota, Institute of Forestry, Pokhara, 2012 4

Figure 2: Precision, bias and accuracy of a target shooter. The target's bull's eye is analogous to the unknown true population parameter, and the hole represent parameter estimates based on different samples. The goal is accuracy, which is the precise, unbiased target (Adapted from Shiver and Borders, 1996).
Accuracy in Forest Mensuration Though mensuration is the branch of mathematics, forest mensuration does not attempt
to secure absolute accuracy. Forest mensuration aims at reasonable or relative accuracy, i.e. maximum accuracy
which is profitable and possible to obtain in practice. For the following reasons, foresters are compelled to be content with relative accuracy.
(a) Characteristics of trees(b) Varying methods and conditions of felling and conversion(c) Instruments and conditions in which they are used(d) Personal bias of the estimator(e) Biological character of the forest(f) The use to which the measurements are to be put(g) Cost
Lecture notes on Forest Mensuration by Bishnu P Devkota, Institute of Forestry, Pokhara, 2012 5

Unit-2: Measurement of Trees
2.1 Diameter Measurement A diameter is a straight line passing through the center of a circle or sphere and meeting
at each end of circumference or surface. The most common diameter measurements taken in forestry are of the main stem of
standing trees, cut portions of trees and branches. Diameter measurement is important because it is one of the directly measurable
dimensions from which tree cross sectional area and volume etc. can be computed. The point at which diameters are measured will vary with circumstances.
2.1.1 DBH measurement and its significance The most frequent tree measurement made by forester is diameter at breast height (dbh). DBH is defined as the average stem diameter outside bark, at a point 1.3 m above
ground as measured The rational of DBH measurement of individual trees is to estimate the quantity of
timber, fuel wood or any other forest products which can be obtained from them. These measurement are also necessary for making inventory of growing stock as well as
to correlate height, volume, age, increment with most easily determinable dimension i.e. dbh
DBH has been accepted as the standard height for diameter measurement because … It is a convenient height for taking measurement. It is economic (the base of the tree is generally covered with the grasses and shrubs and
even thorns sometimes). Majority of the trees develop root swell near the base (abnormalities at the base). It gives a uniform point of measurement and standardization is maintained.
2.1.2 Rules of DBH measurement and instruments used
Rules of DBH measurement Moss, creepers, lichens and loose bark found on the tree must be removed before
measuring the diameter over bark. Breast height (BH) should be by means of a measuring stick on standing trees at 1.3m
above the ground level.
BH point should be marked by intersecting vertical and horizontal lines 12 cm long, painted with white paint.
Lecture notes on Forest Mensuration by Bishnu P Devkota, Institute of Forestry, Pokhara, 2012 6
Figure3: Level ground
On sloping land, the diameter at BH should be measured on the uphill side.
In case of the tree is leaning, dbh is measured along the tree stem and not vertically, on the side of the lean for trees growing on flat ground and on the uphill side, for trees growing on sloping ground.
The dbh should not be measured at 1.3m if the stem is abnormal at the level. BH mark should be shifted up or down as little as possible to a more normal position of the stem and then dia. Measured.
BH should be taken at the lowest point above which the buttress formation is not likely to extend
Lecture notes on Forest Mensuration by Bishnu P Devkota, Institute of Forestry, Pokhara, 2012 7
Figure 4: Sloped groundFigure 5: Uneven ground
Figure 6: Leaning treeFigure 7: Crooked tree
Figure 8: Defect at 1.3m Figure 9: Buttressed tree

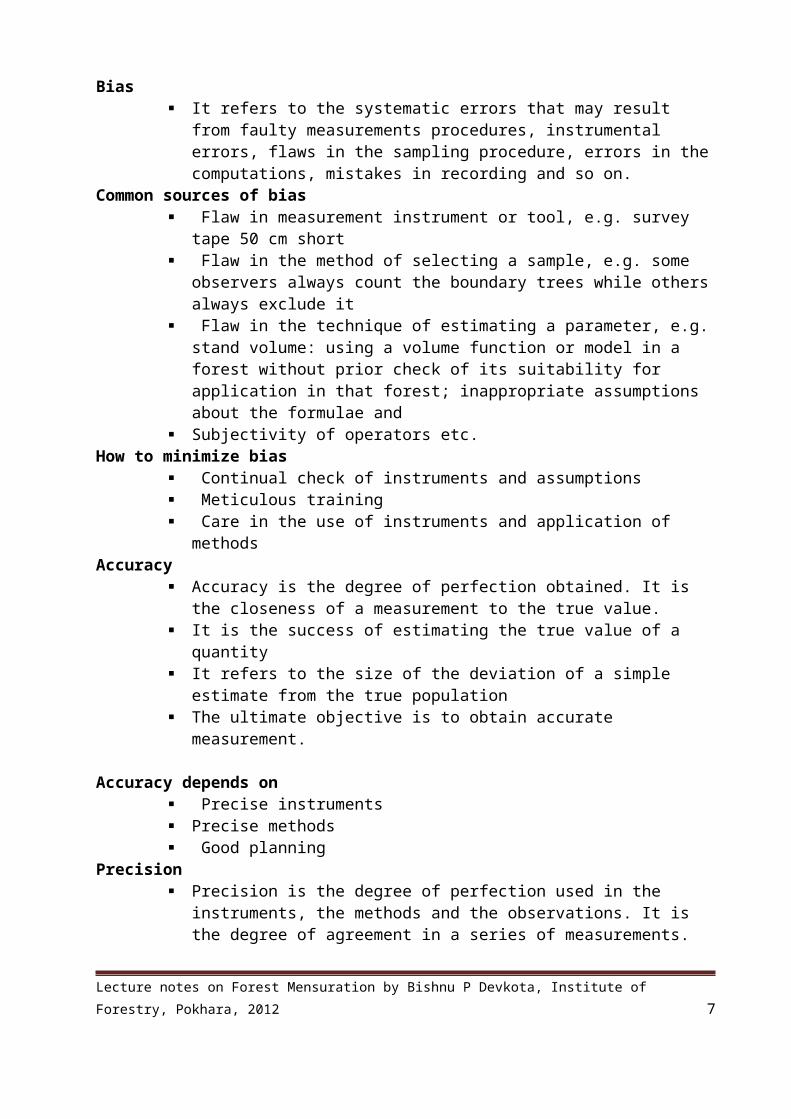
When the tree is forked above the BH, it is counted as one tree, but when it is forked below BH, each fork should be treated as though it were a separate tree.
Diameter measuring instruments The most commonly used instruments for measuring diameters at BH are: Diameter tape,
calipers, Biltmore stick and other optical instruments. Collectively, instruments employed in determining tree diameters are referred to as
dendrometers. Biltmore stick
It is a specially graduated stick used for diameter measurement. The stick measures a tangent to a circle, from a point, exactly 25 inches from the tree.
(The stick is graduated to show the diameter as if it were projected from the user’s eye into the tree.)
This specially graduated stick is placed against the tree trunk with the diameter scale facing the user. Keep your head 25 inches from the stick, and without moving your head, slide the stick so
Lecture notes on Forest Mensuration by Bishnu P Devkota, Institute of Forestry, Pokhara, 2012 8
Figure 10: Fork at 1.3 m (1 tree) Figure 11: Fork above 1.2 m (1 tree)
Figure 12: Fork below 1.3 m (2 trees) Figure13: Fork below 1.3m (2 trees: alternative method)
Figure 14: Measuring with a Biltmore stick
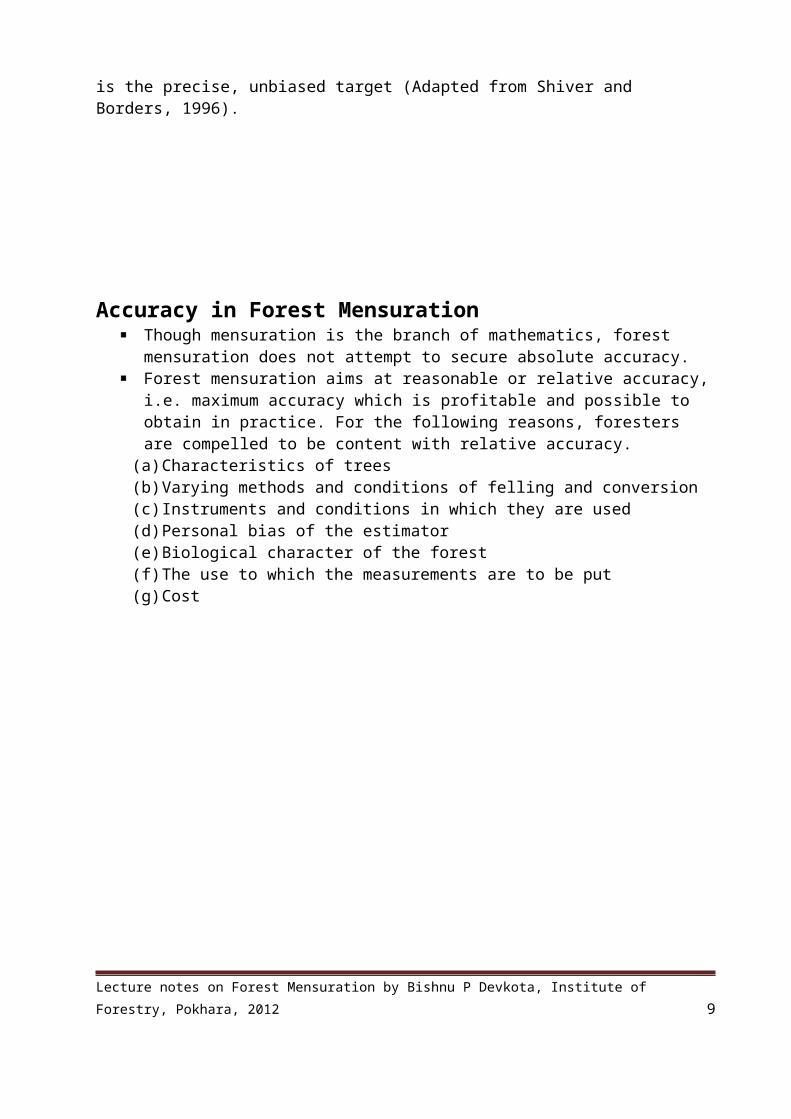
that the left edge of the stick appears to line up exactly with the left edge of the tree trunk.
Keep your head stationary, and move your eyes to read the number on the scale those lines up exactly with the right edge of the tree trunk. That number is a reasonable estimate of the diameter of the tree at breast height (DBH).
If the measurement of the right edge of the tree falls between two numbers on the scale, the lower number is used as the diameter.
The Biltmore stick tends to be inaccurate on large timber. Trees over 20 inches should be checked with a diameter tape.
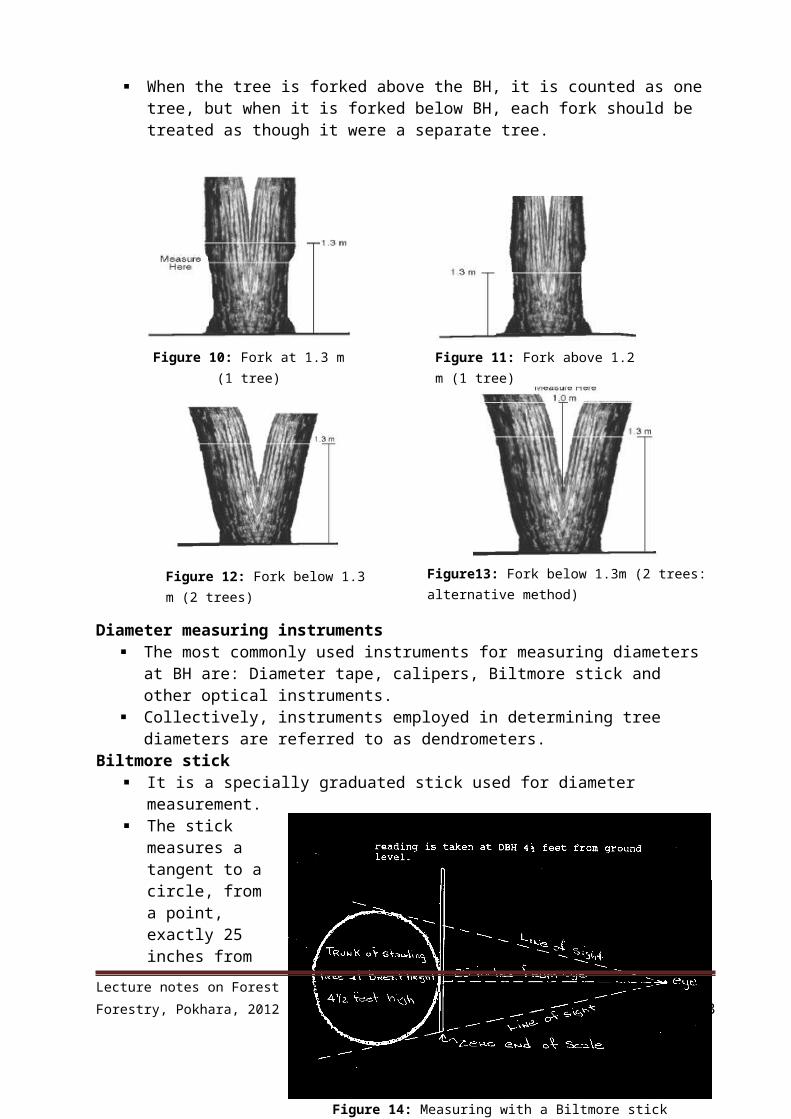
Diameter tape
The diameter of a tree cross section may be obtained with a flexible tape by measuring the circumference of the tree and dividing by π(D=C/ π).
The diameter tapes used by foresters, however are graduated at intervals of π units (in or cm), thus permitting a direct reading of diameter.
A diameter tape is a measuring tape that has scales on both sides: one side is specially marked to show the diameter of a tree, and the other is a normal scale.
Precautions in using tape The tape should not be old. It must lie flat against the tree and not in twisted manner. It must lie in a perpendicular to the axis of the tree. The tape should be taken care of.
Advantage of tape Tape is convenient to carry. It does not require constant adjustment. Only one measurement is needed even with irregular trees. Diameter measurement by tape is the easiest in the case of logs lying on ground. The errors in case of tape are always positive and systematic. Tape negotiates the whole circumference of the tree. Tape readings are more consistent.
Disadvantages of tape The tape exaggerates the diameter if the tree has rough bark. It is somewhat slower to particularly in areas with dense shrub growth.
Difference in tension of the tape due to elasticity affects true diameter.
Lecture notes on Forest Mensuration by Bishnu P Devkota, Institute of Forestry, Pokhara, 2012 9
Figure 15: Tape

Calipers
Calipers are often used to
measure tree dbh or when diameters are less than about 60 cm. A calipers may be constructed of metal, plastic or wood, consists of a graduated
beam/rule with two perpendicular arms. One arm is fixed at the origin of the scale and the other arm slides. When the beam is
pressed against the tree and the arms closed, the beam of the caliper can be read on the scale.
For an accurate reading, the beam of the caliper must be pressed against the tree with the beam perpendicular to the axis of the tree stem and the arms parallel and perpendicular to the beam.
Diameter measurement using calipers Place the calipers over the stem at the required height. Record the diameter then take another measurement at a right angle to the first and
record this measurement and Calculate the average of the two measurements and record to the nearest to 0.1cm.
Precautions in use The calipers must be placed on the tree with movable arm well opened and must not be
forced on the tree. The reading must be taken before the caliper is removed from tree. If the cross section of the stem is more or less elliptical, it is necessary to measure two
diameters. Calipers must be placed at right angles to the axis of the tree. The two arms of the caliper must be in contact with the tree and the movable arm should
be at right angles to the scale arm. Not only should the two arms of the caliper be in contact with the tree but the scale arm
must also touch it.
Advantages Diameters can be read directly in centimeters and millimeters, thus making the
instrument applicable for precise scientific work. By pressing the arms against the tree bole, the loose swollen bark is crushed out and
irregularity from this source is avoided. It is adaptable for use by unskilled labour. The errors are both positive and negative and therefore the chances are that they may
neutralize to give more accurate results than the tape.
Lecture notes on Forest Mensuration by Bishnu P Devkota, Institute of Forestry, Pokhara, 2012 10
Figure 16: Caliper

Disadvantages They are not accurate when not in adjustment. Calipers sufficient in size to measure large trees are very awkward to carry and handle. Two measurements have to be taken on every tree to get the correct diameter. Movable arms often stick when the scale is wet or dirty, thus wasting a lot of time.
2.2 Height Measurement Height is the linear distance of an object normal to the surface of the earth. Tree height is the vertical distance measured from the ground surface. Height of standing tree is measured to find out its volume. Height of selected trees in a
forest are also required to read volume tables, form factor tables, yield tables etc. Lastly, heights of trees are required to find out productive capacity of site. Height is
generally considered as an index of fertility and with the knowledge of age it gives a reliable measure of the site quality of a locality.
Total height of a standing tree is the distance along the axis of the tree stem between the ground and the tip of the tree.Bole height is the distance along the axis of tree between ground level and crown point. (crown point is the position of the first crown forming branch).Commercial bole height is the height of bole that is usually fit for utilization as timber.Height of standard timber bole is the height of the bole from the ground level up to the point where average diameter over bark is 20cm.Stump height is the distance between the ground and basal position on the main stem where a tree is cut.Crown length-The vertical measurement of the crown of the tree from the tip to the point half way between the lowest green branches forming green crown all round and the lowest green branch on the bole. Crown height - The height of the crown as a measured vertically from the ground level to the point half way between the lowest green the lowest green branches forming green crown all round.
2.2.1 Principles of height measurement Instruments used for measuring tree heights are collectively referred to as hypsometers. All height measuring instruments are based either on geometric principles of similar
triangles or on trigonometric principles based on relations between the sides of right angled triangle.
Lecture notes on Forest Mensuration by Bishnu P Devkota, Institute of Forestry, Pokhara, 2012 11
Figure 17: Tree height

2.2.1.1 Trigonometric principlesThe principles follow the basic rules of trigonometry for deriving heights of trees from distance and angle measurements. Two laws are applicable for this purpose and they are: tangent law and sine law. Instruments based on Trigonometrical principles are Brandis hypsometer, Abney’s level, Haga Altimeter, Topographical Abney’s level, Relaskop, Tele Relaskop, Barr and Stroud dendrometer, Blume-Leiss hypsometer
2.2.1.1.1 Tangent law Applicable to right angle triangle For accurate results, trees must not lean more than 5° from the vertical, and the fixed
horizontal distance must be determined by taped measurement.
2.2.1.1.2 Sine law Applicable to non right angle triangle is useful in deriving tree height in difficult
conditions. Sines of angles are proportional to the opposite sides.
2.2.1.2 Geometric principle of similar triangle Corresponding angles are equal and the corresponding sides are proportional. By knowing the two sides of a triangle and only one side of the other, the corresponding
second side of the latter can be found. Useful in rough estimation, not reliable for precise work. Eg. Christen’s hypsometer,
Smythies Hypsometer etc.
Lecture notes on Forest Mensuration by Bishnu P Devkota, Institute of Forestry, Pokhara, 2012 12
Method of height measurement Techniques for measuring tree height may be direct or indirect and essentially depend on
the position or fate of the tree: Felled trees - when the tree is on the ground, measurement of the linear distance from
base to tip or to the merchantable limit is done directly with linear tape or graduated pole.
Standing trees - height can be measured by either direct or indirect methods (see below). Indirect methods are most common because the tip or merchantable limit is often inaccessible.
Basic assumptions in measurement of standing trees: The tree is vertical and The tip and the base of the tree are simultaneously visible.
1. Direct methods Climbing with tape and graduated pole. An accurate approach, but practicable only with
some species under certain conditions. This technique is costly and dangerous and is normally restricted to experimental projects only.
Height sticks or rods. A reliable method, with an instrument error less than l%. However this method can also be expensive for trees in excess of about 20 m.
2. Indirect Methods (Non Instrumental methods and Instrumental methods)
Non instrumental methods
1. Shadow method: a pole of convenient length is fixed upright in the ground and its height above the ground is measured. The shadows of the pole and the tree are also measured.
2.
2. Single pole methodPole of about 1.5 m length vertically at arm’s length in one hand in such a way that portion of the pole above the hand is equal in length to the distance of the pole from eye.
AB/ab = EB/Eb i.e. AB = EB x ab/Eb Where, AB = tree, ac=pole about 1.5 m long, Eb=ab
Lecture notes on Forest Mensuration by Bishnu P Devkota, Institute of Forestry, Pokhara, 2012 13
Instrumental method By using instruments like hypsometer, clinometer, altimeters, abneys level etc. All these instruments are based either on geometric principle of similar triangles or on
trigonometric principles.
2.2.2 Measurement of height (vertical & leaning) tree in plane and slope areas
Measurement of height of trees on plane area The height of the tree is calculated with the help of the tangents of the angle to the top
and the distance of the observer from the tree.
AB = AD + BD = ED tanα + BD = BF tan α + EFWhere, AB = tree, EF = eye height of the observer, BF = horizontal distance
Measurement of height of trees on sloped area Where the observer is standing at such a place that the top of the tree is above the
eye level and the base below it.
AB = AD + DB = ED tan α + ED tan β = ED (tan α + tanβ) = EB Cosβ (tan α + tanβ)
Where top and base of the tree are above the eye level.
AB = AD-BD = ED tan α – ED tan β = ED (tanα-tan β) = EB cos β (tanα-tan β)
Where base and top of the tree are below the eye level
AB = BD – AD = ED tan β – ED tan α
= ED (tan β - tan α) = EB cos β (tan β - tan α)
Lecture notes on Forest Mensuration by Bishnu P Devkota, Institute of Forestry, Pokhara, 2012 14
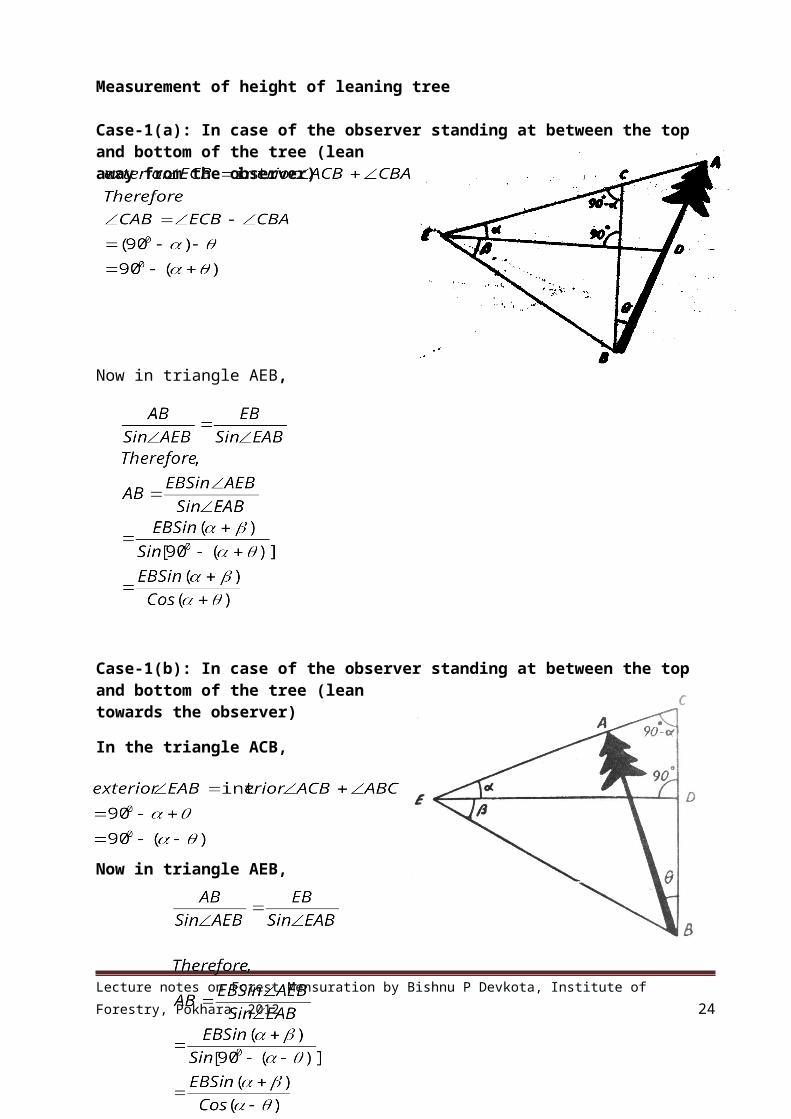
Measurement of height of leaning tree
Case-1(a): In case of the observer standing at between the top and bottom of the tree (lean away from the observer)
Now in triangle AEB,
Case-1(b): In case of the observer standing at between the top and bottom of the tree (lean towards the observer)
In the triangle ACB,
Now in triangle AEB,
Lecture notes on Forest Mensuration by Bishnu P Devkota, Institute of Forestry, Pokhara, 2012 15

Case-2(a): When the observer is below the top and bottom of the tree (lean away from the observer)
In the triangle ACB,
Now in triangle AEB,
Case-2(b): when the observer is below the top and bottom of the tree (lean towards the observer)
In the triangle ACB,
Now in triangle AEB,
Lecture notes on Forest Mensuration by Bishnu P Devkota, Institute of Forestry, Pokhara, 2012 16

Case-3(a): when the observer is above the top and bottom of the tree (lean away from the observer)
In the triangle ACB,
Now in triangle AEB,
Case-3(b): when the observer is above the top and bottom of the tree (lean is towards the observer)
In the triangle ACB,
Now in triangle AEB,
Lecture notes on Forest Mensuration by Bishnu P Devkota, Institute of Forestry, Pokhara, 2012 17

2.2.3 Instrument used in height measurement There are various instruments to measure height of the tree. Height measuring instruments are called hypsometer. Those instruments based on trigonometric principles are more accurate than the ones
employing geometric principles. The Abney’s level, Haga Altimeter, Blume-Leiss Altimeter and Sunto Clinometer are
similar in accuracy.a. Christen’s Hypsometer
It is based on the geometric relationships of similar triangles. Consists of a strip of metal, thin wood or card board about 2.5cm wide and 33 cm length. It has two flanges or protruding edges one at the top and other at the bottom. Each flange has a hole in it, the upper one to suspend the instrument by some thread
passing through it at and the lower one to suspend a weight from it to prevent it from swinging.
To use it, a pole (usually 5 or 10 ft long) is held upright against the base of the tree, or a mark is placed on the tree at a height of 5 or 10 ft above the ground.
The hypsometer is then held vertically at a distance from the eye such that the two inside edges of the flanges are in line with the top and base of the tree.
It may be necessary for the observer to move closer to or farther from the tree to accomplish this, but except for this, the distance from the tree is immaterial.
The graduation on the scale that is in line with the top of the pole, or the mark, gives the height of the tree.
The following proportion gives the formula for graduating the instrument.
For a given length of instrument A’B’ and a given pole length or mark height AC, the graduation A’C’ can be obtained by substituting different values of height AB in the equation.
Although the christen hypsometer may be used to measure any type of height, it is practical only for total height measurements.
A crowding of graduations at the bottom of the scale, makes the instrument unreliable for the determination of the height of tall trees.
Advantages It is light, easily made and easy to transport The height of the tree can be read directly. It is quicker to use and so it is useful in conditions where speed is required.
Disadvantages Extra care has to be taken to hold the top and bottom of the tree within the flanges while
reading the heights. It should be held in the true vertical plane It is not suitable for more than 30m tree height. It requires the use of staff. Skill is necessary to use the instrument with consistent accuracy.
b. Sunto clinometers
Lecture notes on Forest Mensuration by Bishnu P Devkota, Institute of Forestry, Pokhara, 2012 18
Figure18: Christen hypsometer

Hypsometers based on tangent of angles such as Abney’s level, Haga altimeter, the Blume-Leiss altimeter and the Sunto clinometers are used in height measurement of trees.
The sunto clinometer is a handheld device house in a corrosion-resistant aluminum body.
A jewel-bearing assembly supports the scale, and all moving parts are immersed in a damping liquid inside a hermetically sealed plastic capsule.
The liquid dampens undue scale vibrations.
The instrument is held to one eye and raised as lowered until the baseline is seen at the point of measurement.
At the same time, the position of the hairline on the scale gives the reading. Due to optical illusion, the hairline seems to continue outside the frame and can be
observed at the point of measurement. The instrument is available with several scale combinations: percent and degrees,
percent and topographic, degrees and topographic, and feet and meter. Hypsometers based on the tangents of angle are more accurate than those on similar
triangles. When used correctly, the Suunto Clinometer has an accuracy of about +/- 0.5 m for a
20 m tall tree (ie about 2.5%).Use
1. Measure the horizontal distance from the base of a vertical tree (or the position directly beneath the tree tip of a leaning tree) to a location where the required point on the tree (e.g. tree tip) can be seen.
2. Sight at the required point on the tree: Using one eye: Close one eye and simultaneously look through the Suunto at the scale
and 'beside' the Suunto at the tree. Judge where the horizontal line on the Suunto scale would cross the tree.
Both eyes: With one eye looking at the Suunto scale and the other looking at the tree, allow the images to appear to be superimposed on each other and read where the horizontal line on the Suunto scale crosses the tree. Note: If you suffer from astigmatism (a common situation where the eyes are not exactly parallel), use the one eye approach.
3. Read from the percent scale and multiply this percentage by the horizontal distance measured in step 1.
4. Site to the base of the tree and repeat steps 2 - 3.5. Combine the heights from steps 3 and 4 to determine total tree height:
– Add the 2 heights together if you looked up to the required point in step 2 and down to the base of the tree in step 4.
– Subtract the height to the base of the tree from the height to the required point if you are on sloping ground and had to look up to both the required point and the base of the tree.
6. Check all readings and calculations.c. Abney’s level
It is used to measure tree heights as well as land elevations.
Lecture notes on Forest Mensuration by Bishnu P Devkota, Institute of Forestry, Pokhara, 2012 19
Figure 19: Sunto clinometer

The instrument consists of a graduated arc mounted on a sighting tube about 6 inches long.
The arc may have a degree, percentage or topographic scale.
When the level bubble, which is attached to the instrument, is rotated while a sight is taken, a small mirror inside the tube makes it possible to observe when the bubble is horizontal.
The angle between the bubble tube and the sighting tube may be read on the arc.
The abney’s level, however, is slower to use, and large vertical angles are difficult to measure because of the effect of refraction on observations of the bubble through the tube beneath.
This makes the abney level difficult to use in tall timber that is so dense that the tops cannot be seen from a considerable distance.
When used correctly, the Abney Level has an accuracy of about +/- 0.5 m for a 20 m tall tree (ie about 2.5%).
Use 1. Measure the horizontal distance from the base of a vertical tree (or the position directly
beneath the tree tip of a leaning tree) to a location where the required point on the tree (e.g. tree tip) can be seen.
2. Sight at the required point and move the index arm over the scale until the bubble tube is level.
3. Read the percentage scale (or the degrees and minutes of the angle).4. Calculate the height by multiplying the percentage read by the horizontal distance (or by
multiplying the horizontal distance by Tan of the angle).5. Site to the base of the tree and repeat steps 2 - 4.6. Combine the heights from steps 4 and 5 to determine total tree height:
– Add the 2 heights together if you looked up to the required point in step 2 and down to the base of the tree in step 5.
– Subtract the height to the base of the tree from the height to the required point if you are on sloping ground and had to look up to both the required point and the base of the tree.
7. Check all readings and calculations.Advantages
It gives accurate angles of elevation and depression Reading can be taken after sighting the tree without distrubing the index. It is small and light and can be used even in hills without difficulty.
Disadvantages Shaking of the hand makes the sighting of the top or bottom of the tree a little difficult
and time consuming. The spirit level has to be adjusted by moving the head of the screw while simultaneously
looking to the top or bottom of the tree.
Lecture notes on Forest Mensuration by Bishnu P Devkota, Institute of Forestry, Pokhara, 2012 20
Figure 20: Abney's level

d. Haga altimeter It consists of a gravity-controlled, damped, pivoted pointer, and a series of scales on a
rotatable, hexagonal bar in a metal, pistol-shaped case.
The six regular American scales are 15, 20, 25, 30, percentage, and topographic scale.
Sights are taken through a gun-type peep sight; squeezing a trigger locks the indicator needle, and the observed reading is taken on the scale.
A range finder is available with this instrument.
When used correctly, the Blume Leiss has an accuracy of about +/- 0.5 m for a 20 m tall tree (ie about 2.5%).
Use1. Select a location, preferably 15, 20, 30 or
40 meters horizontal distance from the base of a vertical tree (or the position directly beneath the tree tip of a leaning tree) where the required point on the tree (e.g. tree tip) can be seen.
2. Select the appropriate distance scale on the rotating rod.3. Release the pointer by pressing the button on the side of the instrument.4. Sight at the required point on the tree, wait for a moment for the pointer to settle then
pull trigger.5. Read the height directly from the appropriate scale if you are 15, 20, 30, or 40 meters
away from the tree. If you were unable to find a position at one of these distances: – If the horizontal distance is a simple fraction of one of the scale distances (e.g. 10
m is half of 20 m), read from the scale distance and multiply by the appropriate fraction.
– Read from the percent scale and multiply this percentage by the horizontal distance measured in step 1.
6. Site to the base of the tree and repeat steps 3 - 5.7. Combine the heights from steps 5 and 6 to determine total tree height:
– Add the 2 heights together if you looked up to the required point in step 2 and down to the base of the tree in step 6.– Subtract the height to the base of the tree from the height to the required
point if you are on sloping ground and had to look up to both the required point and the base of the tree.
8. Check all readings and calculations.
Lecture notes on Forest Mensuration by Bishnu P Devkota, Institute of Forestry, Pokhara, 2012 21
Figure 21: Haga altimeter

e. Spiegel relaskop The Spiegel Relaskop, also known as a Relaskop, is a sophisticated instrument that can
be used to measure stand basal area and tree height and diameter at any point up a tree bole.
In conjunction with other equipment, the Relaskop can be used in the estimation of distance (range) to an object and the number of trees / ha.
The Relaskop has a peep-hole at the rear and a clear window at the front.
Three additional windows in the lower half of the instrument allow light to enter and illuminate the scale.
A brake button, bottom half at the front of the instrument, allows a weighted wheel within the Relaskop to rotate.
When looking through the peephole, a circular field of view is seen. The scales are seen in the bottom half of this field of view and scale readings are taken
where the scale touches the line halfway up the field of view. The standard metric Relaskop has three scales for measuring (vertical) height. The
appropriate scale will depend on the horizontal distance from the tree. – left-most scale - 20 m from the tree. – middle-left - 25 m from the tree. – middle-right - 30 m from the tree.
If you depress the brake button and look straight up or down, the appropriate distance values can be seen alongside their scales.
Select a point from where base and tip (or any other points of interest) must be clearly visible from the selected point.
Lecture notes on Forest Mensuration by Bishnu P Devkota, Institute of Forestry, Pokhara, 2012 22
Figure 22: Spiegel relaskop
Figure 23: Scales in Spiegel relaskop

f. Blume Leiss altimeter It is similar in construction and operation to the Haga altimeter, although its appearance
is somewhat different. The regular scales are 15,
20, 30 and 40. A degree scale is also provided.
All scales can be seen at a time. The instrument is available with a rangefinder.
When used correctly, the Blume Leiss has an accuracy of about +/- 0.5 m for a 20 m tall tree (ie about 2.5%).
Use 1. Select a location, preferably
15, 20, 30 or 40 meters horizontal distance from the base of a vertical tree (or the position directly beneath the tree tip of a leaning tree) where the required point on the tree (e.g. tree tip) can be seen.
2. Release the pointer by pressing the button on the side of the instrument.3. Sight at the required point on the tree, wait for a moment for the pointer to settle then
pull trigger.4. 4. Read the height directly from the appropriate scale if you are 15, 20, 30, or 40 meters
away from the tree. If you were unable to find a position at one of these distances: – If the horizontal distance is a simple fraction of one of the scale distances (e.g. 10
m is half of 20 m), read from the scale distance and multiply by the appropriate fraction.
– Read from the percent scale and multiply this percentage by the horizontal distance measured in step 1.
5. Site to the base of the tree and repeat steps 2 - 4. 6. Combine the heights from steps 4 and 5 to determine total tree height:
– Add the 2 heights together if you looked up to the required point in step 2 and down to the base of the tree in step 5.
– Subtract the height to the base of the tree from the height to the required point if you are on sloping ground and had to look up to both the required point and the base of the tree.
7. Check all readings and calculations
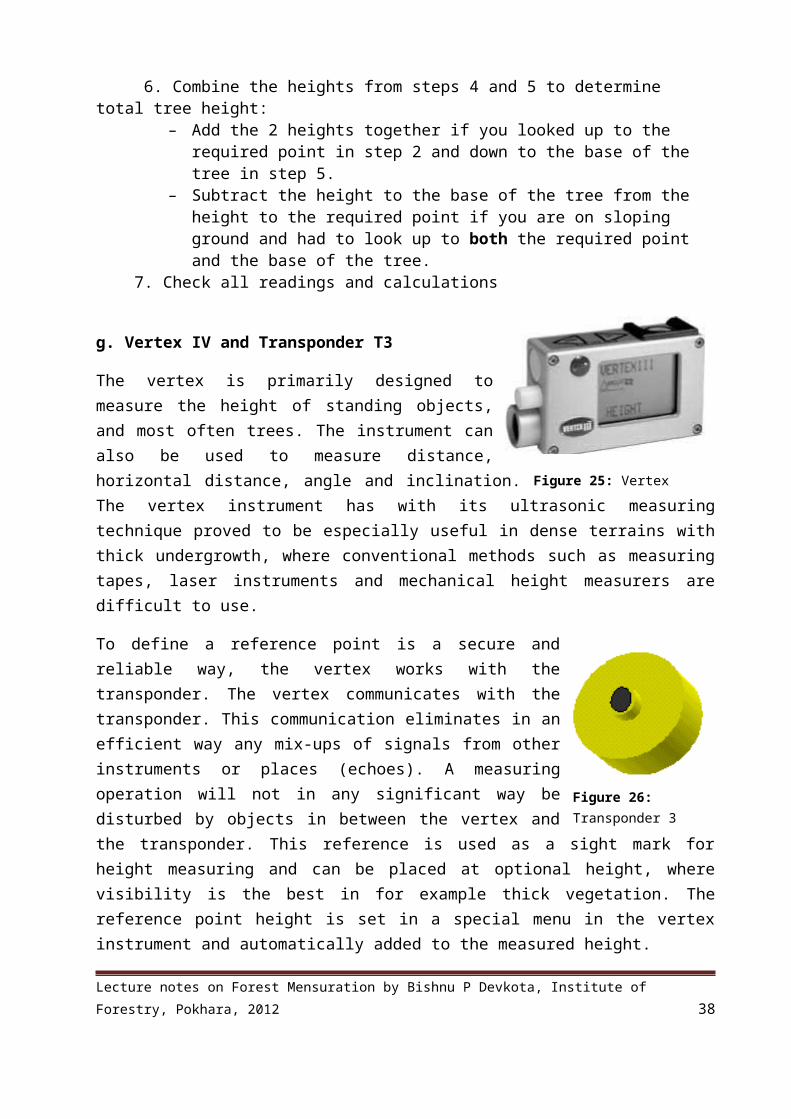
g. Vertex IV and Transponder T3
The vertex is primarily designed to measure the height of standing objects, and most often trees. The instrument can also be used to measure distance, horizontal distance, angle and inclination. The vertex instrument has with its ultrasonic measuring technique proved to be especially useful in dense terrains with thick undergrowth, where conventional methods such as measuring tapes, laser instruments and mechanical height measurers are difficult to use.
Lecture notes on Forest Mensuration by Bishnu P Devkota, Institute of Forestry, Pokhara, 2012 23
Figure 24: Blume leiss altimeter
Figure 25: Vertex
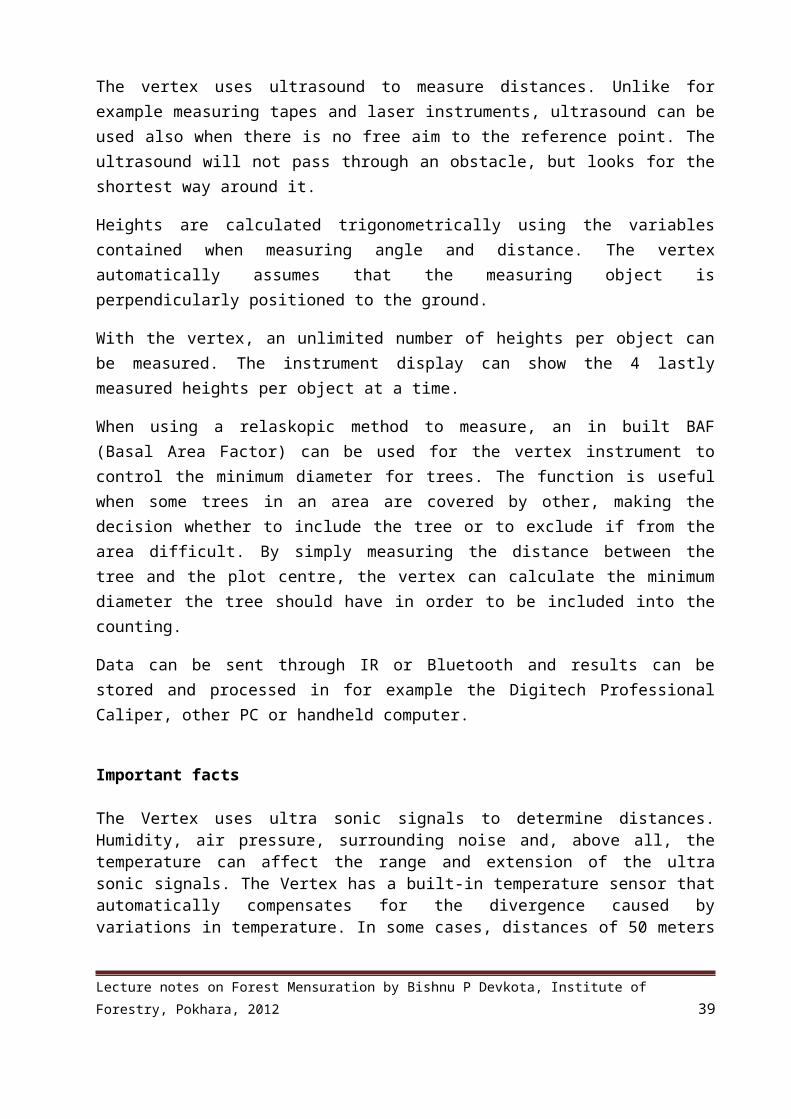
To define a reference point is a secure and reliable way, the vertex works with the transponder. The vertex communicates with the transponder. This communication eliminates in an efficient way any mix-ups of signals from other instruments or places (echoes). A measuring operation will not in any significant way be disturbed by objects in between the vertex and the transponder. This reference is used as a sight mark for height measuring and can be placed at optional height, where visibility is the best in for example thick vegetation. The reference point height is set in a special menu in the vertex instrument and automatically added to the measured height.
The vertex uses ultrasound to measure distances. Unlike for example measuring tapes and laser instruments, ultrasound can be used also when there is no free aim to the reference point. The ultrasound will not pass through an obstacle, but looks for the shortest way around it.
Heights are calculated trigonometrically using the variables contained when measuring angle and distance. The vertex automatically assumes that the measuring object is perpendicularly positioned to the ground.
With the vertex, an unlimited number of heights per object can be measured. The instrument display can show the 4 lastly measured heights per object at a time.
When using a relaskopic method to measure, an in built BAF (Basal Area Factor) can be used for the vertex instrument to control the minimum diameter for trees. The function is useful when some trees in an area are covered by other, making the decision whether to include the tree or to exclude if from the area difficult. By simply measuring the distance between the tree and the plot centre, the vertex can calculate the minimum diameter the tree should have in order to be included into the counting.
Data can be sent through IR or Bluetooth and results can be stored and processed in for example the Digitech Professional Caliper, other PC or handheld computer.
Important facts
The Vertex uses ultra sonic signals to determine distances. Humidity, air pressure, surrounding noise and, above all, the temperature can affect the range and extension of the ultra sonic signals. The Vertex has a built-in temperature sensor that automatically compensates for the divergence caused by variations in temperature. In some cases, distances of 50 meters and greater can be measured without problems, and in other cases, the maximum distance can be shorter than 30 meters.
To increase and optimize the measuring accuracy, calibration should be made regularly. When calibrating, it is of utmost importance that the instrument has been given enough time to stabilize at ambient temperature. If, for example, the instrument is carried in an inner pocket, it can take up to 10 minutes before it has adjusted to current outdoor temperature. The measurement inaccuracy pending on temperature is approximately 2 cm/C°.
Lecture notes on Forest Mensuration by Bishnu P Devkota, Institute of Forestry, Pokhara, 2012 24
Figure 26: Transponder 3

An example: Your inner pocket holds +15 C°. Outdoor air temperature is -5 C°. The measurement result will show 10,40 m and not the correct 10,00 m.
The measuring fault can be made permanent if the instrument is calibrated before reaching the correct current temperature.-Check your instrument daily and recalibrate if necessary-Do not touch the temperature sensor at the front of the instrument (the metal knobbetween the sight and the loudspeaker)-Never calibrate the instrument before it has reached ambient temperature
When measuring heights, it is important to hold the instrument as straight as possible.
The trigonometric functions calculate the height based on two (2) angles and one (1) distance. The distance can be measured manually with a tape, or automatically by using the Ttransponder. If using a tape, the distance has to be input in the Vertex before starting (angle-) and height measuring.
How to use the Vertex
HEIGHTHeight measuring can be performed in different ways depending on type of surroundings and operation. Heights, distance and angle can be transmitted via InfraRed (IR) to, for example the Digitech Professional Caliper or other computer device for storage/processing with IR or Bluetooth (Vertex IV BT model only) by pressing right arrow key. For height measuring 3 last measured heights with angle and distance can be transferred.
Height measuring with transponderStart the transponder and place it on/towards the object to measure. Note that the transponder should be placed at the T.HEIGHT /(transponder height) that has been set in the settings menu.Walk a suitable distance from the object – for optimal results the distance equals the approximate height.1. Press ON to start the Vertex and aim at the transponder. Keep pressing ON until the cross hair sight goes out momentarily. Now release ON. The Vertex has measured the distance, the angle and the horizontal distance to the transponder.2. Aim at the height to measure with the sight cross blinking. Press ON until the cross hair disappears. The first height is locked and displayed. Repeat until all heights on the object are measured.
Inclination (ANGLE)The Vertex is an excellent instrument to measure inclination and angles in the terrain.1. Press ON to start the Vertex and step with the arrow keys to ANGLE and press ON.2. The angle window is displayed. Aim at the point where you need to know the angle.Push and press the ON until the cross disappears. Read the obtained value in display.The angle is featured in Grads, degrees and percentage.Note that the angle is measured from the Vertex with the cross hair sight. This implies that it is not possible to use the outside of the Vertex to measure the angle of, for example a flat table surface.
Lecture notes on Forest Mensuration by Bishnu P Devkota, Institute of Forestry, Pokhara, 2012 25

Distance Measuring (DME)To measure the distance, press the DME key (left arrow key) when the vertex is turned off. The result, the distance between the vertex and the transponder, is presented in the vertex display.
Distance measuring with the adapter for 360 degreesWith the adapter, the ultrasound is spread and it is possible to measure from any direction. This is particularly useful when working in circular sample plots, where the distance from the plot centre to objects within a defined circle should be measured.
Horizontal distance measuring (DME)The vertex can be used as horizontal distance measurer (DME). The display text will rotate 900 to simplify reading the results when measuring horizontal distances.
1. Press ON to start the vertex and go with the arrow keys to ANGLE and push ON.2. Aim at the point where you need to know the angle. Push and press the ON until the Red
Cross goes out.3. To measure the distance, now push the left arrow key. The vertex presents the horizontal
distance in the display.
Basal Area FactorWorking in dense forest with relaskopes or prism can sometimes offer difficulties and accurate diameter estimation hard to make. When using relaskopic method to measure, an in built BAF function can be used for the Vertex instrument to control the minimum diameter for trees. The function is useful when some trees in an area covered by other, making the decision whether to include the tree or to exclude if from the area difficult. By simply measuring the distance between the tree and the plot centre, the vertex can calculate the minimum diameter the tree should have in order to be included in the counting. Basal area factors: 0.5, 1, 2, 3, 4, 5, 6, 7, 8, 9 (m2/ha)TransponderThe transponder is an ultrasonic transmitter/receiver that communicates with the vertex instrument. The transponder can be used both for direct measuring (600), and in 3600 when used with “360 adapter”- for example when working in circular sample plots. The transponder is equipped with an audible signal that tells if the transponder is activated or not. Transponder T3 has no switch and the vertex and /or DME is used as a remote control to turn off and on. When turned on, the transponder stays activated for app. 20 minutes. To measure in 3600 circle with the transponder, the T3 is attached to the adopter. The adapter spreads and receives the ultrasound in a full circle. The adapter can be mounted onto the custom plot center staff.
Lecture notes on Forest Mensuration by Bishnu P Devkota, Institute of Forestry, Pokhara, 2012 26
Figure27: Transponder with adapter

Special considerations in measuring tree heights It is difficult to measure accurately the height of large flat crowned trees. There is
tendency to overestimate their heights. The optimum viewing distance for any hypsometer is the distance along the slope equal
to the height to be measured. This rule of thumb should be used with discretion. Since all hypsometers assume that trees are vertical, tress leaning away from an observer
will be underestimated and trees leaning towards an observer will be overestimated. This error will be minimized if measurements are taken such that the lean is to the left or right of the observer.
The measurement of tree height with an accurate hypsometer is slow and expensive.
2.2.4 Sources of errors in height measurement Measuring the height of trees is time consuming and prone to errors. Experience has shown that when indirect methods are used to measure height,
measurement from two independent positions is essential. The readings from the two positions should agree within the limits of instrumental error
- this is an absolute check on instrument and operator error (sighted to correct tip, etc.). Thus, differences of up to 1 m in readings for a 40 m tree are acceptable - precision of
instruments under forest conditions is no better than this. The most common errors include:
The sources of the major errors in height measurement are:1. Failure to measure correctly the horizontal distance from the observer to the tree
If the distance from the observer to the tree is not measured horizontally, the observer will stand too near the tree, and the height will be overestimated by the direct reading on the instrument scale.
2. Wind swayWind causes tree tops to sway and this can be very serious hindrance in tree height measurement and cause serious errors. Accurate readings cannot be made in high winds. The errors may be reduced by averaging readings taken at the extremes of the sway towards and away from the observer.
3. Leaning treesIf the tree is leaning away from the observer, height will be under estimated and if the lean is towards the observer, height will be overestimated.
4. Non linearity of the relationship of tree height and angle of sight. The smaller the angle of the sight the easier it is to define the highest point in the crown; but the nearer the angle of sight to 450 the smaller is the error caused by an inaccurate reading of that angle. The best compromise between these two conflicting considerations is to select the observation point so that the angle of sight lies between 300 and 450, i.e the observer should stand between one and one-and-a-half times the tree height away from the tree. Angles greater than 450 must be avoided as the probability of mistaking a side branch for the top of the tree is unacceptably high.
5. Instrument error. All instruments should be checked periodically against some standard or known height and adjust as necessary.
6. Operator and recording error. - Personal error is always likely, e.g. – incorrect setting of distance or booking of angles and distances, incorrect reading;– forgetting to add on the section of tree below eye level or forgetting to sight to the
tree base; – Measuring to wrong tip - shaking the tree may help! – Difference of opinion amongst observers in nominating the tip of an umbrageous
crown.
Lecture notes on Forest Mensuration by Bishnu P Devkota, Institute of Forestry, Pokhara, 2012 27

2.3 Measurement of Logs and Fuel wood
Some terminologyBasal area: the area of a cross section of a stem at breast heightBillet: A piece of round wood about one meter in length usually cut for pulp or firewoodCull: the portion of a tree stem or log which is unmerchantable Log: The stem of a tree or a length of stem or branch after felling and trimming (BCFT)
2.3.1 Measurement of length, diameter and sectional area of logs The ultimate object of all mensuration activity in forest is to calculate or estimate
quantity of wood contained in trees and consequently in crops not only for sale but also for research, predicting future yields, estimating increment to assess return on capital etc.
Measurement of felled trees are to determine the quantity of merchantable volume to obtain statistical data that could be applied to standing trees for the purpose of estimation the yield, to estimate the growing stock and to estimate the increment of woods and forests.
Volume estimation may be made most accurately when the logs are separated and accessible to the measurer
A tree, therefore, could be separated into stem wood, which may be further divided into timber and small wood, crown and branch wood.
Stem wood may be measured after division into sections for obtaining real volume The measurement requires length and mid diameter or mid girth except where the tip is
measured as frustum of a cone where the diameter or girth at the ends is measured. Logs are neither cylinder nor often of any regular geometric shape. Therefore in order to
calculate the volume, the shape of a quadratic paraboloid is adopted. It is usual to cut the tree into logs due to irregularity in tree tapers. The length of the logs depends upon the rate of taper and market requirements. As the diameter at the thin end of the log determines the sawn volume that can be taken
out of it, the greater the rate of taper, the lesser is the length of the log. Another consideration that affects the length of log is the mode of transport When the logs are made for calculating volume of felled trees for research work, all logs
including the first are of uniformly 3m in length except the top end log which may be up to 4.5 m. But if the end section is more than 1.5m in length, it is left separate rate log.
Simple tape or a graduated rod can be used to measure the length of a given logs. Similarly, diameter tape, caliper and other optical instrument are used to measure the
diameter and sectional area of logs. Logs ate the round piece with square cut ends./Normally, a log is 6 or 8 ft over in length
and suitable for lumber. The cross sectional area or basal is found from the diameter as follows:
2.3.2 Formulae for log volume calculationWhen calculating volumes of logs and trees we normally assume that the sections are circular, or at least that diameters are such that the area of the section is πD2/4.It is customary in forest mensuration to take the shape of logs and trees as similar to certain solids of revolution, the cylinder, paraboloid, cone, or neiloid.
Lecture notes on Forest Mensuration by Bishnu P Devkota, Institute of Forestry, Pokhara, 2012 28

More generally, different parts from the tree resemble portions of these solids. The crown part, in conifers, tends to the cone form. The stem central part approaches a paraboloid. The base of the tree expands in a form similar to the neiloid, although generally values of n greater than 3 come closer.
A. Prismoidal or Newton’s formula
Where,
It is the best and accurate method for volume calculation It gives particularly the volume of frustum of Neiloid ( as well as other sections) It is only used to calculate the error in volume calculated by other formula It is difficult to apply particularly when the logs are stacked
B. Smalian’s formula
Where,
It gives the volume of frustum of paraboloid ( also cylinder) It over estimates the volume It is used when the logs are stacked or lying on the ground
C. Huber’s formula
It gives the volume of frustum of paraboloid ( also cylinder) It under estimates the volume It is difficult to apply particularly when the logs are stacked.
Lecture notes on Forest Mensuration by Bishnu P Devkota, Institute of Forestry, Pokhara, 2012 29

It is more easy and accurate than Smalian’s formulaD. Quarter Girth formula (Hoppus’s rule)
This is the system of measurement used in Great Britain and also in Nepal for sale purpose when round timber is sold by volume
This formula gives only 78.5% of the cubic volume of cylinders, thus allowing a loss of 21.5%
Volume of sawn timber I
t
is the simple product of three dimensions; length, breadth and height Volume of sawn timber varies according to its cross sectional size and length.
2.3.3 Volume of stacked timber Products such as firewood and pulp logs are frequently commercialized according to
their volume in piles or stacks. A stere metre is the volume of a stack of
1×1×1 metres (a cubic metre stacked), and it is used for firewood
This volume contains air space and wood in variable proportions according to the form of logs
Piling co-efficient has to be used to get the actual volume
Piling co-efficient= π/4=0.7854 if all piece of wood were cylindrical and of the same diameter
Due to edge effects the wood content can vary slightly with the stack dimensions, and much with the stacking method, so buyers and sellers usually establish specific norms on dimensions and stacking methods.
Other important factors in the solid content are the irregularity of the logs, the variability of the diameters, and the bark thickness.
Movement during transport can also introduce important changes.
Lecture notes on Forest Mensuration by Bishnu P Devkota, Institute of Forestry, Pokhara, 2012 30
Figure 28: Sawn timber
Figure 29: Stacked timber

2.3.4 Dimension and volume of chatta (stacked fuelwood)
Standard size of chatta= 5ft.*5ft. *20ft. = 500 cft including air space One chatta in metric unit= 14.16m3 The following formula should be used in order to calculate the amount of fuelwood that
is obtained from the total volume up to 10 cm top-diameter of class III and the remaining portions up to 10 cm top-diameter of class I and II trees which would not be used as timber.
Volume of chatta
All trees except Khair having dbh of 27.94 cm (11 inch) or above should be classified as below
Class I = Green, dead or dying, standing or uprooted tree having good and solid trunk in which sign of any disease or wound is not visible from outside
Class II = Green, dead or dying, standing or uprooted tree in which complete volume could not be realized due to hollowness or other sign of defect but at least two straight logs of each 1.83 m (6ft) long or one straight log of 30.5 m (10 ft) long which should have at least 20 cm diameter could be recovered.
Class III = Remaining trees which do not fall under class I and class II
Solid volume of fire wood The stacked volume is not the actual volume of firewood, it is only for the convenience
of paying the labour in the forest where there is no arrangement for weightage. Solid volume of firewood in a stock depends upon several factors such as care in
stacking, form of billets, length of billets and their diameter(i) Xylometric method
Lecture notes on Forest Mensuration by Bishnu P Devkota, Institute of Forestry, Pokhara, 2012 31
Figure 30: Chatta

Volume of billets calculated with the help of xylometer which consists of a graduated vessel
Volume of wood calculated by the principle of water displacement Water poured in vessel, reading taken, wood are submerged in water and reading taken
again. Difference between two reading gives the volume of submerged wood
For large quantities of wood
This method is cumbersome and seldom used in practice
(ii) Specific gravity method Specific gravity is a unitless measure of mass. If specific gravity of wood is known than volume can be calculated.
As density for pure water is 1 gm per cc, the density of wood in gm per cc is the same as its specific gravity minus the units.
Specific gravity typically varies from 0.35 to 0.81 for most commercial tree species
Lecture notes on Forest Mensuration by Bishnu P Devkota, Institute of Forestry, Pokhara, 2012 32

Unit-3: Measurement of Form
Tree Stem Form Form is the rate of taper of a log or stem It is the decrease in diameter of a stem of a tree or
of a log from base upward. The taper varies not only with species, age, site
and crop density but also in the different parts of the same tree.
The basal portion of the tree corresponds to the frustum of a neiloid, the middle portion to the frustum of a paraboloid, and the top portion to the cone
Trees often are combinations of form.
Metzger’s Theory or Girder Theory
Several theory put forward to explain variations in taper from tree to tree and in the same tree as well
Metzer’s theory assumes that the tree stem should be considered as a cantilever beam of uniform size against the bending force of the wind.
The wind pressure acts on the crown and is conveyed to the lower parts of the stem in an increasing measure with the increasing length of the bole.
Thus, the biggest pressure is exerted at the base and there is a danger of trees snapping at the place, to counteract this tendancy, the tree reinforces itself towards the base.
The pressure of wind crown keeps on changing as the tree is growing in open crowded portion.
Tapering increase if it is an isolated area, an area where largest density, in the area tapering decreases.
Though tapering is the natural process which can be controlled by human interference. If competition increases, tapering decreases.
Trees growing in complete isolation or exposed situation have short but rapidly tapering boles while the trees growing in dense crops, which are therefore subjected to lesser wind pressure, have long and nearly cylindrical boles. Mathematically,Let,p= a force applied to a cantilever beam at its free endl= the distance of a given cross section from the point of applications of this forced= the diameter of the beam at the points= the bending stress in kg/cm2
By the rule of mechanics,
Lecture notes on Forest Mensuration by Bishnu P Devkota, Institute of Forestry, Pokhara, 2012 33
Figure 31: Tree form

As the force p in case of trees consists of componentsW= wind pressure per unit area, F= crown area, than p=w*FThen,
For a given tree w, F, s can be considered as constant, therefore d3= kl, where k is a constant
Thus, the diameter raised to the third power increases proportionately with lengthening of the lever or with the increasing distance from the central point of application of wind force
According to this logic, the tree stem must have the shape of a cubic paraboloid.
Methods of studying form1. By comparisons of standard form ratios (form factor and form quotient)2. By classification of form on the basic of form ratios and3. By compilation of taper table
3.1 Form factor and its type Form factor is the ratio of the volume of a tree or its part to the volume of a cylinder
having the same length and cross section as the tree. It is the ratio between the volume of a tree to the product of basal area and height.
Types of form factor
1. Artificial form factor
Known as breast-height form factor Basal area or diameter measured at dbh and the volume refers to the whole tree both
above and below the point of measurement. It is not reliable guide to the tree form. Diameter measurement is fixed, but no fixed relation exists to the height of the tree and
portion above the breast height. Trees of same form but different heights will have different form factor. Universally used for its handy measurement and standardization of diameter at breast
height. A useful application is for quick-and-dirty volume estimates, assuming a constant form
factor.
Lecture notes on Forest Mensuration by Bishnu P Devkota, Institute of Forestry, Pokhara, 2012 34

2. Absolute form factor
It is the ratio between the volume of the tree above the point of diameter or basal area measurement with the cylinder which has the same basal area and whose height is equal to the height of the tree above that point.
Basal area is measured at any convenient height and the volume refers to that part of the tree above the point of measurement
3. Normal form factor
Basal area is measured at a constant proportion of the total height of the tree, e.g 1/10th , 1/20th etc. of the total height and the volume refers to the whole tree above ground level.
Disadvantages1. The height of tree to be determined before the point of measurement can be fixed.2. Point of measurement very inconvenient in case both very tall and short trees.
Absolute form factor and normal factor are no longer used. Unless stated, form factor implies artificial form factor whose basal area calculated at 1.3 m. The natural form factor corresponding to the total volume of a stem is generally between 0.3 and 0.6.
Uses of form factor1. To estimate volume of standing trees
Form factor compiled in tabular form to give average form factor of different dimensions by dbh and height classes.
Table used to estimate volume by measuring dbh and height. Table prepared from measuring large number of trees, so application to individual tree
not satisfactory, however used to estimate volume of group trees. Uses limited to similar growing conditions
2. To study laws of growth Gives insight to laws of growth, particularly to stem form of trees.
Kinds of form factorDepending upon volume represented, form factor may be of following kinds
1. Tree form factor2. Stem timber form factor3. Stem small wood form factor
Form HeightIt is the product of form factor and total height of the tree.
Volume is calculated from under bark measurements and the basal area is calculated from dbh (ob). Form height is used to determine how far is it reasonable to assume that volume is proportional to the basal area. If form height remains constant with increasing diameter, then it is clear that the assumption is justified.
Lecture notes on Forest Mensuration by Bishnu P Devkota, Institute of Forestry, Pokhara, 2012 35

3.2 Form quotient and its typeForm Quotient
It is the ratio between the mid-diameter and the dbh.
Taper depends upon form quotient (A. Schiffel)Types of form quotient
1. Normal form quotient Ratio of mid-diameter or mid-girth of a tree to its diameter or girth at breast height.
2. Absolute form quotient Ratio of diameter or girth of a stem at one half its heights above the breast height to the
diameter or girth at breast height.
Form quotient is the third independent variable of volume table that can be used to predict the volume of a tree stem.
Form Class Form class is defined as one of the intervals in which the range of form quotients of trees
is divided for classification and use. It also implies to the class of trees which fall into such an interval. Trees may be grouped into form classes expressed by form quotient intervals such as
0.50 to 0.55, 0.55 to 0.60 and so on or by mid-points of these intervals such as 0.525, 0.575 and so on.
Form Point Ratio It is defined as the point in the crown as which wind pressure is estimated to be cantered. Form point ratio is defined as the relationship, usually expressed as a percentage, of the
height of the form point above ground level to the total height of the tree. Form point ratio bears a consistent relation to the form quotient. If form point ratio is known, the form quotient and form class of a tree can be
determined.
3.3 Taper table and formulae It provides the actual form by diameters at fixed points from the base to the tip of a tree. Volume tables can thus be prepared from taper tables in desired unit.
Use of taper table1. Volume of the average tree for each diameter and height class can be found readily in
office without direct measurement. The only measurement that will be needed is the dbh (ob) and the height of standing tree.
2. Volume table can be prepared from taper tables in desired units.The ultimate purpose of all taper tables is to show upper stem diameters, which can then be used to calculate the volume of the sections of a tree and the entire tree. Taper tables can assume several forms.
Lecture notes on Forest Mensuration by Bishnu P Devkota, Institute of Forestry, Pokhara, 2012 36

Types of taper table1. Ordinary taper table or diameter taper table It gives the taper directly for diameter at breast- height without reference to the tree
form. 2. Form class taper table
This tables gives for different form classes the diameters at fixed points on the stem expressed as percentage of dbh (u.b)
General formulae or equations for tree form Taper equation represent the expected diameter as a function of height above ground,
total tree height and dbh irrespective of tree species and generalized for form class Many different forms of taper equations have been developed as no single one can
adequately represent all species in all situations. The use of taper equations allow us to obtain volumes for any desired portion of a tree stem by predicting upper stem diameters.
Hojer’s formulae It determines the diameter quotient (i.e the ratio of the diameter of a stem at any given
height to its breast-height diameter) for each form class It gives the percentage of the length of the tree between breast height and top
Behre’s formulae
This formulae is more consistentBark Measurement
The thickness of the bark and its percentage of volume in the tree or log are important parameters in mensuration because most measurements on standing trees have to be made on over bark.
Some species have very thick bark. In general, bark thickness varies with: species, age, genotype, rate of growth and position in the tree
The bark thickness of the living tree may be measured with little damage to the trees using a Swedish Bark Gauge
Lecture notes on Forest Mensuration by Bishnu P Devkota, Institute of Forestry, Pokhara, 2012 37
Unit-5: Forest sampling and Inventory
5.1 Definition and scope of sampling Sampling is the process in which enumeration is to be done only in a representative
portion of the whole. In Sampling, the information is obtained only from a part of the population assuming that
it is the representative of the whole. A part is studied and on that basis, the conclusion is drawn for the entire population.
For example, a forest area may be of 1000 ha out of which only 100 ha have been selected for enumeration and estimate of the whole population of 1000 ha is made, it is called sampling.
Sampling unit: The population is divided into suitable units for the purpose of sampling. Types of sampling units in forest surveys are:• Compartments, • topographical sections, • strips of a fixed width, • Plots of definite shape and size etc.
Sampling frame: The list of sampling units from which the sample units are to be selected is called sampling frame.
Sampling Intensity (SI): The ratio of sample to the whole population which is expressed on a percentageSI = sample area/Total area x 100
Size of the sampleThe number of sample units in the sample is known as sample size.Factors affecting the size of sample• Nature of population• Number of classes• Nature of Study• Types of sampling• Standard of accuracy/precision required, and• Other considerations
Scope of sampling• Less time• Reduced cost• Administrative convenience• Better supervision• Check result of census method• Suitable for infinite/hypothetical population• Suitable for destructing sampling
Limitations of samplingSampling is better over complete census only if• The sampling units are drawn in a scientific manner.
Lecture notes on Forest Mensuration by Bishnu P Devkota, Institute of Forestry, Pokhara, 2012 38
• Appropriate sampling technique is used, and • The sample size is adequate.
Sampling theory has its own limitations and problems, which are:• Proper care should be taken in the planning and execution of the sample survey;
otherwise the results obtained might be inaccurate and misleading• Sampling theory requires the services of trained and qualified personnel and
sophisticated equipment for its planning, execution and analysis. In the absence of these, the results of the sample survey are not reliable.
• If the information is required about each and every unit of the universe, there is no way but to resort to complete enumeration.
5.2 Types of samplingRandom and Non random SamplingProbability/random sampling• Simple random sampling• Stratified random sampling• Multistage sampling• Multiphase sampling• Sampling with varying probabilities
Non random sampling• Selective sampling• Systematic sampling
5.2.1 Simple Random Sampling• It is a selection process in which every possible combination of sample units has an equal
and independent chance of being selected in the sample. • Sampling units are chosen completely at random.• For theoretical considerations, SRS is the simplest form of sampling and is the basis for
many sampling methods. • It is most applicable for the initial survey in an investigation and for studies that involve
sampling from a small area where the sample size is relatively small.
Selection of SRS • Lottery Method and • Random number table method
When to use • If the population is more or less homogenous
with respect to the characteristics under study and • If the population is not widely spread
geographically.•• 16 samples are selected randomly from a
population composed of 256 square plots
Advantages• SRS is a scientific method and there is no
possibility of personal bias.• Estimation method are simple and easy.
Lecture notes on Forest Mensuration by Bishnu P Devkota, Institute of Forestry, Pokhara, 2012 39
Figure 32: Simple Random Sampling

Disadvantages• If the sample chosen is widely spread, takes more time and cost.• A population frame or list is needed.
5.2.2 Stratified Random Sampling It is a method of sampling in which the population is first divided into sub population of
called strata of same or different size in such a way that characteristics within the strata are homogenous but between the strata are heterogeneous.
Samples are taken from each stratum by randomly or other method regarding to optimum or proportional allocation methods.
Criteria of stratification of forest area• Topographic features, Forest types, Density classes• Volume classes, Age classes etc.
A. Proportional allocation• When information regarding the relative variances within strata and cost of operations
are not available, the allocation in the different strata may be made in proportion to the number of units in them or the total area of each stratum.
• Proportion to the area• Formula, ni = (Ni/N) x n
Where, N = total number of sampling units in the population/forests (total population), Ni
= the number of sampling units in the ith stratum (stratum size), ni = the no. of sample units, i = 1, 2, 3, …..k, k = the no. of strata and n = total sample size from all the strata.
• Larger size strata receive large size sample values.Example
Sample size(n)=30Total population size (N)=8000Strata size N1=4000, N2=2400, N3=1600Let Pi represent the proportion of population included in stratum i Then,For strata with N1=4000, we have P1=4000/8000Hence,n1=n*p1=30(4000/8000)=15Similarly,n2= n*p2=30(2400/8000)=9n3=n*p3=30(1600/8000)=6
B. Optimum Allocation Sample plots are allocated to various strata according to standard statistical
procedure resulting in smallest standard error possible with a fixed number of observations.
Determining numbers of plots to be assigned to each stratum requires first a product of the area and standard deviation of each type
Minimize the variance (i.e. maximize the precision) of the estimate
Lecture notes on Forest Mensuration by Bishnu P Devkota, Institute of Forestry, Pokhara, 2012 40

Other thing being equal, a larger sample may be taken from a stratum with a larger variance so that the variances of the estimates of strata means get reduced.
ni = n x NiSi/∑NiSi Where, Si = standard deviation of each stratum
ExampleSample size (n)=84Total population size (N)=10000Strata size N1=5000, N2=2000, N3=3000
When to use – when the sampling units are heterogeneous with respect to characteristics under study.
16 samples are selected randomly from a population composed of 256 square plots.Advantages• More representatives than SRS & systematic
sampling• Greater accuracy than SRS• Administrative convenienceDisadvantages• More time & cost • Sampling units for each stratum is necessary or separate frame is needed for each
stratum• Need prior & additional information about population & its subpopulation.
5.2. 3 Systematic sampling
• Systematic sampling is a commonly employed technique if the complete and up to date list of the sampling units is available.
Lecture notes on Forest Mensuration by Bishnu P Devkota, Institute of Forestry, Pokhara, 2012 41
Figure 33: Stratified random sampling

• In this sampling technique, first unit is chosen randomly and the rest being automatically selected according to some predetermined patterns.
• In this sampling, the sampling units are spaced at fixed intervals throughout the population.
• Measure of every ith tree along a certain compass bearing is an example of systematic sampling.
• A common sampling unit in forest surveys is a narrow strip at right angles to a base line and running completely across the forest, i.e. systematic sampling by strips.
• Another possibility is known is systematic line plot sampling where plots of fixed size and shape are taken at equal intervals along equally spaced parallel lines.
When to use- if the complete or up to date lists of the sampling units are available.
16 samples are selected systematically from a population composed of 256 square plots.
Advantages• The distribution of the selected sampling units
is controlled by designer and is regular.• Field teams understand the layout and can
usually identify and locate the units easily.• Qualitative and quantitative information over
the whole population can be collected at regular intervals during the survey
• The precision of the parameters estimated is usually high.
Disadvantages• No valid estimates of the precision are feasible unless the pattern of variation is known.• There is no rational method of choosing the sampling intensity and layout of sample to
achieve a desired precision at minimum cost
According to community forestry inventory guidelines,2061• Sampling Method Stratified systematic sampling • Sampling Intensity 0.1% (for regeneration and open land), 0.5 % (general forest) in community forest• Timber Volume Calculation Timber volume = π x d2/4 x ht. x ff x TQ Where, ff = form factor (0.5), TQ, first quality (by 2/3), second quality (1/2)Tree quality (TQ) • First quality- straight and clear bole, 3 or more logs with 6 feet length obtained.• Second quality- straight bole, 2 logs with 6 feet length obtained.• Third quality – crooked and abnormal bole and only fuel wood obtained.
Lecture notes on Forest Mensuration by Bishnu P Devkota, Institute of Forestry, Pokhara, 2012 42

5.3 Inventory5.3.1 Introduction and scope • Forest inventory is the procedure of obtaining information on the quantity and quality of
the forest resources and many of the characteristics of the land area on which the forest is located.
• Most forest inventories have been, and will continue to be, focused on timber estimation. Thus, Forest inventory is the tabulated, reliable and satisfactory tree information.
• However, the need for information on forest health, water, soils recreation, wildlife and scenic values, and other non timber values has stimulated the development of integrated or multi resource inventories.
• It is also called enumeration or cruise
An inventory of a forest area can provide information for many different purposes; it may be part of-• A natural resource survey with the aim of allocating land to different uses, i.e. land
planning• A natural project to assess the potential for forest and wood based industry development• A wood based industry feasibility study• A resource assessment for forest management planning• The usual purpose of a timber inventory is to determine the volume ( or value) of
standing trees in a given area. To attain this objective requires a reliable estimate of the forest area and measurement of all or an unbiased sample of trees within this area.
• The information may be obtained from measurement taken on the ground or on remotely sensed imagery (aerial photographs, satellite imagery etc.).
Types of inventory
Total enumeration (census): enumeration is carried out over the entire area of the forest unit under consideration. It is expensive and time consuming.
Partial enumeration: enumeration is to be done only in a representative portion of the whole forest.• The choice of a particular inventory system is governed by relative cost, size and density
of timber, area to be covered, precision desired, number of people available for fieldwork, and length of time allowed for the estimate.
• Regardless of the kind of inventory being under taken, a carefully developed plan is needed to execute the inventory efficiently.
• Many forest inventories are carried out using fixed area sample units. These fixed area sample units are called strips or plots, depending on their dimensions.
• Sample plots can be any shape (circular, square, rectangular or triangular), however, square/rectangular and circular plot shapes are most commonly employed.
A strip can be thought of as a rectangular plot whose length is many times its width.• Population – is an aggregate of objects under study.• Sample – a finite subset of the population selected from it for the purpose of the
study/investigation. • Sampling unit: The population is divided into suitable units for the purpose of sampling.
Types of sampling units in forest surveys are:
Lecture notes on Forest Mensuration by Bishnu P Devkota, Institute of Forestry, Pokhara, 2012 43

• Compartments, topographical sections, strips of a fixed width, plots of definite shape and size etc.
• Sampling frame: The list of sampling units from which the sample units are to be selected is called sampling frame.
• Sampling Intensity (SI): The ratio of sample to the whole population which is expressed on a percentage
SI = sample area/Total area x 100
Inventory planning• Purpose of the inventory• Background information• Description of area• Information required in final report• Inventory design• Procedures for interpretation of photo, satellite imagery, or other remote sensing material• Procedures for fieldwork• Compilation and calculation procedures• Final report• Maintenance
5.3.2 Strip system of cruising• With this system, sample areas take the form of continuous strips of uniform width
which are established through the forest at equally spaced intervals, such as 100m, 200m, or 300m etc.
• The sample strip itself is usually 20 m to 40 m wide. • Strips are commonly run straight through the tract in the north-south or east west
direction, preferably oriented to cross topography and drainage at right angles.• By this technique, all soil types and timber conditions from ridge top to valley floor are
theoretically interested to provide a representative sample.• Strip cruises are usually organized to sample a predetermined percentage of the forest
area.• Cruise intensity (I) = W/D x 100,Where, W =strip width and D = distance between strips
Advantages• Sampling is continuous and less time is wasted in
traveling between strips.• Strips have fewer bordering trees than plot cruise
of the same intensity.• With two persons working together, there is less
risk to personnel in remote or hazardous regions.
Disadvantages• Errors are easily incurred through inaccurate
estimation of strip width.• It is difficult to make spot checks of the cruise
results, because the strip centerline is rarely marked on the ground.• Brush and windfalls are more of a hindrance to the strip cruiser than to the plot cruiser.
Lecture notes on Forest Mensuration by Bishnu P Devkota, Institute of Forestry, Pokhara, 2012 44

5.3.3 Line-Plot system of cruising• Line plot cruising consists of a systematic tally of trees on a series of plots that are
arranged in a rectangular or square grid pattern. • Compass lines are established at uniform
spacing, and plots of equal area are located at predetermined intervals along these lines.
• Shape of the plots may be circular, rectangular, square or triangles. But circular plot is widely used.
• Sampling intensity (I) I = (no. of plots x area of plot)/ Total area x
100 • An intensity of plot sampling is governed by the
variability of the stand, allowable inventory costs, and desired standards of precision.
Advantages• The system is suitable for one person cruising.• Tree tally is separated for each plot, thus permitting quick summaries of data by timber
types, stand sizes or area condition classes.• Cruisers do not have to tally trees while following a compass line.• Cruiser gets some time, at each plot center to check stem dimensions, borderline trees,
and defective trees.
Disadvantages• It takes more time
5.3.4 Inventory with Point Sampling• Point sampling is a method of selecting trees to be tallied on the basis of their sizes rather
than by their frequency of occurrence. • It has been found that counting from a random point, the no. of trees whose breast-height
cross-section exceeds a certain critical angle when multiplied by a factor gives an unbiased estimate of basal area/ha.
• This technique is called : angle count cruising, Point Sampling, variable plot cruising, PPS (Probability proportional to size) sampling.
• Sample points are located within a forested tract, and a simple prism or angle gauge that subtends a fixed angle of view is used to sight in each tree diameter at breast height.
• Tree boles close enough to the observation point to completely fill the fixed sighting angle are tallied; stem to small or too far away are ignored. The resulting tree tally may be used to compute basal area, volumes, or numbers of trees per unit area.
• Point sampling can be either horizontal (For basal area estimation) or vertical (For ht. estimation)
• horizontal sampling has been widely used• The probability of tallying a given tree depends on its cross-sectional area and the
sighting angle used. The smaller the angle, the more stems will be included in the sample.
• PS does not require direct measurements of either plot areas or tree diameters. A predetermined basal area factor (BAF) is established in advance of sampling and resulting tree tallies can be easily converted to basal area per unit area.
Lecture notes on Forest Mensuration by Bishnu P Devkota, Institute of Forestry, Pokhara, 2012 45

• BA conversion factors are dependent or the sighting angle (or critical angle) arbitrarily selected.
Horizontal point sampling• In horizontal point sampling, a series of sampling points are selected randomly or
systematically distributed over the entire area to be inventoried. • Trees around this point are viewed through any angle –gauge at breast height and all
trees forming an angle bigger than the critical angle of instruments are counted.• Even though all trees are of same basal area, some are counted while others are not
because of being far away from sampling points and they do not form an angle bigger than critical angle.
• Inclusion of trees in tally for a given angle depends upon (i) sizes of trees (ii) their distance from the sampling point.
• Basal area per ha = BAF x number of tally trees/ numbers of points
• Number of trees/ha = (no. of trees tallied) x (per-ha conversion factor)/ total numbers of points (per-ha conversion factor= BAF/BA per tree)
• Volume/h = basal area x stand form height
Instruments used in horizontal point sampling
• Angle gauge• Wedge prism• Spiegel Relaskop • Tele Relaskop
Lecture notes on Forest Mensuration by Bishnu P Devkota, Institute of Forestry, Pokhara, 2012 46

Choice of instruments• When steep slopes are regularly encountered, the Spiegel Relaskop is preferred • For relatively flat topography, either the wedge prism or the stick gauge may be used.• The prism is primarily desirable for persons who wear eyeglasses.• The simple stick gauge is preferred in dense stand.
Intensity of point sampling• There is no fixed plot size when using point sampling.• Each tree has its own imaginary plot radius (depending on the BAF used), and the exact
plot size can not be easily determined, even after the tally has been made. • However, approximations can be made on the basis of the average stem diameter
encountered at a given point. • From the a statistical point view, however, the selection of trees according to size rather
than frequency may more than offset this reduction of sample size and with an additional saving in time.
• Conversely, it must be remembered that smaller samples of any kind require larger expansion factors.
• Thus, when point sampling is adopted, the so-called borderline trees must always be closely checked.
• The only accurate method of determining how many sample points should be measured is to determine the standard deviation (or coefficient of variation) of BA or volume per ha from a preliminary field sample.
If the statistical approach is not feasible, the following rules of thumb will often provide acceptable results:• If the BAF is selected according to tree size so that an average of 5 or 12 trees are
counted as each point, use the same number of points.• With a BAF 10 angle gauge and timber that averages 12 or 15 in. in diameter, use the
same number of points.• For reliable estimates, never use fewer than 30 points in natural timber stands or less
than 20 points in even-aged plantations.
Advantages• It is not necessary to establish a fixed plot boundary; thus greater cruising speed is
possible.• Large high value trees are sampled in greater proportions than smaller stems.• BA and volume per ha may be derived without direct measurement of stems.• When volume per ha conversions are developed in advance of fieldwork, efficient
volume determinations can be made in a minimum of time. Thus the method is particularly suited to quick, reconnaissance type cruises.
Disadvantages
• Heavy underbrush reduces sighting visibility and cruising efficiency.• Because of the relatively small sized of sampling units, carelessness and errors in the
tally (when expanded to tract totals) are likely to more serious than in plot cruising.• Slope compensation causes difficulties that may result in large errors unless special care
is exercised.
Lecture notes on Forest Mensuration by Bishnu P Devkota, Institute of Forestry, Pokhara, 2012 47

• Unless taken into account, problems can arise in edge-effect bias when sampling very small tracts or long, narrow tracts.
Vertical Point sampling
• A method for deriving the mean stand height• Within a full 360 degree sweep around the sample point all trees appearing taller than a
critical angle are counted.• Instrument used – Conimeter • This instrument subtends a critical angle of 45 degree.• By using Conimeter, if the number of trees per ha
is N, then number of tree counted (n) in the area can be counted from the Conimeter.
• The average height of the trees (h) in meter (when the critical angle is 45 degree) is
For crop height, the height at which the instrument is kept will require to be added.
5.3.5 Inventory of important NTFP found in Terai, Mid-hills and High Mountain, in each locality
1. Introduction Non –Timber Forest Products (NTFP) can be defined as all goods derived from forests of both plant and animal origin other than timber and firewood. Non-Wood forest products consist of goods of biological origin other than wood, derived from forests, other wooded land and trees outside forests (FAO 1999). Mallet (1999) defined NTFP as all products, with the exception of timber, that can be harvested from a forest ecosystem.
Resource assessment is an evaluation of some aspect of the resource based on information gathered from a variety of sources. It can include socio-economic issues, market issues, or the quantity and quality of the resource (FAO 2001)Inventory is an itemized list of current assets (finished goods, components or raw material on hand) (Lund 1997). This may or may not include the quantity or other characteristics of the assests. Forest inventory is a sample-based survey of the forest resource (Burkhart & Gregoire 1994), the intention being to quantify the abundance of biological resources in the forest. The species lists are a subset of an inventory of biodiversity. Thus, a listing of all plants and animals in a forest is not a NTFP assessment but a biodiversity inventory. NTFPs are a sub-set of diversity that has utility to humans. Therefore the first step in the assessment of NTFPs has to be the identification of a plant or animal whole or part that is collected for some particular use.
Lecture notes on Forest Mensuration by Bishnu P Devkota, Institute of Forestry, Pokhara, 2012 48

It is agreed that the objective of NTFP assessments is to collect information about the distribution, frequency and seasonality of NTFP so that plans can be made for the sustainable management and utilization of the NTFPs for the improvement of human welfare. It is important to determine, prior to the assessment, for whom is the information being collected-who are the beneficiaries/clients. It is also important to determine that the policies and regulations governing the ownership, management and utilization of NTFPs are conducive to supporting farmers and the rural community and hence the local economy. There is no single technique for assessing NTFPs, because of the variety of products. The appropriate methods therefore depend on the objectives of the inventory. The following considerations are important.
The intended use of the inventory: The purpose may be to identify a management plan for an area, or it may be the conservation of an endangered species, or the development of specific products for marketing and processing.
Spatial scale: Inventories may be done at a local, district, national or regional scale, depending on their objectives. Local-level inventories are usually management or market oriented, while regional inventories are usually for planning or policy formulation.
Forest inventories are usual oriented towards specific products-most commonly timber, but increasingly also for some non-timber forest products such as bamboo, medicinal herbs and fruits. The incorporation of many different products in one inventory is complicated by differences in species phenology, scale and spatial distribution. Inventories of non-timber forest products can be purely to determine the quantity of the product available or to determine the quantity used. The latter involves market studies and the flow of products, which can be age or size dependent. In many cases the biophysical resource inventory would focus on individual products (e.g., bark, fruits), while a socioeconomic flow inventory would concentrate on types of product usage (e.g., food, medicines, gums). The need for an established methodology for NTFP inventory was recognised by a Working Group at an FAO meeting on NTFPs (FAO 1996) which attempted to define a standard for assessing NTFPs. However, the Group concluded that it is ‘virtually impossible and therefore perhaps futile to search for a generalised technique for NTFP resource assessment’ because of major differences in:
• intended use of the survey results,• the groups of NTFPs to be included,• spatial scale, and• temporal scale.
To this list the resources available for the inventory in terms of technologies, skill levels and finances should be added. Despite these complexities inventory is done for the sustainable harvesting of NTFPs, monitoring the state of resources, considering promotion of resource based industries and informing conservation of endangered species. Though the inventory methods of NTFP are different, however they follow a basic strategy for managing on a sustained yield basis (Wong 2000).
Lecture notes on Forest Mensuration by Bishnu P Devkota, Institute of Forestry, Pokhara, 2012 49

Figure: Flow chart of a basic strategy for managing NTFPs on a sustained-yield basis
(After Peters 1994)
2. Inventory methods for NTFPs
For biologically sustainable exploitation of the products to be determined, there must be a minimum set of good information available on the resource species condition, abundance, distribution and reproductive biology. Resource assessment can be done either qualitatively or quantitatively. In qualitative assessment, based on the ocular judgment/estimation condition of the resource is assessed as abundant, moderate or poor.Campbell (1989) describes quantitative ecological inventory as ‘enumeration of individuals and species of trees in a small patch of forest, the measurement of several important parameters of those individuals and the analysis of the abundance and distribution of those individuals as functions of their physical and biotic environments’. This is subtly different from the foresters definition of ‘a sample-based survey of the forest resource’ (Burkhart & Gregoire 1994) because of the emphasis on ecology in the former and on sample based observations in the latter. For the purposes of this study quantitative inventory is defined as a biometrically rigorous enumeration of the abundance and distribution of resource populations.
Since NTFPs can be plants or animals it is necessary to review methodologies for each. Although, at first glance these look very different they have the same underlying structure. This structure is envisaged as a hierarchy of design features. At the highest/largest level is the sampling design itself, whether the plots are to be located using random or systematic, stratified or uniform layouts etc. The next level down is the
Lecture notes on Forest Mensuration by Bishnu P Devkota, Institute of Forestry, Pokhara, 2012 50

plot scale at which decisions about plot dimensions have to be made. Conventionally, the term plot is taken as meaning a measured area on the ground. However, observations at a point are area-less and therefore one-dimensional, also timed observations (e.g. for bird calls) are defined in terms of time rather than area. ‘Plot’ should therefore be understood to be any observational unit for enumerating the target species at the local scale (i.e. over metres and hours). Within each plot the enumeration that is undertaken is dependent on the target and product being investigated.
The status of NTFPs in an inventory largely determines how closely methodology is adapted to the peculiarities of the target species and products and the level of resources available. Single resource studies should be best placed to undertake methodological development of specific protocols for assessment of enumeration, this seldom happens. Inclusion of NTFPs into multipurpose resource inventories places very severe constraints on NTFP methodology though there are opportunities which often are not utilised. Methodological studies of optimal inventory design for a range of plant NTFPs are rare. In contrast, methodology for animal inventory is already well developed and requires application rather than further methodological work (Bibby & Moss 1998: Cited in Wong 2000). For the purposes of this study, three contextual settings for NTFP inventory are distinguished. These are single resource, single purpose multiple resource and multi-purpose resource inventories. The distinction between these is the focus of the inventory and the extent to which protocols can be tailored to specifics of the NTFPs in question. Single resource studies are focused exclusively on a particular product and provide the best opportunity for development of tailored protocols and should set the standards for NTFP studies. Single-purpose multi-resource inventories are generally designed to provide management information on NTFPs for a defined area and have as their focus the potential of the land in terms of the species and quantities of NTFPs present and they use land-centric methodology, and differ from multipurpose inventory in that they are undertaken by one institution within the context of a management structure. Multi-purpose resource inventories (MRI) are often multi-institutional and NTFPs are often a small component of the inventory and consequently the development of protocols is heavily constrained by the need to compromise with the needs of other elements of the inventory.
2.1.1 Single resource inventoryThe objective of a single resource inventory is the quantification of the abundance and distribution of a single product. Such an inventory is unfettered by considerations of other products or purposes and one would expect methodology to be closely tailored to the characteristics of the species from which the product is derived. However, there are very few single product studies that have quantification of the insitu resource as an objective. This could be because a NTFP has to be either very valuable, or subject to legislation for it to justify a species-specific inventory. Therefore most species specific studies have been done for species that are traditionally important for export such as rattan. Although there are few true inventories for single species there are a number of studies that use inventory methodology to address resource related questions and it is these which are examined here.Six reasons for undertaking a single resource inventory which are (Wong 2000):1. To provide knowledge of the effects of exploitation of a species for which no other
work has been done2. To assess the potential of particular products for which increased commercialization
is sought at either the national or local level
Lecture notes on Forest Mensuration by Bishnu P Devkota, Institute of Forestry, Pokhara, 2012 51

3. To assess the potential of a specific area for exploitation of a known commercial product
4. To investigate the spatial distribution of an exploited product5. To provide supporting data for the determination of quotas, this is required for
several products under national legislation or international treaty 6. For academic inquiry e.g. historical understanding of role of wild yams in historical
human diet (Hladick & Dounias 1993, Cited in Wong 2000).2.1.2 Single purpose multi-resource inventory
The single purpose inventories are intended to provide quantitative information for the purpose of management planning. As such they are area based and attempt to record the presence and abundance of a range of species that occur on a particular portion of land. In selection timber management the forest is divided into compartments (~ 100 ha – 1 km²). Immediately before logging the compartment is subjected to a stock survey which involves the location, identification, numbering and measurement of every timber tree in the compartment. Yield formulae are used to determine the sustainable yield of timber from the compartment based on the stock survey data. Trees are selected from the stock survey map to make up the allocated yield according to rules designed to protect the environment and the future potential of the forest. Stock survey protocols are generally 100% surveys with the area covered by consecutive enumeration strips. The integration of NTFPs into conventional forest management has resulted in attempts to incorporate NTFPs in timber stock surveys. For example, in Belize, Smith (1995) experimented with a 10% random sample of 1 ha stock survey blocks for a range of products including thatch, edible nuts, palm heart, chicle, incense resin, all spice and decorative epiphytes (Orchids and Bromeliads). Although it is difficult, in the absence of any data to make a judgment of this methodology, it would seem to be a sound and pragmatic means of discovering the distribution, abundance and NTFP management potential of the area to be logged. The only disadvantage is that non-tree NTFPs may be adversely affected by logging and consequently not be available after logging and the stock surveys would need to be complemented by species specific studies to determine optimal sustainable harvesting strategies for each species. This information could then be used to develop management plans for all resources available in each compartment. Detailed information on a range of resources including timber, other plant products and bushmeat has been acquired by the Adwenaase and Namtee communities using techniques derived from those used for timber stock survey (Gronow & Safo 1996, Cited in Wong 2000). A trial of a method designed to permit quantification of key plant resources to support National Park management planning was undertaken in the Bwindi Impenetrable National Park in Uganda (Cunningham 1996a). The design is based on a few small sample plots and uses basic forestry techniques to enumerate the number and size distributions of trees and bamboo. This methodology is intended to provide information to support management decisions but the small number of replicates leads to imprecision and incomplete coverage leads to bias and inaccuracy suggesting that the information is not adequate for detailed planning and is best used as a guide for strategic planning.
2.1.3 Multi-purpose resource inventoryMany resource assessments for NTFPs take place as a component of a multi-purpose resource inventory (MRI). MRIs have been defined as ‘data collection efforts designed to meet all or part of the information requirements for two or more products, functions (such as timber management and watershed protection) or sectors (such as forestry and agriculture)’ (Lund 1998b). NTFPs originate from forests which generally fall under the
Lecture notes on Forest Mensuration by Bishnu P Devkota, Institute of Forestry, Pokhara, 2012 52
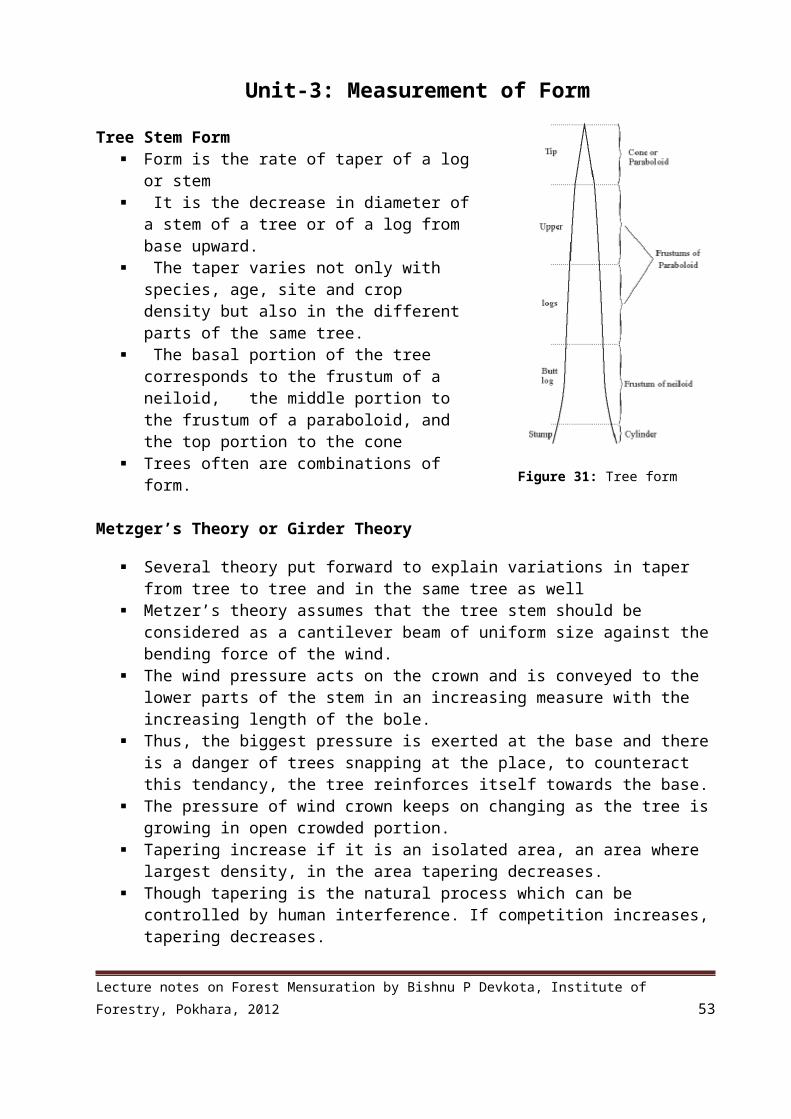
jurisdiction of a state forest authority which often have statutory responsibility for maintaining up-to-date forest resource data. Once the forest authority has accepted a responsibility for specific NTFPs they are generally included in routine resource inventory and monitoring. For example, the US Forest Service now includes special forest products as part of forest resource plans in accordance with the National Forest Management Act, the National Environmental Policy Act etc. (Molina et al.1993: Cited in Wong 2000). In addition, Lund (1998a) lists further national scale MRI with NTFPs for the Russian Federation. In northern and eastern Europe NTFPs in the form of berries and mushrooms have been recognised and included in recurrent inventory (statutory national inventories usually based around compartments undertaken every 10 years) for almost a hundred years. In Russia industrial scale interest in NTFPs led to the development of a journal (Plant Resources Journal established in 1967) and technical committee (Committee of Wild Berry Research established in 1975) dedicated to plant resources (Rutkauskas 1998: Cited Wong 2000). Rabindranath and Premnath (1997) suggested basically two methods of NTFP assessment based on source of information obtained.
2.2.1 Tapping local knowledge Local people are knowledgeable and can provide information of the species identification, species location, different use and changes in the vegetation pattern. The medium for obtaining such information includes:
Interview Rural people are the source of information regarding the use, distribution and harvesting of NTFPs, their personal knowledge can be explored through interview to give an overview of the resources. Alexiades (1996) defines four types of interview.
Informal interview: A completely informal interaction between two or more people. The researcher might take notes during or after the ‘interview’.
Unstructured interview: A discussion where one person is gathering information from another on a particular topic but no specific or guiding questions are used after the initial enquiry (e.g. ‘tell me about the plants in the forest’). The informant(s) is aware that it is an interview but the choice of topics to discuss and the direction of the conversation are mostly controlled by the informant.
Semi-structured interview: The interviewer has a list of open ended questions or topics to discuss (usually 6-10 key questions). The amount of information provided on a topic is largely controlled by the informant and the interviewer is free to follow leads. This type of interview is generally used once specific research topics have been identified.
Structured interview: The interviewer has a fixed length questionnaire. Questions are not open ended but have a limited range of possible responses. Understanding what would be a locally meaningful question is a pre-requisite to designing a questionnaire form. This is because inappropriate closed questions will invariably introduce interviewer bias. Formal surveys are generally used to obtain quantitative information regarding a problem. Nichols (1991) states that ‘In order to design a good structured interview survey, you need a full knowledge of the problem you are studying. This in itself limits their use. In a new area one needs methods that are more suitable for exploratory.
Lecture notes on Forest Mensuration by Bishnu P Devkota, Institute of Forestry, Pokhara, 2012 53

10 m
10m mmmm
25m
20mm
5m
5m
1m 1m
Interest group discussionPeople who share particular set of interests make up an interest group, also called focus group. An interest group can be determined by differences in age, gender, ethnic group, wealth, belief etc. Interest group meetings are conducted to get the people with similar sets of interests to discuss the matter and decide the use and distribution of the resources.
Other Participatory Rural Appraisals (PRA)PRA is qualitative method of resource assessment which is based on people’s view on status and trend of a species of interest. Different PRA tools give different information of a species. Timeline trend, resource mapping, seasonal calendar, matrix ranking are important to assess the species.
2.2.2 Direct measurement The vegetation may be heterogeneous or homogenous. Depending upon the condition two methods are applied.
Census survey or total enumerationCensus survey means that enumeration of desired NTFPs over the entire area of the forest unit under consideration. Since it is expensive and time consuming; it is applied when the area of study is small (<5ha) and the NTFP is commercially valuable. Census surveys are often carried out to check on the statistical results of partial enumeration.
Partial enumerationThe area is partially enumerated and the enumerated samples represent the whole population under study. Partial enumeration can be plot method or plot less method.
Plot method
It is most common method employed for sampling various types of the vegetation (Rabindranath 1997). A plot may be rectangle, square, circle or any other shape. Plots may be again taken randomly or systematically and stratified or non-stratified. In Nepal generally rectangular and circular plots are used in community forestry inventory. Nested plot designed are commonly practiced for tree, shrub and herb. The size and number of plot depend on the objective of the study. Ideally 10 % to 15% of the total area should be sampled (Rabindranath 1997). If the area is too large this may not be possible, in this case a minimum of 1 ha should be studied. The sample plot should of course be located at randomly chosen spot. All vegetation falling inside the plot and its replication are studied. The figure below shows an rectangular nested plot design commonly adopted in inventory of community forest (25*20m2 for mature trees, 10*10m2 for pole, 5*5m2 for shrub and 1*1m2 for herbs).
Lecture notes on Forest Mensuration by Bishnu P Devkota, Institute of Forestry, Pokhara, 2012 54

Plotless methodThe plotless method are best suited for large vegetation area having the heterogeneous plant population (forest area and uneven terrain), where laying plot becomes very difficult. There are several plotless methods however Point Centered Quadrant method is widely used. This is simple and requires less time and more suited for randomly distributed vegetation. In this process a number of points are selected randomly depending on the size of the area, from each point four lines are drawn perpendicularly in all four directions which results four quarters around the point. The nearest tree, shrub or herb is taken as the sample. The following figure illustrates the method.
3. Productivity Assessment Productivity is the amount of height, girth, volume, biomass that is accumulated by a plant species in certain period of time; may be seasonal, annual or over its whole life span. Different inventory methods are used for different plant parts to determine the productive capacity. These inventory methods may involve the destruction of the whole plants or its parts or without destruction. Resource assessment and productivity of the plants can be done according to the convenience but few important things should be considered.
One time resource inventory is not enough It should be done when the leaves are green for easy identification of plant When the products are ready for harvest for productivity estimation of NTFPs More than one period of data collection may be required within a year because
different products are ready for harvest at different times of year. Productivity should be measured over several years, rather than just one year.
The inventory methods for fruits, root, leaf, bark taking one example of species is dealt here.
a. Inventory process of Amala(Emblica officinalis) fruitsAmala is a medium sized deciduous tree, but sometimes grows quietly and attains up to 19m height. In Nepal it is found in terai and subtropical valleys from east to west between 100-1600m. Fruits are commercially used. Brief inventory method of Amala is as described (Kunwar 2006).
With the participation of local people and reconnaissance survey the distribution of Amala in the forest is determined
Forest should be divided into blocks and sub-blocks on the basis of area, geo-structure, natural condition, management objectives, population of species
Sampling intensity of 1.5% of site should be taken. Stratified systematic sampling method is adopted while surveying.
Lecture notes on Forest Mensuration by Bishnu P Devkota, Institute of Forestry, Pokhara, 2012 55

Necessary inventory plots should be kept equally in every block where Amala is found
25*20 m rectangular inventory plot should be made at every 100 m distance at both right and left sides of the transect line
Height and diameter of the trees are measured. Availability, density, etc are calculated.
After calculating the density of Amala trees, girth classes (less than 10 cm, 11 to 30 cm, 31 to 65 cm, 66 to 100 cm and above 100 cm) of trees are computed.
5/5 trees per block from each girth class are selected (3/3 trees if there are less than 5).
Select 5/5 (or 3/3) tree branches of uniform sizes from each of the upper, middle and lower canopy cover of tree.
Pluck or collect the fruits from each branch and weigh the fruits. The mean weight of the fruits from each branch, each tree, each girth class, and each block is determined. This calculation gives the amount of Amala fruits per hectare and that of entire forest.
b. Inventory of Kutki (Neopicrorhiza scrophulariflora) root
Kutki is a perennial herb distributed in the North-Western Himalayan region from Kashmir to Kumaun and Garhwal regions in India, Pakistan, Nepal, Myanmar, Southeast Tibet, North Burma and China (Pollunin and Stainton, 1984: Cited in Giri 2006). It grows naturally in alpine and sub-alpine regions on rock scars as well as in organic soils. It prefers moist habitat formed by winter snow or depressions mostly on the exposed north facing slopes.
In Nepal, Kutki is distributed abundantly also in Sub-alpine and alpine Himalayan regions between 3000-4800m-elevation range with associated of Rhododendron anthopogan, Raktelo. It found in the eastern and central regions of Nepal, but most abundantly in the western region where it grows on the rock’s crevices on the north facing slopes, cliffs and the turf of glacial flats. Kutki prefers a moist habitat and sandy loam soil (Shrestha and Shrestha, 2004).
It is mainly found in the following districts of Nepal-Taplejung, Sankhuwasabha, Sindhuplancok. Nuwakot, Rasuwa, Ramechhap, Bahlung, Myagdi, Lamjung, Gorkha, Jumla, Mugu, Jajarkiot, Rukum, Bajhang, Bajura, Darchula, Humla, Mustang, Manang, (HMGN, 2055,2058: Cited in Giri 2006). Roots and rhizomes are used indigenously and scientifically. Inventory of Kuti can be done in the following way (Kunwar 2006).
With the participation of local people and reconnaissance survey the distribution of Kutki in the forest is determined
Forest should be divided into blocks and sub-blocks on the basis of area, geo-structure, natural condition, management objectives, population of species
Sampling intensity of 0.5-1% of site should be taken. Stratified systematic sampling method is adopted while surveying. Draw a baseline to the survey block and draw parallel horizontal and vertical
lines at a distance of 50m. Lay 2*2 m quadrates at a distance of 10m in each horizontal line. Study the availability, density and fresh weight of Kutki of all quadrant inventory
quadrant plots.
Lecture notes on Forest Mensuration by Bishnu P Devkota, Institute of Forestry, Pokhara, 2012 56

At the time of maturation leaves become yellow and plants wilt. Roots should be dug out from mature plants.
The collection is fresh weighed, sun dried for one week and weighed again to its dry weight. From the difference between fresh weight and dry weight, the conversion factor can be found out. The conversion factor of kutki roots is 0.6140
The productivity of kutki of definite location can be calculated by multiplying the conversion factor per hectare with area of forest surveyed.
c. Inventory of Lokta (Daphne bholua) barkDaphne bholua (Kalo lokta) is an evergreen, erect standing shrub found at an altitude range of 1800m to 3600m. The inner bark of the plant is used for the local manufacture of extremely durable hand-made paper. Lokta paper making in Nepal dates back to at least the 12th century (Trier, 1972: Cited in NSCFP 2001) and continue as an important and rapidly growing cottage industry. The increasing demand of lokta makes its resource inventory an essential for its proper management. The inventory of lokta can be done in a participatory method (NSCFP 2001).
Delineation and estimation of the potential area for lokta: From participatory mapping, focus group discussion and key informants survey the distribution of lokta in the forest, availability, harvesting suitability is assessed. The potential lokta areas are delineated, block division and estimation of the area of delineated block is conducted.
Field visit is done to verify the accuracy of participatory mapping, area estimation and preliminary assessment of condition of lokta. During the field visits, parallel transects are constructed covering the whole lokta area. Transects are walked, lokta distribution observed, verify and correct the boundary of potential area. By visual observation, estimate the area of the blocks, cross check it with the obtained values of areas estimated before. Final delineation of the different blocks of lokta and final estimation of their area is done.
Defining the resource condition of lokta: This step involves common understanding of the different qualitative and quantitative resource condition of lokta. By peoples participation stocking condition of lokta can be defined and classified in four resource conditions namely good, fair, poor or nil. The users are asked to keep a visual picture of each of the condition in mind.
Estimation of the availability of lokta plants and lokta bark in sample plots: This step involves the quantification of the amount of harvestable bark, according to different resource condition. Walk along parallel transects lines spaced 100m apart. Stopping at each 20 m interval, resource condition in plots of 5m*5m is defined as classified previously. In this way we achieve a sampling intensity of about 1%. After observing several plots of each resource condition, a sample of them is selected and measured to assess the amount of harvestable bark and regeneration of lokta. Either randomly or systematically, 10m*10m plots are taken, regeneration/plant condition measured and classified. Within these plots the plants above the agreed harvestable height are harvested according to the traditional practice; the external bark is separated from the collected product which is weighted (Kg). This helps to quantify the availability of harvestable lokta (number of stems, height of the stems and the weight of the harvestable
Lecture notes on Forest Mensuration by Bishnu P Devkota, Institute of Forestry, Pokhara, 2012 57
amount of bark) in each starta or, and so representing each resource condition. This should be done at least 6 times to get reliable estimates.
Data analysis: The total condition of the resource is estimated by multiplying the block area with the percentage spots with resource condition.
d. Inventory of Machhino (Gaultheria fragrantissima) leafMachhino is a robust shrub of up to 2m height with ovate to lanceolate evergreen leaves. It grows in open forests and shrubland between 1500 and 2700 m above sea level. It prefers moist and sunny places. The oil extracted from the leaves of Machhino is used as massage oil, as a flavoring agent by the confectionery industry and in the manufacture of soft drinks. The inventory method of machhino as outlined by NSCFP 2001 is as below.
Delineation and estimation of the potential area for machhino: From participatory mapping, focus group discussion and key informants survey the distribution of machhino in the forest, availability, harvesting suitability is assessed. The potential machhino areas are delineated, block division and estimation of the area of delineated block is conducted.
Field visit is done to verify the accuracy of participatory mapping, area estimation and preliminary assessment of condition of machhino. During the field visits, parallel transects are constructed covering the whole machhino area. Transects are walked, machhino distribution observed, verify and correct the boundary of potential area. By visual observation, estimate the area of the blocks, cross check it with the obtained values of areas estimated before. Final delineation of the different blocks of machhino and final estimation of their area is done.
Inventory of the harvestable amount of machhino: This step involves the quantification of the harvestable raw materials in a number of sample plots. Walk along parallel transects lines spaced 100m apart. Stopping at each 50 m interval, resource condition in plots of 5.64 m radius is defined as good, medium or poor. In this way we achieve a sampling intensity of about 2%. The inventory of Machhino may be also integrated in a general forest inventory, using the same sample plots for the inventory of other products (fodder, fuelwood, litter, ground grass etc.). Once the quality of the shrub has been defined, its average crown diameter has to be estimated by measuring its maximum and minimum diameters and recording the data. In order to simplify this measurement, the borer of the crown can be visualized with a colored rope. The maximum and minimum diameters can then be easily measured with a measuring tape.
Data analysis: The amount of harvestable machhino is estimated in Kg of fresh material. For this purpose a correlation factor has been defined, that relates the average diameter of the crown and the quality of the shrub to the fresh weight of the harvested product. The total amount of harvestable machhino in the plots is the sum of the fresh weight of all crown diameter classes (excluding those below the agreed minimum harvestable size).
4. Gaps in the inventory methods of NTFPsNTFP inventory is complex, there are no particular systems. More over methods in one locality or time may not be appropriate in other locality. Major gaps in NTFP inventory can be outlined as below (Wong 2000).
4.1 Problems with adopting traditional forest inventory techniques for NTFPs
Lecture notes on Forest Mensuration by Bishnu P Devkota, Institute of Forestry, Pokhara, 2012 58

The problem of a lack of methods and protocols for NTFP inventory could be easily solved if it were possible to use traditional forestry methods as these are well described and understood.
Unfortunately, this is not a practical solution as there are certain characteristics of NTFPs that are not easily accommodated in traditional forest inventory. The main pitfalls are: Rarity - many NTFPs are rare which means that only a few plots of a conventional systematic or random inventory will contain the species of interest. Imperfect detectability – people dealing with trees have rarely come across the
problem of searching for an elusive or moving target because trees are generally easy to find. Unfortunately, many NTFPs are not that easy to find and these require that detectability is considered. This is an area where NTFP studies can borrow wildlife techniques.
Seasonality - Many NTFPs are seasonal but in comparison, timber quantities are constant, consequently forest inventory methods do not cope well with seasonality.
Motility - Animals run away, fruit falls off a tree and rolls down a hill but trees are static. This is an area where NTFP studies may be able to borrow wildlife techniques.
Quantification of yield for non-destructive harvesting - most of the methods for determining timber yield from a forest are concerned with the harvesting of entire individuals. For NTFPs one is often only harvesting a small part of the individual. The review suggests that there is little theoretical background for determining harvesting levels of parts of a plant.
Incorporation of local knowledge – most NTFP studies value local knowledge but there is at present no formal means of using this knowledge to optimise inventory designs. The fact that many studies have struggled with the problem of linking local and scientific knowledge suggests that this would be fruitful area for research.
4.2 Lack of properly researched NTFP-specific sampling designsThere are relatively few research studies that have looked at optimising sampling designs specifically for NTFPs. Most of these studies have been done on rattan and, unfortunately, several of these had their own failings. These were mostly to do with plot independence (the trial plot sizes and shapes were contiguous and from only one study site).
4.3 Little guidance available on development of appropriate NTFP measurement (mensuration) techniquesEven for the most commonly studied products there is little advice or standardization of methods.
4.4 No application to NTFPs of sampling designs tailored to monitoring needsThere has been no application to NTFP monitoring of any of the statistical thinking on monitoring. Monitoring from a statistical point of view is complicated as there is a problem with controlling the power of the design to discriminate change. Precise observations are required at each time interval to actually detect changes; if the data is imprecise the changes may reside within the errors of the estimates and mask any real change. There has been quite a lot of work done on how to address these problems but to date they have not been applied to NTFPs. Precise monitoring is often very expensive therefore many NTFP monitoring studies use indicators to track changes in the resource. However, there is little known about the linkages between indicators and the resource
Lecture notes on Forest Mensuration by Bishnu P Devkota, Institute of Forestry, Pokhara, 2012 59

base. Where this has been studied it has often been shown that a change in off-take or harvest level (a commonly used indicator) is not directly linked to resource condition. What is required are some relatively easy means of determining and tracking change in the relationship between the chosen indicator and resource condition.
4.5 Difficulties in determination of the sustainability of harvestingOne of the more stark findings of the review is the general lack of good quality data and the almost complete absence of a theoretical background for determining sustainable yield of NTFPs. Consequently, despite the many hopes that NTFPs can be managed sustainably, we do not actually have the data or the means to demonstrate that this is possible It is suggested that this is a very severe and urgent problem.
4.6 Application of novel sampling strategies to NTFPsThere are a range of newer (at least to forestry) sampling techniques such as rank set sampling and adaptive cluster sampling, that appear to offer certain advantages for NTFPs. Clearly there is new methodology available, however, much of it may be at the cutting edge of statistics and has not yet been considered for NTFPs.
4.7 Cross-disciplinary exchange of ideas and methods suitable for use with NTFPsThere is an urgent need for cross-disciplinary exchange in the development of NTFP specific sampling designs and methods. There are many ideas and methods that apply in a wide range of different disciplines but there is little cross-over between them. In this respect the reviewer suggests we should think of NTFPs as wild-grown products from natural or seminatural environments. Although there are many products that lie in a grey area between the wild and domestic, it seems that the problems of managing cultivated or wild products are quite different and this needs to be reflected in methods selected for their quantification, management and monitoring. Areas where techniques and ideas can be shared between domestic and wild resources might also be identified.
4.8 Effective communication of advice to field workers and communitiesTo be effective, any advice that can be offered and the results of any research undertaken has to get to people on the ground. Research must be developed in the field in a manner responsive to expressed needs and then put into a form appropriate for use by field technicians and people in village communities.
5. Possible solutions for difficulties in NTFP inventory In Nepal different organizations have developed different methods of NTFP inventory. Some have focused more on participatory approach while others emphasize on field measurement. These two methods should be combined to get the benefit of each other and exclude their demerits. Some of the possible strategies for NTFP inventory are;
Inventory methods which are cost effective and locally adapted should be preferred.
Indigenous and scientific knowledge should be linked to make inventory effective and more precise.
Inventory methods for the hills and terai even for same species should be adopted accordingly
Lecture notes on Forest Mensuration by Bishnu P Devkota, Institute of Forestry, Pokhara, 2012 60

5.3.6 Use of Aerial Photographs in forestry inventory
Remote Sensing Remote sensing is the science and art of obtaining information about an object, area or
phenomenon through analysis of data acquired by a device that is not in contact with the object, area or phenomenon under investigation.
Aerial remote sensing-it is that method of remote sensing in which cameras or other devices, fixed in an aircraft flying at fixed altitude are used to take photographs of any resource on earth. It is also called aerial photography.
Space remote sensing- it is that method of remote sensing in which cameras, sensor or other devices attached to a satellite orbiting round the earth, take photographs of earth and resources inside it.
Aerial photography Aerial photography is the process of taking photograph of earth’s surface and its natural
resources from an aircraft flying at fixed altitude from the earth Aerial photographs are the photographs of earth’s surface and its natural resources taken
from an aircraft flying at fixed altitude from the earth. The relative position of the objects on photographs is superficially similar to the actual
position on ground. Canada was the first country which applied aerial photography in forestry. In Asia(tropics), Burma is the first country to start aerial survey of vegetation. In Nepal, Aerial photography was used for the estimation of forest and shrub land cover
and changes. Aerial photography are very useful tool for the forest manager. A basic knowledge of the location and extent of the forest is critical to the management
of forest resources. Aerial photographs are useful in designing and conducting field inventories and used to
estimate tree and stand characteristicsScope
To determine the volume (value) of standing trees in a given area. To get a reliable estimate of the forest area. The measurement of all or an unbiased sample of trees within the area To get the knowledge of location of all tract corners and
boundary lines
a. Types of aerial photographsAerial photography may be classified into various types depending
on the different criteria.On the basis of position of optical axis of cameras
Vertical photograph Oblique photograph
Vertical photograph Optical axis of camera is kept perpendicular or nearly
perpendicular to the horizontal plane The degree of tilt is less than 4 degree
Lecture notes on Forest Mensuration by Bishnu P Devkota, Institute of Forestry, Pokhara, 2012 61

It is considered to be best because ground features like building, roads, streams, forest boundaries appear same as the map of similar scale covers small area but scale is quite uniform over the whole picture.α= angle of viewβ= deviation of optical axis from vertical linea`= vertical line perpendicular to the horizon
Oblique photographsLow oblique photographs
Optical axis of camera is tilted by 30 degree or less from the vertical and horizon does not show in the picture
High oblique photographs Optical axis of camera is tilted by 60 degree and horizon is apparent. Unlike vertical photograph the scale of oblique is variable, and that is why there is
distortion. The degree of distortion increases towards the horizon
On the basis of films or sensor used Panchromatic black and white photograph Infra-red black and white photograph Normal color photograph Infra-red color photograph
Panchromatic black and white photograph This film is sensitive to the
electromagnetic spectrum in the wavelength range of 0.3 to 0.75 μm
When panchromatic film is used, the conventional black and white photograph is produced.
This film has low sensitivity in the green region of visible spectrum and therefore is not suitable for identification of plant species.
Lecture notes on Forest Mensuration by Bishnu P Devkota, Institute of Forestry, Pokhara, 2012 62

Panchromatic photograph recording reflected sunlight over the wavelength band 0.4 to 0.7 μm
Infra-red black and white photograph By the use of infra-red film and proper
filter, the electromagnetic spectrum in the wavelength range of 0.3 to 0.9 μm is photographed as black and white photograph.
The photograph is very useful in identification of broadleaved and coniferous trees.
Normal Color photograph
A color film with proper filter produced colored photograph in true color. It registers visible color by human eye.
It is three-layered film with emulsion sensitive to an additive primary color i.e. blue, green and red.
The color photography is much more useful in separation and identification of different species and diseases.
Infra-red color photograph It is called false color photograph as it
shows objects in different color as compared to the true color of the objects. The film sensitive to infrared
region is used in taking such photographs.
The normal color of vegetation is green but in infrared color photograph, vegetation appears red.
On the basis of device used Single lens photograph-single lens
camera used Multi-spectral photograph-more than one camera or camera with more than one lens
used Multi-spectral imagery-optical mechanical scanner used
On the basis of scale of photograph Small scale photograph-1:40,000 to 1:70,000 or more
Lecture notes on Forest Mensuration by Bishnu P Devkota, Institute of Forestry, Pokhara, 2012 63
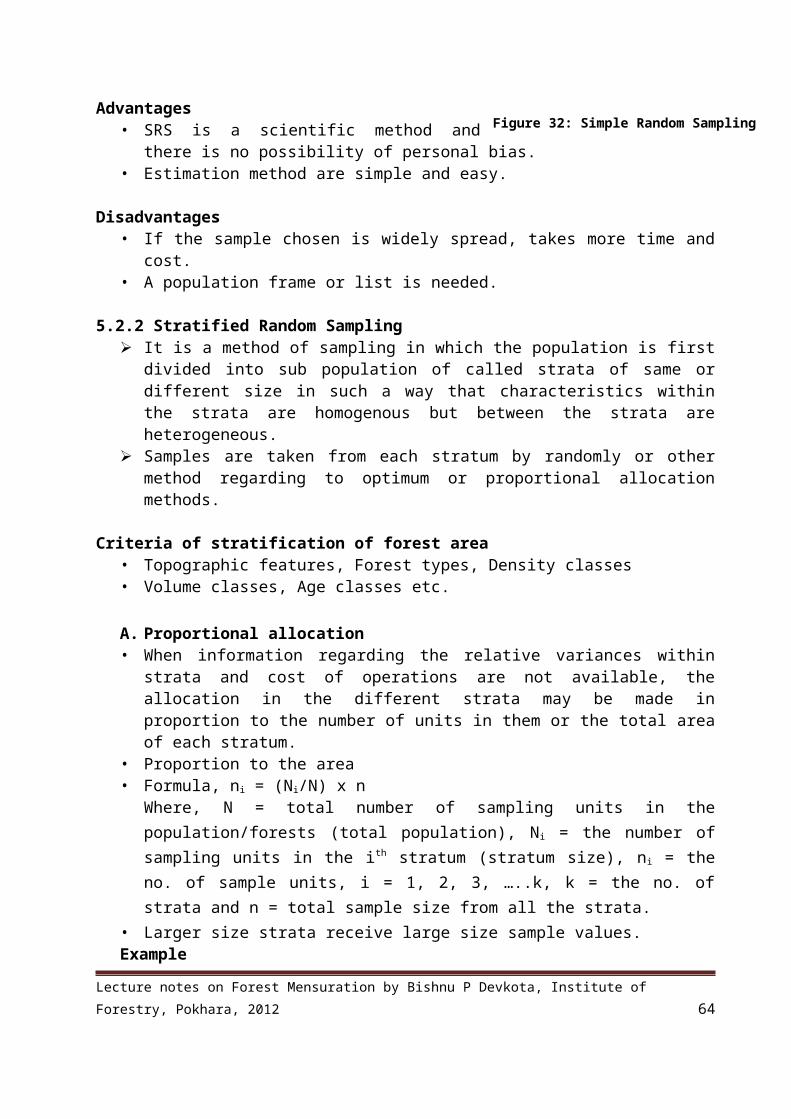
Medium scale photograph-1:20,000 to 1: 40,000 Large scale photograph-1:5000 to 1:20,000
Lecture notes on Forest Mensuration by Bishnu P Devkota, Institute of Forestry, Pokhara, 2012 64

Season of photography
Depends upon the nature of the features to be identified, the film to be used and number of days suitable for photographic flights
Less expensive in sunny area Best season-during October to Februray Another season-growing season Eg. Coniferous forests-October to November, Mixed deciduous forests-December to
February, Tropical evergreen and moist deciduous forests-January to February Spring, Winter, Summer photographs
Scale of Photographs Scale= photo distance/ground distance or Scale= focal length of camera (f)/flying height above ground (h’)
b. Photo interpretation & technical terms• Photo interpretation is an act of examining photographic images and judging their
significance.• When we can identify what we see on the photographs and communicate this
information to others, we are practicing aerial photographs interpretation.• Aerial photo graphs contain raw photographic data. These data, when processed by a
human intepreter’s brain, become useful information.• Aerial photographs can be interpreted by using following basic elements/characteistics:
Shape, Size, Pattern, tone, texture, shadows, site, association and resolution. Tone (or hue)
It refers to the relative brightness or color of objects on an image. Relative photo tones could be used to distinguish between deciduous(light tone) and
coniferous trees(dark tone) on black and white photographs Without tonal difference, the shape, patterns, and texture of object could not be
distinguished.Shape
It refers to the general form, configuration or outline of individual objects. Shape help a great deal in making interpretation in forestry.
Lecture notes on Forest Mensuration by Bishnu P Devkota, Institute of Forestry, Pokhara, 2012 65

Eg. Some species have rounded crowns, some have cone-shaped crowns and some have star shaped crowns.
Variation of these basic crown shapes also occur. Pattern
It related to the spatial arrangement of objects. The repetition of certain general forms or relationship is characteristic of many objects,
both natural and constructed and gives objects a pattern that aids the image interpreter in recognizing them.
For example, the ordered spatial arrangements of tree is an orchard is in distinct contrast to that of forest tree stands.
Size Size of objects on images must be considered in the context of image scale. A small
storage shed, for example might be misinterpreted as barn if size were not considered. Relative sizes among objects on images of the same scale must also be considered. Similarly, size is also helpful in identifying the forest stands.
Texture It is the frequency of tonal change on a photo. Texture is produced by an aggregation of unit features that may be too small to be
discerned individually on the image, sucha as tree leaves and leaf shadows. It is the product of their individual shape, size, pattern, shadow. It determines the overall visual “smoothness” or “coarseness” of image features. Difference in texture help distinguish tree species.
Shadow Shadows are important to interpreters in two opposite respects: 1). the shape of outline
of a shadow affords and impression of the profile view of objects(which aids interpretation) and 2) Objects within shadows reflect little sight and are difficult to discern on a image (which hinders the interpretation)
When trees are isolated, shadows provide a profile of image of trees that is useful in species identification.
Sites It refers to topographic or geographic location and is a particularly important in
identification of vegetation types. For eg. Certain tree species would be expected to occur on well drained upland sites,
whereas other tree species would be expected to occur on poorly drained lowland sites. Alnus nepalensis is expected to occur in degraded and exposed sites.
Association It refers to the occurrence of certain features in relation to others. Eg. Stak of wood nearby the forest would be easier to identify than the stack of wood
kept in proximity with small shed in the agriculture land.Resolution
It depends on many factors, but it always places a practical limit on interpretation because some objects are too small or have too little contrast with their surroundings to be clearly seen on the image.
There are certain equipments that can be used for the aerial photo interpretation. They help in viewing the photo, making measurement on the photo, performing interpretation tasks and transferring interpreted information to base maps or database.
c. Forest classification Forest classification can be done on aerial photographs using the basic elements for
photo interpretation.
Lecture notes on Forest Mensuration by Bishnu P Devkota, Institute of Forestry, Pokhara, 2012 66

The classification of forest types and plant species largely depends on quality, scale and season of photography and the ability of interpreter.
The shape, texture, and tone or tree foliage as seen on vertical photographic along with other basic elements of photo interpretation are key to forest classification.
The first step in forest classification is to determine which types should and should not be expected in given locality.
It will also be helpful to get familiar with the most common plant and environmental association.
This information can be derived by previous maps or direct observation. In some regions, photo-interpretation keys are available for recognition of forest cover
types and such keys can be used. Classification can be conducted in minute details in large scale photographs where
species can be identified and in small scale photographs, the knowledge of locality is essential for forest classification.
In modern days, computer programs (image processing software like ERDAS, PCI, ENVI, GRASS etc) are available for making forest classification using the aerial photographs and other imageries.
Relationship between photographic scale and expected levels of plant recognitionPhotographic Scale
General level of plant discrimination
1:30,000-1:100,000
Recognition of broad vegetative types, largely by inferential processes
1: 10,000-1:30,000 Direct identification of major cover types of species occurring in pure stands
1:2,500-1:10,000 Identification of individual trees and large shrubs
1:500-1:2,500 Identification of individual range plant are grassland types
d. Area determination A truly vertical aerial photo is just like a map and area can be measured with methods
similar to that from a map. The scale of photographs is known and the area is calculated accordingly. But in aerial photo, the center part of the plant is generally true as map but as we move
radially outward from the center, the scale changes and there is displacement. In determining the area, if all corners are at the same elevation, the area calculation from
photographs can be made accurately. If not, substantial error can exist. Similarly, if the area are measured outward the center of the photograph, then some
correction will only yield accurate result. Thus, we should use the photo where the area to be measured is as close to nadir as
possible. Such errors can be reduced by using photos taken from higher flying height. Following methods and tools are used to measure area in aerial photographs- Dot grids,
planimeter, weight apportionment and GIS method.
1. Dot Grids Determine number of dots per unit area
Lecture notes on Forest Mensuration by Bishnu P Devkota, Institute of Forestry, Pokhara, 2012 67

Count number of dots in stand or feature on map or photo
Calculate the area of stand or feature Convert measurement to ground areas Widely used method of area calculation on aerial photo Relatively simple and inexpensive tool for estimating
area on photographs
2. Planimeter
Run the pointer of an instrument around the boundaries of an area in clockwise direction; usually the perimeter is traced two or three times for an average and read the instrument details.
Convert measurements to ground areas Laborious if many areas need to measure
3. Weight apportionment Traditional method Physically cut a method into individual areas Weigh each area and determine areas based on their weight Need a very sensitive instrument to weight small pieces of
paper
4. GIS method Advance method By digitizing the particular area and using the different
function, area can be calculated
e. Volume estimation For estimating individual tree volume, multiple entry tree volume tables based on dbh
and height can be converted to aerial volume table when correlations can be established between crown diameter and stem diameters
Photo determination of crown diameter is substituted for the usual ground measures of dbh, and total heights are measured on stereoscopic pairs of photographs.
Large scale aerial photographs are essential for obtaining reliable crown diameter and health measurement of individual trees.
Where only small scale aerial photographs are available, stand variables should be measured than individual tree variable
Aerial stand volume tables are multiple entry tables that are used based on assessments of two or three photographic characteristics of the dominant –co dominant crown canopy; average stand height, average crown diameter and percent of crown close
These tables are usually derived by multiple regression analysis; photographic measurements of independent variables are made by several skilled interpreters when developing the volume prediction equation.
Other Forestry application of aerial photography
Lecture notes on Forest Mensuration by Bishnu P Devkota, Institute of Forestry, Pokhara, 2012 68

Vegetation growth distribution investigation Forest resource investigation Forest fire monitoring Forest disease and pest monitoring Shifting cultivation study Timber harvest planning Monitoring of logging and reforestation Forest recreation resource inventory and monitoring Wildlife habitat analysis Planning forest roads Monitoring power line right of way vegetation growth etc.
Lecture notes on Forest Mensuration by Bishnu P Devkota, Institute of Forestry, Pokhara, 2012 69