web view7.4. proportionality. the ... any two congruent, ... when given a one-variable equation or...
TRANSCRIPT
Enhanced TEKS Clarification
Mathematics
Grade 7
2014 - 2015
Grade 7
§111.25. Implementation of Texas Essential Knowledge and Skills for Mathematics, Middle School, Adopted 2012.Source: The provisions of this §111.25 adopted to be effective September 10, 2012, 37 TexReg 7109.§111.27. Grade 7, Adopted 2012.
7.Intro.1 The desire to achieve educational excellence is the driving force behind the Texas essential knowledge and skills for mathematics, guided by the college and career readiness standards. By embedding statistics, probability, and finance, while focusing on computational thinking, mathematical fluency, and solid understanding, Texas will lead the way in mathematics education and prepare all Texas students for the challenges they will face in the 21st century.
7.Intro.2 The process standards describe ways in which students are expected to engage in the content. The placement of the process standards at the beginning of the knowledge and skills listed for each grade and course is intentional. The process standards weave the other knowledge and skills together so that students may be successful problem solvers and use mathematics efficiently and effectively in daily life. The process standards are integrated at every grade level and course. When possible, students will apply mathematics to problems arising in everyday life, society, and the workplace. Students will use a problem-solving model that incorporates analyzing given information, formulating a plan or strategy, determining a solution, justifying the solution, and evaluating the problem-solving process and the reasonableness of the solution. Students will select appropriate tools such as real objects, manipulatives, algorithms, paper and pencil, and technology and techniques such as mental math, estimation, number sense, and generalization and abstraction to solve problems. Students will effectively communicate mathematical ideas, reasoning, and their implications using multiple representations such as symbols, diagrams, graphs, computer programs, and language. Students will use mathematical relationships to generate solutions and make connections and predictions. Students will analyze mathematical relationships to connect and communicate mathematical ideas. Students will display, explain, or justify mathematical ideas and arguments using precise mathematical language in written or oral communication.
7.Intro.3 The primary focal areas in Grade 7 are number and operations; proportionality; expressions, equations, and relationships; and measurement and data. Students use concepts, algorithms, and properties of rational numbers to explore mathematical relationships and to describe increasingly complex situations. Students use concepts of proportionality to explore, develop, and communicate mathematical relationships, including number, geometry and measurement, and statistics and probability. Students use algebraic thinking to describe how a change in one quantity in a relationship results in a change in the other. Students connect verbal, numeric, graphic, and symbolic representations of relationships, including equations and inequalities. Students use geometric properties and relationships, as well as spatial reasoning, to model and analyze situations and solve problems. Students communicate information about geometric figures or situations by quantifying attributes, generalize procedures from measurement experiences, and use the procedures to solve problems. Students use appropriate statistics, representations of data, and reasoning to draw conclusions, evaluate arguments, and make recommendations. While the use of all types of technology is important, the emphasis
Grade 7
on algebra readiness skills necessitates the implementation of graphing technology.
7.Intro.4 Statements that contain the word "including" reference content that must be mastered, while those containing the phrase "such as" are intended as possible illustrative examples.
7.1 Mathematical process standards. The student uses mathematical processes to acquire and demonstrate mathematical understanding. The student is expected to:
7.1A Apply mathematics to problems arising in everyday life, society, and the workplace.
Apply mathematics to problems arising in everyday life, society, and the workplace.ApplyMATHEMATICS TO PROBLEMS ARISING IN EVERYDAY LIFE, SOCIETY, AND THE WORKPLACE
Note(s):
The mathematical process standards may be applied to all content standards as appropriate. TxRCFP:
o Developing fluency with rational numbers and operations to solve problems in a variety of contextso Representing and applying proportional relationshipso Using expressions and equations to describe relationships in a variety of contexts, including geometric problemso Comparing sets of data
TxCCRS:
X. Connections
7.1B Use a problem-solving model that incorporates analyzing given information, formulating a plan or strategy, determining a solution,
justifying the solution, and evaluating the problem-solving process and the reasonableness of the solution.
Use a problem-solving model that incorporates analyzing given information, formulating a plan or strategy, determining a solution,
justifying the solution, and evaluating the problem-solving process and the reasonableness of the solution.UseA PROBLEM-SOLVING MODEL THAT INCORPORATES ANALYZING GIVEN INFORMATION, FORMULATING A PLAN OR STRATEGY, DETERMINING A SOLUTION, JUSTIFYING THE SOLUTION, AND EVALUATING THE PROBLEM-SOLVING PROCESS AND THE
Grade 7
REASONABLENESS OF THE SOLUTION
Note(s):
The mathematical process standards may be applied to all content standards as appropriate. TxRCFP:
o Developing fluency with rational numbers and operations to solve problems in a variety of contextso Representing and applying proportional relationshipso Using expressions and equations to describe relationships in a variety of contexts, including geometric problemso Comparing sets of data
TxCCRS:
VIII. Problem Solving and Reasoning
7.1C Select tools, including real objects, manipulatives, paper and pencil, and technology as appropriate, and techniques, including mental
math, estimation, and number sense as appropriate, to solve problems.
Select tools, including real objects, manipulatives, paper and pencil, and technology as appropriate, and techniques, including mental
math, estimation, and number sense as appropriate, to solve problems.SelectTOOLS, INCLUDING REAL OBJECTS, MANIPULATIVES, PAPER AND PENCIL, AND TECHNOLOGY AS APPROPRIATE, TO SOLVE PROBLEMS
SelectTECHNIQUES, INCLUDING MENTAL MATH, ESTIMATION, AND NUMBER SENSE AS APPROPRIATE, TO SOLVE PROBLEMS
Note(s):
The mathematical process standards may be applied to all content standards as appropriate. TxRCFP:
o Developing fluency with rational numbers and operations to solve problems in a variety of contextso Representing and applying proportional relationshipso Using expressions and equations to describe relationships in a variety of contexts, including geometric problemso Comparing sets of data
TxCCRS:

Grade 7
VIII. Problem Solving and Reasoning
7.1D Communicate mathematical ideas, reasoning, and their implications using multiple representations, including symbols, diagrams, graphs,
and language as appropriate.
Communicate mathematical ideas, reasoning, and their implications using multiple representations, including symbols, diagrams, graphs,
and language as appropriate.CommunicateMATHEMATICAL IDEAS, REASONING, AND THEIR IMPLICATIONS USING MULTIPLE REPRESENTATIONS, INCLUDING SYMBOLS, DIAGRAMS, GRAPHS, AND LANGUAGE AS APPROPRIATE
Note(s):
The mathematical process standards may be applied to all content standards as appropriate. TxRCFP:
o Developing fluency with rational numbers and operations to solve problems in a variety of contextso Representing and applying proportional relationshipso Using expressions and equations to describe relationships in a variety of contexts, including geometric problemso Comparing sets of data
TxCCRS:
IX. Communication and Representation
7.1E Create and use representations to organize, record, and communicate mathematical ideas.
Create and use representations to organize, record, and communicate mathematical ideas.Create, UseREPRESENTATIONS TO ORGANIZE, RECORD, AND COMMUNICATE MATHEMATICAL IDEAS
Note(s):
The mathematical process standards may be applied to all content standards as appropriate. TxRCFP:

Grade 7
o Developing fluency with rational numbers and operations to solve problems in a variety of contextso Representing and applying proportional relationshipso Using expressions and equations to describe relationships in a variety of contexts, including geometric problemso Comparing sets of data
TxCCRS:
IX. Communication and Representation
7.1F Analyze mathematical relationships to connect and communicate mathematical ideas.
Analyze mathematical relationships to connect and communicate mathematical ideas.AnalyzeMATHEMATICAL RELATIONSHIPS TO CONNECT AND COMMUNICATE MATHEMATICAL IDEAS
Note(s):
The mathematical process standards may be applied to all content standards as appropriate. TxRCFP:
o Developing fluency with rational numbers and operations to solve problems in a variety of contextso Representing and applying proportional relationshipso Using expressions and equations to describe relationships in a variety of contexts, including geometric problemso Comparing sets of data
TxCCRS:
X. Connections
7.1G Display, explain, and justify mathematical ideas and arguments using precise mathematical language in written or oral communication.
Display, explain, and justify mathematical ideas and arguments using precise mathematical language in written or oral communication.Display, Explain, JustifyMATHEMATICAL IDEAS AND ARGUMENTS USING PRECISE MATHEMATICAL LANGUAGE IN WRITTEN OR ORAL COMMUNICATION
Note(s):

Grade 7
The mathematical process standards may be applied to all content standards as appropriate. TxRCFP:
o Developing fluency with rational numbers and operations to solve problems in a variety of contextso Representing and applying proportional relationshipso Using expressions and equations to describe relationships in a variety of contexts, including geometric problemso Comparing sets of data
TxCCRS:
IX. Communication and Representation
7.2 Number and operations. The student applies mathematical process standards to represent and use rational numbers in a variety of forms. The student is expected to:
7.2A Extend previous knowledge of sets and subsets using a visual representation to describe relationships between sets of rational numbers.
Supporting StandardExtend previous knowledge of sets and subsets using a visual representation to describe relationships between sets of rational numbers.
Supporting StandardExtendPREVIOUS KNOWLEDGE OF SETS AND SUBSETS USING A VISUAL REPRESENTATION TO DESCRIBE RELATIONSHIPS BETWEEN SETS OF RATIONAL NUMBERSIncluding, but not limited to:
Counting (natural) numbers – the set of positive numbers that begins at one and increases by increments of one each time {1, 2, 3, ..., n} Whole numbers – the set of counting (natural) numbers and zero {0, 1, 2, 3, ..., n} Integers – the set of counting (natural numbers), their opposites, and zero {-n, …, -3, -2, -1, 0, 1, 2, 3, ..., n}. The set of integers is denoted by
the symbol Z.
Rational numbers – the set of numbers that can be expressed as a fraction , where a and b are integers and b ≠ 0, which includes the

Grade 7
subsets of integers, whole numbers, and counting (natural) numbers (e.g., -3, 0, 2, etc.). The set of rational numbers is denoted by the symbol Q.
Visual representations of the relationships between sets and subsets of rational numbers
To DescribeRELATIONSHIPS BETWEEN SETS OF NUMBERSIncluding, but not limited to:
All counting (natural) numbers are a subset of whole numbers, integers, and rational numbers.o Ex: Two is a counting (natural) number, whole number, integer, and rational number.
All whole numbers are a subset of integers and rational numbers.o Ex: Zero is a whole number, integer, and rational number, but not a counting (natural) number.
All integers are a subset of rational numbers.o Ex: Negative two is an integer and rational number, but neither a whole number nor counting (natural) number.
All counting (natural) numbers, whole numbers, and integers are a subset of rational numbers.o Ex: Four is a counting (natural) number, whole number, integer, and rational number.
Not all rational numbers are an integer, whole number, or counting (natural) number.o Ex: One-half is a rational number, but not an integer, whole number, or counting (natural) number.
Terminating and repeating decimals are rational numbers but not integers, whole numbers, or counting (natural) numbers.o Ex: is a repeating decimal; therefore, it is rational number.
Note(s):
Grade Level(s):

Grade 7
o Grade 6 classified whole numbers, integers, and rational numbers using a visual representation such as a Venn diagram to describe relationships between sets of numbers.
o Grade 8 will extend previous knowledge of sets and subsets using a visual representation to describe relationships between sets of real numbers.
o Various mathematical process standards will be applied to this student expectation as appropriate. TxRCFP:
o Developing fluency with rational numbers and operations to solve problems in a variety of contexts TxCCRS:
o I. Numeric Reasoningo IX. Communication and Representation
7.3 Number and operations. The student applies mathematical process standards to add, subtract, multiply, and divide while solving problems and justifying solutions. The student is expected to:
7.3A Add, subtract, multiply, and divide rational numbers fluently.
Supporting StandardAdd, subtract, multiply, and divide rational numbers fluently.
Supporting StandardAdd, Subtract, Multiply, and DivideRATIONAL NUMBERS FLUENTLYIncluding, but not limited to:
Rational numbers – the set of numbers that can be expressed as a fraction , where a and b are integers and b ≠ 0, which includes the
subsets of integers, whole numbers, and counting (natural) numbers (e.g., -3, 0, 2, etc.). The set of rational numbers is denoted by the symbol Q.
Fluency – efficient application of procedures with accuracy Addition, subtraction, multiplication, and division involving various forms of positive and negative rational numbers
o Whole numbers

Grade 7
o Integerso Decimals (less than or greater than one)o Fractions (proper, improper, and mixed numbers)o Percents converted to equivalent decimals or fractions for multiplying or dividing fluently
Note(s):
Grade Level(s):o Grade 5 estimated to determine solutions to mathematical and real-world problems involving addition, subtraction, multiplication, or
division.o Grade 5 added and subtracted positive rational numbers fluently.o Grade 6 multiplied and divided positive rational numbers fluently.o Various mathematical process standards will be applied to this student expectation as appropriate.
TxRCFP:o Developing fluency with rational numbers and operations to solve problems in a variety of contexts
TxCCRS:o I. Numeric Reasoningo IX. Communication and Representation
7.3B Apply and extend previous understandings of operations to solve problems using addition, subtraction, multiplication, and division of
rational numbers.
Readiness StandardApply and extend previous understandings of operations to solve problems using addition, subtraction, multiplication, and division of
rational numbers.
Readiness StandardApply, ExtendPREVIOUS UNDERSTANDINGS OF OPERATIONS TO SOLVE PROBLEMS USING ADDITION, SUBTRACTION, MULTIPLICATION, AND DIVISION OF RATIONAL NUMBERSIncluding, but not limited to:
Grade 7
Rational numbers – the set of numbers that can be expressed as a fraction , where a and b are integers and b ≠ 0, which includes the
subsets of integers, whole numbers, and counting (natural) numbers (e.g., -3, 0, 2, etc.). The set of rational numbers is denoted by the symbol Q.
Various forms of positive and negative rational numberso Whole numberso Integerso Decimals (less than or greater than one)o Fractions (proper, improper, and mixed numbers)o Percents converted to equivalent decimals or fractions for multiplying or dividing
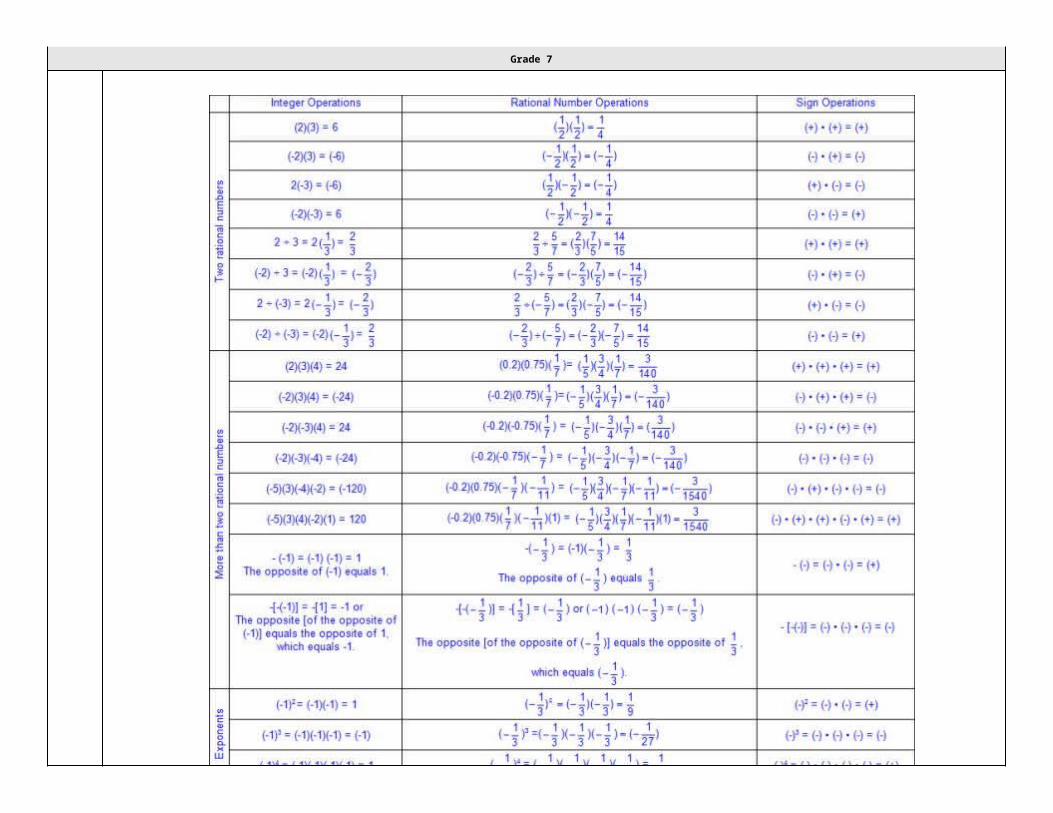
Various forms of representing multiplying by a negative
Ex: Generalizations of integer operations
o Addition and subtraction
If a pair of addends has the same sign, then the sum will have the sign of both addends. If a pair of addends has opposite signs, then the sum will have the sign of the addend with the greatest absolute value. A subtraction problem may be rewritten as an addition problem by adding the opposite of the integer following the subtraction
symbol, and then applying the rules for addition.o Multiplication and division
o If two rational numbers have the same sign, then the product or quotient is positive.o If two rational numbers have opposite signs, then the product or quotient is negative.o When multiplying or dividing two or more rational numbers, the product or quotient is positive if there are no negative signs or
an even number of negative signs.o When multiplying or dividing two or more rational numbers, the product or quotient is negative if there is one negative sign or
an odd number of negative signs. Connections between generalizations for integer operations to rational number operations for addition and subtraction
Ex:

Grade 7
Recognize that dividing by a rational number and multiplying by its reciprocal result in equivalent values. Connections between generalizations for integer operations to rational number operations for multiplication and division
Ex:

Grade 7
Grade 7
7.4 Proportionality. The student applies mathematical process standards to represent and solve problems involving proportional relationships. The student is expected to:
7.4A Represent constant rates of change in mathematical and real-world problems given pictorial, tabular, verbal, numeric, graphical, and
algebraic representations, including d = rt.
Readiness StandardRepresent constant rates of change in mathematical and real-world problems given pictorial, tabular, verbal, numeric, graphical, and
algebraic representations, including d = rt.
Readiness StandardRepresentCONSTANT RATES OF CHANGE IN MATHEMATICAL AND REAL-WORLD PROBLEMS GIVEN PICTORIAL, TABULAR, VERBAL, NUMERIC, GRAPHICAL, AND ALGEBRAIC REPRESENTATIONS, INCLUDING d = rtIncluding, but not limited to:
Rational numbers – the set of numbers that can be expressed as a fraction , where a and b are integers and b ≠ 0, which includes the
subsets of integers, whole numbers, and counting (natural) numbers (e.g., -3, 0, 2, , etc.). The set of rational numbers is denoted by the symbol Q.
Various forms of positive and negative rational numberso Whole numberso Integerso Decimals (less than or greater than one)o Fractions (proper, improper, and mixed numbers)
Constant rate of change – a ratio when the dependent, y-value, changes at a constant rate for each independent, x-value Proportional mathematical and real-world problems
o Unit conversions within and between systems
Customary Metric

Grade 7
o d = rt
o In d = rt, the d represents distance, the r represents rate, and the t represents time.
Connections between constant rate of change r, in d = rt, to the constant of proportionality, k, in y = kx Various representations of constant rates of change
o Pictorial
o Ex:
Tabular (vertical/horizontal)
Ex:
Verbal
Ex:

Grade 7
Numeric
Ex:
Graphical
Ex:

Grade 7
Algebraic
Ex:
Note(s):
Grade Level(s):o Grade 6 compared two rules verbally, numerically, graphically, and symbolically in the form of y = ax or y = x + a in order to
differentiate between additive and multiplicative relationships.o Grade 6 gave examples of rates as the comparison by division of two quantities having different attributes, including rates as
quotients.o Grade 6 represented mathematical and real-world problems involving ratios and rates using scale factors, tables, graphs, and
proportions.o Various mathematical process standards will be applied to this student expectation as appropriate.
TxRCFP:o Representing and applying proportional relationships
TxCCRS:o I. Numeric Reasoningo II. Algebraic Reasoningo VIII. Problem Solving and Reasoningo IX. Communication and Representationo X. Connections
7.4B Calculate unit rates from rates in mathematical and real-world problems.
Supporting StandardCalculate unit rates from rates in mathematical and real-world problems.

Grade 7
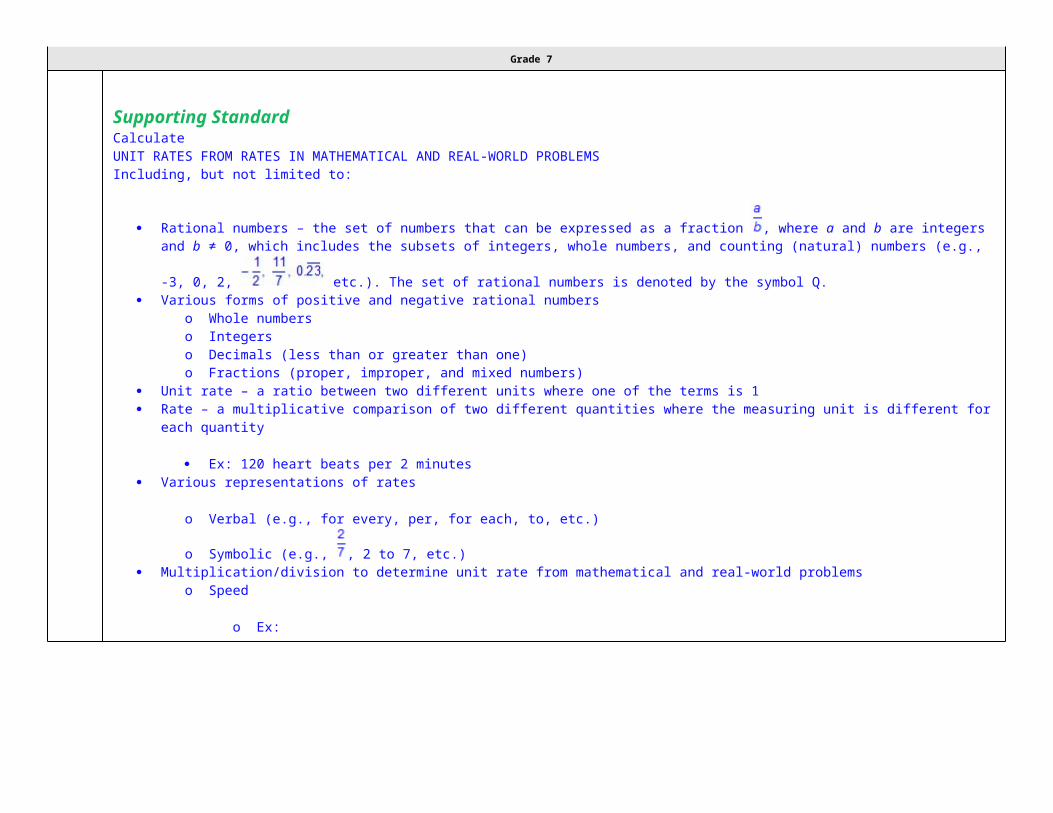
Supporting StandardCalculateUNIT RATES FROM RATES IN MATHEMATICAL AND REAL-WORLD PROBLEMSIncluding, but not limited to:
Rational numbers – the set of numbers that can be expressed as a fraction , where a and b are integers and b ≠ 0, which includes the
subsets of integers, whole numbers, and counting (natural) numbers (e.g., -3, 0, 2, etc.). The set of rational numbers is denoted by the symbol Q.
Various forms of positive and negative rational numberso Whole numberso Integerso Decimals (less than or greater than one)o Fractions (proper, improper, and mixed numbers)
Unit rate – a ratio between two different units where one of the terms is 1 Rate – a multiplicative comparison of two different quantities where the measuring unit is different for each quantity
Ex: 120 heart beats per 2 minutes Various representations of rates
o Verbal (e.g., for every, per, for each, to, etc.)
o Symbolic (e.g., , 2 to 7, etc.) Multiplication/division to determine unit rate from mathematical and real-world problems
o Speed
o Ex:
Grade 7
Density ( )
Ex:
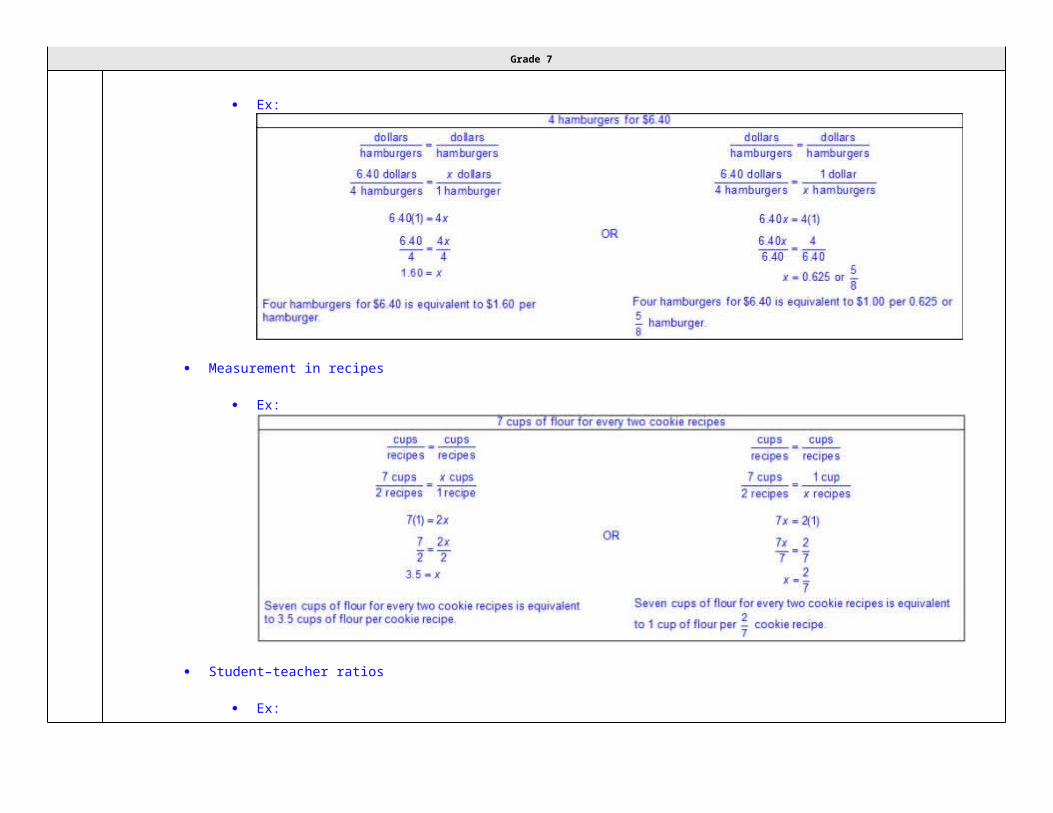
Price

Grade 7
Ex:
Measurement in recipes
Ex:
Student–teacher ratios
Ex:
Grade 7
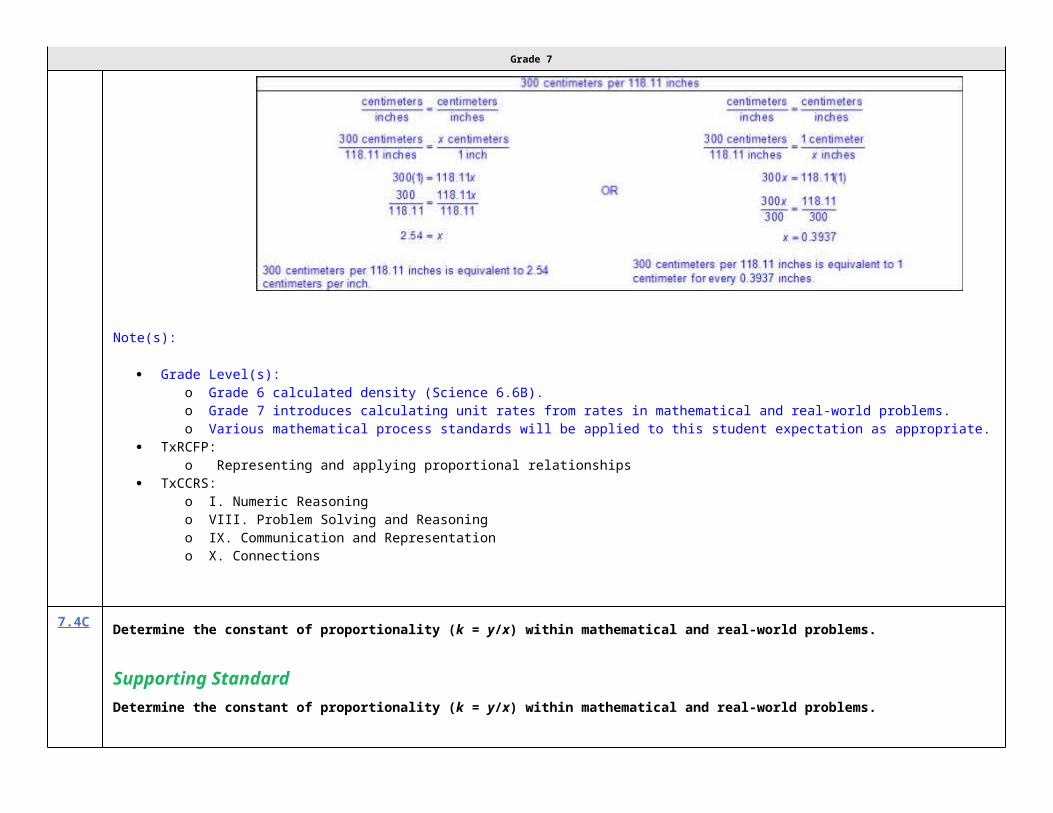
Unit conversions within and between systems
Customary Metric Ex:
Ex:

Grade 7
Note(s):
Grade Level(s):o Grade 6 calculated density (Science 6.6B).o Grade 7 introduces calculating unit rates from rates in mathematical and real-world problems.o Various mathematical process standards will be applied to this student expectation as appropriate.
TxRCFP:o Representing and applying proportional relationships
TxCCRS:o I. Numeric Reasoningo VIII. Problem Solving and Reasoningo IX. Communication and Representationo X. Connections
7.4C Determine the constant of proportionality (k = y/x) within mathematical and real-world problems.
Supporting StandardDetermine the constant of proportionality (k = y/x) within mathematical and real-world problems.
Grade 7
Supporting StandardDetermine
THE CONSTANT OF PROPORTIONALITY ( ) WITHIN MATHEMATICAL AND REAL-WORLD PROBLEMSIncluding, but not limited to:
Rational numbers – the set of numbers that can be expressed as a fraction , where a and b are integers and b ≠ 0, which includes the
subsets of integers, whole numbers, and counting (natural) numbers (e.g., -3, 0, 2, etc.). The set of rational numbers is denoted by the symbol Q.
Various forms of positive and negative rational numberso Whole numberso Integerso Decimals (less than or greater than one)o Fractions (proper, improper, and mixed numbers)
Constant rate of change – a ratio when the dependent, y-value, changes at a constant rate for each independent, x-value
Constant of proportionality – a constant positive ratio between two proportional quantities denoted by the symbol k Characteristics of the constant of proportionality
o The constant of proportionality can never be zero. Unit rate – a ratio between two different units where one of the terms is 1 Proportional mathematical and real-world problems
o Unit conversions within and between same system
Customary Metric
o d = rt
o In d = rt, the d represents distance, the r represents rate, and the t represents timeo Connections between constant rate of change r, in d = rt, to the constant of proportionality, k, in y = kx
Various representations of the constant of proportionalityo Tabular (vertical/horizontal)
o Ex:

Grade 7
Verbal
Ex:
Numeric
Ex:
Graphical
Ex:

Grade 7
Algebraic
Ex:
Note(s):
Grade Level(s):o Grade 6 compared two rules verbally, numerically, graphically, and symbolically in the form of y = ax or y = x + a in order to
differentiate between additive and multiplicative relationships.o Grade 8 will solve problems involving direct variation.o Various mathematical process standards will be applied to this student expectation as appropriate.
TxRCFP:o Representing and applying proportional relationships
TxCCRS:o I. Numeric Reasoning

Grade 7
o II. Algebraic Reasoningo VIII. Problem Solving and Reasoningo IX. Communication and Representationo X. Connections
7.4D Solve problems involving ratios, rates, and percents, including multi-step problems involving percent increase and percent decrease, and
financial literacy problems.
Readiness StandardSolve problems involving ratios, rates, and percents, including multi-step problems involving percent increase and percent decrease, and
financial literacy problems.
Readiness StandardSolvePROBLEMS INVOLVING RATIOS, RATES, AND PERCENTS INCLUDING MULTI-STEP PROBLEMS INVOLVING PERCENT INCREASE AND PERCENT DECREASE, AND FINANCIAL LITERACY PROBLEMSIncluding, but not limited to:
Rational numbers – the set of numbers that can be expressed as a fraction , where a and b are integers and b ≠ 0, which includes the
subsets of integers, whole numbers, and counting (natural) numbers (e.g., -3, 0, 2, etc.). The set of rational numbers is denoted by the symbol Q.
Various forms of positive rational numberso Whole numberso Decimals (less than or greater than one)o Fractions (proper, improper, and mixed numbers)o Percents converted to equivalent decimals or fractions for multiplying or dividing
Ratio – a multiplicative comparison of two quantitieso Symbolic representations of ratios
a to b, a:b, or

Grade 7
o Verbal representations of ratios
o 12 to 3, 12 per 3, 12 parts to 3 parts, 12 for every 3, 12 out of every 3o Units may or may not be included (e.g., 12 boys to 3 girls, 12 to 3, etc.)
Rate – a multiplicative comparison of two different quantities where the measuring unit is different for each quantity
Ex: 120 heart beats per 2 minutes Relationship between ratios and rates
o All ratios have associated rates Percent – a part of a whole expressed in hundredths
o Numeric forms
o Ex: 40%, , 0.4o Algebraic notation as a decimal
o Ex: 40% of any given amount x can be represented as 0.4xo Ex: 132% of any given amount x can be represented as 1.32x
Multi-step problems Multiple methods for solving problems involving ratios, rates, and percents
o Models (e.g., percent bars, hundredths grid, etc.)o Decimal method (algebraic)o Dimensional analysiso Proportion methodo Scale factors between ratios
Equivalent representations of ratios, rates and percents
Ex: 50% is equivalent to 0.50 because 0.50 is equal to or . Various representations of ratios, rates, percents
o Tabular (vertical/horizontal)o Verbalo Numerico Graphical
Strip diagram Number line

Grade 7
Percent grapho Algebraic
Situations involving ratios, rates, or percentso Percent increase – a change in percentage where the value increases
o Ex:
Percent decrease – a change in percentage where the value decreases
Ex:
Financial literacy problems

Grade 7
Principal – the original amount invested or borrowed Simple interest – interest paid on the original principal in an account, disregarding any previously earned interest
Formula for simple interest from STAAR Grade 7 Mathematics Reference Materials
I = Prt, where I represents the interest, P represents the principal amount, r represents the interest rate in decimal form, and t represents the number of years the amount is deposited or borrowed
Ex:
Tax – a financial charge, usually a percentage applied to goods, property, sales, etc.
Ex:

Grade 7
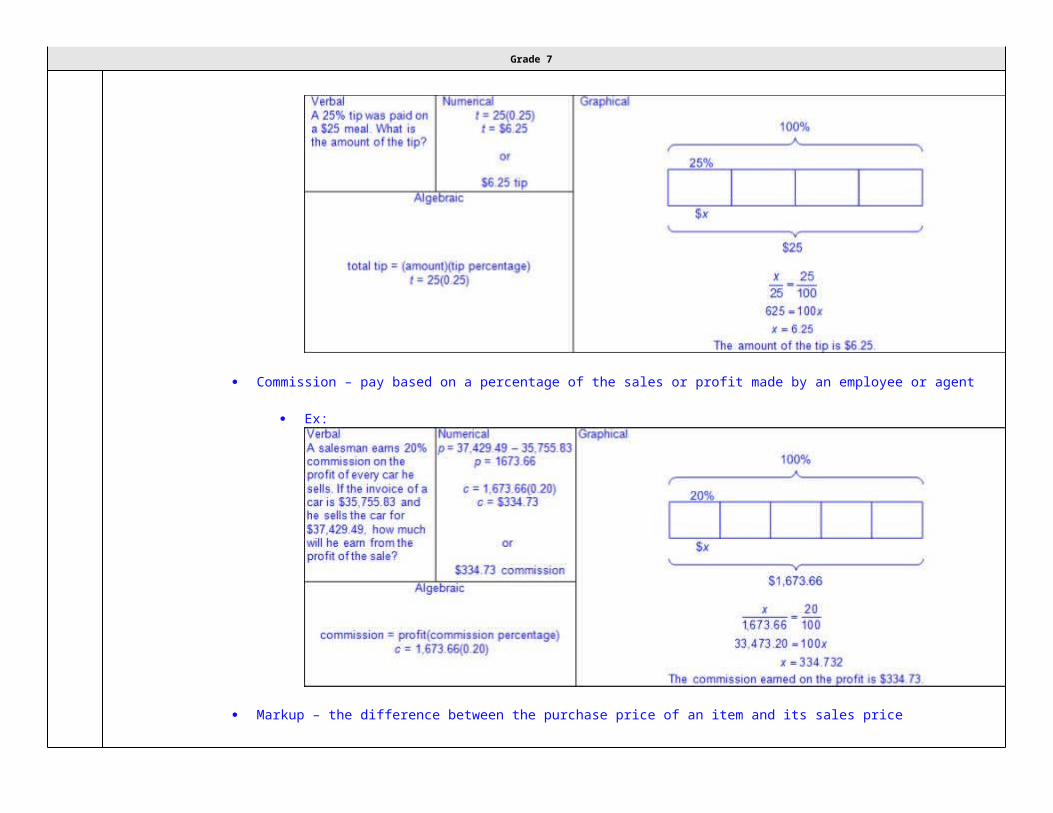
Tip – an amount of money rendered for a service, gratuity
Ex:

Grade 7
Commission – pay based on a percentage of the sales or profit made by an employee or agent
Ex:
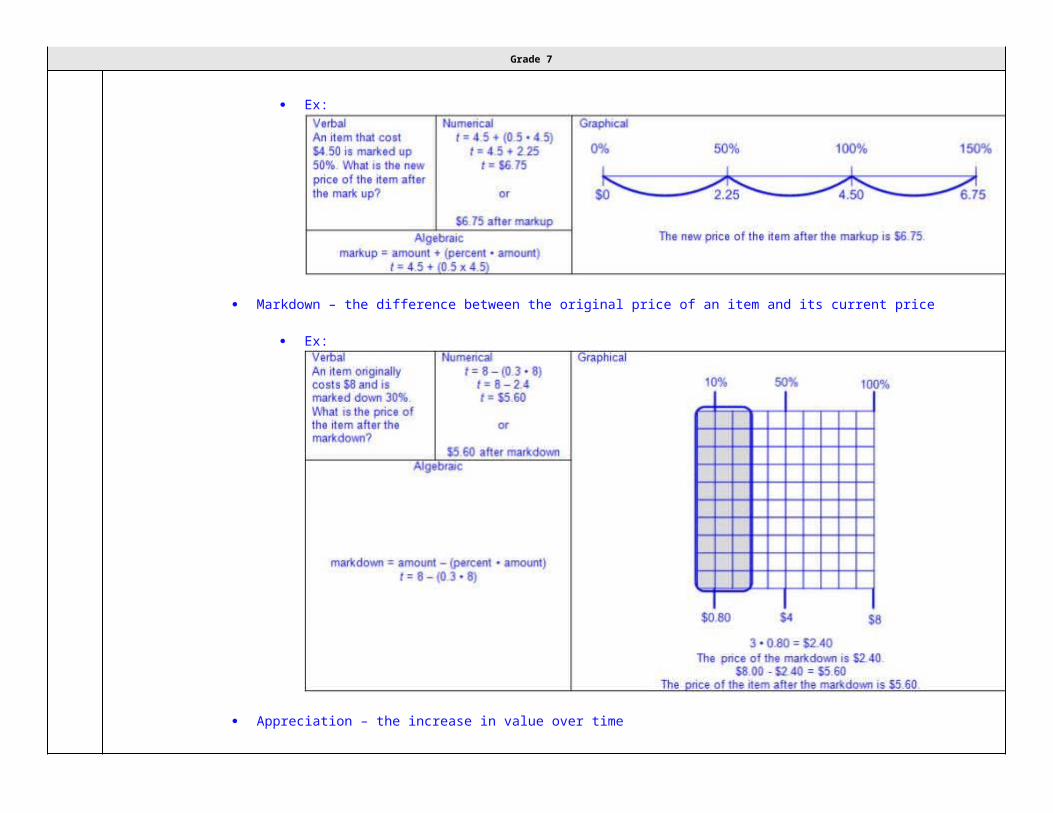
Markup – the difference between the purchase price of an item and its sales price
Ex:
Markdown – the difference between the original price of an item and its current price
Ex:
Grade 7
Appreciation – the increase in value over time
Ex:
Grade 7
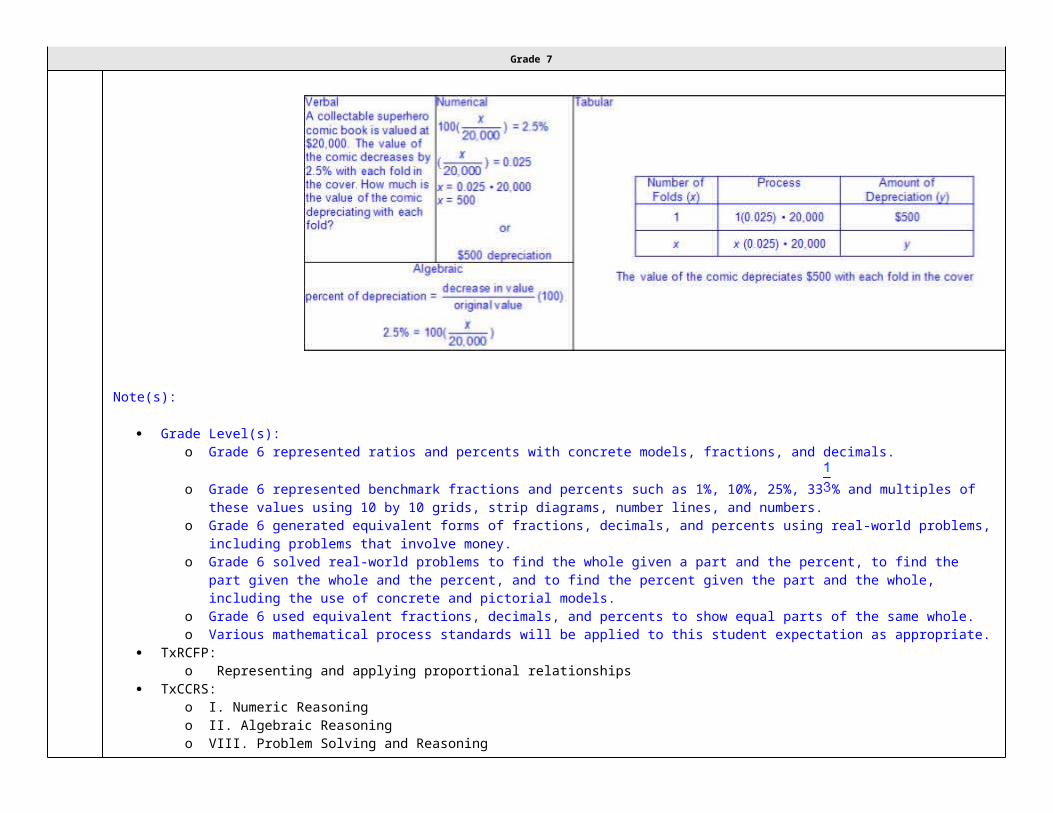
Depreciation – the decrease in value over time
Ex:

Grade 7
Note(s):
Grade Level(s):o Grade 6 represented ratios and percents with concrete models, fractions, and decimals.
o Grade 6 represented benchmark fractions and percents such as 1%, 10%, 25%, 33 % and multiples of these values using 10 by 10 grids, strip diagrams, number lines, and numbers.
o Grade 6 generated equivalent forms of fractions, decimals, and percents using real-world problems, including problems that involve money.
o Grade 6 solved real-world problems to find the whole given a part and the percent, to find the part given the whole and the percent, and to find the percent given the part and the whole, including the use of concrete and pictorial models.
o Grade 6 used equivalent fractions, decimals, and percents to show equal parts of the same whole.o Various mathematical process standards will be applied to this student expectation as appropriate.
TxRCFP:o Representing and applying proportional relationships
TxCCRS:o I. Numeric Reasoningo II. Algebraic Reasoningo VIII. Problem Solving and Reasoningo IX. Communication and Representationo X. Connections
7.4E Convert between measurement systems, including the use of proportions and the use of unit rates.
Supporting StandardConvert between measurement systems, including the use of proportions and the use of unit rates.
Supporting StandardConvertBETWEEN MEASUREMENT SYSTEMS, INCLUDING THE USE OF PROPORTIONS AND THE USE OF UNIT RATESIncluding, but not limited to:
Grade 7
Positive rational numbers – the set of numbers that can be expressed as a fraction , where a and b are whole numbers and b ≠ 0, which
includes the subsets of whole numbers and counting (natural) numbers (e.g., 0, 2, etc.). Various forms of positive rational numbers
o Whole numberso Decimals (less than or greater than one)o Fractions (proper, improper, and mixed numbers)
Convert units between measurement systems.o Customary to metric
o Ex: inches to centimeters, yards to meters, pounds to kilograms, quarts to liters, etc.o Metric to customary
o Ex: centimeters to inches, meters to yards, kilograms to pounds, liters to quarts, etc. Multiple solution strategies
o Dimensional analysis using unit rateso Ex:
Scale factor between ratios
Grade 7
Ex:
Proportion method
Ex:

Grade 7
Conversion graph
Ex:
Note(s):
Grade Level(s):o Grade 6 converted units within a measurement system, including the use of proportions and unit rates.o Various mathematical process standards will be applied to this student expectation as appropriate.
TxRCFP:o Representing and applying proportional relationships

Grade 7
TxCCRS:o I. Numeric Reasoningo IV. Measurement Reasoningo VIII. Problem Solving and Reasoningo IX. Communication and Representation
7.5 Proportionality. The student applies mathematical process standards to use geometry to describe or solve problems involving proportional relationships. The student is expected to:
7.5A Generalize the critical attributes of similarity, including ratios within and between similar shapes.
Supporting StandardGeneralize the critical attributes of similarity, including ratios within and between similar shapes.
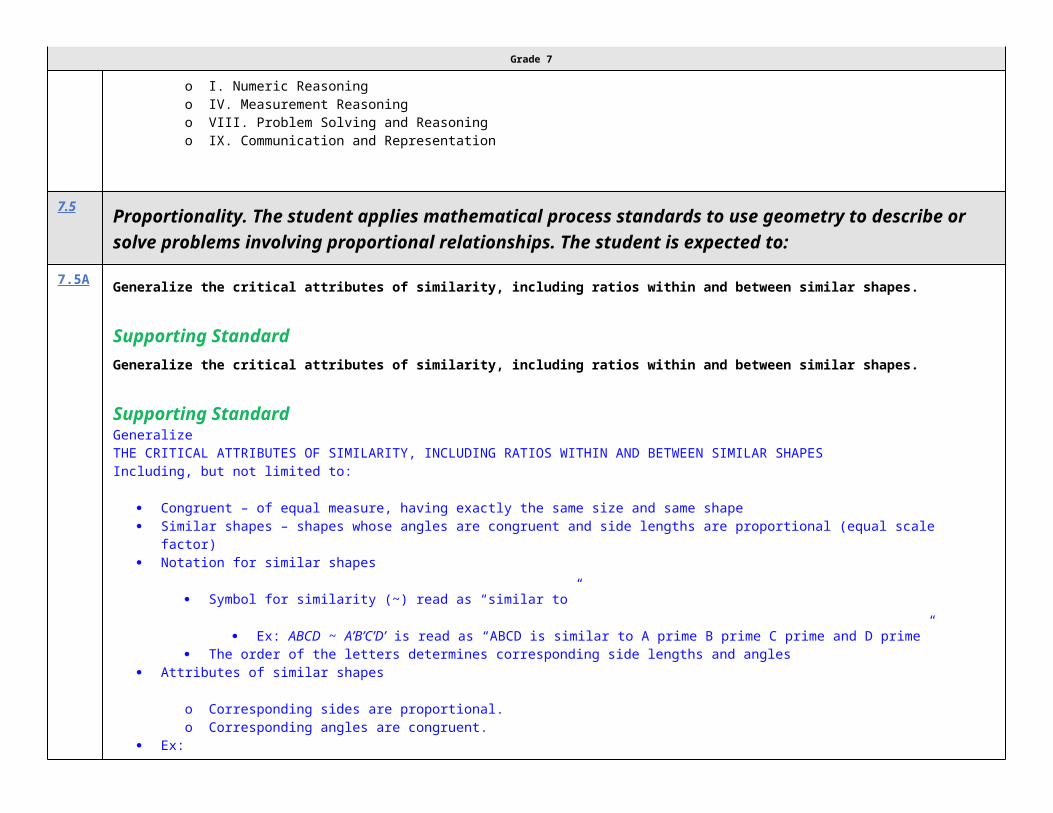
Supporting StandardGeneralizeTHE CRITICAL ATTRIBUTES OF SIMILARITY, INCLUDING RATIOS WITHIN AND BETWEEN SIMILAR SHAPESIncluding, but not limited to:
Congruent – of equal measure, having exactly the same size and same shape Similar shapes – shapes whose angles are congruent and side lengths are proportional (equal scale factor) Notation for similar shapes
Symbol for similarity (~) read as “similar to”
Ex: ABCD ~ A’B’C’D’ is read as “ABCD is similar to A prime B prime C prime and D prime” The order of the letters determines corresponding side lengths and angles
Attributes of similar shapes
o Corresponding sides are proportional.o Corresponding angles are congruent.
Ex:

Grade 7
Generalizations of similarityo A scale factoro A scale factor >1 increases the linear dimensions of the shape.o Ratios comparing lengths within each shape or between shapes will determine if the shapes are similar.o Shapes that are “the same shape, but a different size” are not always similar shapes.o Corresponding sides are proportional, while corresponding angles are congruent.o There is a multiplicative relationship between the lengths of corresponding sides.
Note(s):
Grade Level(s):o Grade 7 introduces generalizing the critical attributes of similarity, including ratios within and between similar shapes.o Various mathematical process standards will be applied to this student expectation as appropriate.
TxRCFP:o Representing and applying proportional relationships
TxCCRS:o III.C. Geometric Reasoning – Connections between geometry and other mathematical content strands
Grade 7
o IV. Measurement Reasoningo VIII. Problem Solving and Reasoningo IX. Communication and Representationo X. Connections
7.5B Describe π as the ratio of the circumference of a circle to its diameter.
Supporting StandardDescribe π as the ratio of the circumference of a circle to its diameter.
Supporting StandardDescribeπ AS THE RATIO OF THE CIRCUMFERENCE OF A CIRCLE TO ITS DIAMETERIncluding, but not limited to:
Circleo A figure formed by a closed curve with all points equal distance from the centero No straight sideso No verticeso No parallel or, perpendicular sideso Diameter – a line segment whose endpoints are on the circle and passes through the center of the circleo Radius – a line segment drawn from the center of a circle to any point on the circle and is half the length of diameter of the circle
Circumference – a linear measurement of the distance around a circle Pi (π) – the ratio of the circumference to the diameter of a circle
o π = or
o π ≈ 3.14 or Relationships between circumference and diameter
Ex:

Grade 7
Note(s):
Grade Level(s):o Grade 7 introduces describing π as the ratio of the circumference of a circle to its diameter.o Various mathematical process standards will be applied to this student expectation as appropriate.
TxRCFP:o Representing and applying proportional relationships
TxCCRS:o I. Numeric Reasoningo III.C. Geometric Reasoning – Connections between geometry and other mathematical content strandso IV. Measurement Reasoningo IX. Communication and Representationo X. Connections
7.5C Solve mathematical and real-world problems involving similar shape and scale drawings.

Grade 7
Readiness StandardSolve mathematical and real-world problems involving similar shape and scale drawings.
Readiness StandardSolveMATHEMATICAL AND REAL-WORLD PROBLEMS INVOLVING SIMILAR SHAPE AND SCALE DRAWINGSIncluding, but not limited to:
Positive rational numbers – the set of numbers that can be expressed as a fraction , where a and b are whole numbers and b ≠ 0, which
includes the subsets of whole numbers and counting (natural) numbers (e.g., 0, 2, etc.). Various forms of positive rational numbers
o Whole numberso Decimals (less than or greater than one)o Fractions (proper, improper, and mixed numbers)o Percents converted to equivalent decimals or fractions for multiplying or dividing
Similar shapes – shapes whose angles are congruent and side lengths are proportional (equal scale factor) Proportional relationship between scale factor and linear measures of similar figures and scale drawings in mathematical and real-world
problem situationso Linear measures
o Ex:

Grade 7
o Ex:

Grade 7
Note(s):
Grade Level(s):o Grade 7 introduces solving mathematical and real-world problems involving similar shape and scale drawings.o Various mathematical process standards will be applied to this student expectation as appropriate.
TxRCFP:o Representing and applying proportional relationships
TxCCRS:o I. Numeric Reasoningo III.C. Geometric Reasoning – Connections between geometry and other mathematical content strandso IV. Measurement Reasoning

Grade 7
o VIII. Problem Solving and Reasoningo IX. Communication and Representationo X. Connections
7.6 Proportionality. The student applies mathematical process standards to use probability and statistics to describe or solve problems involving proportional relationships. The student is expected to:
7.6A Represent sample spaces for simple and compound events using lists and tree diagrams.
Supporting StandardRepresent sample spaces for simple and compound events using lists and tree diagrams.
Supporting StandardRepresentSAMPLE SPACES FOR SIMPLE AND COMPOUND EVENTS USING LISTS AND TREE DIAGRAMSIncluding, but not limited to:
Event – a probable situation or condition Outcome – the result of an action or event Mutually exclusive events – events that cannot happen at the same time
Ex:

Grade 7
Simple event – an event that consists of a single outcome Compound events – events that consists of two or more simple events and consists of more than one outcome
o Compound independent events – events with more than one outcome, and one event does not affect the outcome of the othero Compound dependent events – events with more than one outcome, and the outcome of one event affects the outcome of the
subsequent event or events Sample space – a set of all possible outcomes of one or more events Various representations of sample space for simple and compound events
o Listso Tree diagramso Tableso Fundamental Counting Principle – if one event has a possible outcomes and a second independent event has b possible outcomes,
then there are a • b total possible outcomes for the two events togethero Ex:
Ex:

Grade 7
Ex:

Grade 7
Note(s):
Grade Level(s):o Grade 7 introduces representing sample spaces for simple and compound events using lists and tree diagrams.o Various mathematical process standards will be applied to this student expectation as appropriate.
TxRCFP:o Representing and applying proportional relationships
TxCCRS:o V. Probabilistic Reasoningo IX. Communication and Representation
7.6B Select and use different simulations to represent simple and compound events with and without technology.
Select and use different simulations to represent simple and compound events with and without technology.Select, UseDIFFERENT SIMULATIONS TO REPRESENT SIMPLE AND COMPOUND EVENTS WITH AND WITHOUT TECHNOLOGYIncluding, but not limited to:
Event – a probable situation or condition Outcome – the result of an action or event Simple event – an event that consists of a single outcome Compound events – events that consists of two or more simple events and consists of more than one outcome
o Compound independent events – events with more than one outcome, and one event does not affect the outcome of the othero Compound dependent events – events with more than one outcome, and the outcome of one event affects the outcome of the
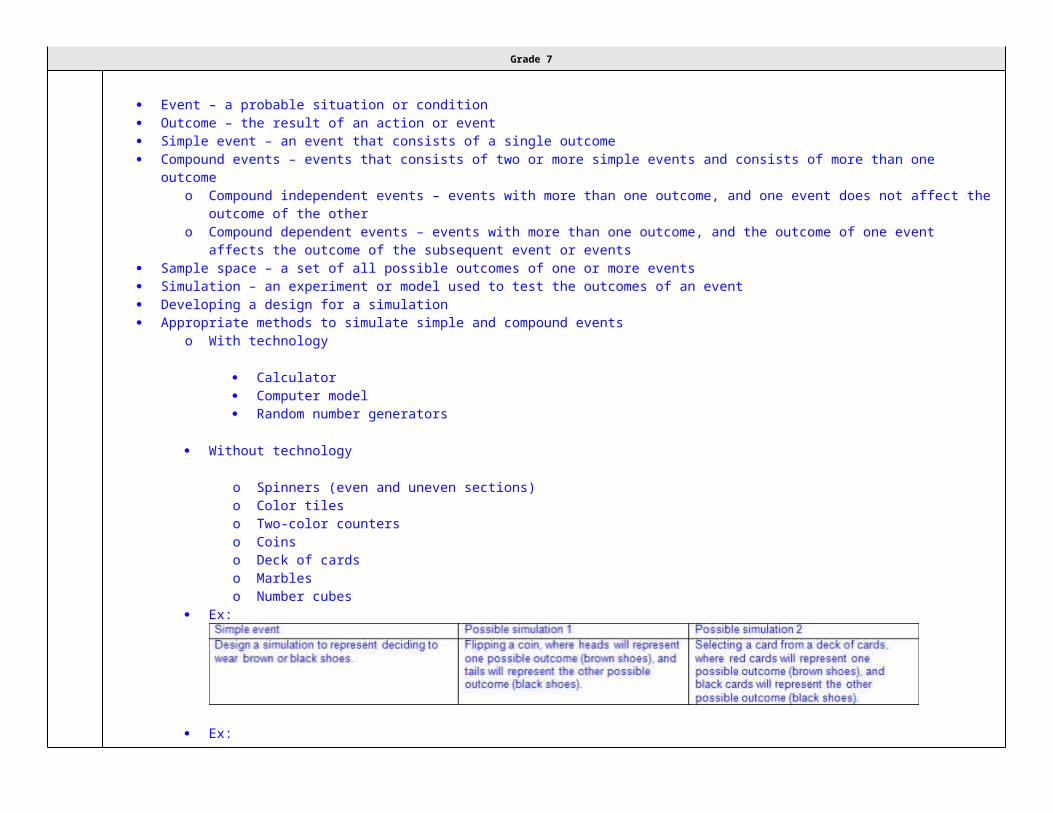
subsequent event or events Sample space – a set of all possible outcomes of one or more events Simulation – an experiment or model used to test the outcomes of an event Developing a design for a simulation Appropriate methods to simulate simple and compound events
o With technology
Calculator Computer model Random number generators

Grade 7
Without technology
o Spinners (even and uneven sections)o Color tileso Two-color counterso Coinso Deck of cardso Marbleso Number cubes
Ex:
Ex:
Note(s):
Grade Level(s):o Grade 7 introduces selecting and using different simulations to represent simple and compound events with and without technology.o Various mathematical process standards will be applied to this student expectation as appropriate.
TxRCFP:o Representing and applying proportional relationships
TxCCRS:o V. Probabilistic Reasoning

Grade 7
o VIII. Problem Solving and Reasoningo IX. Communication and Representation
7.6C Make predictions and determine solutions using experimental data for simple and compound events.
Supporting StandardMake predictions and determine solutions using experimental data for simple and compound events.
Supporting StandardPredict, DetermineSOLUTIONS USING EXPERIMENTAL DATA FOR SIMPLE AND COMPOUND EVENTSIncluding, but not limited to:
Positive rational numbers – the set of numbers that can be expressed as a fraction , where a and b are whole numbers and b ≠ 0, which
includes the subsets of whole numbers and counting (natural) numbers (e.g., 0, 2, etc.). Various forms of positive rational numbers
o Whole numberso Decimals (less than or equal to one)o Fractions (proper or equal to one)o Percents (less than or equal to 100%)
Event – a probable situation or condition Outcome – the result of an action or event Mutually exclusive events – events that cannot happen at the same time
Ex:
Grade 7
Experimental data – the data collected or observed from the outcomes of an experimento Various types of experiments
o Ex: Coins, drawing objects out of box without looking, spinners with even and uneven sections, choosing a random card, marbles, number cubes, etc.
o Representation of experimental data as a fraction, decimal, or percent
o Ex: Three out of the ten throws were strikes: , 0.3, 30% Simple event – an event that consists of a single outcome Compound events – events that consists of two or more simple events and consists of more than one outcome
o Compound independent events – events with more than one outcome, and one event does not affect the outcome of the othero Compound dependent events – events with more than one outcome, and the outcome of one event affects the outcome of the
subsequent event or events Proportional reasoning to make predictions using experimental data
Ex:

Grade 7
Ex:

Grade 7
Ex:

Grade 7
Note(s):
Grade Level(s):o Grade 7 introduces making predictions and determining solutions using experimental data for simple and compound events.o Various mathematical process standards will be applied to this student expectation as appropriate.
TxRCFP:o Representing and applying proportional relationships
TxCCRS:o I. Numeric Reasoningo V. Probabilistic Reasoningo VI. Statistical Reasoningo VIII. Problem Solving and Reasoningo IX. Communication and Representation

Grade 7
7.6D Make predictions and determine solutions using theoretical probability for simple and compound events.
Supporting StandardMake predictions and determine solutions using theoretical probability for simple and compound events.
Supporting StandardPredict, DetermineSOLUTIONS USING THEORETICAL PROBABILITY FOR SIMPLE AND COMPOUND EVENTSIncluding, but not limited to:
Positive rational numbers – the set of numbers that can be expressed as a fraction , where a and b are whole numbers and b ≠ 0, which
includes the subsets of whole numbers and counting (natural) numbers (e.g., 0, 2, etc.). Various forms of positive rational numbers
o Whole numberso Decimals (less than or equal to one)o Fractions (proper or equal to one)o Percents (less than or equal to 100%)
Event – a probable situation or condition Outcome – the result of an action or event Mutually exclusive events – events that cannot happen at the same time
Ex:

Grade 7
Sample space – a set of all possible outcomes of one or more events Probability – a ratio between the number of desired outcomes to the total possible outcomes, 0 ≤ p ≤1
o Probability = o Notation for probability
P(event)o The closer a probability of an outcome is to 1, the more likely the outcome will occur; whereas, the closer a probability of an outcome
is to 0, the less likely the outcome will occur.
o Ex:
Theoretical probability – the likelihood of an event occurring without conducting an experimento Various types of theoretical experiments
o Ex: Coins, drawing objects out of box without looking, spinners with even and uneven sections, choosing a random card, marbles, number cubes, etc.
o Representation of theoretical probability as a fraction, decimal, or percent
o Ex: Three out of the ten sections are blue: , 0.3, 30% Simple event – an event that consists of a single outcome Compound events – events that consists of two or more simple events and consists of more than one outcome
o Compound independent events – events with more than one outcome, and one event does not affect the outcome of the othero Compound dependent events – events with more than one outcome, and the outcome of one event affects the outcome of the
subsequent event or events

Grade 7
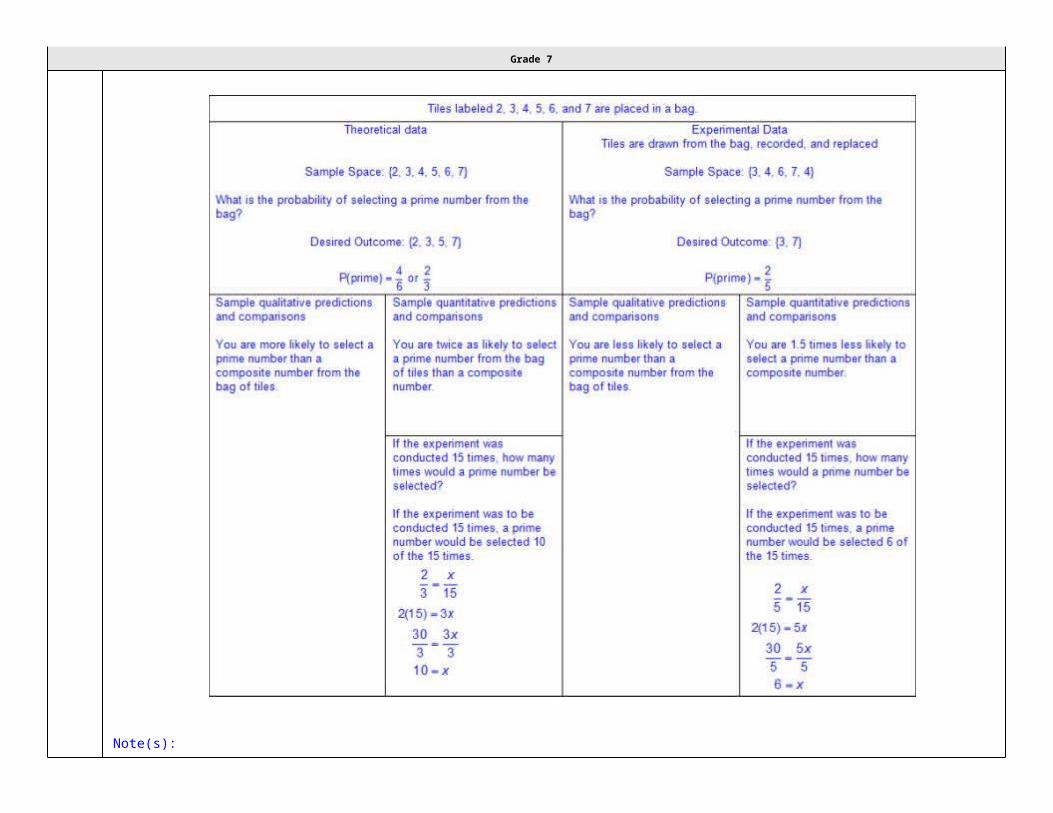
Proportional reasoning to make predictions using theoretical probability
Ex:
Ex:

Grade 7
Ex:

Grade 7
Note(s):
Grade Level(s):o Grade 7 introduces making predictions and determining solutions using theoretical probability for simple and compound events.o Various mathematical process standards will be applied to this student expectation as appropriate.
TxRCFP:o Representing and applying proportional relationships
TxCCRS:o I. Numeric Reasoningo V. Probabilistic Reasoningo VI. Statistical Reasoningo VIII. Problem Solving and Reasoningo IX. Communication and Representation

Grade 7
7.6E Find the probabilities of a simple event and its complement and describe the relationship between the two.
Supporting StandardFind the probabilities of a simple event and its complement and describe the relationship between the two.
Supporting StandardFindTHE PROBABILITIES OF A SIMPLE EVENT AND ITS COMPLEMENT AND DESCRIBE THE RELATIONSHIP BETWEEN THE TWOIncluding, but not limited to:
Positive rational numbers – the set of numbers that can be expressed as a fraction , where a and b are whole numbers and b ≠ 0, which
includes the subsets of whole numbers and counting (natural) numbers (e.g., 0, 2, etc.). Various forms of positive rational numbers
o Whole numberso Decimals (less than or equal to one)o Fractions (proper or equal to one)o Percents (less than or equal to 100%)
Event – a probable situation or condition Outcome – the result of an action or event Sample space – a set of all possible outcomes of one or more events Probability – a ratio between the number of desired outcomes to the total possible outcomes, 0 ≤ p ≤1
o Probability = o Notation for probability
P(event)o The closer a probability of an outcome is to 1, the more likely the outcome will occur; whereas, the closer a probability of an outcome
is to 0, the less likely the outcome will occur.
o Ex:

Grade 7
Various types of simple experiments
Ex: coins, drawing objects out of box without looking, spinners with even and uneven sections, choosing a random card, marbles, cubes, etc.
Simple event – an event that consists of a single outcome Complement of an event – the probability of the non-occurrence of a desired outcome
Ex: The probability of selecting a face card from a deck of cards is or . The complement of selecting a face card from a deck of
cards is the probability of selecting any card but a face card from a deck of cards which is or . The outcomes of a simple event and its complement complete the sample space.
Ex:

Grade 7
Representation of probability and complements as a fraction, decimal, or percent
Ex: The probability of not selecting a day of the week with a “u” in the name of the day: , 0.6, 60% Relationship between a simple event and its complement expressed as a ratio or numerical expression.
o The sum of the probability of a simple event and its complement will always be 1.
o Ex:

Grade 7
Ex: If, P(A) = , then P(not A) = or . Therefore, P(A) + P(not A) = = 1
Note(s):
Grade Level(s):o Grade 7 introduces finding the probabilities of a simple event and its complement and describing the relationship between the two.o Various mathematical process standards will be applied to this student expectation as appropriate.

Grade 7
TxRCFP:o Representing and applying proportional relationships
TxCCRS:o I. Numeric Reasoningo V. Probabilistic Reasoningo VIII. Problem Solving and Reasoningo IX. Communication and Representation
7.6F Use data from a random sample to make inferences about a population.
Use data from a random sample to make inferences about a population.UseDATA FROM A RANDOM SAMPLE TO MAKE INFERENCES ABOUT A POPULATIONIncluding, but not limited to:
Positive rational numbers – the set of numbers that can be expressed as a fraction , where a and b are whole numbers and b ≠ 0, which
includes the subsets of whole numbers and counting (natural) numbers (e.g., 0, 2, etc.). Various forms of positive rational numbers
o Whole numberso Decimals (less than or equal to one)o Fractions (proper or equal to one)o Percents (less than or equal to 100%)
Data – information that is collected about people, events, or objects Inference – a conclusion or prediction based on data Population – total collection of persons, objects, or items of interest Sample – a subset of the population selected in order to make inferences about the entire population
Ex:
Ex:

Grade 7
Random sample – a subset of the population selected without bias in order to make inferences about the entire populationo Random samples are more likely to contain data that can be used to make predictions about a whole population.
Data from a random sample given or collected in various formso Verbal
o Ex:
Tabular (vertical/horizontal)
Ex:
Graphical
Ex:

Grade 7
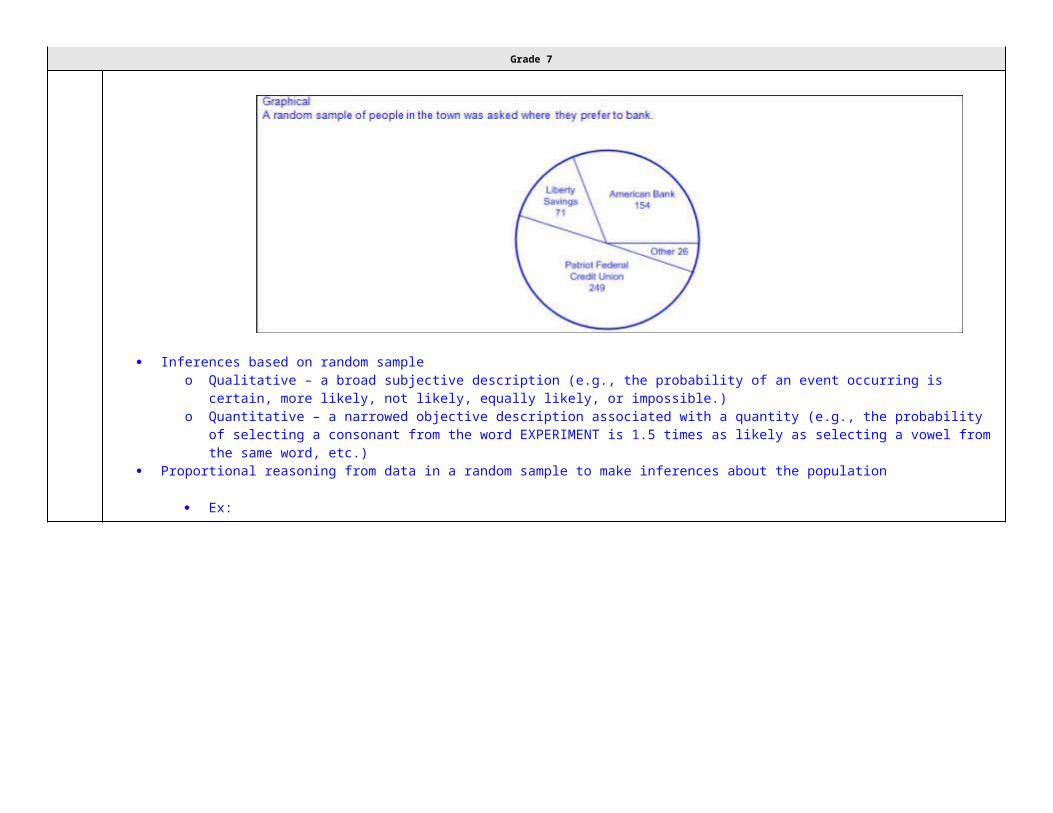
Inferences based on random sampleo Qualitative – a broad subjective description (e.g., the probability of an event occurring is certain, more likely, not likely, equally likely,
or impossible.)o Quantitative – a narrowed objective description associated with a quantity (e.g., the probability of selecting a consonant from the word
EXPERIMENT is 1.5 times as likely as selecting a vowel from the same word, etc.) Proportional reasoning from data in a random sample to make inferences about the population
Ex:

Grade 7
Note(s):
Grade Level(s):o Grade 7 introduces using data from random samples to make inferences about a population.o Various mathematical process standards will be applied to this student expectation as appropriate.
TxRCFP:o Representing and applying proportional relationships
Grade 7
TxCCRS:o I. Numeric Reasoningo IV. Measurement Reasoningo VI. Statistical Reasoningo VIII. Problem Solving and Reasoningo IX. Communication and Representation
7.6G Solve problems using data represented in bar graphs, dot plots, and circle graphs, including part-to-whole and part-to-part comparisons
and equivalents.
Readiness StandardSolve problems using data represented in bar graphs, dot plots, and circle graphs, including part-to-whole and part-to-part comparisons
and equivalents.
Readiness StandardSolvePROBLEMS USING DATA REPRESENTED IN BAR GRAPHS, DOT PLOTS, AND CIRCLE GRAPHS, INCLUDING PART-TO-WHOLE AND PART-TO-PART COMPARISONS AND EQUIVALENTSIncluding, but not limited to:
Positive rational numbers – the set of numbers that can be expressed as a fraction , where a and b are whole numbers and b ≠ 0, which
includes the subsets of whole numbers and counting (natural) numbers (e.g., 0, 2, etc.). Various forms of positive rational numbers
o Whole numberso Decimals (less than or greater than one)o Fractions (proper, improper, and mixed numbers)o Percents converted to equivalent decimals or fractions for multiplying or dividing
Data – information that is collected about people, events, or objectso Categorical data – data that represents the attributes of a group of people, events, or objects
o Ex: What is your favorite color? Represented on a graph with colors as category labels (e.g., red, yellow, blue, green, and

Grade 7
purple).o Ex: Do you have a brother? Represented on a graph with yes and no as category labels.o Ex: Which sporting event do you prefer? Represented on a graph with names of sports as category labels (e.g., basketball,
baseball, football, soccer, and hockey).o Categorical data may represent numbers or ranges of numbers.
o Ex: How many pets do you have? Represented on a graph with numbers as category labels (e.g., 0, 1, 2, 3, and 4 or more).
o Ex: How many letters are in your name? Represented on a graph with ranges of numbers as category labels (e.g., 1 – 3, 4 – 6, 7 – 9, and 10 or more).
o Numerical data – data that represents values or observations that can be measured and placed in ascending or descending ordero Data can be counted (discrete) or measured (continuous).o Ex: How many hours do you spend studying each night? Represented on a graph with a numerical axis.o Ex: How old were you when you lost your first tooth? Represented on a graph with a numerical axis.
Data representationso Bar graph – a graphical representation to organize data that uses solid bars that do not touch each other to show the frequency
(number of times) that each category occurs
Characteristics of a bar grapho Title clarifies the meaning of the data represented.o Subtitles clarify the meaning of the data represented on each axis.o Categorical data is represented with labels.o Horizontal or vertical linear arrangemento Bars are solid.o Bars do not touch.o Scale of the axis may be intervals of one or more, and scale intervals are proportionally displayed.
The scale of the axis is a number line.o Length of the bar represents the number of data points for a given category.
Length the bar represents the distance from zero on the scale of the axis.o Value of the data represented by the bar is determined by reading the number associated with its length (distance
from zero) on the axis scale.o Dot plot – a graphical representation to organize data that uses dots (or Xs) to show the frequency (number of times) that each
number occurs
o Characteristics of a dot plot

Grade 7
o Title clarifies the meaning of the data represented.o Numerical data is represented with labels and may be whole numbers, fractions, or decimals.o Data represented may be numbers.
o Counts related to numbers represented by a number line.o Dots (or Xs) recorded vertically above the line to represent the frequency of each number.o Dots (or Xs) generally represent one count.o Dots (or Xs) may represent multiple counts if indicated with a key.o Density of dots relates to the frequency of distribution of the data.
o Circle graph – a circular graph with partitions (sections) that represent a part of the totalo Characteristics of a circle graph
o Title clarifies the meaning of the data represented.o Categorical data is represented as partitions of the circle.
o Size of partition is proportional to the magnitude of the quantity and its relationship to the 360° of the circle.
oo Partitions generally labeled as percents or fractions.
o When labeled as percents, the sum of the quantities of the partitions is 100%.o When labeled as fractions, the sum of the quantities of the partitions is 1.
Proportional relationships within data representations
Part-to-whole comparisons Part-to-part comparisons
Ex:

Grade 7

Grade 7
7.6H Solve problems using qualitative and quantitative predictions and comparisons from simple experiments.
Readiness StandardSolve problems using qualitative and quantitative predictions and comparisons from simple experiments.
Readiness StandardSolvePROBLEMS USING QUALITATIVE AND QUANTITATIVE PREDICTIONS AND COMPARISONS FROM SIMPLE EXPERIMENTSIncluding, but not limited to:
Positive rational numbers – the set of numbers that can be expressed as a fraction , where a and b are whole numbers and b ≠ 0, which
includes the subsets of whole numbers and counting (natural) numbers (e.g., 0, 2, etc.). Various forms of positive rational numbers
o Whole numberso Decimals (less than or equal to one)o Fractions (proper or equal to one)o Percents (less than or equal to 100%)
Event – a probable situation or condition Outcome – the result of an action or event Sample space – a set of all possible outcomes of one or more events Probability – a ratio between the number of desired outcomes to the total possible outcomes, 0 ≤ p≤1
o Probability = o Notation for probability
P(event)o The closer a probability of an outcome is to 1, the more likely the outcome will occur; whereas, the closer a probability of an outcome
is to 0, the less likely the outcome will occur.
o Ex:

Grade 7
Simple experiment – an experiment with one simple evento Various types of simple experiments
o Ex: coins, drawing objects out of box without looking, spinners with even and uneven sections, choosing a random card, marbles, cubes, etc.
Theoretical data – the possible outcomes of an event without conducting an experiment Experimental data – the data collected or observed from the outcomes of an experiment Predictions and comparisons
o Qualitative – a broad subjective description (e.g., the probability of an event occurring is certain, more likely, not likely, equally likely, or impossible.)
o Quantitative – a narrowed objective description associated with a quantity (e.g., the probability of selecting a consonant from the word EXPERIMENT is 1.5 times as likely as selecting a vowel from the same word, etc.)
Proportional reasoning to make predictions and comparisons from simple experiments
Ex:

Grade 7
Note(s):

Grade 7
Grade Level(s):o Grade 7 introduces solving problems using qualitative and quantitative predictions and comparisons from simple experiments.o Various mathematical process standards will be applied to this student expectation as appropriate.
TxRCFP:o Representing and applying proportional relationships
TxCCRS:o I. Numeric Reasoningo IV. Measurement Reasoningo V. Probabilistic Reasoningo VI. Statistical Reasoningo VIII. Problem Solving and Reasoningo IX. Communication and Representation
7.6I Determine experimental and theoretical probabilities related to simple and compound events using data and sample spaces.
Readiness StandardDetermine experimental and theoretical probabilities related to simple and compound events using data and sample spaces.
Readiness StandardDetermineEXPERIMENTAL AND THEORETICAL PROBABILITIES RELATED TO SIMPLE AND COMPOUND EVENTS USING DATA AND SAMPLE SPACESIncluding, but not limited to:
Positive rational numbers – the set of numbers that can be expressed as a fraction , where a and b are whole numbers and b ≠ 0, which
includes the subsets of whole numbers and counting (natural) numbers (e.g., 0, 2, etc.). Various forms of positive rational numbers
o Whole numberso Decimals (less than or equal to one)o Fractions (proper or equal to one)o Percents (less than or equal to 100%)
Grade 7
Event – a probable situation or condition Outcome – the result of an action or event Mutually exclusive events – events that cannot happen at the same time
Ex:
Sample space – a set of all possible outcomes of one or more eventso Various representations of sample space
Lists Tree diagrams Tables Fundamental Counting Principle – if one event has a possible outcomes and a second independent event has b possible
outcomes, then there are a • b total possible outcomes for the two events together Probability – a ratio between the number of desired outcomes to the total possible outcomes, 0 ≤ p≤1
o Probability = o Notation for probability
P(event)o The closer a probability of an outcome is to 1, the more likely the outcome will occur; whereas, the closer a probability of an outcome
is to 0, the less likely the outcome will occur.
o Ex:

Grade 7
Theoretical probability – the likelihood of an event occurring without conducting an experiment Experimental probability – the likelihood of an event occurring from the outcomes of an experiment Various types of experiments
Ex: Coins, drawing objects out of box without looking, spinners with even and uneven sections, choosing a random card, marbles, number cubes, etc.
Representation of probability as a fraction, decimal, or percent
Ex: Three out of the ten sections are blue: , 0.3, 30% Complement of an event – the probability of the non-occurrence of a desired outcome
Ex: The probability of selecting a face card from a deck of cards is or . The complement of selecting a face card from a deck of
cards is the probability of selecting any card but a face card from a deck of cards which is or . The outcomes of an event and its complement complete the sample space.
Relationship between an event and its complement expressed as a ratio or numerical expression
o The sum of the probability of an event and its complement will always be 1.
o Ex: If, P(A) = , then P(not A) = or . Therefore, P(A) + P(not A) = = 1 Relationship between theoretical and experimental probability
o Law of large numbers – as the number of trials increases the difference between the experimental and theoretical probability will be closer to zero
Simple event – an event that consists of a single outcome

Grade 7
Ex:
Compound events – events that consists of two or more simple events and consists of more than one outcomeo Compound independent events – events with more than one outcome, and one event does not affect the outcome of the other
o Ex:

Grade 7
Compound dependent events – events with more than one outcome, and the outcome of one event affects the outcome of the subsequent event or events
Ex:

Grade 7
Note(s):
Grade Level(s):o Grade 7 introduces determining experimental and theoretical probabilities related to simple and compound events using data and
sample spaces.o Various mathematical process standards will be applied to this student expectation as appropriate.
TxRCFP:o Representing and applying proportional relationships
TxCCRS:o I. Numeric Reasoningo IV. Measurement Reasoningo V. Probabilistic Reasoning

Grade 7
o VIII. Problem Solving and Reasoningo IX. Communication and Representation
7.7 Expressions, equations, and relationships. The student applies mathematical process standards to represent linear relationships using multiple representations. The student is expected to:
7.7A Represent linear relationships using verbal descriptions, tables, graphs, and equations that simplify to the form y = mx + b.
Readiness StandardRepresent linear relationships using verbal descriptions, tables, graphs, and equations that simplify to the form y = mx + b.
Readiness StandardRepresentLINEAR RELATIONSHIPS USING VERBAL DESCRIPTIONS, TABLES, GRAPHS, AND EQUATIONS THAT SIMPLIFY TO THE FORM y = mx + bIncluding, but not limited to:
Rational numbers – the set of numbers that can be expressed as a fraction , where a and b are integers and b ≠ 0, which includes the
subsets of integers, whole numbers, and counting (natural) numbers (e.g., -3, 0, 2, etc.). The set of rational numbers is denoted by the symbol Q.
Various forms of positive and negative rational numbers as constants and coefficientso Coefficient – a number that is multiplied by a variable(s)o Constant – a fixed value that does not appear with a variable(s)o Whole numberso Integerso Decimals (less than or greater than one)o Fractions (proper, improper, and mixed numbers)
Constant rate of change – a ratio when the dependent, y-value, changes at a constant rate for each independent, x-value Linear relationship – a relationship with a constant rate of change represented by a graph that forms a straight line
o Linear proportional relationship

Grade 7
Linear Represented by y = kx or y = mx + b (slope intercept form), where b = 0
Constant of proportionality represented as
Constant rate of change represented as m = or m = Passes through the origin (0,0) meaning b = 0 in y = mx + b b represents the y-coordinate when the x-coordinate of the ordered pair is 0, (0,b)
o Linear non-proportional relationship
o Linearo Represented by y = mx + b (slope intercept form), where b ≠ 0
o Constant rate of change represented as m = or m = o Does not pass through the origin (0,0) meaning b ≠ 0 in y = mx + bo b represents the y-coordinate of the ordered pair when 0 is the x-coordinate of the ordered pair, (0,b)
Rate of change is either positive, negative, zero, or undefined
Ex:
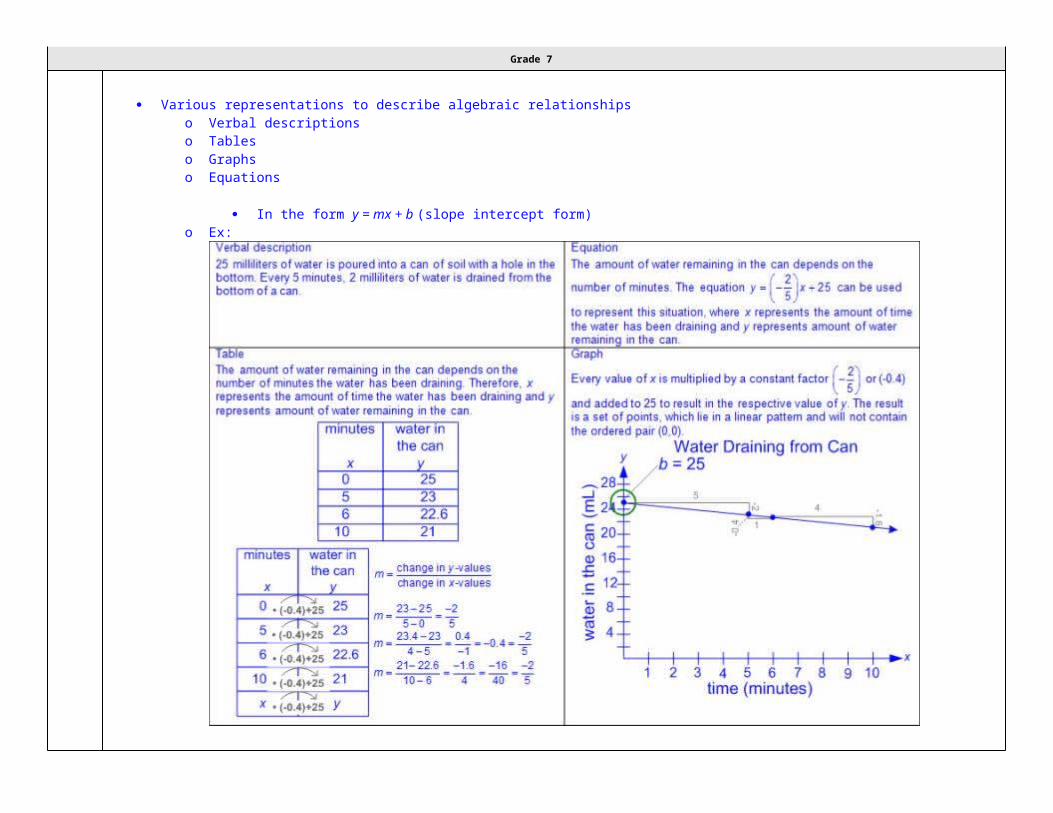
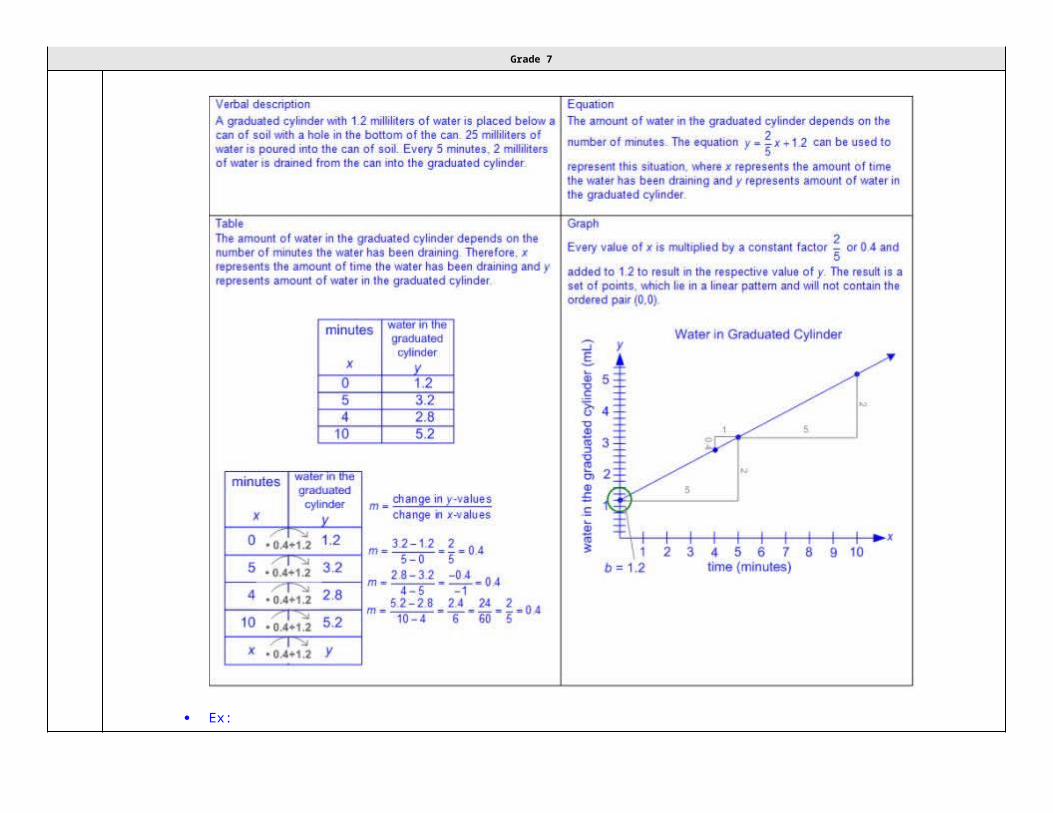
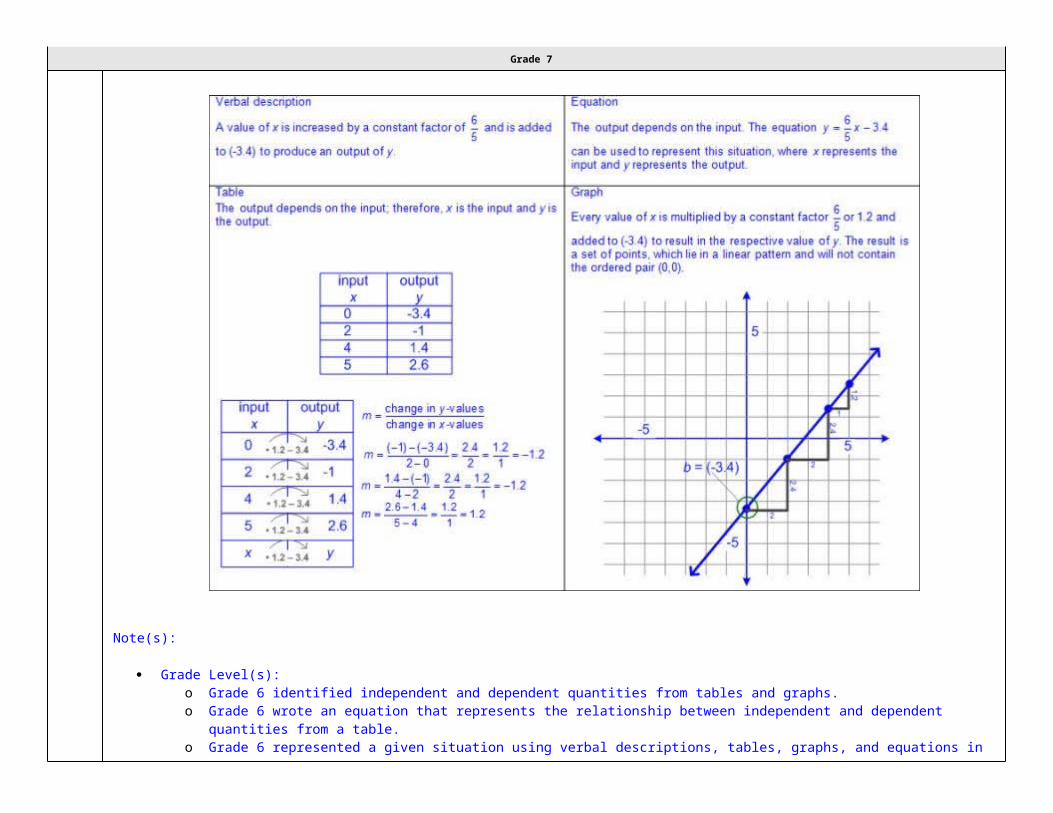
Various representations to describe algebraic relationshipso Verbal descriptionso Tableso Graphso Equations

Grade 7
In the form y = mx + b (slope intercept form)o Ex:
Ex:

Grade 7
Ex:
Grade 7
Ex:

Grade 7
Note(s):
Grade Level(s):o Grade 6 identified independent and dependent quantities from tables and graphs.o Grade 6 wrote an equation that represents the relationship between independent and dependent quantities from a table.o Grade 6 represented a given situation using verbal descriptions, tables, graphs, and equations in the form y = kx or y = x + b.o Grade 8 will represent linear non-proportional situations with tables, graphs, and equations in the form of y = mx + b, where b ≠ 0.
Grade 7
o Grade 8 will write an equation in the form y = mx + b to model a linear relationship between two quantities using verbal, numerical, tabular, and graphical representations.
o Grade 8 will distinguish between proportional and non-proportional situations using tables, graphs, and equations in the form y = kx or y = mx + b, where b ≠ 0.
o Various mathematical process standards will be applied to this student expectation as appropriate. TxRCFP:
o Using expressions and equations to describe relationships in a variety of contexts, including geometric problems TxCCRS:
o I. Numeric Reasoningo II. Algebraic Reasoningo VIII. Problem Solving and Reasoningo IX. Communication and Representation
7.8 Expressions, equations, and relationships. The student applies mathematical process standards to develop geometric relationships with volume. The student is expected to:
7.8A Model the relationship between the volume of a rectangular prism and a rectangular pyramid having both congruent bases and heights and
connect that relationship to the formulas.
Model the relationship between the volume of a rectangular prism and a rectangular pyramid having both congruent bases and heights and
connect that relationship to the formulas.ModelTHE RELATIONSHIP BETWEEN THE VOLUME OF A RECTANGULAR PRISM AND A RECTANGULAR PYRAMID HAVING BOTH CONGRUENT BASES AND HEIGHTS AND CONNECT THAT RELATIONSHIP TO THE FORMULASIncluding, but not limited to:
Three-dimensional figure – a figure that has measurements including length, width (depth), and heighto Attributes of rectangular prisms and pyramids
Rectangular prism
o 6 rectangular faces (2 parallel rectangular faces [bases], 4 rectangular faces)o 12 edgeso 8 vertices
Grade 7
o Face – a flat surface of a three-dimensional figureo Base of a rectangular prism – any two congruent, opposite and parallel faces shaped like rectangles; possibly more
than one seto Height of a rectangular prism – the length of a side that is perpendicular to both bases
Rectangular pyramido 5 faces (1 rectangular face [base], 4 triangular faces)o 8 edgeso 5 verticeso Base of a rectangular pyramid – a rectangle attached to triangular faces meeting at a pointo Height of a rectangular pyramid – the length of a perpendicular line segment from the vertex of the pyramid to the
base Volume – the measurement attribute of the amount of space occupied by matter
o One way to measure volume is a three-dimensional cubic measure Congruent – of equal measure, having exactly the same size and same shape Various models to represent the relationship between the volume of a rectangular prism and a rectangular pyramid having both congruent
bases and heightso Filling the rectangular pyramid with a measurable unit (e.g., rice, sand, water, etc.) and emptying the contents into the rectangular
prism until the rectangular prism is completely full The contents of the rectangular pyramid will need to be emptied three times in order to fill the rectangular prism completely.
o Creating a replica of the rectangular pyramid and rectangular prisms with clay and comparing their masses The mass of the rectangular prism will be three times the mass of the rectangular pyramid, whereas the mass of the
rectangular pyramid is the mass of the rectangular prism. Generalizations from models used to represent the relationship between the volume of a rectangular prism and a rectangular pyramid having
congruent bases and heightso The volume of a rectangular prism is three times the volume of a rectangular pyramid.
o The volume of a rectangular pyramid is the volume of a rectangular prism. Connections between models to represent volume of a rectangular prism and rectangular pyramid having both congruent bases and heights
to the formulas for volumeo Formulas for volume from STAAR Grade 7 Mathematics Reference Materials
Prismo V = Bh, where B represents the base area and h represents the height of the prism which is the number of times the
base area is repeated or layered
Rectangular prism
Grade 7
o The base of a rectangular prism is a rectangle whose area may be found with the formula, A = bh or A = lw, meaning the base area, B, may be found with the formula B = bh or B = lw; therefore, the volume of a rectangular prism may be found using V = Bh or V = (bh)h or V = (lw)h.
Pyramid
V = Bh, where B represents the base area and h represents the height of the pyramid Rectangular pyramid
The base of a rectangular pyramid is a rectangle whose area may be found with the formula, A = bh or A = lw, meaning the base area, B, may be found with the formula B = bh or B =
lw; therefore the volume of a rectangular pyramid may be found using V = Bh or V =
(bh)h or V = (lw)h.o Ex:
Note(s):
Grade Level(s):o Grade 6 modeled area formulas for parallelograms, trapezoids, and triangles by decomposing and rearranging parts of these shapes.o Grade 8 will describe the volume formula V = Bh of a cylinder in terms of its base area and its height.

Grade 7
o Various mathematical process standards will be applied to this student expectation as appropriate. TxRCFP:
o Using expressions and equations to describe relationships in a variety of contexts, including geometric problems TxCCRS:
o IV. Measurement Reasoningo VIII. Problem Solving and Reasoningo IX. Communication and Representation
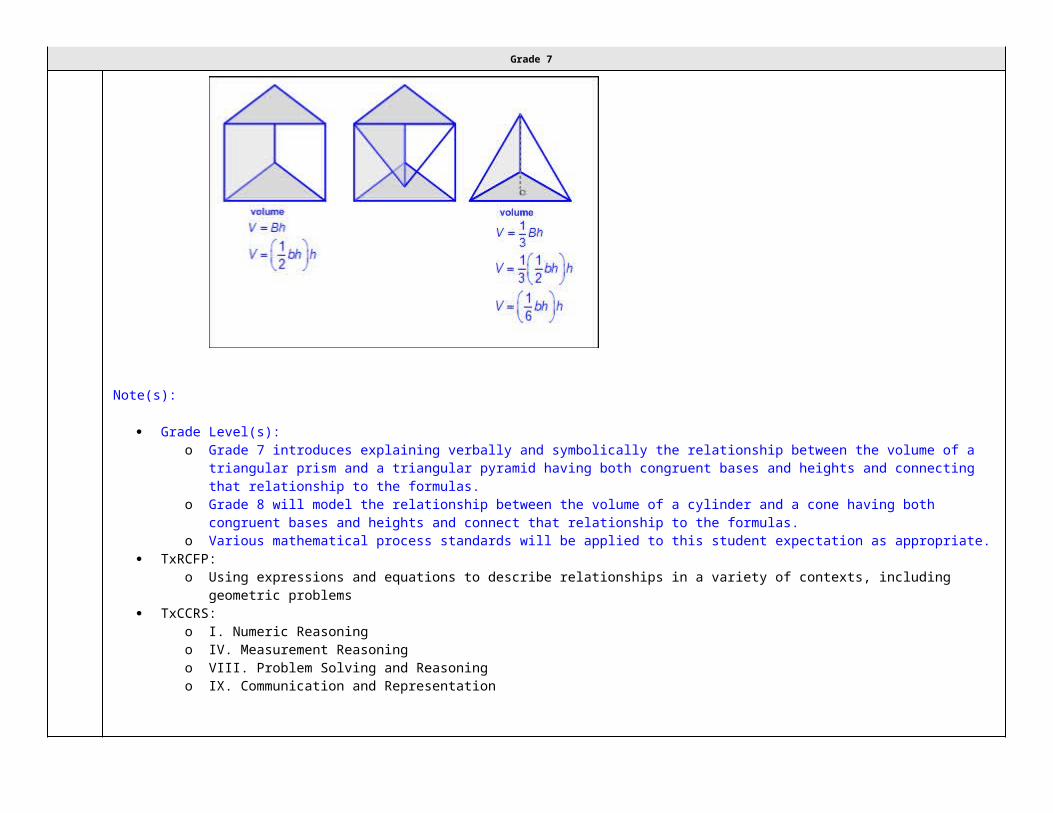
7.8B Explain verbally and symbolically the relationship between the volume of a triangular prism and a triangular pyramid having both
congruent bases and heights and connect that relationship to the formulas.
Explain verbally and symbolically the relationship between the volume of a triangular prism and a triangular pyramid having both
congruent bases and heights and connect that relationship to the formulas.ExplainVERBALLY AND SYMBOLICALLY THE RELATIONSHIP BETWEEN THE VOLUME OF A TRIANGULAR PRISM AND A TRIANGULAR PYRAMID HAVING BOTH CONGRUENT BASES AND HEIGHTS AND CONNECT THAT RELATIONSHIP TO THE FORMULASIncluding, but not limited to:
Three-dimensional figure – a figure that has measurements including length, width (depth), and heighto Attributes of triangular prisms and pyramids
Triangular prism
o 5 faces (2 triangular faces [bases], 3 rectangular faces)o 9 edgeso 6 verticeso Face – a flat surface of a three-dimensional figureo Base of a triangular prism – the two congruent, opposite and parallel faces shaped like triangleso Height of a triangular prism – the length of a side that is perpendicular to a base
Triangular pyramido 4 faces (1 triangular face [base], 3 triangular faces)o 6 edgeso 4 verticeso Base of a triangular pyramid – a triangle attached to triangular faces meeting at a pointo Height of a triangular pyramid – the length of a perpendicular line segment from the vertex of the pyramid to the base

Grade 7
Volume – the measurement attribute of the amount of space occupied by mattero One way to measure volume is a three-dimensional cubic measure
Congruent – of equal measure, having exactly the same size and same shape Generalizations of the relationship between the volume of a triangular prism and a triangular pyramid having congruent bases and heights
o The volume of a triangular prism is three times the volume of a triangular pyramid.
o The volume of a triangular pyramid is the volume of a triangular prism. Connections between models to represent volume of a triangular prism and triangular pyramid having both congruent bases and heights to
the formulas for volumeo Formulas for volume from STAAR Grade 7 Mathematics Reference Materials
Prismo V = Bh, where B represents the base area and h represents the height of the prism which is the number of times the
base area is repeated or layered)
Triangular prism
o The base of a triangular prism is a triangle whose area may be found with the formula, A = bh,
meaning the base area, B, may be found using B = bh; therefore, the volume of a triangular prism
may be found using V = Bh or V = .o Pyramid
o V = Bh, where B represents the base area and h represents the height of the pyramido Triangular pyramid
o The base of a triangular pyramid is a triangle whose area may be found with the formula, A = bh, meaning
the base area, B, may be found using B = bh; therefore, the volume of a triangular pyramid may be found
using V = Bh or V = or V = .o Ex:

Grade 7
Note(s):
Grade Level(s):o Grade 7 introduces explaining verbally and symbolically the relationship between the volume of a triangular prism and a triangular
pyramid having both congruent bases and heights and connecting that relationship to the formulas.o Grade 8 will model the relationship between the volume of a cylinder and a cone having both congruent bases and heights and
connect that relationship to the formulas.o Various mathematical process standards will be applied to this student expectation as appropriate.
TxRCFP:o Using expressions and equations to describe relationships in a variety of contexts, including geometric problems
TxCCRS:o I. Numeric Reasoningo IV. Measurement Reasoningo VIII. Problem Solving and Reasoningo IX. Communication and Representation
7.8C Use models to determine the approximate formulas for the circumference and area of a circle and connect the models to the actual
formulas.

Grade 7
Use models to determine the approximate formulas for the circumference and area of a circle and connect the models to the actual
formulas.UseMODELS TO DETERMINE THE APPROXIMATE FORMULAS FOR THE CIRCUMFERENCE AND AREA OF A CIRCLE AND CONNECT THE MODELS TO THE ACTUAL FORMULASIncluding, but not limited to:
Circleo A figure formed by a closed curve with all points equal distance from the centero No straight sideso No verticeso No parallel or, perpendicular sideso Diameter – a line segment whose endpoints are on the circle and passes through the center of the circleo Radius – a line segment drawn from the center of a circle to any point on the circle and is half the length of diameter of the circle
Circumference – a linear measurement of the distance around a circle Pi (π) – the ratio of the circumference to the diameter of a circle Various models to approximate the formulas for the circumference of a circle
o Using a string to measure the length around a circle, and another piece of string to measure the length of the diameter of the circle
The length of the string representing the circumference of the circle will be a little more than three times longer than the length of the string representing the diameter of the circle
Using centimeter cubes to measure the length around a circle, and using centimeter cubes to measure the length of the radius of the circle
o The number of centimeter cubes needed to represent the radius of the circle is a little more than one-sixth of the number of centimeter cubes needed to represent the length of the circumference of the circle.
Circumference using the diameter of a circle
Ex:

Grade 7
Circumference using the radius of a circle
Ex:
Generalizations of models used to determine the approximate formulas for circumference of a circleo The circumference of a circle is a little more than three times the length of the diameter of a circle.o The circumference of a circle is a little more than three times twice the length of the radius of a circle or a little more than 6 times the
radius.
Grade 7
Connections between models to represent the circumference of a circle and formulas for circumferenceo Formulas for circumference from STAAR Grade 7 Mathematics Reference Materials
Circumference using the diameter of a circle
o C = πd, where C represents the circumference of the circle, d represents the diameter of the circle, and π represents the approximate number of times the diameter wraps the circumference of the circle.
The ratio of the circumference to the diameter of the circle is a little more than 3 and denoted by π ≈ 3.14. Circumference using the radius of a circle
o C = 2πr, where C represents the circumference of the circle, r represents the radius of the circle, and π represents the approximate number of times the radius wraps the circumference of the circle.
The ratio of the circumference to the radius of the circle is a little more than 6. The ratio of the circumference to the radius of the circle is twice as much as the ratio of the circumference to
the diameter of the circle. The ratio of the circumference to the diameter of the circle is a little more than 3 and denoted by π ≈ 3.14.
Area – the measurement attribute that describes the number of square units a figure or region coverso Area is a two-dimensional square unit measure.
Various models to approximate the formula for the area of a circleo Cutting a circle into equally sized pieces from the center of the circle to the outside of the circle where the length of the non-curved
side is the length of the radius of the circle, then laying the equally-sized pieces next to each other to create a figure similar to the shape of a rectangle
The area of the rectangle (formed with pieces of the circle) is a little more than three times the length of the radius squared. Ex:
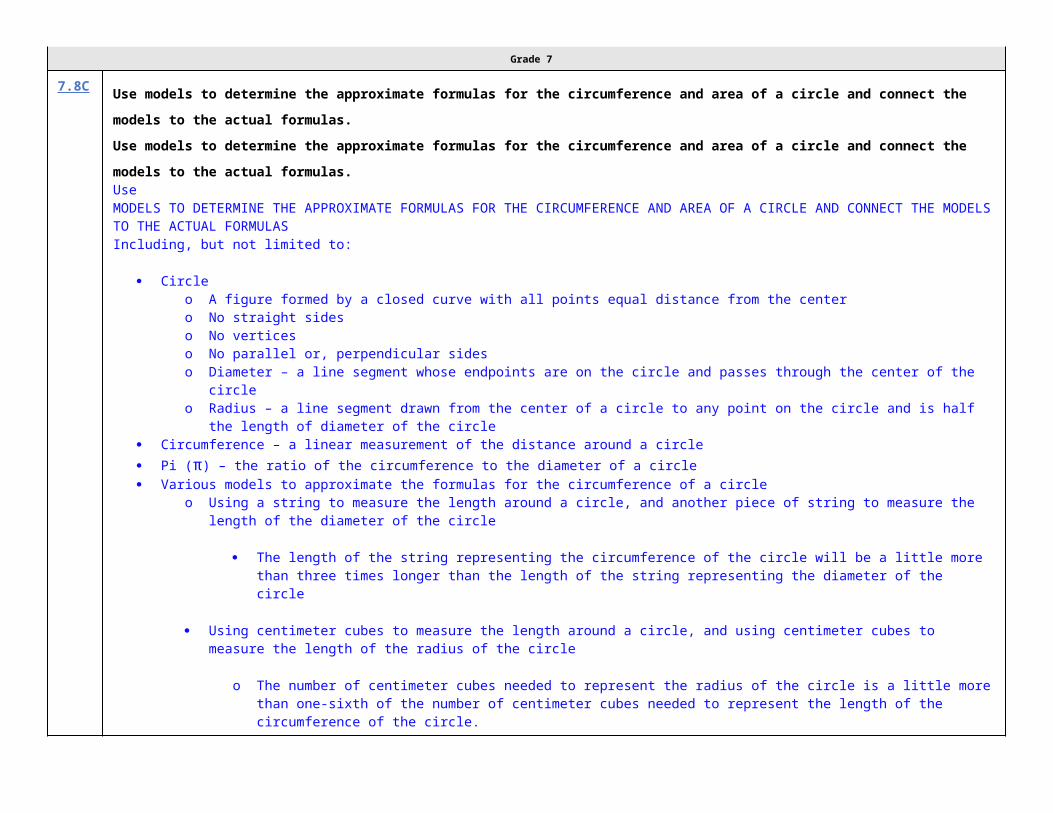
Grade 7
Tracing a circle on centimeter grid paper, dividing the circle into four equally sized pieces from the center of the circle, forming squares with three of the four pieces of the divided circle using the radius of the circle as the side length of each square, and using the area of the square that extends beyond the circle to fill the last of the four equally sized pieces
o The number of square centimeters needed to represent the area of the entire circle is a little more than the area of three squares with the radius of the circle as one of the side lengths of the square.
o Ex:

Grade 7
Generalization of models used to determine the approximate formula for area of a circleo The area of a circle is a little more than three times the length of the radius squared.
Connections between models to represent the area of a circle and formulas for area of a circle
Formula for area of a circle from STAAR Grade 7 Mathematics Reference Materials
Area of a circle
A = πr2, where A represents the area of the circle, r represents the radius of the circle, and π represents the approximate number of squares, with a side length of r, needed to fill the area of the circle.

Grade 7
The ratio of the area of the circle to the area of the radius squared is a little more than 3 and denoted by π ≈ 3.14.
Note(s):
Grade Level(s):o Grade 7 introduces using models to determine the approximate formulas for the circumference and area of a circle and connecting
the models to the actual formulas.o Grade 8 will use models and diagrams to explain the Pythagorean theorem.o Various mathematical process standards will be applied to this student expectation as appropriate.
TxRCFP:o Using expressions and equations to describe relationships in a variety of contexts, including geometric problems
TxCCRS:o I. Numeric Reasoningo IV. Measurement Reasoningo VIII. Problem Solving and Reasoningo IX. Communication and Representation
7.9 Expressions, equations, and relationships. The student applies mathematical process standards to solve geometric problems. The student is expected to:
7.9A Solve problems involving the volume of rectangular prisms, triangular prisms, rectangular pyramids, and triangular pyramids.
Readiness StandardSolve problems involving the volume of rectangular prisms, triangular prisms, rectangular pyramids, and triangular pyramids.
Readiness StandardSolvePROBLEMS INVOLVING THE VOLUME OF RECTANGULAR PRISMS, TRIANGULAR PRISMS, RECTANGULAR PYRAMIDS, AND TRIANGULAR PYRAMIDS

Grade 7
Including, but not limited to:
Positive rational numbers – the set of numbers that can be expressed as a fraction , where a and b are whole numbers and b ≠ 0, which
includes the subsets of whole numbers and counting (natural) numbers (e.g., 0, 2, etc.). Various forms of positive rational numbers
o Whole numberso Decimals (less than or greater than one)o Fractions (proper, improper, and mixed numbers)
Three-dimensional figure – a figure that has measurements including length, width (depth), and heighto Attributes of prisms and pyramids
Rectangular prism
o 6 rectangular faces (2 parallel rectangular faces [bases], 4 rectangular faces)o 12 edgeso 8 verticeso Face – a flat surface of a three-dimensional figureo Base of a rectangular prism – any two congruent, opposite and parallel faces shaped like rectangles; possibly more
than one seto Height of a rectangular prism – the length of a side that is perpendicular to both bases
Triangular prismo 5 faces (2 triangular faces [bases], 3 rectangular faces)o 9 edgeso 6 verticeso Base of a triangular prism – the two congruent, opposite and parallel faces shaped like triangleso Height of a triangular prism – the length of a side that is perpendicular to both bases
Rectangular pyramido 5 faces (1 rectangular face [base], 4 triangular faces)o 8 edgeso 5 verticeso Base of a rectangular pyramid – a rectangle attached to triangular faces meeting at a pointo Height of a rectangular pyramid – the length of a perpendicular line segment from the vertex of the pyramid to the
base Triangular pyramid
o 4 faces (1 triangular face [base], 3 triangular faces)o 6 edges
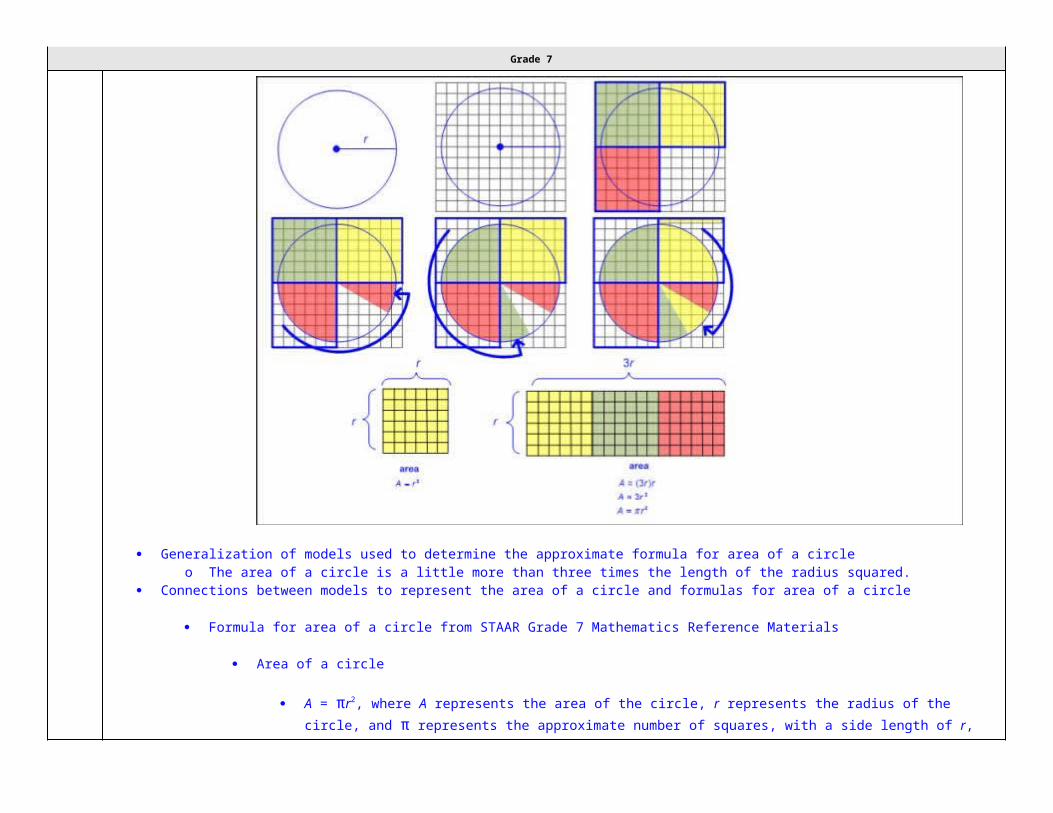
Grade 7
o 4 verticeso Base of a triangular pyramid – a triangle attached to triangular faces meeting at a pointo Height of a triangular pyramid – the length of a perpendicular line segment from the vertex of the pyramid to the base
Volume – the measurement attribute of the amount of space occupied by mattero One way to measure volume is a three-dimensional cubic measureo Positive rational number side lengths
Recognition of volume embedded in mathematical and real-world problem situations
Ex: How much sand is needed to fill a sand box? Ex: How much water is needed to fill an aquarium?
Formulas for volume from STAAR Grade 7 Mathematics Reference Materials
o Prism V = Bh, where B represents the base area and h represents the height of the prism which is the number of times the base
area is repeated or layered)o Rectangular prism
The base of a rectangular prism is a rectangle whose area may be found with the formula, A = bh or A = lw, meaning the base area, B, may be found with the formula B = bh or B = lw; therefore, the volume of a rectangular prism may be found using V = Bh or V = (bh)h or V = (lw)h.
Ex:
Grade 7
Triangular prism
The base of a triangular prism is a triangle whose area may be found with the formula, A = bh, meaning the
base area, B, may be found using B = bh; therefore, the volume of a triangular prism may be found
using V = Bh or V = . Ex:

Grade 7
Pyramid
V = Bh, where B represents the base area and h represents the height of the pyramid
Rectangular pyramid
The base of a rectangular pyramid is a rectangle whose area may be found with the formula, A = bh or A = lw, meaning the base area, B, may be found with the formula B = bh or B =
lw; therefore the volume of a rectangular pyramid may be found using V = Bh or V = (bh)h or V = (lw)h.
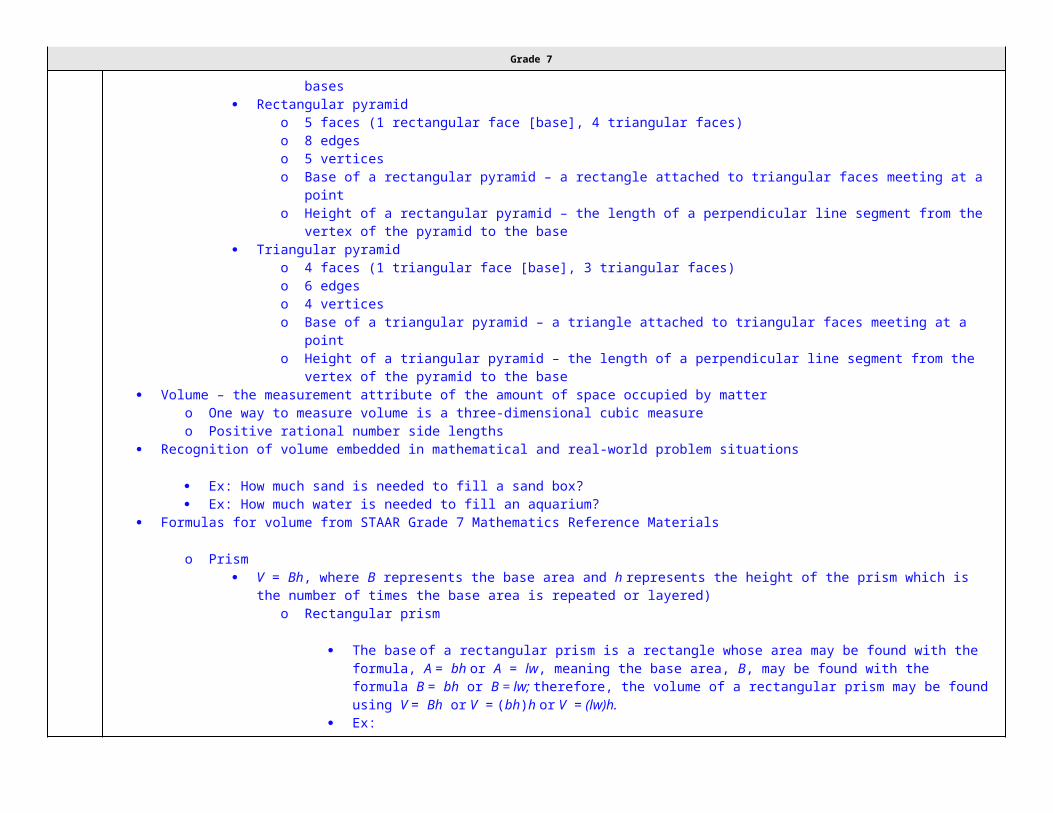
Grade 7
Ex:
Triangular pyramid
The base of a triangular pyramid is a triangle whose area may be found with the formula, A = bh, meaning
the base area, B, may be found using B = bh; therefore, the volume of a triangular pyramid may be found
using V = Bh or V = or V = . Ex:

Grade 7
Note(s):
Grade Level(s):o Grade 6 determined solutions for problems involving the area of rectangles, parallelograms, trapezoids, and triangles and volume of
right rectangular prisms where dimensions are positive rational numbers.o Grade 8 will solve problems involving the volume of cylinders, cones, and spheres.o Various mathematical process standards will be applied to this student expectation as appropriate.
TxRCFP:o Using expressions and equations to describe relationships in a variety of contexts, including geometric problems
TxCCRS:o I. Numeric Reasoning

Grade 7
o III.C. Geometric Reasoning – Connections between geometry and other mathematical content strandso IV. Measurement Reasoningo VIII. Problem Solving and Reasoningo IX. Communication and Representationo X. Connections
7.9B Determine the circumference and area of circles.
Readiness StandardDetermine the circumference and area of circles.
Readiness StandardDetermineTHE CIRCUMFERENCE AND AREA OF CIRCLESIncluding, but not limited to:
Positive rational numbers – the set of numbers that can be expressed as a fraction , where a and b are whole numbers and b ≠ 0, which
includes the subsets of whole numbers and counting (natural) numbers (e.g., 0, 2, etc.). Various forms of positive rational numbers
o Whole numberso Decimals (less than or greater than one)o Fractions (proper, improper, and mixed numbers)
Circleo A figure formed by a closed curve with all points equal distance from the centero No straight sideso No verticeso No parallel or, perpendicular sideso Diameter – a line segment whose endpoints are on the circle and passes through the center of the circleo Radius – a line segment drawn from the center of a circle to any point on the circle and is half the length of diameter of the circleo Semicircle – half of a circleo Quarter circle – one-fourth of a circle

Grade 7
Circumference – a linear measurement of the distance around a circleo Positive rational number dimensions
Pi (π) – the ratio of the circumference to the diameter of a circle
o π ≈ 3.14 or Formulas for circumference from STAAR Grade 7 Mathematics Reference Materials
o Circumference using the radius of a circle
C = 2πr, where C represents the circumference of the circle and r represents the radius of the circle, and π is approximately
3.14 or Ex:

Grade 7
Circumference using the diameter of a circle
C = πd, where C represents the circumference of the circle, d represents the diameter of the circle, and π is approximately
3.14 or Ex:
Area – the measurement attribute that describes the number of square units a figure or region coverso Area is a two-dimensional square unit measure.o Positive rational number dimensions
Formula for area of a circle from STAAR Grade 7 Mathematics Reference Materialso Area
A = πr2, where A represents the area of the circle, r represents the radius of the circle, and π is approximately 3.14 or Ex:

Grade 7
Note(s):
Grade Level(s):o Grade 6 determined solutions for problems involving the area of rectangles, parallelograms, trapezoids, and triangles and volume of
right rectangular prisms where dimensions are positive rational numbers.o Various mathematical process standards will be applied to this student expectation as appropriate.
TxRCFP:o Using expressions and equations to describe relationships in a variety of contexts, including geometric problems
TxCCRS:o I. Numeric Reasoningo III.C. Geometric Reasoning – Connections between geometry and other mathematical content strandso IV. Measurement Reasoningo VIII. Problem Solving and Reasoningo IX. Communication and Representationo X. Connections
7.9C Determine the area of composite figures containing combinations of rectangles, squares, parallelograms, trapezoids, triangles, semicircles,
and quarter circles.

Grade 7
Readiness StandardDetermine the area of composite figures containing combinations of rectangles, squares, parallelograms, trapezoids, triangles, semicircles,
and quarter circles.
Readiness StandardDetermineTHE AREA OF COMPOSITE FIGURES CONTAINING COMBINATIONS OF RECTANGLES, SQUARES, PARALLELOGRAMS, TRAPEZOIDS, TRIANGLES, SEMICIRCLES, AND QUARTER CIRCLESIncluding, but not limited to:
Positive rational numbers – the set of numbers that can be expressed as a fraction , where a and b are whole numbers and b ≠ 0, which
includes the subsets of whole numbers and counting (natural) numbers (e.g., 0, 2, etc.). Various forms of positive rational numbers
o Whole numberso Decimals (less than or greater than one)o Fractions (proper, improper, and mixed numbers)
Two-dimensional figure – a figure with two basic units of measure, usually length and widtho Circle
A figure formed by a closed curve with all points equal distance from the center No straight sides No vertices No parallel or, perpendicular sides
o Polygon – a closed figure with at least 3 sides, where all sides are straight (no curves) Types of polygons
o Triangle
3 sides 3 vertices No parallel sides
o Quadrilateral 4 sides
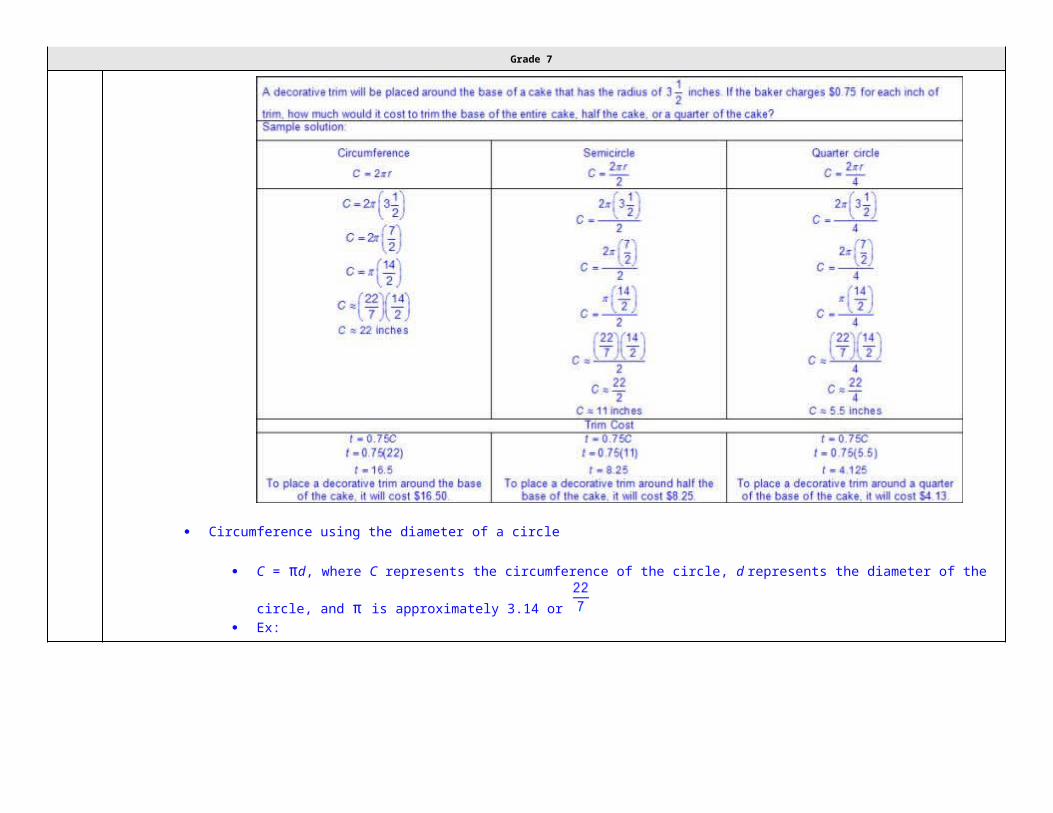
Grade 7
4 vertices Types of quadrilaterals
o Trapezoid
4 sides 4 vertices Exactly one pair of parallel sides Up to two possible pairs of perpendicular sides
o Parallelogram 4 sides 4 vertices Opposite sides congruent 2 pairs of parallel sides Opposite angles congruent Types of parallelograms
o Rectangle
4 sides
4 vertices
Opposite sides congruent
2 pairs of parallel sides
2 pairs of perpendicular sides
4 right angles
o Rhombus
o 4 sides
o 4 vertices

Grade 7
o All sides congruent
o 2 pairs of parallel sides
o Opposite angles congruent
o Square (a special type of rectangle and a special type of rhombus)
o 4 sides
o 4 vertices
o All sides congruent
o 2 pairs of parallel sides
o 2 pairs of perpendicular sides
o 4 right angles
Composite Figure – a figure that is composed of two or more two-dimensional figureso Rectangleso Squareso Parallelogramso Trapezoidso Triangleso Circleso Semicircleso Quarter circleso Any combination of these figures
Area – the measurement attribute that describes the number of square units a figure or region coverso Area is a two-dimensional square unit measure.o Positive rational number side lengths
Formulas for area from STAAR Grade 7 Mathematics Reference Materialso Triangle

Grade 7
A = bh, where b represents the length of the base of the triangle and h represents the height of the triangleo Rectangle or parallelogram
o A = bh, where b represents the length of the base of the rectangle or parallelogram and h represents the height of the rectangle or parallelogram
o Trapezoid
o A = (b1 + b2)h, where b1 represents the length of one of the parallel bases, b2 represents the length of the other parallel base, and h represents the height of the trapezoid
o Circle
o A = πr2, where A represents the area of the circle, r represents the radius of the circle, and π is approximately 3.14 or o Ex:

Grade 7

Grade 7
Ex:
Ex:

Grade 7
Note(s):
Grade Level(s):o Grade 6 determined solutions for problems involving the area of rectangles, parallelograms, trapezoids, and triangles and volume of
right rectangular prisms where dimensions are positive rational numbers.o Various mathematical process standards will be applied to this student expectation as appropriate.
TxRCFP:
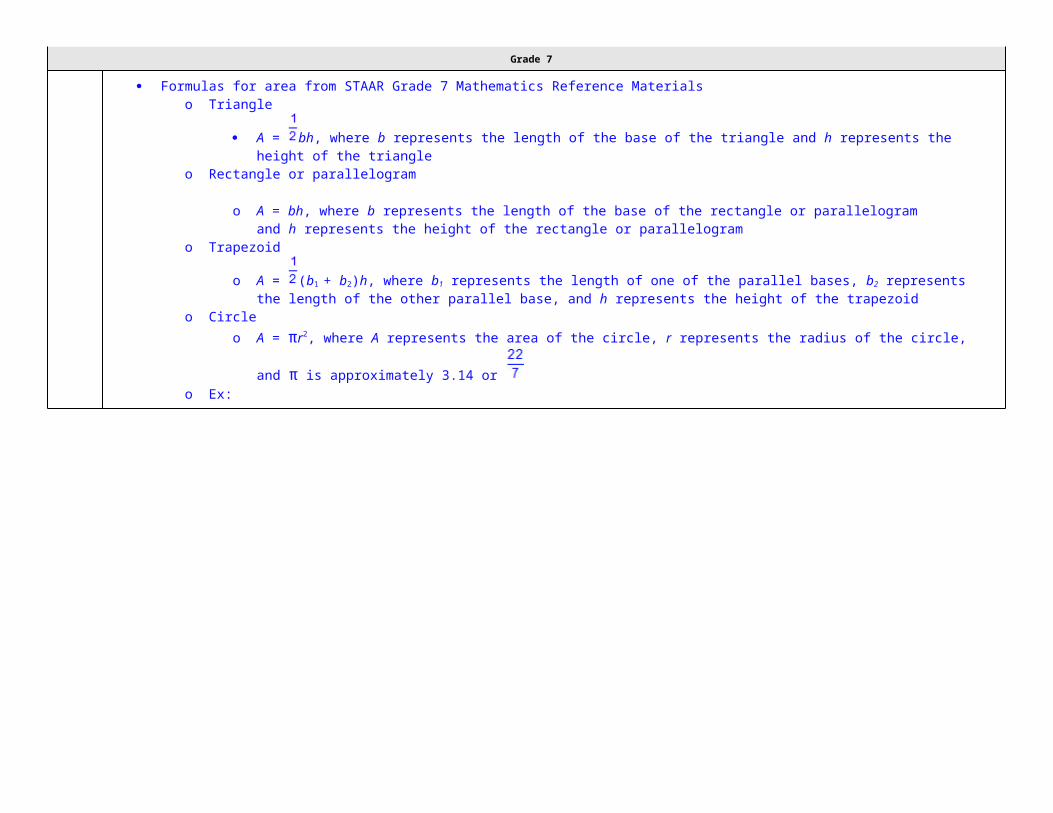
Grade 7
o Using expressions and equations to describe relationships in a variety of contexts, including geometric problems TxCCRS:
o I. Numeric Reasoningo III.C. Geometric Reasoning – Connections between geometry and other mathematical content strandso IV. Measurement Reasoningo VIII. Problem Solving and Reasoningo IX. Communication and Representationo X. Connections
7.9D Solve problems involving the lateral and total surface area of a rectangular prism, rectangular pyramid, triangular prism, and triangular
pyramid by determining the area of the shape's net.
Supporting StandardSolve problems involving the lateral and total surface area of a rectangular prism, rectangular pyramid, triangular prism, and triangular
pyramid by determining the area of the shape's net.
Supporting StandardSolvePROBLEMS INVOLVING THE LATERAL AND TOTAL SURFACE AREA OF A RECTANGULAR PRISM, RECTANGULAR PYRAMID, TRIANGULAR PRISM, AND TRIANGULAR PYRAMID BY DETERMINING THE AREA OF THE SHAPE'S NETIncluding, but not limited to:
Positive rational numbers – the set of numbers that can be expressed as a fraction , where a and b are whole numbers and b ≠ 0, which
includes the subsets of whole numbers and counting (natural) numbers (e.g., 0, 2, etc.). Various forms of positive rational numbers
o Whole numberso Decimals (less than or greater than one)o Fractions (proper, improper, and mixed numbers)
Three-dimensional figure – a figure that has measurements including length, width (depth), and heighto Attributes of prisms and pyramids
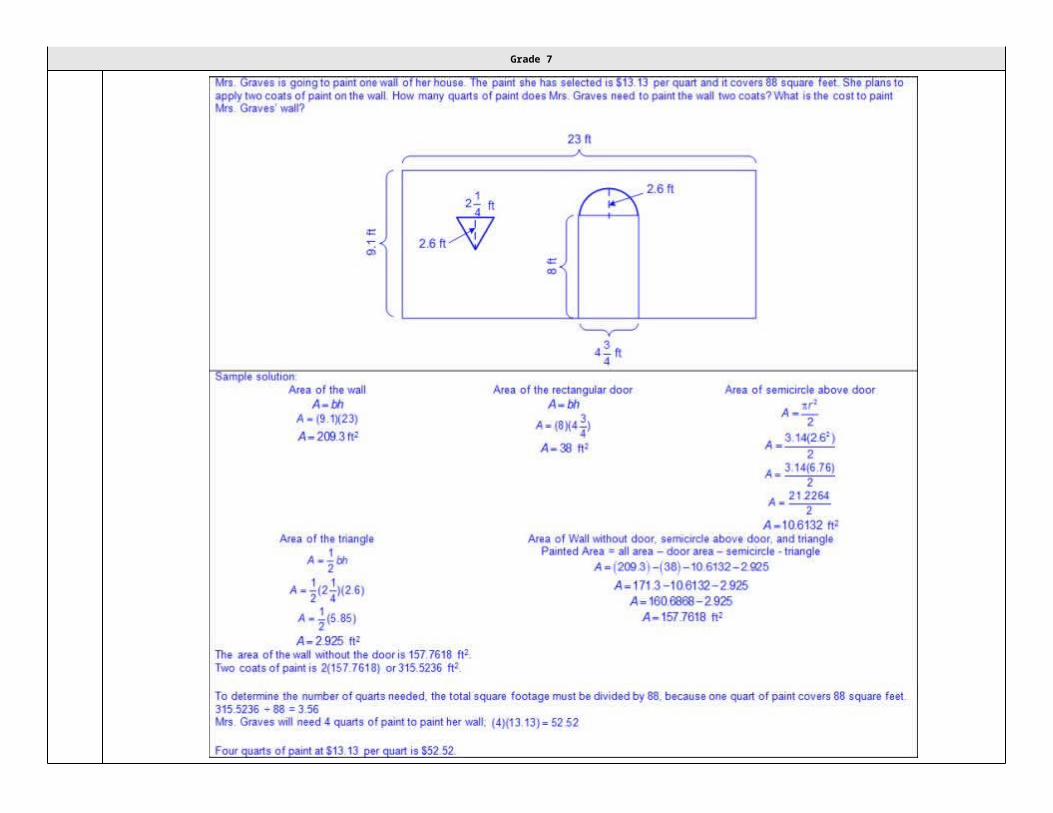
Grade 7
Rectangular prism
o 6 rectangular faces (2 parallel rectangular faces [bases], 4 rectangular faces)o 12 edgeso 8 verticeso Face – a flat surface of a three-dimensional figureo Base of a rectangular prism – any two congruent, opposite and parallel faces shaped like rectangles; possibly more
than one seto Height of a rectangular prism – the length of a side that is perpendicular to both bases
Triangular prismo 5 faces (2 triangular faces [bases], 3 rectangular faces)o 9 edgeso 6 verticeso Base of a triangular prism – the two congruent, opposite and parallel faces shaped like triangleso Height of a triangular prism – the length of a side that is perpendicular to both bases
Rectangular pyramido 5 faces (1 rectangular face [base], 4 triangular faces)o 8 edgeso 5 verticeso Base of a rectangular pyramid – a rectangle attached to triangular faces meeting at a pointo Height of a rectangular pyramid – the length of a perpendicular line segment from the vertex of the pyramid to the
base Triangular pyramid
o 4 faces (1 triangular face [base], 3 triangular faces)o 6 edgeso 4 verticeso Base of a triangular pyramid – a triangle attached to triangular faces meeting at a pointo Height of a triangular pyramid – the length of a perpendicular line segment from the vertex of the pyramid to the base
Area – the measurement attribute that describes the number of square units a figure or region coverso Area is a two-dimensional square unit measure.o Positive rational number side lengths
Surface Areao Lateral surface area – the number of square units needed to cover the lateral view (area excluding the base(s) of a three-dimensional
figure)o Total surface area – the number of square units needed to cover all of the surfaces (bases and lateral area)o Net – a two-dimensional model or drawing that can be folded into a three-dimensional solid

Grade 7
o Ex:
Ex:

Grade 7
Ex:

Grade 7
Ex:

Grade 7
Note(s):

Grade 7
Grade Level(s):o Grade 6 determined solutions for problems involving the area of rectangles, parallelograms, trapezoids, and triangles and volume of
right rectangular prisms where dimensions are positive rational numbers.o Grade 8 will use previous knowledge of surface area to make connections to the formulas for lateral and total surface area and
determine solutions for problems involving rectangular prisms, triangular prisms, and cylinders.o Various mathematical process standards will be applied to this student expectation as appropriate.
TxRCFP:o Using expressions and equations to describe relationships in a variety of contexts, including geometric problems
TxCCRS:o I. Numeric Reasoningo III.C. Geometric Reasoning – Connections between geometry and other mathematical content strandso IV. Measurement Reasoningo VIII. Problem Solving and Reasoningo IX. Communication and Representationo X. Connections
7.10 Expressions, equations, and relationships. The student applies mathematical process standards to use one-variable equations and inequalities to represent situations. The student is expected to:
7.10A
Write one-variable, two-step equations and inequalities to represent constraints or conditions within problems.
Supporting StandardWrite one-variable, two-step equations and inequalities to represent constraints or conditions within problems.
Supporting StandardWriteONE-VARIABLE, TWO-STEP EQUATIONS AND INEQUALITIES TO REPRESENT CONSTRAINTS OR CONDITIONS WITHIN PROBLEMSIncluding, but not limited to:
Equation – a mathematical statement composed of algebraic and/or numeric expressions set equal to each other Inequality – a mathematical statement composed of algebraic and/or numeric expressions set apart by an inequality symbol

Grade 7
Variable – a letter or symbol that represents a numbero One variable on one side of the equation or inequalityo Ex:
Coefficient – a number that is multiplied by a variable(s)o Whole numberso Integerso Decimals (less than or greater than one)o Fractions (proper, improper, and mixed numbers)o Ex:
Constant – a fixed value that does not appear with a variable(s)o Whole numberso Integerso Decimals (less than or greater than one)o Fractions (proper, improper, and mixed numbers)o Ex:
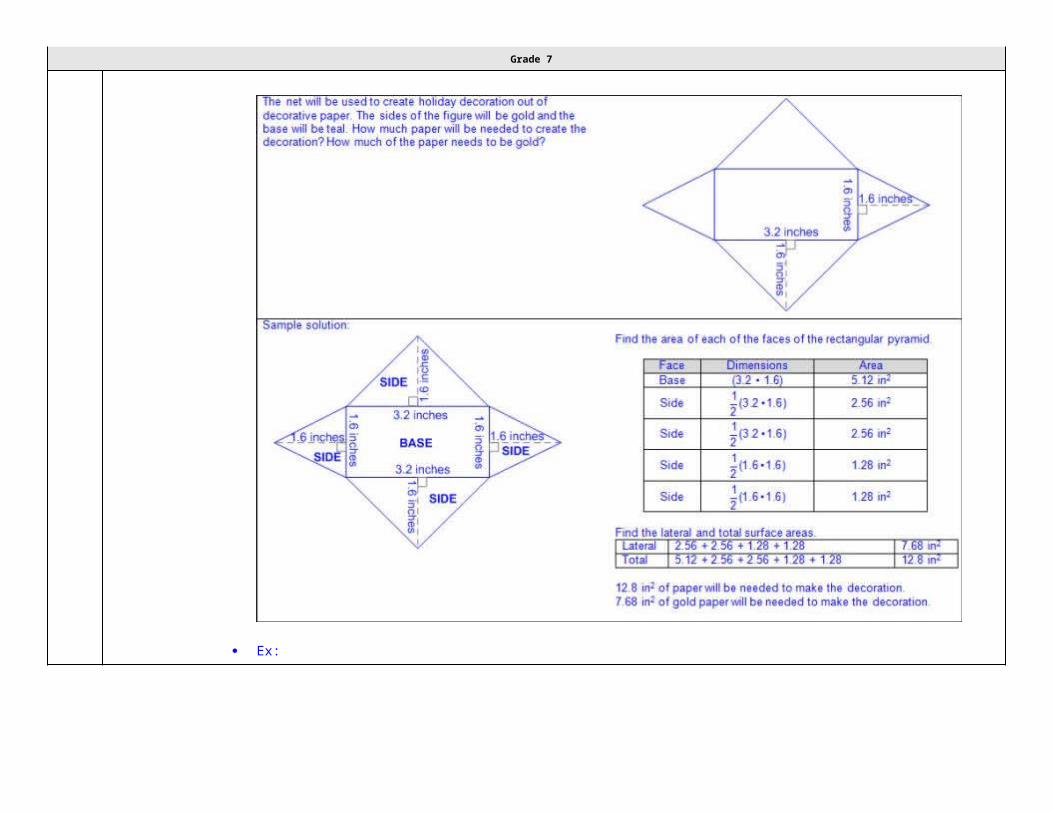
Grade 7
Solution set – a set of all values of the variable(s) that satisfy the equation or inequalityo Constraints or conditions
o Ex: Minimum, maximum, up to, no more than, no less than, etc. Distinguishing between equations and inequalities
o Characteristics of equations
Equates two expressions Equality of the variable One solution
o Characteristics of inequalities Shows the relationship between two expressions in terms of >,≥, ≤,or ≠ Inequality of the variable One or more solutions
Equality and inequality words and symbolso Equal to, =
o Ex: x is 4, x = 4o Greater than, >
o Ex: x is greater than 4, x > 4o Greater than or equal to, ≥
o Ex: x is greater than or equal to 4, x ≥ 4o Less than, <
o Ex: x is less than 4, x < 4o Less than or equal to, ≤
o Ex: x is less than or equal to 4, x ≤ 4o Not equal to, ≠
o Ex: x is not equal to 4, x ≠ 4 Relationship of order of operations within an equation or inequality
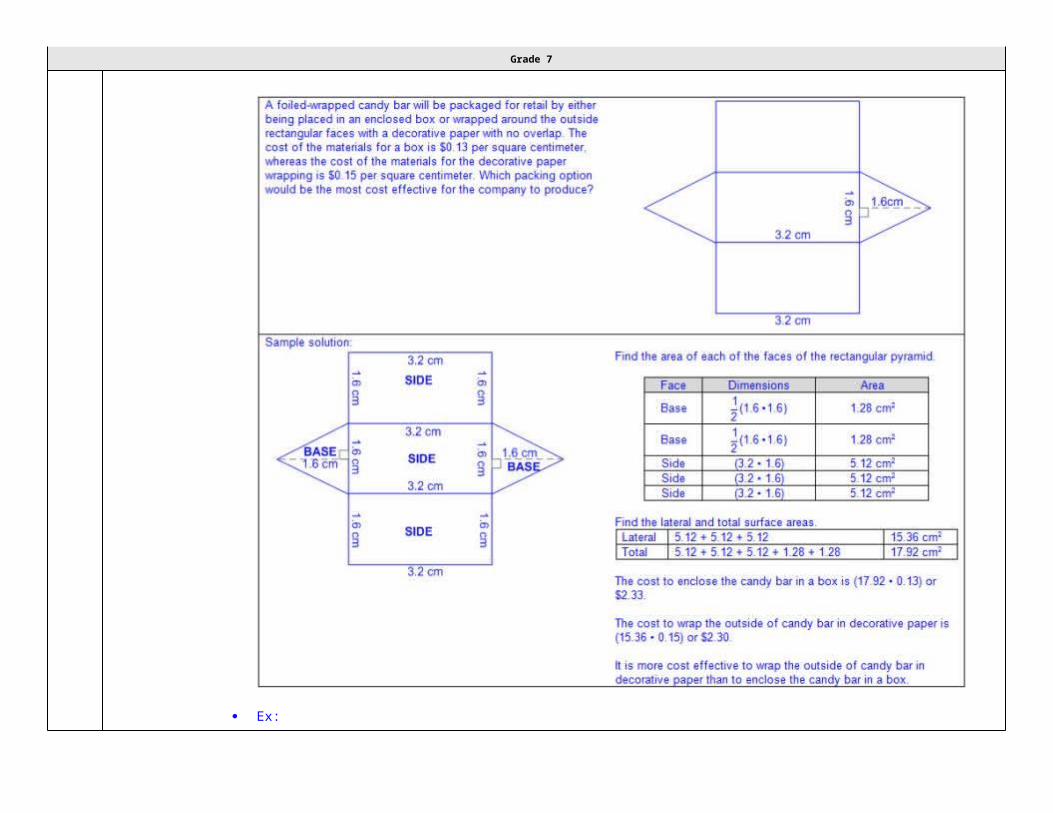
Grade 7
o Order of operations – the rules of which calculations are performed first when simplifying an expression
Parentheses/brackets: simplify expressions inside parentheses or brackets in order from left to right Exponents: rewrite in standard numerical form and simplify from left to right
Limited to positive whole numer exponents Multiplication/division: simplify expressions involving multiplication and/or division in order from left to right Addition/subtraction: simplify expressions involving addition and/or subtraction in order from left to right
One-variable, two-step equations from a problem
Ex:
Ex:
Ex:
One-variable, two-step inequalities from a problem
Ex:
Ex:

Grade 7
Ex:
Note(s):
Grade Level(s):o Grade 6 wrote one-variable, one-step equations and inequalities to represent constraints or conditions within problems.o Grade 8 will write one-variable equations or inequalities with variables on both sides that represent problems using rational number
coefficients and constants.o Various mathematical process standards will be applied to this student expectation as appropriate.
TxRCFP:o Using expressions and equations to describe relationships in a variety of contexts, including geometric problems
TxCCRS:o II. Algebraic Reasoningo VIII. Problem Solving and Reasoningo IX. Communication and Representationo X. Connections
7.10B
Represent solutions for one-variable, two-step equations and inequalities on number lines.
Supporting StandardRepresent solutions for one-variable, two-step equations and inequalities on number lines.
Supporting StandardRepresentSOLUTIONS FOR ONE-VARIABLE, TWO-STEP EQUATIONS AND INEQUALITIES ON NUMBER LINESIncluding, but not limited to:
Equation – a mathematical statement composed of algebraic and/or numeric expressions set equal to each other

Grade 7
Inequality – a mathematical statement composed of algebraic and/or numeric expressions set apart by an inequality symbol Variable – a letter or symbol that represents a number
o One variable on one side of the equation or inequalityo Ex:
Coefficient – a number that is multiplied by a variable(s)o Whole numberso Integerso Decimals (less than or greater than one)o Fractions (proper, improper, and mixed numbers)o Ex:
Constant – a fixed value that does not appear with a variable(s)o Whole numberso Integerso Decimals (less than or greater than one)o Fractions (proper, improper, and mixed numbers)o Ex:

Grade 7
Solution set – a set of all values of the variable(s) that satisfy the equation or inequalityo Constraints or conditions
o Ex: Minimum, maximum, up to, no more than, no less than, etc. Distinguishing between equations and inequalities
o Characteristics of equations
Equates two expressions Equality of the variable One solution
o Characteristics of inequalities Shows the relationship between two expressions in terms of >,≥, ≤,or ≠ Inequality of the variable One or more solutions
Equality and inequality words and symbols
Equal to, = Ex: x is 4, x = 4
Greater than, > Ex: x is greater than 4, x > 4
Greater than or equal to, ≥ Ex: x is greater than or equal to 4, x ≥ 4
Less than, < Ex: x is less than 4, x < 4
Less than or equal to, ≤ Ex: x is less than or equal to 4, x ≤ 4
Not equal to, ≠ Ex: x is not equal to 4, x ≠ 4
Representations of solutions to equations and inequalities on a number line

Grade 7
o Closed circle Equal to, =
Ex:
Greater than or equal to, ≥
Ex:
Less than or equal to, ≤
Ex:
Open circle
Greater than, >
Ex:
Less than, <
Ex:

Grade 7
Not equal to, ≠
Ex:
Ex:
Ex:
Ex:
Note(s):
Grade Level(s):o Grade 6 represented solutions for one-variable, one-step equations and inequalities on number lines.o Various mathematical process standards will be applied to this student expectation as appropriate.
TxRCFP:

Grade 7
o Using expressions and equations to describe relationships in a variety of contexts, including geometric problems TxCCRS:
o II. Algebraic Reasoningo IX. Communication and Representation
7.10C
Write a corresponding real-world problem given a one-variable, two-step equation or inequality.
Supporting StandardWrite a corresponding real-world problem given a one-variable, two-step equation or inequality.
Supporting StandardWriteA CORRESPONDING REAL-WORLD PROBLEM GIVEN A ONE-VARIABLE, TWO-STEP EQUATION OR INEQUALITYIncluding, but not limited to:
Equation – a mathematical statement composed of algebraic and/or numeric expressions set equal to each other Inequality – a mathematical statement composed of algebraic and/or numeric expressions set apart by an inequality symbol Variable – a letter or symbol that represents a number
o One variable on one side of the equation or inequalityo Ex:
Coefficient – a number that is multiplied by a variable(s)o Whole numberso Integerso Decimals (less than or greater than one)o Fractions (proper, improper, and mixed numbers)o Ex:

Grade 7
Constant – a fixed value that does not appear with a variable(s)o Whole numberso Integerso Decimals (less than or greater than one)o Fractions (proper, improper, and mixed numbers)o Ex:
Solution set – a set of all values of the variable(s) that satisfy the equation or inequalityo Constraints or conditions
o Ex: Minimum, maximum, up to, no more than, no less than, etc. Distinguishing between equations and inequalities
o Characteristics of equations
Equates two expressions Equality of the variable One solution
o Characteristics of inequalities Shows the relationship between two expressions in terms of >,≥, ≤,or ≠ Inequality of the variable One or more solutions
Equality and inequality words and symbols

Grade 7
Equal to, = Ex: x is 4, x = 4
Greater than, > Ex: x is greater than 4, x > 4
Greater than or equal to, ≥ Ex: x is greater than or equal to 4, x ≥ 4
Less than, < Ex: x is less than 4, x < 4
Less than or equal to, ≤ Ex: x is less than or equal to 4, x ≤ 4
Not equal to, ≠ Ex: x is not equal to 4, x ≠ 4
Relationship of order of operations within an equation or inequality
o Order of operations – the rules of which calculations are performed first when simplifying an expression Parentheses/brackets: simplify expressions inside parentheses or brackets in order from left to right Exponents: rewrite in standard numerical form and simplify from left to right
Limited to positive whole numer exponents Multiplication/division: simplify expressions involving multiplication and/or division in order from left to right Addition/subtraction: simplify expressions involving addition and/or subtraction in order from left to right
Corresponding real-world problem from a one-variable, two-step equation
Ex:
Corresponding real-world problem from a one-variable, two-step inequality
Ex:

Grade 7
Note(s):
Grade Level(s):o Grade 6 wrote corresponding real-world problems given one-variable, one-step equations or inequalities.o Grade 8 will write a corresponding real-world problem when given a one-variable equation or inequality with variables on both sides of
the equal sign using rational number coefficients and constants.o Various mathematical process standards will be applied to this student expectation as appropriate.
TxRCFP:o Using expressions and equations to describe relationships in a variety of contexts, including geometric problems
TxCCRS:o II. Algebraic Reasoningo VIII. Problem Solving and Reasoningo IX. Communication and Representationo X. Connections
7.11 Expressions, equations, and relationships. The student applies mathematical process standards to solve one-variable equations and inequalities. The student is expected to:
7.11A
Model and solve one-variable, two-step equations and inequalities.
Readiness StandardModel and solve one-variable, two-step equations and inequalities.

Grade 7
Readiness StandardModel, SolveONE-VARIABLE, TWO-STEP EQUATIONS AND INEQUALITIESIncluding, but not limited to:
Equation – a mathematical statement composed of algebraic and/or numeric expressions set equal to each other Inequality – a mathematical statement composed of algebraic and/or numeric expressions set apart by an inequality symbol Variable – a letter or symbol that represents a number
o One variable on one side of the equation or inequalityo Ex:
Coefficient – a number that is multiplied by a variable(s)o Whole numberso Integerso Decimals (less than or greater than one)o Fractions (proper, improper, and mixed numbers)o Ex:
Constant – a fixed value that does not appear with a variable(s)o Whole numberso Integerso Decimals (less than or greater than one)o Fractions (proper, improper, and mixed numbers)o Ex:

Grade 7
Solution set – a set of all values of the variable(s) that satisfy the equation or inequalityo Constraints or conditions
o Ex: Minimum, maximum, up to, no more than, no less than, etc. Distinguishing between equations and inequalities
o Characteristics of equations
Equates two expressions Equality of the variable One solution
o Characteristics of inequalities Shows the relationship between two expressions in terms of >,≥, ≤,or ≠ Inequality of the variable One or more solutions
Equality and inequality words and symbols
Equal to, = Ex: x is 4, x = 4
Greater than, > Ex: x is greater than 4, x > 4
Greater than or equal to, ≥ Ex: x is greater than or equal to 4, x ≥ 4
Less than, < Ex: x is less than 4, x < 4
Less than or equal to, ≤ Ex: x is less than or equal to 4, x ≤ 4
Not equal to, ≠ Ex: x is not equal to 4, x ≠ 4
Relationship of order of operations within an equation or inequality

Grade 7
o Order of operations – the rules of which calculations are performed first when simplifying an expression Parentheses/brackets: simplify expressions inside parentheses or brackets in order from left to right Exponents: rewrite in standard numerical form and simplify from left to right
Limited to positive whole numer exponents Multiplication/division: simplify expressions involving multiplication and/or division in order from left to right Addition/subtraction: simplify expressions involving addition and/or subtraction in order from left to right
Models to solve one-variable, two-step equations (concrete, pictorial, algebraic)
Ex:

Grade 7

Grade 7
7.11B
Determine if the given value(s) make(s) one-variable, two-step equations and inequalities true.
Supporting StandardDetermine if the given value(s) make(s) one-variable, two-step equations and inequalities true.
Supporting StandardDetermineIF THE GIVEN VALUE(S) MAKE(S) ONE-VARIABLE, TWO-STEP EQUATIONS AND INEQUALITIES TRUEIncluding, but not limited to:
Equation – a mathematical statement composed of algebraic and/or numeric expressions set equal to each other Inequality – a mathematical statement composed of algebraic and/or numeric expressions set apart by an inequality symbol Variable – a letter or symbol that represents a number
o One variable on one side of the equation or inequalityo Ex:
Coefficient – a number that is multiplied by a variable(s)o Whole numberso Integerso Decimals (less than or greater than one)o Fractions (proper, improper, and mixed numbers)o Ex:

Grade 7
Constant – a fixed value that does not appear with a variable(s)o Whole numberso Integerso Decimals (less than or greater than one)o Fractions (proper, improper, and mixed numbers)o Ex:
Solution set – a set of all values of the variable(s) that satisfy the equation or inequalityo Constraints or conditions
o Ex: Minimum, maximum, up to, no more than, no less than, etc. Distinguishing between equations and inequalities
o Characteristics of equations
Equates two expressions Equality of the variable One solution
o Characteristics of inequalities Shows the relationship between two expressions in terms of >,≥, ≤,or ≠ Inequality of the variable One or more solutions
Equality and inequality words and symbols

Grade 7
Equal to, = Ex: x is 4, x = 4
Greater than, > Ex: x is greater than 4, x > 4
Greater than or equal to, ≥ Ex: x is greater than or equal to 4, x ≥ 4
Less than, < Ex: x is less than 4, x < 4
Less than or equal to, ≤ Ex: x is less than or equal to 4, x ≤ 4
Not equal to, ≠ Ex: x is not equal to 4, x ≠ 4
Relationship of order of operations within an equation or inequality
o Order of operations – the rules of which calculations are performed first when simplifying an expression Parentheses/brackets: simplify expressions inside parentheses or brackets in order from left to right Exponents: rewrite in standard numerical form and simplify from left to right
Limited to positive whole numer exponents Multiplication/division: simplify expressions involving multiplication and/or division in order from left to right Addition/subtraction: simplify expressions involving addition and/or subtraction in order from left to right
Evaluation of given value(s) as possible solutions of one-variable, two-step equations
Ex:

Grade 7
Ex:
Evaluation of given value(s) as possible solutions of one-variable, two-step inequalities
Ex:

Grade 7
Ex:
Note(s):
Grade Level(s):o Grade 6 determined if the given value(s) make(s) one-variable, one-step equations or inequalities true.o Grade 8 identify and verify the values of x and y that simultaneously satisfy two linear equations in the form y = mx + b from the
intersections of the graphed equations.o Various mathematical process standards will be applied to this student expectation as appropriate.
TxRCFP:o Using expressions and equations to describe relationships in a variety of contexts, including geometric problems
TxCCRS:o I. Numeric Reasoning

Grade 7
o II. Algebraic Reasoningo VIII. Problem Solving and Reasoningo IX. Communication and Representation
7.11C
Write and solve equations using geometry concepts, including the sum of the angles in a triangle, and angle relationships.
Supporting StandardWrite and solve equations using geometry concepts, including the sum of the angles in a triangle, and angle relationships.
Supporting StandardWrite, SolveEQUATIONS USING GEOMETRY CONCEPTS, INCLUDING THE SUM OF THE ANGLES IN A TRIANGLE, AND ANGLE RELATIONSHIPSIncluding, but not limited to:
Equation – a mathematical statement composed of algebraic and/or numeric expressions set equal to each other Variable – a letter or symbol that represents a number
o One variable on one side of the equationo Ex:
Coefficient – a number that is multiplied by a variable(s)o Whole numberso Integerso Decimals (less than or greater than one)o Fractions (proper, improper, and mixed numbers)o Ex:
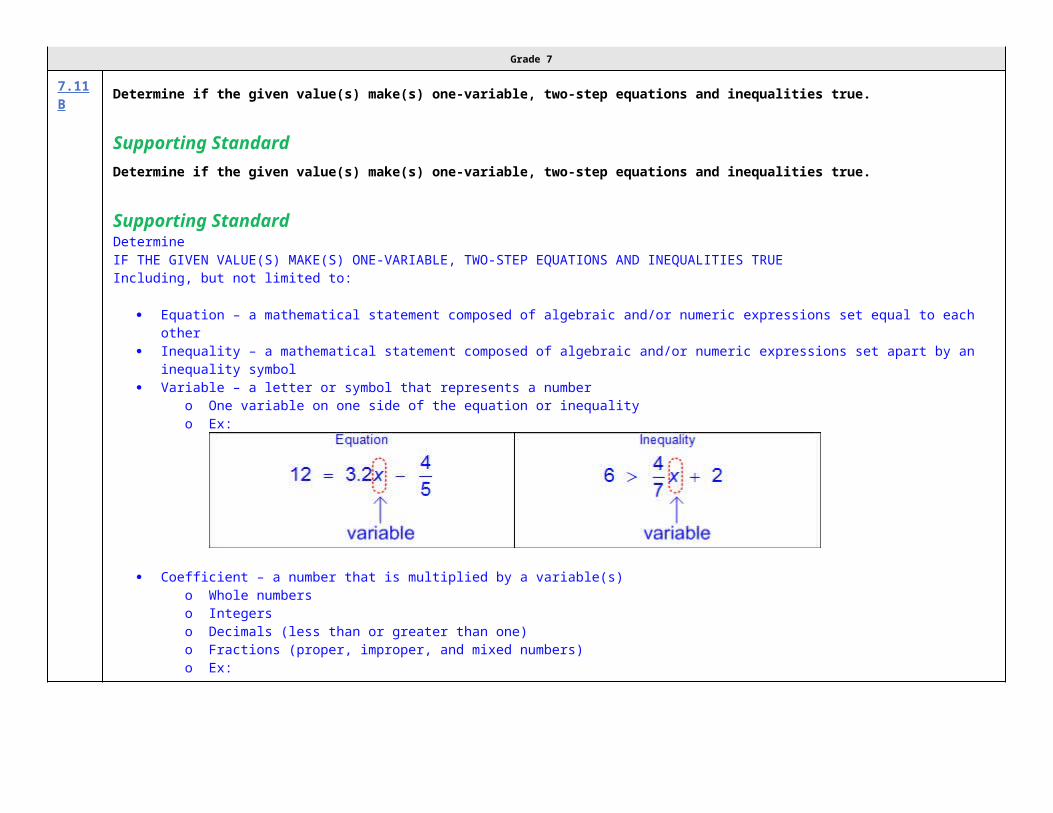
Grade 7
Constant – a fixed value that does not appear with a variable(s)o Whole numberso Integerso Decimals (less than or greater than one)o Fractions (proper, improper, and mixed numbers)o Ex:
Solution set – a set of all values of the variable(s) that satisfy the equation or inequality Equations from geometry concepts
o Angle measures as numeric and/or algebraic expressions
Sum of the angles in a triangle
Ex:
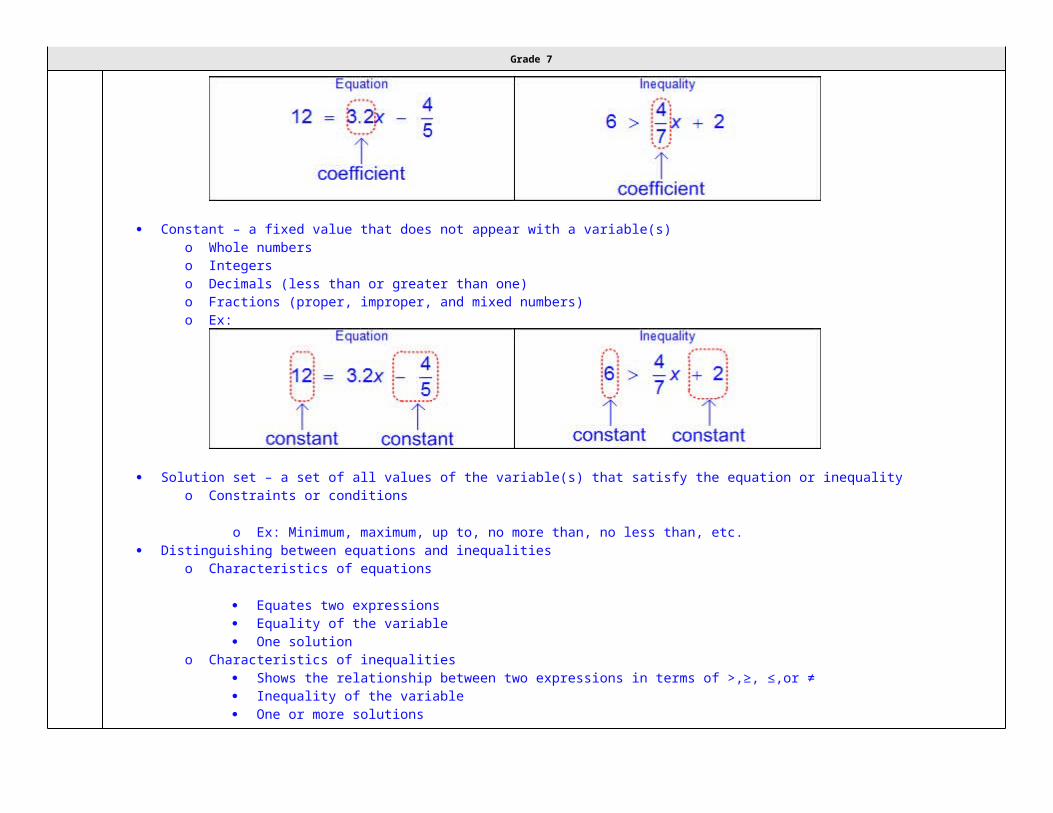
Grade 7
Other angle relationships
Complementary angles – two angles whose sum of angle measures equals 90 degrees Supplementary angles – two angles whose sum of angle measures equals 180 degrees Ex:
Note(s):
Grade Level(s):o Grade 6 extended previous knowledge of triangles and their properties to include the sum of angles of a triangle, the relationship
between the lengths of sides and measures of angles in a triangle, and determining when three lengths form a triangle.o Grade 8 will use informal arguments to establish facts about the angle sum and exterior angle of triangles, the angles created when
parallel lines are cut by a transversal, and the angle-angle criterion for similarity of triangles.o Various mathematical process standards will be applied to this student expectation as appropriate.
TxRCFP:o Using expressions and equations to describe relationships in a variety of contexts, including geometric problems
TxCCRS:

Grade 7
o I. Numeric Reasoningo II. Algebraic Reasoningo III.C. Geometric Reasoning – Connections between geometry and other mathematical content strandso VIII. Problem Solving and Reasoningo IX. Communication and Representationo X. Connections
7.12 Measurement and data. The student applies mathematical process standards to use statistical representations to analyze data. The student is expected to:
7.12A
Compare two groups of numeric data using comparative dot plots or box plots by comparing their shapes, centers, and spreads.
Readiness StandardCompare two groups of numeric data using comparative dot plots or box plots by comparing their shapes, centers, and spreads.
Readiness StandardCompareTWO GROUPS OF NUMERIC DATA USING COMPARATIVE DOT PLOTS OR BOX PLOTS BY COMPARING THEIR SHAPES, CENTERS, AND SPREADSIncluding, but not limited to:
Positive rational numbers – the set of numbers that can be expressed as a fraction , where a and b are whole numbers and b ≠ 0, which
includes the subsets of whole numbers and counting (natural) numbers (e.g., 0, 2, etc.). Various forms of positive rational numbers
o Whole numberso Decimals (less than or greater than one)o Fractions (proper, improper, and mixed numbers)
Data – information that is collected about people, events, or objectso Numerical data – data that represents values or observations that can be measured and placed in ascending or descending order

Grade 7
Data can be counted (discrete) or measured (continuous). Ex: How many hours do you spend studying each night? Represented on a graph with a numerical axis. Ex: How old were you when you lost your first tooth? Represented on a graph with a numerical axis.
Data representationso Dot plot – a graphical representation to organize data that uses dots (or Xs) to show the frequency (number of times) that each
number occurs Characteristics of a dot plot
o Title clarifies the meaning of the data represented.o Numerical data is represented with labels and may be whole numbers, fractions, or decimals.o Data represented may be numbers.
Counts related to numbers represented by a number line.o Dots (or Xs) recorded vertically above the line to represent the frequency of each number.o Dots (or Xs) generally represent one count.o Dots (or Xs) may represent multiple counts if indicated with a key.o Density of dots relates to the frequency of distribution of the data.
Ex:
Comparative dot plots – a graphical representation that consists of at least two related dot plots

Grade 7
Ex:
Box plot (box and whisker plot) – a graphical representation that displays the centers and range of the data distribution on a number line
Characteristics of a box plot
Title clarifies the meaning of the data represented. Numerical data is represented with labels and may be whole numbers, fractions, or decimals. Aligned to a vertical or horizontal number line

Grade 7
Data is divided into quartiles using the five-number summary.
Minimum Quartile 1 (Q1): median of lower 50% of the data Median Quartile 3 (Q3): median of the upper 50% of the data Maximum
Interquartile range represented by the difference between Q3 and Q1 (IQR = Q3 – Q1) Ex:
Outliers may or may not exist.
Outliers calculated as any data point that falls outside of range of 1.5 times the IQR (Outliers = 1.5(IQR)) from Q1 and Q3
From the lower quartile: Q1 – 1.5(IQR) From the upper quartile: Q3 + 1.5(IQR)
Density of quartiles represents the frequency of distribution of the data.
Ex:

Grade 7
Comparative box plots – a graphical representation that consists of at least two related box plots
Ex:
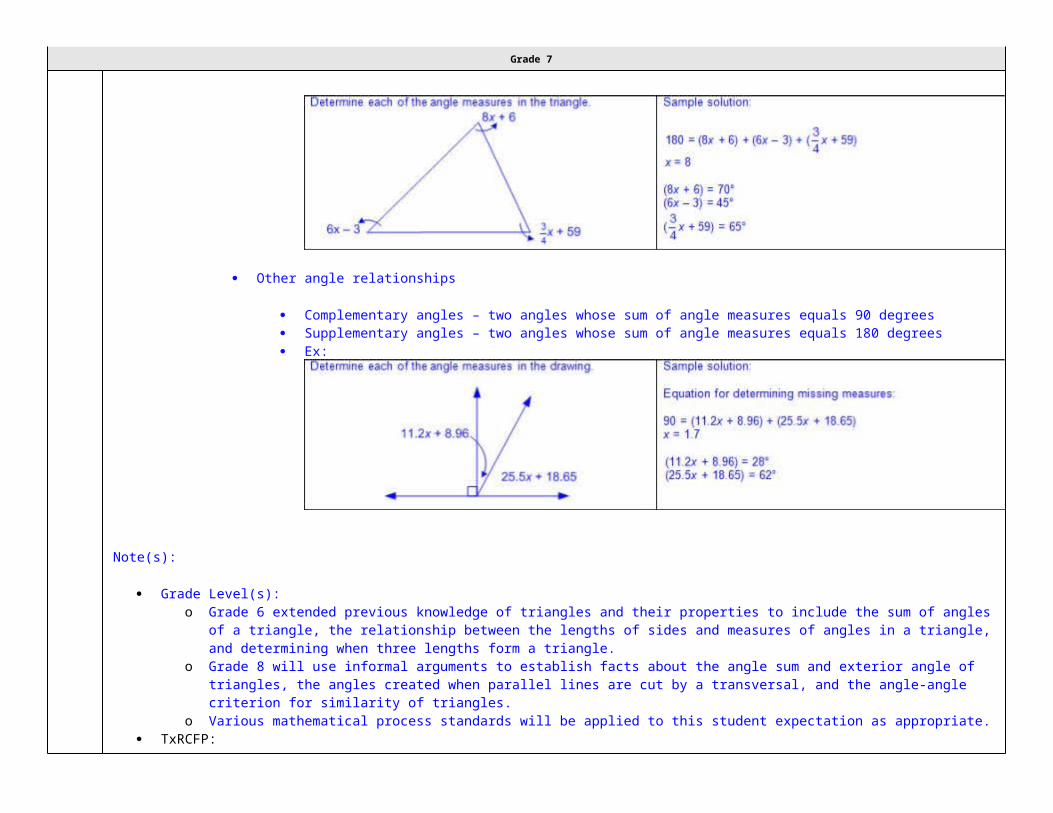
Grade 7
Measures of center of a data distributiono Mean – average of a set of data found by finding the sum of a set of data and dividing the sum by the number of pieces of data in the
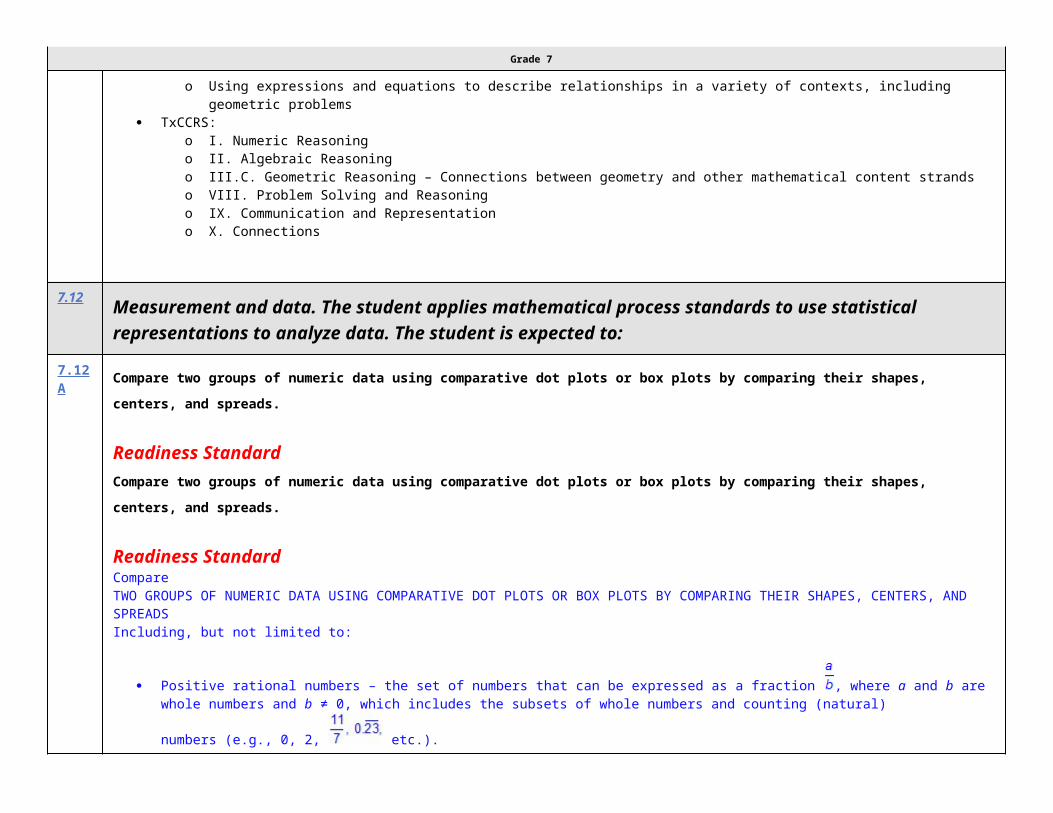
Grade 7
seto Median – the middle number of a set of data that has been arranged in order from greatest to least or least to greatesto Mode of numeric data – most frequent value in a set of data
Measures of shape of a data distributiono Range – the difference between the greatest number and least number in a set of datao Interquartile range
Shape of the data distributiono Skewed right
Usually the mean is greater than the median, and the median is greater than the mode. Shape of data when graphed has a tail to the right Ex:
Symmetric
Usually the mean, median, and mode are approximately the same. Shape of data when graphed resembles a bell curve Ex:
Skewed left
Usually the mean is less than the median, and the median is less than the mode. Shape of data when graphed has a tail to the left Ex:

Grade 7
Comparisons of shapes, centers, and spreadso Comparative dot plots
o Ex:
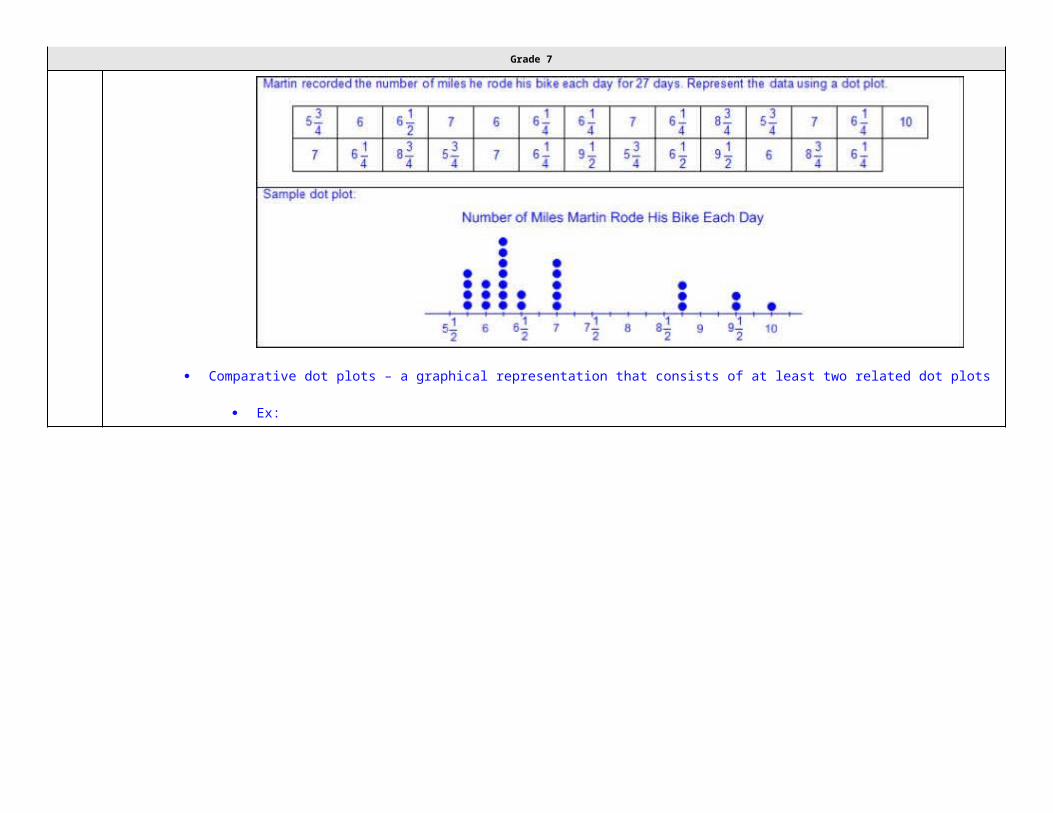
Grade 7
Comparative box plots
Ex:

Grade 7
Note(s):
Grade Level(s):o Grade 6 used the graphical representation of numeric data to describe the center, spread, and shape of the data distribution.o Grade 6 summarized numeric data with numerical summaries, including the mean and median (measures of center) and the range
and interquartile range (IQR) (measures of spread), and used these summaries to describe the center, spread, and shape of the data distribution.
o Grade 6 summarized categorical data with numerical and graphical summaries, including the mode, the percent of values in each category (relative frequency table), and the percent bar graph, and used these summaries to describe the data distribution.

Grade 7
o Grade 8 will determine the mean absolute deviation and use this quantity as a measure of the average distance data are from the mean using a data set of no more than 10 data points.
o Various mathematical process standards will be applied to this student expectation as appropriate. TxRCFP:
o Comparing sets of data TxCCRS:
o I. Numeric Reasoningo VI. Statistical Reasoningo VIII. Problem Solving and Reasoningo IX. Communication and Representation
7.12B
Use data from a random sample to make inferences about a population.
Supporting StandardUse data from a random sample to make inferences about a population.
Supporting StandardUseDATA FROM A RANDOM SAMPLE TO MAKE INFERENCES ABOUT A POPULATIONIncluding, but not limited to:
Positive rational numbers – the set of numbers that can be expressed as a fraction , where a and b are whole numbers and b ≠ 0, which
includes the subsets of whole numbers and counting (natural) numbers (e.g., 0, 2, etc.). Various forms of positive rational numbers
o Whole numberso Decimals (less than or greater than one)o Fractions (proper, improper, and mixed numbers)
Data – information that is collected about people, events, or objects Inference – a conclusion or prediction based on data Population – total collection of persons, objects, or items of interest

Grade 7
Sample – a subset of the population selected in order to make inferences about the entire population
Ex:
Ex:
Random sample – a subset of the population selected without bias in order to make inferences about the entire populationo Random samples are more likely to contain data that can be used to make predictions about a whole population.
Data from a random sample given or collected in various formso Verbalo Tabular (vertical/horizontal)o Graphical
Inferences based on random sampleo Qualitative – a broad subjective description (e.g., the probability of an event occurring is certain, more likely, not likely, equally likely,
or impossible.)o Quantitative – a narrowed objective description associated with a quantity (e.g., the probability of selecting a consonant from the word
EXPERIMENT is 1.5 times as likely as selecting a vowel from the same word, etc.) Statistical analysis of data in a random sample to make inferences about a population
Ex:
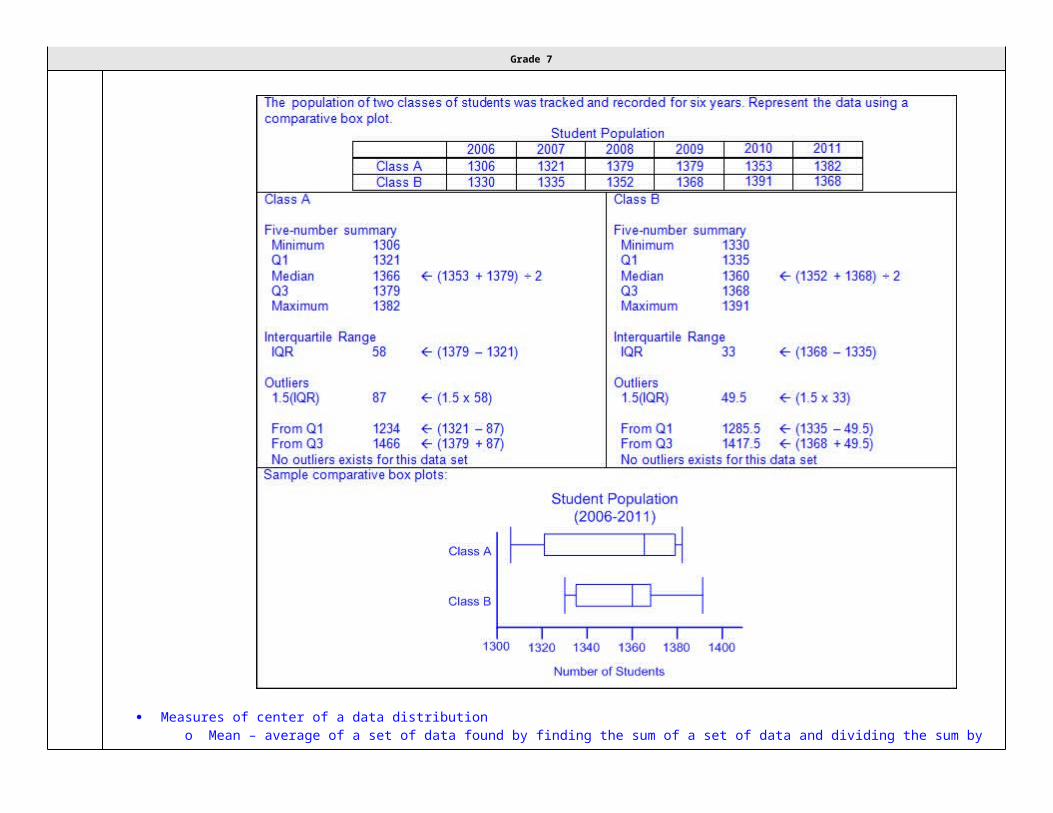
Grade 7
Ex:

Grade 7
Note(s):
Grade Level(s):o Grade 7 introduces using data from random samples to make inferences about a population.o Various mathematical process standards will be applied to this student expectation as appropriate.
TxRCFP:o Comparing sets of data
TxCCRS:o I. Numeric Reasoningo IV. Measurement Reasoning

Grade 7
o VI. Statistical Reasoningo VIII. Problem Solving and Reasoningo IX. Communication and Representation
7.12C
Compare two populations based on data in random samples from these populations, including informal comparative inferences about
differences between the two populations.
Supporting StandardCompare two populations based on data in random samples from these populations, including informal comparative inferences about
differences between the two populations.
Supporting StandardCompareTWO POPULATIONS BASED ON DATA IN RANDOM SAMPLES FROM THESE POPULATIONS, INCLUDING INFORMAL COMPARATIVE INFERENCES ABOUT DIFFERENCES BETWEEN THE TWO POPULATIONSIncluding, but not limited to:
Positive rational numbers – the set of numbers that can be expressed as a fraction , where a and b are whole numbers and b ≠ 0, which
includes the subsets of whole numbers and counting (natural) numbers (e.g., 0, 2, etc.). Various forms of positive rational numbers
o Whole numberso Decimals (less than or greater than one)o Fractions (proper, improper, and mixed numbers)
Data – information that is collected about people, events, or objects Inference – a conclusion or prediction based on data Population – total collection of persons, objects, or items of interest Sample – a subset of the population selected in order to make inferences about the entire population
Ex:

Grade 7
Ex:
Random sample – a subset of the population selected without bias in order to make inferences about the entire populationo Random samples are more likely to contain data that can be used to make predictions about a whole population.
Data from a random sample given or collected in various formso Verbalo Tabular (vertical/horizontal)o Graphical
Informal comparative inferences based on random samples from two populationso Qualitative – a broad subjective description (e.g., the probability of an event occurring is certain, more likely, not likely, equally likely,
or impossible.)o Quantitative – a narrowed objective description associated with a quantity (e.g., the probability of selecting a consonant from the word
EXPERIMENT is 1.5 times as likely as selecting a vowel from the same word, etc.) Statistical analysis of data from random sample to make inferences about two populations
Ex:

Grade 7
Ex:

Grade 7
Note(s):
Grade Level(s):o Grade 7 introduces comparing two populations based on data in random samples from these populations, including informal
comparative inferences about differences between the two populations.o Grade 8 will simulate generating random samples of the same size from a population with known characteristics to develop the notion

Grade 7
of a random sample being representative of the population from which it was selected.o Various mathematical process standards will be applied to this student expectation as appropriate.
TxRCFP:o Comparing sets of data
TxCCRS:o I. Numeric Reasoningo VI. Statistical Reasoningo VIII. Problem Solving and Reasoningo IX. Communication and Representation
7.13 Personal financial literacy. The student applies mathematical process standards to develop an economic way of thinking and problem solving useful in one's life as a knowledgeable consumer and investor. The student is expected to:
7.13A
Calculate the sales tax for a given purchase and calculate income tax for earned wages.
Supporting StandardCalculate the sales tax for a given purchase and calculate income tax for earned wages.
Supporting StandardCalculateTHE SALES TAX FOR A GIVEN PURCHASE AND CALCULATE INCOME TAX FOR EARNED WAGESIncluding, but not limited to:
Positive rational numbers – the set of numbers that can be expressed as a fraction , where a and b are whole numbers and b ≠ 0, which
includes the subsets of whole numbers and counting (natural) numbers (e.g., 0, 2, etc.). Various forms of positive rational numbers
o Whole numberso Decimals (less than or greater than one)o Percents converted to equivalent decimals or fractions for multiplying or dividing
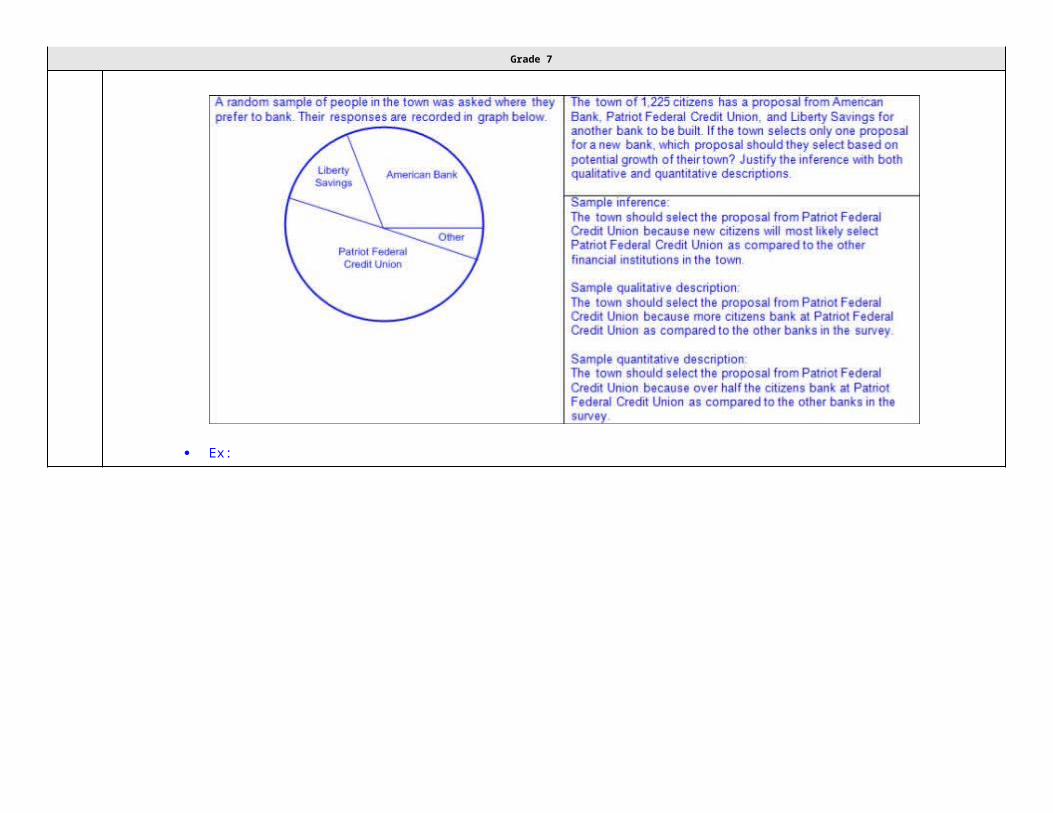
Grade 7
Sales tax – a percentage of money collected by a store (retailer), in addition to a good or service that was purchased, for the local government as required by law
o Sales tax is set by the local government (city, county, and state) and the money stays within those local systemso Ex:
Earned wages – the amount an individual earns over given period of time Income tax – a percentage of money paid on the earned wages of an individual or business for the federal and/or state governments as
required by lawo Determined by a fixed rate on different brackets (levels) of taxable income and an individual’s income tax filing status of single,
married joint, or head of household
Income tax filing status
o Single can be claimed by any individual filing an income tax return.o Married-joint can be claimed by married couples or individuals who have been widowed within the last two years.o Head of household can be claimed individuals who pay for more than half of the household expenses and have at
least one dependent (usually a child) that lives with them.o Income tax brackets and rates are published by the state and/or federal government annually
Income tax goes directly to federal government; the state of Texas does not collect income tax. Income tax rates fluctuate from year to year due to inflation and other federal and/or state government budgets. Earned income is rounded to the nearest whole dollar for purposes of tax brackets. Income tax is rounded to the nearest whole dollar.
o Ex:

Grade 7
Note(s):
Grade Level(s):o Grade 5 defined income tax, payroll tax, sales tax, and property tax.o Various mathematical process standards will be applied to this student expectation as appropriate.
TxRCFP:o Financial Literacy
TxCCRS:o I. Numeric Reasoningo VIII. Problem Solving and Reasoningo IX. Communication and Representationo X. Connections

Grade 7
7.13B
Identify the components of a personal budget, including income; planned savings for college, retirement, and emergencies; taxes; and
fixed and variable expenses, and calculate what percentage each category comprises of the total budget.
Supporting StandardIdentify the components of a personal budget, including income; planned savings for college, retirement, and emergencies; taxes; and
fixed and variable expenses, and calculate what percentage each category comprises of the total budget.
Supporting StandardIdentifyTHE COMPONENTS OF A PERSONAL BUDGET, INCLUDING INCOME; PLANNED SAVINGS FOR COLLEGE, RETIREMENT, AND EMERGENCIES; TAXES; AND FIXED AND VARIABLE EXPENSESIncluding, but not limited to:
Budget – a monthly or yearly spending and savings plan for an individual, family, business, or organization Budgets based on financial records help people plan and make choices about how to spend and save their money Components of a personal budget
o Income – money earned or receivedo Savings for college – money saved for continuing education beyond high schoolo Savings for retirement – money saved over the period of time an individual is employed to be spent once the individual retires from
their occupationo Savings for emergencies – money save for unexpected expenses (e.g., car repairs, emergency healthcare, etc.)o Taxes – money paid to local, state, and federal governments to pay for things the government provides to its citizens
Ex: Federal taxes pay for social security, national defense, healthcare, etc. Ex: Local taxes pay for schools, roads, healthcare, fire departments, police, etc. Various types of taxes
o Income tax – a percentage of money paid on the earned wages of an individual or business for the federal and/or state governments as required by law
o Payroll tax – a percentage of money that a company withholds from its employees for the federal government as required by law
o Sales tax – a percentage of money collected by a store (retailer), in addition to a good or service that was purchased, for the local government as required by law
o Property tax – a percentage of money collected on the value of a property for the local government as required by
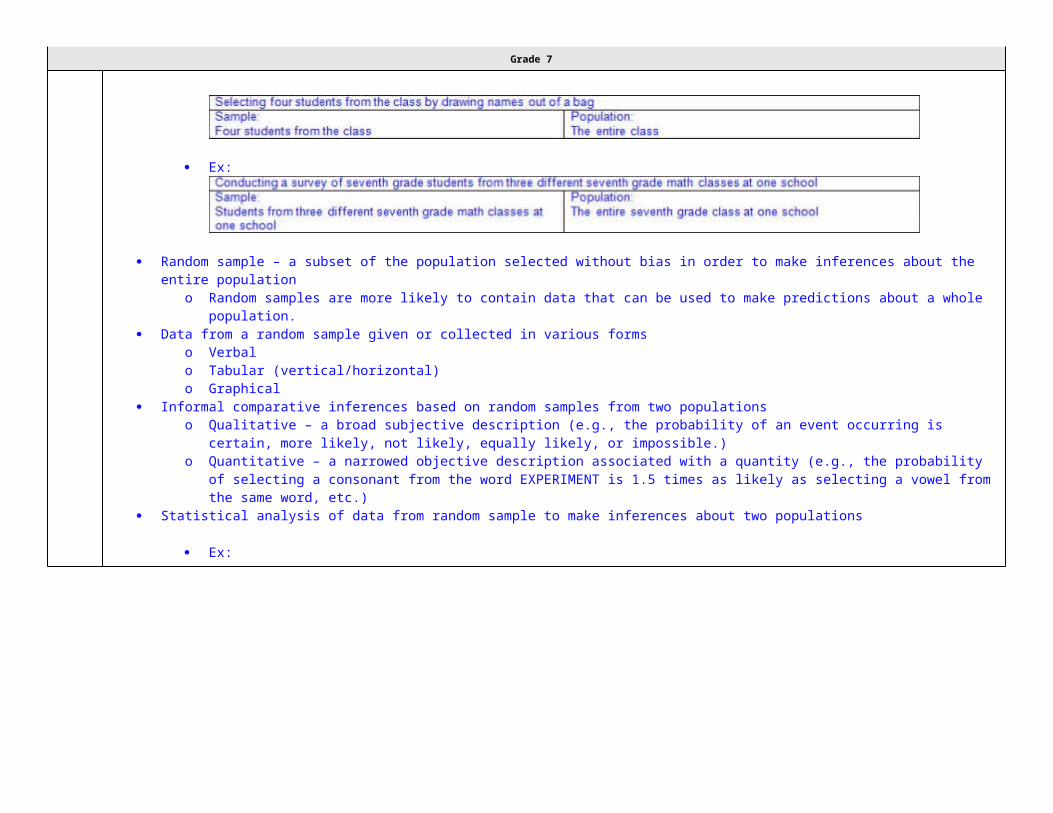
Grade 7
lawo Expense – payment for goods and services
Fixed expenses – expenses that occur regularly and do not vary month to month Variable expenses – expenses that occur regularly but vary month to month and can usually be controlled by an individual
CalculateWHAT PERCENTAGE EACH CATEGORY OF A PERSONAL BUDGET COMPRISES OF THE TOTAL BUDGETIncluding, but not limited to:
Positive rational numbers – the set of numbers that can be expressed as a fraction , where a and b are whole numbers and b ≠ 0, which
includes the subsets of whole numbers and counting (natural) numbers (e.g., 0, 2, etc.). Various forms of positive rational numbers
o Whole numberso Decimals (less than or greater than one)o Percents (less than or equal to 100%)
o Ex: Proportional reasoning to determine percentages within a budget
Ex:
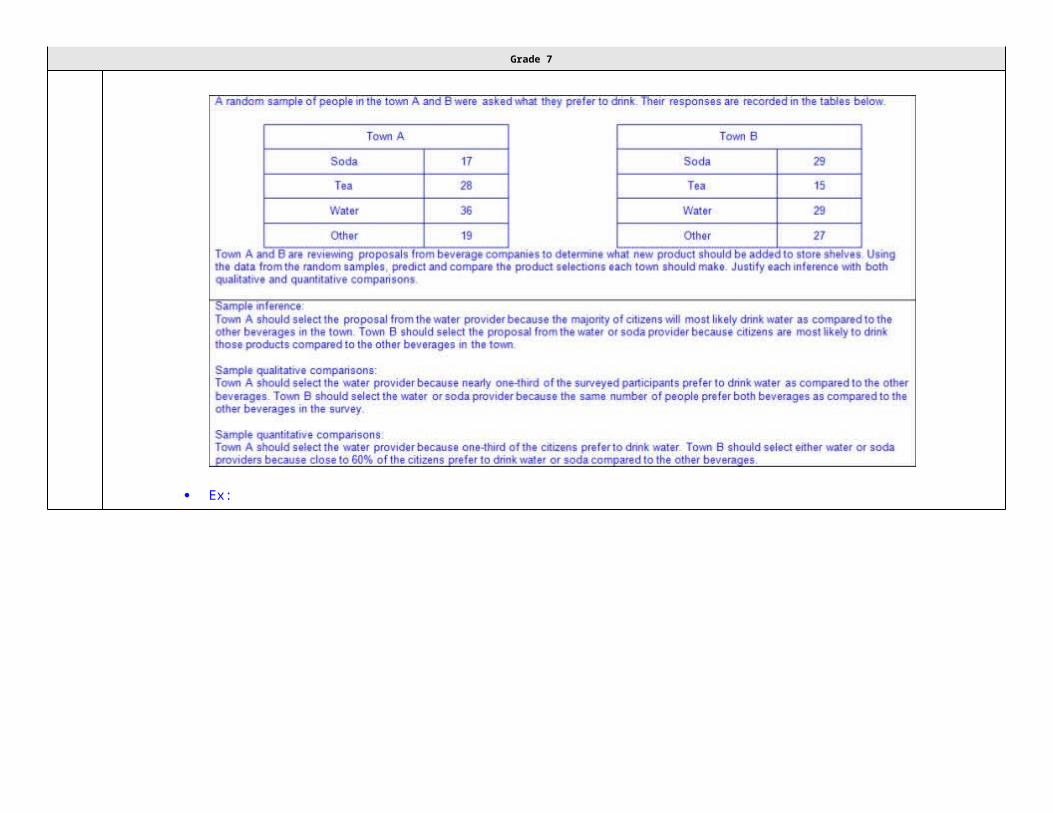
Grade 7

Grade 7
7.13C
Create and organize a financial assets and liabilities record and construct a net worth statement.
Supporting StandardCreate and organize a financial assets and liabilities record and construct a net worth statement.
Supporting StandardCreate, OrganizeA FINANCIAL ASSETS AND LIABILITIES RECORDIncluding, but not limited to:
Financial asset – an object or item of value that one owns Financial liability – an unpaid or outstanding debt Financial assets and liabilities records may fluctuate each month depending on payments made towards liabilities, whether additional
liabilities are taken on, or if the value of an asset changes due to appreciation or depreciation.
Ex:
ConstructA NET WORTH STATEMENTIncluding, but not limited to:
Net worth – the total assets of an individual after their liabilities have been settled An individual’s net worth may be positive or negative depending on the amount of their assets and liabilities. Process of constructing a net worth statement
o Calculate the value of an individual’s assets.
o Ex:

Grade 7
Calculate the value on an individual’s liabilities.
Ex:
Calculate the difference between an individual’s assets and liabilities.
Ex:
Note(s):
Grade Level(s):o Grade 7 introduces creating and organizing a financial assets and liabilities record and constructing a net worth statement.o Various mathematical process standards will be applied to this student expectation as appropriate.
TxRCFP:o Financial Literacy
TxCCRS:o I. Numeric Reasoningo VIII. Problem Solving and Reasoningo IX. Communication and Representation

Grade 7
o X. Connections
7.13D
Use a family budget estimator to determine the minimum household budget and average hourly wage needed for a family to meet its basic
needs in the student's city or another large city nearby.
Supporting StandardUse a family budget estimator to determine the minimum household budget and average hourly wage needed for a family to meet its basic
needs in the student's city or another large city nearby.
Supporting StandardUseA FAMILY BUDGET ESTIMATORIncluding, but not limited to:
Budget – a monthly or yearly spending and savings plan for an individual, family, business, or organization Family budget estimator – determines the monthly or annual base income that is needed for a family
Ex:
Components of a family budget estimatoro Location of familyo Number of parents/guardians in the householdo Number of children in the householdo Basic needs
Housing

Grade 7
Food Medical Insurance Medial out-of-pocket expenses Transportation Child care Other family needs
o Savings (e.g., emergencies, retirement, college, etc.)o Federal taxes
Payroll tax Income tax Earned income credit Child tax credit
o Budget components are usually rounded to the nearest whole dollar amount.o Values of budget components vary depending on location within a country, state, city, or county.
Data from multiple sources is used to create a family budget estimator.
To DetermineTHE MINIMUM HOUSEHOLD BUDGET AND AVERAGE HOURLY WAGE NEEDED FOR A FAMILY TO MEET ITS BASIC NEEDS IN THE STUDENT'S CITY OR ANOTHER LARGE CITY NEARBYIncluding, but not limited to:
Wage – the amount usually earned per hour or over a given period of time Basic needs – minimum necessities Minimum household budget is usually a monthly budget and is determined by finding the difference between the sum of the cost of basic
needs, savings, and taxes and the total household incomeo Average hourly wage is calculated by dividing the minimum household budget by the number of hours worked each month by each
working adult in the household
A typical workweek is considered 40 hours or 8 hours per day. The number of hours worked per month varies depending on the number of working days in the month, but can be usually
considered as 20 working days per month. Ex:

Grade 7
Average hourly wage needed in the student’s city Average hourly wage needed in nearby larger city
Note(s):
Grade Level(s):o Grade 7 introduces using a family budget estimator to determine the minimum household budget and average hourly wage needed
for a family to meet its basic needs in the student's city or another large city nearby.o Various mathematical process standards will be applied to this student expectation as appropriate.
TxRCFP:o Financial Literacy
TxCCRS:o I. Numeric Reasoningo VIII. Problem Solving and Reasoningo IX. Communication and Representationo X. Connections
7.13E Calculate and compare simple interest and compound interest earnings.
Supporting StandardCalculate and compare simple interest and compound interest earnings.
Supporting StandardCalculate, CompareSIMPLE INTEREST AND COMPOUND INTEREST EARNINGSIncluding, but not limited to:
Positive rational numbers – the set of numbers that can be expressed as a fraction , where a and b are whole numbers and b ≠ 0, which
includes the subsets of whole numbers and counting (natural) numbers (e.g., 0, 2, etc.).

Grade 7
Various forms of positive rational numberso Whole numberso Decimals (less than or greater than one)
Principal – the original amount invested or borrowed Simple interest – interest paid on the original principal in an account, disregarding any previously earned interest Compound interest – interest that is computed on the latest balance, including any previously earned interest that has been added to the
original principal Formulas for interest from STAAR Grade 7 Mathematics Reference Materials
o Simple interest
I = Prt, where I represents the interest, P represents the principal amount , r represents the interest rate in decimal form, and t represents the number of years the amount is deposited or borrowed
Ex:
Compound interest
A = P(1+r)t , where A represents the total amount of money deposited or borrowed, including interested, P represents the principal amount, r represents the interest rate in decimal form, and t represents the number of years the amount is deposited or borrowed
Ex:

Grade 7
Comparing simple and compound interest earnings
Ex:
Note(s):
Grade Level(s):

Grade 7
o Grade 4 compared the advantages and disadvantages of various savings options.o Grade 8 will calculate and compare simple interest and compound interest earnings.o Various mathematical process standards will be applied to this student expectation as appropriate.
TxRCFP:o Financial Literacy
TxCCRS:o I. Numeric Reasoningo VIII. Problem Solving and Reasoningo IX. Communication and Representationo X. Connections
7.13F Analyze and compare monetary incentives, including sales, rebates, and coupons.
Supporting StandardAnalyze and compare monetary incentives, including sales, rebates, and coupons.
Supporting StandardAnalyze, CompareMONETARY INCENTIVES, INCLUDING SALES, REBATES, AND COUPONSIncluding, but not limited to:
Monetary incentiveso Sale – a reduced amount or price of an item
May be offered by a store or manufacturer depending on the location of the purchase Ex: 30% off, buy one get one free, etc.
o Rebate – an amount returned or refunded for purchasing an item or items May be offered by the store or manufacturer May be instant or require a rebate form with proof of purchase to be mailed in Ex: Five dollars back with the purchase of four items, $50 rebate when you purchase a qualifying cell phone, etc.
o Coupon – an amount deducted from the total cost of an item May be offered by manufacturers or by retailers Some retailers may allow coupons to be stacked by accepting both a store coupon and a manufacturer’s coupon.

Grade 7
Ex: $0.50 with the purchase of two, $1.00 off, etc. Ex:
Note(s):
Grade Level(s):o Grade 3 identified the costs and benefits of planned and unplanned spending decisions.o Grade 8 will explain how small amounts of money invested regularly, including money saved for college and retirement, grow over
time.o Various mathematical process standards will be applied to this student expectation as appropriate.
TxRCFP:o Financial Literacy
TxCCRS:o I. Numeric Reasoningo VIII. Problem Solving and Reasoningo IX. Communication and Representationo X. Connections

Grade 7
Bibliography:Texas Education Agency & Texas Higher Education Coordinating Board. (2009). Texas college and career readiness standards. Retrieved from http://www.thecb.state.tx.us/collegereadiness/crs.pdf
Texas Education Agency. (2013). Introduction to the revised mathematics TEKS – kindergarten-algebra I vertical alignment. Retrieved fromhttp://www.projectsharetexas.org/sites/default/files/resources/documents/K-AlgebraIVAChart.pdf
Texas Education Agency. (2013). Texas response to curriculum focal points for kindergarten through grade 8 mathematics. Retrieved fromhttp://projectsharetexas.org/resource/txrcfp-texas-response-curriculum-focal-points-k-8-mathematics-revised-2013
Bold black text in italics: Knowledge and Skills Statement (TEKS); Bold black text: Student Expectation (TEKS)Bold red text in italics: Student Expectation identified by TEA as a Readiness Standard for STAAR
Bold green text in italics: Student Expectation identified by TEA as a Supporting Standard for STAARBlue text: Supporting information / Clarifications from TCMPC (Specificity)
Black text: Texas Education Agency (TEA); Texas College and Career Readiness Standards (TxCCRS)