· web viewunit two: population other resources available for this unit: supplemental activities...
TRANSCRIPT

UNIT TWO: POPULATION POPULATION LEARNING TARGETS AND GUIDED
NOTES
Other resources available for this unit:
Supplemental Activities Vocabulary Cards aligned
with Learning Targets Multiple Choice Tests
aligned with Learning Targets
For more resources, follow “Jenne Talbot” at www.teacherspayteachers.com
Other Units Available: Basics, Migration, Culture, Agriculture, Political, Economic, and Urban
1

POPULATION LEARNING TARGET #1
By the end of this section, I will be able to
DEFINE THE FOLLOWING WORDS
COMPLETE THE FOLLOWING
Distribution Density
o Arithmetic Densityo Physiological Densityo Agricultural Density
Ecumene Gendered Space
Identify world patterns of population density and distribution?
o Where do most people live?
o Where do people not live?
Explain how technology changed our settlements patterns
2
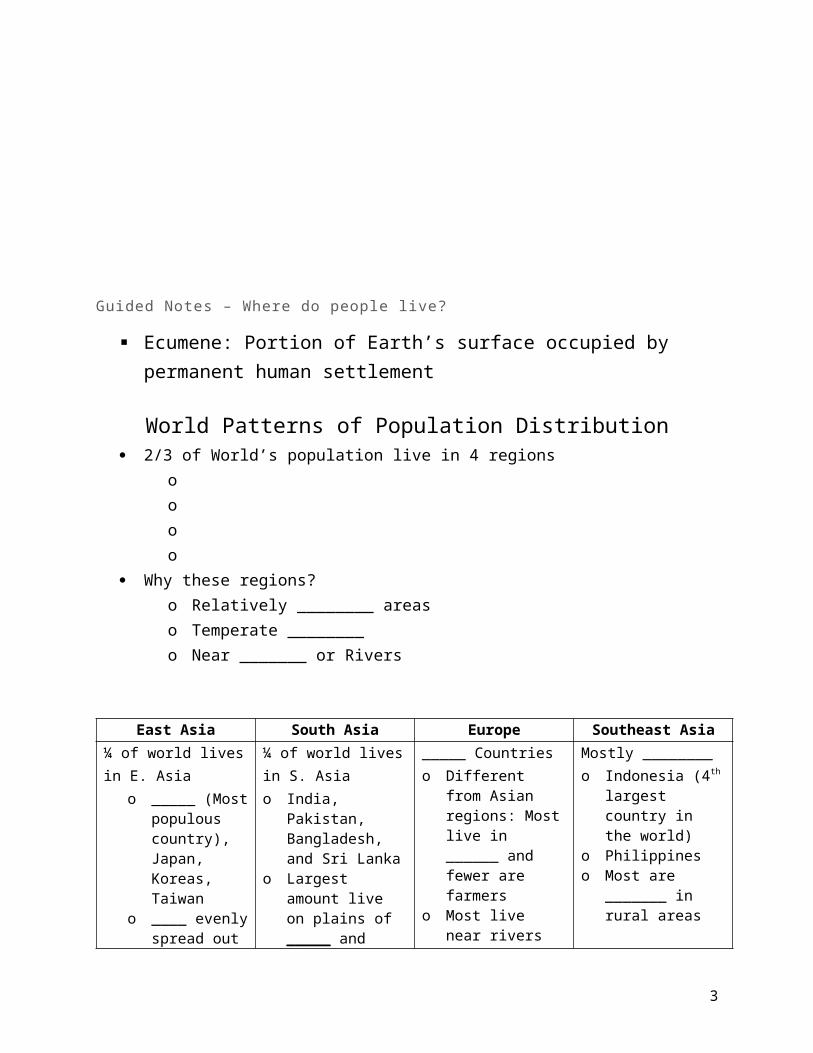
Guided Notes – Where do people live?
Ecumene: Portion of Earth’s surface occupied by permanent human settlement
World Patterns of Population Distribution 2/3 of World’s population live in 4 regions
o oo o
Why these regions? o Relatively ________ areaso Temperate ________o Near _______ or Rivers
East Asia South Asia Europe Southeast Asia¼ of world lives in E. Asia
o _____ (Most populous country), Japan, Koreas, Taiwan
o ____ evenly spread out
o Example: China (East v. West)
¼ of world lives in S. Asiao India, Pakistan,
Bangladesh, and Sri Lanka
o Largest amount live on plains of _____ and Ganges River
o Most are _______ living in rural areas
_____ Countrieso Different from
Asian regions: Most live in ______ and fewer are farmers
o Most live near rivers and _______ or _______ cities such as London and Paris
Mostly ________ o Indonesia (4th
largest country in the world)
o Philippineso Most are _______
in rural areas
Other Clusters Western Hemisphere
o Northeastern _____ and Southeastern ________ Most live in _____
Africao _______ Coast
Nigeria Largest Country in Africa Most are _______
3
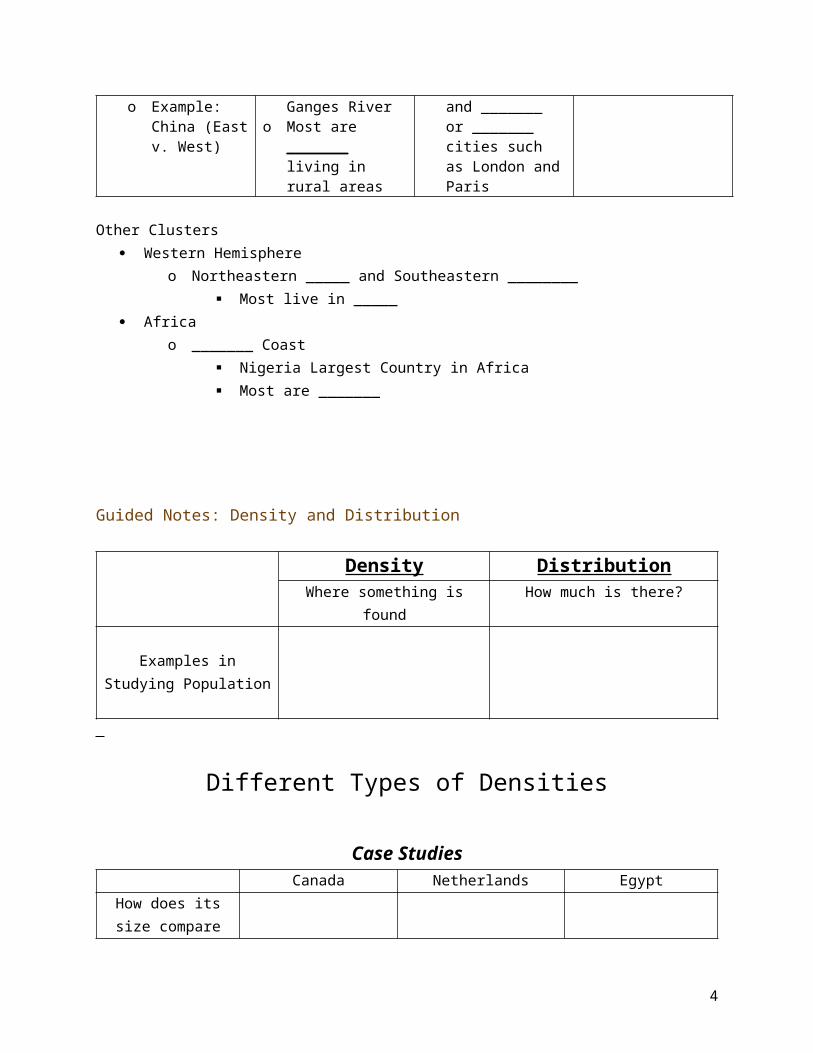
Guided Notes: Density and Distribution
Density DistributionWhere something is found How much is there?
Examples in Studying Population
Different Types of Densities
Case Studies Canada Netherlands Egypt
How does its size compare to U.S.
What is its climate like?
1.Arithmetic Density Total #/area
Population Density - Total # of people/area
Example: Canada
4
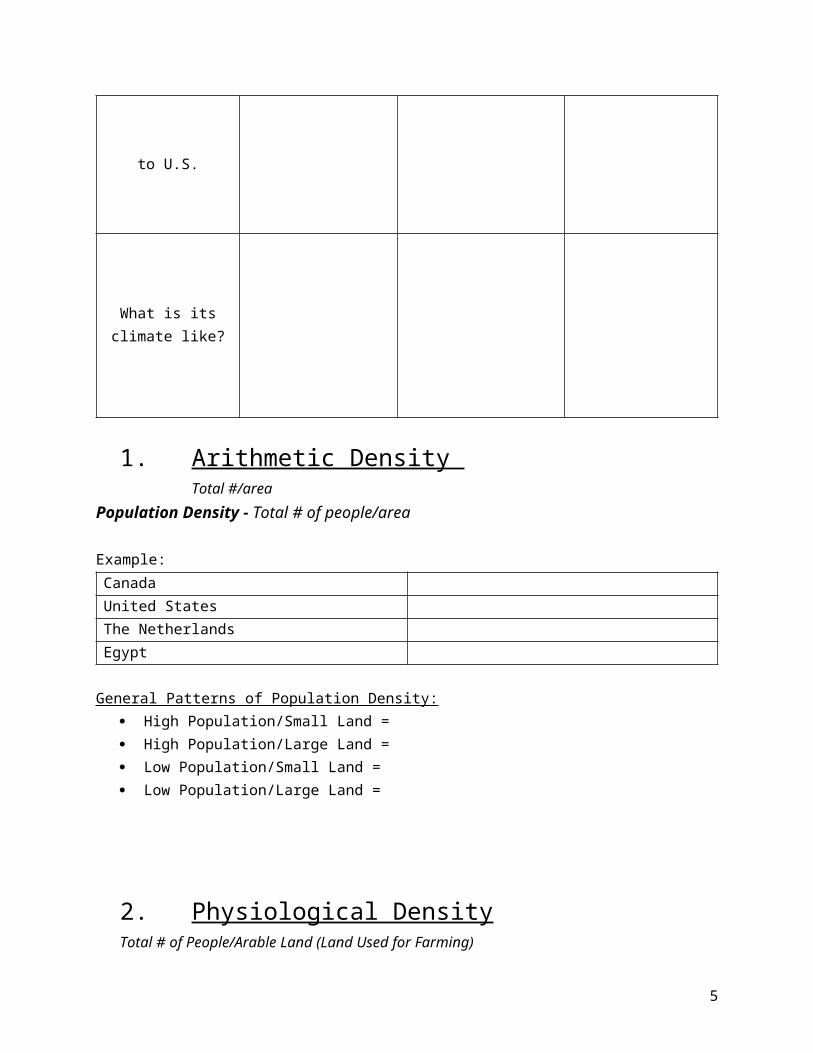
United StatesThe NetherlandsEgypt
General Patterns of Population Density: High Population/Small Land = High Population/Large Land = Low Population/Small Land = Low Population/Large Land =
2.Physiological Density Total # of People/Arable Land (Land Used for Farming)
Physiological Density
Total Land % Arable Land
Canada 3,855,000 sq. miles
.5
United States 3,794,000 sq. miles
1.7
Netherlands 16,033 sq. miles .01Egypt 386,700 sq. miles .03
Patterns of Physiological Density Greater % of Farm Land = Low % of Farm Land =
3.Agricultural Density Total # of farmers/Arable Land (Land Used for Farming)
Physiological Density
% Arable Land Percentage of Farmers
Canada .5 2United States 1.7 2Netherlands .01 3
Egypt .03 31
Patterns of Agricultural Density
5

_________________ countries have ___________ agricultural densities because technology and finance allow a few people to farm large land areas and feed many people
Guided Notes: Gendered Space
Definition: Areas or _____ designed for men or women
Examples:
6
POPULATION LEARNING TARGET #2
By the end of this section, I will be able to
DEFINE THE FOLLOWING WORDS
COMPLETE THE FOLLOWING
Crude Birth Rate Crude Death Rate Total Fertility Rate Dependency Group Population Pyramid Gendered Space Exponential Growth J Curve Renewable Resources Non-Renewable Resources Carrying Capacity Sustainability Thomas Malthus Point of Crisis Neo-Malthusians Green Revolution Exponential Growth Linear Growth
Identify and analyze the general patterns of population growth by world region
Describe Thomas Malthus’s theory
Analyze reasons for and against Thomas Malthus’s theory
Describe how population growth interacts with natural disasters
7

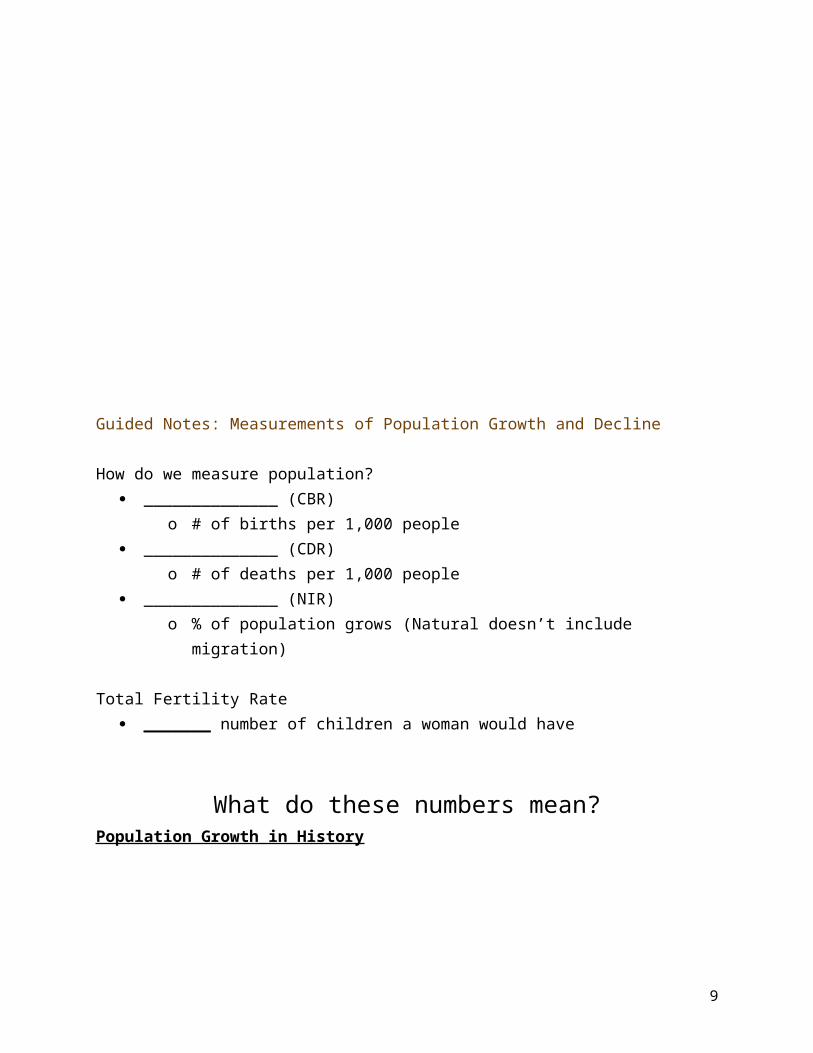
Guided Notes: Measurements of Population Growth and Decline
How do we measure population? ______________ (CBR)
o # of births per 1,000 people ______________ (CDR)
o # of deaths per 1,000 people ______________ (NIR)
o % of population grows (Natural doesn’t include migration)
Total Fertility Rate _______ number of children a woman would have
What do these numbers mean?Population Growth in History
Over the past 200 years, the world’s population has grown ___________
This is often referred to as the _____ curve
8
Population Growth Patterns Today 95% of today’s growth is occurring in ___________ countries (higher
birth rate)
The world’s total fertility rate is ________ (we are having less children than in the past)
o Why is the population still growing? Demographic Momentum : Occurs when, despite a
decreasing fertility rate, a country with a young population continues to experience continued population growth
Additional Measurements of PopulationPopulation Pyramids
Divided by ________ group and gender
_____________ Ratioo Number of people who are too _______ or too _____ to work
Sex Ratio
9

o Number of __________ for every 100 females• Developed countries usually have _______ females• Asian countries have more _______ than women
Guided Notes: Issues with PopulationSustainability and Resources
Key Vocabulary: Renewable Resource: Produced in nature more rapidly than it is __________ by
humanso Example:
Nonrenewable Resource: Produced in nature more __________ than consumed by humans
o Example:
Carrying Capacity: The number of people (or things) that can be _____________ in an area
Sustainability: 1. Environment: Used so that it doesn’t _________ the earth2. Economy: 3. Society: Decisions made by _______ those affected
Thomas Malthus and Sustainability
Arithmetic Growth: Grows using a _______ rate (resources)
Geometric Growth: Also known as ___________ growth (population)
Modern-Day Supporters of Thomas Malthus: _______________
10

Population and Natural Hazards
Natural Hazard Areas at High Risk with Large Populations
Example
Hurricane
Floods
Tornado
Volcanoes
Earthquake
Tsunami
Landslide
11

Desertification/Drought
Wildfires
Investigation Questions:
1. Where do natural disasters occur in relationship to population distribution?
2. If human population is increasing, how does this influence the level of effect a natural disaster can have on human population.
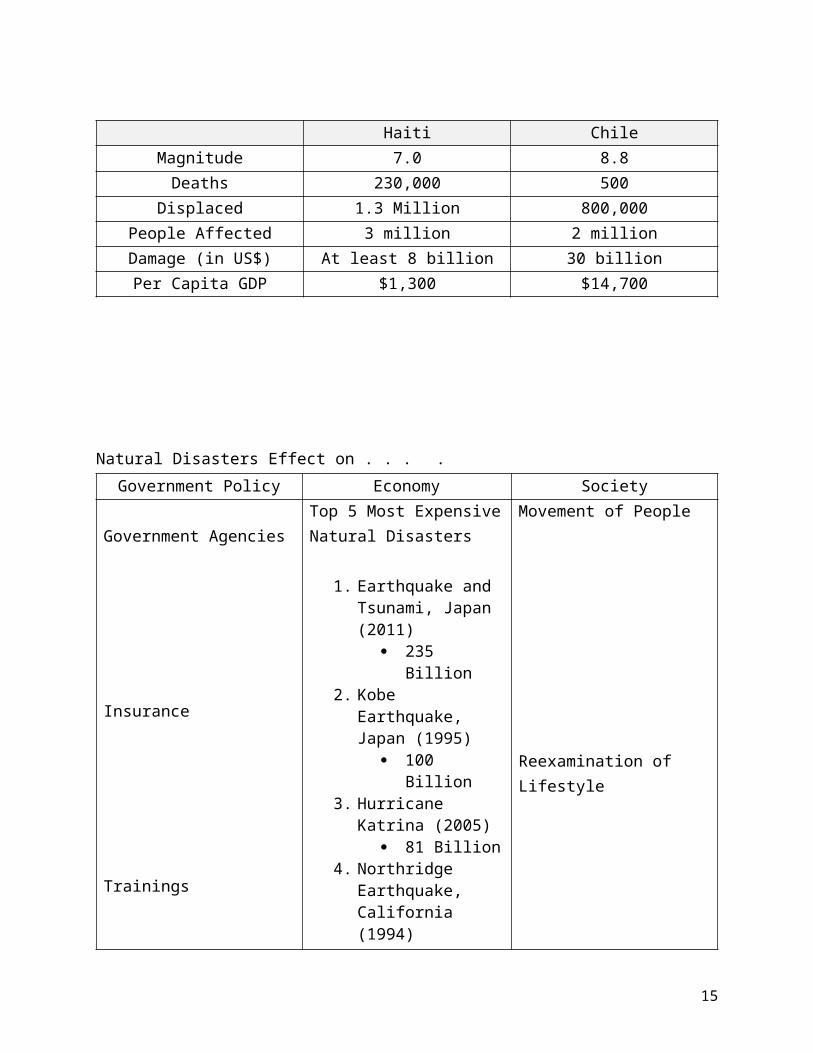
Natural Disasters’ Effect on Poor and Wealthy Countries - Case Study: Haiti and Chile and 2010 Earthquakes
Haiti ChileMagnitude 7.0 8.8
12

Deaths 230,000 500Displaced 1.3 Million 800,000
People Affected 3 million 2 millionDamage (in US$) At least 8 billion 30 billionPer Capita GDP $1,300 $14,700
Natural Disasters Effect on . . . . Government Policy Economy Society
Government Agencies
Insurance
Trainings
Top 5 Most Expensive Natural Disasters
1. Earthquake and Tsunami, Japan (2011)
235 Billion2. Kobe Earthquake,
Japan (1995) 100 Billion
3. Hurricane Katrina (2005)
81 Billion 4. Northridge
Earthquake, California (1994)
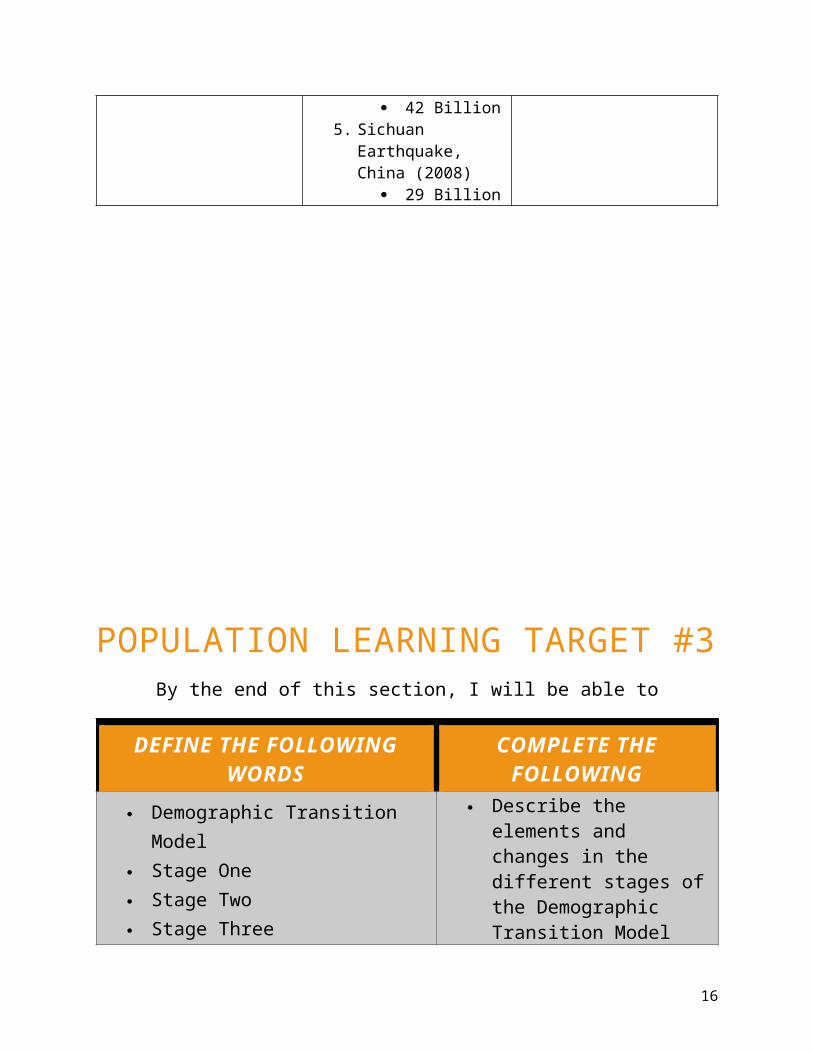
42 Billion5. Sichuan
Earthquake, China (2008)
29 Billion
Movement of People
Reexamination of Lifestyle
13

POPULATION LEARNING TARGET #3
By the end of this section, I will be able to
DEFINE THE FOLLOWING WORDS
COMPLETE THE FOLLOWING
Demographic Transition Model
Stage One Stage Two Stage Three Stage Four Stage Five Epidemiological Transition
Model Anti-Natalism Contraceptives India’s Policies China’s One Child Policy Pro-Natalism Pandemic
Describe the elements and changes in the different stages of the Demographic Transition Model and the Epidemiological Transition Model
Identify how countries have attempted to limit population growth
Identify how countries have attempted to increase population growth
14
Pestilence
Guided Notes - Understanding Growth: Demographic Transition Model
Demographic Transition Model Demographic: Transition:Model:
Definition: An example of change that occurs in a human population
For each of the 4 stages, identify what happens to birth rate, death rate, and if population size is increasing, decreasing, or remaining the same.
15
What country was the modeled after? ___________________
Stage One – High Death Rate and High Birth Rate Zero Population Growth
High Deaths All _________________ began with almost everyone in ___________
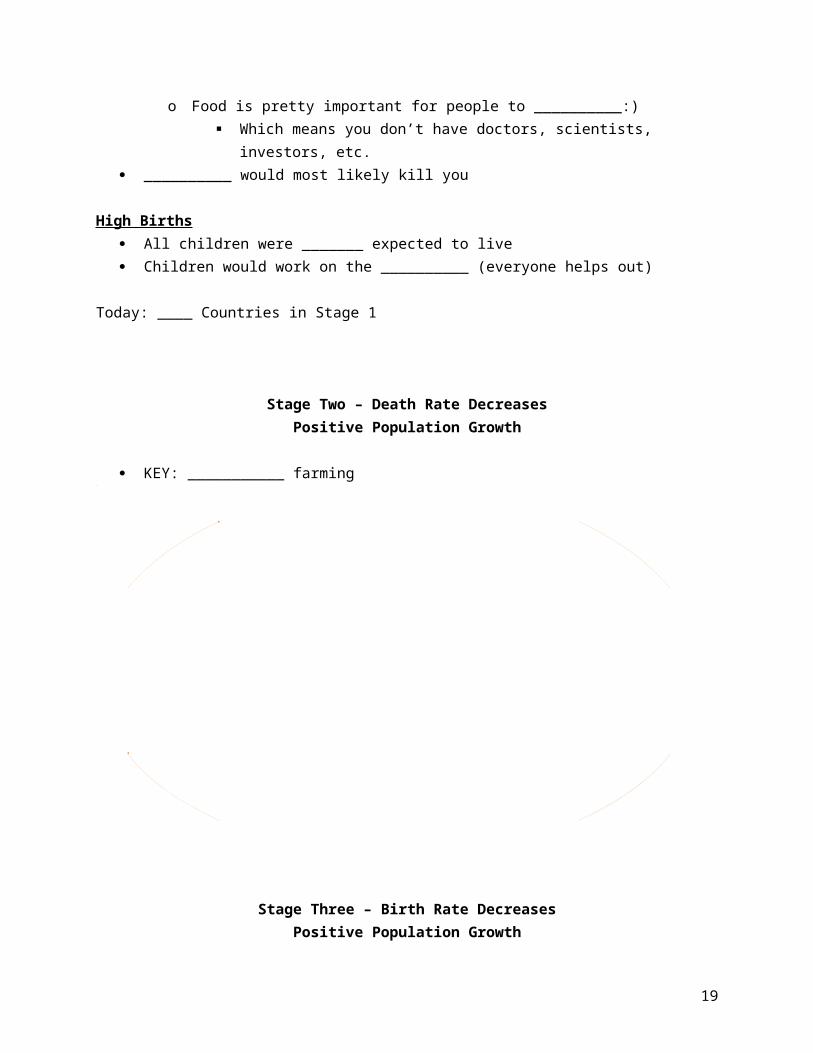
o Food is pretty important for people to __________:) Which means you don’t have doctors, scientists, investors, etc.
__________ would most likely kill you
High Births All children were _______ expected to live Children would work on the __________ (everyone helps out)
Today: ____ Countries in Stage 1
Stage Two – Death Rate DecreasesPositive Population Growth
KEY: ___________ farming
16
Stage OneBirth Rate:Death Rate:Total Population:
Stage TwoBirth Rate:Death Rate:Total Population:
Stage ThreeBirth Rate:Death Rate:Total Population:
Stage FourBirth Rate:Death Rate:Total Population:

Stage Three – Birth Rate DecreasesPositive Population Growth
Children are expected to live to ________ Need for less children
Investment in education Children go to ______ rather than work
Women receive more education Participate in the _______ Get married later and have children later (therefore less)
Stage Four: Low Deaths and Low BirthsLittle or No Population Growth
Stage 4: ________ Population Growth
Low Deaths Increased ______________
Low Births Less children _______ Women choose to have ______ children
Some people can be something other than a
farmer
Civilization can grow enough food
to support specialists
Specialists invent new technology
Technology affects how we
live
17

Future of the World?Stage 5?
Unknown Many guess . . .
o _________ population growth o Aging Population
DTM ApplicationBased on the CBR and CDR, identify the stage of DTM for each country
CBR CDR Stage???
China 12 7France 13 9Yemen 38 6India 22 7Germany 8 10United States 13 8
Connection between Demographic Transition Model and Epidemiological Transition Model
DTM ETMStage 1 Death Rates
HighHigh rates of Infectious and Parasitic Diseases
Parasitic Disease Example: ______ Infectious Disease Example: _______
Stage 2 Death Rates Drop
Receding Pandemics • Why? _______________________________
Stage 3 Death Rates Drop (People
get Older)
Increase in chronic disorders associated with _______ (Heart Disease and Cancer)
Stage 4 People Living Longer
People still die from Heart Disease and Cancer but they live ________
Demographic Transition Model: Variations Across the World
18
Country Examples
Policies
Anti-Natalist (Anti-
Natalism)
ChinaIndia
China _____ Child
Policy
India Free
Contraceptives
Free Sterilization
Pro-Natalist
(Pro-Natalism)
Tax ______ for Children Generous ______ Leave _______ Incentives
19

Remember, to head back to TPT to rate this product. I receive valuable information about my resources while you earn credits to
use on future purchases.
If you like this product, please visit my TPT Store.
Jenne Talbot
20