· web viewthe interest rate bank of tanzania charges on loans it extends to banks and to the...
TRANSCRIPT

BANK OF TANZANIA
ECONOMIC BULLETINFOR THE QUARTER ENDING
DECEEMBER, 2013VOL. XLV NO. 4
For any enquiries contact:Director of Economic Research and Policy
Bank of Tanzania, P.O. Box 2939, Dar es SalaamTel: 255 22 2233328/9, Fax: 255 22 2234060
http://www.bot-tz.org

TABLE OF CONTENTS
SUMMARY OF ECONOMIC DEVELOPMENTS................................................................iii
1.0 OUTPUT AND PRICES...................................................................................................1
Overall Economic Performance.........................................................................................1Sectoral Performance.........................................................................................................2Food Supply Situation........................................................................................................3Inflation Developments......................................................................................................4
2.0 MONETARY AND FINANCIAL DEVELOPMENTS......................................................6
Money and Credit...............................................................................................................6Interest Rates Developments..............................................................................................8Financial Market Operations..............................................................................................9
3.0 PUBLIC FINANCE...........................................................................................................12
Government Budgetary Operations..................................................................................12National Debt...................................................................................................................13
4.0 EXTERNAL SECTOR DEVELOPMENTS.....................................................................17
Current Account...............................................................................................................17World Commodity Prices.................................................................................................19
5.0 THE ZANZIBAR ECONOMY.........................................................................................21
Sectoral Performance.......................................................................................................21Government Budgetary Operations..................................................................................23Debt Developments..........................................................................................................24External Sector Developments.........................................................................................27
6.0 ECONOMIC DEVELOPMENTS IN THE EAC AND SADC.........................................30
7.0 STATISTICAL TABLES AND MANAGEMENT LIST.................................................32
A1: STATISTICAL TABLES.........................................................................................33A2: LIST OF MANAGEMENT....................................................................................107
8.0 GLOSSARY...................................................................................................................113
i

BOARD OF DIRECTORS
Prof. Benno J. Ndulu Governor, Chairman
Dr. Natu E. Mwamba Deputy Governor, Economic and Financial Policies (EFP)
Mr. Juma H. Reli Deputy Governor, Administration and Internal Controls (AIC)
Mr. Lila H. Mkila Deputy Governor, Financial Stability and Financial Deepening
(FSD)
Mr. Bedason A. Shallanda Representative from Ministry of Finance (MoF)
Mr. Khamis M. Omar Principal Secretary to the Treasury (RGZ)
Prof. Haidari K. Amani Director
Mrs. Esther P. Mkwizu Director
Mr. Yona S. Kilagane Director
Mr. Yusto E. Tongola Secretary to the Board
ii

SUMMARY OF ECONOMIC DEVELOPMENTS
The real Gross Domestic Product (GDP) at 2001 prices for Mainland Tanzania grew by 6.5
percent during the quarter ending September 2013, compared to a growth of 7.2 percent
recorded in the corresponding period in 2012. The decline in real GDP growth is mainly
explained by slowdown in growth of manufacturing activities. Average annual headline
inflation eased to 6.0 percent during the quarter ending December 2013, from 6.8 percent
recorded in the preceding quarter mainly due to a slowdown in prices of some items under
food and non-food groups.
Extended broad money supply (M3) recorded an annual growth rate of 10.0 percent
compared to 12.5 percent recorded in the year ending December 2012. This development is
explained by a slowdown in the growth of net domestic assets of the banking system. During
the quarter, banks’ lending and deposit rates exhibited a general upward trend when
compared to the rates recorded in the corresponding period in 2012. The spread between the
12-month deposit rate and the 1-year lending rate narrowed to 2.45 percentage points from
3.35 percentage points recorded in the quarter ending December 2012. Annual growth rate of
credit to the non-government sector declined to 15.3 percent in December 2013 from 18.2
percent recorded in corresponding period in 2012.
Government budgetary operations (on cheque issued basis) were characterized by good
domestic revenue collection coupled with moderate expenditure. Domestic revenue
collections were sufficient to cover recurrent expenditure for the quarter ending December
2013 by 96.7 percent. Total external debt stock increased by 3.5 percent to USD 13,195.7
million from the level recorded at the end of September 2013 mainly on account of new
disbursements and accumulation of interest arrears. Meanwhile, domestic debt stock
decreased by 1.6 percent to TZS 6,048.6 billion following large maturing obligations
compared to new issuance.
During the quarter ending December 2013, the current account recorded a deficit of USD
869.2 million compared to a deficit of USD 958.0 million recorded in the corresponding
quarter in 2012 on account of a decline in official current transfers. The USD was exchanged
at an average of TZS 1,609.0 compared to TZS 1,618.5 recorded in the quarter ending
September 2013.
iii

In Zanzibar, average headline inflation accelerated to 5.2 percent from 3.9 percent recorded
in the quarter ending December 2012, largely due to increases in the prices of some items
under food, and communications and education sub-groups. Government budgetary operations recorded good performance with tax revenue be within the target for the
quarter. Development expenditure was below the period estimates by 7.1 percent on account
of delays in disbursement of project funds by Development Partners and Government. The
current account position improved, recording a deficit of USD 1.4 million compared with a
deficit of USD 10.7 million recorded in the quarter ending December 2012, mainly on
account of an increase in income receipts and official current transfers.
In the East African Community region, headline inflation declined to an average of 6.8
percent during the quarter ending December 2013, from 7.1 percent recorded in the preceding
quarter. This development was mainly due to easing of prices of some food items, water,
electricity, gas and fuel as well as costs of housing and transport. In the Southern African
Development Community region, the average headline inflation was 6.1 percent compared
to 6.7 percent recorded in the quarter ending September 2013.
iv

1.0 OUTPUT AND PRICES
Overall Economic Performance
Real GDP at market prices is estimated to have grown by 6.5 percent in the third quarter of
2013, compared to a growth of 7.2 percent recorded in the corresponding quarter in 2012.
This outturn was mainly on account of growth deceleration recorded in manufacturing
activities. Activities which recorded higher growth rates than the ones recorded in the third
quarter of 2012 include agriculture, fishing, mining and quarrying, construction, wholesale
and retail trade, transport and communication, real estate and business services, and financial
intermediation (Table 1.1).
Table 1.1: Quarterly Growth of Gross Domestic Product by Activity at 2001 Constant PricesPercent
Mar-12 Jun-12 Sep-12 Dec-12 Mar-13 Jun-13 Sep-13
Agriculture 0.4 5.1 5.7 2.5 1.4 5.3 6.1Fishing 2.0 6.5 1.5 0.9 1.8 2.4 3.1Mining and quarrying 23.8 -5.1 1.3 14.8 -4.7 4.3 10.4Manufacturing 4.9 8.2 11.6 7.4 8.6 5.8 5.8Electricity 5.1 -1.1 7.6 12.2 6.3 4.5 2.3Construction 3.7 4.3 6.5 13.2 5.3 12.3 7.3Wholesale and retail trade 12.1 7.0 6.1 6.0 9.5 5.9 7.0Hotels and restaurants 3.9 2.7 6.4 5.6 3.4 3.2 4.2Transport and communication 16.2 13.6 10.6 10.3 22.2 14.8 11.6Financial intermediation 13.1 11.0 11.3 17.9 13.7 15.2 11.6Real estate and business services 8.1 6.9 5.0 6.5 10.0 6.7 5.3Public administration 6.8 6.3 5.5 4.6 3.6 5.0 5.1Education 6.0 6.5 6.7 6.8 5.6 5.7 5.4Other services 4.9 5.5 5.4 4.5 4.3 3.8 4.8
less FISIM 16.0 15.8 9.3 10.6 16.7 15.9 7.8All indust. at basic prices 7.3 6.2 6.7 7.5 7.6 6.8 6.6
Taxes on products 6.6 5.2 16.0 1.9 5.3 4.4 5.5GDP at market prices 7.3 6.2 7.2 7.0 7.5 6.7 6.5
Activity Quarter Ending
Source: National Bureau of Statistics
Highest growth rate was recorded in transport and communication, and financial
intermediation each growing at 11.6 percent, followed by mining and quarrying (10.4
percent), construction (7.3 percent) and agriculture (6.1 percent). The growth in financial
intermediation is mainly explained by the rise in levels of deposits and lending by banks, and
insurance premium. Meanwhile, observed growth in transport and communication activities
was on account of an increase in volume of cargo handled, number of passengers transported
and mobile phone airtime usage. Growth in construction is associated with increased
construction of buildings and roads, while that of mining is attributed to increased production
1

of gold and Tanzanite. Increase in food crops production particularly maize, rice, sorghum
and millet largely explained growth recorded in agricultural activities.
Sectoral Performance
Procurement of Traditional Export Crops
During the quarter ending December 2013, procurement of major traditional export crops
increased to 184,456.8 tonnes from 125,746.3 tonnes recorded in corresponding period in
2012 on account of rise in procurement of sisal and cashew nuts (Table 1.2). Procurement of
sisal and cashew nuts increased during the quarter following high global demand and
improved weather condition, respectively. Meanwhile, procurement of cotton declined on
account of inadequate supply of inputs, bad weather condition and low farm gate prices
offered.
Table 1.2: Procurement of Traditional Export Crops
Tonnes
2012 2013Tobacco off season off seasonCashew nuts 51,005.1 105,365.2 106.6Coffee 31,073.9 35,158.0 13.1Cotton lint 23,308.4 17,588.8 -24.5Sisal 10,548.4 16,752.3 58.8Tea 9,810.5 9,592.5 -2.2Total 125,746.3 184,456.8 46.7
October - December % Change
Source: Respective Crops Boards
Production of Gold and Diamond During the quarter ending December 2013, the value of gold produced declined to USD 407.3
million, from USD 520.0 million realized in the corresponding quarter in 2012 due to decline
in unit price in the world market. Production of gold by large scale miners declined to 9,845.5
kilograms, from 9,850.1 kilograms recorded in the quarter ending December 2012.
Production of diamond also declined during the review period (Table 1.3).
Table 1.3: Production of Gold and Diamond
Dec-12 Sep-13 Dec-13 Sep to Dec-13 Dec-12 to Dec-13
Gold Kilograms 9,850.1 8,658.7 9,845.5 13.7 0.0Value (USD Million) 520.0 387.8 407.3 5.0 -21.7
Diamond Karats 46,889.2 28,359.1 35,382.5 24.8 -24.5Value (USD Million) 11.6 7.9 10.2 29.9 -11.9
% ChangeMineral Type Unit
Quarter Ending
Source: Respective Mining Companies
2

Food Supply SituationFood supply situation in the country remained satisfactory with some pockets of food
shortages reported. During the quarter under review, the National Food Reserve Agency
(NFRA) purchased 14,013.1 tonnes of maize and sorghum and sold 5,248.8 tonnes to Prison
Department and Disaster Coordination Unit under the Prime Minister’s office. The stock of
maize and sorghum held by NFRA increased to 233,552.5 tonnes at the end of December
2013, from 89,951.0 tonnes recorded in corresponding period in 2012 (Table 1.4).
Table 1.4: National Food Reserve Agency Stock Tonnes
% Change2012-2013
January 128,919 66,267 220,035 166,796 72,170 -56.7February 125,430 64,461 226,281 142,906 60,739 -57.5March 124,252 60,694 224,355 123,312 46,153 -62.6April 122,849 53,821 215,662 105,245 36,982 -64.9May 109,876 50,312 191,419 78,125 26,802 -65.7June 94,699 48,248 165,216 65,985 27,494 -58.3July 88,841 47,143 139,404 61,469 71,141 15.7August 93,231 90,519 155,348 75,489 175,609 132.6September 110,278 138,694 200,053 91,021 224,788 147.0October 107,177 180,803 194,090 98,544 235,817 139.3November 86,542 197,747 188,702 105,734 234,145 121.4December 77,644 210,895 179,488 89,951 233,553 159.6
201320122011Period 2009 2010
Source: National Food Reserve Agency
During the quarter ending December 2013, wholesale prices for all selected food crops, with
exception of sorghum and beans, declined when compared with those recorded in the
corresponding quarter in 2012 mainly due to higher seasonal crop harvests (Table 1.5).
Table 1.5: National Average Wholesale Prices for Selected Food Crops TZS per 100 Kilogram
Dec-12 Sep-13 Dec-13 Sep to Dec-13 Dec-12 to Dec-13
Maize 65,318 51,859 53,714 3.6 -17.8Rice 178,158 124,108 119,962 -3.3 -32.7Beans 133,419 123,264 134,383 9.0 0.7Sorghum 69,181 87,974 75,365 -14.3 8.9Round Potatoes 80,621 66,107 67,390 1.9 -16.4
% ChangeQuarter EndingCrop
Source: Ministry of Industry, Trade and Marketing
3

Inflation Developments
Headline inflation eased to an average of 6.0 percent in the quarter ending December 2013,
from 12.4 percent recorded in the corresponding quarter in 2012. This development was
mainly on account of gradual slowdown in food prices following improved food supply in the
country and eastern Africa region. Average quarterly food and non-alcoholic beverages
inflation decelerated to 6.7 percent, from 13.8 percent recorded in the quarter ending
December 2012. Likewise, non-food inflation declined to 5.8 percent, from an average of
10.2 percent registered in the quarter ending December 2012 (Chart 1.1).
Chart 1.1: Annual Headline, Food and Non-food Inflation
0
5
10
15
20
25
30
Jan-
12Fe
b-12
Mar
-12
Apr
-12
May
-12
Jun-
12Ju
l-12
Aug
-12
Sep-
12O
ct-1
2N
ov-1
2D
ec-1
2Ja
n-13
Feb-
13M
ar-1
3A
pr-1
3M
ay-1
3Ju
n-13
Jul-
13A
ug-1
3Se
p-13
Oct
-13
Nov
-13
Dec
-13
Perc
ent
Headline Food Non-food Non-Food non-energy
Source: National Bureau of Statistics and Bank of Tanzania.
With the exception of alcoholic and tobacco, and communication, all other CPI categories
registered lower inflation rates compared to the corresponding quarter in 2012 (Table 1.6).
4

Table 1.6: Quarterly Percentage Changes in the National Consumer Price Index Base: Sept 2010 = 100
Dec-12 Mar-13 Jun-13 Sep-13 Dec-13
Headline/All items 100 12.4 10.4 8.5 6.8 6.0Food and Non Alcoholic Beverages 47.8 13.8 11.7 8.6 7.0 6.7Transport 9.5 21.4 19.8 16.9 11.0 9.5Housing, Water, Electricity, Gas and Other Fuel 9.2 12.0 17.3 5.4 5.1 4.3Clothing and Footwear 6.7 17.3 8 18.1 12.8 9.3Furnishing, Housing Equip. and Routine Maintenance of the House 6.7 8.2 6.1 4.3 3.5 2.7Restaurants and hotels 6.4 2.9 9.8 3.0 2.8 2.1Alcoholic and Tobacco 3.3 2.7 11.5 6.3 8.1 8.7Communication 2.1 -1.8 -0.8 -0.6 -0.1 0.2Education 1.7 10.8 2.9 2.4 0.4 0.7Recreation and Culture 1.3 4.7 5.2 2.2 2.4 2.4Health 0.9 16.1 3.2 5.6 4.3 2.6Miscellaneous goods and services 4.5 8.5 6.8 5.0 5.8 5.2Other Selected Groups: Food and Non-alcoholic Beverages - combining food consumed at home and in restaurants 11.5 8.3 7.5 7.2 Energy and Fuels - combining electricity and other fuels for use at home with petrol and diesel 18.2 19.4 18.8 12.6 11.1 All Items Less Food (Non-Food) 49 10.2 8.8 8.7 6.9 5.8 All Items Less Food and Energy 43.3 8.7 6.8 6.8 6.2 5.2
5.7
14.0
Weight
51
Quarter EndingMain Groups
Source: National Bureau of Statistics
5

2.0 MONETARY AND FINANCIAL DEVELOPMENTS
Money and Credit
During the year ending December 2013, extended broad money supply (M3) grew by 10.0
percent compared with 12.5 percent recorded in the corresponding period in 2012. This
development was on account of slowdown in the growth of net domestic assets of the
banking system. Net claims on the government grew by 26.5 percent compared to 37.3
percent recorded in the year ending in December 2012, while credit to the private sector grew
by 15.3 percent from 18.2 percent. Net foreign assets (NFA) of the banking system recorded
annual growth of 2.8 percent in December 2013 compared to 2.0 percent recorded in the
corresponding period in 2012 following increase in NFA of the Bank of Tanzania (Chart 2.1
and Table 2.1).
Chart 2.1: Annual Growth Rates of Monetary Aggregates and its Components
0
5
10
15
20
25
30
-500
-250
0
250
500
750
1000
Dec-11 Mar-12 Jun-12 Sep-12 Dec-12 Mar-13 Jun-13 Sep-13 Dec-13
Billi
ons o
f TZS
Perc
ent
Annual change in NFA of Banking System Annual Change in Net Government BorrowingGrowth of M3 (RHS) Growth of Private Sector Credit (RHS)
Note: RHS = Right Hand Scale Source: Bank of Tanzania
6

Table 2.1: Developments in Selected Monetary Aggregates Billions of TZS
Dec-12 Sep-13 Dec-13 Dec-12 Sep-13 Dec-13 Dec-12 Sep-13 Dec-13Net Foreign Assets of the Banking System 6,396.0 6,691.6 6,576.3 122.4 318.7 180.3 2.0 5.0 2.8
Bank of Tanzania 5,385.3 6,158.8 6,187.5 522.1 794.2 802.2 10.7 14.8 14.9Banks 1,010.7 532.8 388.8 -399.7 -475.5 -621.9 -28.3 -47.2 -61.5
Net Domestic Assets of the Banking System 8,251.1 9,241.3 9,530.4 1,503.4 1,591.6 1,279.4 22.3 20.8 15.5Domestic Claims 11,029.8 12,254.0 12,947.2 1,936.2 2,165.7 1,917.4 21.3 21.5 17.4
Claims on central government (net) 2,019.4 2,359.8 2,554.6 548.1 853.8 535.2 37.3 56.7 26.5Claims on Other Sectors 9,010.4 9,894.2 10,392.7 1,388.1 1,311.9 1,382.3 18.2 15.3 15.3
Extended Broad Money Supply (M3) 14,647.1 15,932.9 16,106.8 1,625.8 1,910.3 1,459.7 12.5 13.6 10.0Foreign Currency Deposits (FCD) in National Currency 3,922.6 4,187.3 4,216.2 149.2 466.9 293.6 4.0 12.6 7.5
FCD in millions of US dollar 2,495.9 2,609.1 2,670.9 87.3 238.3 175.0 3.6 10.1 7.0Broad Money Supply (M2) 10,724.5 11,745.6 11,890.6 1,476.6 1,443.4 1,166.0 16.0 14.0 10.9
Other Deposits in National Currency 4,186.0 4,466.7 4,672.4 510.0 560.4 486.5 13.9 14.3 11.6Narrow Money Supply (M1) 6,538.6 7,279.0 7,218.1 966.6 883.0 679.6 17.3 13.8 10.4
Currency in Circulation 2,414.8 2,703.3 2,764.0 179.0 223.3 349.2 8.0 9.0 14.5Transferable Deposits in National Currency 4,123.8 4,575.6 4,454.2 787.6 659.7 330.4 23.6 16.8 8.0
Memorandum ItemsNominal Exchange Rate (end of period) (TZS/USD) 1,571.6 1,604.9 1,578.6
Outstanding Stock Annual Change Annual Growth (%)
Source: Bank of Tanzania
In 2013, the highest credit growth rate was recorded in building and construction activities
followed by transportation and communication, and trade (Chart 2.2). Meanwhile, trade
activities continued to hold the largest share in total outstanding banks’ credit (Chart 2.3).
Chart 2.2: Annual Growth of Banks' Credit to Selected ActivitiesPercent
14.2
21.0
6.8
2.9
11.9
28.0
0.61.
6
13.8
23.3
1.3
22.6
19.5
6.2
-1.9
17.3
17.0
2.8
19.3
25.2
2.2
Personal Trade Manufacturing Agriculture Transport andCommunication
Building andConstruction
Hotels andRestaurants
Dec-12 Sep-13 Dec-13
Source: Bank of Tanzania
7

Chart 2.3: Share of Banks’ Outstanding Credit to Various ActivitiesPercent
20
.4 21.1
11.4
10.8
7.0
4.7
4.2
18.2 20
.7
11.5
10.8
7.5
5.0
3.8
17.2
21.3
11.4
9.5
7.2
5.1
3.7
Personal Trade Manufacturing Agriculture Transport andCommunication
Building andConstruction
Hotels andRestaurants
Dec-12 Sep-13 Dec-13
Source: Bank of Tanzania
Interest Rates Developments
During the quarter ending December 2013, interest rates offered and charged by commercial
banks recorded a general upward trend, except for short-term lending rate and rates charged
to prime customers. Overall deposit rate averaged 8.63 percent compared to 8.50 percent and
8.86 percent recorded in the quarters ending December 2012 and September 2013,
respectively. Likewise, 12-month deposit rate increased to an average of 11.42 percent from
10.91 percent recorded in the quarter ending December 2012 but was lower than the rate
recorded in the quarter ending September 2013 by 26 basis points.
Average overall lending rate during the quarter ending December 2013 was 16.05 percent,
higher than the rates recorded in the corresponding quarter in 2012 and the preceding quarter
by 6 basis points and 37 basis points, respectively. One-year lending rate averaged 13.87
percent compared with 14.26 percent and 13.71 percent recorded in the quarters ending
December 2012 and September 2013, respectively. The spread between the 12-month deposit
rate and one-year lending rate narrowed to 2.45 percent from 3.35 percent recorded in quarter
ending December 2012 (Table 2.2).
8

Table 2.2: Interest Rate Structure (Quarterly Average) Percent
Dec-11 Mar-12 Jun-12 Sep-12 Dec-12 Mar-13 Jun-13 Sep-13 Dec-13
Overall Interbank cash market rate 18.34 15.23 19.26 6.85 6.26 6.55 9.37 8.05 7.69Overnight interbank cash market 18.28 15.15 19.06 6.51 5.69 6.05 8.86 7.76 7.33
REPO Rate 9.37 6.11 5.48 5.85 4.33 4.07 3.62 2.53 3.90Discount Rate 11.19 12.00 12.00 12.00 12.00 12.00 12.00 12.00 12.00
Overall Treasury bills rate 14.98 14.73 14.19 12.94 12.72 13.41 13.81 14.61 15.0435 days 3.87 7.42 5.72 4.28 7.59 6.69 6.40 6.29 4.7191 days 11.08 12.72 13.67 12.44 12.01 11.21 11.85 12.79 13.51182 days 14.01 14.73 13.81 13.04 13.02 13.18 13.98 15.02 15.30364 days 15.58 15.29 14.74 13.39 13.48 13.96 14.35 15.35 15.39
Treasury bond rates2-years 12.54 16.48 14.31 14.13 13.98 14.29 14.22 15.02 15.005-years 12.92 16.31 14.90 14.66 14.67 14.57 14.95 14.34 15.497-years 14.99 14.23 15.17 14.93 15.19 15.39 15.39 15.76 15.6010-years 15.54 15.53 15.05 15.10 15.64 15.30 14.95 15.44 15.8915-years 16.65
Overall Time Deposits Rate 6.76 7.82 8.48 8.61 8.50 8.84 8.73 8.86 8.6312 month time deposit rate 8.73 10.38 11.75 11.72 10.91 11.14 11.37 11.67 11.42
Negotiated Deposit Rate 9.36 9.86 10.10 9.69 9.77 10.04 10.23 10.77 10.69
Overall Lending rate 14.37 15.28 15.20 15.77 15.98 15.76 15.84 15.67 16.05Short-term lending rate (up to 1year) 14.08 13.89 14.13 14.45 14.26 14.06 14.36 13.71 13.87
Negotiated Lending Rate 13.46 14.28 13.80 13.89 14.26 14.72 13.49 13.51 13.38Margin between short-term lending and one-year time deposit rates
5.36 3.51 2.38 2.73 3.35 2.93 3.00 2.04 2.45
Quarter Ending
Source: Bank of Tanzania
Financial Market Operations
In the quarter ending December 2013, the Bank offered Treasury bills worth TZS 1,075.0
billion compared to TZS 995.0 billion offered in the preceding quarter. Demand amounted to
TZS 1,162.8 billion and the Bank accepted bids worth TZS 754.9 billion. Overall Weighted
Average Yield (WAY) increased to an average of 14.92 percent from 14.61 percent recorded
in the preceding quarter (Chart 2.4).
Chart 2.4: Treasury bills Market Performance
10
11
12
13
14
15
16
300
600
900
1200
1500
1800
Dec-11 Mar-12 Jun-12 Sep-12 Dec-12 Mar-13 Jun-13 Sep-13 Dec-13
Perc
ent
Billi
ons o
f TZS
Offer Tender Sucessful Bids Weighted Average Yield (RHS)
Note: RHS = Right Hand Scale Source: Bank of Tanzania
9

In an effort to increase the number of instruments used in the financial market while
maintaining smooth redemption profile, the Bank of Tanzania on behalf of the Government
launched a 15-year Treasury bond during the quarter under review. The Bank offered
Treasury bonds of different maturities amounting to TZS 214.4 billion compared to TZS
215.4 billion offered in the quarter ending September 2013. Total demand amounted to TZS
403.8 billion and the Bank accepted bids worth TZS 147.6 billion.
Total transactions in the interbank cash market amounted to TZS 2,709.96 billion
compared to TZS 3,164.07 billion transacted in the quarter ending September 2013.
Overnight placements accounted for 76.8 percent of total transactions against 84.2 percent
registered in the preceding quarter, while overnight interbank rate decreased to an average of
7.33 percent from 7.76 percent (Chart 2.5). This development signals that liquidity level in
banks has increased.
Chart 2.5: Inter-bank Cash Market Developments
3
6
9
12
15
18
21
800
1300
1800
2300
2800
3300
3800
Dec-11 Mar-12 Jun-12 Sep-12 Dec-12 Mar-13 Jun-13 Sep-13 Dec-13
Perc
ent
Billi
ons o
f TZS
Value of Interbank Cash Market TransactionsValue of Overnight TransactionsOvernight Interbank Cash Market Rate (RHS)Overall Interbank Cash Market Rate (RHS)
Note: RHS = Right Hand Scale Source: Bank of Tanzania
During the quarter ending December 2013, the Bank conducted repurchase agreements
(repos) with commercial banks amounting to TZS 557.6 billion compared to TZS 295.0
billion transacted in the preceding quarter. Meanwhile, repo rate increased to an average of
3.90 percent from 2.53 percent registered in the quarter ending September 2013 (Chart 2.6).
10

Chart 2.6: Repo Market Developments
0
2
4
6
8
10
0
150
300
450
600
750
900
Dec-11 Mar-12 Jun-12 Sep-12 Dec-12 Mar-13 Jun-13 Sep-13 Dec-13
Perc
ent
Billi
ons o
f TZS
Repo Conducted Repo Rate (RHS)
Note: RHS = Right Hand Scale Source: Bank of Tanzania
Total transactions in the Interbank Foreign Exchange Market (IFEM) during the quarter
ending December 2013 amounted to USD 432.2 million, out of which USD 145 million were
sold by the Bank. The Shilling appreciated to an average of TZS 1,609.04 per USD from TZS
1,618.40 per USD recorded in the quarter ending September 2013. However, on annual basis
the Shilling depreciated by 1.9 percent from an average of TZS 1,578.40 per USD recorded in
the quarter ending December 2012 (Chart 2.7).
Chart 2.7: Inter–Bank Exchange Rate Movements and Value of Transaction
1570
1590
1610
1630
1650
1670
250
350
450
550
650
Dec-11 Mar-12 Jun-12 Sep-12 Dec-12 Mar-13 Jun-13 Sep-13 Dec-13
TZS/
USD
Mill
ions
of
USD
Total Value of Transactions Weighted Average Exchange Rate (TZS/USD)(RHS)
Note: RHS = Right Hand Scale Source: Bank of Tanzania
11

3.0 PUBLIC FINANCE
Government Budgetary Operations
During the quarter ending December 2013, Government budgetary operations recorded an
overall deficit of TZS 386.9 billion, which was financed by foreign and domestic borrowings.
Domestic revenue (excluding Local Government Authorities own sources) amounted to TZS
2,447.7 billion, which is 15 percent below the target. Tax revenue was TZS 2,319.6 billion or
86.8 percent of the target for the quarter and accounted for 92.4 percent of total revenue. The
under-performance in tax collections was partly explained by resistance in the use of
Electronic Fiscal Devices (EFDs) and delays in the implementation of some revenue
measures.
Grants disbursed during the quarter ending December 2013 amounted to TZS 567.2 billion
against the projection of TZS 913.5 billion (Chart 3.1).
Chart 3.1: Government Resources for the Quarter Ending December 2013 Billions of TZS
1,03
4.1
550.
4
944.
1
143.
4
205.
9 432.
3
946.
3
421.
7
848.
3
103.
4
128.
0
567.
2
Taxes onImports
Taxes on LocalGoods andServices
Income Taxes Other taxes Non- taxRevenue
Grants
Target Actuals
Source: Ministry of Finance
Total expenditure during the quarter under review amounted to TZS 3,684.7 billion or 84.2
percent of budget estimate for the period. Out of total expenditure, TZS 2,595.7 billion was
recurrent expenditure and TZS 1,089.1 billion development expenditure, equivalent to 94.3
percent and 67.1 percent of estimates, respectively (Chart 3.2).
12

Chart 3.2: Government Expenditure for the Quarter Ending September 2013 Billions of TZS
1,
214.
7
222.
2
1,31
5.5
1,62
3.0
1,12
5.0
247.
8
1,22
2.9
1,08
9.1
Wages and salaries Interest payments Other ReccurentExpenditures
Dev. Expenditure andnet lending
Estimate Actuals
Source: Ministry of Finance
National Debt
External debt stock as at the end of December 2013 was USD 13,195.7 million, an increase
of USD 451.4 million and USD 2,530.8 million over the amount recorded at the end of
preceding quarter and the corresponding quarter in 2012, respectively. The increase was on
account of new disbursements and accumulation of interest arrears. Out of the external debt
stock 88.7 percent was Disbursed Outstanding Debt (DOD) and 11.3 percent was interest
arrears.
Central Government debt accounted for the largest share in external debt stock and has
increased to USD 10,414.2 million, from USD 10,160.9 million and USD 8,241.3 million
recorded at the end of preceding quarter and corresponding quarter in 2012, respectively. The
increase was mainly due to new disbursements received from International Development
Association (IDA), Credit Suisse and Exim Bank. The amount and shares in respect of other
borrower categories are as presented in Table 3.1.
13

Table 3.1: External Debt Stock by Borrower Category Millions of USD
Borrower Dec-12 Share (%) Sep-13 Share (%) Dec-13 Share (%)Central Government 8,241.3 77.3 10,160.9 79.7 10,414.2 79.7
DOD 7,447.5 69.8 9,377.3 73.6 9,605.9 73.6Interest Arrears 793.8 7.4 783.6 6.1 808.3 6.1
Private Sector 1,879.3 17.6 1,951.6 15.3 2,257.4 15.3DOD 1,283.4 12.0 1,524.2 12.0 1,569.1 12.0Interest Arrears 595.9 5.6 427.4 3.4 688.3 3.4
Parastatal Companies 544.3 5.1 631.8 5.0 524.1 5.0DOD 410.9 3.9 523.4 4.1 524.1 4.1Interest Arrears 133.4 1.3 108.4 0.9 0.0 0.9
External Debt Stock 10,664.9 100.0 12,744.3 100.0 13,195.7 100.0Source: Ministry of Finance and Bank of Tanzania
External debt by creditor category indicates that during the quarter ending December 2013
debt increased across all creditor categories (Table 3.2).
Table 3.2: External Debt Stock by Creditor Category Millions of USD
Creditor Dec-12 Share(%) Sep-13 Share(%) Dec-13 Share(%)Multilateral 5,909.0 55.4 6,671.3 52.3 6,859.9 52.0
DOD 5,901.5 55.3 6,662.4 52.3 6,853.3 51.9Interest Arrears 7.5 0.1 8.9 0.1 6.6 0.1
Bilateral 1,763.2 16.5 1,817.8 14.3 1,832.0 13.9DOD 970.4 9.1 1,034.2 8.1 1,030.3 7.8Interest Arrears 792.8 7.4 783.6 6.1 801.7 6.1
Commercial 2,247.0 21.1 3,433.8 26.9 3,598.8 27.3DOD 1,649.4 15.5 3,015.6 23.7 3,050.3 23.1Interest Arrears 597.6 5.6 418.2 3.3 548.5 4.2
Export Credit 745.7 7.0 821.4 6.4 905.0 6.9DOD 620.5 5.8 713.0 5.6 765.2 5.8Interest Arrears 125.2 1.2 108.4 0.9 139.8 1.1
External Debt Stock 10,664.9 100.0 12,744.3 100.0 13,195.7 100.0Source: Ministry of Finance and Bank of Tanzania
Disbursements received and recorded during the quarter under review amounted to USD
270.9 million. External debt service amounted to USD 56.5 million, out of which USD 29.7
million was principal and USD 26.7 million interest payments. The amount of debt service
was 2.2 percent of export of goods and services against a sustainability threshold of 25 per
cent.
The stock of domestic debt as at the end of December 2013 was TZS 6,048.6 billion, a 1.6
percent decrease over the amount recorded at the end of the preceding quarter. This
development was on account of large maturing obligations compared to new issuance.
14

However, the domestic debt increased by 17.4 percent when compared to amount recorded at
the end of December 2012 on account of relatively large issuance of Government bonds
compared to maturing obligations. Out of total domestic debt, Government bonds accounted
for largest share (Table 3.3).
Table 3.3: Government Domestic Debt by InstrumentsBillions of TZS
Dec-12 Share(%) Sep-13 Share(%) Dec-13 Share(%)Government Securities 5,151.5 100.0 6,138.3 99.9 6,040.7 99.9
Treasury Bills 1,042.8 20.2 1,580.8 25.7 1,388.7 23.0Government Stocks 257.1 5.0 257.1 4.2 257.1 4.3Government Bonds 3,851.5 74.8 4,300.4 70.0 4,394.8 72.7Tax Certificates 0.1 0.1 0.1 0.1 0.1 0.0
Non Securuitized Debt 0.0 0.0 8.0 0.1 8.0 0.1Total Domestic Debt 5,151.5 100.0 6,146.3 100.0 6,048.6 100.0Interest Arrears 0.0 0.0 0.0 0.0 0.0 0.0Domestic Debt Stock 5,151.5 100.0 6,146.3 100.0 6,048.6 100.0Source: Ministry of Finance and Bank of Tanzania
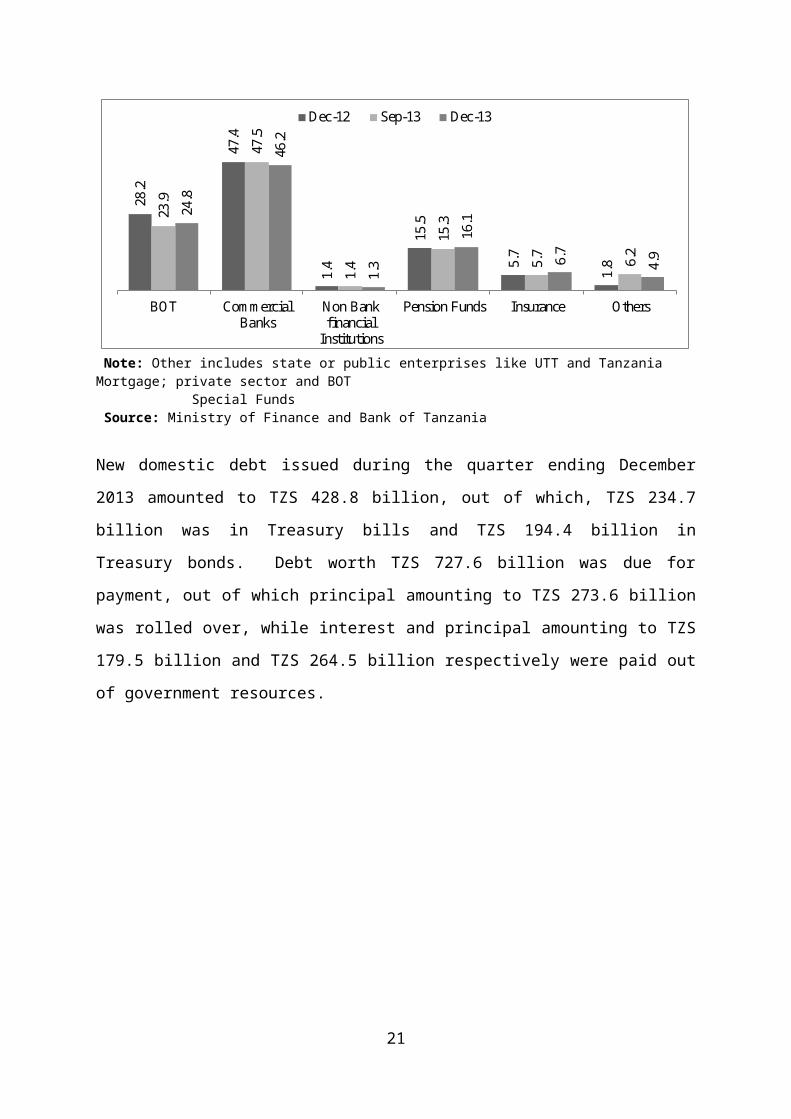
Commercial banks were the largest creditor to the Government, holding 46.2 percent of total
domestic debt, followed by the Bank of Tanzania and Pension Funds (Chart 3.3).
Chart 3.3: Percentage Share of Holding of Government Domestic Debt Percent
28.2
47.4
1.4
15.5
5.7
1.8
23.9
47.5
1.4
15.3
5.7
6.2
24.8
46.2
1.3
16.1
6.7
4.9
BOT CommercialBanks
Non Bankfinancial
Institutions
Pension Funds Insurance Others
Dec-12 Sep-13 Dec-13
Note: Other includes state or public enterprises like UTT and Tanzania Mortgage; private sector and BOT Special Funds Source: Ministry of Finance and Bank of Tanzania
New domestic debt issued during the quarter ending December 2013 amounted to TZS 428.8
billion, out of which, TZS 234.7 billion was in Treasury bills and TZS 194.4 billion in
Treasury bonds. Debt worth TZS 727.6 billion was due for payment, out of which principal
15

amounting to TZS 273.6 billion was rolled over, while interest and principal amounting to
TZS 179.5 billion and TZS 264.5 billion respectively were paid out of government resources.
16

4.0 EXTERNAL SECTOR DEVELOPMENTS
Current Account
During the quarter ending December 2013, the current account recorded a deficit of USD
869.2 million, compared to a deficit of USD 958.0 million recorded during the corresponding
quarter in 2012. This outturn was largely driven by a decline in official current transfers
(Table 4.1).
Table 4.1: Current Account Balance Millions of USD
% ChangeDec-12 Sep-13p Dec-13p
Dec-12 to Dec-13Goods Account (Net) -1,128.6 -1,714.7 -1,180.0 4.6
Exports *1,475.8 1,346.8 1,606.8 8.9
Imports 2,604.4 3,061.5 2,786.8 7.0Services Account (Net) 104.4 279.0 239.1 129.1
Receipts 750.3 931.4 925.5 23.4Payments 645.9 652.5 686.4 6.3
Goods and Services (Net) -1,024.2 -1,435.8 -940.8 -8.1Exports of Goods and Services 2,226.1 2,278.2 2,532.4 13.8Imports of Goods and Services 3,250.3 3,714.0 3,473.2 6.9
Income Account (Net) -167.1 -184.1 -162.0 -3.1Receipts 32.7 34.0 30.0 -8.1Payments 199.8 218.1 192.0 -3.9
Current transfers (Net) 233.3 304.1 233.6 0.2Inflows 256.2 325.9 244.5 -4.6
o/w Official transfers 170.9 235.9 154.6 -9.5Outflows 22.9 21.8 10.8 -52.8
Current Account Balance -958.0 -1,315.7 -869.2 -9.3
ItemQuarter Ending
Note: P = Provisional o/w = of whichSource: Bank of Tanzania
Exports
The value of exports of goods increased by 8.9 percent to USD 1,606.8 million in the quarter
ending December 2013, from the value recorded in the corresponding quarter in 2012 mainly
on account of increase in the value of traditional exports (Table 4.2). Meanwhile, mineral
exports declined following a fall in the unit price of gold, and low volume of gold and
diamond exported.
17

Table 4.2: Exports by Type of Commodity Millions of USD
Dec-12 Sep -13p Dec -13p
Sep to Dec-13 Dec-12 to Dec-13Traditional Exports 314.2 188.0 361.9 92.5 15.2Non-Traditional Exports 969.2 983.2 1,035.4 5.3 6.8
Minerals 543.5 414.5 539.4 30.1 -0.7Gold 520.0 389.8 505.1 29.6 -2.9Diamond 11.6 5.5 9.5 73.1 -17.9Other minerals 11.9 19.1 24.8 29.7 109.1
Manufactured Goods 212.0 306.1 298.6 -2.5 40.8Cotton Yarn 1.3 3.1 1.4 -54.7 12.0Manufactured Coffee 0.3 0.3 0.4 66.0 55.7Manufactured Tobacco 6.8 9.2 9.7 5.5 42.2Sisal Products (Yarn & Twine) 1.9 2.3 2.2 -4.9 19.0Other manufactured Goods 201.8 291.2 284.8 -2.2 41.2
Fish and Fish Products 35.9 30.9 31.1 0.7 -13.5Hortcultural products 6.5 6.1 6.6 9.4 2.9Others Exports 134.1 166.4 122.7 -26.3 -8.5Re-exports 37.2 59.2 36.9 -37.6 -0.7
Adjustment for unrecorded exports 192.5 175.7 209.6 19.3 8.9GRAND TOTAL* 1,475.8 1,346.8 1,606.8 19.3 8.9
Quarter Ending % Change
Note: P = ProvisionalSource: Bank of Tanzania and Tanzania Revenue Authority
Imports
During the quarter ending December 2013, the value of goods imported was USD 2,786.8
million, 7.0 percent higher than the value recorded in the corresponding quarter in 2012. The
increase was largely on account of a rise in the value of oil imports, which accounted for 35.6
percent of the total value of goods imports (Table 4.3). The rise in value of oil imports was
mainly on account of increase in the volume imported following higher demand for thermo
power generation.
Table 4.3: Goods Import Millions of USD
Dec-12 Sep -13p Dec -13p
Sep to Dec-13 Dec-12 to Dec-13CAPITAL GOODS 942.6 987.2 938.6 -4.9 -0.4
Transport Equipment 329.6 311.4 356.6 14.5 8.2Building and Construction Equipment 209.0 314.0 240.1 -23.5 14.9Machinery 404.0 361.8 341.9 -5.5 -15.4
INTERMEDIATE GOODS 1,085.2 1,443.6 1,246.7 -13.6 14.9Oil imports 833.1 1,155.9 990.8 -14.3 18.9Fertilizers 63.1 72.2 42.4 -41.3 -32.8Industrial Raw materials 189.1 215.4 213.5 -0.9 12.9
CONSUMER GOODS 576.5 630.8 601.5 -4.6 4.3Food and foodstuff 136.8 120.8 155.3 28.6 13.6All other consumer goods 439.8 509.9 446.2 -12.5 1.5
GRAND TOTAL (F.O.B) 2,604.4 3,061.5 2,786.8 -9.0 7.0
CategoryQuarter Ending % Change
Note: Oil imports refers to refined petroleum and its products, P = Provisional data Source: Bank of Tanzania and Tanzania Revenue Authority
18

Services and Income Account
Services account recorded a surplus of USD 239.1 million, compared with a surplus of USD
104.4 million recorded during the quarter ending December 2012. This performance was
associated with a rise in travel and transportation receipts following an increase in the number
of tourist arrivals and volume of transit goods. Income account recorded a deficit of USD
162.1 million in the quarter ending December 2013, which is 3.1 percent decline from a
deficit recorded in the corresponding quarter in 2012 (Table 4.4).
Table 4.4: Services and Income Account Millions of USD
Dec-12 Sep-13P Dec-13P Sep to Dec-13
Dec-12 to Dec-13
A. Services Account Net 155.2 255.9 165.2 -35.5 6.4Receipt 801.1 937.4 906.7 -3.3 13.2Payment -645.9 -681.5 -741.5 8.8 14.8
B. Income Account Net -93.9 -91.6 -62.1 -32.2 -33.8Receipt 32.7 36.7 35.7 -2.7 9.2Payment -126.6 -128.3 -97.8 -23.8 -22.7
o/w Interest payment -29.4 -18.9 -30.1 59.3 2.4
% ChangeQuarter Ending
Note: P = Provisional dataSource: Commercial banks, Non-bank Financial Institutions and Bank of Tanzania
World Commodity Prices
During the quarter ending December 2013, average world market prices of selected
commodities declined save for those of crude oil (Dubai), coffee (Arabica), tea (average
price) and sisal (Table 4.5). Fall in price of coffee (Robusta) was largely explained by
expectation of an increase in production of coffee in Vietnam and Indonesia. Price of cloves
declined on account of low global demand coupled with high production in Indonesia.
Likewise, price of tea (Mombasa Auction) declined largely due to low demand following
political unrest in Egypt, the major market for Mombasa auction tea. Price of cotton went
down mainly due to low global demand following increasing usage of synthetic fibers by
textile manufacturers. Meanwhile, increase in prices of coffee (Arabica) and tea (Average)
was mainly on account of demand factor.
Prices of crude oil (Average) and white petroleum products declined largely due to
increase in supplies from Brazil coupled with low oil demand from OECD countries, while
19

gold price fall is associated with India’s action to restrict importation of gold in efforts to
control its current account deficit.
Table 4.5: World Commodity Prices
Dec-12 Sep-13 Dec-13Sep to Dec-13
Dec-12 to Dec-13
Robusta Coffee USD/kg 2.19 2.34 1.85 -20.9 -15.7Arabica Coffee USD/kg 3.57 2.68 2.81 4.9 -21.3Tea (Average price) USD/kg 3.38 2.80 2.83 1.1 -16.3Tea (Mombasa Auction) USD/kg 3.00 2.23 2.14 -4.0 -28.7Cotton, "A Index" USD/kg 1.80 2.03 1.92 -5.4 6.7Sisal (UG) USD/tonne 1,553.33 1,400.00 1,400.00 0.0 -9.9Cloves USD/tonne 9,500.00 12,825.00 12,708.33 -0.9 33.8Crude oil* USD/barrel 101.92 107.43 104.50 -2.7 2.5Crude oil** USD/barrel 107.26 106.27 106.70 0.4 -0.5White products*** USD/tonne 969.17 956.61 935.60 -2.2 -3.5
Jet/Kerosine USD/tonne 998.24 969.70 978.21 0.9 -2.0Premium Gasoline USD/tonne 982.66 1,002.84 942.91 -6.0 -4.0Heat Oil USD/tonne 926.62 897.30 885.68 -1.3 -4.4
Gold USD/troy ounce 1,723.66 1,328.60 1,272.52 -4.2 -26.2
Commodity Unit
Quarter Ending(Three Month Average)
% Change
Note: * Average of U.K. Brent, Dubai and West Texas Intl** f. o. b. Dubai*** f.o.b West Mediterranean
Source: http:www//worldbank.org/prospects/commodities, World Bank Public Ledger, Bloomberg
20

5.0 THE ZANZIBAR ECONOMY
Sectoral Performance
Procurement of Major Export Crops
During the quarter ending December 2013, procurement of cloves increased significantly to
2,807.0 tonnes compared to 440.8 tonnes procured in the corresponding quarter in 2012. This
performance is attributed to cyclical nature of the crop and control efforts against cloves
smuggling. Meanwhile, seaweed procurement declined to 2,446.3 tonnes from 3,329.9 tonnes
recorded during the quarter ending December 2012 (Chart 5.1). This outturn was on account
of fall in production following rise in sea temperatures and turbulent conditions on the seabed
due to more extreme weather.
Chart 5.1: Zanzibar Procurement of Major Export Crops
Tonnes
2,59
6.3
1,09
5.3
103.
4
105.
7
440.
8
916.
4
41.3
1,06
3.1
2,80
7.0
3,43
0.2 4,
626.
6
3,16
3.2
3,96
9.1
3,32
9.9
3,22
2.2
1,42
4.5
3,34
2.40
2,44
6.3
Q4-11 Q1-12 Q2-12 Q3-12 Q4-12 Q1-13 Q2-13 Q3-13 Q4-13
Cloves Seaweeds
Notes: Q = Quarter Source: Office of Chief Government Statistician
Manufacturing Activity
During the quarter under review, production of juice/water, noodles and soft drinks increased
when compared with the amount produced in the quarter ending September 2013 mainly on
account of increased demand. Production of wheat flour and bakery products declined due to
low demand, while that of rubber decreased on account of aging trees coupled with poor
management of rubber plantations. Table 5.1 depicts production performance of selected
manufactured commodities.
21

Table 5.1: Zanzibar Production of Selected Manufactured Commodities
Dec-12 Sep-13 Dec-13 Sep to Dec-13 Dec-12 to Dec-13Wheat flour Tonnes 6,512.0 7,705.0 5,735.7 -25.6 -11.9Breads Pieces "000" 29,661.0 32,412.0 30,438.3 -6.1 2.6Soft drinks Litres "000" 890.2 427.7 683.0 59.7 -23.3Mineral Water Litres "000" 2,196.6 2,154.2 2,145.6 -0.4 -2.3Juice/Soda Litres "000" 124.3 91.4 107.6 17.7 -13.5Noodles Tonnes 43.0 45.0 50.3 11.9 17.1Rubber Tonnes 49.3 80.0 54.4 -32.0 10.3
Commodity Unit% ChangeQuarter Ending
Note: P = Provision Source: Office of Chief Government Statistician
Inflation Developments
Average headline inflation during the quarter ending December 2013 accelerated to 5.2
percent, from 3.9 percent recorded in the corresponding quarter in 2012. This outturn was
largely on account of increases in the prices of food and some items under communications
subgroup. Average food inflation rose to 2.0 percent from negative 1.2 percent following rise
in the price of fish, while non-food inflation eased to 9.0 percent from 10.3 percent mainly on
account of decline in prices of some items under restaurants and hotels subgroup (Table 5.2).
Table 5.2: Zanzibar Quarterly Average Inflation Base: August 2012 = 100
Dec-11 Mar-12 Jun-12 Sep-12 Dec-12 Mar-13 Jun-13 Sep-13 Dec-13
Food 49.5 23.8 17.9 7.1 4.4 -1.2 -1.7 2.8 7.6 2.0Non- Food 50.5 13.7 15.6 14.8 12.3 10.3 8.7 6.6 5.0 9.0
Alcoholic Beverages, Tobacco and Narcotics 0.3 12.4 21.3 30.8 36.1 33.3 24.0 11.0 5.4 5.1Clothing and Footwear 9.3 17.9 21.7 24.2 21.2 18.4 15.9 12.6 12.7 10.9Housing, Water, electricity and Other fuels 17.1 13.0 13.7 8.7 5.6 3.6 3.6 5.1 7.3 9.8Furnishing, H/hold Equipments and Routine h/h maintenance 4.6 18.7 25.0 27.5 23.9 18.5 11.0 6.9 4.5 2.6Health 2.8 15.5 11.3 21.0 19.4 20.8 15.1 4.4 2.7 1.4Transport 6.3 16.3 11.2 5.4 1.8 2.3 3.9 4.3 3.1 1.4Communication 2.6 1.1 0.2 0.3 0.3 -0.2 -0.5 -0.6 33.7 51.8Recreation and culture 0.8 10.0 13.1 16.7 12.2 15.4 16.7 13.5 10.8 5.6Education 1.3 5.5 17.9 17.9 18.2 18.9 12.4 15.3 17.4 17.3Restaurants and Hotels 2.1 16.2 15.3 16.5 14.5 7.7 6.5 1.1 -0.3 -0.8Miscellaneous Good and Services 3.2 -4.5 12.3 15.6 14.8 19.5 17.5 14.7 14.1 9.6
Headline/Overall 100.0 19.1 16.7 10.2 7.7 3.9 2.3 4.8 5.9 5.2
Weight (%)Sub-Group Quarter Ending
Note: CPI = Consumer Price IndexSource: Office of Chief Government Statistician
22
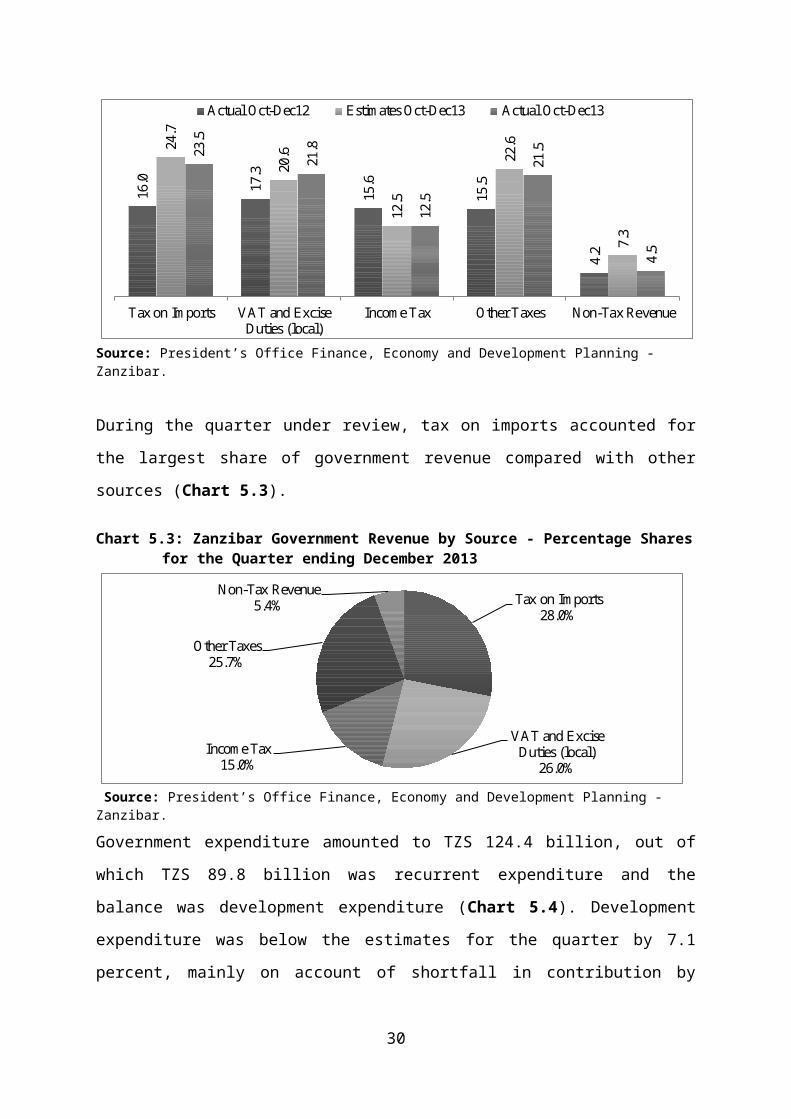
Government Budgetary Operations
In the quarter ending December 2013, Government budgetary operations registered a deficit
of TZS 10.4 billion after grants and adjustment to cash. Total resources amounted to TZS
105.6 billion, out of which TZS 83.8 billion was domestic revenue and the balance was
grants. Tax revenue amounted to TZS 79.3 billion, or 98.6 percent of the target for the period,
while non- tax revenue was below the target by 38.1 percent. Total grants disbursed during
the quarter under review amounted to TZS 21.8 billion, above the estimated amount by 4.7
percent. Chart 5.1 summarizes revenue collection by source.
Chart 5.2: Zanzibar Government Revenue by SourceBillions of TZS
16.0
17.3
15.6
15.5
4.2
24.7
20.6
12.5
22.6
7.3
23.5
21.8
12.5
21.5
4.5
Tax on Imports VAT and ExciseDuties (local)
Income Tax Other Taxes Non-Tax Revenue
Actual Oct-Dec12 Estimates Oct-Dec13 Actual Oct-Dec13
Source: President’s Office Finance, Economy and Development Planning - Zanzibar.
During the quarter under review, tax on imports accounted for the largest share of
government revenue compared with other sources (Chart 5.3).
Chart 5.3: Zanzibar Government Revenue by Source - Percentage Shares for the Quarter ending December 2013
Tax on Imports
28.0%
VAT and Excise Duties (local)
26.0%Income Tax
15.0%
Other Taxes25.7%
Non-Tax Revenue5.4%
Source: President’s Office Finance, Economy and Development Planning - Zanzibar.
23

Government expenditure amounted to TZS 124.4 billion, out of which TZS 89.8 billion was
recurrent expenditure and the balance was development expenditure (Chart 5.4).
Development expenditure was below the estimates for the quarter by 7.1 percent, mainly on
account of shortfall in contribution by Government and disbursements from development
partners’ for development projects
Chart 5.4: Zanzibar Government Expenditure by Component Billions of TZS
33.1 34.4
41.4 40.4
53.3
37.3 41.3
48.4
34.7
Wages and Salaries Other Expenditure Development Expenditure
Actual Oct-Dec12 Estimates Oct-Dec13 Actual Oct-Dec13
Source: President’s Office Finance, Economy and Development Planning - Zanzibar.
Debt Developments
As at the end of December 2013, Zanzibar’s external debt stock amounted to USD 129.7
and accounted for 76.7 percent of the total debt stock. Of the external debt stock 87.9 percent
was guaranteed by the Union Government and the balance was non-guaranteed debt. Debt
due to multilateral creditors was dominant, followed by bilateral creditors (Chart 5.5).
Chart 5.5: Zanzibar External Debt by Creditors as at the end of December 2013
Multilateral63.4%
Bilateral25.2%
Commercial6.0%
Export Credit5.4%
Source: President's Office, Finance, Economy and Development Planning – Zanzibar
24

Table 5.3 shows the profile of total external debt by debt maturity.
Table 5.3: Zanzibar External Debt by Maturity Millions of USD
Dec-12 Sep-13P Dec-13P% of Total
Dec 13 Sep to Dec-13 Dec-12 to Dec-13< 10 Years 48.6 47.4 50.3 38.8 6.2 3.610-20 Years 4.3 4.3 1.5 1.2 -65.3 -65.3>20 Years 77.3 77.9 77.9 60.0 -0.1 0.7Total 130.2 129.6 129.7 100.0 0.1 -0.4
Period% ChangeQuarter Ending
Note: P = ProvisionalSource: President's Office, Finance, Economy and Development Planning – Zanzibar
Transport and telecommunications sectors accounted for the largest share of external debt by
use of funds followed by social welfare and education sectors. Agricultural sector was the
least recipient of external debt (Table 5.4).
Table 5.4: Zanzibar External Debt by Use of Funds as at the end of December 2013Millions of USD
Sector Amount % of Total DisbursementEnergy 2.2 1.7Agriculture 1.3 1.0Industries 1.4 1.1Transport and telecommunication 64.0 49.3Social Welfare and education 49.0 37.8Finance and Insurance 4.6 3.5Others 7.1 5.5Total 129.7 100.0Source: President's Office, Finance, Economy and Development Planning – Zanzibar
The stock of domestic debt decreased to TZS 62.0 billion at the end of December 2013 from
TZS 73.0 billion recorded at the end of the preceding quarter. This development was mainly
on account of re-payment of TZS 10.0 billion short-term overdraft facility issued by Bank of
Tanzania to the Revolutionary Government of Zanzibar. Chart 5.6 shows composition of
domestic debt by creditor category.
25

Chart 5.6: Zanzibar Domestic Debt by Creditor as at the end of December 2013 Zanzibar Port
Company5.7%
Zanzibar Social Security Fund
16.1%
People's Bank of Zanzibar13.2%
Government Suppliers
20.2%Gratuity claims
4.2%
Others40.6%
Source: President's Office, Finance, Economy and Development Planning – Zanzibar
Treasury bonds accounted for the largest share of domestic debt by instrument category,
followed by government loans and suppliers’ claims (Table 5.5).
Table 5.5: Zanzibar Domestic Debt by Instruments Millions of TZS
Dec-12 Sep-13P Dec-13P % of Total Dec-13 Sep to Dec-13 Dec-12 to Dec-13
Government loans 13,287.9 21,470.4 21,470.4 34.7 0.0 61.6Government stocks 654.2 654.2 651.2 1.1 -0.5 -0.5Treasury bills 0.0 9,950.0 0.0 0.0 -100.0Treasury bonds 23,253.1 22,873.3 24,751.3 39.9 8.2 6.4Other Instruments* 13,267.0 18,004.1 15,090.3 24.4 -16.2 13.7Total 50,462.1 72,951.9 61,963.1 100.0 -15.1 22.8
Instrument% ChangeQuarter Ending
Note: * : mainly government suppliers and gratuity claimsP = Provision
Source: President's Office, Finance, Economy and Development Planning - Zanzibar
Classifications of domestic debt by maturity indicate that, debt with “undetermined maturity”
(predominantly gratuity and suppliers’ claims) was the largest, followed by debt maturing
between two to five years (Table 5.6).
Table 5.6: Zanzibar Domestic Debt by Maturity Millions of TZS
Dec-12 Sep-13P Dec-13P % of Total Dec-13
Sep to Dec-13
Dec-12 to Dec-13
Less than I year 6,500.0 16,450.0 8,274.0 13.4 -49.7 27.32-5 Years 16,753.1 14,599.3 24,659.8 39.8 68.9 47.2Undetermined 27,209.0 41,902.6 29,029.3 46.8 -30.7 6.7Total 50,462.1 72,951.9 61,963.1 100.0 -15.1 22.8
Period% ChangeQuarter Ending
Note: P = ProvisionSource: President's Office, Finance, Economy and Development Planning – Zanzibar
26

External Sector Developments
Current Account
During the quarter ending December 2013, Zanzibar current account recorded a deficit of
USD 1.4 million compared with a surplus of USD 3.1 million recorded in the preceding
quarter. This outturn was mainly on account of an increase in the value of goods and services
imported (Table 5.7).
Table 5.7: Zanzibar Current Account Millions of USD
Dec-12 Sep-13P Dec-13P Sep to Dec-13 Dec-12 to Dec-13
Goods Account (net) -47.2 -32.7 -51.7 57.8 9.5Exports 4.4 9.0 31.1 --- ---Imports (fob) 51.6 41.7 82.7 98.2 60.3
Services Account (net) 23.4 24.6 21.9 -10.9 -6.6Receipts 61.5 36.0 34.6 -3.9 -43.8Payments 38.1 11.4 12.7 11.2 -66.6
Goods and Services (net) -23.8 -8.2 -29.8 --- 25.3Exports of goods and services 65.9 45.0 65.7 46.0 -0.4Imports of goods and services 89.7 53.2 95.4 79.5 6.4
Income Account (net) -0.9 -2.6 0.4 --- ---Receipts 0.7 1.2 1.9 58.3 ---Payments 1.6 3.8 1.5 -60.4 -7.0
Current Transfers (net) 14.0 13.8 28.0 --- 100.0 Inflows 14.0 17.9 34.0 89.9 ---Outflows 0.0 4.1 6.0 46.1 100.0
Current Account Balance -10.7 3.1 -1.4 -144.5 -87.3
ItemQuarter Ending % Change
Note: P = Provision ‘---’ = large numberSource: Bank of Tanzania
Exports
Export of goods and services rose to USD 65.7 million from USD 45.0 million recorded
during the quarter ending September 2013, largely due to increase in the volume of cloves
export following enhanced measures taken by the Government to control smuggling (Tables
5.7 and 5.8).
27

Table 5.8: Zanzibar Exports by Type of Commodity
Dec-12 Sep-13P Dec-13P% of Total
Dec-13Sep to Dec-13
Dec-12 to Dec-13
Traditional ExportsCloves
Value Mill. USD 1.4 7.5 23.2 74.6 210.1 ---Volume '000' Tonnes 0.1 0.7 2.1 201.1 ---Unit Price USD/Tonne 10,000.0 10,664.8 10,980.6 3.0 9.8
Sub-Total 1.4 7.5 23.2 74.6 210.1 ---Non-Traditional ExportsSeaweeds
Value Mill. USD 0.7 1.0 5.8 18.7 456.7 674.1Volume '000' Tonnes 2.0 2.8 2.5 -11.0 28.0Unit Price USD/Tonne 383.6 371.0 2,320.2 525.4 504.8
Manufactured goods Mill. USD 1.1 0.2 1.2 3.9 604.8 16.4Fish and fish produce Mill. USD 0.1 0.0 0.0 0.1 372.4 -29.6Others exports Mill. USD 1.2 0.3 0.8 2.6 177.5 -32.6Sub Total Mill. USD 3.1 1.5 7.9 25.4 419.4 157.5Grand Total Mill. USD 4.4 9.0 31.1 100.0 245.4 604.3
Quarter EndingCommodity
% ChangeUnit
Note: P = Provision ‘---’ = large numberSource: Bank of Tanzania, Tanzania Revenue Authority and Zanzibar State Trading Corporation
Imports
During the quarter ending December 2013, imports of goods and services increased to USD
95.4 million from USD 53.2 million recorded in the preceding quarter. Increase in the value
of goods imported is largely explained by rise in value of capital and consumer goods
imported (Table 5.9).
Table 5.9: Zanzibar Goods Import (c.i.f) by Major Categories Millions of USD
Dec-12 Sep-13P Dec-13P % of Total Dec-13
Sep to Dec-13
Dec-12 to Dec-13
Capital Goods 27.0 22.5 45.2 49.8 100.9 67.3Transport Equipments 6.3 8.5 15.4 16.9 81.2 143.6Building and Constructions 3.2 5.0 10.1 11.1 103.3 215.7Machinery 17.5 9.1 19.8 21.8 118.0 12.8
Intermediate Goods 18.9 12.5 14.3 15.7 14.0 -24.6Oil imports 16.5 10.5 11.7 12.9 11.9 -29.2Industrial raw materials 2.4 2.1 2.6 2.8 24.5 6.9
Consumer Goods 10.7 10.8 31.4 34.5 190.2 192.3Food and food stuffs 4.1 3.9 11.2 12.3 184.4 175.4All other consumer goods 6.7 6.9 20.2 22.2 193.4 202.6
Grand Total (c.i.f.) 56.7 45.9 90.9 100.0 98.2 60.3Grand Total (f.o.b.) 51.6 41.7 82.7 91.0 98.2 60.3
% Change Import Category
Quarter Ending
Note: P = Provision
28

Source: Bank of Tanzania and Tanzania Revenue Authority
Services and Income Account
Services account registered a surplus of USD 21.9 million compared with a surplus of USD
24.6 million registered in the quarter ending September 2013, mainly on account of a
decrease in receipts from tourism activities (Table 5.10).
Table 5.10: Zanzibar Service and Income Account Millions of USD
Dec-13 Sep-13P Dec-13P Sep to Dec-13
Dec-13 to Dec-13
A. Services Account Net 23.4 21.4 24.6 14.8 4.8Receipt 61.5 39.0 36.0 -7.8 -41.5Payment 38.1 17.6 11.4 -35.1 -70.0
B. Income Account Net -0.9 0.3 -2.6 --- ---Receipt 0.7 1.0 1.2 20.0 74.2Payment 1.6 0.8 3.8 --- ---
Item% ChangeQuarter Ending
Note: P = Provision ‘---’ = large numberSource: Commercial Banks, Non-Banks Financial Institutions and Bank of Tanzania
29

6.0 ECONOMIC DEVELOPMENTS IN THE EAC AND SADC
During the quarter ending December 2013, headline inflation in East African Community
region declined to an average of 6.8 percent from 7.1 percent recorded in the previous quarter
(Table 6.1). With exception of Tanzania and Burundi, other countries in the region recorded
increase in the rate of inflation largely attributed to rise in the prices of food and non-
alcoholic beverages, transport and energy. The decline in inflation in Tanzania and Burundi
was largely driven by easing of prices of some food items, housing, water, electricity, gas,
fuel and transport.
Headline inflation in the SADC region declined to an average of 6.1 percent during the
quarter under review from 6.7 percent recorded in the quarter ending September 2013 (Table
6.1). With the exception of Lesotho, other countries in the region recorded declines in
inflation on account of easing of food and non-alcoholic beverages, electricity, water and gas
prices as well as costs of transport and housing. The recorded increase in inflation in Lesotho
was largely due to rise in prices of food and non-alcoholic beverages, electricity, gas and
other fuels.
30

Table 6.1: EAC and SADC Real GDP and Inflation Percent
Mar-12 Jun-12 Sep-12 Dec-12 Mar-13 Jun-13 Sep-13 Dec-13Tanzania 6.0 7.0 6.4 6.9 6.4 19.4 18.1 14.7 12.4 10.4 8.4 6.8 6.0Kenya 2.6 5.6 4.4 4.6 4.2 16.8 11.8 6.4 3.5 4.1 4.4 7.0 7.4Uganda 5.8 5.2 6.7 2.8 4.4 24.2 19.0 10.5 5.0 4.1 3.5 6.8 7.2Burundi 3.5 3.9 4.2 4.2 4.2 22.7 21.7 15.9 13.1 7.6 7.5 10.8 9.1Rwanda 6.0 7.5 8.6 8.0 7.7 8.0 7.1 5.7 4.6 4.6 3.7 4.2 4.4Angola 2.4 1.6 3.9 8.4 7.9 11.3 10.5 9.9 9.5 9.0 9.1 9.0 8.0Botswana -3.7 8.6 5.1 4.2 5.8 8.3 7.5 7.0 7.3 7.5 6.4 5.4 4.3Congo DRC 2.8 7.2 6.9 7.1 19.4 11.9 6.9 5.9 n.a n.a n.a n.aLesotho 3.0 2.4 5.7 4.0 3.8 7.3 6.4 5.5 5.6 5.1 4.9 5.0 5.3Madagascar -4.1 0.4 1.8 1.9 6.3 n.a n.a n.a n.a n.a n.a n.aMalawi 7.6 6.6 4.3 1.9 2.0 10.9 16.6 25.1 32.8 36.5 31.6 23.4 22.6Mauritius 3.0 4.0 3.8 3.3 3.3 6.2 5.3 4.6 4.1 3.3 3.6 3.5 3.4Mozambique 6.3 7.0 7.3 7.5 7.4 3.8 2.0 1.4 2.0 3.0 4.9 4.5 4.0Namibia -0.8 4.4 4.8 4.0 4.7 7.0 6.0 6.2 7.0 6.4 6.1 5.8 4.7Seychelles 0.7 6.7 5.0 2.8 3.2 5.7 8.2 8.0 6.5 6.2 4.2 3.5 3.5South Africa -1.7 2.9 3.5 2.5 2.5 6.2 5.8 5.1 5.8 5.7 5.7 6.2 5.4Swaziland 1.2 2.0 0.3 -1.5 -0.3 9.2 9.2 8.6 9.1 6.7 5.6 5.8 4.6Zambia 6.4 7.6 6.8 7.3 7.3 6.3 6.6 6.4 7.0 6.8 6.9 7.1 7.0Zimbabwe 6.0 9.0 10.6 4.4 4.4 4.2 4.0 3.6 3.1 4.2 2.2 1.4 0.5EAC Average 4.8 5.8 6.1 5.3 5.4 18.2 15.5 10.6 7.7 6.2 5.5 7.1 6.8SADC Average 2.3 5.2 5.1 4.3 4.5 8.8 8.4 8.1 8.4 8.5 7.7 6.7 6.1
Inflation Rate
2012P 2013P
Real Growth RateQuarter EndingCountry
2009 2010 2011r
Source: Respective National Statistical Offices Note: P = Provisional, r = Revised n.a = Not Available Q = Quarter
31
7.0 STATISTICAL TABLES AND MANAGEMENT LIST
32

A1: STATISTICAL TABLES
Selected Economic Indicators................................................................................................35
1.0 OUTPUT AND PRICES..................................................................................................361.1 Gross Domestic Product (GDP), by Kind of Economic Activity at Current Prices,
Tanzania Mainland.............................................................................................................361.2 Zanzibar Gross Domestic Product (GDP) at Market Prices by Kind of Economic Activity,
at Current Prices.................................................................................................................371.3 Gross Domestic Product (GDP), by Kind of Economic Activity Percentage Share in Total
GDP at Current Prices, Tanzania Mainland ......................................................................381.4 Zanzibar Gross Domestic Product (GDP) at Market Price by Kind of Economic Activity,
Percentage Share in Total GDP, ........................................................................................391.5 Gross Domestic Product (GDP), by Kind of Economic Activity at Constant 2001 Prices,
Tanzania Mainland.............................................................................................................401.6 Zanzibar Gross Domestic Product (GDP), by Kind of Economic Activity, at 2001
Constant Prices.................... ..............................................................................................411.7 Gross Domestic Product (GDP), by Kind of Economic Activity, Percentage Share in
Total GDP, at 2001 Prices, Tanzania Mainland.................................................................421.8 Zanzibar Gross Domestic Product (GDP) by Kind of Economic Activity, Percentage
Share in Total GDP, at 2001 ConstantPrices.....................................................................431.9 Gross Domestic Product (GDP), by Kind of Economic Activity, Percentage Growth Rates
at Constant 2001 Prices, Tanzania Mainland.....................................................................441.10 Zanzibar Gross Domestic Product (GDP) by Kind of Economic Activity, Annual
Growth Rates, at 2001 Prices.............................................................................................451.11 Production of Major Agricultural Crops, Tanzania Mainland ........................................461.12 Production of Major Export Crops, Zanzibar...................................................................471.13 Agricultural Production Indices, Tanzania Mainland......................................................481.14 Production in Selected Industries, Tanzania Mainland....................................................491.15 Production in Selected Industries in Zanzibar .................................................................501.16 Industrial Production Indices, Tanzania Mainland...........................................................511.17 Mineral Recoveries, Tanzania Mainland .........................................................................521.18 Seasonally Adjusted Consumer Prices Index, Tanzania Mainland .................................531.19a National Consumer Price Index (Urban & Rural) - New CPI........................................541.19b National Consumer Price Index (Old CPI) ....................................................................551.20 Zanzibar Consumer Price Index ..................................................................................... 561.21a National Consumer Price Index (Urban & Rural), Percentage Change on the Previous
Year - New CPI..............................................................................................................571.21b National Consumer Price Index (Old CPI), Percentage Change on the Previous
Year…………………………………………………………………………………....581.22 Zanzibar Consumer Price Index, Percentage Change on the Previous Year....................591.23a Dar Es Salaam Cost of Living Index- Middle Income Group (Old Version).................601.23b Dar Es Salaam Cost of Living Index- Middle Income Group (New Version)…….......611.24a Dar Es Salaam Retail Price Index-Wage Earners (Old Version)...................................621.24b Dar Es Salaam Retail Price Index-Wage Earners (New Version)..................................63
2.0 GOVERNMENT FINANCE...........................................................................................642.1 Analysis of Central Government Finance, Tanzania Mainland.........................................64
33

2.2 Central Government Operations,........................................................................................652.3 Zanzibar Central Government Operations ........................................................................662.4 Treasury Bills Auctions - Actual Sales by Transactor ......................................................672.5 Central Government Outstanding Stocks, Bonds and Notes by Holders...........................68
3.0 MONEY AND BANKING...............................................................................................693.1 Depository Corporation Survey..........................................................................................693.2 Bank of Tanzania - Assets..................................................................................................703.3 Bank of Tanzania - Liabilities............................................................................................713.4 Tanzania Notes in Circulation............................................................................................723.5 Tanzania Coins in Circulation............................................................................................733.6 Commercial Banks - Assets...............................................................................................743.7 Commercial Banks - Liabilities..........................................................................................753.8 Analysis of Banking System Liquidity..............................................................................763.9 Commercial Banks - Analysis of Domestic Assets............................................................773.10 Commercial Banks - Lending and Holding of Securities.................................................783.11 Commercial Banks - Domestic Lending by Activity (Borrowing Sector).......................793.12 Commercial Banks - Deposits..........................................................................................803.13 Weighted Average Interest Rates Structure.....................................................................813.14 Weighted Average Yields Obtained during Treasury Bills Auctions..............................823.15 Discount Rate and Minimum Reserve Ratio....................................................................83
4.0 BALANCE OF PAYMENTS AND FOREIGN TRADE DEVELOPMENTS...........844.1a Tanzania’s Balance of Payments in USD.........................................................................844.1b Quarterly Tanzania’s Balance of Payments in USD........................................................854.2 Tanzania’s Balance of Payments in TZS...........................................................................864.3 Tanzania Exports by type of Commodity in USD.............................................................874.4 Tanzania’s Exports by Type of Commodity in TZS..........................................................884.5 Tanzania’s Imports (c.i.f) by Major Category in USD.......................................................894.6 Tanzania’s Imports (c.i.f) by Major Category in TZS.......................................................904.7 Official and Forex Bureau Exchange Rates, Mean Selling Rates in TZS..........................914.8 Tanzania’s Trade Balance .................................................................................................924.9 Tanzania’s Exports by Major Commodity Groups............................................................934.10 Tanzania’s Imports (c.i.f) by Major Commodity Groups................................................944.11 Tanzania’s Exports by Country of Destination................................................................954.12 Tanzania’s Imports (c.i.f) by Country of Origin..............................................................964.13 Tanzania’s Exports to COMESA Countries.....................................................................974.14 Tanzania’s Direct Imports from COMESA Countries.....................................................984.15 Tanzania’s Services, Income and Transfers.....................................................................994.16 Tanzania’s Foreign Reserve Position.............................................................................100
5.0 NATIONAL DEBT DEVELOPMENTS......................................................................1015.1 National Debt Developments ..........................................................................................101
6.0 INTERNATIONAL ECONOMIC AND FINANCIAL DEVELOPMENTS............1026.1 Economic Performance in G-7 Countries and the Euro Area..........................................1026.2 Word Market prices for selected commodities.................................................................1036.3 Bureau de change Quarterly Transactions........................................................................104
34

Selected Economic Indicators
Item Unit 2007 2008 2009 2010 2011r 2012P
1. National Accounts and Prices 1.1 Change in GDP at Current Prices Percent 16.8 18.3 13.8 14.5 16.2 19.1 1.2 Change in GDP at Constant 2001 Prices Percent 7.1 7.4 6.0 7.0 6.4 6.9 1.3 GDP Per Capita--Current Prices1 TZS 546,955.7 627,269.4 693,185.4 770,727.4 868,818.6 995,939.1 1.4 GDP Per Capita--Current Prices1 USD 441.3 524.1 525.2 538.1 550.1 628.9 1.5 Change in Consumer Price Index (Inflation) Percent 7.0 10.3 12.1 5.5 12.7 16.0 1.6 Saving to GNDI Ratio2 Percent 6.4 12.5 11.9 17.4 n.a n.a
2. Money Credit and Interest Rates*
2.1 Change in Extended Broad Money Supply (M3) Percent 20.5 19.8 17.7 25.4 18.2 12.5 2.2 Change in Broad Money supply (M2) Percent 27.2 24.4 20.8 21.8 15.0 16.0 2.3 Change in Narrow Money Supply (M1) Percent 29.1 21.9 13.7 25.9 23.2 17.3 2.4 Change in Reserve Money Percent 24.9 21.1 32.2 16.2 17.6 10.1 2.5 Total Credit to GDP Ratio1 Percent 13.5 17.0 18.1 21.1 24.2 24.8 2.6 Non-Government Sector Credit to GDP Ratio1 Percent 15.0 18.4 17.7 18.6 20.3 20.1 2.7 Ratio of Credit to Non-Government sector to Total Credit Percent 111.3 107.9 97.5 88.1 83.8 81.2 2.8 12-Months Deposit Rate3 Percent 9.3 8.9 8.9 8.0 7.8 10.2 2.9 Overall Treasury Bill Rate3 Percent 14.8 9.1 8.3 4.8 8.3 13.6 2.10 Long-Term Lending Rate3 Percent 16.1 16.4 15.1 14.6 14.8 16.0
3. Balance of Payments 3.1 Exports of goods (f.o.b) Mill. USD 2,226.6 3,578.8 3,298.1 4,324.3 5,097.9 5,912.3 3.2 Imports of goods (f.o.b) Mill. USD -4,860.6 -7,012.3 -5,834.1 -7,165.5 -9,827.5 -10,324.9 3.3 Trade Balance Mill. USD -2,634.1 -3,433.5 -2,536.1 -2,841.2 -4,729.6 -4,412.6 3.4 Current Account Balance Mill. USD -1,714.7 -2,577.1 -1,809.9 -1,960.1 -3,992.2 -3,658.1 3.5 Overall Balance Mill. USD 404.6 148.0 366.2 369.8 -202.0 327.3 3.7 Gross Official Reserves Mill. USD 2,724.3 2,872.6 3,552.5 3,948.0 3,744.6 4,069.1 3.8 Reserves Months of Imports (of goods and services) Months 5.2 4.0 5.6 5.2 3.7 3.8 3.9 Exchange Rate: 3.9.1 Annual Average TZS/USD 1,239.5 1,196.8 1,319.9 1,432.3 1,579.5 1,583.7 3.9.2 End of Period TZS/USD 1,132.1 1,280.3 1,313.3 1,453.5 1,566.7 1,571.6
4. Population (TZ Mainland) Million 38.3 39.3 40.7 41.9 43.2 44.9
5. Public Finance 2007/08 2008/09 2009/10 2010/11 2011/12 2012/13
5.1 Current Revenue to GDP Ratio1 Percent 15.9 16.2 15.4 16.3 17.6 17.7 5.2 Grants to GDP Ratio1 Percent 6.9 4.7 4.6 4.7 4.5 3.1 5.2 Current Expenditure to GDP Ratio1 Percent 14.9 17.7 18.3 19.1 17.0 18.8 5.3 Development Expenditure to GDP Ratio1 Percent 7.9 8.0 8.6 7.6 9.2 7.9 5.4 Budget Balance to GDP Ratio (excluding grants)1
Percent -8.6 -9.3 -11.0 -11.7 -9.6 -9.3
5.5 Budget Balance to GDP Ratio (including grants)1 Percent -1.7 -4.5 -6.4 -6.9 -5.0 -6.2
6. Total External Debt Stock Mill. USD 5,846.4 6,999.4 8,197.8 9,637.5 10,354.6 12,089.2
6.1 Disbursed Debt Mill. USD 4,483.1 5,483.0 6,558.3 7,843.7 8,873.0 10,693.46.2 Interest Mill. USD 1,363.3 1,516.3 1,639.5 1,793.8 1,481.6 1,395.86.3 Total External Debt as % of GDP Percent 31.1 33.3 37.3 43.6 39.5 39.2
Notes: 1 Calculated on the basis of GDP at Market Prices--Curent Prices2 GNDI stands for Gross National Disposable Income3 Annual Averager = Revised* 2006 Data have been revised after adoption of Standard Reporting Format (SRF)n.a = Not available
Source: Bank of Tanzania Database and National Bureau of Statistics (Economic Survey, National Accounts)
35

1.0 Output and Prices
Table 1.1: Gross Domestic Product (GDP) by Kind of Economic Activity at Current Prices, Tanzania Mainland Millions of TZS
Economic Activity 2001 2002 2003 2004 2005 2006 2007r 2008r 2009r 2010r 2011r 2012P
MonetaryGross domestic product at market prices 7,638,099 8,795,422 10,214,161 11,680,834 13,431,438 15,152,834 17,761,462 20,836,777 24,045,416 27,614,465 32,191,091 38,649,022Agriculture, Hunting and Forestry 1,610,975 1,824,450 2,104,035 2,404,037 2,589,263 2,737,686 3,154,263 3,696,524 4,229,723 4,780,639 5,480,078 6,751,476
Crops 1,151,820 1,324,078 1,523,553 1,743,041 1,831,665 1,901,931 2,250,434 2,638,184 2,911,387 3,231,640 3,673,765 4,552,098Livestock 307,313 336,310 399,611 447,491 529,630 580,430 631,254 744,879 931,703 1,061,841 1,224,837 1,486,128Forestry and hunting 151,842 164,062 180,871 213,505 227,968 255,325 272,575 313,461 386,634 487,158 581,476 713,250
Fishing 149,760 168,598 182,929 201,771 219,930 235,045 269,831 288,719 342,334 447,471 527,534 625,216Industry and construction 1,550,360 1,957,554 2,437,259 2,776,974 3,149,293 3,515,928 4,173,741 4,897,633 5,638,892 6,557,277 7,749,303 9,387,985
Mining and quarrying 159,979 220,000 288,200 357,368 457,431 576,363 742,932 839,513 941,094 1,072,847 1,255,231 1,543,935Manufacturing 762,400 866,228 1,002,827 1,129,558 1,269,145 1,395,282 1,625,504 1,935,975 2,226,370 2,627,117 3,152,540 3,751,523Electricity, gas 196,860 209,640 227,081 244,977 271,925 276,915 335,898 421,216 479,768 571,130 684,847 835,513Water supply 29,840 32,421 37,597 42,697 47,696 54,872 57,816 63,482 70,934 77,348 85,601 99,892Construction 401,281 629,265 881,554 1,002,374 1,103,096 1,212,496 1,411,592 1,637,447 1,920,726 2,208,835 2,571,084 3,157,123
Services 3,795,004 4,230,646 4,763,613 5,419,639 6,247,148 7,170,793 8,413,349 9,884,310 11,460,586 13,191,325 15,394,523 18,354,023Trade and repairs 1,182,797 1,298,349 1,454,527 1,593,717 1,752,826 2,044,421 2,416,506 2,875,642 3,276,989 3,909,550 4,597,631 5,494,169Hotels and restaurants 250,978 269,120 286,883 319,365 394,417 459,584 559,722 649,278 705,919 754,037 856,439 1,010,598Transport 487,062 526,710 577,977 637,720 706,291 769,830 886,844 1,037,608 1,286,634 1,646,704 1,996,102 2,365,380Communications 112,783 130,496 161,623 206,877 277,216 374,241 487,132 611,350 684,002 691,627 811,265 1,022,193Financial intermediation 140,000 179,715 204,766 229,370 265,261 299,734 345,000 403,727 477,492 567,822 666,216 799,459Real estate and business services 591,482 621,333 723,952 819,300 980,660 1,120,466 1,318,834 1,416,251 1,728,515 1,851,995 2,101,850 2,551,106Public administration 640,649 754,654 866,917 1,076,215 1,278,881 1,440,913 1,652,556 2,026,815 2,282,763 2,579,522 2,985,562 3,493,107Education 188,733 211,372 223,409 236,813 251,022 268,594 289,617 333,060 392,507 455,308 519,820 610,788Health 118,972 151,993 174,789 200,933 233,032 275,726 327,658 383,360 454,990 532,339 627,520 737,964Other social & personal services 81,548 86,904 88,770 99,329 107,542 117,284 129,482 147,221 170,776 202,422 232,119 269,257
Gross value added before adjustments 7,106,099 8,181,248 9,487,836 10,802,421 12,205,634 13,659,452 16,011,184 18,767,186 21,671,535 24,976,712 29,151,438 35,118,701less FISIM -80,000 -90,400 -105,382 -120,588 -141,723 -169,661 -208,281 -260,029 -328,478 -358,049 -432,285 -497,128
Gross value added at current basic prices 7,026,099 8,090,848 9,382,454 10,681,833 12,063,911 13,489,791 15,802,903 18,507,157 21,343,057 24,618,663 28,719,152 34,621,573Add Taxes on products 612,000 704,574 831,707 999,001 1,367,527 1,663,043 1,958,559 2,329,620 2,702,359 2,995,802 3,471,939 4,027,449
Non-monetaryGross domestic product at market prices 1,462,175 1,649,085 1,892,899 2,290,757 2,533,855 2,788,434 3,217,238 3,814,911 4,167,230 4,679,015 5,341,871 6,068,641Agriculture, Hunting and Forestry 1,025,218 1,163,933 1,375,611 1,712,407 1,821,215 1,970,870 2,258,995 2,677,952 2,923,874 3,273,476 3,736,722 4,281,969
Crops 794,125 912,131 1,118,034 1,379,855 1,440,478 1,550,759 1,732,893 2,062,143 2,275,693 2,526,019 2,871,607 3,302,348Livestock 152,135 166,490 163,524 221,530 262,193 287,342 359,742 424,496 412,208 450,132 510,224 578,594Forestry & hunting 78,958 85,312 94,053 111,022 118,544 132,769 166,360 191,313 235,973 297,326 354,890 401,026
Fishing 3,900 4,391 4,764 5,254 5,727 6,409 7,358 7,873 10,610 12,202 14,385 16,687Industry and construction 88,099 94,005 101,224 122,289 167,464 208,050 257,315 296,801 346,489 396,477 459,416 505,919
Water supply 14,000 16,245 16,327 18,777 20,909 20,937 27,166 29,828 33,330 36,344 40,221 44,804Construction 74,099 77,760 84,897 103,512 146,555 187,113 230,149 266,973 313,159 360,133 419,195 461,114
Services 344,958 386,756 411,300 450,807 539,449 603,105 693,571 832,285 886,257 996,860 1,131,347 1,264,067Real estate & business services 344,958 386,756 411,300 450,807 539,449 603,105 693,571 832,285 886,257 996,860 1,131,347 1,264,067
Total GDP at market prices 9,100,274 10,444,507 12,107,060 13,971,591 15,965,293 17,941,268 20,978,701 24,651,687 28,212,646 32,293,479 37,532,962 44,717,663Population 32.9 33.6 34.2 35.3 36.20 37.5 38.3 39.5 40.7 41.9 43.2 44.9D:Per Capita nominal GDP (TZS) 276,741 310,991 353,495 396,154 441,063 478,100 547,081 627,787 693,470 770,464 868,819 995,939Note: P = Provisional, r = Revised The National Bureau of Statistics revised the Set of National Account Estimates from September 2007 by rebasing them to 2001 constant pricesSource: National Bureau of Statistics, Per Capita GDP-BoT computation
36

1.0 Output and Prices
Millions of TZS
Economic Activity 2001 2002 2003 2004 2005 2006 2007 2008 2009 2010 2011r 2012P
Agriculture, forestry & fishing 56,487.8 63,636.9 61,312.1 80,434.8 92,529.2 150,500.0 161,000.0 229,600.0 271,000.0 306,800.0 386,100.0 408,400.0
Crops 35,943.3 40,085.5 35,552.4 47,281.7 51,700.0 104,200.0 100,300.0 159,600.0 182,900.0 201,100.0 251,000.0 256,300.0Livestock 9,420.7 10,644.8 12,221.6 14,786.1 16,280.8 20,900.0 25,800.0 34,400.0 39,300.0 44,100.0 49,900.0 51,500.0Forestry & hunting 1,059.6 1,083.3 1,097.2 1,181.6 1,268.9 1,800.0 2,200.0 2,600.0 2,800.0 3,300.0 4,400.0 4,500.0Fishing 10,064.3 11,823.3 12,440.9 17,185.5 23,279.5 23,500.0 32,700.0 33,000.0 46,000.0 58,300.0 80,800.0 96,100.0Industry 24,600.7 29,783.3 37,640.6 45,902.5 53,580.5 75,400.0 88,400.0 106,400.0 114,900.0 119,300.0 143,700.0 157,900.0
Mining & quarrying 1,130.1 1,507.9 2,236.2 2,512.0 3,190.3 3,800.0 4,700.0 7,000.0 8,500.0 9,500.0 12,300.0 14,300.0Manufacturing 11,274.1 13,708.0 16,845.6 17,229.7 19,399.2 23,400.0 26,600.0 32,000.0 36,100.0 39,500.0 46,400.0 46,500.0Electricity, gas & water supply 3,659.6 4,248.9 4,726.9 5,638.6 6,435.8 9,900.0 11,100.0 12,800.0 12,300.0 13,100.0 17,800.0 20,400.0Construction 8,536.9 10,318.5 13,831.9 20,522.1 24,555.3 38,300.0 46,000.0 54,600.0 58,000.0 57,200.0 67,200.0 76,700.0Services 106,634.3 126,138.4 148,605.3 173,687.4 199,197.0 222,100.0 258,600.0 319,300.0 387,700.0 405,300.0 526,700.0 614,000.0Trade & repairs 23,722.1 25,408.1 27,811.8 30,628.2 38,600.0 45,300.0 55,400.0 65,000.0 73,500.0 83,400.0 116,100.0 127,200.0Hotels & restaurants 13,316.8 16,082.6 16,128.6 19,869.9 30,580.9 38,900.0 46,000.0 55,200.0 63,100.0 68,900.0 87,400.0 87,500.0Transport & communication 13,868.3 15,725.3 23,522.0 27,005.1 31,500.0 34,500.0 40,500.0 59,600.0 98,000.0 85,800.0 110,700.0 130,600.0Financial intermediation 2,938.9 3,770.8 4,581.4 5,569.1 7,800.0 8,000.0 10,800.0 13,700.0 15,400.0 19,800.0 23,500.0 26,300.0Real estate & business services 2,266.4 2,501.2 2,862.9 3,240.1 3,728.9 4,500.0 5,400.0 6,800.0 7,700.0 8,600.0 10,300.0 11,100.0Public administration 34,046.4 43,315.4 50,578.9 60,138.0 56,729.3 53,700.0 59,200.0 72,300.0 80,000.0 86,000.0 105,100.0 132,200.0Education 12,655.0 14,852.2 17,355.7 20,556.0 22,660.3 27,700.0 30,500.0 33,600.0 35,600.0 37,300.0 55,100.0 74,700.0Health 2,953.7 3,513.6 4,622.2 5,356.6 6,090.6 7,500.0 8,700.0 10,600.0 11,600.0 12,400.0 14,600.0 19,300.0Other social & personal services 866.8 969.3 1,141.7 1,324.4 1,506.9 1,800.0 2,100.0 2,500.0 2,800.0 3,100.0 3,900.0 5,100.0Adjustment to market prices 831,400.0 1,056,500.0 1,180,300.0 Taxes on products 34,675.5 36,393.3 39,073.0 44,300.9 49,569.0 62,000.0 78,700.0 92,300.0 105,900.0 115,300.0 141,500.0 173,900.0GDP at Current Market Prices 222,398.3 255,951.9 286,631.0 344,325.6 394,875.7 510,000.0 586,700.0 747,600.0 879,500.0 946,700.0 1,198,000.0 1,354,200.0
Population "000" 944.0 982.0 1,011.0 1,041.0 1,072.0 1,104.0 1,137.0 1,171.0 1,206.0 1,211.0 1,247.0 1,303.0 GDP per capita: TZS "000" 235.6 260.6 283.5 330.8 369.1 462.0 516.0 638.4 726.0 782.0 960.0 1,003.0 Exchange rate: TZS/USD 889.0 946.0 1,040.0 1,091.0 1,127.9 1,255.0 1,247.8 1,197.0 1,307.0 1,396.0 1,557.0 1,572.0Notes: P = Provisional
r = RevisedSource: Office of Chief Government Statistician-Zanzibar
Table 1.2: Zanzibar Gross Domestic Product (GDP) at Market Prices by kind of Economic Activity, at Current Prices
37

1.0 Output and Prices
Table 1.3: Gross Domestic Product (GDP) by Kind of Economic Activity, Percentage Share in Total GDP at Current Prices, Tanzania MainlandPercent
Economic Activity 2001 2002 2003 2004 2005 2006 2007r 2008r 2009r 2010r 2011r 2012p
A:Monetary Gross domestic product at market prices 83.9 84.2 84.4 83.6 84.1 84.5 84.7 84.5 85.2 85.5 85.8 86.4Agriculture, Hunting and Forestry 17.7 17.5 17.4 17.2 16.2 15.3 15.0 15.0 15.0 14.8 14.6 15.1
Crops 12.7 12.7 12.6 12.5 11.5 10.6 10.7 10.7 10.3 10.0 9.8 10.2Livestock 3.4 3.2 3.3 3.2 3.3 3.2 3.0 3.0 3.3 3.3 3.3 3.3Forestry and hunting 1.7 1.6 1.5 1.5 1.4 1.4 1.3 1.3 1.4 1.5 1.5 1.6
Fishing 1.6 1.6 1.5 1.4 1.4 1.3 1.3 1.2 1.2 1.4 1.4 1.4Industry and construction 17.0 18.7 20.1 19.9 19.7 19.6 19.9 19.9 20.0 20.3 20.6 21.0
Mining and quarrying 1.8 2.1 2.4 2.6 2.9 3.2 3.5 3.4 3.3 3.3 3.3 3.5Manufacturing 8.4 8.3 8.3 8.1 7.9 7.8 7.7 7.9 7.9 8.1 8.4 8.4Electricity, gas 2.2 2.0 1.9 1.8 1.7 1.5 1.6 1.7 1.7 1.8 1.8 1.9Water supply 0.3 0.3 0.3 0.3 0.3 0.3 0.3 0.3 0.3 0.2 0.2 0.2Construction 4.4 6.0 7.3 7.2 6.9 6.8 6.7 6.6 6.8 6.8 6.9 7.1
Services 41.7 40.5 39.3 38.8 39.1 40.0 40.1 40.1 40.6 40.8 41.0 41.0Trade and repairs 13.0 12.4 12.0 11.4 11.0 11.4 11.5 11.7 11.6 12.1 12.2 12.3Hotels and restaurants 2.8 2.6 2.4 2.3 2.5 2.6 2.7 2.6 2.5 2.3 2.3 2.3Transport 5.4 5.0 4.8 4.6 4.4 4.3 4.2 4.2 4.6 5.1 5.3 5.3Communications 1.2 1.2 1.3 1.5 1.7 2.1 2.3 2.5 2.4 2.1 2.2 2.3Financial intermediation 1.5 1.7 1.7 1.6 1.7 1.7 1.6 1.6 1.7 1.8 1.8 1.8Real estate and business services 6.5 5.9 6.0 5.9 6.1 6.2 6.3 5.7 6.1 5.7 5.6 5.7Public administration 7.0 7.2 7.2 7.7 8.0 8.0 7.9 8.2 8.1 8.0 8.0 7.8Education 2.1 2.0 1.8 1.7 1.6 1.5 1.4 1.4 1.4 1.4 1.4 1.4Health 1.3 1.5 1.4 1.4 1.5 1.5 1.6 1.6 1.6 1.6 1.7 1.7Other social & personal services 0.9 0.8 0.7 0.7 0.7 0.7 0.6 0.6 0.6 0.6 0.6 0.6
Gross value added before adjustments 78.1 78.3 78.4 77.3 76.5 76.1 76.3 76.1 76.8 77.3 77.7 78.5less FISIM -0.9 -0.9 -0.9 -0.9 -0.9 -0.9 -1.0 -1.1 -1.2 -1.1 -1.2 -1.1
Gross value added at current basic prices 77.2 77.5 77.5 76.5 75.6 75.2 75.3 75.1 75.7 76.2 76.5 77.4Add Taxes on products 6.7 6.7 6.9 7.2 8.6 9.3 9.3 9.5 9.6 9.3 9.3 9.0
B:Non-MonetaryGross domestic product at market prices 16.1 15.8 15.6 16.4 15.9 15.5 15.3 15.5 14.8 14.5 14.2 13.6Agriculture, Hunting and Forestry 11.3 11.1 11.4 12.3 11.4 11.0 10.8 10.9 10.4 10.1 10.0 9.6
Crops 8.7 8.7 9.2 9.9 9.0 8.6 8.3 8.4 8.1 7.8 7.7 7.4Livestock 1.7 1.6 1.4 1.6 1.6 1.6 1.7 1.7 1.5 1.4 1.4 1.3Forestry & hunting 0.9 0.8 0.8 0.8 0.7 0.7 0.8 0.8 0.8 0.9 0.9 0.9
Fishing 0.0 0.0 0.0 0.0 0.0 0.0 0.0 0.0 0.0 0.0 0.0 0.0Industry and construction 1.0 0.9 0.8 0.9 1.0 1.2 1.2 1.2 1.2 1.2 1.2 1.1
Water supply 0.2 0.2 0.1 0.1 0.1 0.1 0.1 0.1 0.1 0.1 0.1 0.1Construction 0.8 0.7 0.7 0.7 0.9 1.0 1.1 1.1 1.1 1.1 1.1 1.0Services 3.8 3.7 3.4 3.2 3.4 3.4 3.3 3.4 3.1 3.1 3.0 2.8Real estate & business services 3.8 3.7 3.4 3.2 3.4 3.4 3.3 3.4 3.1 3.1 3.0 2.8
C:Total Gross Domestic Product at market prices 100.0 100.0 100.0 100.0 100.0 100.0 100.0 100.0 100.0 100.0 100.0 100.0Notes: P = ProvisionalSource: National Bureau of Statistics
38

1.0 Output and Prices
Table 1.5: Gross Domestic Product (GDP) by Kind of Economic Activity at Constant 2001 Prices, Tanzania MainlandMillions of TZS
Economic Activity 2001 2002 2003 2004 2005 2006 2007 2008 2009 2010 2011 2012p
A: MonetaryGDP at market prices 7,638,006 8,223,867 8,833,128 9,525,201 10,300,744 11,021,170 11,852,682 12,767,259 13,536,636 14,566,980 15,501,904 16,618,786Agriculture and Fishing 1,760,735 1,858,279 1,913,425 1,993,064 2,114,515 2,187,610 2,277,890 2,379,345 2,430,546 2,559,774 2,604,826 2,711,597
Crops 1,151,820 1,225,544 1,259,304 1,312,030 1,399,662 1,446,975 1,510,406 1,587,437 1,617,938 1,723,526 1,748,958 1,831,159Livestock 307,313 316,043 323,067 334,237 351,232 359,519 371,398 379,387 388,264 400,373 409,779 422,482Forestry and hunting 151,842 156,806 161,575 165,963 171,937 179,847 185,827 191,750 198,686 206,832 214,071 219,209Fishing 149,760 159,886 169,479 180,834 191,684 201,269 210,259 220,772 225,658 229,043 232,018 238,746
Industry and construction 1,550,268 1,699,749 1,893,028 2,106,686 2,326,418 2,522,828 2,760,870 2,996,217 3,208,502 3,470,768 3,706,858 3,995,057Mining and quarrying 159,979 187,000 219,000 254,000 295,000 341,000 377,559 386,998 391,642 402,331 411,182 443,154Manufacturing 762,400 819,200 893,000 977,000 1,071,000 1,162,000 1,263,435 1,388,515 1,499,596 1,618,064 1,744,273 1,887,303Electricity, gas 196,860 209,000 223,953 240,708 263,218 258,347 286,507 301,978 327,344 360,733 366,144 388,113Water supply 29,748 30,569 32,062 33,903 35,417 37,950 40,841 43,536 45,418 48,969 50,927 53,677Construction 401,281 453,980 525,013 601,075 661,783 723,531 792,529 875,190 944,502 1,040,671 1,134,332 1,222,810
Services 3,795,004 4,096,913 4,422,457 4,775,960 5,166,826 5,580,151 6,044,462 6,567,737 7,030,934 7,616,302 8,220,068 8,883,672Trade and repairs 1,182,797 1,281,544 1,405,698 1,486,931 1,585,906 1,736,631 1,906,821 2,097,503 2,254,816 2,439,711 2,637,328 2,840,402Hotels and restaurants 250,978 267,162 275,836 285,732 301,873 314,921 328,859 343,658 358,779 380,664 398,175 417,287Transport 487,062 516,000 541,901 588,574 627,951 661,000 703,965 752,539 797,691 853,529 910,715 975,376Communications 112,783 124,549 144,039 169,158 200,900 239,537 287,684 346,659 422,577 515,967 614,001 740,485Financial intermediation 140,000 154,108 170,643 184,775 204,694 228,000 251,280 281,120 306,339 337,356 373,453 422,748Real estate and business services 591,482 639,474 684,602 734,880 796,832 860,219 925,021 990,697 1,046,921 1,125,486 1,194,828 1,274,882Public administration 640,649 699,561 766,760 871,169 970,786 1,033,488 1,102,951 1,180,158 1,232,313 1,312,414 1,401,658 1,482,954Education 188,733 202,000 207,606 215,910 224,547 235,774 248,742 265,905 284,704 305,402 328,002 349,322Health 118,972 129,229 140,437 151,370 163,572 177,520 193,142 210,525 224,654 240,058 253,021 267,190Other social and personal services 81,548 83,286 84,935 87,461 89,765 93,061 95,998 98,974 102,141 105,716 108,887 113,025
Gross value added excluding adjustments 7,106,007 7,654,941 8,228,910 8,875,710 9,607,759 10,290,589 11,083,223 11,943,299 12,669,982 13,646,844 14,531,752 15,590,325less FISIM -80,000 -87,000 -97,154 -106,931 -119,497 -137,287 -158,292 -175,704 -190,990 -208,370 -231,708 -261,135
Gross value added at basic prices 7,026,007 7,567,941 8,131,756 8,768,779 9,488,262 10,153,302 10,924,931 11,767,595 12,478,992 13,438,474 14,300,044 15,329,190Taxes on products 612,000 655,926 701,372 756,422 812,482 867,868 927,751 999,664 1,057,645 1,128,507 1,201,860 1,289,596
B: Non-monetaryGDP at market prices 1,462,268 1,528,311 1,590,607 1,714,533 1,767,345 1,859,993 1,949,239 2,061,086 2,184,664 2,261,583 2,411,899 2,536,979Agriculture, forestry, hunting & fishing 1,029,118 1,072,250 1,111,424 1,210,467 1,230,544 1,287,138 1,337,492 1,401,663 1,471,737 1,500,780 1,594,807 1,663,724
Crops 794,125 830,090 863,057 950,694 962,268 1,010,398 1,057,549 1,111,484 1,172,746 1,189,948 1,266,487 1,326,012Livestock 152,135 156,457 159,934 168,763 173,877 177,979 179,000 185,322 189,658 197,199 211,098 217,642Forestry and hunting 78,958 81,539 84,019 86,301 89,407 93,520 95,468 99,109 102,353 106,550 110,279 112,926Fishing 3,900 4,164 4,414 4,709 4,992 5,241 5,475 5,749 6,979 7,084 6,942 7,143
Industry and construction 88,192 92,275 95,053 97,933 106,843 117,074 128,648 142,024 149,201 162,896 176,508 189,751Water supply 14,093 14,515 15,066 15,654 16,283 16,955 17,633 18,797 20,405 20,987 21,826 23,005Construction 74,099 77,760 79,987 82,279 90,560 100,119 111,015 123,227 128,796 141,910 154,682 166,747
Services 344,958 363,786 384,130 406,133 429,958 455,781 483,099 517,399 563,726 597,907 640,585 683,504Real estate and business services 344,958 363,786 384,130 406,133 429,958 455,781 483,099 517,399 563,726 597,907 640,585 683,504
C: Total GDP at market prices 9,100,274 9,752,178 10,423,735 11,239,734 12,068,089 12,881,163 13,801,921 14,828,345 15,721,301 16,828,563 17,913,803 19,155,765Population 32.9 33.6 34.2 35.3 36.20 37.5 38.3 39.3 40.7 41.9 43.2 44.9D:Per Capita real GDP (TZS) 276,604 290,243 304,788 318,677 333,465 343,223 360,363 377,312 386,273 401,636 414,671 426,632Notes: P = Provisional, r = Revised The National Bureau of Statistics revised the Set of National Account Estimates from September 2007 by rebasing them to 2001 constant pricesSource: National Bureau of Statistics, Per Capita GDP-BoT computation
39

1.0 Output and Prices
Table 1.6 : Zanzibar Gross Domestic Product (GDP) at factor cost by kind of Economic Activity, at 2001 Constant PricesMillions of TZS
Economic Activity 2001 2002 2003 2004 2005 2006 2007 2008 2009r 2010 2011r 2012p
Agriculture, forestry & fishing 56,487.8 55,614.1 57,959.7 59,579.1 61,279.6 72,700.0 72,400.0 76,500.0 79,900.0 82,400.0 84,700.0 85,700.0
Crops 35,943.3 34,823.1 36,557.2 37,288.8 37,900.9 49,000.0 48,000.0 51,100.0 53,700.0 55,600.0 55,900.0 56,200.0
Livestock 9,420.7 9,743.9 10,086.5 10,441.7 10,810.1 11,200.0 11,600.0 12,000.0 12,400.0 12,800.0 13,200.0 13,600.0
Forestry & hunting 1,059.6 1,083.3 1,097.2 1,138.2 1,178.9 1,200.0 1,300.0 1,300.0 1,400.0 1,400.0 1,500.0 1,500.0
Fishing 10,064.3 9,963.8 10,218.8 10,710.3 11,389.7 11,300.0 11,500.0 12,100.0 12,400.0 12,600.0 14,100.0 14,400.0
Industry 24,600.7 28,056.1 32,633.6 36,726.0 39,146.8 46,000.0 48,100.0 49,200.0 50,800.0 51,800.0 54,700.0 59,700.0
Mining & quarrying 1,130.1 1,431.5 1,946.4 2,027.9 2,341.7 2,400.0 2,600.0 3,200.0 3,600.0 3,800.0 4,300.0 5,000.0
Manufacturing 11,274.1 13,013.4 14,662.7 13,908.8 14,239.4 14,700.0 14,800.0 15,000.0 15,300.0 15,800.0 16,200.0 16,200.0
Electricity, gas & water supply 3,659.6 3,815.4 3,985.0 4,222.8 4,541.6 4,800.0 5,100.0 5,200.0 5,300.0 5,300.0 6,100.0 6,400.0
Construction 8,536.9 9,795.7 12,039.5 16,566.6 18,024.1 24,100.0 25,600.0 25,800.0 26,600.0 26,900.0 28,100.0 32,100.0
Services 106,634.3 120,095.4 125,213.2 133,587.6 140,646.4 136,700.0 150,880.0 160,600.0 174,700.0 190,700.0 207,000.0 225,400.0
Trade & repairs 23,722.1 24,129.7 24,217.4 24,748.0 28,400.0 28,600.0 30,900.0 30,100.0 31,300.0 33,500.0 40,700.0 44,600.0
Hotels & restaurants 13,316.8 15,267.7 14,038.6 15,648.8 21,899.4 23,900.0 25,000.0 24,900.0 26,100.0 26,900.0 29,600.0 29,700.0
Transport & communication 13,868.3 16,348.9 19,755.5 21,122.7 23,200.0 23,300.0 32,000.0 39,800.0 48,700.0 58,100.0 63,600.0 76,200.0
Financial intermediation 2,938.9 3,543.0 3,852.7 4,587.4 5,214.1 4,700.0 5,700.0 5,900.0 6,000.0 7,500.0 7,800.0 8,600.0
Real estate & business services 2,266.4 2,371.2 2,481.5 2,597.7 2,720.1 2,800.0 3,000.0 3,100.0 3,300.0 3,400.0 3,600.0 3,800.0
Public administration 34,046.4 40,400.8 41,773.1 44,657.4 38,616.1 31,600.0 32,000.0 33,200.0 34,600.0 35,500.0 35,600.0 35,700.0
Education 12,655.0 13,852.9 14,334.1 15,264.5 15,425.1 16,300.0 16,500.0 17,500.0 18,500.0 19,400.0 19,900.0 20,200.0
Health 2,953.7 3,277.2 3,817.5 3,977.7 4,145.9 4,390.0 4,680.0 4,900.0 5,000.0 5,100.0 4,900.0 5,200.0
Other social & personal services 866.8 904.0 942.9 983.5 1,025.7 1,100.0 1,100.0 1,200.0 1,200.0 1,300.0 1,300.0 1,400.0
Adjustment to market prices
Taxes on products 34,675.5 37,638.8 39,863.0 42,427.6 44,500.0 47,200.0 50,100.0 52,900.0 56,400.0 60,000.0 64,100.0 68,500.0
Total GDP at market Prices 187,722.8 241,400.0 255,700.0 272,400.0 285,600.0 302,600.0 321,480.0 339,200.0 361,800.0 384,900.0 410,500.0 439,300.0Notes: P = Provisional
r = RevisedSource: Office of Chief Government Statistician - Zanzibar
40

1.0 Output and Prices
Table 1.7: Gross Domestic Product (GDP) by Kind of Economic Activity, Percentage Share in Total GDP at 2001 Prices, Tanzania MainlandPercent
Economic Activity 2001 2002 2003 2004 2005 2006 2007 2008 2009 2010 2011 2012p
A: MonetaryGDP at market prices 83.9 84.3 84.7 84.7 85.4 85.6 85.9 86.1 86.1 86.6 86.5 86.8Agriculture and Fishing 19.3 19.1 18.4 17.7 17.5 17.0 16.5 16.0 15.5 15.2 14.5 14.2
Crops 12.7 12.6 12.1 11.7 11.6 11.2 10.9 10.7 10.3 10.2 9.8 9.6Livestock 3.4 3.2 3.1 3.0 2.9 2.8 2.7 2.6 2.5 2.4 2.3 2.2Forestry and hunting 1.7 1.6 1.6 1.5 1.4 1.4 1.3 1.3 1.3 1.2 1.2 1.1
Fishing 1.6 1.6 1.6 1.6 1.6 1.6 1.5 1.5 1.4 1.4 1.3 1.2Industry and construction 17.0 17.4 18.2 18.7 19.3 19.6 20.0 20.2 20.4 20.6 20.7 20.9
Mining and quarrying 1.8 1.9 2.1 2.3 2.4 2.6 2.7 2.6 2.5 2.4 2.4 2.3Manufacturing 8.4 8.4 8.6 8.7 8.9 9.0 9.2 9.4 9.5 9.6 10.4 9.9Electricity, gas 2.2 2.1 2.1 2.1 2.2 2.0 2.1 2.0 2.1 2.1 2.2 2.0Water supply 0.3 0.3 0.3 0.3 0.3 0.3 0.3 0.3 0.3 0.3 0.3 0.3Construction 4.4 4.7 5.0 5.3 5.5 5.6 5.7 5.9 6.0 6.2 6.7 6.4
Services 41.7 42.0 42.4 42.5 42.8 43.3 43.8 44.3 44.7 45.3 45.9 46.4Trade and repairs 13.0 13.1 13.5 13.2 13.1 13.5 13.8 14.1 14.3 14.5 14.7 14.8Hotels and restaurants 2.8 2.7 2.6 2.5 2.5 2.4 2.4 2.3 2.3 2.3 2.2 2.2Transport 5.4 5.3 5.2 5.2 5.2 5.1 5.1 5.1 5.1 5.1 5.1 5.1Communications 1.2 1.3 1.4 1.5 1.7 1.9 2.1 2.3 2.7 3.1 3.4 3.9Financial intermediation 1.5 1.6 1.6 1.6 1.7 1.8 1.8 1.9 1.9 2.0 2.1 2.2Real estate and business services 6.5 6.6 6.6 6.5 6.6 6.7 6.7 6.7 6.7 6.7 6.7 6.7Public administration 7.0 7.2 7.4 7.8 8.0 8.0 8.0 8.0 7.8 7.8 7.8 7.7Education 2.1 2.1 2.0 1.9 1.9 1.8 1.8 1.8 1.8 1.8 1.8 1.8Health 1.3 1.3 1.3 1.3 1.4 1.4 1.4 1.4 1.4 1.4 1.4 1.4Other social and personal services 0.9 0.9 0.8 0.8 0.7 0.7 0.7 0.7 0.6 0.6 0.6 0.6
Gross value added excluding adjustments 78.1 78.5 78.9 79.0 79.6 79.9 80.3 80.5 80.6 81.1 81.1 81.4less FISIM -0.9 -0.9 -0.9 -1.0 -1.0 -1.1 -1.1 -1.2 -1.2 -1.2 -1.3 -1.4
Gross value added at basic prices 77.2 77.6 78.0 78.0 78.6 78.8 79.2 79.4 79.4 79.9 79.8 80.0Taxes on products 6.7 6.7 6.7 6.7 6.7 6.7 6.7 6.7 6.7 6.7 6.7 6.7
B: Non-MonetaryGDP at market prices 16.1 15.7 15.3 15.3 14.6 14.4 14.1 13.9 13.9 13.4 13.5 13.2Agriculture, forestry, hunting & fishing 11.3 11.0 10.7 10.8 10.2 10.0 9.7 9.5 9.4 8.9 8.9 8.7
Crops 8.7 8.5 8.3 8.5 8.0 7.8 7.7 7.5 7.5 7.1 7.1 6.9Livestock 1.7 1.6 1.5 1.5 1.4 1.4 1.3 1.2 1.2 1.2 1.2 1.1Forestry and hunting 0.9 0.8 0.8 0.8 0.7 0.7 0.7 0.7 0.7 0.6 0.6 0.6
Fishing 0.0 0.0 0.0 0.0 0.0 0.0 0.0 0.0 0.0 0.0 0.0 0.0Industry and construction 1.0 0.9 0.9 0.9 0.9 0.9 0.9 1.0 0.9 1.0 1.0 1.0
Water supply 0.2 0.1 0.1 0.1 0.1 0.1 0.1 0.1 0.1 0.1 0.1 0.1Construction 0.8 0.8 0.8 0.7 0.8 0.8 0.8 0.8 0.8 0.8 0.9 0.9Services 3.8 3.7 3.7 3.6 3.6 3.5 3.5 3.5 3.6 3.6 3.6 3.6Real estate and business services 3.8 3.7 3.7 3.6 3.6 3.5 3.5 3.5 3.6 3.6 3.6 3.6
C: Gross Domestic Product at market prices 100.0 100.0 100.0 100.0 100.0 100.0 100.0 100.0 100.0 100.0 100.0 100.0Notes: P = ProvisionalSource: National Bureau of Statistics
41

1.0 Output and Prices
Table 1.8: Zanzibar Gross Domestic Product (GDP) by kind of Economic Activity, Percentage Share in Total GDP, at 2001 Constant PricesPercent
Economic Activity 2001 2002 2003 2004 2005 2006 2007 2008 2009 2010 2011r 2012p
Agriculture, forestry & fishing 30.1 23.0 22.7 21.9 21.5 24.0 22.5 22.6 22.1 21.4 20.6 19.5
Crops 19.1 14.4 14.3 13.7 13.3 16.2 14.9 15.1 14.8 14.4 13.6 12.8
Livestock 5.0 4.0 3.9 3.8 3.8 3.7 3.6 3.5 3.4 3.3 3.2 3.1
Forestry & hunting 0.6 0.4 0.4 0.4 0.4 0.4 0.4 0.4 0.4 0.4 0.4 0.3
Fishing 5.4 4.1 4.0 3.9 4.0 3.7 3.6 3.6 3.4 3.3 3.4 3.3
Industry 13.1 11.6 12.8 13.5 13.7 15.2 15.0 14.5 14.0 13.5 13.3 13.6
Mining & quarrying 0.6 0.6 0.8 0.7 0.8 0.8 0.8 0.9 1.0 1.0 1.0 1.1
Manufacturing 6.0 5.4 5.7 5.1 5.0 4.9 4.6 4.4 4.2 4.1 3.9 3.7
Electricity, gas & water supply 1.9 1.6 1.6 1.6 1.6 1.6 1.6 1.5 1.5 1.4 1.5 1.5
Construction 4.5 4.1 4.7 6.1 6.3 8.0 8.0 7.6 7.4 7.0 6.8 7.3
Services 56.8 49.7 49.0 49.0 49.2 45.2 46.9 47.3 48.3 49.5 50.4 51.3
Trade & repairs 12.6 10.0 9.5 9.1 9.9 9.5 9.6 8.9 8.7 8.7 9.9 10.2
Hotels & restaurants 7.1 6.3 5.5 5.7 7.7 7.9 7.8 7.3 7.2 7.0 7.2 6.8
Transport & communication 7.4 6.8 7.7 7.8 8.1 7.7 10.0 11.7 13.5 15.1 15.5 17.3
Financial intermediation 1.6 1.5 1.5 1.7 1.8 1.6 1.8 1.7 1.7 1.9 1.9 2.0
Real estate & business services 1.2 1.0 1.0 1.0 1.0 0.9 0.9 0.9 0.9 0.9 0.9 0.9
Public administration 18.1 16.7 16.3 16.4 13.5 10.4 10.0 9.8 9.6 9.2 8.7 8.1
Education 6.7 5.7 5.6 5.6 5.4 5.4 5.1 5.2 5.1 5.0 4.8 4.6
Health 1.6 1.4 1.5 1.5 1.5 1.5 1.5 1.4 1.4 1.3 1.2 1.2
Other social & personal services 0.5 0.4 0.4 0.4 0.4 0.4 0.3 0.4 0.3 0.3 0.3 0.3
Adjustment to market prices
Taxes on products 18.5 15.6 15.6 15.6 15.6 15.6 15.6 15.6 15.6 15.6 15.6 15.6
Total GDP at market prices 100.0 100.0 100.0 100.0 100.0 100.0 100.0 100.0 100.0 100.0 100.0 100.0Notes: P = Provisional, r = RevisedSource: Office of Chief Government Statistician - Zanzibar and BoT
42

1.0 Output and Prices
Table 1.9: Gross Domestic Product (GDP) by Kind of Economic Activity, Percentage Growth Rates at Constant 2001 Prices, Tanzania MainlandPercent
Economic Activity 2001 2002 2003 2004 2005 2006 2007 2008 2009 2010 2011 2012p
A:MonetaryGross Domestic Product at market prices 6.5 7.7 7.4 7.8 8.1 7.0 7.5 7.7 6.0 7.6 6.4 7.2Agriculture, forestry, hunting & fishing 6.3 5.5 3.0 4.2 6.1 3.5 4.1 4.5 2.2 5.3 1.8 4.1
Crops 7.6 6.4 2.8 4.2 6.7 3.4 4.4 5.1 1.9 6.5 1.5 4.7Livestock 4.0 2.8 2.2 3.5 5.1 2.4 3.3 2.2 2.3 3.1 2.3 3.1Forestry and hunting 3.1 3.3 3.0 2.7 3.6 4.6 3.3 3.2 3.6 4.1 3.5 2.4Fishing 4.7 6.8 6.0 6.7 6.0 5.0 4.5 5.0 2.2 1.5 1.3 2.9
Industry and construction 6.7 9.6 11.4 11.3 10.4 8.4 9.4 8.5 7.1 8.2 6.8 7.8Mining and quarrying 13.9 16.9 17.1 16.0 16.1 15.6 10.7 2.5 1.2 2.7 2.2 7.8Manufacturing 5.0 7.5 9.0 9.4 9.6 8.5 8.7 9.9 8.0 7.9 7.8 8.2Electricity, gas 5.9 6.2 7.2 7.5 9.4 -1.9 10.9 5.4 8.4 10.2 1.5 6.0Water supply 3.8 2.8 4.9 5.7 4.5 7.2 7.6 6.6 4.3 7.8 4.0 5.4Construction 7.9 13.1 15.6 14.5 10.1 9.3 9.5 10.4 7.9 10.2 9.0 7.8
Services 6.5 8.0 7.9 8.0 8.2 8.0 8.3 8.7 7.1 8.3 7.9 8.1Trade and repairs 6.4 8.3 9.7 5.8 6.7 9.5 9.8 10.0 7.5 8.2 8.1 7.7Hotels and restaurants 4.8 6.4 3.2 3.6 5.6 4.3 4.4 4.5 4.4 6.1 4.6 4.8Transport 4.9 5.9 5.0 8.6 6.7 5.3 6.5 6.9 6.0 7.0 6.7 7.1Communications 8.7 10.4 15.6 17.4 18.8 19.2 20.1 20.5 21.9 22.1 19.0 20.6Financial intermediation 6.9 10.1 10.7 8.3 10.8 11.4 10.2 11.9 9.0 10.1 10.7 13.2Real estate and business services 3.4 8.1 7.1 7.3 8.4 8.0 7.5 7.1 5.7 7.5 6.2 6.7Public administration 10.5 9.2 9.6 13.6 11.4 6.5 6.7 7.0 4.4 6.5 6.8 5.8Education 11.4 7.0 2.8 4.0 4.0 5.0 5.5 6.9 7.1 7.3 7.4 6.5Health 5.6 8.6 8.7 7.8 8.1 8.5 8.8 9.0 6.7 6.9 5.4 5.6Other social and personal services 3.1 2.1 2.0 3.0 2.6 3.7 3.2 3.1 3.2 3.5 3.0 3.8
Gross value added before adjustments 6.5 7.7 7.5 7.9 8.2 7.1 7.7 7.8 6.1 7.7 6.5 7.3less FISIM 2.5 8.7 11.7 10.1 11.8 14.9 15.3 11.0 8.7 9.1 11.2 12.7
Gross value added at basic prices 6.5 7.7 7.5 7.8 8.2 7.0 7.6 7.7 6.0 7.7 6.4 7.2Taxes on products 6.0 7.2 6.9 7.8 7.4 6.8 6.9 7.8 5.8 6.7 6.5 7.3
B:Non-MonetaryGross Domestic Product at market prices 3.5 4.5 4.1 7.8 3.1 5.2 4.8 5.7 6.0 3.5 6.6 5.2Agriculture, forestry, hunting & fishing 2.7 4.2 3.7 8.9 1.7 4.6 3.9 4.8 5.0 2.0 6.3 4.3Crops 2.2 4.5 4.0 10.2 1.2 5.0 4.7 5.1 5.5 1.5 6.4 4.7Livestock 4.0 2.8 2.2 5.5 3.0 2.4 0.6 3.5 2.3 4.0 7.0 3.1Forestry & hunting 4.7 3.3 3.0 2.7 3.6 4.6 2.1 3.8 3.3 4.1 3.5 2.4Fishing 6.1 6.8 6.0 6.7 6.0 5.0 4.5 5.0 21.4 1.5 -2.0 2.9Industry & construction 5.4 4.6 3.0 3.0 9.1 9.6 9.9 10.4 5.1 9.2 8.4 7.5Water supply 2.8 3.0 3.8 3.9 4.0 4.1 4.0 6.6 8.6 2.8 4.0 5.4Construction 5.9 4.9 2.9 2.9 10.1 10.6 10.9 11.0 4.5 10.2 9.0 7.8Services 5.6 5.5 5.6 5.7 5.9 6.0 6.0 7.1 9.0 6.1 7.1 6.7Real estate & business services 5.6 5.5 5.6 5.7 5.9 6.0 6.0 7.1 9.0 6.1 7.1 6.7C:Gross Domestic Product at market prices 6.0 7.2 6.9 7.8 7.4 6.7 7.1 7.4 6.0 7.0 6.4 6.9Notes: P = ProvisionalSource: National Bureau of Statistics
43

1.0 Output and Prices
Table 1.10: Zanzibar Gross Domestic Product (GDP) by kind of Economic Activity, Percentage Annual Growth Rates, at 2001 Constant PricesPercent
Economic Activity 2001 2002 2003 2004 2005 2006 2007 2008 2009 2010 2011r 2012p
Agriculture, forestry & fishing 13.9 -1.5 4.2 2.8 2.8 18.7 -0.4 5.7 4.4 3.1 2.8 1.2
Crops 17.1 -3.1 5.0 2.0 1.6 29.4 -2.0 6.5 5.1 3.5 0.5 0.5
Livestock 3.4 3.4 3.5 3.5 3.5 3.5 3.6 3.5 3.3 3.2 3.1 3.0
Forestry & hunting 7.0 2.2 1.3 3.7 3.6 3.8 8.3 3.0 7.7 0.0 7.1 0.0
Fishing 14.1 -1.0 2.6 4.8 6.3 -1.0 1.8 5.2 2.5 1.6 11.9 2.1
Industry 7.2 14.0 16.3 12.5 6.6 17.6 4.6 1.9 3.3 2.0 5.6 9.1
Mining & quarrying 11.3 26.7 36.0 4.2 15.5 3.0 8.3 22.8 12.5 5.6 13.2 16.3
Manufacturing -8.2 15.4 12.7 -5.1 2.4 3.5 0.7 1.1 2.0 3.3 2.5 0.0
Electricity, gas & water supply 3.5 4.3 4.4 6.0 7.6 5.0 6.3 0.9 1.9 0.0 15.1 4.9
Construction 39.3 14.7 22.9 37.6 8.8 33.8 6.2 0.5 3.1 1.1 4.5 14.2
Services 7.5 12.6 4.3 6.7 5.3 -2.8 10.4 6.1 8.8 9.2 8.5 8.9
Trade & repairs 18.1 1.7 0.4 2.2 14.6 1.0 8.0 -4.3 4.0 7.0 21.5 9.6
Hotels & restaurants -17.9 14.6 -8.1 11.5 39.9 9.2 4.6 -0.5 4.8 3.1 10.0 0.3
Transport & communications 12.5 17.9 20.8 6.9 9.9 0.4 37.3 24.1 22.4 19.3 9.5 19.8
Financial intermediation 8.7 20.6 8.7 19.1 13.7 -10.2 21.3 4.0 1.7 25.0 4.0 10.3
Real estate & business services 4.6 4.6 4.7 4.7 4.7 4.7 7.1 4.8 6.5 3.0 5.9 5.6
Public administration 11.8 18.7 3.4 6.9 -13.5 -18.3 1.3 4.0 4.2 2.6 0.3 0.3
Education 8.9 9.5 3.5 6.5 1.1 5.4 1.2 6.4 5.7 4.9 2.6 1.5
Health 6.9 11.0 16.5 4.2 4.2 5.9 6.6 4.5 2.0 2.0 -3.9 6.1
Other social & personal services 4.3 4.3 4.3 4.3 4.3 4.3 0.0 4.3 0.0 8.3 0.0 7.7
Total GDP at market prices 9.3 8.5 5.9 6.5 4.9 6.0 6.3 5.3 6.7 6.4 6.7 7.0
Notes: P = Provisional
r = Revised Source: Office of Chief Government Statistician-Zanzibar
44

1.0 Output and Prices
Table 1.11 : Production of Major Agricultural Crops, Tanzania Mainland '000' Tonnes
Type of Crop 2001/02 2002/03 2003/04 2004/05 2005/06 2006/07 2007/08 2008/09 2009/10 2010/11 2011/12p
Food Crops:
Maize 2,705.0 2,322.0 3,157.0 3,219.0 3,373.0 3,302.1 3,593.7 3,555.8 4,733.1 4,122.6 5,240.0
Rice 640.0 713.0 688.0 759.0 784.0 872.2 896.7 875.1 1,722.6 1,439.1 1,128.3
Wheat 77.0 74.0 67.0 102.0 110.0 82.8 86.4 92.4 62.4 112.7 102.8
Pulses 683.0 850.0 879.0 886.0 1,018.0 1,156.0 1,111.2 1,125.5 1,298.9 1,684.1 1,824.2
Cash Crops:
Coffee 37.5 52.4 32.5 54.0 34.3 54.8 43.1 68.5 34.6 56.8 33.5
Cotton 49.9 63.4 46.9 114.6 125.6 43.8 67.3 123.6 89.5 54.8 75.7
Tea 24.7 27.6 30.1 30.7 30.3 31.3 32.7 31.6 32.1 35.0 35.8
Cashewnuts 67.3 95.0 79.0 72.0 77.4 92.6 99.1 79.1 75.4 121.1 158.4
Tobacco 28.0 28.0 34.0 47.0 52.0 50.7 50.8 55.4 60.7 94.2 126.6
Sisal 23.5 23.6 23.8 27.0 27.8 30.9 34.1 23.8 24.0 35.0 34.6
Pyrethrum 1.7 1.1 0.8 1.0 2.8 2.0 2.3 3.3 3.3 5.0 naNote: P = Provisional
na = Not AvailableSource: Ministry of Agriculture, Food Security and Cooperatives & Crop Boards
45

1.0 Output and Prices
Table 1.12 Production of Major Export Crops, Zanzibar
Tonnes
Crop 2001 2002 2003 2004 2005 2006 2007 2008 2009 2010 2011 2012P
Cloves 2,061.9 5,959.8 5,219.0 4,097.6 3,266.7 3,156.7 1,085.6 4,007.0 3,536.0 2,129.0 3,743.0 1,755.4
Clove Stems 323.5 187.3 497.0 476.0 350.6 128.8 226.5 345.4 445.0 280.0 468.0 328.4
Seaweeds 8,117.0 9,090.7 9,261.0 7,184.5 7,361.8 7,543.1 8,485.0 11,177.0 10,248.0 11,937.0 13,193.0 15,087.0
Rubber 0.0 0.0 0.0 683.0 711.0 886.8 974.2 1,479.0 428.0 564.0 457.0 385.0
Notes: P = Provisional
r = Revised
Source: Office of Chief Government Statistician - Zanzibar
46

1.0 Output and Prices
Table 1.13 : Agricultural Production Indices, Tanzania Mainland1980/81=100
Crops 2000/01 2001/02 2002/03 2003/04 2004/05 2005/06 2006/07 2007/08 2008/09 2009/10 2010/11 2010/12P
Food Crops:
Maize 140.2 147.0 126.2 171.6 175.0 183.4 179.5 195.3 193.3 257.3 224.1 284.8
Paddy 161.4 183.1 204.0 196.9 217.2 224.3 249.6 256.6 250.4 492.9 411.7 322.8
Wheat 98.3 85.1 81.8 74.0 112.7 121.5 91.5 95.4 102.1 68.9 124.5 113.6
Pulses 269.9 251.5 313.0 323.6 326.2 374.8 425.6 409.1 414.4 478.2 620.1 671.6
Cash Crops:
Coffee 105.8 68.3 95.5 59.2 98.4 62.5 99.9 78.5 124.8 62.9 103.4 60.9
Cotton 72.7 88.1 111.7 82.8 202.2 221.5 77.2 118.6 218.0 157.8 96.7 133.6
Tea 152.0 140.3 156.6 171.1 174.4 172.4 178.1 185.8 179.6 182.2 198.9 203.7
Cashewnuts 226.3 124.8 171.1 146.3 133.3 143.4 171.4 183.5 146.4 137.3 224.3 293.4
Tobacco 168.9 189.2 189.2 229.7 317.6 351.4 342.3 343.1 374.0 408.0 636.8 855.6
Sisal 25.5 29.1 29.1 29.1 32.7 33.7 37.5 41.3 28.8 38.9 42.4 41.9
Pyrethrum 54.3 64.3 40.4 31.2 37.0 103.7 75.8 85.2 121.5 123.0 185.2 naNote: n.a = Not Available
P = Provisional Source : Ministry of Agriculture and BOT computation
47
1.0 Output and Prices
Table 1.14: Production in Selected Industries, Tanzania Mainland
Commodity Unit 2001 2002 2003 2004 2005 2006 2007 2008 2009 2010 2011r 2012p
Biscuits & pasta Tonnes 1,215.0 2,284.0 5,906.0 10,214.0 10,912.0 10,565.0 11,273.0 15,435.0 6,930.0 6,912.0 12,240.0 16,119.0
Wheat flour Tonnes 180,098.0 219,118.0 334,601.0 338,076.0 368,019.0 421,973.0 412,823.0 287,925.0 367,846.0 463,552.0 439,201.0 443,731.0
Sugar, refined '000' Tonnes 184.0 189.6 212.9 202.3 268.8 173.4 285.6 310.1 287.7 259.9 249.0 271.1
Konyagi '000' Lts 2,287.0 2,937.0 3,738.0 4,105.0 4,489.0 5,365.0 7,614.0 4,049.0 10,201.0 11,236.0 17,177.0 16,774.0
Beer '000' Lts 175,649.0 175,870.0 194,100.0 202,628.0 216,604.0 299,036.0 310,194.0 291,178.0 288,901.0 248,502.0 331,011.0 338,650.0
Chibuku '000' Lts 18,750.0 19,400.0 14,825.0 10,119.0 11,106.0 11,559.0 10,320.0 10,255.0 16,141.0 21,040.0 23,474.0 22,028.0
Cigarattes Mill Pcs 3,491.0 3,778.0 3,920.0 4,219.0 4,445.0 5,095.0 5,821.0 6,101.0 5,741.0 6,181.0 6,630.0 7,558.0
Textiles '000'Sq. Mt. 84,548.0 106,305.0 126,900.0 127,051.0 110,520.0 130,716.0 127,231.0 155,088.0 101,803.0 102,938.0 108,398.0 92,585.0
Sisal ropes and twines Tonnes 4,796.0 5,901.0 6,839.0 5,161.0 5,943.0 5,854.0 7,295.0 7,783.0 7,913.0 6,872.0 6,976.0 7,754.0
Fishnet & products Tonnes 57.0 30.0 41.0 260.0 274.0 119.0 156.0 0.0 64.0 247.0 164.0 295.0
Plywood Cubic Mt. 450.0 304.0 562.0 578.0 918.0 1,032.0 1,080.0 925.0 254.0 988.0 1,007.0 776.0
Pyrethrum extract Tonnes 71.0 36.0 16.0 23.0 164.0 33.0 30.0 423.0 143.0 64.0 70.0 73.0
Paints '000'Ltrs 9,662.0 13,564.0 16,842.0 16,621.0 16,222.0 18,384.0 22,849.0 24,857.0 25,761.0 28,201.0 47,589.0 35,344.0
Cement '000' Tonnes 900.4 1,026.0 1,186.3 1,280.9 1,366.0 1,369.9 1,629.9 1,755.9 1,940.8 2,312.1 2,408.8 2,581.4
Rolled steel Tonnes 16,340.0 25,418.0 38,794.0 40,029.0 47,652.0 50,654.0 46,016.0 75,274.0 122,318.0 126,054.0 118,249.0 133,229.0
Iron Sheets Tonnes 25,937.0 35,067.0 31,018.0 29,573.0 25,088.0 30,293.0 36,369.0 31,751.0 47,153.0 58,956.0 76,912.0 81,427.0
Aluminium sheets/circles Tonnes 137.0 141.0 199.0 171.0 103.0 105.0 110.0 85.0 58.0 58.0 33.0 37.0
Dry cells '000' Pcs 39,000.0 42,000.0 43,000.0 74,000.0 81,000.0 82,000.0 84,000.0 53,000.0 78,000.0 93,000.0 86,000.0 146,100.0
Battery, auto Pieces 11,000.0 17,000.0 27,000.0 29,000.0 42,000.0 50,000.0 12,000.0 0.0 0.0 0.0 0.0 0.0Note: P = Provisional
r = RevisedSource: National Bureau of Statistics
48

1.0 Output and Prices
Table 1.15: Production in Selected Industries in Zanzibar
Commodity Units 2001 2002 2003 2004 2005 2006 2007 2008 2009 2010 2011 2012p
Wheat Flour Tonnes 0.0 18,154.0 21,446.0 16,753.0 14,822.0 10,590.0 1,026.0 0.0 0.0 0.0 0.0 0.0
Beverage Litres'000' 5,689.0 5,419.0 6,250.0 7,132.0 8,435.0 10,246.0 9,925.0 12,780.0 13,800.0 15,414.0 17,199.0 14,409.0
Animal Feed Tonnes 1,534.0 1,674.0 1,520.0 1,277.0 1,001.0 842.0 1,115.0 215.0 0.0 0.0 0.0 1.0
Super Shine Audio Cartoon 0.0 0.0 0.0 54,685.0 47,976.5 63,240.0 70,597.0 - - - - -
Super Shine Video Cartoon 0.0 0.0 0.0 40,577.0 31,038.5 23,339.0 10,090.0 - - - - -
Coconut oil Tonnes 233.0 147.0 3.1 66.0 89.0 82.0 77.0 - - - - -
Bread No.'000' 53,059.0 54,519.0 59,992.0 68,706.0 77,331.0 87,037.0 97,960.0 102,050.0 105,531.0 108,264.0 111,512.0 114,858.0
Copra Cakes Tonnes 61.0 54.0 2.0 59.0 31.0 46.0 49.0 - - - -
Jewellery (Gold/Silver) Grams 0.0 0.0 29,165.0 35,125.0 19,090.0 16,737.0 7,563.0 7,526.0 9,710.0 9,508.0 8,602.0 8,172.0
Noodles Kg 0.0 0.0 159,133.0 193,656.0 93,830.0 61,085.0 58,807.0 71,072.0 75,600.0 80,417.0 189,000.0 199,000.0
Mineral Water Litres'000' 0.0 0.0 0.0 3,136.0 2,975.1 5,033.0 3,631.0 - - - - -
Door UPVC Nos. 0.0 0.0 0.0 70.0 18.0 32.0 53.0 33.0 43.0 125.0 140.0 95.0
Window UPVC Nos. 0.0 87.0 0.0 150.0 15.0 59.0 161.0 35.0 98.0 43.0 95.0 201.0
Video/Radio Tape Cartons 0.0 82,353.0 97,223.0 107,273.0 81,918.0 86,579.0 80,687.0 61,167.0 30,742.0 30,648.0 14,517.0 4,646.0
Garments Dish Dash (Nguo) Pcs 0.0 5,687.0 3,324.0 4,929.0 3,860.0 2,004.0 5,338.0 3,778 4,392 4,648 4,672 2,877 Note: P = Provissional, 0.0 = No ProductionSource: Office of Chief Government Statistician - Zanzibar.
49

1.0 Output and Prices
Table 1.16: Industrial Production Indices, Tanzania Mainland1985=100
Commodity 2001 2002 2003 2004 2005 2006 2007 2008 2009 2010 2011r 2012p
Biscuits & pasta 122.9 230.9 597.2 1,032.8 1,103.3 1,068.3 1,139.8 1,560.7 700.7 698.9 1,237.6 1,629.8
Wheat flour 462.9 563.1 859.9 868.9 945.8 1,084.5 1,061.0 740.0 945.4 1,191.3 1,128.8 1,140.4
Sugar, refined 144.6 169.6 190.1 180.6 240.0 154.8 255.0 276.8 256.9 232.0 222.3 242.0
Konyagi 237.7 305.3 388.6 426.7 466.6 557.7 791.5 420.9 1,060.4 1,168.0 1,785.6 1,743.7
Beer 231.8 232.1 256.2 267.5 285.9 394.7 409.4 384.3 381.3 328.0 436.9 447.0
Chibuku 171.5 177.5 135.6 92.6 101.6 105.8 94.4 93.8 147.7 192.5 214.8 201.5
Cigarattes 130.9 141.7 147.0 158.3 166.7 191.1 218.3 228.8 215.3 231.8 248.7 283.5
Textiles 145.6 183.1 218.5 218.8 190.3 225.1 219.1 267.1 175.3 177.3 186.7 159.4
Sisal ropes and twines 33.1 40.7 47.2 35.6 41.0 40.4 50.3 53.7 54.6 47.4 48.1 53.5
Fishnet & products 59.4 31.3 42.7 270.8 285.4 124.0 162.5 0.0 66.7 257.3 170.8 307.3
Plywood 28.3 19.1 35.4 36.4 57.8 64.9 68.0 58.2 16.0 62.2 63.4 48.8
Pyrethrum extract 182.1 92.3 41.0 59.0 420.5 84.6 76.9 1,084.6 366.7 164.1 179.5 187.2
Paints 708.4 994.4 1,234.8 1,218.5 1,189.3 1,347.8 1,675.1 1,822.4 1,888.6 2,067.5 3,488.9 2,591.2
Cement 239.4 272.9 315.5 340.7 363.3 364.3 433.5 467.0 516.2 614.9 640.6 686.5
Rolled steel 144.6 224.9 343.3 354.2 421.7 448.3 407.2 666.1 1,082.5 1,115.5 1,046.5 1,179.0
Iron Sheets 119.7 161.8 143.1 136.5 115.8 139.8 167.8 146.5 217.6 272.1 354.9 375.8
Aluminium sheets/circles 5.7 5.9 8.3 7.1 4.3 4.4 4.6 3.5 2.4 2.4 1.4 1.5
Dry cells 88.4 95.2 97.5 167.8 183.7 185.9 190.5 120.2 176.9 210.9 195.0 331.3
Battery, auto 72.4 111.8 177.6 190.8 276.3 328.9 78.9 0.0 0.0 0.0 0.0 0.0Notes P = Provisional
r = RevisedSource: National Bureau of Statistics & BOT computation
50

1.0 Output and Prices
Table 1.17: Mineral Recoveries, Tanzania Mainland
Item Unit 2001 2002 2003 2004 2005 2006 2007 2008 2009 2010 2011P
Diamond '000' Carats 254.3 239.8 236.4 303.9 219.6 272.2 282.8 237.7 181.9 80.5 28.4
Gold Kgs 30,088.0 43,320.0 48,018.0 48,175.7 47,269.5 39,749.8 40,193.2 36,433.0 39,112.6 39.4 40.4
Gemstone Tonnes 96.9 195.8 1,531.5 1,613.8 627.8 2,498.6 1,286.3 1,858.3 1,058.5 1,250.3 1,581.7
Salt '000' Tonnes 65.0 71.2 59.0 57.1 51.2 34.8 35.2 25.9 27.4 34.5 36.4
Gypsum '000' Tonnes 72.0 73.0 33.2 59.2 23.1 32.6 52.8 55.7 8.1 26.9 38.7
Limestone '000' Tonnes 2,269.4 2,856.7 1,206.2 1,390.9 2,006.4 1,607.6 1,322.0 1,281.8 1,284.1 1,436.6 1,972.1
Pozzolana Tonnes 41,468.0 52,000.0 105,910.8 152,678.6 163,499.3 129,295.3 184,070.4 260,403.3 171,904.3 199,698.4 222,591.8
Coal '000' Tonnes 77.8 79.2 54.6 65.0 30.8 17.9 27.2 15.2 0.8 179.5 82,856.2
Tanzanite Kilogram 5,504.0 8,187.0 11,770.0 10,011.7 12,773.6 14,974.4
Phosphate Tonnes 4,000.0 1,182.0 3,738.0 6,570.0 1,975.3 2,880.7 8,261.1 28,684.0 752,000.0 17,180.0 848,512.0
Copper '000' Pounds 5,832.2 9,239.4 8,191.0 9,348.2 8,072.1 7,241.6 7,222.4 6,288.5 4,451.7 11,741.9 11,180.2Note: P = Provisional
r = RevisedSource : Ministry of Energy and Minerals
51

1.0 Output and Prices
Table 1.18: Seasonally Adjusted Consumer Price Index, Tanzania Mainland* December 2001=100
Period Total Food Non-Food Total 1) Food Non-Food 2)
2008 - Jan 146.2 157.8 131.1 7.2 9.4 3.2 3.3Feb 148.1 161.5 131.5 13.2 18.5 5.5 1.3Mar 149.8 162.6 132.8 14.0 15.1 10.7 1.1Apr 147.9 162.5 134.3 12.9 19.1 11.9 -1.3May 150.1 162.6 135.0 13.6 16.5 10.7 1.5Jun 151.6 164.1 137.3 14.8 17.7 13.4 1.0Jul 154.5 167.5 137.4 11.6 12.6 9.9 1.9
Aug 153.3 166.1 137.7 7.2 5.8 9.7 -0.8Sep 157.1 171.7 137.4 10.0 11.5 7.1 2.5Oct 156.6 172.7 137.2 12.0 12.9 4.3 -0.3Nov 158.8 176.3 136.2 12.0 17.6 1.9 1.4Dec 161.1 179.7 137.2 13.0 19.9 -0.3 1.5
2009 - Jan 164.8 186.3 137.6 13.8 23.7 0.2 2.3Feb 167.5 191.0 137.9 19.4 32.2 0.3 1.6Mar 168.4 191.0 138.7 15.0 23.8 1.8 0.5Apr 168.4 190.9 138.3 15.7 22.3 1.6 0.0May 166.6 191.4 136.9 10.1 17.8 1.1 -1.1Jun 167.1 191.7 137.0 7.5 13.9 -0.3 0.3Jul 169.9 194.1 139.3 6.4 8.6 2.5 1.7
Aug 172.5 199.2 140.3 6.2 8.8 3.5 1.5Sep 176.2 201.4 142.9 9.4 11.2 6.3 2.1Oct 178.0 205.6 143.8 11.8 15.9 8.1 1.0Nov 179.9 207.9 144.0 16.5 18.0 10.7 1.1Dec 181.0 205.9 149.4 17.3 15.3 19.0 0.6
2010 - Jan 179.5 208.6 151.3 11.6 15.4 18.2 -0.8Feb 181.4 210.2 150.1 10.6 11.4 14.5 1.1Mar 179.4 211.0 149.2 3.7 9.7 8.8 -1.1Apr 180.7 212.8 149.6 3.1 7.1 8.7 0.7May 179.6 208.4 147.3 -0.3 0.5 4.5 -0.6Jun 180.7 205.7 147.5 -0.3 -0.2 -2.5 0.6Jul 182.5 204.2 149.1 3.3 -4.1 -2.9 1.0
Aug 187.2 208.6 149.8 6.5 -1.5 -0.4 2.6Sep 186.7 208.5 149.4 8.3 -2.3 0.3 -0.3
Notes: 1) Headline Inflation 2) Underlying Inflation * Adjusted for seasonal movements or seasonal variations, which refer to identical, or almost identical, patterns that time series appears to follow during the corresponding months (quarters) of successive years. Such movements are due to recurring events, which take place annually, for example the increase of food prices during Ramadhan.Source: Bank of Tanzania
Index % Change for the last six months at an annual rate Month-on-Month Total NCPI
52

1.0 Output and Prices
Table 1.19a: National Consumer Price Index (Urban and Rural) - New CPISeptember 2010 = 100
General index
Total Index
Food and Non-
Alcoholic Beverages
Alcohol & Tobacco
Clothing &
Footwear
Housing, Water,
Electricity, Gas and
Other Fuel
Furnishing, Housing
Equipment and Routine Maintanance of the House Health Transport
Communication
Recreation and
Culture Education
Restaurants and hotels
Miscel. Goods
&services
Food and Non Alcoholic beverages combining
food consumed at
home and food consumed in restaurants
Energy and Fuels -
combining electricity and
other fuels for use at home with petrol and
diesel
All Items Less Food
(Non Food)
All Items Less Food
and Energy
Weight (%) 100 47.8 3.3 6.7 9.2 6.7 0.9 9.5 2.1 1.3 1.7 6.4 4.5 51 5.7 49 43.32010 99.9 100.9 99.4 98.0 96.8 98.4 99.9 100.7 99.4 97.4 101.6 100.6 98.7 100.8 94.3 98.7 99.42011 112.5 117.0 104.2 107.3 114.9 112.0 102.0 108.1 97.9 100.2 105.7 108.8 103.3 116.1 121.2 108.4 106.42012 130.6 141.1 119.7 122.1 133.6 122.2 105.1 114.7 96.7 110.2 110.5 126.8 114.4 139.5 147.5 120.0 115.8
2012-Jan 124.6 135.7 107.4 115.4 123.3 117.6 103.8 112.3 98.1 103.2 107.9 116.9 109.1 133.6 132.2 114.0 111.3Feb 127.1 138.5 111.0 118.2 124.8 119.3 103.9 112.6 96.6 107.9 110.8 121.9 111.5 136.6 134.7 115.7 112.8Mar 128.4 139.5 112.5 120.2 126.4 120.7 104.3 114.3 96.6 108.5 110.8 125.1 113.1 137.9 138.4 117.1 113.9Apr 129.5 140.6 112.7 121.2 128.9 121.1 104.7 115.1 96.7 108.6 110.8 126.0 113.7 139.0 143.0 118.1 114.4May 129.9 141.2 112.9 121.9 129.5 121.4 105.0 115.1 96.6 108.7 110.8 126.6 114.3 139.6 143.6 118.5 114.7Jun 130.1 140.6 116.1 122.1 131.0 122.2 105.1 115.3 96.5 112.1 110.8 126.8 114.7 139.1 146.1 119.3 115.3Jul 130.2 139.9 123.3 123.0 133.1 122.5 105.6 115.4 96.6 112.6 110.8 126.3 114.5 138.4 149.5 120.5 116.2
Aug 131.1 140.8 126.5 123.4 135.7 123.0 105.3 114.2 96.6 112.2 110.8 127.5 115.9 139.3 150.4 121.3 117.0Sep 132.6 141.7 127.1 124.2 141.7 123.7 105.4 116.1 96.6 112.5 110.8 131.0 115.3 140.5 158.9 123.2 117.8Oct 133.0 142.5 127.2 124.6 142.9 123.9 105.5 114.7 96.4 112.3 110.8 130.6 115.7 141.2 157.7 123.3 118.1Nov 133.9 143.8 128.3 125.1 142.9 125.0 106.3 115.2 96.5 112.1 110.8 131.2 116.4 142.4 157.9 123.8 118.7Dec 136.5 148.2 130.9 126.0 143.6 125.7 106.9 116.0 96.3 111.8 110.8 131.9 118.5 146.4 158.1 124.7 119.7
2013-Jan 138.3 151.9 132.1 126.8 142.3 126.1 106.9 115.4 96.3 112.4 112.5 132.6 118.7 149.8 155.2 124.6 120.0Feb 140.2 155.2 132.0 127.5 145.1 126.6 107.0 115.4 96.2 111.8 113.2 132.9 118.9 152.7 159.4 125.5 120.4Mar 140.9 155.0 132.1 127.8 152.1 126.8 108.1 115.8 96.2 111.9 113.2 133.5 118.8 152.6 169.8 127.1 120.7
2011-Q1 106.1 108.8 102.1 103.6 105.3 107.9 101.1 102.4 97.7 99.2 105.4 104.9 100.0 108.4 103.2 103.5 103.5Q2 109.9 112.9 103.6 105.5 112.7 111.4 101.6 107.6 97.4 99.8 105.8 107.1 101.1 112.3 118.0 107.1 105.5Q3 114.5 118.9 105.1 108.1 119.6 113.4 102.0 111.5 98.2 100.9 105.8 110.1 104.5 118.0 130.1 110.3 107.4Q4 119.7 127.3 106.0 111.8 122.1 115.4 103.2 112.2 98.2 101.1 105.8 113.1 107.7 125.7 133.5 112.5 109.3
2012-Q1 126.7 137.9 110.3 117.9 124.8 119.2 104.0 113.1 97.1 106.5 109.8 121.3 111.2 136.0 135.1 115.6 112.7Q2 129.8 140.8 113.9 121.7 129.8 121.5 104.9 115.2 96.6 109.8 110.8 126.5 114.2 139.2 144.2 118.6 114.8Q3 131.3 140.8 125.6 123.5 136.8 123.1 105.4 115.2 96.6 112.4 110.8 128.3 115.2 139.4 152.9 121.7 117.0Q4 134.4 144.8 128.8 125.2 143.1 124.8 106.2 115.3 96.4 112.1 110.8 131.2 116.9 143.3 157.9 123.9 118.8
2013-Q1 139.8 154.0 132.1 127.4 146.5 126.5 107.3 115.5 96.2 112.0 112.9 133.0 118.8 151.7 161.5 125.7 120.4Notes: Please note that from October 2010 National Bureau of Statistics has changed base period from December 2001=100 to September 2010=100. NCPI market basket weights have also been updated from 2001 to
2007 using results of 2007 Household Budget Survey.Q = Quarter
Source: National Bureau of Statistics.
Main Groups Other Selected Groups
53

1.0 Output and Prices
Table 1.19b: National Consumer Price Index (Old CPI)December 2001 = 100
General Food Non FoodPeriod Index Total Drinks & Clothing Rent Fuel, light Furniture Household Personal care Recreation Transpor- Educ- Misc. goods
Tobacco & footwear & water & utensils operations & health & entertain. tation ation & servicesWeight (%) 100.0 55.9 44.1 6.9 6.4 1.4 8.5 2.1 2.1 2.1 0.8 9.7 2.6 1.5
2005 120.9 129.4 110.1 116.0 92.8 125.5 134.4 96.7 102.4 97.0 94.0 110.2 91.0 93.9
2006 129.6 138.5 118.5 125.0 99.3 132.3 145.8 104.3 104.4 107.8 98.7 120.2 93.3 101.5
2007 138.8 148.2 126.8 138.1 105.2 137.1 154.8 112.5 113.4 110.9 107.4 128.7 102.2 102.3
2008 153.0 167.0 135.4 149.3 106.7 140.4 171.3 119.2 117.0 116.5 113.4 137.5 109.4 104.1
2009 171.4 196.2 140.4 162.0 113.2 157.7 167.7 126.3 123.1 124.2 123.5 137.4 120.2 107.5
2006-Q1 127.9 138.6 114.4 119.7 98.1 128.8 138.2 100.8 101.0 107.6 98.0 115.3 90.2 102.0
Q2 131.2 142.5 117.1 121.4 98.3 131.5 145.5 102.9 102.7 106.2 97.5 119.1 91.6 101.0
Q3 127.8 133.3 120.9 127.7 99.7 134.5 151.7 105.9 105.0 107.2 98.3 122.8 94.4 101.6
Q4 131.7 139.7 121.7 131.1 101.2 134.5 147.9 107.6 108.9 110.3 100.8 123.8 96.9 101.3 2007-Q1 137.0 147.3 124.0 133.6 104.5 136.0 149.1 111.4 111.6 109.9 105.3 125.9 100.6 101.8
Q2 138.7 148.2 126.6 137.6 105.3 136.6 154.7 112.3 114.0 110.6 106.9 127.8 101.4 103.1
Q3 138.5 147.0 127.9 138.0 105.2 137.5 158.3 112.4 114.3 110.9 108.5 129.9 102.8 102.0
Q4 140.8 150.2 128.9 143.0 105.6 138.3 157.0 113.8 113.8 112.3 108.9 130.9 104.1 102.2
2008-Q1 149.2 163.4 131.2 146.8 105.3 138.9 161.6 116.6 115.1 113.6 110.0 132.9 106.2 103.4
Q2 151.7 165.1 134.9 148.5 106.4 139.5 172.0 118.1 117.1 114.7 111.4 136.5 107.8 103.9
Q3 152.8 164.5 137.9 149.7 106.4 141.6 179.2 120.1 116.8 117.4 114.5 141.0 110.8 104.2
Q4 158.4 175.0 137.6 152.1 108.6 141.6 172.5 122.1 119.1 120.3 117.6 139.6 112.7 104.9
2009-Q1 168.7 193.5 137.3 154.8 109.7 156.4 164.5 124.8 120.7 122.3 121.4 137.7 116.9 106.9
Q2 168.6 192.9 137.9 160.5 114.1 157.5 159.6 126.5 122.9 123.8 122.2 135.1 120.6 108.1
Q3 170.6 193.6 141.6 165.7 115.7 159.4 168.9 128.0 123.0 125.9 124.6 136.8 122.4 108.3
Q4 178.2 203.8 145.8 170.9 115.6 158.9 182.1 127.1 126.0 126.1 127.6 140.3 122.7 106.3
2010-Q1 185.3 213.5 149.5 172.0 115.3 160.6 197.3 127.8 127.0 128.0 126.9 142.6 123.6 106.0
Q2 182.7 210.2 147.7 173.9 115.3 160.8 185.0 129.1 127.0 130.0 124.7 144.7 122.0 103.3
Q3 180.5 204.2 150.5 177.3 116.3 162.4 192.8 131.1 128.1 131.1 124.7 145.9 122.4 102.3Notes: Base (1) 2001 = 100 up to August 2006, (2) December 2001 = 100 from September 2006 Please note that NBS has adjusted CPI figures from September 2006. Despite the adjustments the previous published figures remains the official measure of inflation in the past (The old and adjusted CPI figures are yet to be harmonized)
Q = Quarter Source: National Bureau of Statistics.
54

1.0 Output and Prices
Table 1.20: Zanzibar Consumer Price Index
Total Food Total Alcoholic Clothing Housing, Water, Furnishing, H/hold Health Transport Communi- Recreation Edu- Restaurants MiscellaneousPeriod Index Beverages, and electricity, Equipments & cation and cation and Goods &
Tobacco and Footwear Gas and Routine H/hold Culture Hotels Services.Narcotics Other Fuels Maintenance
Weights (%) 100.0 49.5 50.5 0.3 9.3 17.1 4.6 2.8 6.3 2.6 0.8 1.3 2.1 3.22008 67.3 65.3 70.2 44.5 63.0 73.5 63.1 55.8 84.9 98.3 72.7 67.7 59.8 80.02009 73.9 72.3 75.2 52.2 67.4 81.9 68.4 61.0 82.5 98.1 75.5 71.0 66.9 90.02010 84.3 84.3 83.8 69.7 75.8 89.4 75.2 75.4 90.9 99.0 83.1 82.6 82.4 90.02011 90.1 91.6 87.7 73.6 80.4 93.3 79.3 82.3 96.5 99.7 86.4 84.8 87.0 85.92012 98.5 97.7 99.3 96.0 97.5 100.5 98.0 97.3 101.3 99.8 98.7 100.3 98.6 99.32013 103.4 98.0 99.5 96.0 97.5 100.7 98.1 97.4 101.3 99.8 98.8 100.3 98.6 99.3
2011 - Q1 84.5 85.2 83.1 69.7 75.0 88.2 74.4 80.1 89.5 99.7 82.8 84.8 82.4 83.2Q2 88.1 89.4 85.9 73.3 77.3 92.3 76.1 80.9 95.2 99.7 83.2 84.8 84.4 84.5Q3 92.0 93.8 89.3 73.5 82.7 95.0 80.7 83.9 99.4 99.7 88.8 84.8 87.3 87.0Q4 95.8 98.0 92.7 77.9 86.7 97.7 86.0 84.3 101.8 99.7 90.7 84.8 93.9 88.8
2012 - Q1 98.6 100.4 96.0 84.6 91.3 100.2 93.1 89.2 99.5 99.9 93.6 100.0 95.1 93.5Q2 97.0 95.7 98.7 95.8 96.0 100.4 97.1 97.8 100.3 100.0 97.0 100.0 98.3 97.7Q3 99.0 97.9 100.3 100.0 100.1 100.3 100.0 100.2 101.2 100.0 99.7 100.3 99.9 99.9Q4 99.5 96.9 102.2 103.7 102.7 101.2 102.0 101.9 104.1 99.5 104.6 100.9 101.1 106.1
2013 - Q1 101.5 98.6 104.4 104.6 105.8 103.8 103.3 102.6 103.4 99.4 109.2 112.4 101.3 109.9Q2 102.7 99.5 106.0 106.3 108.1 106.1 103.9 102.4 104.8 99.4 110.3 115.5 99.3 112.1Q3 104.8 101.3 109.5 109.2 112.9 107.6 104.5 102.9 104.3 133.7 110.5 117.8 99.6 114.0
Q4 104.7 98.8 111.4 109.0 113.8 111.1 104.6 103.3 105.6 151.0 110.5 118.4 100.2 116.2
2012- Jan 99.2 102.2 95.0 81.0 87.7 100.6 91.3 85.4 99.9 99.7 93.6 100.0 94.7 92.6Feb 99.1 101.2 96.0 81.0 92.5 100.2 93.2 90.0 98.9 100.0 93.6 100.0 94.7 93.1Mar 97.5 97.7 97.0 91.8 93.8 99.9 94.7 92.4 99.7 100.0 93.6 100.0 95.7 94.8Apr 96.7 96.0 97.5 95.7 94.8 99.6 95.5 93.2 99.8 100.0 96.0 100.0 97.4 96.3May 97.4 96.5 98.6 97.1 95.0 100.2 96.8 100.2 100.9 100.0 96.0 100.0 97.4 97.8Jun 96.9 94.6 99.9 94.6 98.2 101.3 98.9 100.2 100.3 100.0 99.0 100.0 100.0 99.0Jul 98.3 97.2 99.9 100.0 99.3 100.2 99.6 100.2 99.8 100.0 99.0 100.0 100.0 99.9Aug 100.0 100.0 100.0 100.0 100.0 100.0 100.0 100.0 100.0 100.0 100.0 100.0 100.0 100.0Sep 98.7 96.5 100.9 100.0 101.2 100.6 100.3 100.3 103.7 100.0 100.0 100.9 99.8 99.8Oct 99.2 96.7 101.7 103.6 101.9 101.4 100.5 101.2 103.9 99.5 102.6 100.9 100.6 102.7Nov 99.3 96.3 102.4 103.8 102.6 101.5 102.5 102.1 104.1 99.5 104.3 100.9 100.7 106.4Dec 100.1 97.6 102.6 103.8 103.5 100.7 102.9 102.4 104.4 99.5 107.0 100.9 101.9 109.3
2013- Jan 101.0 98.5 103.5 103.8 103.7 101.7 102.9 103.1 104.8 99.4 108.3 112.4 102.5 109.7Feb 101.5 98.4 104.7 103.7 106.3 104.8 103.3 102.4 102.7 99.4 109.5 112.4 101.9 109.8Mar 101.9 98.9 104.9 106.3 107.5 104.9 103.6 102.4 102.6 99.4 109.9 112.4 99.4 110.2Apr 103.6 101.3 105.9 106.3 107.7 106.3 103.7 102.4 105.6 99.4 109.9 113.6 99.2 110.6May 102.7 99.2 106.2 106.3 108.1 106.4 103.7 102.4 105.7 99.4 110.5 116.5 99.5 112.7Jun 101.8 98.1 106.0 106.3 108.5 105.6 104.3 102.4 103.0 99.4 110.5 116.5 99.2 112.9Jul 105.3 104.3 107.0 109.0 112.5 105.9 104.5 102.4 103.7 99.8 110.5 116.5 99.1 113.2Aug 105.2 101.1 110.4 109.6 113.0 108.2 104.5 103.1 104.0 150.7 110.5 118.4 99.9 113.3Sep 104.0 98.4 111.0 108.9 113.1 108.7 104.5 103.1 105.2 150.7 110.5 118.4 99.9 115.4Oct 105.0 99.6 111.0 108.9 113.4 110.8 104.5 103.1 105.1 150.7 110.5 118.4 100.3 115.4Nov 105.2 99.7 111.5 108.9 113.9 111.1 104.5 103.1 106.5 151.2 110.5 118.4 100.3 115.5Dec 103.9 97.1 111.7 109.2 114.2 111.4 104.7 103.8 105.1 151.2 110.5 118.4 100.1 117.8
Notes: Please note that effective from September 2012, OCGS started to publish inflation rates basing on new CPI sub-groups weights using results of 2009/10 Househole Budget Survey and changed base period from December 2005=100 to August 2012=100.Q = Quarter
Source: Office of Chief Government Statistician (OCGS) - Zanzibar and BoT
Non- FoodBase: August 2012 = 100
55

1.0 Output and Prices
Table 1.21a: National consumer Price Index(Urban and Rural), Percentage Change on the Previous Year (New CPI)September 2010 = 100
General indexTotal Index Food
Alcohol & Tobacco
Clothing &
Footwear
Housing, Water,
Electricity, Gas and
Other Fuel
Furnishing, Housing
Equipment and Routine Maintanance of the House Health Transport
Communication
Recreation and
Culture Education
Restaurants and hotels
Miscel. Goods
&services
Food and Non Alcoholic beverages
combining food consumed at
home and food consumed in restaurants
Energy and Fuels -
combining electricity and other fuels for
use at home with petrol and diesel
All Items Less Food
(Non Food)
All Items Less Food
and Energy
Weight (%) 100 47.8 3.3 6.7 9.2 6.7 0.9 9.5 2.1 1.3 1.7 6.4 4.5 51 5.7 49 43.32010 5.52011 12.7 16.0 4.8 9.5 18.7 13.8 2.1 7.4 -1.5 3.0 4.1 8.1 5.5 15.1 28.3 9.7 7.12012 16.0 20.6 14.8 13.8 16.3 9.0 3.1 6.1 -1.2 9.9 4.6 16.6 9.8 20.2 21.7 10.7 8.8
2012-Jan 19.7 27.8 6.3 12.5 18.8 14.4 3.4 10.9 -0.4 4.5 2.9 12.8 9.1 26.2 30.1 11.8 9.0Feb 19.4 26.7 8.3 13.9 19.5 8.2 2.5 10.9 -0.8 8.7 4.8 15.8 12.1 25.5 33.5 11.8 8.7Mar 19.0 25.7 9.3 15.0 17.4 9.0 2.8 9.7 -0.7 9.1 4.8 18.2 12.3 24.9 29.4 11.5 8.8Apr 18.7 25.3 9.3 15.4 16.2 9.1 3.2 8.6 -0.7 9.1 4.7 18.8 2.6 24.7 24.9 11.2 9.0May 18.2 25.3 8.7 15.5 14.7 9.1 3.2 6.7 -0.7 9.2 4.7 17.5 13.2 24.5 21.2 10.5 8.7Jun 17.4 23.5 11.7 15.1 14.6 9.0 3.3 5.9 -0.9 11.7 4.7 17.8 13.1 22.9 20.5 10.5 8.8Jul 15.7 20.8 18.0 14.9 12.5 8.7 3.7 4.7 -1.6 11.9 4.7 16.1 10.8 20.3 16.3 10.0 8.8
Aug 14.9 18.8 20.4 14.4 14.4 8.6 3.3 3.8 -1.7 11.0 4.7 16.0 11.6 18.5 16.9 10.3 9.2Sep 13.5 15.6 20.3 13.4 16.5 8.3 3.0 1.7 -1.7 11.3 4.7 17.5 8.3 15.8 19.4 10.5 8.9Oct 12.9 14.9 20.3 12.4 17.4 7.9 2.3 2.7 -1.8 11.1 4.7 16.3 8.4 15.0 18.4 10.1 8.6Nov 12.1 13.4 21.3 12.0 17.3 8.4 2.9 2.3 -1.7 10.8 4.7 16.1 8.0 13.7 18.6 10.1 8.5Dec 12.1 13.1 22.8 11.6 17.1 8.2 3.4 3.2 -1.9 10.5 4.7 15.7 9.1 13.3 17.8 10.3 8.9
2013-Jan 10.9 11.9 23.0 9.8 15.3 7.2 2.9 2.7 -1.8 8.9 4.2 13.5 8.8 12.1 17.4 9.3 7.9Feb 10.4 12.0 18.9 7.9 16.3 6.1 3.0 2.5 -0.3 3.6 2.2 9.0 6.6 11.7 18.3 8.4 6.7Mar 9.8 11.1 17.4 6.4 20.4 5.1 3.7 1.3 -0.4 3.1 2.2 6.8 5.0 10.7 22.6 8.5 6.0Apr 9.4 10.2 17.7 5.8 19.9 4.6 3.2 4.2 -0.6 3.5 2.2 5.9 5.2 9.7 21.6 8.9 6.5May 8.3 8.0 18.0 5.3 19.0 4.4 3.0 7.5 -0.7 3.5 2.2 5.5 4.9 7.7 20.1 9.2 7.1Jun 7.6 7.6 15.0 5.2 15.4 4.0 2.9 7.1 -0.6 0.3 2.2 5.5 4.8 7.4 14.8 7.9 6.6Jul 7.5 8.0 12.0 5.2 14.4 3.8 2.7 7.5 -0.1 0.2 2.4 5.9 5.9 8.6 12.9 7.3 6.7
Aug 6.7 6.5 10.6 5.2 14.3 3.5 2.9 9.0 0.0 0.7 2.4 4.9 4.9 7.1 15.2 7.3 6.2Sep 6.1 6.5 10.4 4.9 9.6 3.2 2.9 7.8 0.0 0.4 2.4 2.2 6.5 6.9 9.6 6.0 5.8
2011-Q1 7.3 8.3 2.5 8.0 14.1 11.9 1.4 1.3 -1.1 3.6 2.7 4.2 3.0 7.9 16.4 6.6 5.3Q2 9.7 10.8 6.1 9.7 15.9 14.0 1.6 6.8 -2.1 3.0 3.0 6.4 3.4 10.3 25.2 9.0 6.7Q3 14.7 19.0 5.3 9.4 20.9 14.2 1.9 11.0 -1.5 2.3 5.0 8.8 4.5 17.9 32.4 10.8 7.6Q4 18.9 25.7 5.5 10.8 23.4 15.1 3.5 11.7 -1.5 2.9 5.7 13.2 7.8 24.4 39.2 12.5 8.7
2012-Q1 19.4 26.8 8.0 13.8 18.6 10.6 2.9 10.5 -0.6 7.5 4.2 15.6 11.2 25.5 31.0 11.7 8.8Q2 18.1 24.7 9.9 15.3 15.2 9.4 3.3 7.0 -0.8 10.0 4.7 18.0 13.1 24.0 22.2 10.8 8.8Q3 14.7 18.4 19.6 14.2 14.5 8.5 3.3 3.4 -1.7 11.4 4.7 16.5 10.2 18.2 17.6 10.3 9.0Q4 12.4 13.8 21.4 12.0 17.3 8.2 2.9 2.7 -1.8 10.8 4.7 16.1 8.5 14.0 18.2 10.2 8.7
2013-Q1 10.3 11.7 19.7 8.0 17.4 6.1 3.2 2.2 -0.9 5.1 2.8 9.7 6.8 11.5 19.5 8.8 6.8Q2 8.5 8.6 16.9 5.4 18.1 4.3 3.0 6.3 -0.6 2.4 2.2 5.6 5.0 8.3 18.8 8.7 6.8Q3 6.8 7.0 10.9 5.1 12.7 3.5 2.8 8.1 -0.1 0.4 2.4 4.3 5.8 7.5 12.5 6.9 6.2
Notes: Please note that from October 2010 National Bureau of Statistics has changed base period from December 2001=100 to September 2010=100. NCPI market basket weights have also been updated from 2001 to 2007 using results of 2007 Household Budget Survey.Q = Quarter
Source: National Bureau of Statistics.
Main Groups Other Selected Groups
56

1.0 Output and Prices
Table 1.21b: National consumer Price Index (Old CPI), Percentage Change on the Previous YearDecember 2001 = 100
General Food Non FoodPeriod Index Total Drinks & Clothing Rent Fuel, light Furniture Household Personal care Recreation Transpor- Educ- Miscel. goods
Tobacco & footwear & water & utensils operations & health & entertain. tation ation & servicesWeight 100.0 55.9 44.1 6.9 6.4 1.4 8.5 2.1 2.1 2.1 0.8 9.7 2.6 1.5
2005 4.4 5.9 2.9 2.1 -0.5 -0.4 7.7 -1.1 0.5 3.5 -1.5 4.7 -0.1 -1.4
2006 7.3 7.0 7.6 7.7 7.0 5.5 8.5 7.8 2.0 11.2 5.0 9.1 2.5 8.0
2007 7.0 7.0 7.0 10.5 5.9 3.6 6.1 7.9 8.6 2.9 8.9 7.0 9.6 0.8
2008 10.3 12.7 6.7 8.1 1.5 2.4 10.7 6.0 3.2 5.0 5.5 6.9 7.0 1.8
2009 12.1 17.6 3.7 8.8 6.3 12.4 -1.5 6.1 5.2 6.8 9.2 0.1 10.1 3.3
2006-Q1 7.7 8.3 6.8 5.6 7.9 8.5 7.3 4.7 -1.0 16.9 4.9 7.5 0.3 9.4
Q2 9.2 10.0 7.9 6.0 7.4 7.7 9.5 6.8 0.3 13.6 5.5 10.0 2.1 7.7
Q3 5.9 3.5 9.4 9.8 6.9 3.9 12.0 10.1 2.6 10.5 7.0 11.2 5.0 8.6
Q4 6.3 6.2 6.5 9.2 5.9 2.3 5.4 9.8 6.0 4.8 2.8 7.8 2.5 6.6
2007-Q1 7.2 6.3 8.4 11.7 6.5 5.6 7.9 10.6 10.5 2.1 7.4 9.2 11.6 -0.2
Q2 5.7 4.0 8.1 13.3 7.2 3.9 6.3 9.2 11.0 4.2 9.6 7.4 10.7 2.1
Q3 8.4 10.3 5.8 8.1 5.5 2.2 4.3 6.2 8.9 3.4 10.4 5.8 8.9 0.4
Q4 6.9 7.5 5.9 9.1 4.3 2.8 6.2 5.8 4.5 1.9 8.1 5.7 7.5 0.9
2008-Q1 8.9 10.9 5.8 9.9 0.8 2.1 8.4 4.6 3.1 3.4 4.4 5.5 5.6 1.6
Q2 9.4 11.4 6.6 7.9 1.1 2.1 11.2 5.2 2.7 3.7 4.1 6.8 6.3 0.7
Q3 10.3 11.9 7.8 8.5 1.1 3.0 13.2 6.8 2.2 5.9 5.5 8.5 7.8 2.2
Q4 12.5 16.5 6.7 6.4 2.8 2.4 9.9 7.2 4.7 7.1 8.0 6.6 8.3 2.6
2009-Q1 13.1 18.4 4.6 5.5 4.1 12.6 1.8 7.0 4.9 7.7 10.4 3.6 10.1 3.4
Q2 11.2 16.8 2.2 8.0 7.2 12.9 -7.2 7.0 5.0 7.9 9.7 -1.0 11.9 4.0
Q3 11.7 17.7 2.6 10.7 8.8 12.6 -5.7 6.6 5.3 7.2 8.8 -2.9 10.5 4.0
Q4 12.5 16.5 6.0 12.3 6.5 12.2 5.5 4.2 5.8 4.9 8.5 0.5 8.9 1.3
2010-Q1 9.8 10.4 8.8 11.1 5.1 2.7 19.9 2.4 5.2 4.7 4.6 3.6 5.7 -0.9
Q2 8.2 8.3 7.8 9.9 2.5 2.8 16.6 2.3 3.5 5.5 2.7 7.0 2.1 -4.9
Q3 5.8 5.5 6.3 6.9 0.6 1.9 14.4 2.4 4.1 4.2 0.1 6.6 0.0 -5.5Note: Q = QuarterSource: National Bureau of Statistics.
57

1.0 Output and Prices
Table 1.22: Zanzibar Consumer Price Index, Percentage Change on the Previous Year
Total Total Alcoholic Clothing Housing, Water, Furnishing, H/hold Health Transport Communication Recreation Education Restaurants MiscellaneousPeriod Index Beverages, Tobacco and electricity, Gas Equipments & Routine and and Hotels Goods &
and Narcotics Footwear & Other Fuels H/hold Maintenance Culture Services.Weights (%) 100 49.5 50.5 0.3 9.3 17.1 4.6 2.8 6.3 2.6 0.8 1.3 2.1 3.2
2008 20.5 24.1 16.6 8.0 8.3 21.8 13.1 18.0 19.1 -1.5 8.4 7.3 24.5 19.02009 9.2 10.1 6.6 17.4 6.7 11.6 8.2 8.8 -3.6 0.0 3.8 4.6 12.2 11.82010 6.1 6.2 6.2 25.6 5.5 4.5 3.7 12.1 4.4 0.1 5.6 13.0 16.0 3.92011 14.7 18.8 9.9 12.1 12.8 9.2 11.6 20.2 13.1 1.5 8.2 5.5 11.7 -8.62012 9.6 7.1 13.2 30.4 21.4 7.9 23.7 18.1 5.2 0.2 14.4 18.2 13.5 15.6
2012 - Jan 19.9 23.4 15.6 16.8 17.4 15.8 23.9 7.0 13.9 0.0 13.6 17.9 16.3 10.9Feb 17.4 18.6 16.1 15.9 23.1 14.1 25.3 12.6 11.3 0.3 12.9 17.9 16.3 12.9Mar 12.9 11.6 15.0 31.1 24.6 11.1 25.9 14.4 8.6 0.3 12.9 17.9 13.5 13.2Apr 9.9 7.0 14.2 30.6 24.3 8.6 26.2 15.2 6.4 0.3 15.4 17.9 15.4 14.0May 11.6 9.6 14.8 32.6 22.4 8.7 26.9 23.9 7.5 0.3 15.4 17.9 15.4 15.7Jun 9.0 4.8 15.4 29.2 25.7 8.9 29.4 23.9 2.4 0.3 19.1 17.9 18.5 17.1Jul 9.4 6.7 13.6 36.5 26.7 6.0 27.2 19.5 1.3 0.3 13.0 17.9 15.9 15.8
Aug 8.0 5.6 11.7 36.5 18.4 5.0 23.7 19.2 0.9 0.3 11.9 17.9 15.9 14.5Sep 5.6 1.0 11.6 35.2 18.6 5.7 20.8 19.6 3.1 0.3 11.9 18.9 11.6 14.2Oct 4.6 -0.4 11.0 37.7 18.9 5.1 18.8 20.7 3.2 -0.2 14.8 18.9 7.3 17.5Nov 4.2 -1.2 10.8 34.7 18.0 4.3 20.4 21.9 1.8 -0.2 14.2 18.9 7.2 21.2Dec 3.0 -2.0 9.2 27.4 18.3 1.4 16.5 19.9 1.9 -0.2 17.2 18.9 8.5 19.8
2013 - Jan 1.8 -3.6 8.9 28.2 18.2 1.1 12.8 20.7 4.9 -0.3 15.7 12.4 8.2 18.4Feb 2.4 -2.8 9.0 28.1 14.9 4.6 10.8 13.8 3.9 -0.6 16.9 12.4 7.6 17.9Mar 2.7 1.2 8.2 15.8 14.6 5.0 9.4 10.9 2.9 -0.6 17.4 12.4 3.8 16.2Apr 3.9 2.3 6.1 11.1 13.6 5.0 8.0 8.9 5.5 -0.6 13.9 12.9 1.8 14.8May 5.4 2.8 7.8 9.4 13.8 6.1 7.1 2.2 4.8 -0.6 15.1 16.5 2.1 15.2Jun 5.1 3.4 6.1 12.4 10.4 4.3 5.5 2.2 2.6 -0.6 11.6 16.5 -0.8 14.1Jul 7.1 7.3 7.1 9.0 13.3 5.6 4.9 2.2 3.9 -0.2 11.5 16.5 -0.9 13.3
Aug 5.2 1.1 10.4 9.6 13.0 8.2 4.5 3.1 4.0 50.7 10.5 18.4 -0.1 13.3Sep 5.4 15.0 -2.5 -2.3 11.8 8.1 4.2 2.8 1.5 50.7 10.5 17.4 0.1 15.6
2011 - Q1 9.1 11.2 6.8 12.6 7.7 5.6 6.3 21.5 9.0 1.6 6.4 5.5 11.7 -11.9Q2 14.5 19.4 8.7 18.2 10.1 8.4 8.3 19.8 12.9 1.6 5.7 5.5 10.1 -9.8Q3 16.1 20.8 10.5 5.0 15.6 9.5 13.2 23.9 14.0 1.6 10.8 5.5 8.7 -8.4Q4 19.1 23.8 13.7 12.4 17.9 13.0 18.7 15.5 16.3 1.1 10.0 5.5 16.2 -4.5
2012 - Q1 16.7 17.9 15.6 21.3 21.7 13.7 25.0 11.3 11.2 0.2 13.1 17.9 15.3 12.3Q2 10.2 7.1 14.8 30.8 24.2 8.7 27.5 21.0 5.4 0.3 16.7 17.9 16.5 15.6Q3 7.7 4.4 12.3 36.1 21.2 5.6 23.9 19.4 1.8 0.3 12.2 18.2 14.5 14.8Q4 3.9 -1.2 10.3 33.3 18.4 3.6 18.5 20.8 2.3 -0.2 15.4 18.9 7.7 19.5
2013 - Q1 2.3 -1.7 8.7 24.0 15.9 3.6 11.0 15.1 3.9 -0.5 16.7 12.4 6.5 17.5Q2 4.8 2.8 6.6 11.0 12.6 5.1 6.9 4.4 4.3 -0.6 13.5 15.3 1.1 14.7Q3 5.9 7.8 5.0 5.4 12.7 7.3 4.5 2.7 3.1 33.7 10.8 17.4 -0.3 14.1
Notes: Please note that effective from September 2012, OCGS started to publish inflation rates basing on new CPI sub-groups weights using results of 2009/10 Househole Budget Survey and changed base period from December 2005=100 to August 2012=100.Q = Quarter
Source: Office of Chief Government Statistician (OCGS) - Zanzibar and BoT
Non- FoodBase: August 2012 = 100
Food
58

1.0 Output and Prices
Base: 2001 = 100
Total Drinks & Clothing Rent Fuel, light Furniture Household Personal care Transpor- Recreation Educ- Miscel. goodsTobacco & footwear & water & utensils operations & health tation & entertain- ation & services
mentWeight 100.0 57.0 43.0 7.9 7.5 1.2 6.9 1.3 2.0 2.1 10.7 1.0 1.7 0.6
2004 114.6 116.3 112.4 110.5 106.8 111.9 139.2 103.7 109.1 102.3 106.0 104.6 102.8 119.5
2005 123.7 127.8 118.3 107.2 105.0 119.3 162.9 110.7 105.8 106.6 114.3 114.0 108.0 122.9
2006 135.0 135.6 134.3 122.7 111.0 132.8 196.6 133.1 109.9 115.7 133.6 114.3 117.1 115.4
2007 150.2 149.0 151.9 142.6 129.3 146.1 219.8 147.4 120.1 116.9 150.9 117.8 152.3 106.0
2008 173.6 173.6 173.8 164.5 121.0 197.9 275.0 169.6 148.7 131.0 172.1 128.3 173.9 105.7
2009 202.1 208.9 193.2 191.1 131.3 227.8 288.6 179.1 167.1 167.3 194.4 132.1 197.1 113.0
2007-Mar 143.2 142.5 144.2 133.3 118.8 146.1 215.8 144.2 113.6 117.4 140.0 114.4 143.4 106.3
Jun 148.7 148.7 148.7 142.8 128.9 146.1 215.1 148.8 112.6 117.8 142.0 118.1 151.7 106.3
Sep 152.3 149.4 156.0 144.2 134.0 146.1 227.2 148.6 120.2 114.7 157.4 119.3 157.8 106.1
Dec 156.8 155.3 158.8 150.1 135.4 146.1 221.2 148.1 133.8 117.9 164.0 119.5 156.4 105.3
2008-Mar 166.5 166.4 167.6 160.5 122.7 195.1 259.4 163.5 130.5 125.9 165.7 124.2 168.4 103.9
Jun 171.4 173.8 168.0 160.8 119.1 195.1 266.9 167.7 140.7 128.2 162.1 129.0 165.4 104.0
Sep 175.7 174.0 177.9 165.5 120.3 197.9 286.6 172.0 157.8 132.2 176.7 129.5 182.7 106.9
Dec 180.8 180.1 181.8 171.2 121.7 203.5 287.1 175.0 165.8 137.5 183.9 130.6 179.2 107.8
2009-Mar 191.1 194.7 186.5 183.2 125.7 206.6 275.9 178.4 168.5 155.5 192.1 132.1 183.1 109.4
Jun 196.7 202.1 189.5 189.1 128.3 206.6 276.2 179.9 169.9 156.2 196.5 135.1 184.9 109.3
Sep 206.9 214.8 196.6 195.8 134.3 227.8 295.3 179.6 172.9 170.3 195.1 131.5 203.3 114.4
Dec 213.8 224.0 200.4 196.2 136.8 270.1 306.8 178.6 157.2 187.4 193.8 129.7 217.2 118.9Note: * People with monthly incomes between TZS 17,500/= and TZS 40,000/=Source: National Bureau of Statistics.
Table 1.23a: Dar es Salaam Cost of Living Index - Middle Income Group* (Old Version)
Non Food
Period General Index
Food
59

1.0 Output and Prices
Base: 2001 = 100
2010 99.3 75.8 98.0 99.3 97.9 98.6 100.0 99.6 99.8 98.5 100.0 99.3 100.2
2011 107.1 108.7 102.9 104.8 110.3 106.5 104.1 103.3 100.1 102.0 99.7 100.3 106.6
2012 124.9 129.6 115.7 122.8 131.3 114.9 112.3 112.3 101.0 114.8 117.6 111.6 118.8
2010-Mar 97.9 98.0 97.4 98.3 95.4 98.3 100.0 99.3 99.6 97.2 100.0 98.7 100.5
Jun 99.0 99.0 96.3 99.1 96.6 97.7 100.0 99.3 99.5 96.9 100.0 98.8 100.2
Sep 99.8 6.0 97.9 99.7 99.0 98.9 100.0 99.6 100.0 100.1 100.0 99.7 100.3
Dec 100.5 100.0 100.2 100.1 100.6 99.6 100.0 100.1 100.0 99.8 100.0 100.0 99.8
2011 - Mar 104.1 105.4 101.1 102.7 105.5 103.3 102.5 102.2 100.0 100.6 99.6 99.0 102.3
Jun 106.1 107.0 101.9 105.3 110.0 106.7 104.5 103.3 100.0 101.9 99.4 100.2 106.0
Sep 107.7 108.9 103.7 105.4 112.3 107.5 104.7 103.5 100.1 102.2 99.8 100.9 108.4
Dec 110.4 113.3 104.7 105.9 113.2 108.3 104.7 104.3 100.3 103.1 99.9 101.0 109.6
2012 - Mar 120.2 125.0 110.5 117.8 125.0 109.9 107.7 107.1 100.6 107.9 109.6 107.2 114.8
Jun 125.0 129.8 114.5 121.6 131.6 115.3 112..9 113.9 101.0 114.5 117.4 110.9 118.2
Sep 126.7 131.4 118.1 124.2 133.3 116.8 114.0 114.3 101.1 118.3 120.6 113.4 120.0
Dec 127.7 132.2 119.5 127.6 135.3 117.6 115.1 113.7 101.2 118.6 122.8 114.7 122.1Note: * People with monthly incomes between TZS 17,500/= and TZS 40,000/=Source: National Bureau of Statistics.
PeriodGeneral Index
Table 1.23b: Dar es Salaam Cost of Living Index - Middle Income Group* (New Version)
Food and Non
Alcoholic beverages
Alcohol and
Tobacco
Clothing &
Footwear
Housing, Energy and
Water
Furniture, Housing Equipment and
Routine Maintanance of the House Health
Transportation
Communication
Recreation and
Entertainment EducationRestaurants and hotels
Miscel. Goods
& Services
60

1.0 Output and Prices
Base: 2001 = 100Period General Food
Index Total Drinks & Clothing Rent Fuel, light Furniture Household Personal care Transpor- Recreation Educ- Miscel. goodsTobacco & footwear & water & utensils operations & health tation & entertain- ation & services
mentWeights 100.0 67.52 32.5 2.5 4.1 0.8 10.4 0.6 1.8 1.3 8.6 0.8 1.2 0.3
2004 116.8 117.1 116.1 123.2 111.9 111.9 133.2 113.0 102.2 118.5 100.9 103.7 111.2 103.4
2005 126.5 125.7 128.0 120.0 108.7 113.6 162.3 115.7 110.0 113.6 109.8 110.4 115.0 121.1
2006 141.1 138.6 146.2 141.8 108.0 132.8 193.7 115.4 109.6 118.8 134.0 113.6 93.8 139.3
2007 154.0 151.2 159.8 159.5 124.6 146.1 209.1 131.7 119.1 115.0 148.5 114.9 104.0 128.4
2008 180.9 174.6 192.2 175.0 139.3 199.3 269.8 160.5 138.4 134.1 179.3 110.9 99.3 137.3
2009 211.3 208.5 217.2 201.8 206.6 276.6 152.8 173.3 167.1 163.8 225.9 124.7 111.3 147.7
2006-Mar 137.0 135.2 140.7 130.2 107.7 129.9 179.6 114.4 108.4 119.8 133.0 117.6 98.0 149.7
Jun 141.7 139.7 146.0 137.6 106.1 132.8 195.0 114.6 108.9 119.9 133.8 114.1 89.9 148.4
Sep 140.9 137.4 148.3 148.6 106.8 134.3 199.1 116.3 110.0 117.8 134.5 112.9 91.2 129.0
Dec 144.6 142.0 149.9 150.9 111.4 134.3 201.1 116.3 111.0 117.8 134.7 109.7 96.1 130.1
2007-Mar 150.8 150.0 152.6 156.6 117.0 146.1 203.0 122.7 112.9 117.7 135.6 110.3 99.7 125.9
Jun 151.1 150.1 153.1 158.4 124.0 146.1 199.8 133.6 112.6 117.0 135.7 115.7 105.2 128.8
Sep 153.6 148.3 164.7 159.3 124.2 146.1 217.1 133.5 123.7 110.6 156.2 118.1 107.3 130.4
Dec 160.5 156.5 168.9 163.8 133.2 146.1 216.5 137.0 127.4 114.7 166.4 115.4 103.6 128.6
2008-Mar 170.7 167.2 178.1 169.6 145.2 195.1 234.7 160.7 122.2 126.2 166.5 102.9 98.8 132.1
Jun 177.1 172.8 185.9 171.4 149.6 195.1 252.9 172.2 134.1 132.2 166.4 107.8 98.0 142.1
Sep 182.2 173.1 201.3 178.0 136.2 203.5 283.5 163.4 146.7 136.1 187.4 112.1 102.2 141.3
Dec 191.4 185.4 203.6 181.0 134.4 203.5 280.4 168.2 150.6 141.7 197.0 120.1 101.8 142.5
2009-Mar 202.0 198.3 210.1 200.2 142.7 206.6 267.8 171.8 168.6 152.3 219.0 121.7 109.0 177.3
Jun 205.9 202.6 212.7 205.8 145.8 206.6 264.4 171.8 170.2 157.3 229.6 121.7 109.5 148.2
Sep 214.1 210.3 222.2 216.1 156.3 206.6 284.2 174.9 170.7 171.4 230.1 126.7 112.6 147.3
Dec 223.2 222.9 223.9 220.9 166.5 206.6 289.9 174.9 158.7 174.3 225.2 128.6 114.0 148.1Note: * People with Monthly incomes up to TZS 17,500/=.Source: National Bureau of Statistics.
Table 1.24a: Dar es Salaam Retail Price Index - Wage earners* (Old Version)
Non Food
61

1.0 Output and Prices
Base: 2001 = 100
2010 98.56 98.83 97.54 97.30 99.24 101.33 96.67 92.59 99.95 101.17 99.77 99.03 97.87
2011 105.87 105.82 102.94 114.13 106.44 109.87 100.46 106.51 99.99 100.15 99.88 104.54 106.96
2012 125.74 130.39 111.38 125.82 124.72 113.18 107.15 121.15 100.27 120.35 100.47 114.50 118.28Note: * People with Monthly incomes up to TZS 17,500/=.Source: National Bureau of Statistics.
Communication
Recreation and
Entertainment EducationRestaurants and hotels
Miscel. Goods
& Services
Table 1.24b: Dar es Salaam Retail Price Index - Wage earners* (New Version)
PeriodGeneral Index
Food and Non
Alcoholic beverages
Alcohol and
Tobacco
Clothing &
Footwear
Housing, Energy and
Water
Furniture, Housing Equipment and
Routine Maintanance of the House Health
Transportation
62

2.0 Government Finance
Table 2.1: Analysis of Central Government Finance, Tanzania MainlandMillions of TZS
2011/12 2012/13 Annual Budget Jul - Sep Oct - Dec Jul - Sep Oct - Dec r
1. Total Revenue (A+ B) 9,076,504.3 9,821,329.4 13,927,688.4 3,715,853.8 3,376,779.0 2,820,480.6 2,741,647.5A. Recurrent Revenue 7,221,408.6 8,442,611.2 11,537,522.6 2,795,888.8 2,944,502.2 2,179,318.1 2,406,794.2
Tax revenue 6,480,477.8 7,729,985.9 10,395,439.8 2,488,077.9 2,672,129.0 1,985,683.5 2,208,473.1Taxes on Imports 2,555,535.8 2,915,214.6 4,124,002.8 1,027,345.4 1,034,105.7 821,023.3 905,088.3Income taxes 1,336,916.4 1,466,562.2 2,063,220.5 468,740.0 550,448.0 387,258.8 406,701.6Taxes on Local Goods and Service 2,246,783.7 3,019,555.7 3,656,505.6 855,881.6 944,133.7 687,669.3 793,254.8Other taxes 341,241.8 328,653.3 551,711.0 136,110.9 143,441.6 89,732.1 103,428.4
Non - tax revenue 545,406.4 491,790.4 758,630.9 211,947.9 205,917.0 107,424.1 122,139.2LGA Own Sources 195,524.5 220,835.0 383,451.8 95,863.0 66,456.2 86,210.5 76,181.9Drawing from EPA 0.0 0.0 0.0 0.0 0.0 0.0 0.0
B. Grants 1,855,095.6 1,378,718.2 2,390,165.8 919,965.1 432,276.8 641,162.5 334,853.3
2.Total expenditure/1 10,764,528.4 12,714,236.4 16,710,973.1 4,172,647.0 4,375,490.3 2,777,284.3 3,256,157.9Recurrent expenditure 6,989,806.6 9,043,323.0 11,065,984.0 2,849,629.8 2,752,473.1 2,075,956.5 2,342,632.1
Current payments 6,553,489.6 8,276,575.1 10,068,293.1 2,581,610.8 2,530,284.7 1,847,506.6 2,094,844.7Interest payments 436,317.1 766,747.8 997,690.8 268,019.0 222,188.4 228,449.8 247,787.4
Development expenditure 3,774,721.7 3,670,913.5 5,644,989.1 1,323,017.2 1,623,017.2 701,327.8 913,525.8
3. Surplus(+) / Deficit(-) [ 1-2 ] -1,688,024.1 -2,892,907.0 -2,783,284.7 -456,793.2 -998,711.3 43,196.4 -514,510.44. Adjustment to cash and other items (net) -198,538.6 439,983.1 0.0 0.0 0.0 152,042.4 129,342.55. Expenditure Float -183,562.4 -351,395.3 0.0 0.0 0.0 -610,630.4 0.06. Overall balance [3+4+5] -2,070,125.1 -2,804,319.3 -2,783,284.7 -456,793.2 -998,711.3 -415,391.6 -385,167.9
7.Total Financing 2,070,124.1 2,804,319.3 2,783,284.7 456,793.2 998,711.3 415,391.6 385,167.9Foreign (net): 1,735,260.4 1,734,998.0 2,231,000.2 341,213.1 698,914.4 316,355.8 101,879.0
Loans 1,815,757.6 1,861,661.1 2,621,433.7 370,289.1 799,057.4 335,420.4 159,516.7Program 246,849.8 357,480.9 386,221.0 100,586.0 0.0 24,101.3 96,203.5Development project 1,396,695.9 1,317,844.4 2,000,860.9 211,115.2 740,469.4 251,038.6 0.0
o/w: Non-Concessinal Borrowing 801,281.6 1,063,006.0 1,156,400.0 0.0 529,354.2 126,252.5 0.0Basket Support 172,211.8 186,335.8 234,351.8 58,588.0 58,588.0 60,280.5 63,313.2
Amortization -80,497.1 -126,663.1 -390,433.5 -29,076.0 -100,143.0 -19,064.6 -57,637.7Domestic (net): 334,863.7 1,069,321.3 552,284.5 115,580.1 299,797.0 99,035.7 283,288.9
Domestic 334,863.7 1,069,321.3 552,284.5 115,580.1 299,797.0 99,035.7 283,288.8Domestic Bank borrowing 71,249.5 667,929.9 552,284.5 115,580.1 299,797.0 96,071.0 194,744.2Domestic non-bank borrowing 263,614.1 401,391.4 0.0 0.0 0.0 2,964.8 88,544.6
Amortization of continget debt 0.0 0.0 0.0 0.0 0.0 0.0 0.0 Privatization Fund 0.0 0.0 0.0 0.0 0.0 0.0 0.0
Borrowing/Roll over 1,326,851.5 1,734,534.6 1,147,576.0 281,201.2 328,245.2 321,901.5 875,722.5Domestic amortisation/Rollover -1,326,851.5 -1,734,534.6 -1,147,576.0 -281,201.2 -328,245.2 -321,901.5 -875,722.4
Note: P = Provisional, r = revised /1 = Exclude amortization and Expenditure Float, includes Road fund and Retention expenditures
Source: Ministry of Finance and Bank of Tanzania
Item
Actuals Estimates2013/14
Actuals
63

2.0 Government Finance
Table 2.2: Government OperationsMillions of TZS
2011/12 2012/13 Annual Budget Jul - Sep Oct - Dec Jul - Sep Oct - Dec r
Total Revenue 7,221,408.6 3,670,913.5 11,537,522.6 1,323,017.2 1,623,017.2 2,179,318.1 2,406,794.2Tax Revenue 6,480,477.8 7,729,985.9 10,395,439.8 2,488,077.9 2,672,129.0 1,985,683.5 2,208,473.1
Taxes on Imports 2,555,535.8 2,915,214.6 4,124,002.8 1,027,345.4 1,034,105.7 821,023.3 905,088.3Taxes on Local Goods and Services 1,336,916.4 1,466,562.2 2,063,220.5 468,740.0 550,448.0 387,258.8 406,701.6Income Taxes 2,246,783.7 3,019,555.7 3,656,505.6 855,881.6 944,133.7 687,669.3 793,254.8Other taxes 341,241.8 328,653.3 551,711.0 136,110.9 143,441.6 89,732.1 103,428.4
Non- tax Revenue 545,406.4 491,790.4 758,630.9 211,947.9 205,917.0 107,424.1 122,139.2LGA Own Resources 195,524.5 220,835.0 383,451.8 95,863.0 66,456.2 86,210.5 76,181.9Drawing from EPA 0.0 0.0 0.0 0.0 0.0 0.0 0.0
Total Expenditure/1 10,764,528.4 12,714,236.4 16,710,973.1 4,172,647.0 4,375,490.3 2,777,284.3 3,256,157.9 Recurrent expenditure 6,989,806.6 9,043,323.0 11,065,984.0 2,849,629.8 2,752,473.1 2,075,956.5 2,342,632.1
Interest payments 436,317.1 766,747.8 997,690.8 268,019.0 222,188.4 228,449.8 247,787.4 Domestic 2/ 345,125.7 589,595.0 620,264.8 187,289.0 167,090.8 159,408.2 206,118.9 Foreign 91,191.4 177,152.8 377,426.0 80,730.1 55,097.6 69,041.7 41,668.5 Wages and salaries 3,177,090.5 3,868,713.7 4,763,196.0 1,118,968.0 1,214,742.7 1,102,095.0 1,125,017.8 Other goods, services and transfers 3,376,399.0 4,407,861.4 5,305,097.1 1,462,642.8 1,315,542.0 745,411.6 969,826.9
of which: Retention fund 145,734.1 Dev. Expenditure and net lending 3,774,721.7 3,670,913.5 5,644,989.1 1,323,017.2 1,623,017.2 701,327.8 913,525.8
Local 1,872,311.7 2,314,717.9 2,952,920.2 650,000.0 950,000.0 241,850.8 644,095.2 Foreign 1,902,410.0 1,356,195.6 2,692,068.9 673,017.2 673,017.2 459,477.0 269,430.6
Balance (cheques issued) before Grants -3,543,119.7 -4,271,625.2 -5,173,450.5 -1,376,758.3 -1,430,988.1 -597,966.2 -849,363.7
Grants 1,855,096.6 1,378,718.2 2,390,165.8 919,965.1 432,276.8 641,162.5 334,853.3 Program (CIS/OGL) 720,312.8 537,473.7 776,909.6 516,651.0 28,962.7 366,752.1 128,735.8 Project 833,631.7 565,205.4 1,347,186.2 336,796.5 336,796.5 262,974.6 88,087.3
of which: MCA(T) - USA 221,601.0 219,990.7 394,773.2 98,693.3 98,693.3 213,612.2 0.0 MDF funds / Basket Support funds 301,152.2 276,039.0 266,070.0 66,517.5 66,517.5 11,435.8 118,030.2 MDRI (IMF) 0.0 0.0 0.0 0.0 0.0 0.0 0.0
Balance (cheques issued) after grants -1,688,023.1 -2,892,907.0 -2,783,284.7 -456,793.2 -998,711.3 43,196.4 -514,510.4Adjustments to cash and other items (net) -198,538.6 439,983.1 0.0 0.0 0.0 152,042.4 129,342.5Expenditure Float -183,562.4 -351,395.3 0.0 0.0 0.0 -610,630.4 0.0Overall balance (cheques cleared) -2,070,124.1 -2,804,319.3 -2,783,284.7 -456,793.2 -998,711.3 -415,391.6 -385,167.9
Financing 2,070,124.1 2,804,319.3 2,783,284.7 456,793.2 998,711.3 415,391.6 385,167.9Foreign Financing (net) 1,735,260.4 1,734,998.0 2,231,000.2 341,213.1 698,914.4 316,355.8 101,879.0
Loans 1,815,757.6 1,861,661.1 2,621,433.7 370,289.1 799,057.4 335,420.4 159,516.7Program loans 246,849.8 357,480.9 386,221.0 100,586.0 0.0 24,101.3 96,203.5Development Project loans 1,396,695.9 1,317,844.4 2,000,860.9 211,115.2 740,469.4 251,038.6 0.0
o/w: Non-Concessinal Borrowing 801,281.6 1,063,006.0 1,156,400.0 0.0 529,354.2 126,252.5 0.0 Basket Support 172,211.8 186,335.8 234,351.8 58,588.0 58,588.0 60,280.5 63,313.2
Amortization -80,497.1 -126,663.1 -390,433.5 -29,076.0 -100,143.0 -19,064.6 -57,637.7Domestic (net) 334,863.7 1,069,321.3 552,284.5 115,580.1 299,797.0 99,035.7 283,288.9Banks and Non-Bank Financing(NDF) 334,863.7 1,069,321.3 552,284.5 115,580.1 299,797.0 99,035.7 283,288.8
Bank borrowing 71,249.5 667,929.9 552,284.5 115,580.1 299,797.0 96,071.0 194,744.2Non-Bank (net of amortization) 263,614.1 401,391.4 0.0 0.0 0.0 2,964.8 88,544.6
Borrowing/Roll over 1,326,851.5 1,734,534.6 1,147,576.0 281,201.2 328,245.2 321,901.5 875,722.5Amortization of contingent debt 0.0 0.0 0.0 0.0 0.0 0.0 0.0Domestic amortisation/Rollover -1,326,851.5 -1,734,534.6 -1,147,576.0 -281,201.2 -328,245.2 -321,901.5 -875,722.4Privatization Proceeds 0.0 0.0 0.0 0.0 0.0 0.0 0.0Notes: /1 Exclude amortization and Expenditure Float, includes Road fund and Retention expenditures /2 Domestic Interest payments and amortization include Cash and Non cash r = Revised
P = ProvisionalSource: Ministry of Finance, Bank of Tanzania and National Bureau of Statistics.
ItemActuals Actual
64

2.0 Government FinanceTable 2.3: Zanzibar Central Goverment O perations
Jul-Sep O ct-Dec Jan-Mar Apr-June Annual Budget
Jul-Sep O ct-Dec Jul-SepP O ct-DecP
Total Revenue 62.7 68.6 69.8 63.4 350.3 75.9 87.7 73.4 83.8 95.6Tax Revenue 59.0 64.4 64.4 59.1 322.0 70.0 80.4 68.6 79.3 98.6T ax on Imports 18.0 16.0 15.7 14.2 98.8 24.8 24.7 18.9 23.5 95.1VAT and Excise Duties (local) 14.2 17.3 20.2 16.1 76.9 16.5 20.6 18.4 21.8 105.5 Income T ax 14.4 15.6 12.0 17.3 75.1 10.8 12.5 10.4 12.5 100.4 Other Taxes 12.4 15.5 16.5 11.5 71.2 18.0 22.6 20.8 21.5 95.2Non-Tax Revenue 3.7 4.2 5.4 4.3 28.2 5.8 7.3 4.8 4.5 61.9
Total Expenditure 119.9 108.9 98.2 106.9 672.0 116.8 131.0 97.9 124.4 95.0Recurrent Expenditure 71.8 67.5 66.3 72.0 353.1 71.2 93.7 71.8 89.8 95.8 Wages and Salaries 32.6 33.1 33.0 34.1 155.5 36.0 40.4 36.1 41.3 102.3 Interest Payment (Public Debt) 0.0 0.0 0.0 0.0 0.0 0.0 0.0 0.0 0.0
Local 0.0 0.0 0.0 0.0 0.0 0.0 0.0 0.0Foreign 0.0 0.0 0.0 0.0 0.0 0.0 0.0 0.0 0.0
Other Expenditure 39.2 34.4 33.2 37.9 197.6 35.1 53.3 35.7 48.4 90.9
Development Expenditure 48.1 41.4 31.9 35.0 318.9 45.7 37.3 26.1 34.7 92.9local 2.4 13.2 5.1 5.4 70.0 7.1 8.5 4.4 7.1 83.8foreign 45.7 28.2 26.8 29.5 248.9 38.6 28.8 21.7 27.5 95.6
O verall Surplus/ Deficit before -57.2 -40.3 -28.4 -43.5 -321.7 -40.9 -43.3 -24.5 -40.6 93.8grants Grants 37.8 21.2 14.7 12.5 115.8 25.0 20.8 23.1 21.8 104.7
4.5% Budget Support 10.6 6.6 2.1 1.6 26.5 7.8 2.9 13.5 4.6 158.7Debt relief 0.0 0.0 0.0 0.0 2.5 0.2 0.0 0.0 0.0Project grant 27.1 14.6 12.6 10.9 86.8 17.0 17.9 9.5 17.2 95.9
O verall Surplus/Deficit after grants -19.4 -19.1 -13.7 -31.0 -205.9 -15.9 -22.6 -1.5 -18.9 83.7Adjustment to cash and other items 0.9 5.5 -0.5 12.3 0.0 0.0 0.0 -10.7 8.5O verall Deficit cheques Cleared -18.6 -13.6 -14.2 -18.7 -206.0 -23.2 -8.0 -12.1 -10.4 129.1
Financing 18.6 13.6 14.2 18.7 206.0 23.2 8.0 12.1 10.4 129.1Foreign 18.6 13.6 14.2 18.7 162.1 19.6 8.0 12.1 10.4 129.1 Import Support 0.0 0.0 0.0 0.0 0.0 0.0 0.0 0.0 0.0 Program Loans 18.6 13.6 14.2 18.7 162.1 19.6 8.0 12.1 10.4 129.1 Amortizat ion (foreign) 0.0 0.0 0.0 0.0 0.0 0.0 0.0 0.0 0.0Domest ic (net) 0.0 0.0 0.0 0.0 43.9 3.7 0.0 0.0 0.0 Bank 0.0 0.0 0.0 0.0 18.9 0.0 0.0 0.0 0.0 Non-bank 0.0 0.0 0.0 0.0 25.0 3.7 0.0 0.0 0.0 Amortizat ion (local) 0.0 0.0 0.0 0.0 0.0 0.0 0.0 0.0 0.0
GDP TZS 1,354.0 billion (2012p current mkt prices)p: provisional Source: Ministry of Finance, Zanzibar.
Item Actual Estimates Actual Actual versus Estimate
2012/13 2013/14
65

2.0 Government Finance
Table 2.4. Treasury Bills Auction - Actual Sales by TransactorMillions of TZS
PeriodAuction Cumulative Auction Cumulative Auction Cumulative Auction Cumulative Auction Cumulative Auction Cumulative Auction Cumulative
2009 2,899,559.9 18,919,245.5 16,228.7 35,532.0 2,048,808.4 13,170,360.6 70,072.7 157,691.2 702,130.1 2,949,435.8 33,856.4 43,274.0 28,463.6 1,989,188.42010 3,074,995.9 21,994,241.4 5,400.0 40,932.0 2,616,627.5 15,786,988.1 102,146.5 259,837.7 246,742.2 3,196,178.0 84,634.2 127,908.2 19,445.5 2,008,633.92011 2,280,706.9 24,274,948.3 0.0 40,932.0 1,833,319.8 17,620,307.9 99,049.2 358,886.9 186,531.4 3,382,709.4 140,190.2 268,098.5 21,616.2 2,030,250.12012 2,877,986.7 27,152,934.9 23,743.6 64,675.5 2,233,942.2 19,854,250.1 30,256.0 389,142.8 347,960.1 3,730,669.5 207,794.4 475,892.8 34,290.5 2,064,540.62013 4,147,869.6 31,300,804.6 19,450.0 84,125.5 3,067,288.1 22,921,538.2 57,750.0 366,170.5 578,589.7 1,054,482.6 58,621.4 2,123,162.0
2012 - Jan 168,044.0 24,442,992.3 0.0 40,932.0 117,133.9 17,737,441.8 1,512.0 763,257.5 41,044.0 3,606,774.8 6,878.0 274,976.5 1,476.1 2,031,726.2Feb 316,740.3 24,759,732.6 0.0 40,932.0 288,881.5 18,026,323.3 3,893.1 767,150.6 3,534.3 3,610,309.1 19,065.1 294,041.5 1,366.3 2,033,092.5Mar 312,266.8 25,071,999.3 0.0 40,932.0 204,315.2 18,230,638.5 50.3 767,200.9 65,539.4 3,675,848.5 41,595.0 335,636.5 766.9 2,033,859.4Apr 95,208.8 25,167,208.1 0.0 40,932.0 57,800.2 18,288,438.7 300.0 767,500.9 25,475.0 3,701,323.5 8,661.0 344,297.5 2,972.6 2,036,832.0May 110,907.3 25,278,115.4 0.0 40,932.0 84,383.5 18,372,822.2 1,202.5 768,703.3 3,910.1 3,705,233.6 16,493.5 360,791.0 4,917.8 2,041,749.8Jun 190,801.8 25,468,917.3 0.0 40,932.0 77,080.6 18,449,902.7 600.0 769,303.3 109,405.7 3,814,639.3 3,561.7 364,352.7 153.8 2,041,903.7Jul 250,992.2 25,719,909.5 0.0 40,932.0 199,107.3 18,649,010.0 0.0 769,303.3 9,242.4 3,823,881.7 34,550.8 398,903.5 8,091.8 2,049,995.4
Aug 372,839.6 26,092,749.1 11,498.0 52,430.0 307,867.6 18,956,877.6 3,180.0 772,483.3 10,900.0 3,834,781.7 30,663.8 429,567.3 8,730.2 2,058,725.6Sep 248,419.6 26,341,168.6 1,000.0 53,430.0 196,923.0 19,153,800.6 0.0 772,483.3 5,170.0 3,839,951.7 44,825.6 474,392.8 501.0 2,059,226.6Oct 230,790.5 26,571,959.1 4,000.0 57,430.0 217,269.0 19,371,069.6 2,280.0 774,763.3 3,691.0 3,843,642.7 0.0 474,392.8 3,550.5 2,062,777.1Nov 318,738.8 26,890,697.9 7,245.5 64,675.5 269,938.6 19,641,008.2 10,700.0 785,463.3 28,944.5 3,872,587.2 1,000.0 475,392.8 910.1 2,063,687.3Dec 262,237.1 27,152,935.0 0.0 64,675.5 213,241.9 19,854,250.1 6,538.1 792,001.4 41,103.7 3,913,690.9 500.0 475,892.8 853.4 2,064,540.6
2013 - Jan 432,394.5 27,585,329.4 1,000.0 65,675.5 238,956.0 20,093,206.2 5,000.0 797,001.4 10,419.7 3,924,110.7 175,556.0 651,448.8 1,462.7 2,066,003.3Feb 581,545.7 28,166,875.1 0.0 65,675.5 447,395.1 20,540,601.2 10,400.0 807,401.4 55,231.8 3,979,342.4 68,281.0 719,729.9 237.9 2,066,241.2Mar 303,739.8 28,470,614.9 4,000.0 69,675.5 215,803.4 20,756,404.6 7,040.0 814,441.4 29,365.0 4,008,707.4 46,057.4 765,787.2 1,474.0 2,067,715.2Apr 208,070.6 28,678,685.5 0.0 69,675.5 164,207.5 20,920,612.1 3,200.0 817,641.4 28,130.0 4,036,837.4 7,030.0 772,817.2 5,503.1 2,073,218.3May 321,118.4 28,999,803.9 350.0 70,025.5 273,923.7 21,194,535.8 3,260.0 820,901.4 28,027.2 4,064,864.6 9,402.1 782,219.3 6,155.4 2,079,373.7Jun 235,903.3 29,235,707.2 1,500.0 71,525.5 148,415.0 21,342,950.8 1,380.0 822,281.4 62,361.5 4,127,226.1 12,778.4 794,997.7 9,468.4 2,088,842.1Jul 186,713.9 29,422,421.1 0.0 71,525.5 151,850.0 21,494,800.8 300.0 822,581.4 3,192.6 4,130,418.7 25,454.5 820,452.2 5,916.9 2,094,759.0
Aug 598,104.2 30,020,525.3 4,100.0 75,625.5 408,092.1 21,902,892.9 9,980.0 832,561.4 23,532.6 4,153,951.3 138,262.2 958,714.4 14,137.2 2,108,896.2Sep 321,910.0 30,342,435.3 0.0 75,625.5 197,046.7 22,099,939.6 8,960.0 841,521.4 27,977.5 4,181,928.9 82,024.1 1,040,738.6 5,901.6 2,114,797.8Oct 272,879.4 30,615,314.7 8,500.0 84,125.5 230,597.0 22,330,536.6 600.0 842,121.4 27,046.6 4,208,975.5 2,650.0 1,043,388.6 3,485.8 2,118,283.6Nov 435,115.4 31,050,430.1 0.0 84,125.5 372,074.0 22,702,610.6 1,650.0 843,771.4 48,152.4 4,257,127.8 9,644.0 1,053,032.6 3,595.1 2,121,878.7Dec 250,374.5 31,300,804.6 0.0 84,125.5 218,927.6 22,921,538.2 5,980.0 849,751.4 22,733.6 4,279,861.4 1,450.0 1,054,482.6 1,283.3 2,123,162.0
Source: Bank of Tanzania
Official Private SectorMoney Banks Institutions Institutions Entities
Total Bank of Tanzania Deposit Other Banking Other Financial
66

2.0 Government Finance
Table 2.5 : Central Government Outstanding Stocks, Bonds and Notes by Holders
Millions of TZSEnd Bank Deposit Other Other Official Private Others Totalof of Money banks Financial Entities Sector
period Tanzania banks Institutions
2009 988,519.9 571,501.1 58,393.6 570,888.5 19,819.5 13,386.5 0.0 2,222,509.1
2010 981,219.9 989,749.0 61,605.8 671,526.7 4,075.9 9,308.5 0.0 2,717,485.8
2011 979,029.5 1,361,497.4 79,380.1 839,009.2 14,016.0 13,990.1 0.0 3,286,922.4
2012 1,446,323.9 1,647,863.4 65,821.7 941,323.9 14,181.0 15,914.7 0.0 4,131,428.7
2013
2009-Mar 620,081.6 412,230.4 48,494.4 505,697.2 28,373.5 12,382.2 0.0 1,627,259.3
Jun 897,003.6 412,077.2 51,091.4 568,132.0 28,269.5 12,703.4 0.0 1,969,277.1
Sep 992,169.9 496,131.7 47,572.6 542,839.1 19,819.5 12,583.5 0.0 2,111,116.3
Dec 988,519.9 571,501.1 58,393.6 570,888.5 19,819.5 13,386.5 0.0 2,222,509.1
2010-Mar 988,519.9 625,586.5 58,393.6 580,503.2 19,819.5 13,475.7 0.0 2,286,298.4
Jun 984,869.9 754,200.4 53,888.9 634,942.3 22,612.5 13,384.3 0.0 2,463,898.3
Sep 984,869.9 889,359.2 61,047.8 659,782.8 4,375.9 9,587.8 0.0 2,609,023.4
Dec 981,219.9 989,749.0 61,605.8 671,526.7 4,075.9 9,308.5 0.0 2,717,485.8
2011-Mar 981,219.9 1,085,821.5 64,105.8 719,254.9 5,347.9 10,510.3 0.0 2,866,260.4
Jun 980,124.9 1,263,099.0 70,724.7 802,580.7 11,867.9 11,456.4 0.0 3,139,853.7
Sep 980,124.5 1,286,120.5 73,704.2 815,561.0 15,312.9 11,824.2 0.0 3,182,647.4
Dec 979,029.5 1,361,497.4 79,380.1 839,009.2 14,016.0 13,990.1 0.0 3,286,922.4
2012-Mar 979,029.5 1,378,979.7 77,515.1 863,341.3 15,881.0 14,285.4 0.0 3,329,032.1
Jun 977,934.5 1,335,191.1 71,088.7 882,086.9 15,881.0 14,262.3 0.0 3,296,444.6
Sep 977,934.5 1,485,819.4 67,833.7 874,214.8 15,881.0 15,622.4 0.0 3,437,305.9
Dec 1,446,323.9 1,647,863.4 65,821.7 941,323.9 14,181.0 15,914.7 0.0 4,131,428.7
2013-Mar 1,446,323.9 1,741,798.2 66,431.7 1,006,532.0 15,578.1 17,763.7 0.0 4,294,427.7
Jun 1,445,228.9 1,791,384.5 67,012.8 1,095,437.9 17,078.1 18,833.2 0.0 4,434,975.5
Sep 1,445,228.9 1,858,806.1 65,212.8 1,149,281.8 17,078.1 21,878.1 0.0 4,557,485.9
Dec 1,444,130.4 1,917,104.1 64,121.9 1,186,148.5 17,010.0 23,375.6 0.0 4,651,890.7Notes: - Before June 1998, Other Banks, Other Financial Institutions, Official Entities and Private Sector categories were
included in "Others" category. - All figures are in face value
Source: Bank of Tanzania
67

1.0 Money and Banking
Table 3.1: Depository Corporations Survey Millions of TZS
Domestic assets (net) M3, Extended Broad Money Domestic credit (net) M2, Broad Money
M1, Narrow Money M0 Base MoneyEnd Claims on Other Currency in Foreign TOTAL of which:of Foreign Claims on other domestic items sum(2-5) or circulation Transferable Other currency Com. Banks
Period assets (net) government (net) sector* (net) (net) sum(9-12) sum(9-11) sum(9,10) outside banks deposits deposits deposits sum (9,14) Reserves1 2 3 4 5 6 7 8 9 10 11 12 13 14
2009 4,939,511.0 128,358.3 4,991,886.9 -1,279,612.8 8,780,143.4 6,603,404.4 3,590,798.6 1,566,753.2 2,024,045.4 3,012,605.9 2,176,738.9 3,009,062.3 1,442,309.12010 6,125,607.8 806,665.4 5,991,767.1 -1,911,376.5 11,012,663.7 8,042,188.2 4,521,438.6 1,897,134.9 2,624,303.7 3,520,749.6 2,970,475.5 3,497,849.8 1,600,714.92011 6,273,631.2 1,471,254.6 7,622,317.6 -2,345,881.3 13,021,322.0 9,247,939.4 5,571,986.7 2,235,829.8 3,336,156.9 3,675,952.7 3,773,382.6 4,111,917.1 1,876,087.32012 6,395,808.2 2,035,131.3 9,010,380.9 -2,777,768.6 14,663,551.8 10,724,557.0 6,538,563.9 2,414,788.0 4,123,775.9 4,185,993.0 3,938,994.8 4,525,589.7 2,110,801.72013 6,576,331.8 2,554,554.3 10,392,663.1 -3,416,780.9 16,106,768.4 11,890,554.2 7,218,118.5 2,763,963.0 4,454,155.6 4,672,435.7 4,216,214.2 5,027,783.6 2,263,820.6
2011-Mar 5,826,778.5 1,227,423.5 6,321,573.3 -2,141,723.2 11,234,052.1 8,169,388.9 4,448,994.9 1,855,146.5 2,593,848.4 3,720,394.0 3,064,663.2 3,554,158.9 1,699,012.4Jun 5,804,034.4 1,617,907.7 6,859,395.9 -2,323,396.7 11,957,941.4 8,698,665.7 4,927,149.5 2,081,134.9 2,846,014.6 3,771,516.2 3,259,275.7 3,789,965.1 1,708,830.2Sep 6,016,610.2 1,933,649.0 7,392,501.1 -2,541,895.6 12,800,864.7 9,115,413.3 5,186,520.2 2,243,124.2 2,943,396.0 3,928,893.1 3,685,451.4 4,239,423.1 1,996,298.9Dec 6,273,631.2 1,471,254.6 7,622,317.6 -2,345,881.3 13,021,322.0 9,247,939.4 5,571,986.7 2,235,829.8 3,336,156.9 3,675,952.7 3,773,382.6 4,111,917.1 1,876,087.3
2012-Mar 5,863,802.9 1,917,727.0 7,707,599.3 -2,487,469.3 13,001,660.0 9,381,225.0 5,711,377.7 2,145,192.0 3,566,185.7 3,669,847.3 3,620,434.9 3,881,051.2 1,735,859.2Jun 6,030,162.0 1,595,809.2 8,132,837.0 -2,495,455.3 13,263,353.0 9,803,184.1 6,031,298.6 2,317,459.3 3,713,839.4 3,771,885.4 3,460,168.9 4,591,634.7 2,274,175.4Sep 6,372,030.0 1,506,098.7 8,582,271.4 -2,437,810.2 14,022,589.9 10,302,230.8 6,395,956.8 2,480,009.2 3,915,947.5 3,906,274.0 3,720,359.2 4,492,021.3 2,012,012.1Dec 6,395,808.2 2,035,131.3 9,010,380.9 -2,777,768.6 14,663,551.8 10,724,557.0 6,538,563.9 2,414,788.0 4,123,775.9 4,185,993.0 3,938,994.8 4,525,589.7 2,110,801.7
2013-Mar 6,811,842.1 1,834,249.8 9,336,028.8 -3,142,517.1 14,839,603.6 10,931,594.6 6,765,430.9 2,392,697.1 4,372,733.8 4,166,163.6 3,908,009.0 4,715,493.1 2,322,796.0Jun 6,221,344.4 2,271,880.5 9,522,458.1 -2,720,097.3 15,295,585.7 11,251,259.7 7,017,349.4 2,610,850.3 4,406,499.1 4,233,910.3 4,044,326.0 4,917,700.1 2,306,849.8Sep 6,691,309.1 2,357,375.2 9,894,153.8 -2,964,103.7 15,978,734.4 11,745,694.5 7,278,949.9 2,703,342.9 4,575,606.9 4,466,744.6 4,233,039.9 5,091,297.5 2,387,954.6Dec 6,576,331.8 2,554,554.3 10,392,663.1 -3,416,780.9 16,106,768.4 11,890,554.2 7,218,118.5 2,763,963.0 4,454,155.6 4,672,435.7 4,216,214.2 5,027,783.6 2,263,820.6
2012-Jan 5,966,637.2 1,885,450.5 7,578,829.3 -2,425,223.7 13,005,693.3 9,334,614.8 5,627,444.2 2,102,923.6 3,524,520.6 3,707,170.6 3,671,078.5 4,305,279.1 2,202,355.5Feb 5,934,674.8 1,989,767.0 7,761,667.9 -2,677,808.0 13,008,301.8 9,359,681.9 5,738,642.6 2,106,227.2 3,632,415.4 3,621,039.3 3,648,619.9 4,073,258.2 1,967,031.0Mar 5,863,802.9 1,917,727.0 7,707,599.3 -2,487,469.3 13,001,660.0 9,381,225.0 5,711,377.7 2,145,192.0 3,566,185.7 3,669,847.3 3,620,434.9 3,881,051.2 1,735,859.2Apr 5,762,069.5 1,669,227.3 7,960,295.9 -2,405,908.7 12,985,684.1 9,381,988.5 5,682,914.7 2,147,789.5 3,535,125.1 3,699,073.8 3,603,695.6 3,991,852.8 1,844,063.3May 5,697,482.5 1,761,315.4 8,070,249.6 -2,446,455.0 13,082,592.5 9,419,749.0 5,723,154.3 2,221,923.8 3,501,230.5 3,696,594.7 3,662,843.5 4,236,357.3 2,014,433.6Jun 6,030,162.0 1,595,809.2 8,132,837.0 -2,495,455.3 13,263,353.0 9,803,184.1 6,031,298.6 2,317,459.3 3,713,839.4 3,771,885.4 3,460,168.9 4,591,634.7 2,274,175.4Jul 6,287,139.4 1,577,216.0 8,313,781.8 -2,619,709.6 13,558,427.6 9,847,196.2 6,089,947.8 2,354,673.2 3,735,274.6 3,757,248.4 3,711,231.4 4,514,138.8 2,159,465.5Aug 6,173,471.2 1,758,425.0 8,452,001.5 -2,571,797.8 13,812,099.9 10,203,245.1 6,362,834.0 2,510,895.4 3,851,938.6 3,840,411.1 3,608,854.8 4,627,804.5 2,116,909.1Sep 6,372,030.0 1,506,098.7 8,582,271.4 -2,437,810.2 14,022,589.9 10,302,230.8 6,395,956.8 2,480,009.2 3,915,947.5 3,906,274.0 3,720,359.2 4,492,021.3 2,012,012.1Oct 6,366,124.7 1,816,572.4 8,720,393.1 -2,674,306.6 14,228,783.6 10,453,113.3 6,463,143.5 2,415,035.2 4,048,108.2 3,989,969.9 3,775,670.3 4,695,012.2 2,279,976.9Nov 6,094,481.0 2,238,631.8 8,868,810.5 -2,584,711.7 14,617,211.6 10,723,637.7 6,602,634.4 2,418,416.8 4,184,217.6 4,121,003.3 3,893,573.9 4,839,747.7 2,421,330.8Dec 6,395,808.2 2,035,131.3 9,010,380.9 -2,777,768.6 14,663,551.8 10,724,557.0 6,538,563.9 2,414,788.0 4,123,775.9 4,185,993.0 3,938,994.8 4,525,589.7 2,110,801.7
2013-Jan 5,928,049.2 2,289,584.6 9,030,588.1 -2,766,224.6 14,481,997.3 10,558,543.8 6,456,942.3 2,294,979.4 4,161,962.8 4,101,601.6 3,923,453.5 4,699,754.6 2,404,775.2Feb 5,843,156.3 2,539,524.0 9,154,004.8 -2,866,248.0 14,670,437.2 10,724,889.4 6,593,201.0 2,281,745.5 4,311,455.5 4,131,688.5 3,945,547.7 4,663,417.0 2,381,671.5Mar 6,811,842.1 1,834,249.8 9,336,028.8 -3,142,517.1 14,839,603.6 10,931,594.6 6,765,430.9 2,392,697.1 4,372,733.8 4,166,163.6 3,908,009.0 4,715,493.1 2,322,796.0Apr 6,510,805.1 1,974,768.5 9,559,444.9 -3,077,521.4 14,967,497.2 10,984,633.3 6,833,985.9 2,364,028.1 4,469,957.8 4,150,647.4 3,982,863.8 4,816,599.2 2,452,571.1May 6,316,133.9 2,450,481.9 9,575,783.3 -3,111,040.8 15,231,358.4 11,205,323.0 6,949,557.6 2,486,687.3 4,462,870.3 4,255,765.4 4,026,035.4 4,976,772.2 2,490,084.9Jun 6,221,344.4 2,271,880.5 9,522,458.1 -2,720,097.3 15,295,585.7 11,251,259.7 7,017,349.4 2,610,850.3 4,406,499.1 4,233,910.3 4,044,326.0 4,917,700.1 2,306,849.8Jul 6,403,238.9 2,769,289.8 9,655,878.3 -2,926,688.7 15,901,718.4 11,740,797.0 7,366,657.3 2,709,666.9 4,656,990.4 4,374,139.8 4,160,921.3 5,286,974.1 2,577,307.2Aug 6,619,992.8 2,386,162.0 9,813,249.1 -2,828,231.5 15,991,172.4 11,807,559.5 7,386,028.1 2,745,649.8 4,640,378.3 4,421,531.4 4,183,612.9 5,127,532.6 2,381,882.8Sep 6,691,309.1 2,357,375.2 9,894,153.8 -2,964,103.7 15,978,734.4 11,745,694.5 7,278,949.9 2,703,342.9 4,575,606.9 4,466,744.6 4,233,039.9 5,091,297.5 2,387,954.6Oct 6,615,945.2 2,862,685.7 9,917,840.7 -3,428,971.3 15,967,500.2 11,901,988.7 7,344,251.3 2,706,752.3 4,637,499.0 4,557,737.3 4,065,511.6 5,343,350.0 2,636,597.7Nov 6,410,027.9 2,775,238.9 10,167,838.0 -3,333,695.7 16,019,409.1 11,965,236.0 7,390,998.9 2,758,770.0 4,632,229.0 4,574,237.0 4,054,173.1 5,210,853.6 2,452,083.7Dec 6,576,331.8 2,554,554.3 10,392,663.1 -3,416,780.9 16,106,768.4 11,890,554.2 7,218,118.5 2,763,963.0 4,454,155.6 4,672,435.7 4,216,214.2 5,027,783.6 2,263,820.6
Notes: * Formerly known as "Claims on other domestic sectors" Other deposits include saving and time deposits in national currency - Monetary data have been revised from December 2001 using the IMF international standard reporting format (SRF), which is in line with the Monetary and Financial Statistics Manual of 2000
Source: Bank of Tanzania
Memorandum item:
68

3.0: Money and Banking
Table 3.3: Bank of Tanzania - Liabilities Millions of TZS
End Currency Central Interna- Allocation Capital of in circu- government Banks' Other Foreign tional Mone- of Other and Total
period lation deposits deposits deposits liabilities tary fund SDRs liabilities reserves2009 1,896,843.3 2,069,669.2 1,153,810.1 23,290.6 3,528.0 811,524.7 390,806.1 887,049.3 100,861.1 7,337,382.32010 2,298,635.0 2,021,302.9 1,292,852.9 65,995.5 3,713.3 898,579.2 426,458.2 1,271,080.4 99,771.6 8,378,389.12011 2,694,169.5 1,235,421.9 1,720,844.4 69,724.3 187.1 1,024,983.5 456,771.9 1,553,119.1 99,415.4 8,854,637.02012 2,909,997.8 1,933,979.3 1,895,779.1 138,263.8 4,189.2 978,295.4 460,171.9 1,457,413.6 99,990.2 9,878,080.12013 3,324,794.6 2,550,655.3 2,034,705.2 19,956.3 7,421.4 1,181,472.7 463,131.8 1,498,411.9 98,675.7 11,179,224.9
2011-Mar 2,264,789.2 1,924,035.3 1,359,618.9 33,233.1 4,031.5 924,009.9 448,643.1 1,462,990.5 99,771.6 8,521,123.2Jun 2,503,645.1 1,784,797.6 1,347,973.7 32,349.9 4,242.0 1,055,779.6 480,700.8 1,680,531.8 85,627.7 8,975,648.3Sep 2,661,977.2 1,267,619.9 1,694,824.4 53,409.1 1,003.5 1,061,972.7 487,039.9 1,086,027.7 826,283.6 9,140,157.9Dec 2,694,169.5 1,235,421.9 1,720,844.4 69,724.3 187.1 1,024,983.5 456,771.9 1,553,119.1 99,415.4 8,854,637.0
2012-Mar 2,493,184.4 1,450,856.7 1,565,831.3 96,777.9 185.7 1,031,818.9 463,612.8 1,529,536.9 99,415.4 8,731,219.9Jun 2,705,224.5 1,702,183.5 2,041,905.4 75,973.4 3,830.0 970,661.4 451,512.5 1,304,733.8 177,594.7 9,433,619.0Sep 2,900,370.8 1,759,181.6 1,706,177.8 84,483.8 3,203.1 979,174.5 460,342.4 1,400,083.8 99,990.2 9,393,008.0Dec 2,909,997.8 1,933,979.3 1,895,779.1 138,263.8 4,189.2 978,295.4 460,171.9 1,457,413.6 99,990.2 9,878,080.1
2013-Mar 2,808,158.9 2,158,604.2 2,117,464.7 125,166.0 4,164.0 1,146,390.2 453,356.9 1,462,710.1 99,990.2 10,376,005.3Jun 3,030,650.1 2,140,713.7 2,196,010.9 110,894.6 5,250.7 1,178,413.2 459,452.8 1,375,569.1 142,193.0 10,639,148.0Sep 3,186,075.7 2,206,555.3 2,110,265.9 116,033.3 5,159.5 1,191,434.5 469,040.5 1,426,928.4 117,116.7 10,828,609.9Dec 3,324,794.6 2,550,655.3 2,034,705.2 19,956.3 7,421.4 1,181,472.7 463,131.8 1,498,411.9 98,675.7 11,179,224.9
2013-Jan 2,734,120.5 1,854,775.3 2,126,481.5 133,911.9 4,217.0 983,994.5 464,968.6 1,487,075.0 99,990.2 9,889,534.5Feb 2,695,237.5 1,950,287.4 2,175,097.5 101,400.6 4,213.3 1,154,358.2 457,983.4 1,439,394.2 99,990.2 10,077,962.4Mar 2,808,158.9 2,158,604.2 2,117,464.7 125,166.0 4,164.0 1,146,390.2 453,356.9 1,462,710.1 99,990.2 10,376,005.3Apr 2,807,355.4 2,082,244.5 2,215,928.2 105,159.6 5,236.4 1,152,201.4 457,468.9 1,445,766.7 99,990.2 10,371,351.4May 2,909,072.3 2,079,656.8 2,288,560.6 108,664.9 5,241.2 1,171,966.2 456,064.0 1,457,749.2 99,990.2 10,576,965.4Jun 3,030,650.1 2,140,713.7 2,196,010.9 110,894.6 5,250.7 1,178,413.2 459,452.8 1,375,569.1 142,193.0 10,639,148.0Jul 3,198,026.1 1,809,016.5 2,445,504.5 114,037.3 5,249.7 1,187,236.0 465,058.7 1,452,842.2 117,140.9 10,794,111.9Aug 3,229,621.8 2,045,919.8 2,226,074.2 60,448.6 5,233.4 1,186,512.3 465,033.2 1,416,300.8 117,120.9 10,752,264.9Sep 3,186,075.7 2,206,555.3 2,110,265.9 116,033.3 5,159.5 1,191,434.5 469,040.5 1,426,928.4 117,116.7 10,828,609.9Oct 3,216,733.9 2,377,553.3 2,401,481.2 54,781.8 4,639.9 1,191,852.1 469,306.6 1,751,635.3 98,714.1 11,566,698.3Nov 3,216,418.8 2,521,621.9 2,281,273.4 43,034.4 7,080.3 1,192,322.7 470,046.7 1,509,208.3 98,714.1 11,339,720.5Dec 3,324,794.6 2,550,655.3 2,034,705.2 19,956.3 7,421.4 1,181,472.7 463,131.8 1,498,411.9 98,675.7 11,179,224.9
Notes: - Monetary data have been revised from December 2001 using the IMF international standard reporting format (SRF), which is in line with the Monetary and Financial Statistics Manual of 2000 Source: Bank of Tanzania
69

3.0. Money and Banking
Table 3.4: Tanzania Notes in CirculationMillions of TZS Percent of Total
End of 10/- 20/- 50/- 100/- 200/- 500/- 1000/- 2000/- 5000/- 10000/- Total 10/- 20/- 50/- 100/- 200/- 500/- 1,000/- 2,000/- 5,000/- 10,000/-Period2009 99.7 497.7 0.0 0.0 1,969.5 40,789.5 86,025.2 64,538.8 257,629.6 1,410,502.1 1,862,052.0 0.0 0.0 0.0 0.0 0.1 2.2 4.6 3.5 13.8 75.72010 99.7 497.7 0.0 0.0 1,969.1 42,423.1 84,097.4 101,938.6 416,550.9 1,612,837.2 2,260,413.7 0.0 0.0 0.0 0.0 0.1 1.9 3.7 4.5 18.4 71.42011 99.7 497.7 0.0 0.0 1,969.0 51,519.0 83,793.4 111,196.0 420,406.8 1,982,878.0 2,652,359.4 0.0 0.0 0.0 0.0 0.1 1.9 3.2 4.2 15.9 74.82012 100.1 498.3 0.0 0.0 2,001.8 376,213.7 627,706.0 1,037,263.2 2,363,220.2 5,861,017.8 10,268,021.0 0.0 0.0 0.0 0.0 0.1 15.4 25.6 42.3 96.4 239.22013 99.7 497.7 0.0 0.0 1,968.0 57,544.7 99,078.4 141,056.3 553,031.7 2,467,015.3 3,320,291.9 0.0 0.0 0.0 0.0 0.1 1.7 3.0 4.2 16.7 74.3
2011-Mar 100.1 498.3 0.0 0.0 2,001.8 326,600.4 395,947.1 741,064.0 1,146,029.8 2,815,513.3 5,427,754.8 0.0 0.0 0.0 0.0 0.0 6.0 7.3 13.7 21.1 51.9Jun 99.7 497.7 0.0 0.0 1,969.0 48,024.6 85,258.3 110,518.7 404,253.3 1,813,463.3 2,464,084.7 0.0 0.0 0.0 0.0 0.1 1.9 3.5 4.5 16.4 73.6Sep 99.7 497.7 0.0 0.0 1,969.0 50,844.9 91,313.4 118,869.5 413,103.1 1,944,561.9 2,621,259.2 0.0 0.0 0.0 0.0 0.1 1.9 3.5 4.5 15.8 74.2Dec 99.7 497.7 0.0 0.0 1,969.0 51,519.0 83,793.4 111,196.0 420,406.8 1,982,878.0 2,652,359.4 0.0 0.0 0.0 0.0 0.1 1.9 3.2 4.2 15.9 74.8
2012-Mar 99.7 497.7 0.0 0.0 1,968.9 50,136.0 71,295.2 96,917.6 348,992.4 1,880,539.6 2,450,447.1 0.0 0.0 0.0 0.0 0.1 2.0 2.9 4.0 14.2 76.7Jun 99.7 497.7 0.0 0.0 1,968.8 50,736.0 77,742.7 112,045.5 457,103.5 1,960,916.0 2,661,109.9 0.0 0.0 0.0 0.0 0.1 2.1 3.2 4.6 18.7 80.0Sep 99.7 497.7 0.0 0.0 1,969.2 43,141.6 83,707.5 74,597.1 299,342.9 1,711,503.3 2,214,859.1 0.0 0.0 0.0 0.0 0.1 1.8 3.4 3.0 12.2 69.8Dec 100.1 498.3 0.0 0.0 2,001.8 376,213.7 627,706.0 1,037,263.2 2,363,220.2 5,861,017.8 10,268,021.0 0.0 0.0 0.0 0.0 0.1 15.4 25.6 42.3 96.4 239.2
2013-Mar 99.8 498.0 0.0 0.0 1,992.2 370,644.7 683,347.0 1,078,977.6 2,232,260.5 5,580,653.3 9,948,473.1 0.0 0.0 0.0 0.0 0.1 15.1 27.9 44.0 91.1 227.7Jun 99.8 498.0 0.0 0.0 1,992.2 366,794.7 740,047.0 1,071,421.7 1,994,582.0 5,163,939.0 9,339,374.4 0.0 0.0 0.0 0.0 0.1 15.0 30.2 43.7 81.4 210.7Sep 99.7 497.7 0.0 0.0 1,968.0 57,059.5 94,638.3 146,719.6 520,602.6 2,315,385.5 3,136,971.0 0.0 0.0 0.0 0.0 0.1 1.8 3.0 4.7 16.6 73.8Dec 99.7 497.7 0.0 0.0 1,968.0 57,544.7 99,078.4 141,056.3 553,031.7 2,467,015.3 3,320,291.9 0.0 0.0 0.0 0.0 0.1 1.7 3.0 4.2 16.7 74.3
2013-Jan 100.1 498.3 0.0 0.0 2,001.8 375,612.7 684,980.0 1,013,167.2 2,303,765.1 5,690,906.0 10,071,031.1 0.0 0.0 0.0 0.0 0.1 15.3 28.0 41.3 94.0 232.2Feb 100.1 498.3 0.0 0.0 2,001.8 373,524.7 684,980.0 1,012,977.6 2,254,547.9 5,557,846.8 9,886,477.1 0.0 0.0 0.0 0.0 0.1 15.2 28.0 41.3 92.0 226.8Mar 99.8 498.0 0.0 0.0 1,992.2 370,644.7 683,347.0 1,078,977.6 2,232,260.5 5,580,653.3 9,948,473.1 0.0 0.0 0.0 0.0 0.1 15.1 27.9 44.0 91.1 227.7Apr 99.8 498.0 0.0 0.0 1,992.2 367,294.7 744,047.0 1,078,659.6 2,162,844.9 5,423,591.8 9,779,027.9 0.0 0.0 0.0 0.0 0.1 15.0 30.4 44.0 88.3 221.3May 99.8 498.0 0.0 0.0 1,992.2 367,294.7 740,047.0 1,077,659.6 2,079,989.4 5,284,722.9 9,552,303.6 0.0 0.0 0.0 0.0 0.1 15.0 30.2 44.0 84.9 215.7Jun 99.8 498.0 0.0 0.0 1,992.2 366,794.7 740,047.0 1,071,421.7 1,994,582.0 5,163,939.0 9,339,374.4 0.0 0.0 0.0 0.0 0.1 15.0 30.2 43.7 81.4 210.7Jul 99.7 497.7 0.0 0.0 1,968.1 55,883.2 92,213.1 145,055.2 567,730.3 2,284,789.1 3,148,236.4 0.0 0.0 0.0 0.0 0.1 1.8 2.9 4.6 18.0 72.6
Aug 99.7 497.7 0.0 0.0 1,968.1 56,351.1 95,366.1 152,505.3 574,182.4 2,298,424.2 3,179,394.6 0.0 0.0 0.0 0.0 0.1 1.8 3.0 4.8 18.1 72.3Sep 99.7 497.7 0.0 0.0 1,968.0 57,059.5 94,638.3 146,719.6 520,602.6 2,315,385.5 3,136,971.0 0.0 0.0 0.0 0.0 0.1 1.8 3.0 4.7 16.6 73.8Oct 99.7 497.7 0.0 0.0 1,968.0 57,198.7 99,390.1 142,220.8 525,604.1 2,338,822.0 3,165,801.2 0.0 0.0 0.0 0.0 0.1 1.8 3.1 4.5 16.6 73.9Nov 99.7 497.7 0.0 0.0 1,968.0 57,198.7 99,390.1 142,220.8 525,604.1 2,338,822.0 3,165,801.2 0.0 0.0 0.0 0.0 0.1 1.8 3.1 4.5 16.6 73.9Dec 99.7 497.7 0.0 0.0 1,968.0 57,544.7 99,078.4 141,056.3 553,031.7 2,467,015.3 3,320,291.9 0.0 0.0 0.0 0.0 0.1 1.7 3.0 4.2 16.7 74.3
Source: Bank of Tanzania
70
3.0. Money and Banking
Table 3.5: Tanzania Coins in CirculationMillions of TZS Percent of Total
End ofPeriod -/05 -/10 -/20 -/50 1/- 5/- 10/- 20/- 25/- 50/= 100/- 200/- Total -/05 -/10 -/20 /50 1/- 5/- 10/- 20/- 25/- 50/= 100/- 200/-2009 8.8 4.4 38.4 46.0 167.7 441.7 839.0 999.7 11.7 5,437.5 14,039.8 12,951.2 34,985.7 0.0 0.0 0.1 0.1 0.5 1.3 2.4 2.9 0.0 15.5 40.1 37.02010 8.8 4.4 38.4 46.0 167.7 441.7 836.5 991.9 11.7 6,128.1 14,995.8 14,550.4 38,221.3 0.0 0.0 0.1 0.1 0.4 1.2 2.2 2.6 0.0 16.0 39.2 38.12011 8.8 4.4 38.4 46.0 167.7 440.4 824.4 976.5 11.7 6,570.8 15,736.7 16,983.3 41,809.1 0.0 0.0 0.1 0.1 0.4 1.1 2.0 2.3 0.0 15.7 37.6 40.62012 8.8 4.4 38.5 46.1 168.2 516.4 938.5 1,242.3 11.8 9,511.0 22,083.1 23,882.3 58,451.3 0.0 0.0 0.1 0.1 0.4 1.2 2.2 2.9 0.0 22.3 51.7 55.92013 8.8 4.4 38.4 46.0 167.7 440.1 818.9 960.5 11.7 7,859.5 18,137.7 22,879.6 51,373.2 0.0 0.0 0.1 0.1 0.3 0.9 1.6 1.9 0.0 15.3 35.3 44.5
2011-Mar 8.8 4.4 38.5 46.1 168.2 516.5 938.6 1,242.4 11.8 6,869.4 16,560.0 23,901.9 50,306.4 0.0 0.0 0.1 0.1 0.3 1.0 1.9 2.5 0.0 13.7 32.9 47.5Jun 8.8 4.4 38.4 46.0 167.7 441.5 835.2 986.6 11.7 6,221.3 15,100.5 15,022.8 38,884.8 0.0 0.0 0.1 0.1 0.4 1.1 2.1 2.5 0.0 16.0 38.8 38.6Sep 8.8 4.4 38.4 46.0 167.7 441.5 827.5 979.3 11.7 6,443.3 15,505.6 16,244.1 40,718.0 0.0 0.0 0.1 0.1 0.4 1.1 2.0 2.4 0.0 15.8 38.1 39.9Dec 8.8 4.4 38.4 46.0 167.7 440.4 824.4 976.5 11.7 6,570.8 15,736.7 16,983.3 41,809.1 0.0 0.0 0.1 0.1 0.4 1.1 2.0 2.3 0.0 15.7 37.6 40.6
2012-Mar 8.8 4.4 38.4 46.0 167.7 440.3 823.4 973.4 11.7 6,695.7 15,841.1 17,686.0 42,736.8 0.0 0.0 0.1 0.1 0.4 1.0 1.9 2.3 0.0 15.7 37.1 41.4Jun 8.8 4.4 38.4 46.0 167.7 440.3 823.1 972.1 11.7 6,746.4 16,111.4 18,733.6 44,103.7 0.0 0.0 0.1 0.1 0.4 1.0 1.9 2.3 0.0 15.8 37.7 43.8Sep 8.8 4.4 38.4 46.0 167.7 441.7 837.6 994.3 11.7 5,950.2 14,747.7 14,194.5 37,443.0 0.0 0.0 0.1 0.1 0.4 1.0 2.0 2.3 0.0 13.9 34.5 33.2Dec 8.8 4.4 38.5 46.1 168.2 516.4 938.5 1,242.3 11.8 9,511.0 22,083.1 23,882.3 58,451.3 0.0 0.0 0.1 0.1 0.4 1.2 2.2 2.9 0.0 22.3 51.7 55.9
2013-Mar 8.8 4.4 38.5 46.1 168.2 516.4 938.5 1,242.3 11.8 9,511.0 22,083.1 23,882.3 58,451.3 0.0 0.0 0.1 0.1 0.4 1.2 2.2 2.9 0.0 22.3 51.7 55.9Jun 8.8 4.4 38.5 46.1 168.2 516.4 938.5 1,242.3 11.8 9,511.0 22,083.1 23,882.3 58,451.3 0.0 0.0 0.1 0.1 0.4 1.2 2.2 2.9 0.0 22.3 51.7 55.9Sep 8.8 4.4 38.4 46.0 167.7 440.1 819.5 962.7 11.7 7,706.6 17,916.6 22,461.5 50,584.0 0.0 0.0 0.1 0.1 0.3 0.9 1.6 1.9 0.0 15.2 35.4 44.4Dec 8.8 4.4 38.4 46.0 167.7 440.1 818.9 960.5 11.7 7,859.5 18,137.7 22,879.6 51,373.2 0.0 0.0 0.1 0.1 0.3 0.9 1.6 1.9 0.0 15.3 35.3 44.5
2013-Jan 8.8 4.4 38.5 46.1 168.2 516.4 938.5 1,242.3 11.8 9,511.0 22,083.1 23,882.3 58,451.3 0.0 0.0 0.1 0.1 0.4 1.2 2.2 2.9 0.0 22.3 51.7 55.9Feb 8.8 4.4 38.5 46.1 168.2 516.4 938.5 1,242.3 11.8 9,511.0 22,083.1 23,882.3 58,451.3 0.0 0.0 0.1 0.1 0.4 1.2 2.2 2.9 0.0 22.3 51.7 55.9Mar 8.8 4.4 38.5 46.1 168.2 516.4 938.5 1,242.3 11.8 9,511.0 22,083.1 23,882.3 58,451.3 0.0 0.0 0.1 0.1 0.4 1.2 2.2 2.9 0.0 22.3 51.7 55.9Apr 8.8 4.4 38.5 46.1 168.2 516.4 938.5 1,242.3 11.8 9,511.0 22,083.1 23,882.3 58,451.3 0.0 0.0 0.1 0.1 0.4 1.2 2.2 2.9 0.0 22.3 51.7 55.9May 8.8 4.4 38.5 46.1 168.2 516.4 938.5 1,242.3 11.8 9,511.0 22,083.1 23,882.3 58,451.3 0.0 0.0 0.1 0.1 0.4 1.2 2.2 2.9 0.0 22.3 51.7 55.9Jun 8.8 4.4 38.5 46.1 168.2 516.4 938.5 1,242.3 11.8 9,511.0 22,083.1 23,882.3 58,451.3 0.0 0.0 0.1 0.1 0.4 1.2 2.2 2.9 0.0 22.3 51.7 55.9Jul 8.8 4.4 38.4 46.0 167.7 440.1 819.6 963.2 11.7 7,552.6 17,687.1 22,040.4 49,779.9 0.0 0.0 0.1 0.1 0.3 0.9 1.6 1.9 0.0 15.2 35.5 44.3Aug 8.8 4.4 38.4 46.0 167.7 440.1 819.5 962.8 11.7 7,629.3 17,835.6 22,253.1 50,217.3 0.0 0.0 0.1 0.1 0.3 0.9 1.6 1.9 0.0 15.2 35.5 44.3Sep 8.8 4.4 38.4 46.0 167.7 440.1 819.5 962.7 11.7 7,706.6 17,916.6 22,461.5 50,584.0 0.0 0.0 0.1 0.1 0.3 0.9 1.6 1.9 0.0 15.2 35.4 44.4Oct 8.8 4.4 38.4 46.0 167.7 440.1 819.3 962.1 11.7 7,763.9 17,955.3 22,603.1 50,820.8 0.0 0.0 0.1 0.1 0.3 0.9 1.6 1.9 0.0 15.3 35.3 44.5Nov 8.8 4.4 38.4 46.0 167.7 440.1 819.3 962.1 11.7 7,763.9 17,955.3 22,603.1 50,820.8 0.0 0.0 0.1 0.1 0.3 0.9 1.6 1.9 0.0 15.3 35.3 44.5Dec 8.8 4.4 38.4 46.0 167.7 440.1 818.9 960.5 11.7 7,859.5 18,137.7 22,879.6 51,373.2 0.0 0.0 0.1 0.1 0.3 0.9 1.6 1.9 0.0 15.3 35.3 44.5
Source: Bank of Tanzania
71

3.0 Money and Banking
Table 3.6: Commercial Banks - Assets Millions of TZS
End of Cash Deposit with Treasury Other govt. Loans and Other Liquid Others Fixed Total
period Bank of Tanzania Securities * Securities Bills assets2009 330,090.0 1,118,792.3 1,739,009.1 15,285.7 5,026,557.4 537,801.5 1,040,125.4 254,471.2 397,327.4 10,459,460.12010 401,500.1 1,300,906.3 2,414,939.5 8,772.0 6,117,158.6 840,776.0 1,353,121.8 188,971.6 517,259.9 13,143,405.82011 458,339.7 1,716,218.7 2,040,559.3 37,407.2 7,723,629.9 900,196.5 1,505,320.6 191,567.7 634,533.4 15,207,773.02012 495,209.7 1,785,793.4 2,877,270.9 52,666.8 9,248,521.7 1,218,284.2 1,260,420.2 133,720.7 734,604.6 17,806,492.12013 560,831.6 1,954,249.3 3,700,292.0 33,052.0 10,631,959.2 1,337,929.5 1,234,830.5 134,325.3 838,798.7 20,426,268.1
2011-Mar 409,642.8 1,375,288.9 2,362,833.6 84,649.0 6,284,124.9 757,720.3 1,352,865.5 329,414.4 537,882.4 13,494,421.7Jun 422,510.2 1,375,527.5 2,446,289.7 65,640.4 6,962,464.9 868,670.3 1,410,944.4 248,066.0 563,663.2 14,363,776.6Sep 418,853.0 1,690,964.6 2,194,880.2 50,400.6 7,601,628.6 946,396.6 1,514,742.8 173,365.5 599,258.0 15,190,490.0Dec 458,339.7 1,716,218.7 2,040,559.3 37,407.2 7,723,629.9 900,196.5 1,505,320.6 191,567.7 634,533.4 15,207,773.0
2012-Mar 347,992.5 1,544,323.9 2,412,895.3 43,115.3 7,951,017.7 859,952.4 1,405,328.2 204,417.1 663,117.2 15,432,159.6Jun 387,765.3 1,908,569.0 2,260,772.6 30,272.2 8,291,262.7 959,496.5 1,298,654.8 131,247.5 684,629.1 15,952,669.6Sep 420,361.6 1,659,211.6 2,689,440.5 55,044.4 8,933,937.9 1,044,181.1 1,368,900.0 52,834.6 709,763.2 16,933,674.7Dec 495,209.7 1,785,793.4 2,877,270.9 52,666.8 9,248,521.7 1,218,284.2 1,260,420.2 133,720.7 734,604.6 17,806,492.1
2013-Mar 415,461.8 2,070,992.1 3,096,630.3 44,806.0 9,669,748.4 1,344,706.0 1,394,622.6 151,305.1 757,565.7 18,945,838.0Jun 419,799.8 2,117,422.8 3,298,253.1 46,786.8 10,135,831.8 1,331,948.0 1,236,116.1 66,193.2 771,321.0 19,423,672.6Sep 482,732.8 2,057,756.1 3,522,116.9 44,215.9 10,344,899.7 1,348,757.7 1,233,267.9 177,378.4 803,726.9 20,014,852.3Dec 560,831.6 1,954,249.3 3,700,292.0 33,052.0 10,631,959.2 1,337,929.5 1,234,830.5 134,325.3 838,798.7 20,426,268.1
2013-Jan 439,141.1 2,124,386.7 2,796,997.9 49,768.3 9,287,064.0 1,098,518.8 1,002,234.7 136,319.1 741,463.1 17,675,893.7Feb 413,492.0 2,150,442.8 2,974,577.4 42,611.6 9,467,375.3 1,119,495.9 1,213,294.9 66,724.9 739,378.4 18,187,393.3Mar 415,461.8 2,070,992.1 3,096,630.3 44,806.0 9,669,748.4 1,344,706.0 1,394,622.6 151,305.1 757,565.7 18,945,838.0Apr 443,327.3 2,223,194.0 3,204,988.8 44,353.2 9,799,264.2 1,240,269.1 1,295,648.1 158,255.5 766,976.6 19,176,276.9May 422,385.0 2,261,856.8 3,297,132.2 45,734.1 9,870,532.1 1,117,445.6 1,277,352.9 113,336.6 770,892.6 19,176,667.8Jun 419,799.8 2,117,422.8 3,298,253.1 46,786.8 10,135,831.8 1,331,948.0 1,236,116.1 66,193.2 771,321.0 19,423,672.6Jul 488,359.2 2,393,633.3 3,347,904.1 61,519.8 10,066,924.9 1,212,771.9 1,217,866.2 91,197.0 778,714.6 19,658,891.0Aug 483,972.0 2,186,767.3 3,513,821.7 57,064.9 10,254,016.1 1,212,439.2 1,177,256.9 117,940.5 790,025.0 19,793,303.5Sep 482,732.8 2,057,756.1 3,522,116.9 44,215.9 10,344,899.7 1,348,757.7 1,233,267.9 177,378.4 803,726.9 20,014,852.3Oct 509,981.6 2,269,519.8 3,570,252.6 35,691.0 10,340,333.1 1,305,204.2 1,301,108.2 166,682.4 816,064.2 20,314,837.0Nov 457,648.8 2,214,544.0 3,718,343.7 37,765.5 10,364,773.8 1,331,644.2 1,219,697.3 283,601.8 823,275.3 20,451,294.5Dec 560,831.6 1,954,249.3 3,700,292.0 33,052.0 10,631,959.2 1,337,929.5 1,234,830.5 134,325.3 838,798.7 20,426,268.1
Notes: * Previously known as Treasury bills - Monetary data have been revised from December 2001 using the IMF international standard reporting format (SRF), which is in line with the Monetary and Financial Statistics Manual of 2000
Source: Bank of Tanzania
Domestic assets Foreign assets
72

3.0 Money and Banking
Table 3.7: Commercial Banks -- Liabilities Millions of TZS
Domestic liabilities CapitalEnd of Deposits Due to Bank Due to other Other Foreign Due to and Totalperiod of Tanzania banks banks Other Reserves2009 7,190,113.6 475.0 302,578.3 1,500,623.5 108,973.9 91,112.9 1,265,583.0 10,459,460.12010 9,049,547.5 0.0 446,361.5 1,917,148.0 137,109.8 78,774.9 1,514,464.0 13,143,405.82011 10,715,782.2 0.0 357,570.4 2,072,724.7 202,667.5 83,779.5 1,775,248.6 15,207,773.02012 12,110,517.7 4,200.0 588,704.2 2,581,225.2 250,909.4 132,528.4 2,138,407.2 17,806,492.12013 13,322,900.6 14.3 800,311.0 2,782,696.7 542,898.0 437,425.6 2,540,021.8 20,426,268.1
2011-Mar 9,345,686.7 0.0 393,591.1 1,834,659.6 144,252.9 226,639.4 1,549,592.1 13,494,421.7Jun 9,844,471.2 0.0 506,156.0 1,924,226.6 216,192.0 256,873.3 1,615,857.4 14,363,776.6Sep 10,504,345.6 0.0 541,102.2 2,168,277.8 177,955.8 94,889.3 1,703,919.4 15,190,490.0Dec 10,715,782.2 0.0 357,570.4 2,072,724.7 202,667.5 83,779.5 1,775,248.6 15,207,773.0
2012-Mar 10,759,705.1 2,500.0 495,445.2 2,060,592.4 189,845.5 87,450.8 1,836,620.7 15,432,159.6Jun 10,869,936.2 4,200.0 453,509.6 2,358,680.4 245,050.1 120,082.4 1,901,210.9 15,952,669.6Sep 11,458,113.9 4,200.0 577,515.3 2,469,484.7 250,849.3 162,618.4 2,010,893.1 16,933,674.7Dec 12,110,517.7 4,200.0 588,704.2 2,581,225.2 250,909.4 132,528.4 2,138,407.2 17,806,492.1
2013 Mar 12,321,758.5 9,000.0 774,136.3 2,905,432.5 405,472.7 185,720.4 2,344,317.6 18,945,838.0Jun 12,573,858.9 9,450.0 748,103.0 2,868,520.8 661,846.1 221,165.7 2,340,728.1 19,423,672.6Sep 13,159,377.0 9.5 705,937.2 2,858,866.0 673,308.6 204,558.7 2,412,795.4 20,014,852.3Dec 13,322,900.6 14.3 800,311.0 2,782,696.7 542,898.0 437,425.6 2,540,021.8 20,426,268.1
2012-Jan 10,815,814.5 0.0 338,681.5 2,098,700.9 178,887.1 43,968.7 1,779,715.4 15,255,768.1Feb 10,832,099.0 0.0 325,233.2 2,111,749.6 203,140.5 41,692.5 1,813,809.5 15,327,724.3Mar 10,759,705.1 2,500.0 495,445.2 2,060,592.4 189,845.5 87,450.8 1,836,620.7 15,432,159.6Apr 10,676,183.4 2,500.0 460,808.2 2,078,515.5 189,453.1 100,676.2 1,880,908.6 15,389,044.9May 10,657,903.9 4,306.6 482,582.7 2,232,544.4 236,136.8 102,086.5 1,896,799.5 15,612,360.4Jun 10,869,936.2 4,200.0 453,509.6 2,358,680.4 245,050.1 120,082.4 1,901,210.9 15,952,669.6Jul 11,122,290.8 4,200.0 525,549.5 2,361,602.5 248,801.6 117,856.6 1,945,364.9 16,325,665.8Aug 11,245,632.3 4,200.0 531,064.8 2,436,276.9 288,392.1 135,517.8 1,983,194.4 16,624,278.3Sep 11,458,113.9 4,200.0 577,515.3 2,469,484.7 250,849.3 162,618.4 2,010,893.1 16,933,674.7Oct 11,712,342.0 4,200.0 573,291.1 2,406,679.5 255,493.8 148,026.4 2,078,646.3 17,178,679.0Nov 12,126,160.4 4,200.0 607,980.8 2,542,217.8 239,267.4 173,684.1 2,118,259.6 17,811,770.1Dec 12,110,517.7 4,200.0 588,704.2 2,581,225.2 250,909.4 132,528.4 2,138,407.2 17,806,492.1
2013-Jan 12,053,124.8 4,200.0 511,095.7 2,612,510.0 217,488.7 100,338.6 2,177,135.8 17,675,893.7Feb 12,287,309.1 4,200.0 569,254.5 2,753,276.4 229,366.5 112,661.9 2,231,324.8 18,187,393.3Mar 12,321,758.5 9,000.0 774,136.3 2,905,432.5 405,472.7 185,720.4 2,344,317.6 18,945,838.0Apr 12,498,327.5 4,200.0 592,161.6 2,976,727.6 612,753.3 122,265.6 2,369,841.3 19,176,276.9May 12,636,024.2 4,200.0 573,797.2 2,891,620.9 580,179.5 163,230.1 2,327,615.9 19,176,667.8Jun 12,573,858.9 9,479.6 748,103.0 2,868,520.8 661,846.1 221,165.7 2,340,728.1 19,423,702.2Jul 13,078,032.2 6.8 545,384.4 2,951,444.3 544,807.7 186,935.8 2,352,279.8 19,658,891.0Aug 13,185,091.9 26.7 513,155.7 2,868,551.5 621,292.8 205,676.4 2,399,508.4 19,793,303.5Sep 13,159,377.0 9.5 705,937.2 2,858,866.0 673,308.6 204,558.7 2,412,795.4 20,014,852.3Oct 13,205,985.0 10.3 658,673.1 2,869,173.2 818,921.2 274,341.1 2,487,733.1 20,314,837.0Nov 13,217,656.2 38.1 700,762.6 2,846,068.1 817,378.1 355,099.6 2,514,291.7 20,451,294.5Dec 13,322,900.6 14.3 800,311.0 2,782,696.7 542,898.0 437,425.6 2,540,021.8 20,426,268.1
Note: - Monetary data have been revised from December 2001 using the IMF international standard reporting format (SRF), which is
in line with the Monetary and Financial Statistics Manual of 2000Source: Bank of Tanzania
Foreign liabilities
73

3.0. Money and Banking
Table 3.8: Analysis of Banking System LiquidityMillions of TZS
Change Govt. net Net foreign Currency in Other Net liquidity Bank of Tanzania Change in of which During the position with liquid assets circulation transa- effect on lending to commercial Deposits with Treasury Net foreign
Period Bank of of banking outside ctions commercial commercial banks' liquid Cash Bank of securities** liquidTanzania system banks net* banks banks assets Tanzania assets
2009 -46,462.8 -96,874.9 13,592.7 146,753.2 17,008.3 -2,576.7 14,431.6 41,406.5 19,688.1 -20,381.2 -26,281.72010 -370,460.4 322,316.7 8,481.7 161,823.5 122,161.5 -718.6 121,442.9 13,351.0 3,079.6 32,880.7 72,131.72011 -508,119.2 9,886.3 -30,379.9 308,086.5 -220,526.2 979.8 -219,546.4 64,111.8 57,699.8 -104,601.7 -236,756.32012 -353,945.4 301,327.1 -3,628.8 -203,880.8 -260,127.8 2,664.8 -257,463.0 81,355.3 -431,485.2 81,919.1 10,747.82013 -289,177.1 166,304.0 5,193.0 232,945.4 115,265.3 -815.8 114,449.5 103,182.8 -260,294.7 -18,051.8 289,613.2
2011-Mar 44,985.3 -178,600.9 22,214.0 93,622.4 -17,779.2 242.9 -17,536.3 16,950.6 -95,482.8 47,536.5 13,459.4Jun 186,706.4 280,157.3 169,255.8 -526,272.3 109,847.2 -1,694.3 108,152.9 52,234.0 11,499.8 -3,122.8 47,541.9Sep 259,162.3 -270,022.1 -36,146.0 299,472.7 252,466.9 -406.6 252,060.3 -13,112.5 289,133.6 -77,268.4 53,307.5Dec -508,119.2 9,886.3 -30,379.9 308,086.5 -220,526.2 979.8 -219,546.4 64,111.8 57,699.8 -104,601.7 -236,756.3
2012-Mar -290,779.0 -70,871.9 38,964.8 155,881.9 -166,804.2 17,490.5 -149,313.6 -20,148.5 -187,099.2 134,520.6 -76,586.5Jun -148,435.7 332,679.4 95,535.5 -160,697.5 119,081.7 -63.3 119,018.5 15,534.2 176,767.2 -61,846.4 -11,436.5Sep -402,577.5 198,558.8 -30,886.2 198,476.4 -36,428.4 3,768.5 -32,659.9 -27,695.9 -176,016.5 184,187.5 -13,135.0Dec -353,945.4 301,327.1 -3,628.8 -203,880.8 -260,127.8 2,664.8 -257,463.0 81,355.3 -431,485.2 81,919.1 10,747.8
2013-Mar -854,217.1 968,685.8 110,951.6 -168,319.1 57,101.2 -7,307.7 49,793.5 1,969.8 -79,450.7 122,052.8 5,221.6Jun -145,381.5 -94,789.5 124,163.0 -155,405.9 -271,413.9 2,642.0 -268,771.9 -2,585.2 -144,404.5 1,120.9 -122,903.2Sep -80,559.2 71,316.3 -42,306.9 -47,271.6 -98,821.3 -19,138.5 -117,959.8 -1,239.2 -129,011.2 8,295.2 3,995.3Dec -289,177.1 166,304.0 5,193.0 232,945.4 115,265.3 -815.8 114,449.5 103,182.8 -260,294.7 -18,051.8 289,613.2
2012-Jan 374,287.6 -306,993.9 -132,906.2 131,069.7 65,457.2 -190.5 65,266.7 -78,632.9 156,312.2 30,524.6 -42,937.2Feb -129,589.1 -31,962.4 3,303.6 244,963.4 86,715.5 255.0 86,970.5 -11,565.8 -141,107.9 207,290.7 32,353.4Mar -290,779.0 -70,871.9 38,964.8 155,881.9 -166,804.2 17,490.5 -149,313.6 -20,148.5 -187,099.2 134,520.6 -76,586.5Apr -67,910.6 -101,733.4 2,597.6 51,064.5 -115,981.9 24,972.6 -91,009.3 16,889.3 -8,420.9 -39,552.5 -59,925.2May 251,413.0 -64,587.0 74,134.2 -153,084.8 107,875.4 -45,867.5 62,008.0 7,349.3 195,898.9 -50,723.8 -90,516.4Jun -148,435.7 332,679.4 95,535.5 -160,697.5 119,081.7 -63.3 119,018.5 15,534.2 176,767.2 -61,846.4 -11,436.5Jul -91,677.6 256,977.4 37,214.0 -28,574.7 173,939.1 2,959.1 176,898.2 50,232.4 -97,928.6 102,424.7 122,169.6Aug 15,054.5 -113,668.2 156,222.1 75,337.2 132,945.7 -831.3 132,114.4 10,059.8 24,587.6 142,055.7 -44,588.6Sep -402,577.5 198,558.8 -30,886.2 198,476.4 -36,428.4 3,768.5 -32,659.9 -27,695.9 -176,016.5 184,187.5 -13,135.0Oct 260,948.5 -5,905.3 -64,974.0 13,491.1 203,560.3 -2,870.4 200,689.8 22,173.8 287,001.0 68,873.7 -177,358.7Nov 396,252.9 -271,643.6 3,381.6 198,140.4 326,131.2 11,362.5 337,493.7 -28,680.9 271,066.0 37,037.6 58,071.1Dec -353,945.4 301,327.1 -3,628.8 -203,880.8 -260,127.8 2,664.8 -257,463.0 81,355.3 -431,485.2 81,919.1 10,747.8
2013-Jan 358,408.0 -467,759.0 -119,808.6 6,387,394.7 6,158,235.2 -12,963.5 6,145,271.7 439,141.1 2,124,386.7 2,796,997.9 784,746.0Feb 111,445.0 -84,892.9 -13,234.0 352,660.5 365,978.6 11,190.3 377,168.9 -25,649.1 26,056.1 177,579.6 199,182.4Mar -854,217.1 968,685.8 110,951.6 -168,319.1 57,101.2 -7,307.7 49,793.5 1,969.8 -79,450.7 122,052.8 5,221.6Apr 112,309.8 -301,037.0 -28,669.0 198,643.2 -18,753.0 923.9 -17,829.1 27,865.5 152,202.0 108,358.5 -306,255.1May 337,442.3 -194,671.2 122,659.2 -141,910.6 123,519.6 622.7 124,142.3 -20,942.4 38,662.8 92,143.4 14,278.5Jun -145,381.5 -94,789.5 124,163.0 -155,405.9 -271,413.9 2,642.0 -268,771.9 -2,585.2 -144,404.5 1,120.9 -122,903.2Jul 460,969.9 181,894.5 98,816.6 -240,706.7 500,974.3 -7,794.6 493,179.7 68,559.4 276,180.9 49,651.0 98,788.4Aug -611,940.9 216,753.9 35,982.9 181,644.8 -177,559.2 15,129.1 -162,430.1 -4,387.3 -206,866.0 165,917.6 -117,094.4Sep -80,559.2 71,316.3 -42,306.9 -47,271.6 -98,821.3 -19,138.5 -117,959.8 -1,239.2 -129,011.2 8,295.2 3,995.3Oct 488,635.4 -75,653.8 3,409.3 -195,720.6 220,670.3 -11,294.5 209,375.8 27,248.8 211,763.7 48,135.6 -77,772.3Nov -210,427.3 -205,917.3 52,017.7 323,252.0 -41,074.9 1,989.8 -39,085.1 -52,332.8 -54,975.7 148,091.2 -79,867.7Dec -289,177.1 166,304.0 5,193.0 232,945.4 115,265.3 -815.8 114,449.5 103,182.8 -260,294.7 -18,051.8 289,613.2
Notes : * Includes corrections for change in commercial banks holding of Treasury Securities** Previously known as Treasury bills - Monetary data have been revised from December 2001 using the IMF international standard reporting format (SRF), which is in line with the Monetary and Financial Statistics Manual of 2000
Source: Bank of Tanzania
74

3.0. Money and Banking
Table 3.9: Commercial Banks -Analysis of Domestic Assets Millions of TZS
End of Bank of Other Financial Central Public NonFinancial State & Private Other Totalperiod Tanzania Corportations Govt.* Corporations Local Govt Sector Assets
2009 1,456,945.2 249,536.7 1,756,240.0 411,355.2 4,646.1 4,225,922.2 1,060,218.2 9,164,863.5
2010 1,719,425.1 259,861.7 2,435,551.0 487,152.9 9,163.5 5,140,201.4 1,567,436.5 11,618,792.1
2011 2,174,558.4 331,196.0 2,091,028.7 598,317.1 23,009.2 6,589,844.1 1,702,931.2 13,510,884.6
2012 2,281,003.1 269,381.8 2,952,030.7 718,299.7 33,678.6 7,932,639.4 2,225,318.0 16,412,351.2
2013 2,515,081.0 446,314.8 3,847,316.7 766,036.0 29,378.2 9,093,473.9 2,359,511.8 19,057,112.3
2011 - Mar 1,784,931.6 278,243.7 2,380,671.6 447,179.1 7,668.9 5,497,734.1 1,415,719.7 11,812,148.8
Jun 1,708,830.2 303,911.5 2,463,746.6 481,838.5 14,882.5 5,972,522.4 1,670,268.3 12,616,000.2
Sep 2,109,817.6 324,976.7 2,212,685.6 539,040.7 17,063.9 6,424,683.8 1,867,574.4 13,495,842.8
Dec 2,174,558.4 331,196.0 2,091,028.7 598,317.1 23,009.2 6,589,844.1 1,702,931.2 13,510,884.6
2012 - Mar 1,892,316.3 351,632.7 2,595,235.1 461,271.4 86,488.7 6,728,930.8 1,706,539.2 13,822,414.3
Jun 2,297,143.5 384,410.9 2,347,332.5 597,126.1 46,659.6 7,040,269.9 1,816,830.8 14,529,773.4
Sep 2,079,573.1 397,234.5 2,771,309.5 609,348.8 31,056.0 7,486,690.3 2,136,727.9 15,511,940.1
Dec 2,281,003.1 269,381.8 2,952,030.7 718,299.7 33,678.6 7,932,639.4 2,225,318.0 16,412,351.2
2013 - Mar 2,486,453.9 449,569.1 3,180,510.0 607,073.9 59,271.7 8,166,738.2 2,450,293.6 17,399,910.4
Jun 2,537,222.6 479,863.8 3,410,306.4 565,750.1 37,411.0 8,387,000.3 2,703,809.0 18,121,363.2
Sep 2,540,488.9 417,294.9 3,662,340.2 658,005.2 39,479.3 8,727,015.1 2,559,582.3 18,604,205.9
Dec 2,515,081.0 446,314.8 3,847,316.7 766,036.0 29,378.2 9,093,473.9 2,359,511.8 19,057,112.3
2012 - Jan 2,252,237.7 354,309.9 2,162,370.9 513,509.1 31,667.9 6,598,550.7 1,736,471.3 13,649,117.5
Feb 2,099,564.1 357,333.4 2,356,345.9 590,237.8 21,588.3 6,713,807.7 1,495,418.4 13,634,295.5
Mar 1,892,316.3 351,632.7 2,595,235.1 461,271.4 86,488.7 6,728,930.8 1,706,539.2 13,822,414.3
Apr 1,900,784.7 352,581.0 2,450,446.6 581,476.8 35,619.8 6,911,448.4 1,559,962.7 13,792,319.9
May 2,104,032.9 390,263.7 2,397,901.6 578,763.0 40,777.4 6,988,393.6 1,622,864.2 14,122,996.3
Jun 2,297,143.5 384,410.9 2,347,332.5 597,126.1 46,659.6 7,040,269.9 1,816,830.8 14,529,773.4
Jul 2,248,638.1 388,844.2 2,447,024.2 580,395.9 48,441.8 7,238,338.3 1,813,814.4 14,765,496.9
Aug 2,283,285.5 398,400.2 2,588,025.3 606,260.8 50,284.5 7,338,607.9 1,829,978.2 15,094,842.5
Sep 2,079,573.1 397,234.5 2,771,309.5 609,348.8 31,056.0 7,486,690.3 2,136,727.9 15,511,940.1
Oct 2,388,747.9 395,497.5 2,841,577.9 590,912.2 29,827.0 7,646,452.9 1,959,189.6 15,852,205.1
Nov 2,631,133.0 392,043.9 2,878,064.2 708,292.1 30,604.3 7,678,891.9 2,085,471.9 16,404,501.3
Dec 2,281,003.1 269,381.8 2,952,030.7 718,299.7 33,678.6 7,932,639.4 2,225,318.0 16,412,351.2
2013 - Jan 2,563,527.8 480,250.0 2,872,272.7 593,496.0 98,503.9 7,804,477.3 2,124,812.1 16,537,339.9
Feb 2,563,934.8 514,480.1 3,050,029.5 637,785.9 58,595.2 7,889,907.1 2,192,640.8 16,907,373.5
Mar 2,486,453.9 449,569.1 3,180,510.0 607,073.9 59,271.7 8,166,738.2 2,450,293.6 17,399,910.4
Apr 2,666,521.4 457,930.5 3,290,113.2 624,508.3 59,707.4 8,363,689.8 2,259,902.8 17,722,373.3
May 2,684,241.8 466,461.5 3,401,570.2 615,144.5 33,307.6 8,403,730.8 2,181,522.0 17,785,978.4
Jun 2,537,222.6 479,863.8 3,410,306.4 565,750.1 37,411.0 8,387,000.3 2,703,809.0 18,121,363.2
Jul 2,881,992.5 469,434.2 3,459,787.2 585,537.8 39,558.2 8,510,588.5 2,402,929.3 18,349,827.8
Aug 2,670,739.3 449,721.2 3,657,670.7 679,891.6 39,927.7 8,592,248.9 2,407,906.7 18,498,106.2
Sep 2,540,488.9 417,294.9 3,662,340.2 658,005.2 39,479.3 8,727,015.1 2,559,582.3 18,604,205.9
Oct 2,779,501.4 443,800.9 3,710,745.0 674,795.1 38,819.3 8,707,765.3 2,491,619.4 18,847,046.4
Nov 2,672,192.9 459,990.8 3,856,895.1 679,539.0 38,325.0 8,934,683.5 2,306,369.0 18,947,995.3
Dec 2,515,081.0 446,314.8 3,847,316.7 766,036.0 29,378.2 9,093,473.9 2,359,511.8 19,057,112.3Notes: *From July 2006 liquidity papers formerly regarded as part of other banks have been reclassified as part of central government deposits.
- Monetary data have been revised from December 2001 using the IMF international standard reporting format (SRF), which is in line with the Monetary and Financial Statistics Manual of 2000
Source: Bank of Tanzania
75

3.0. Money and Banking
Table 3.10: Commercial Banks' - Lending and Holdings of Securities Millions of TZS
Securities
Loans to the Central Bank
Loans to Other Depository
Corporations
Loans to Other Financial
Corporations
Loans to Central
Government
Loans to State and Local
Government
Loans to Public Nonfinancial Corporations
Loans to Other Nonfinancial Corporations
Loans to Other Resident Sectors
Loans to Non- residents Total
2009 8,062.9 160,416.0 204,722.3 17,230.9 4,646.1 411,106.1 2,489,270.3 1,731,102.7 254,321.2 5,280,878.6 64.6 1,739,009.12010 16,561.1 262,695.7 207,655.5 20,611.5 9,163.5 486,803.2 3,028,089.6 2,102,139.6 188,691.8 6,322,411.4 62.3 2,414,939.52011 0.0 237,592.5 260,524.7 49,469.4 23,009.2 598,093.1 3,959,242.3 2,595,698.7 191,272.0 7,914,901.9 67.1 2,040,559.32012 0.0 378,787.9 189,223.1 73,759.8 33,678.6 718,176.3 3,397,428.8 4,457,467.2 133,387.2 9,381,908.9 69.9 2,877,270.92013 0.0 315,336.6 337,799.4 145,574.7 29,378.2 765,952.4 5,306,741.6 3,731,176.3 133,741.3 10,765,700.5 0.0 3,700,292.0
2011-Mar 0.0 185,273.6 222,123.8 17,838.0 7,668.9 446,841.4 3,162,201.7 2,242,177.6 329,133.7 6,613,258.6 63.7 2,362,833.6Jun 0.0 329,582.9 239,396.0 17,514.9 14,882.5 481,645.9 3,397,417.8 2,482,024.8 247,781.5 7,210,246.4 65.2 2,446,231.7Sep 0.0 402,061.4 255,513.9 23,344.3 17,063.9 538,879.7 3,741,840.3 2,622,925.0 173,078.4 7,774,707.1 66.6 2,188,341.3Dec 0.0 237,592.5 260,524.7 49,469.4 23,009.2 598,093.1 3,959,242.3 2,595,698.7 191,272.0 7,914,901.9 67.1 2,040,559.3
2012-Mar 0.0 262,943.1 272,653.4 181,339.8 86,488.7 460,917.3 3,968,648.3 2,718,027.0 204,120.8 8,155,138.5 68.6 2,412,895.3Jun 0.0 267,057.5 285,344.3 85,528.5 46,659.6 596,945.2 4,112,220.1 2,901,800.5 130,934.6 8,426,490.2 69.6 2,260,804.0Sep 0.0 479,510.7 303,418.0 80,869.0 31,056.0 609,280.7 4,412,380.8 3,017,422.7 52,521.7 8,986,459.6 70.3 2,689,440.5Dec 0.0 378,787.9 189,223.1 73,759.8 33,678.6 718,176.3 3,397,428.8 4,457,467.2 133,387.2 9,381,908.9 69.9 2,877,270.9
2013-Mar 0.0 465,589.0 348,621.2 82,879.8 59,271.7 606,991.2 4,855,542.6 3,250,853.0 150,720.2 9,820,468.7 70.0 3,096,630.3Jun 0.0 738,485.1 359,598.9 111,033.3 37,411.0 565,646.5 4,941,766.2 3,381,890.8 65,607.7 10,201,439.5 70.1 3,298,253.1Sep 0.0 544,075.2 309,996.2 138,773.3 39,479.3 657,916.6 5,141,784.0 3,512,874.9 176,793.9 10,521,693.6 69.7 3,522,116.9Dec 0.0 315,336.6 337,799.4 145,574.7 29,378.2 765,952.4 5,306,741.6 3,731,176.3 133,741.3 10,765,700.5 0.0 3,700,292.0
2012-Jun 0.0 267,057.5 285,344.3 85,528.5 46,659.6 596,945.2 4,112,220.1 2,901,800.5 130,934.6 8,426,490.2 69.6 2,260,804.0Jul 0.0 285,550.8 288,362.3 82,826.9 48,441.8 580,336.5 4,245,307.0 2,938,108.0 135,279.9 8,604,213.2 69.3 2,363,197.3
Aug 0.0 278,993.0 300,464.5 81,772.3 50,284.5 606,173.0 4,304,453.7 2,979,508.8 109,545.3 8,711,195.2 69.2 2,505,253.0Sep 0.0 479,510.7 303,418.0 80,869.0 31,056.0 609,280.7 4,412,380.8 3,017,422.7 52,521.7 8,986,459.6 70.3 2,689,440.5Oct 0.0 381,712.7 303,393.3 82,263.7 29,827.0 590,829.2 4,487,888.0 3,092,689.2 129,975.0 9,098,578.2 69.4 2,758,314.2Nov 0.0 411,529.0 305,317.2 81,712.5 30,604.3 708,199.1 4,454,540.9 3,143,757.7 168,924.2 9,304,584.9 68.8 2,795,351.7Dec 0.0 378,787.9 189,223.1 73,759.8 33,678.6 718,176.3 3,397,428.8 4,457,467.2 133,387.2 9,381,908.9 69.9 2,877,270.9
2013-Jan 0.0 402,423.3 372,931.8 74,274.8 98,503.9 593,435.5 4,526,474.1 3,219,020.6 135,734.3 9,422,798.3 70.4 2,796,997.9Feb 0.0 448,882.2 411,443.1 74,452.1 58,595.2 637,725.8 4,637,722.1 3,198,554.9 66,139.9 9,533,515.2 69.4 2,974,577.4Mar 0.0 465,589.0 348,621.2 82,879.8 59,271.7 606,991.2 4,855,542.6 3,250,853.0 150,720.2 9,820,468.7 70.0 3,096,630.3Apr 0.0 375,337.8 351,863.9 84,124.4 59,707.4 624,433.6 5,000,817.0 3,302,980.1 157,670.3 9,956,934.5 69.1 3,204,988.8May 0.0 428,085.6 348,216.3 103,418.0 33,307.6 615,075.4 4,954,345.5 3,388,083.6 112,751.1 9,983,283.2 69.1 3,297,132.2Jun 0.0 738,485.1 359,598.9 111,033.3 37,411.0 565,646.5 4,941,766.2 3,381,890.8 65,607.7 10,201,439.5 70.1 3,298,253.1Jul 0.0 554,611.1 345,547.5 110,883.1 39,558.2 585,467.9 4,938,485.4 3,492,371.6 90,612.0 10,157,536.9 68.1 3,347,904.1
Aug 0.0 544,788.0 331,085.3 142,379.0 39,927.7 679,828.3 5,068,420.0 3,447,587.9 117,355.8 10,371,371.9 69.0 3,513,821.7Sep 0.0 544,075.2 309,996.2 138,773.3 39,479.3 657,916.6 5,141,784.0 3,512,874.9 176,793.9 10,521,693.6 69.7 3,522,116.9Oct 0.0 504,941.0 339,781.5 139,042.5 38,819.3 674,715.0 5,107,265.4 3,535,768.4 166,098.0 10,506,431.1 3,570,252.6Nov 0.0 280,201.8 350,806.5 137,101.4 38,325.0 679,463.1 5,238,716.6 3,640,159.3 283,017.2 10,647,790.9 3,718,343.7Dec 0.0 315,336.6 337,799.4 145,574.7 29,378.2 765,952.4 5,306,741.6 3,731,176.3 133,741.3 10,765,700.5 3,700,292.0
Note: Govt. stands for GovernmentSource: Bank of Tanzania
End of Period
Domestic lending Lending to
deposit ratio
76

3.0 Money and Banking
Table 3.11: Commercial Banks - Domestic Lending by Activity (Borrowing Sector) Millions of TZS
End of Period
Public Sector*
Agriculture, Hunting and
Forestry
Fishing Financial Intermed-
iaries
Mining and
Quarrying
Manufact-uring**
Building and
Construc-tion
Real Estate and
Leasing
Transport and
Communi-cation
Trade Tourism Hotels and Restaurants
Wareh-ousing
and Storage
Electicity Gas Water Education Health Personal and Other
Services
Total
2009 0.0 485,211.7 15,660.1 105,843.7 18,926.3 565,775.5 148,713.4 104,494.5 457,407.2 926,626.3 27,097.6 187,204.6 5,061.4 193,609.6 37,097.1 2,193.8 70,921.5 20,847.6 1,433,451.7 4,806,143.42010 0.0 706,769.9 49,932.8 142,600.1 33,943.7 786,470.6 182,071.6 183,586.8 533,990.3 1,014,177.8 37,665.7 263,046.3 146.9 156,528.3 124,274.0 2,298.8 71,998.7 14,861.4 1,494,058.5 5,798,422.12011 0.0 929,490.5 81,206.8 177,691.8 42,323.5 928,226.2 320,142.4 306,268.9 544,894.4 1,523,375.9 49,604.6 360,653.8 15,375.8 166,672.8 169,608.8 2,196.3 107,292.0 18,375.0 1,655,358.1 7,398,757.62012 0.0 940,157.8 42,932.4 231,269.4 55,158.0 991,795.9 410,748.0 393,644.9 610,053.9 1,843,242.7 60,152.3 363,033.4 23,301.8 338,035.1 130,583.4 3,455.8 183,637.7 42,463.6 2,058,497.8 8,722,164.02013 0.0 982,226.8 34,681.1 251,255.0 96,739.0 1,160,593.7 514,408.4 506,417.6 727,538.0 2,162,191.4 113,394.5 371,008.5 17,993.3 403,022.7 209,267.1 4,129.7 286,542.3 52,125.5 2,259,829.0 10,153,363.7
2011-Mar 0.0 757,067.2 35,517.3 116,532.8 36,395.8 807,220.7 202,371.3 275,293.6 575,640.5 1,122,728.5 47,986.3 294,177.4 747.3 144,711.5 113,058.8 2,131.5 70,544.5 13,633.0 1,422,095.8 6,037,853.7Jun 0.0 823,398.0 40,982.4 143,188.4 34,834.3 838,613.9 221,494.7 278,970.6 555,577.6 1,277,516.1 57,481.2 310,795.7 189.0 145,230.8 147,913.1 2,006.1 72,706.8 13,088.9 1,595,214.1 6,559,201.8Sep 0.0 971,322.2 46,034.1 142,897.7 41,618.5 913,237.2 272,856.0 302,703.4 555,524.4 1,428,703.3 61,082.6 335,661.2 93.7 127,357.0 152,062.1 1,915.8 86,178.0 14,396.3 1,673,468.0 7,127,111.6Dec 0.0 929,490.5 81,206.8 177,691.8 42,323.5 928,226.2 320,142.4 306,268.9 544,894.4 1,523,375.9 49,604.6 360,653.8 15,375.8 166,672.8 169,608.8 2,196.3 107,292.0 18,375.0 1,655,358.1 7,398,757.6
2012-Mar 0.0 914,901.2 60,600.6 197,461.4 46,187.5 899,152.3 326,977.0 346,814.9 599,541.1 1,507,313.8 52,547.5 353,122.7 3,244.7 165,939.3 175,010.3 2,377.1 120,938.7 24,660.4 1,784,194.5 7,580,985.1Jun 0.0 862,528.5 41,803.4 208,578.7 42,809.9 873,542.7 335,726.3 396,608.0 571,973.5 1,705,699.0 50,536.4 382,260.7 19,516.9 158,621.4 223,986.8 2,200.8 133,764.6 27,776.8 1,869,852.7 7,907,787.3Sep 0.0 1,048,903.2 43,674.4 224,196.0 60,891.1 897,896.4 400,591.4 372,011.7 590,282.2 1,754,040.6 54,267.7 342,449.6 17,276.8 137,369.3 139,486.9 2,129.7 149,953.8 37,826.2 2,062,058.4 8,335,305.4Dec 0.0 940,157.8 42,932.4 231,269.4 55,158.0 991,795.9 410,748.0 393,644.9 610,053.9 1,843,242.7 60,152.3 363,033.4 23,301.8 338,035.1 130,583.4 3,455.8 183,637.7 42,463.6 2,058,497.8 8,722,164.0
2013-Mar 0.0 1,011,043.3 43,414.5 218,152.9 66,576.2 1,067,037.3 444,831.5 404,747.6 669,354.0 1,968,122.0 66,712.7 366,152.1 17,376.6 242,495.0 132,073.5 3,851.7 196,881.3 41,876.9 2,087,803.2 9,048,502.3Jun 0.0 1,011,043.3 43,414.5 218,152.9 66,576.2 1,067,037.3 444,831.5 404,747.6 669,354.0 1,968,122.0 66,712.7 366,152.1 17,376.6 242,495.0 132,073.5 3,851.7 196,881.3 41,876.9 2,087,803.2 9,048,502.3Sep 0.0 988,679.5 35,897.2 233,127.0 116,411.9 1,106,746.0 478,692.1 450,777.1 723,831.0 1,995,880.5 107,329.3 363,601.0 17,825.8 247,402.4 193,833.7 4,257.1 240,761.5 49,750.2 2,379,445.5 9,734,248.8Dec 0.0 982,226.8 34,681.1 251,255.0 96,739.0 1,160,593.7 514,408.4 506,417.6 727,538.0 2,162,191.4 113,394.5 371,008.5 17,993.3 403,022.7 209,267.1 4,129.7 286,542.3 52,125.5 2,259,829.0 10,153,363.7
In Percent of Total
End of Period
Public Sector
Agriculture, Hunting and
Forestry
Fishing Financial Intermed-
iaries
Mining and
Quarrying
Manufact-uring
Building and
Construction
Real Estate and
Leasing
Transport and
Communi-cation
Trade Tourism Hotels and Restaurants
Wareh-ousing
and Storage
Electicity Gas Water Education Health Other Social and Personal
Services
Total
2009 0.0 10.1 0.3 2.2 0.4 11.8 3.1 2.2 9.5 19.3 0.6 3.9 0.1 4.0 0.8 0.0 1.5 0.4 29.8 100.02010 0.0 12.2 0.9 2.5 0.6 13.6 3.1 3.2 9.2 17.5 0.6 4.5 0.0 2.7 2.1 0.0 1.2 0.3 25.8 100.02011 0.0 12.6 1.1 2.4 0.6 12.5 4.3 4.1 7.4 20.6 0.7 4.9 0.2 2.3 2.3 0.0 1.5 0.2 22.4 100.02012 0.0 10.8 0.5 2.7 0.6 11.4 4.7 4.5 7.0 21.1 0.7 4.2 0.3 3.9 1.5 0.0 2.1 0.5 23.6 100.02013 0.0 9.7 0.3 2.5 1.0 11.4 5.1 5.0 7.2 21.3 1.1 3.7 0.2 4.0 2.1 0.0 2.8 0.5 22.3 100.0
2011-Mar 0.0 12.5 0.6 1.9 0.6 13.4 3.4 4.6 9.5 18.6 0.8 4.9 0.0 2.4 1.9 0.0 1.2 0.2 23.6 100.0Jun 0.0 12.6 0.6 2.2 0.5 12.8 3.4 4.3 8.5 19.5 0.9 4.7 0.0 2.2 2.3 0.0 1.1 0.2 24.3 100.0Sep 0.0 13.6 0.6 2.0 0.6 12.8 3.8 4.2 7.8 20.0 0.9 4.7 0.0 1.8 2.1 0.0 1.2 0.2 23.5 100.0Dec 0.0 12.6 1.1 2.4 0.6 12.5 4.3 4.1 7.4 20.6 0.7 4.9 0.2 2.3 2.3 0.0 1.5 0.2 22.4 100.0
2012-Mar 0.0 12.1 0.8 2.6 0.6 11.9 4.3 4.6 7.9 19.9 0.7 4.7 0.0 2.2 2.3 0.0 1.6 0.3 23.5 100.0Jun 0.0 10.9 0.5 2.6 0.5 11.0 4.2 5.0 7.2 21.6 0.6 4.8 0.2 2.0 2.8 0.0 1.7 0.4 23.6 100.0Sep 0.0 12.6 0.5 2.7 0.7 10.8 4.8 4.5 7.1 21.0 0.7 4.1 0.2 1.6 1.7 0.0 1.8 0.5 24.7 100.0Dec 0.0 10.8 0.5 2.7 0.6 11.4 4.7 4.5 7.0 21.1 0.7 4.2 0.3 3.9 1.5 0.0 2.1 0.5 23.6 100.0
2013-Mar 0.0 11.2 0.5 2.4 0.7 11.8 4.9 4.5 7.4 21.8 0.7 4.0 0.2 2.7 1.5 0.0 2.2 0.5 23.1 100.0Jun 0.0 11.2 0.5 2.4 0.7 11.8 4.9 4.5 7.4 21.8 0.7 4.0 0.2 2.7 1.5 0.0 2.2 0.5 23.1 100.0Sep 0.0 10.2 0.4 2.4 1.2 11.4 4.9 4.6 7.4 20.5 1.1 3.7 0.2 2.5 2.0 0.0 2.5 0.5 24.4 100.0Dec 0.0 9.7 0.3 2.5 1.0 11.4 5.1 5.0 7.2 21.3 1.1 3.7 0.2 4.0 2.1 0.0 2.8 0.5 22.3 100.0
Note: * Formely known as Public Administration**Prior 2004 commercial banks lending to the manufacturing activities include lending extended to the mining activities.
Source: Bank of Tanzania
77

3.0. Money and Banking
Table 3.12: Commercial Bank's Deposits Million of TZS
Central Government
Other Depository Corporations Non-resident
Transferrable Deposits in National
Currency
Non-Transferrable Deposits in
National Currency
Foreign Currecy Deposits
2009 662,621.7 740,965.9 361,663.6 152,761.1 2,191,522.6 3,743,200.4 211,293.0 108,973.9 8,173,002.3 2,624,824.9 3,155,803.0 2,392,374.42010 699,266.7 871,789.4 448,208.4 227,532.9 2,737,537.1 4,764,404.6 264,137.1 137,109.8 10,149,986.2 3,243,181.8 3,678,536.3 3,228,343.02011 626,616.2 1,018,837.5 384,348.8 359,757.6 117,316.3 8,835,521.9 258,430.3 202,667.5 11,803,496.2 3,819,890.3 3,729,520.4 4,254,085.52012 732,515.4 1,114,929.3 540,378.4 389,460.9 159,696.4 9,906,052.8 320,733.8 250,909.4 13,414,676.3 4,819,966.6 4,190,178.4 4,404,531.32013 791,802.9 1,143,523.1 602,217.4 692,666.9 193,905.0 10,690,588.2 465,960.7 542,898.0 15,123,562.1 5,113,564.8 4,807,640.1 5,202,357.3
2011-Mar 669,492.3 855,681.8 409,325.5 281,365.9 138,536.7 7,660,776.7 214,793.5 144,252.9 10,374,225.4 3,200,199.3 3,827,227.9 3,346,798.2Jun 657,726.9 906,016.8 394,671.5 323,976.5 129,833.3 8,089,973.2 346,672.3 216,192.0 11,065,062.5 3,581,397.1 3,846,248.1 3,637,417.2Sep 654,579.4 916,196.9 379,393.3 381,972.1 100,109.4 8,726,673.8 332,489.5 177,955.8 11,669,370.3 3,608,328.9 3,954,204.9 4,106,836.5Dec 626,616.2 1,018,837.5 384,348.8 359,757.6 117,316.3 8,835,521.9 258,430.3 202,667.5 11,803,496.2 3,819,890.3 3,729,520.4 4,254,085.5
2012-Mar 635,744.2 951,361.4 445,814.2 343,051.8 137,697.9 8,881,779.7 304,624.5 189,845.5 11,889,919.2 4,090,227.8 3,746,239.9 4,053,451.5Jun 743,193.2 956,493.4 464,618.1 295,837.8 148,004.3 9,008,652.3 247,554.2 245,412.2 12,109,765.4 4,369,836.3 3,798,433.7 3,935,763.7Sep 777,570.9 1,109,815.3 494,965.1 282,677.2 165,683.3 9,404,973.0 299,220.1 250,849.3 12,785,754.2 4,568,548.4 3,983,285.1 4,233,920.6Dec 732,515.4 1,114,929.3 540,378.4 389,460.9 159,696.4 9,906,052.8 320,733.8 250,909.4 13,414,676.3 4,819,966.6 4,190,178.4 4,404,531.3
2013-Mar 777,372.8 1,203,765.5 638,878.0 369,994.4 187,527.5 9,921,593.0 516,543.4 405,472.7 14,021,147.4 5,156,870.0 4,223,697.8 4,640,579.6Jun 868,377.3 1,158,217.8 627,113.4 359,861.6 204,731.3 10,223,934.7 453,154.9 661,846.1 14,557,237.1 5,256,456.4 4,264,141.8 5,036,638.9Sep 812,543.3 1,253,435.2 661,544.8 415,492.1 207,834.2 10,621,070.6 448,283.7 673,308.6 15,093,512.5 5,241,376.5 4,603,067.5 5,249,068.5Dec 791,802.9 1,143,523.1 602,217.4 692,666.9 193,905.0 10,690,588.2 465,960.7 542,898.0 15,123,562.1 5,113,564.8 4,807,640.1 5,202,357.3
2012-Jan 658,050.0 962,943.0 406,496.0 359,655.4 137,500.1 8,949,219.9 253,382.1 178,887.1 11,906,133.8 3,200,199.3 3,827,227.9 3,346,798.2Feb 618,119.4 940,545.4 417,781.9 353,270.0 169,356.8 8,951,145.0 209,797.5 203,140.5 11,863,156.3 4,097,957.0 3,698,085.5 4,067,113.8Mar 635,744.2 951,361.4 445,814.2 343,051.8 137,697.9 8,881,779.7 304,624.5 189,845.5 11,889,919.2 4,090,227.8 3,746,239.9 4,053,451.5Apr 670,882.0 951,564.3 504,219.1 345,687.2 146,064.6 8,728,648.2 246,401.9 189,453.1 11,782,920.4 4,101,426.3 3,680,271.9 4,001,222.2May 776,620.7 1,042,173.9 499,757.7 329,023.8 144,823.5 8,642,125.0 275,741.5 236,136.8 11,946,402.9 4,182,854.3 3,712,793.6 4,050,755.0Jun 743,193.2 956,493.4 464,618.1 295,837.8 148,004.3 9,008,652.3 247,554.2 245,412.2 12,109,765.4 4,369,836.3 3,798,433.7 3,935,763.7Jul 769,653.3 1,014,310.6 520,791.4 317,640.7 159,709.4 9,109,838.7 276,182.9 248,801.6 12,416,928.6 4,395,122.1 3,821,065.0 4,200,741.4Aug 744,575.3 1,068,274.8 532,472.0 311,257.2 168,880.6 9,164,747.7 308,040.7 288,392.1 12,586,640.4 4,491,772.3 3,891,742.4 4,203,125.7Sep 777,570.9 1,109,815.3 494,965.1 282,677.2 165,683.3 9,404,973.0 299,220.1 250,849.3 12,785,754.2 4,568,548.4 3,983,285.1 4,233,920.6Oct 798,275.4 1,120,316.8 489,877.7 283,132.3 158,804.3 9,660,210.8 339,285.2 255,493.8 13,105,396.4 4,758,311.6 4,043,896.5 4,303,188.3Nov 809,032.4 1,143,268.1 554,283.4 318,372.4 182,790.3 9,927,446.2 342,670.6 239,267.4 13,517,130.8 4,923,669.2 4,192,779.8 4,400,681.8Dec 732,515.4 1,114,929.3 540,378.4 389,460.9 159,696.4 9,906,052.8 320,733.8 250,909.4 13,414,676.3 4,819,966.6 4,190,178.4 4,404,531.3
2013-Jan 756,673.5 1,221,772.3 504,205.1 368,445.3 163,617.5 9,795,084.7 362,071.1 217,488.7 13,389,358.2 4,896,112.4 4,141,211.6 4,352,034.1Feb 795,873.8 1,241,308.4 631,295.4 362,106.8 203,637.8 9,848,960.6 417,157.9 229,366.5 13,729,707.3 5,086,846.8 4,188,393.7 4,454,466.7Mar 777,372.8 1,203,765.5 638,878.0 369,994.4 187,527.5 9,921,593.0 516,543.4 405,472.7 14,021,147.4 5,156,870.0 4,223,697.8 4,640,579.6Apr 858,837.2 1,214,508.1 671,955.6 385,188.6 200,395.5 10,026,579.3 436,808.3 612,753.3 14,407,025.8 5,274,307.5 4,224,183.9 4,908,534.5May 831,711.4 1,169,865.2 666,633.4 384,114.4 229,463.5 10,185,947.7 389,880.9 580,179.5 14,437,796.1 5,223,320.3 4,329,855.7 4,884,620.1Jun 868,377.3 1,158,217.8 627,113.4 359,861.6 204,731.3 10,223,934.7 453,154.9 661,846.1 14,557,237.1 5,256,456.4 4,264,141.8 5,036,638.9Jul 890,648.2 1,233,391.7 729,893.4 431,086.7 278,616.6 10,405,043.8 398,142.9 544,807.7 14,911,631.0 5,434,304.0 4,525,148.3 4,952,178.6Aug 859,753.6 1,257,248.1 657,680.1 401,728.7 246,198.9 10,622,236.2 356,241.4 621,292.8 15,022,379.8 5,318,786.2 4,598,870.8 5,104,722.8Sep 812,543.3 1,253,435.2 661,544.8 415,492.1 207,834.2 10,621,070.6 448,283.7 673,308.6 15,093,512.5 5,241,376.5 4,603,067.5 5,249,068.5Oct 846,704.3 1,207,614.8 678,740.3 396,989.7 242,393.3 10,680,246.9 365,341.6 818,921.2 15,236,952.0 5,311,748.3 4,694,674.4 5,230,529.3Nov 869,873.8 1,172,524.2 626,943.4 396,232.7 286,628.0 10,735,328.0 346,896.1 817,378.1 15,251,804.2 5,324,706.0 4,677,322.9 5,249,775.3Dec 791,802.9 1,143,523.1 602,217.4 692,666.9 193,905.0 10,690,588.2 465,960.7 542,898.0 15,123,562.1 5,113,564.8 4,807,640.1 5,202,357.3
Source: Bank of Tanzania
of which
TotalEnd of PeriodOther Financial
Corporations State and Local
Government
Public Nonfinancial Corporations
Other Nonfinancial Corporations
Other Resident Sectors
78

3.0 Money and Banking
Table 3.13: Weighted Average Interest Rates Structure Percent
Dec Mar Jun Sep Dec Mar Junr SepP DecP
A: Domestic Currency1 Interbank Cash Market Rates
Overnight 29.34 16.27 14.56 8.67 5.08 6.16 7.34 6.94 8.262 to 7 days 29.05 18.59 15.59 9.22 6.62 7.98 9.49 8.81 9.188 to 14 days 17.00 18.10 19.88 11.16 6.90 9.63 10.05 10.53 10.5915 to 30 days 15.91 19.17 21.55 12.45 7.00 9.50 12.00 11.82 10.7931 to 60 days 23.00 23.00 18.00 18.00 7.70 11.90 10.96 11.50 10.1861 to 90 days 17.00 17.00 24.00 24.00 14.00 14.00 10.40 10.40 12.0091 to 180 days 7.75 7.75 7.75 7.75 12.43 12.43 14.40 13.00 13.00181 and above 7.30 7.30 7.30 7.30 7.30 7.30 14.00 15.00 14.50
Overall Interbank cash market rate 29.11 16.84 14.74 8.79 5.80 6.77 7.88 7.40 8.582 Lombard Rate 35.21 19.53 17.47 10.41 6.10 7.40 8.81 8.33 9.913 REPO Rate 12.61 3.75 8.94 6.69 3.51 3.59 3.81 2.24 5.044 Treasury Bills Rates
35 days 3.87 5.24 6.67 4.24 6.99 6.60 6.04 6.37 4.7191 days 12.61 12.77 13.39 12.27 11.89 11.57 11.86 13.45 13.62182 days 16.39 13.13 13.52 12.92 12.96 13.19 13.98 15.81 15.46364 days 18.66 13.91 14.44 13.44 13.69 13.66 14.64 15.92 15.63
Overall Treasury bills rate 18.20 13.35 13.81 12.93 12.85 13.08 13.85 15.15 15.205 Treasury Bonds Rates
2-years 14.01 13.73 14.76 13.82 14.27 14.06 14.30 15.42 15.005-years 13.15 14.82 14.74 14.49 14.94 14.38 14.86 14.07 15.447-years 14.99 13.84 15.45 15.06 15.25 14.99 15.76 15.76 15.9010-years 16.98 14.80 15.16 15.07 15.82 14.28 15.28 15.75 15.96
6 Discount Rate 12.00 12.00 12.00 12.00 12.00 12.00 12.00 12.00 16.657 Savings Deposit Rate 2.90 2.86 2.88 3.02 2.88 2.89 3.05 2.97 3.048 Overall Time Deposits Rate 7.12 8.35 8.56 8.25 8.45 8.79 8.65 8.62 8.71
Call Accounts 0.99 1.01 7.51 7.51 7.511 month 6.65 7.87 7.51 7.99 9.05 8.85 1.80 2.56 2.412 months 8.24 7.94 7.59 8.84 9.83 9.41 8.66 9.21 8.983 months 8.37 9.44 9.45 10.04 10.43 10.31 9.36 8.89 8.856 months 8.67 10.13 10.69 10.88 10.18 10.74 9.25 9.40 9.9412 months 9.14 10.48 11.10 10.16 9.93 11.40 11.25 10.94 11.1224 months 7.75 11.61 12.12 8.73 8.43 9.59 9.44 8.60 8.43
9 Negotiated Deposit Rate 9.99 10.16 9.79 10.10 10.09 10.00 10.92 11.32 10.5110 Overall Lending rate 14.21 14.87 15.31 15.55 15.53 16.03 15.54 15.33 16.01
Call Loans 42.25 42.25 54.25 54.25 56.25 56.25 56.25 56.25Short-term (up to 1year) 13.73 13.90 13.92 14.33 13.99 14.22 14.25 13.30 13.78Medium-term (1-2 years) 17.80 14.75 16.33 15.99 16.74 17.85 16.52 17.27 16.69Medium-term (2-3 years) 14.17 14.70 15.63 15.58 15.93 16.81 16.33 16.27 16.27Long-term (3-5 years) 14.33 15.64 15.65 16.09 16.73 16.77 14.91 14.41 16.71Term Loans (over 5 years) 10.99 15.34 15.03 15.78 14.24 14.50 15.68 15.40 16.61
11 Negotiated Lending Rate 13.60 14.25 14.21 14.38 14.54 15.13 13.13 13.52 13.13
B: Foreign Currency 1 Deposits Rates
Savings Deposits Rate 0.70 0.64 0.32 0.38 0.32 0.63 0.41 0.55 1.09Overall Time Deposits Rate 1.29 1.33 1.42 1.63 1.63 1.79 3.61 2.06 2.941-months 1.11 0.71 1.21 0.89 1.14 1.67 3.41 1.91 3.202-months 0.75 1.57 1.73 2.37 2.13 2.19 3.64 2.51 2.243-months 1.84 0.79 0.82 1.55 1.78 1.52 3.55 2.05 1.746-months 1.16 1.62 1.86 1.72 1.66 2.06 3.56 2.01 4.0312-months 1.55 1.94 1.47 1.64 1.46 1.51 3.89 1.83 3.50
2 Overall Lending Rate 8.25 8.37 10.14 7.23 7.25 8.10 7.88 7.88 6.97Short-term (up to 1year) 5.99 5.99 8.52 6.27 5.78 6.46 6.47 7.08 3.64Medium-term (1-2 years) 9.32 9.40 11.06 8.13 8.29 8.18 7.54 8.67 8.56Medium-term (2-3 years) 9.02 8.91 10.43 7.11 7.17 8.49 7.49 8.52 8.42Long-term (3-5 years) 8.46 8.76 10.35 7.57 7.28 8.01 8.63 7.63 7.37Term Loans (over 5 years) 8.48 8.80 10.36 7.10 7.76 9.35 9.28 7.50 6.84
Notes: P = ProvisionalSource: Bank of Tanzania
2011 2012 2013
79

3.0 Money and Banking
Table 3.14: Weighted Average Yields Obtained During Treasury Bill Auctions
AuctionNumber Period 35 91 182 364
848 2012 - April, 11 5.24 13.80 13.95 14.83849 April, 25 5.24 13.80 13.85 14.89850 May, 09 5.24 13.81 14.05 15.14851 May, 23 5.24 13.82 13.99 14.68852 May, 24 6.24 14.82 14.99 15.68853 June, 06 5.24 13.47 13.58 14.24854 June, 20 8.09 13.31 13.45 14.64855 July, 04 4.50 13.38 13.41 14.01856 July, 18 4.24 13.06 13.53 13.54857 August, 01 4.24 12.18 13.00 13.06858 August, 15 4.24 11.66 12.61 12.91859 August, 29 4.24 11.64 12.61 12.87860 September, 12 4.24 12.08 12.83 13.11861 September, 26 4.24 12.45 13.01 13.76863 October, 10 8.63 12.59 13.36 13.47864 October, 24 8.05 11.98 13.13 13.40865 November, 7 7.62 11.93 12.86 13.18866 November, 21 7.25 11.76 12.86 13.43867 December, 5 7.01 11.87 12.79 13.47868 December, 19 6.98 11.92 13.12 13.90
869 2013 - January, 2 6.98 11.92 13.12 13.90870 January, 16 6.98 7.03 11.98 14.00871 January, 30 6.80 11.82 13.84 14.60872 February, 13 6.75 11.98 13.57 14.15873 February, 27 6.45 11.62 13.16 13.97874 March, 13 6.55 11.64 13.14 13.67875 March, 28 6.65 11.51 13.23 13.64876 April, 11 6.65 11.67 13.99 14.07877 April, 25 6.65 11.80 13.99 14.28878 May, 09 6.65 12.00 14.01 14.26879 May,23 6.51 11.90 13.92 14.25880 June,06 6.04 11.91 13.97 14.51881 June,20 6.04 11.82 13.98 14.77882 July,03 6.24 12.04 13.95 14.86883 July,17 6.24 12.60 14.65 14.99884 July,31 6.24 12.60 14.56 14.90885 August,14 6.24 12.44 14.61 15.14886 August,28 6.24 12.60 15.15 15.31887 September,11 6.24 13.06 15.75 15.88888 September,25 6.51 13.84 15.86 15.96889 October,09 4.71 13.76 15.61 15.71890 October,23 4.71 13.68 15.45 15.48891 November,06 4.71 12.99 14.96 14.97892 November,20 4.71 13.40 14.88 14.93893 December,04 4.71 13.54 15.24 15.26894 December,18 4.71 13.55 15.56 15.65895 December,31 4.71 13.75 15.57 15.97
Source: Bank of Tanzania
Percent per AnnumTreasury Bills with maturity days
80

3.0 Money and Banking
Table 3.15: Discount Rate and Minimum Reserve Ratio
End Of Discount RatePeriod Percent per Annum Total Private Deposits Government Deposits*2009 10.06 10.00 20.002010 7.58 10.00 20.002011 12.00 10.00 30.002012 12.00 10.00 40.002013 16.00 10.00 40.00
2011 - Jan 7.58 10.00 20.00Feb 7.58 10.00 20.00Mar 7.58 10.00 20.00Apr 7.58 10.00 20.00May 7.58 10.00 20.00Jun 7.58 10.00 20.00Jul 7.58 10.00 20.00Aug 7.58 10.00 20.00Sep 7.58 10.00 20.00Oct 9.58 10.00 20.00Nov 12.00 10.00 30.00Dec 12.00 10.00 30.00
2012 - Jan 12.00 10.00 30.00Feb 12.00 10.00 30.00Mar 12.00 10.00 30.00Apr 12.00 10.00 30.00May 12.00 10.00 30.00Jun 12.00 10.00 30.00Jul 12.00 10.00 30.00Aug 12.00 10.00 30.00Sep 12.00 10.00 30.00Oct 12.00 10.00 30.00Nov 12.00 10.00 30.00Dec 12.00 10.00 40.00
2013 - Jan 12.00 10.00 40.00Feb 12.00 10.00 40.00Mar 12.00 10.00 40.00Apr 12.00 10.00 40.00May 12.00 10.00 40.00Jun 12.00 10.00 40.00Jul 12.00 10.00 40.00Aug 12.00 10.00 40.00Sep 12.00 10.00 40.00Oct 12.00 10.00 40.00Nov 16.00 10.00 40.00Dec 16.00 10.00 40.00
Note: * Applicable from January 2009Source: Bank of Tanzania
Minimum Reserve Ratio (Percent)
81

4.0 Balance of Payments and Foreign Trade Developments
Table 4.1a: Tanzania's Balance of PaymentsMillions of USD
Item 2009 2010 2011 2012 2013p
A. Current Account -1,809.9 -1,960.1 -3,994.7 -3,499.3 -3,664.1Balance on Goods -2,536.1 -2,841.2 -4,729.6 -4,429.9 -4,710.3Goods: Exports f.o.b. 3,298.1 4,324.3 5,097.9 5,889.2 6,318.8
Traditional 486.4 583.2 685.5 956.7 868.9Non-traditional 2,372.9 3,177.0 3,747.5 4,164.4 3,782.3
o\w Gold 1,229.5 1,516.6 2,224.1 2,117.4 1,732.9Unrecorded trade 438.9 564.0 664.9 768.2 843.4
Goods: Imports f.o.b. -5,834.1 -7,165.5 -9,827.5 -10,319.1 -11,029.1Balance on Services 132.7 156.9 92.2 427.5 495.6Services: Credit 1,854.6 2,045.7 2,300.3 2,786.4 3,149.0
Transportation 334.4 445.5 548.8 632.2 778.3Travel 1,159.8 1,254.5 1,353.2 1,712.7 1,862.5Other 360.4 345.7 398.3 441.5 508.1
Services: Debit -1,722.0 -1,888.9 -2,208.1 -2,358.9 -2,653.4Transportation -604.9 -722.8 -973.7 -1,039.0 -1,110.6Travel -766.2 -830.4 -898.6 -967.0 -1,031.2Other -350.9 -335.7 -335.8 -352.8 -511.6
Balance on Goods and Services -2,403.4 -2,684.4 -4,637.3 -4,002.4 -4,214.7Balance on income -297.8 -326.9 -259.5 -314.8 -303.6Income: Credit 161.1 160.1 184.2 131.1 142.7 o/w: Investment income 149.7 147.8 159.8 109.6 114.1
Compensation of employees 11.4 12.2 24.4 21.4 28.7Income: Debit -458.9 -487.0 -443.7 -445.8 -446.3 o/w:Direct investment income -341.8 -365.5 -309.1 -267.5 -388.6
Interest payments (scheduled) -46.1 -40.3 -56.7 -84.1 -77.5Compensation of employees -39.8 -44.0 -40.7 -57.0 -57.7
Balance on Goods, Services and Income -2,701.1 -3,011.3 -4,896.9 -4,317.2 -4,518.3Balance on Current transfers 891.2 1,051.2 902.2 817.8 854.3Current transfers: Credit 959.7 1,130.2 994.9 923.3 931.1
Government 658.4 798.1 609.7 554.6 561.8o\w Multilateral HIPC relief 0.0 0.0 0.0 0.0 0.0
Other sectors 301.3 332.1 385.2 368.7 369.3Current transfer: Debit -68.4 -79.0 -92.7 -105.4 -76.8B. Capital Account 442.2 537.9 690.9 777.2 660.6Capital transfers: Credit 442.2 537.9 690.9 777.2 660.6
General Government 379.6 474.7 627.3 713.6 596.4Project 379.6 474.7 627.3 713.6 596.4Debt forgiveness (including MDRI) 0.0 0.0 0.0 0.0 0.0
Other sectors 62.6 63.2 63.6 63.6 64.2Capital transfers:Debit 0.0 0.0 0.0 0.0 0.0Total, Groups A plus B -1,367.7 -1,422.2 -3,303.8 -2,722.1 -3,003.4C. Financial Account, excl. reserves and related items 1,981.2 3,063.1 3,410.9 3,781.8 3,566.2Direct investment abroad 0.0 0.0 0.0 0.0 0.0Direct investment in Tanzania 952.6 1,812.5 1,229.4 1,706.9 1,852.9Portfolio investment 3.4 3.3 4.0 1.0 4.0Other investment 1,025.1 1,247.4 2,177.5 2,073.9 1,709.3
Assets -363.4 -142.0 -24.5 220.6 -56.7Liabilities 1,388.5 1,389.3 2,202.0 1,853.3 1,766.0
Total, Groups A through C 613.5 1,641.0 107.1 1,059.7 562.8D. Net Errors and Omissions -247.3 -1,271.2 -309.1 -733.6 -248.6Overall balance (Total, Groups A through D) 366.2 369.8 -202.0 326.1 314.2E. Reserves and Related Items -366.2 -369.8 202.0 -326.1 -314.2
Reserve assets -676.8 -395.4 206.3 -324.5 -366.9Use of Fund credit and loans 310.6 25.6 -4.4 -1.5 52.7Exceptional financing 0.0 0.0 0.0 0.0 0.0
Rescheduled debt 0.0 0.0 0.0 0.0 0.0Debt forgiveness 0.0 0.0 0.0 0.0 0.0Interest arrears 0.0 0.0 0.0 0.0 0.0Principal arrears 0.0 0.0 0.0 0.0 0.0
Memorandum itemsGDP(mp) Bill.TZS 28,212.6 32,354.2 37,717.1 44,858.2 52,716.4GDP(mp) Mill. USD 21,602.4 23,181.6 24,217.4 28,541.1 32,930.4CAB/GDP -8.4 -8.5 -16.5 -12.3 -11.1CAB/GDP (excl. current official transfers) -11.4 -11.9 -19.0 -14.2 -12.8Gross Official Reserves (Mil. USD) 3,552.5 3,948.0 3,744.6 4,068.0 4,863.8Months of Imports 5.6 5.2 3.7 3.9 4.3Months of Imports(Excluding FDI related imports) 6.3 6.2 4.1 4.3 4.8Net International Reserves (year end) Mil. USD 3,224.3 3,594.2 3,395.2 1,882.9 1,702.5Change in Net International Reserves -369.4 -369.9 199.0 -294.9 180.5Exchange rate - TZS/USD (end of period) 1,313.3 1,453.5 1,566.7 1,571.6 1,610.4Exchange rate - TZS/USD (annual average) 1,306.0 1,395.7 1,557.4 1,571.7 1,600.8Notes: 1. Revision is based on new data obtained from the completion of Private Capital Flows and Tourism Survey and adoption of new data
sources for some other items in the services account 2. Change in Gross Official Reserves will not necessarily be equal to reserve assets since a new methodology of computing reserve
assets which nets out the impact of valuation was introduced beginning January 2006 P = Provisional , r = Revised, o\w = Of whichSource: Bank of Tanzania
82

4.0 Balance of Payments and Foreign Trade Developments
Table 4.1b: Quaterly Tanzania's Balance of PaymentsMillions of USD
Dec-11 Mar-12 Jun-12 Sep-12 Dec-12 Mar-13P Jun-13P Sep-13P Dec-13P
A. Current Account -1,050.0 -1,044.2 -894.0 -726.5 -834.5 -1,382.5 -1,180.3 -1,253.5 -855.5Goods: exports f.o.b. 1,334.3 1,427.9 1,465.4 1,520.2 1,475.8 1,229.7 1,165.6 1,346.8 1,606.8 Traditional 246.9 268.1 187.7 186.7 314.2 228.1 91.0 188.0 361.9 Nontraditional 913.4 973.6 1,086.5 1,135.2 969.2 841.3 922.5 983.2 1,035.4 o\w Gold 553.6 561.7 495.5 540.1 520.0 410.0 428.0 389.8 505.1 Unrecorded trade 174.0 186.2 191.1 198.3 192.5 160.4 152.0 175.7 209.6Goods: imports f.o.b. -2,881.6 -2,492.0 -2,524.8 -2,697.4 -2,605.0 -2,687.7 -2,491.9 -3,062.1 -2,787.4
Balance on Goods -1,547.4 -1,064.1 -1,059.5 -1,177.2 -1,129.1 -1,458.0 -1,326.4 -1,715.3 -1,180.5Services: credit 628.5 574.9 606.4 804.1 801.1 653.2 672.9 937.4 906.7
Transportation 147.8 143.5 156.1 162.5 170.1 177.3 193.0 195.2 201.4Travel 386.7 356.6 335.9 530.9 489.4 373.9 357.3 598.0 551.2Other 94.1 74.8 114.4 110.7 141.6 102.0 122.5 144.2 154.1
Services: debit -634.6 -584.9 -534.3 -593.8 -645.9 -620.1 -529.9 -681.5 -741.5Transportation -282.4 -251.3 -257.6 -269.5 -260.6 -271.6 -254.2 -314.7 -288.0Travel -274.4 -249.2 -188.0 -235.5 -294.3 -267.4 -201.6 -251.1 -313.9Other -77.8 -84.4 -88.8 -88.8 -90.9 -81.2 -74.1 -115.7 -139.6
Balance on Services -6.1 -10.0 72.0 210.3 155.2 33.0 142.9 255.9 165.2Balance on Goods and Services -1,553.4 -1,074.1 -987.4 -966.9 -973.9 -1,424.9 -1,183.4 -1,459.4 -1,015.4
Income: credit 42.4 38.5 36.1 23.8 32.7 33.3 32.8 36.7 35.7Income: debit -114.7 -106.2 -112.8 -100.2 -126.6 -128.1 -129.0 -128.3 -97.8
o/w: Direct investment income -75.5 -66.9 -66.9 -66.9 -66.9 -66.9 -66.9 -66.9 -66.9 Interest payments (scheduled) -16.6 -18.7 -23.5 -8.1 -33.8 -36.8 -35.3 -32.5 -4.6 Compensation of employees -13.4 -11.4 -13.0 -15.9 -16.6 -15.1 -17.5 -19.6 -17.1
Balance on Income -72.3 -67.8 -76.7 -76.4 -93.9 -94.8 -96.2 -91.6 -62.1Balance on Goods, Services and Income -1,625.8 -1,141.9 -1,064.1 -1,043.3 -1,067.8 -1,519.7 -1,279.7 -1,551.0 -1,077.5Current transfers 575.7 97.7 170.1 316.8 233.3 137.3 99.4 297.6 222.0
Current transfers: credit 602.0 125.1 202.2 339.8 256.2 152.4 114.5 319.4 237.5Government 497.2 31.1 95.3 257.3 170.9 65.8 29.3 235.9 154.6
o\w Multilateral HIPC relief 0.0 0.0 0.0 0.0 0.0 0.0 0.0 0.0 0.0Other Sectors 104.8 94.0 106.9 82.6 85.3 86.6 85.2 83.5 82.9
Current transfer: debit -26.3 -27.4 -32.1 -23.1 -22.9 -15.2 -15.1 -21.8 -15.6B. Capital Account 204.9 204.9 204.9 186.4 181.0 130.0 110.8 103.3 101.2
Capital transfers 204.9 204.9 204.9 186.4 181.0 130.0 110.8 103.3 101.2General Government 189.0 189.0 189.0 170.5 165.1 114.1 94.9 87.4 85.3
o/w: Project 189.0 189.0 189.0 170.5 165.1 114.1 94.9 87.4 85.3Other sectors 15.9 15.9 15.9 15.9 15.9 15.9 15.9 15.9 15.9
Capital transfers:debit 0.0 0.0 0.0 0.0 0.0 0.0 0.0 0.0 0.0Total, Groups A plus B -845.1 -839.3 -689.1 -540.1 -653.6 -1,252.5 -1,069.6 -1,150.2 -754.3
C. Financial Account, excl. reserves and related Items 668.7 623.2 1,378.1 976.2 804.3 1,262.9 1,286.4 603.7 753.6Direct investment abroad 0.0 0.0 0.0 0.0 0.0 0.0 0.0 0.0 0.0Direct investment in Tanzania 307.4 426.7 426.7 426.7 426.7 468.1 468.1 468.1 468.1Portfolio investment -1.0 1.1 1.1 1.6 -2.9 1.0 1.3 0.9 0.4Other investment 362.4 195.3 950.2 547.9 380.5 793.8 817.0 134.7 285.1
Assets -3.1 -51.7 181.9 73.1 17.2 -180.5 156.7 -117.4 -38.8Loans (Banks) -16.0 -7.5 46.1 50.0 -51.4 -9.9 53.8 -69.2 25.4Currency and deposits 12.9 -44.2 135.8 23.2 68.6 -170.8 102.8 -48.2 -64.2 Banks -34.1 68.8 64.8 -43.8 66.6 -74.8 109.1 2.8 -14.2 Other sectors 47.0 -113.0 71.0 67.0 2.0 -96.0 -6.3 -51.0 -50.0Other assets 0.0 0.0 0.0 0.0 0.0 0.2 0.0 0.0 0.0
Liabilities 365.4 247.0 768.3 474.7 363.3 974.3 660.4 252.1 323.9Trade credits 0.0 0.0 -0.1 0.5 -0.2 -0.2 0.1 -0.2 1.1Loans 345.6 255.8 730.4 470.9 363.1 879.3 501.6 245.8 397.2
Monetary Authority 0.0 0.0 0.0 0.0 0.0 0.0 0.0 0.0 0.0SDR Allocation 0.0 0.0 0.0 0.0 0.0 0.0 0.0 0.0 0.0
General government 245.3 114.1 455.2 230.4 171.4 689.5 258.5 36.2 22.3Drawings 254.2 129.3 468.2 235.2 190.0 699.9 281.1 47.6 22.3Repayments -8.9 -15.1 -13.0 -4.9 -18.6 -10.4 -22.6 -11.5 0.0
Scheduled payments -8.9 -15.1 -13.0 -4.9 -18.6 -10.4 -22.6 -11.5 0.0Debt forgiveness 0.0 0.0 0.0 0.0 0.0 0.0 0.0 0.0 0.0Rescheduled debt 0.0 0.0 0.0 0.0 0.0 0.0 0.0 0.0 0.0
Banks -11.4 2.0 21.2 26.6 -19.2 33.9 21.6 -16.6 148.9 Other sectors 111.7 139.7 254.0 214.0 210.9 155.9 221.5 226.3 226.0
Drawings 135.3 156.6 268.7 223.5 223.5 223.5 223.5 227.7 227.7Repayments -23.7 -16.9 -14.8 -9.5 -12.6 -67.5 -2.0 -1.5 -1.7
Scheduled payments -23.7 -16.9 -14.8 -9.5 -12.6 -67.5 -2.0 -1.5 -1.7Currency and deposits 19.8 -8.8 38.0 3.3 0.4 95.2 158.7 6.5 -74.4
Total, Groups A through C -176.4 -216.1 689.0 436.1 150.7 10.4 216.9 -546.5 -0.7D. Net Errors and Omissions 452.3 -8.3 -405.4 -177.8 -142.2 237.9 -276.8 769.2 88.2Overall balance 275.8 -224.4 283.6 258.3 8.5 248.2 -59.9 222.6 87.5E. Reserves and Related Items -275.8 224.4 -283.6 -258.3 -8.5 -248.2 59.9 -222.6 -87.5
Reserve assets -267.0 221.9 -275.3 -263.7 -7.4 -349.8 58.2 -230.1 -88.8Use of Fund credit and loans -8.8 2.5 -8.3 5.3 -1.1 101.6 1.8 7.5 1.3Exceptional financing 0.0 0.0 0.0 0.0 0.0 0.0 0.0 0.0 0.0
Rescheduled debt 0.0 0.0 0.0 0.0 0.0 0.0 0.0 0.0 0.0Debt forgiveness 0.0 0.0 0.0 0.0 0.0 0.0 0.0 0.0 0.0Interest arrears 0.0 0.0 0.0 0.0 0.0 0.0 0.0 0.0 0.0Principal arrears 0.0 0.0 0.0 0.0 0.0 0.0 0.0 0.0 0.0
Memorandum Items:Gross Official Reserves 3,744.6 3,522.0 3,797.1 4,060.6 4,068.0 4,418.4 4,359.9 4,590.6 4,678.8Months of Imports 3.2 3.4 3.7 3.7 3.8 4.0 4.3 3.7 4.0Net International Reserves (Quarter end) 3,395.2 3,170.1 3,451.0 3,709.6 3,717.4 3,966.4 3,905.4 4,128.7 4,214.4Change in Net International Reserves -276.5 225.1 -280.9 -258.6 -7.8 -249.0 61.0 -223.3 -85.6Exchange rate (end of Quarter) 1,566.7 1,575.0 1,568.9 1,569.3 1,571.6 1,590.5 1,602.7 1,604.9 1,578.6Exchange rate (Quarterly average) 1,636.6 1,573.1 1,572.1 1,571.5 1,570.5 1,583.5 1,595.7 1,610.3 1,594.2
Note: P = ProvisionalGoods exports include estimate for unrecorded trade
Source: Bank of Tanzania
Item
83
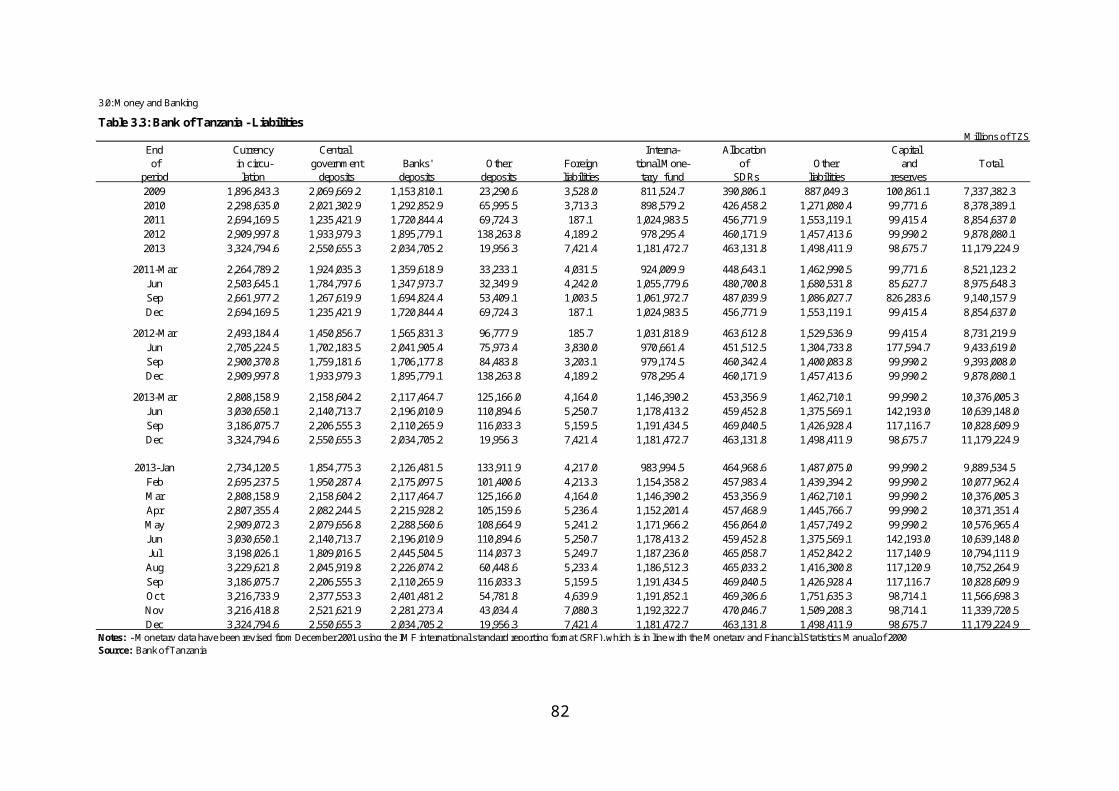
4.0 Balance of Payments and Foreign Trade Developments
Table 4.2: Tanzania's Balance of PaymentsMillions of TZS
Item 2009r 2010r 2011r 2012r 2013p
A. Current Account -2,372,727.7 -2,655,281.4 -6,198,287.1 -5,440,877.6 -7,309,047.3Goods: Exports f.o.b. 4,293,680.1 6,075,758.0 7,952,792.1 9,256,365.1 8,795,998.9
Traditional 634,787.4 822,198.1 1,065,534.8 1,503,255.3 1,391,025.6Nontraditional 3,098,847.5 4,461,069.8 5,849,936.6 6,545,757.9 6,054,880.0
o\w Gold 1,606,204.5 2,120,199.6 3,477,498.0 3,328,472.6 2,774,158.4Goods: imports f.o.b. -7,616,940.4 -10,021,852.1 -15,383,304.1 -16,218,291.3 -17,655,879.1Balance on Goods -3,323,260.3 -3,946,094.1 -7,430,512.0 -6,961,926.2 -8,859,880.2Services: Credit 2,422,251.7 2,869,970.0 3,599,316.2 4,379,336.8 5,041,010.4
Transportation 436,674.7 622,611.3 856,380.4 993,667.3 1,246,008.5Travel 1,514,832.7 1,765,134.4 2,121,167.3 2,691,806.7 2,981,567.5Other 470,744.4 482,224.4 621,768.5 693,862.8 813,434.3
Services: Debit -2,248,261.2 -2,641,741.0 -3,452,223.9 -3,707,399.9 -4,247,661.1Transportation -789,697.9 -1,010,491.6 -1,523,854.7 -1,633,045.0 -1,777,877.6Travel -1,000,369.3 -1,163,933.5 -1,405,135.2 -1,519,829.9 -1,650,838.4Other -458,194.0 -467,315.9 -523,234.0 -554,525.0 -818,945.1
Balance on Services 173,990.5 228,229.0 147,092.3 671,936.9 793,349.3Balance on Goods and Services -3,149,269.8 -3,717,865.1 -7,283,419.7 -6,289,989.3 -8,066,530.9Income: Credit 210,540.6 225,223.5 285,405.3 205,969.6 228,468.3
Investment income 195,660.0 208,070.8 38,344.2 33,690.6 182,579.0Compensation of employees 14,880.6 17,152.7 38,344.2 33,690.6 45,889.3
Income: Debit -599,429.5 -654,152.1 -634,429.6 -642,228.9 -838,536.9Direct investment income -446,334.5 -510,459.1 -480,970.9 -420,450.9 -622,120.1Interest payments (scheduled) -60,334.5 -56,904.5 -89,447.3 -132,274.9 -124,057.3Compensation of employees -52,007.7 -61,849.2 -64,011.4 -89,503.0 -92,359.5
Balance on Income -388,889.0 -428,928.7 -349,024.2 -436,259.3 -610,068.6Balance on Goods, Services and Income -3,538,158.7 -4,146,793.8 -7,632,444.0 -6,726,248.6 -8,676,599.5Current transfers 1,165,431.0 1,491,512.4 1,434,156.9 1,285,370.9 1,367,552.2Current transfers: Credit 1,254,814.4 1,602,104.5 1,579,336.4 1,451,089.2 1,490,545.4
Government 861,309.1 1,138,402.9 977,278.7 871,645.2 899,362.8o\w Multilateral HIPC relief 0.0 0.0 0.0 0.0 0.0
Other sectors 393,505.3 463,701.5 602,057.8 579,444.0 591,182.6Current transfer: Debit -89,383.4 -110,592.1 -145,179.6 -165,718.2 -122,993.1B. Capital Account 577,635.6 752,072.0 1,083,507.5 1,221,540.9 1,023,756.2Capital transfers Credit 577,635.6 752,072.0 1,083,507.5 1,221,540.9 1,023,756.2
General Government 495,853.5 663,813.2 984,454.8 1,121,580.9 954,744.5Project 495,853.5 663,813.2 984,454.8 1,121,580.9 954,744.5Debt forgiveness (including MDRI) 0.0 0.0 0.0 0.0 0.0
Other sectors 81,782.2 88,258.9 99,052.8 99,960.0 69,011.7Capital transfers:Debit 0.0 0.0 0.0 0.0 0.0Total, Groups A plus B -1,795,092.1 -1,903,209.3 -5,114,779.5 -4,219,336.7 -6,285,291.1C. Financial Account, excl. reserves and related items 2,481,989.4 4,259,471.8 5,287,993.4 5,943,562.1 5,848,120.5Direct investment abroad 0.0 0.0 0.0 0.0 0.0Direct investment in Tanzania 1,244,132.8 2,529,557.7 1,914,713.7 2,682,803.8 2,966,198.8Portfolio investment 4,479.0 4,550.9 6,055.6 1,586.6 6,323.5Other investment 1,233,377.7 1,725,363.2 3,367,224.0 3,259,171.8 2,875,598.2
Assets -475,266.0 -198,809.7 -38,925.1 345,646.2 48,492.9Liabilities 1,708,643.6 1,924,172.9 3,406,149.1 2,913,525.5 2,827,105.3
Total, Groups A through C 686,897.3 2,356,262.5 173,213.8 1,724,225.4 -437,170.6D. Net Errors and Omissions -206,350.1 -1,812,255.9 -461,592.6 -1,211,933.8 940,095.0Overall balance (Total, Groups A through D) 480,547.2 544,006.6 -288,378.7 512,291.6 502,924.4E. Reserves and Related Items -480,547.2 -544,006.6 288,378.7 -512,291.6 -502,924.4
Reserve assets -885,176.8 -580,486.6 297,302.7 -509,897.9 -587,301.5Use of Fund credit and loans 404,629.6 36,480.1 -8,923.9 -2,393.7 84,377.1Exceptional financing 0.0 0.0 0.0 0.0 0.0
Memorandum itemsGDP(mp) Bill.TZS 28,212.6 32,354.2 37,717.1 44,858.2 52,716.4GDP(mp) Mill. USD 21,602.4 23,181.6 24,217.4 28,541.1 32,930.4CAB/GDP -8.4 -8.2 -16.4 -12.1 -13.9CAB/GDP (excl. current official transfers) -11.5 -11.7 -19.0 -14.1 -15.6Gross Official Reserves (Mil. USD) 3,552.5 3,948.0 3,744.6 4,068.0 4,863.8Months of Imports 5.6 5.2 3.7 3.9 4.3Net International Reserves (year end) Mil. USD 3,224.3 3,594.2 3,395.2 1,882.9 1,702.5Change in Net International Reserves -369.4 -369.9 199.0 -294.9 180.5Exchange rate - TZS/USD (end of period) 1,313.3 1,453.5 1,566.7 1,571.6 1,610.4Exchange rate - TZS/USD (annual average) 1,306.0 1,395.7 1,557.4 1,571.7 1,600.8Notes: Balance of Payments (BOP) statistics have changed from previous publications due to adoption of results from Private Capital Flows
(PCF) and Tourism surveys and changes from some other data sources. Export figures contain estimates for unrecorded trade
P = Provisional, r = RevisedSource: Bank of Tanzania
84

4.0 Balance of Payments and Foreign Trade Developments
Table 4.3: Tanzania Exports by Type of Commodity Millions of USD
Commodity 2006 2007 2008 2009r 2010r 2011r 2012r 2013p
A: Traditional Exports :COFFEEValue 61.4 98.1 99.1 111.2 101.6 142.6 186.6 171.0Volume 31.5 45.0 45.4 56.0 35.6 39.0 54.8 59.5Unit Price 1,953.1 2,177.6 2,185.7 1,984.6 2,853.1 3,654.9 3,403.2 2,872.7
COTTONValue 55.8 66.4 115.8 111.0 84.0 61.6 164.9 111.7Volume 55.0 59.1 87.9 99.4 67.6 40.3 132.0 89.0Unit Price 1,014.2 1,123.8 1,317.6 1,116.7 1,241.9 1,529.0 1,249.7 1,256.0
SISALValue 6.1 8.8 15.7 0.0 0.0 0.0 18.4 16.9Volume 8.0 9.5 13.8 0.0 0.0 0.0 13.5 12.6Unit Price 766.7 928.4 1,137.7 #DIV/0! #DIV/0! #DIV/0! 1,357.1 1,341.6
TEAValue 31.0 28.7 42.5 47.2 36.4 47.2 56.1 56.9Volume 22.4 21.5 28.1 30.6 18.7 27.1 27.2 28.8Unit Price 1,384.9 1,334.8 1,511.2 1,538.7 1,946.4 1,739.7 2,061.2 1,977.9
TOBACCOValue 65.2 87.8 176.4 127.4 232.3 239.0 350.1 307.0Volume 25.0 37.9 55.2 33.8 53.6 66.8 100.6 67.8Unit Price 2,611.4 2,318.1 3,194.6 3,764.0 4,337.0 3,577.7 3,480.9 4,526.1
CASHEWNUTSValue 39.4 25.6 44.3 68.6 96.9 107.0 142.6 162.4Volume 66.3 41.3 52.7 95.5 125.0 96.4 130.9 147.3Unit Price 594.4 621.1 839.6 718.2 775.3 1,109.8 1,089.3 1,102.5
CLOVESValue 8.2 4.2 13.5 14.4 7.6 33.2 38.1 43.0Volume 2.4 1.4 3.7 4.8 2.2 2.4 3.4 4.1Unit Price 3,346.2 2,968.3 3,605.5 2,977.9 3,449.6 13,588.8 11,198.5 10,562.8Sub Total 267.1 319.7 507.3 479.6 559.0 630.6 956.7 868.9
B. Non-Traditional Exports:Minerals 836.8 848.7 1,186.7 1,271.4 1,560.1 2,286.4 2,187.8 1,861.2Manufactured Goods 195.8 309.8 741.8 506.5 963.8 861.5 1,037.3 1,072.1Others Exports 443.6 546.1 676.2 598.3 653.4 619.5 929.2 849.1Sub Total 1,476.2 1,704.5 2,604.7 2,376.1 3,177.3 3,767.4 4,154.4 3,782.3
Grand Total 1,743.3 2,024.2 3,112.0 2,855.8 3,736.3 4,398.1 5,111.1 4,651.2Notes: 1. Volume in '000 Tonnes; Unit Price in USD/Tonne
2. Figures do not include adjustments on unrecorded trader = Revised
P = Provisional
Source: Bank of Tanzania and Tanzania Revenue Authority (Customs Department).
January - December
85

4.0 Balance of Payments and Foreign Trade Developments
Table 4.4: Tanzania's Exports by Type of Commodity Millions of TZS
Commodity 2006 2007 2008 2009r 2010r 2011r 2012r 2013p
A: Traditional Exports:COFFEE
Value 76,357.9 121,980.5 119,755.0 146,932.4 146,238.6 222,464.6 293,256.4 272,369.1
Volume 31.5 45.0 45.4 56.0 35.6 39.0 54.8 59.5
Unit Price 2,427,763.8 2,708,994.8 2,640,487.3 2,622,638.0 4,104,848.5 5,700,388.2 5,347,916.1 4,575,966.3
COTTON
Value 69,083.0 79,942.5 138,618.8 146,568.1 120,278.1 100,720.8 259,069.4 178,686.5
Volume 55.0 59.1 87.9 99.4 67.6 40.3 132.0 89.0
Unit Price 1,255,785.8 1,353,678.0 1,576,861.1 1,474,570.9 1,778,219.0 2,498,557.0 1,963,005.7 2,008,713.5
SISAL
Value 7,618.4 11,091.9 18,662.1 0.0 0.0 0.0 28,871.7 27,093.3
Volume 8.0 9.5 13.8 0.0 0.0 0.0 13.5 12.6
Unit Price 955,036.5 1,166,853.1 1,354,181.0 #DIV/0! #DIV/0! #DIV/0! 2,132,982.2 2,147,195.5
TEA
Value 38,682.7 35,890.5 50,900.2 62,296.2 50,787.4 73,802.6 88,106.6 90,767.9
Volume 22.4 21.5 28.1 30.6 18.7 27.1 27.2 28.8
Unit Price 1,727,639.8 1,668,179.2 1,811,174.9 2,032,918.3 2,713,211.6 2,721,961.3 3,239,196.5 3,154,655.1
TOBACCO
Value 83,047.2 108,563.7 210,297.4 167,862.0 328,306.0 369,127.9 550,106.4 492,182.0
Volume 25.0 37.9 55.2 33.8 18.7 66.8 100.6 67.8
Unit Price 3,326,226.7 2,864,774.1 3,808,866.1 4,960,627.0 17,539,066.2 5,524,991.8 5,470,229.9 7,255,844.3
RAW CASHEWNUTS
Value 48,619.7 30,983.7 51,602.7 90,561.7 139,519.8 165,664.1 224,005.3 258,301.8
Volume 66.3 41.3 52.7 95.5 125.0 96.4 130.9 147.3
Unit Price 732,836.5 750,738.1 978,386.5 948,649.2 1,116,104.5 1,718,361.2 1,711,386.7 1,753,532.2
CLOVES
Value 10,236.6 5,425.8 16,263.5 18,924.3 11,079.4 54,730.5 59,839.5 68,643.6
Volume 2.4 1.4 3.7 4.8 2.2 2.4 3.4 4.1
Unit Price 4,198,536.0 3,816,764.4 4,349,959.8 3,923,491.2 5,021,917.4 22,421,335.8 17,599,846.9 16,878,198.7
SubTotal 333,645.6 393,878.6 606,099.7 633,144.6 796,209.2 986,510.4 1,503,255.3 1,388,044.3
B: Non Traditional:
Minerals 1,050,622.5 1,056,594.0 1,414,865.8 1,666,511.5 2,202,090.1 3,608,407.2 3,439,064.9 2,973,442.8
Manufactured goods 245,717.2 383,242.5 890,116.3 668,736.6 1,220,392.2 1,352,140.3 1,630,482.9 1,714,057.1
Other exports 556,032.3 676,852.1 811,062.6 789,118.2 925,842.4 976,365.8 1,460,432.9 1,357,912.8
Sub Total 1,852,372.0 2,116,688.6 3,116,044.8 3,124,366.3 4,348,324.8 5,936,913.3 6,529,980.8 6,045,412.7
Grand Total 2,186,017.5 2,510,567.2 3,722,144.4 3,757,510.9 5,144,534.0 6,923,423.7 8,033,236.0 7,433,457.0Notes: 1. Monthly average exchange rates have been used to convert figures from USD to TZS
2. Volume in '000 Tonnes; Unit Price in TZS/Tonne3. Export figures do not include adjustments on unrecorded trade on annual datar = RevisedP = Provisional
Source: Bank of Tanzania and Tanzania Revenue Authority (Customs Department).
January - December
86

4.0 Balance of Payments and Foreign Trade Developments
Table 4.5: Tanzania's Imports (c.i.f) by Major Category Millions of USD
Category 2006 2007 2008 2009 2010 2011 2012 2013p
A. Capital Goods: 1,577.1 1,939.6 3,222.5 2,790.3 2,983.8 3,912.7 4,051.1 3,802.7
Transport Equipment 411.8 525.1 931.3 822.5 990.3 1,108.3 1,272.7 1,274.9
Building and Construction 371.4 457.9 785.3 613.4 671.0 832.7 885.5 1,054.7
Machinery 793.8 956.6 1,505.8 1,354.4 1,322.4 1,971.7 1,892.9 1,473.0
B. Intermediate Goods : 1,732.8 2,165.6 2,931.2 2,077.3 3,012.4 4,548.4 4,753.8 5,720.0
Oil 1,259.9 1,606.8 2,112.3 1,453.8 2,224.4 3,548.3 3,721.3 4,734.7
Fertilizers 59.2 65.0 188.5 104.6 126.4 193.9 147.1 175.9
Industrial Raw Material 413.7 493.9 630.4 518.8 661.6 806.2 885.4 809.4
C. Consumer Goods : 936.4 1,236.2 1,551.9 1,543.3 1,878.1 2,338.2 2,541.2 2,597.2
Food and Food stuffs 273.9 346.6 333.5 377.3 507.3 662.6 721.5 710.3
All Other Consumer Goods 662.5 889.6 1,218.4 1,166.0 1,370.7 1,675.7 1,819.6 1,886.9
TOTAL 4,246.3 5,341.4 7,705.6 6,410.9 7,874.2 10,799.4 11,346.0 12,119.9
Note: P = Provisional Source: Bank of Tanzania and Tanzania Revenue Authority
January - December
87

4.0 Balance of Payments and Foreign Trade Developments
Table 4.6: Tanzania's Imports (c.i.f) by Major Category Millions of TZS
Category 2006 2007 2008 2009 2010 2011 2012r 2013p
A. Capital Goods: 1,981,161.3 2,407,680.4 3,854,345.2 3,643,391.2 4,182,560.6 6,119,015.5 6,366,784.5 6,078,863.9
Transport Equipment 516,422.2 649,792.0 1,114,286.6 1,074,114.1 1,392,264.7 1,729,600.1 2,000,255.0 2,038,223.1
Building and Construction 466,475.8 568,312.5 940,527.0 801,009.8 940,536.4 1,298,783.4 1,391,564.8 1,686,640.6
Machinery 998,263.2 1,189,576.0 1,799,531.6 1,768,267.3 1,849,759.5 3,090,632.0 2,974,964.7 2,354,000.2
B. Intermediate Goods: 2,179,176.0 2,688,516.5 3,502,528.4 2,711,251.8 4,198,885.6 7,130,367.2 7,471,485.1 9,142,290.8
Oil 1,582,296.9 1,998,111.1 2,523,077.3 1,897,538.6 3,092,249.8 5,566,490.4 5,849,008.6 7,565,899.4
Fertilizers 76,129.2 79,605.2 226,010.1 136,461.1 179,812.4 304,829.0 231,129.1 281,988.0
Industrial Raw Material 520,749.9 610,800.2 753,441.0 677,252.0 926,823.4 1,259,047.9 1,391,347.4 1,294,403.4
C. Consumer Goods: 1,174,993.5 1,525,220.1 1,857,920.3 2,015,339.1 2,631,556.0 3,655,347.1 3,993,963.0 4,150,624.1
Food and Food stuffs 342,020.5 424,907.0 399,258.6 492,509.4 707,504.6 1,030,827.5 1,133,890.0 1,133,597.6
All Other Consumer Goods 832,972.9 1,100,313.1 1,458,661.7 1,522,829.6 1,924,051.3 2,624,519.6 2,860,073.0 3,017,026.6
TOTAL 5,335,330.8 6,621,417.1 9,214,793.9 8,369,982.1 11,013,002.2 16,904,729.8 17,832,232.7 19,371,778.8Notes: Convension to TZS from USD is done using monthly average exchange rate
P = Provisional
r = Revised
Source: Bank of Tanzania and Tanzania Revenue Authority
January - December
88

4.0: Balance of Payments and Foreign Trade Developments
Table 4.7: Official and Forex Bureau Exchange Rates, Mean Selling Rates in TZSEnd of
PeriodPound
SterlingUSD Deutsche
MarkSwiss Francs
Dutch Guilder
French Francs
Belgium Francs
Italian Lire
Swedish Kroner
Japanese Yen
Euro
2008 1,221.1 1,849.8 1,280.3 577.7 1,210.6 512.7 172.2 28.0 0.6 165.0 14.2 1,803.32009 1,338.3 2,113.0 1,353.6 592.7 1,266.3 526.0 176.7 28.7 0.6 183.4 14.2 1,877.02010 1,427.0 2,262.0 1,455.2 620.0 1,556.0 582.7 195.8 31.8 0.7 216.5 17.9 1,934.62011 1,561.2 2,438.3 1,571.7 669.7 1,670.0 629.4 211.5 34.4 0.7 228.0 20.4 2,032.22012 2,566.5 1,572.2 669.7 1,724.6 629.6 211.5 34.4 0.7 243.2 18.0 2,084.2
2011-Jan 1,474.8 2,384.2 1,484.7 632.6 1,575.9 594.6 199.7 32.5 0.7 230.9 18.1 2,037.9Feb 1,487.7 2,443.2 1,501.7 639.8 1,611.7 601.4 202.0 32.9 0.7 237.6 18.3 2,074.1Mar 1,495.4 2,388.3 1,488.9 634.4 1,616.9 596.2 200.3 32.6 0.7 235.5 17.8 2,109.8Apr 1,497.3 2,496.1 1,496.7 637.7 1,724.7 599.4 201.4 32.7 0.7 247.4 18.4 2,214.7May 1,516.8 2,504.1 1,519.7 647.5 1,781.9 608.6 204.5 33.2 0.7 246.7 18.7 2,193.6Jun 1,547.7 2,538.0 1,582.4 674.2 1,878.7 633.7 212.9 34.6 0.7 250.7 19.6 2,293.0Jul 1,556.2 2,593.9 1,576.5 671.7 1,989.9 631.3 212.1 34.5 0.7 251.7 20.4 2,269.4
Aug 1,578.9 2,598.6 1,605.0 683.9 2,023.7 642.7 215.9 35.1 0.7 250.7 20.9 2,289.6Sep 1,620.8 2,516.8 1,623.1 691.5 1,780.8 650.0 218.4 35.5 0.7 234.3 21.1 2,163.3Oct 1,659.3 2,643.4 1,645.7 701.2 1,871.3 659.0 221.4 36.0 0.8 252.0 21.0 2,275.5Nov 1,695.4 2,598.8 1,654.9 705.1 1,812.1 662.7 222.6 36.2 0.8 245.0 21.3 2,228.3Dec 1,604.7 2,438.3 1,571.7 669.7 1,670.0 629.4 211.5 34.4 0.7 228.0 20.4 2,032.2
2012-Jan 1,582.8 2,482.5 1,575.3 671.2 1,709.5 630.9 211.9 34.5 0.7 231.4 20.7 2,059.5Feb 1,576.2 2,507.2 1,573.8 670.5 1,743.1 630.2 211.7 34.4 0.7 238.2 19.4 2,100.6Mar 1,585.1 2,515.8 1,573.7 670.5 1,742.8 630.2 211.7 34.4 0.7 238.0 18.9 2,098.6Apr 1,544.0 2,547.5 1,569.0 668.5 1,726.7 628.3 211.1 34.3 0.7 233.5 19.5 2,075.0May 1,546.0 2,415.1 1,571.0 669.4 1,615.2 629.1 211.4 34.4 0.7 215.8 20.0 1,940.3Jun 1,578.0 2,458.0 1,569.8 668.7 1,649.4 628.6 211.2 34.3 0.7 226.3 19.7 1,981.6Jul 1,556.0 2,465.9 1,574.4 670.6 1,611.2 630.5 211.8 34.4 0.7 231.1 20.2 1,935.1
Aug 1,556.0 2,488.4 1,568.1 668.0 1,642.5 628.0 211.0 34.3 0.7 236.8 20.0 1,972.3Sep 1,557.0 2,531.8 1,570.2 668.8 1,665.3 628.8 211.2 34.3 0.7 238.8 20.2 2,012.9Oct 1,571.0 2,537.5 1,573.2 670.1 1,688.4 630.0 211.7 34.4 0.7 237.4 19.7 2,039.3Nov 1,591.0 2,519.8 1,571.2 669.2 1,698.0 629.2 211.4 34.4 0.7 236.7 19.1 2,048.3Dec 1,573.0 2,566.5 1,572.2 669.7 1,724.6 629.6 211.5 34.4 0.7 243.2 18.0 2,084.2
2013-Jan 1,589.0 2,509.6 1,581.7 673.7 1,737.0 633.4 212.8 34.6 0.7 249.4 17.2 2,154.3Feb 1,606.0 2,404.8 1,585.0 675.1 1,693.1 634.8 213.2 34.7 0.7 245.7 17.1 2,072.7Mar 1,618.0 2,424.0 1,590.8 677.6 1,682.4 637.1 214.0 34.8 0.7 244.6 17.1 2,046.3Apr 1,612.0 2,475.4 1,592.1 678.1 1,715.3 637.6 214.2 34.8 0.7 245.9 16.4 2,097.1May 1,620.0 2,434.2 1,599.7 681.4 1,672.9 640.6 215.2 35.0 0.7 241.8 15.9 2,081.6Jun 1,631.0 2,446.6 1,602.7 682.6 1,697.5 641.8 215.6 35.1 0.7 238.3 16.2 2,093.8Jul 1,617.0 2,444.1 1,613.1 687.1 1,730.1 646.0 217.0 35.3 0.7 244.9 16.4 2,133.8
Aug 1,615.0 2,495.3 1,610.9 686.2 1,730.9 645.1 216.7 35.2 0.7 243.4 16.4 2,130.7Sep 1,599.0 2,593.6 1,604.9 683.6 1,777.2 642.7 215.9 35.1 0.7 250.8 16.4 2,173.6
Note: * Period AverageSource: Bank of Tanzania
Bureau* (average)
USD
Official (End of Period)
89

4.0 Balance of Payments and Foreign Trade Developments
Table 4.8: Tanzania's Trade Balance. Million of TZS
Total Total Trade Exports Imports (f.o.b) Balance
2007 2,762,367.5 6,025,493.0 -3,263,125.5
2008 4,280,466.1 8,385,462.4 -4,104,996.4
2009 4,294,644.0 8,369,982.1 -4,075,338.1
2010r 8,829,856.7 11,013,002.2 -2,183,145.5
2011r 7,952,485.7 15,383,157.2 -7,430,671.5
2012r 9,238,221.4 16,227,331.7 -6,989,110.3
2013p 8,644,622.8 18,884,124.2 -10,239,501.4
2007 - 1st Quarter 619,547.4 1,447,453.0 -827,905.6
2nd Quarter 559,066.9 1,429,762.8 -870,695.9
3rd Quarter 652,215.1 1,536,283.2 -884,068.1
4th Quarter 679,737.8 1,611,994.0 -932,256.2
2008 - 1st Quarter 962,956.9 1,744,277.7 -781,320.8
2nd Quarter 794,049.6 2,317,272.5 -1,523,222.9
3rd Quarter 966,569.3 2,199,768.9 -1,233,199.5
4th Quarter 998,568.5 2,124,143.4 -1,125,574.8
2009 - 1st Quarter 826,435.7 1,821,780.7 -995,344.9
2nd Quarter 757,488.0 1,603,910.8 -846,422.8
3rd Quarter 1,022,617.3 2,063,150.1 -1,040,532.8
4th Quarter 1,127,932.0 2,127,842.1 -999,910.1
2010r - 1st Quarter 1,173,697.3 2,220,970.9 -1,047,273.7
2nd Quarter 1,781,516.0 2,324,775.5 -543,259.6
3rd Quarter 2,262,541.6 2,571,520.3 -308,978.7
4th Quarter 2,460,381.5 2,904,565.3 -444,183.8
2011r - 1st Quarter 1,671,570.2 2,856,450.6 -1,184,880.4
2nd Quarter 1,492,708.5 3,503,356.0 -2,010,647.5
3rd Quarter 1,853,624.4 4,318,400.2 -2,464,775.8
4th Quarter 1,897,301.9 4,704,950.4 -2,807,648.5
2012r - 1st Quarter 1,953,256.2 3,929,081.1 -1,975,824.9
2nd Quarter 2,002,284.9 3,967,175.7 -1,964,890.8
3rd Quarter 2,048,591.5 4,238,817.4 -2,190,225.9
4th Quarter 2,029,103.5 4,092,257.5 -2,063,154.0
2013p - 1st Quarter 1,632,944.2 4,677,382.7 -3,044,438.5
2nd Quarter 1,639,340.2 4,371,791.1 -2,732,450.8
3rd Quarter 2,007,639.4 4,930,729.2 -2,923,089.8
4th Quarter 2,237,139.5 4,904,221.3 -2,667,081.8Notes: 1. Convension to TZS from USD is done using monthly average exchange rate
2. Annual figures for Goods Export include adjustments on unrecorded trade r = Revised P = Provisional,
Source: Bank of Tanzania and Tanzania Revenue Authority
Period
90

4.0 Balance of Payments and Foreign Trade Developments
Table 4.9 : Tanzania's Exports by Major Commodity Groups Millions of TZS
ManufacturedPeriod Coffee Cotton Sisal Tea Tobacco Cashewnuts Minerals Products Others Total2007 121,980.5 79,942.5 11,091.9 35,890.5 108,563.7 30,983.7 1,056,594.0 383,242.5 682,277.9 2,510,567.22008 119,755.0 138,618.8 18,662.1 50,900.2 210,297.4 51,602.7 1,414,865.8 890,116.3 827,326.1 3,722,144.42009 145,296.6 145,010.8 8,785.0 61,604.7 166,116.0 89,270.3 1,665,516.8 661,442.0 791,430.8 3,734,473.02010 144,831.7 119,157.8 15,208.5 68,716.1 325,161.2 138,193.5 2,182,318.5 1,364,438.0 925,372.3 5,283,397.52011 220,392.5 99,733.7 26,347.4 73,095.9 434,458.5 164,338.6 3,569,417.9 1,339,540.9 987,879.7 6,915,205.02012r 293,256.4 259,069.4 28,871.7 88,106.6 550,106.4 224,005.3 3,439,064.9 1,630,482.9 1,520,272.4 8,033,236.02013p 272,369.1 178,686.5 27,093.3 90,767.9 492,182.0 258,301.8 2,973,442.8 1,714,057.1 1,426,556.4 7,433,457.0
2007 - 1st Quarter 52,539.6 6,953.6 3,703.6 11,773.7 28,881.7 10,672.6 274,014.6 69,113.5 161,894.4 619,547.42nd Quarter 27,545.8 3,554.9 3,189.9 13,442.9 13,653.8 531.9 256,846.6 84,720.5 155,580.7 559,066.93rd Quarter 11,113.1 23,351.8 2,702.0 4,216.4 33,006.1 599.7 285,080.2 118,204.2 173,941.6 652,215.14th Quarter 30,782.0 46,082.2 1,496.3 6,457.4 33,022.2 19,179.5 240,652.7 111,204.4 190,861.2 679,737.8
2008 - 1st Quarter 41,545.2 16,633.7 5,158.0 14,585.9 87,389.7 50,326.5 395,310.0 183,582.6 168,425.5 962,956.92nd Quarter 18,152.8 14,534.2 4,640.6 15,913.2 2,286.0 227.5 413,420.2 166,692.9 158,182.4 794,049.63rd Quarter 10,958.2 57,343.9 4,986.2 7,986.1 69,968.0 0.0 348,781.8 255,213.1 211,332.0 966,569.34th Quarter 49,098.8 50,107.0 3,877.3 12,415.0 50,653.6 1,048.7 257,353.8 284,627.8 289,386.3 998,568.5
2009 - 1st Quarter 45,311.9 23,672.9 2,304.7 17,666.0 50,032.7 61,643.2 280,898.8 170,012.6 174,892.9 826,435.72nd Quarter 45,532.8 31,367.3 790.1 12,321.6 13,900.2 312.6 347,798.5 139,653.4 165,811.6 757,488.03rd Quarter 15,314.5 38,641.2 3,162.4 7,213.0 27,535.3 0.0 508,687.4 160,740.7 261,322.8 1,022,617.34th Quarter 39,137.5 51,329.4 2,527.8 24,404.0 74,647.8 27,314.5 528,132.1 191,035.4 189,403.6 1,127,932.0
2010 - 1st Quarter 32,606.3 24,947.2 3,754.6 21,382.0 101,772.4 34,035.7 459,775.3 197,286.5 199,370.7 1,074,930.72nd Quarter 7,451.4 5,489.4 3,752.0 21,317.2 45,412.6 1,735.2 541,511.2 276,077.1 187,336.6 1,090,082.83rd Quarter 13,153.8 62,025.4 3,409.3 9,695.2 62,074.1 137.2 570,574.9 447,695.8 280,201.5 1,448,967.24th Quarter 91,620.2 26,695.8 4,292.6 16,321.7 115,902.1 102,285.4 610,457.1 443,378.6 258,463.4 1,669,416.8
2011 - 1st Quarter 92,699.8 6,505.6 6,503.2 18,872.8 189,407.5 89,079.4 751,311.5 305,927.8 211,262.6 1,671,570.22nd Quarter 34,924.0 3,128.3 6,189.6 22,722.8 58,604.6 285.3 784,277.2 366,553.1 216,023.5 1,492,708.53rd Quarter 18,517.2 41,881.3 7,352.3 14,278.0 30,652.9 133.4 1,111,033.7 329,271.6 300,504.0 1,853,624.44th Quarter 74,251.5 48,218.4 6,302.4 17,222.3 155,793.4 74,840.5 922,795.4 337,788.4 260,089.6 1,897,301.9
2012r - 1st Quarter 96,075.7 25,479.1 7,628.2 24,605.4 176,517.0 54,571.9 897,714.7 338,636.5 332,027.6 1,953,256.22nd Quarter 43,359.7 25,423.1 7,543.8 27,694.3 71,301.2 109,607.1 813,670.4 461,025.7 442,659.5 2,002,284.93rd Quarter 44,692.2 91,629.5 7,943.3 14,631.8 122,290.9 995.4 860,842.2 497,722.5 407,843.8 2,048,591.54th Quarter 109,128.8 116,537.7 5,756.4 21,175.0 179,997.3 58,830.8 866,837.7 333,098.2 337,741.5 2,029,103.5
2013P - 1st Quarter 111,443.3 39,237.4 4,114.3 30,081.9 44,615.1 112,560.4 691,037.4 362,399.5 297,371.4 1,692,860.82nd Quarter 57,832.0 3,056.6 4,924.9 26,235.9 11,169.4 41,180.8 751,518.6 380,456.2 341,212.2 1,617,586.63rd Quarter 22,235.9 56,033.8 9,688.5 16,639.4 180,389.5 5,675.6 667,492.7 492,867.1 434,847.6 1,885,870.04th Quarter 80,858.0 80,358.8 8,365.6 17,810.6 256,008.0 98,885.0 863,394.0 478,334.3 353,125.2 2,237,139.5
Notes: - Conversion to TZS from USD is done using monthly average exchange rate - Export figures does not include adjustments on unrecorded trade
91

4.0 Balance of Payments and Foreign Trade Developments
Table 4.10: Tanzania's Imports (c.i.f) by Major Commodity Groups Millions of TZS
Building Industrial Food and Other
Transport. and raw food consumer
Period equipments construction Machinery Oil Fertilizers materials stuffs goods Total
2007r 649,792.5 568,312.8 1,189,576.5 1,998,112.3 79,605.2 610,800.6 424,907.2 1,100,313.7 6,621,420.8
2008 1,114,286.6 940,527.0 1,799,531.6 2,523,077.3 226,010.1 753,441.0 399,258.6 1,458,661.7 9,214,793.9
2009 1,074,114.1 801,009.8 1,768,267.3 1,897,538.6 136,461.1 677,252.0 492,509.4 1,522,829.6 8,369,982.1
2010r 1,392,264.7 940,536.4 1,849,759.5 3,092,378.3 179,820.7 926,873.8 707,538.8 1,924,154.9 11,013,327.2
2011 1,729,600.1 1,298,783.4 3,090,632.0 5,566,864.3 304,635.2 1,258,969.8 1,030,563.9 2,624,519.6 16,904,568.3
2012 2,000,255.0 1,391,564.8 2,974,964.7 5,849,008.6 231,129.1 1,391,347.4 1,133,890.0 2,860,073.0 17,832,232.7
2013 2,038,223.1 1,686,640.6 2,354,000.2 7,565,899.4 281,988.0 1,294,403.4 1,133,597.6 3,017,026.6 19,371,778.8
2007r - 1st Quarter 125,502.2 137,316.2 292,378.8 505,545.3 4,501.4 140,054.5 112,322.9 272,986.3 1,590,607.7
2nd Quarter 166,325.4 139,882.1 340,311.8 464,633.0 10,325.6 122,806.3 78,335.7 248,548.0 1,571,167.9
3rd Quarter 170,833.3 145,272.0 278,933.6 562,584.0 35,398.6 162,558.6 67,183.8 265,459.3 1,688,223.3
4th Quarterr 187,131.6 145,842.4 277,952.3 465,349.9 29,379.5 185,381.2 167,064.9 313,320.1 1,771,422.0
2008 - 1st Quarter 243,105.7 169,667.0 347,369.4 537,554.2 6,798.4 185,276.3 111,996.9 315,020.8 1,916,788.7
2nd Quarter 313,488.9 275,791.2 519,259.1 716,981.5 56,764.6 200,709.5 65,889.4 397,569.2 2,546,453.3
3rd Quarter 291,420.6 242,851.1 512,748.5 658,573.6 84,229.9 177,338.5 90,335.4 359,830.8 2,417,328.4
4th Quarter 266,271.3 252,217.7 420,154.6 609,968.0 78,217.2 190,116.7 131,037.0 386,240.9 2,334,223.5
2009 - 1st Quarter 264,990.2 203,692.3 454,290.0 421,834.2 33,021.8 162,703.1 120,007.2 341,417.9 2,001,956.8
2nd Quarter 248,901.5 147,359.7 429,575.8 327,939.3 14,007.8 133,831.7 138,861.4 322,062.2 1,762,539.4
3rd Quarter 277,433.0 164,741.2 464,801.1 582,683.3 42,719.2 188,127.4 86,155.6 460,537.1 2,267,197.9
4th Quarter 282,789.3 285,216.6 419,600.4 565,081.9 46,712.3 192,589.9 147,485.2 398,812.4 2,338,288.0
2010r - 1st Quarter 272,944.0 208,787.7 442,856.5 782,585.7 14,106.1 194,678.7 174,839.5 349,829.3 2,440,627.4
2nd Quarter 261,882.1 181,565.3 386,357.2 894,442.4 25,533.6 217,821.4 153,763.4 433,333.1 2,554,698.4
3rd Quarter 382,548.9 283,320.5 440,869.5 676,750.7 87,405.7 230,994.6 181,127.9 542,833.2 2,825,851.2
4th Quarter 474,889.7 266,862.9 579,676.2 738,599.5 52,775.3 283,379.2 197,808.1 598,159.4 3,192,150.2
2011 - 1st Quarter 373,055.7 254,054.3 573,402.8 781,526.8 45,155.9 286,324.0 283,312.9 542,124.3 3,138,956.7
2nd Quarter 431,858.0 355,702.1 653,572.5 1,314,243.9 45,301.2 284,613.7 211,806.8 552,743.5 3,849,841.7
3rd Quarter 470,303.4 330,236.9 782,721.1 1,763,297.0 129,708.7 322,462.6 237,966.7 708,798.3 4,745,494.7
4th Quarter 454,383.1 358,790.2 1,080,935.5 1,707,796.5 84,469.4 365,569.5 297,477.4 820,853.5 5,170,275.1
2012 - 1st Quarter 410,913.4 324,294.2 709,201.3 1,456,181.9 53,656.4 324,168.4 333,281.4 705,974.6 4,317,671.5
2nd Quarter 483,743.8 343,044.7 778,157.2 1,352,050.5 13,645.0 391,576.6 308,111.5 689,204.4 4,359,533.8
3rd Quarter 536,487.7 363,396.6 790,298.8 1,602,579.5 54,944.0 349,199.6 256,362.5 704,772.4 4,658,041.1
4th Quarter 569,110.1 360,829.3 697,307.5 1,438,196.6 108,883.7 326,402.8 236,134.6 760,121.7 4,496,986.3
2013P - 1st Quarter 415,654.5 358,508.6 550,871.0 2,099,558.4 29,036.9 257,264.2 326,846.0 639,643.1 4,677,382.7
2nd Quarter 444,014.3 349,998.9 561,493.8 1,677,608.3 50,524.1 280,361.6 319,722.4 688,067.7 4,371,791.1
3rd Quarter 551,053.8 555,550.7 640,275.1 2,045,420.0 127,848.8 381,189.4 213,809.1 903,236.7 5,418,383.7
4th Quarter 627,500.5 422,582.4 601,360.3 1,743,312.7 74,578.1 375,588.2 273,220.1 786,078.9 4,904,221.3Notes: - Conversion to TZS from USD is done using monthly average exchange rateSource: Bank of Tanzania and Tanzania Revenue Authority
92

4.0 Balance of Payments and Foreign Trade Developments
Table 4.11: Tanzania's Exports by Country of DestinationMillions of TZS
Country 2006 2007 2008 2009 2010 2011 2012r
Australia 3,748.2 9,608.5 7,333.9 8,779.1 17,364.7 24,278.9 22,196.4
Belgium 32,979.1 32,079.9 53,929.9 102,452.2 131,477.2 130,053.8 238,009.8
Burundi 4,416.2 51,645.5 23,026.9 31,203.1 72,981.2 48,639.0 72,026.5
Canada 7,295.6 2,819.7 4,438.1 8,048.1 6,548.3 7,893.9 39,683.0
China 149,327.3 175,726.7 264,279.9 480,248.1 908,359.8 1,041,130.6 817,984.8
Democratic Republic of Congo 26,859.4 69,409.6 150,644.2 105,445.0 196,384.8 188,788.8 285,425.7
Denmark 956.0 2,118.8 4,558.2 6,663.6 3,792.1 14,362.2 16,811.9
Eire/Ireland 655.9 986.0 346.6 2,180.0 2,840.4 5,295.0 2,912.8
France 9,329.5 11,323.5 27,761.9 15,259.8 16,156.7 23,037.3 25,291.3
Germany 125,860.7 105,204.0 77,790.6 74,094.5 192,110.3 352,058.6 455,746.3
Hong Kong 8,459.5 17,582.0 15,785.0 112,968.9 18,059.8 17,450.8 36,367.4
India 70,439.1 96,171.0 203,097.2 242,591.1 312,958.9 320,197.9 748,938.4
Indonesia 10,150.3 19,543.6 28,665.0 27,800.7 20,291.7 34,422.1 63,764.2
Italy 36,333.5 69,176.5 79,549.7 70,979.1 93,626.5 78,699.4 78,750.3
Japan 82,003.2 71,038.2 161,859.3 217,362.0 300,373.0 547,693.7 466,079.8
Kenya 111,502.9 125,790.9 277,819.7 234,125.4 425,809.7 333,609.9 520,143.0
Malaysia 1,763.8 2,150.8 3,484.9 3,896.0 6,778.2 13,622.5 15,423.3
Mozambique 13,109.5 23,762.9 37,142.9 26,814.7 25,390.2 97,802.9 83,499.8
Netherland 108,244.8 112,651.0 184,508.2 219,871.2 128,355.1 144,176.6 177,033.8
New Zealand 110.1 4,055.1 2,886.6 2,685.8 2,871.0 1,158.8 4,902.4
Norway 637.7 2,163.9 2,165.5 1,763.6 1,685.6 4,476.3 29,027.4
Pakistan 17,228.8 31,167.6 13,460.4 14,248.2 13,938.2 22,998.1 51,882.0
Portugal 9,290.4 38,120.6 15,493.6 17,558.2 17,534.7 20,693.0 19,820.8
Singapore 5,593.4 4,958.6 13,179.5 8,411.8 19,328.8 17,259.1 38,225.8
Somalia 248.0 533.3 3,315.5 797.1 8,243.0 1,095.5 1,637.0
South Africa 198,557.2 201,331.5 274,866.9 225,538.0 596,978.4 1,312,795.7 1,521,227.4
Spain 13,066.8 23,048.8 30,640.2 27,950.0 30,138.0 21,706.3 25,753.9
Sri Lanka 2,132.6 3,548.7 3,076.1 703.9 2,836.8 2,786.0 2,244.1
St. Helena 0.1 74.3 442.5 7,993.4 8,721.0 0.0 25.4
Sweden 635.4 3,148.6 1,738.1 3,590.3 3,334.2 4,827.2 8,235.1
Switzerland 299,805.4 498,327.3 668,711.0 617,209.6 982,361.5 1,292,703.6 1,245,696.8
Taiwan 1,280.5 1,587.4 751.7 5,322.8 3,322.7 1,609.7 1,804.8
Thailand 11,590.6 14,401.1 16,207.2 18,475.9 27,650.7 11,488.0 56,213.6
Uganda 24,466.8 23,992.1 47,871.3 62,993.8 67,049.4 70,430.1 103,386.6
United Arab Emirates 51,389.6 110,022.1 77,325.4 88,169.9 79,186.8 118,325.6 148,006.1
United Kingdom 84,324.4 31,875.0 76,505.2 40,186.8 45,218.9 45,327.4 71,042.2
United States 24,223.4 42,518.8 65,122.8 52,093.1 66,563.0 74,953.9 105,008.4
USSR/Russia 2,809.8 6,471.1 6,002.7 7,692.4 5,953.8 10,252.4 16,698.1
Yugoslavia 6.9 7.2 0.0 52.0 80.7 0.0 12.6
Zambia 18,948.8 27,910.2 43,237.0 58,526.8 76,618.2 74,470.4 112,288.0
Others 616,236.6 442,514.8 753,123.2 481,727.4 344,123.5 382,633.8 304,009.2
Grand Total 2,186,017.5 2,510,567.2 3,722,144.5 3,734,473.0 5,283,397.5 6,915,204.9 8,033,236.0
Notes: r = RevisedOthers include information of unrecorded exports
Source: Bank of Tanzania and Tanzania Revenue Authority
93

4.0 Balance of Payments and Foreign Trade Developments
Table 4.12:Tanzania's Imports(c.i.f) by Country of OriginsMillions of TZS
Country 2006 2007 2008 2009 2010 2011 2012P
Argentina 17,350.0 30,983.3 73,480.0 49,197.8 43,764.4 43,764.4 192,859.5Australia 33,464.4 31,464.1 67,419.6 162,610.7 222,797.3 223,875.8 193,689.0Belgium 92,631.6 135,951.8 147,083.8 141,919.9 183,024.4 183,919.9 345,750.8Brazil 14,878.6 24,508.0 15,568.2 70,214.0 57,470.7 57,472.2 90,275.9Burundi 2.2 19.8 505.8 402.5 840.9 873.1 6,066.4Canada 46,281.9 44,284.7 67,545.8 46,496.3 52,136.1 52,224.8 174,316.9China 381,692.1 512,890.5 841,597.9 895,038.2 1,212,792.9 1,244,042.7 1,814,049.4Democratic Republic of Congo 182.9 741.7 4,488.9 1,608.3 1,569.4 2,649.0 1,414.0Denmark 15,467.7 28,043.1 31,505.4 146,074.4 45,086.5 46,559.7 42,975.4Eire/Ireland 19,100.7 31,135.6 22,158.2 20,975.8 23,203.4 24,374.8 26,989.4Finland 18,736.0 132,226.1 50,262.2 57,744.7 56,518.6 56,740.4 35,449.7France 71,087.6 162,119.1 188,717.9 145,111.1 178,242.4 178,641.4 169,788.8Germany, Federal 187,389.6 194,240.2 249,035.3 293,353.5 254,335.7 255,395.3 292,440.9Hong Kong 10,244.8 14,678.7 21,392.8 40,597.2 33,316.7 33,379.8 83,187.0India 293,344.2 631,862.4 1,016,503.4 999,540.7 1,238,372.1 1,239,134.6 1,373,732.4Indonesia 196,028.5 159,404.0 107,733.2 141,412.0 155,616.9 155,779.5 370,583.0Iran 17,700.9 26,294.4 40,971.1 14,444.8 30,679.7 30,721.8 73,137.1Italy 113,221.1 102,750.6 104,384.0 128,860.1 133,376.4 137,417.7 182,804.2Japan 310,375.3 325,726.2 405,343.6 545,953.7 786,056.8 794,383.2 808,560.1Kenya 191,252.1 124,630.1 233,967.0 393,748.1 380,896.0 388,779.9 880,188.6Malaysia 118,687.4 182,428.7 192,254.7 87,695.2 147,925.2 147,925.2 137,851.0Mexico 13,386.5 3,247.0 134.3 1,276.5 1,821.5 1,821.5 1,713.9Mozambique 21,226.5 20,988.4 21,513.2 11,857.6 26,518.2 26,630.0 17,471.4Netherlands 106,637.9 106,273.9 248,052.9 122,100.0 199,052.2 201,588.3 248,542.6New Zealand 2,092.7 3,012.6 3,702.9 2,856.2 5,273.0 5,273.0 3,862.6Norway 10,277.6 11,071.4 21,264.1 17,987.5 22,328.7 22,329.5 92,221.8Pakistan 18,370.8 15,119.0 20,052.2 36,140.5 59,658.7 59,681.9 122,635.0Portugal 32.9 472.3 917.3 1,111.2 12,852.1 1,659.6 2,836.0Saudi Arabia 312,889.5 272,318.0 304,719.1 213,014.2 275,426.8 275,502.5 360,197.8Singapore 16,611.1 31,354.5 518,267.5 248,364.3 614,911.4 616,616.3 230,638.6Somalia 5.6 119.5 1,112.3 389.6 45.1 45.1 10.2South Africa 675,401.5 730,969.6 935,205.5 888,001.2 1,067,772.7 1,068,580.0 1,458,335.4South Korea 82,165.3 93,625.6 100,735.3 97,885.1 177,995.5 178,066.5 186,529.9Spain 17,247.0 22,224.5 34,692.4 40,871.4 51,360.9 51,361.0 73,332.5Sri Lanka 2,075.8 3,752.7 3,189.5 3,162.3 3,455.9 3,456.8 5,430.4Swaziland 20,746.1 25,062.1 90,423.8 34,720.6 45,396.1 45,484.8 54,770.3Sweden 64,454.9 128,595.2 167,644.2 108,717.5 84,766.0 89,267.9 172,910.7Switzerland 84,076.7 214,218.6 162,881.0 174,060.1 777,212.0 777,236.5 2,467,204.2Taiwan 14,394.7 20,746.3 13,436.4 16,269.3 37,636.5 37,636.6 45,242.7Thailand 45,613.7 73,378.3 88,341.7 92,154.4 111,230.5 112,855.6 118,265.0Turkey 38,857.8 57,646.7 93,229.0 98,961.8 82,466.5 82,466.5 185,925.6Uganda 4,766.4 7,980.4 7,588.6 15,693.6 24,750.7 25,121.8 169,013.6United Arab Emirate 618,949.9 963,802.7 1,053,525.3 816,795.9 930,045.0 933,293.0 1,600,011.8United Kingdom 194,536.0 214,155.8 195,135.0 237,245.8 287,635.6 289,496.1 574,249.3United States 150,019.1 233,287.9 236,992.6 179,535.0 215,698.5 218,798.5 372,948.8USSR/Russia 53,694.5 88,679.5 87,823.1 84,124.2 140,583.7 140,660.6 127,112.8Yugoslavia 0.9 0.0 0.0 7.1 145.1 144.2 1.0Zambia 14,334.2 2,288.7 32,663.2 30,731.4 42,674.9 42,684.3 62,753.6Zimbabwe 1,611.0 23,035.2 1,732.1 834.1 1,546.4 1,546.4 4,569.6Others 601,734.5 357,611.5 887,900.7 412,114.7 475,044.1 559,073.0 1,777,386.2Grand Total 5,335,330.8 6,621,420.8 9,214,793.9 8,369,982.1 11,013,327.1 11,166,432.9 17,832,232.7Note: P = Provisional
Others include information of unrecorded imports Source: Bank of Tanzania and Tanzania Revenue Authority
94

4.0 Balance of Payments and Foreign Trade Developments
Table 4.13: Tanzania's Exports to COMESA CountriesMillions of TZS
Country 2006 2007 2008 2009 2010r 2011 2012P
Burundi 4,416.2 51,645.5 23,026.9 31,203.1 72,981.2 48,639.0 72,026.5
Comoro 9,322.2 4,470.3 58,707.8 283.3 0.0 1,249.7 3,287.5
Djibout 4.9 59.5 383.5 233.3 374.4 1,402.1 1,062.1
Ethiopia 786.9 1,098.2 1,091.4 778.2 2,215.8 558.1 4,679.1
Kenya 111,502.9 125,790.9 277,819.7 234,125.4 334,400.2 333,609.9 520,143.0
Lesotho 0.0 0.0 0.0 0.0 0.0 13.0 0.0
Malawi 22,206.9 24,476.1 49,913.5 33,151.2 56,575.8 81,048.3 139,858.5
Mauritius 1,134.0 2,196.0 1,084.8 1,928.7 2,268.4 3,818.0 7,305.8
Rwanda 3,401.5 13,913.2 24,340.0 19,887.6 120,820.8 103,886.5 115,323.9
Somalia 248.0 533.3 3,315.5 797.1 8,243.0 1,095.5 1,637.0
Swaziland 2,350.4 242.7 759.1 27,515.6 1,737.3 19,693.7 3,546.4
Uganda 24,466.8 23,992.1 47,871.3 62,993.8 67,049.4 70,430.1 103,386.6
Zambia 18,948.8 27,910.2 43,237.0 58,526.8 76,618.2 74,470.4 112,288.0
Zimbabwe 1,483.2 857.2 1,360.1 7,556.0 1,970.8 6,510.6 7,478.8
Grand Total 200,272.8 277,185.1 532,910.7 478,980.1 745,255.3 746,424.8 1,092,023.3Note: r = Revised
P = ProvisionalSource: Bank of Tanzania and Tanzania Revenue Authority
95

4.0 Balance of Payments and Foreign Trade Developments
Table 4.14: Tanzania's Direct Imports from COMESA CountriesMillions of TZS
Country 2006 2007 2008 2009 2010 2011 2012P
Burundi 2.2 19.8 505.8 402.5 840.9 873.1 6,066.4
Comoro 23.6 0.0 17.2 13.9 61.2 67.5 35.3
Djibout 0.0 0.0 1.4 44.0 25.9 1,587.6 104.4
Ethiopia 202.2 114.7 32.5 192.6 105.8 105.8 1,615.2
Kenya 191,252.1 124,630.1 233,967.0 393,748.1 380,896.0 388,779.9 880,188.6
Lesotho 79.5 10.9 2.6 56.7 213.1 213.1 141.5
Malawi 4,586.2 8,034.3 7,889.7 13,988.5 16,850.5 16,877.0 19,599.0
Mauritius 3,788.7 3,247.0 1,375.1 5,051.9 11,351.0 11,474.3 28,331.8
Rwanda 190.1 18.2 59.4 25.0 1,959.4 1,962.1 3,305.7
Somalia 5.6 119.5 1,112.3 389.6 45.1 45.1 10.2
Swaziland 20,746.1 25,062.1 90,423.8 34,720.6 45,396.1 45,484.8 54,770.3
Uganda 4,766.4 7,980.4 7,588.6 15,693.6 930,045.0 25,121.8 169,013.6
Zambia 14,334.2 2,288.7 32,663.2 30,731.4 42,674.9 42,684.3 62,753.6
Zimbabwe 1,611.0 23,035.2 1,732.1 834.1 1,546.4 1,546.4 4,569.6 Grand Total 241,587.9 194,560.9 377,370.6 495,892.5 1,432,011.4 536,822.7 1,230,505.2
Note: P = ProvisionalSource: Bank of Tanzania and Tanzania Revenue Authority
96

4.0 Balance of Payments and Foreign Trade Developments.
Table 4.15: Tanzania: Services, Income and TransfersMillions TZS
Net Receipts Payments Net Receipts Payments Net Receipts Payments2007 577,348.2 2,333,405.5 1,756,057.4 -71,771.3 133,511.4 205,282.7 812,802.4 903,114.4 90,312.02008 465,749.1 2,389,020.3 1,923,271.2 -110,193.6 146,275.1 256,468.7 739,197.4 834,389.8 95,192.42009 192,745.8 2,448,649.9 2,255,904.0 -94,166.0 212,818.7 306,984.7 921,982.7 1,012,343.6 90,360.92010 285,330.4 2,882,125.1 2,596,794.7 -58,079.4 226,138.2 284,217.6 1,491,512.4 1,602,104.5 110,592.12011 147,092.3 3,599,316.2 3,452,223.9 -349,024.2 285,405.3 634,429.6 1,434,156.9 1,579,336.4 145,179.62012 671,936.9 4,379,336.8 3,707,399.9 -429,202.0 205,969.6 635,171.6 1,285,597.6 1,451,315.8 165,718.22013 1,074,749.6 5,098,750.0 4,024,000.4 -555,831.0 212,088.5 767,919.5 1,488,072.7 1,588,569.0 100,496.3
2007 - 1st Quarter 152,201.2 588,461.1 436,259.9 -13,083.3 24,467.8 37,551.1 56,513.9 80,748.8 24,234.92nd Quarter 122,909.6 571,188.9 448,279.3 -18,268.7 32,831.1 51,099.8 13,595.4 38,816.0 25,220.63rd Quarter 191,400.0 629,013.3 437,613.3 -23,013.1 41,946.0 64,959.1 586,889.5 608,270.4 21,380.94th Quarter 110,837.4 544,742.3 433,904.9 -17,406.3 34,266.5 51,672.8 155,803.6 175,279.2 19,475.6
2008 - 1st Quarter 112,296.1 552,331.6 440,035.5 -15,551.3 38,166.7 53,718.0 53,588.7 74,039.5 20,450.82nd Quarter 135,418.8 607,949.7 472,530.9 -33,471.3 40,127.9 73,599.2 51,960.4 84,112.5 32,152.13rd Quarter 158,842.4 628,909.1 470,066.7 -18,614.5 36,177.0 54,791.4 267,142.7 289,312.1 22,169.44th Quarter 59,191.8 599,829.9 540,638.1 -42,556.6 31,803.5 74,360.0 366,505.5 386,925.7 20,420.20.0 0.0
2009 - 1st Quarter -31,416.8 540,276.9 571,693.8 -36,896.9 38,673.1 75,570.0 182,832.5 204,006.9 21,174.32nd Quarter 17,047.4 512,606.8 495,559.5 -15,907.2 51,020.4 66,927.6 97,513.9 119,009.7 21,495.73rd Quarter 97,540.6 694,851.7 597,311.1 -24,393.0 61,492.4 85,885.4 495,696.2 519,497.1 23,800.94th Quarter 109,574.8 700,914.4 591,339.6 -16,968.9 61,632.7 78,601.6 145,940.1 169,830.0 23,890.00.0 0.0
2010 - 1st Quarter -24,403.5 581,290.6 605,694.0 -17,116.3 46,777.0 63,893.3 281,850.3 305,762.9 23,912.62nd Quarter 47,986.3 611,404.3 563,418.0 -38,752.2 44,055.0 82,807.2 117,960.7 142,489.1 24,528.43rd Quarter 199,761.8 856,125.0 656,363.2 -9,263.3 59,002.4 68,265.7 312,381.1 344,482.2 32,101.14th Quarter 61,985.8 833,305.2 771,319.5 7,052.3 76,303.7 69,251.4 779,320.3 809,370.3 30,050.0
2011 - 1st Quarter -15,711.3 739,430.1 755,141.4 -57,109.5 83,442.2 140,551.7 156,097.6 185,964.7 29,867.12nd Quarter 14,137.9 743,548.0 729,410.1 -77,088.1 75,676.4 152,764.5 209,723.4 241,229.6 31,506.23rd Quarter 157,509.6 1,087,772.0 930,262.4 -111,864.3 56,683.3 168,547.5 131,402.0 172,123.4 40,721.34th Quarter -8,844.0 1,028,566.0 1,037,410.0 -102,962.4 69,603.5 172,565.9 936,933.9 980,018.7 43,084.9
2012 - 1st Quarter -15,750.0 904,286.6 920,036.6 -91,964.1 60,542.7 152,506.8 153,635.9 196,783.2 43,147.32nd Quarter 113,245.8 952,834.5 839,588.7 -105,956.3 56,639.7 162,595.9 267,228.5 317,601.5 50,373.03rd Quarter 330,519.2 1,263,644.3 933,125.1 -105,245.4 37,480.5 142,725.9 498,027.1 534,281.0 36,254.04th Quarter 243,921.8 1,258,571.4 1,014,649.5 -126,036.2 51,306.7 177,342.9 366,706.1 402,650.0 35,943.9
2013 - 1st QuarterP 52,157.4 1,034,115.4 981,958.0 -135,416.3 52,723.0 188,139.3 217,447.2 241,423.7 23,976.52nd Quarterr 227,935.6 1,073,797.1 845,861.5 -138,673.7 52,331.4 191,005.1 158,468.6 182,593.6 24,125.03rd Quarter 412,014.9 1,509,361.9 1,097,347.0 -132,597.6 59,022.7 191,620.3 738,319.9 773,400.5 35,080.64th Quarter 382,641.7 1,481,475.6 1,098,833.9 -149,143.5 48,011.3 197,154.8 373,837.0 391,151.1 17,314.2
Notes: P = Provisional, r =Revised
Source: Bank of Tanzania
Services Income Current TransfersPeriod
97

4.0 Balance of Payments and Foreign Trade Developments
Table 4.16: Tanzania's Foreign Reserve PositionMillions of TZS
SDRs RPF Other UFC Net
Foreign ForeignAssets Assets Liabilities Net Assets Liabilities Assets
2008 - Mar 3,381,392.4 0.0 246.2 34,088.6 3,415,727.2 4,467.3 3,420,194.5 22,951.3 67,347.3 3,329,895.9 0.0 3,392,775.9 920,178.1 227,964.8 692,213.2 105,106.7 74,819.7 722,500.2
Jun 3,127,552.9 0.0 174.5 13,511.7 3,141,239.1 4,581.5 3,145,820.6 21,507.5 64,686.4 3,059,626.7 0.0 3,119,731.7 828,981.1 260,199.8 568,781.4 104,140.5 103,721.3 569,200.5
Sep 3,150,092.8 0.0 536.7 -2,732.7 3,147,896.9 3,840.3 3,151,737.1 20,592.7 61,576.1 3,069,568.3 0.0 3,127,304.1 721,685.4 210,943.4 510,742.0 111,327.4 132,021.6 490,047.8
Dec 3,645,604.8 0.0 39.2 32,106.5 3,677,750.4 8,767.6 3,686,518.0 22,554.5 71,816.4 3,592,147.1 0.0 3,655,195.9 730,323.0 165,433.4 564,889.6 104,411.9 174,691.2 494,610.3
2009 - Mar 3,505,928.3 0.0 86.6 42,565.1 3,548,580.1 4,824.6 3,553,404.7 23,143.4 73,133.8 3,457,127.4 0.0 3,525,436.7 820,381.2 119,016.0 701,365.2 68,737.1 81,971.3 688,131.0
Jun 3,773,577.2 0.0 148.7 27,078.1 3,800,804.0 4,206.1 3,805,010.0 343,101.0 66,775.0 3,395,134.0 0.0 3,457,703.0 861,465.6 128,299.0 733,166.6 173,404.9 104,918.7 801,652.8
Sep 4,275,819.6 0.0 327,137.8 35,167.7 4,638,125.1 4,127.9 4,642,253.0 350,028.2 395,101.5 3,897,123.3 0.0 4,288,096.9 894,551.5 124,998.1 769,553.3 254,431.2 56,867.8 967,116.7
Dec 4,312,412.1 0.0 325,589.8 27,478.6 4,665,480.5 4,844.1 4,670,324.6 430,989.2 394,334.1 3,845,001.2 0.0 4,234,491.3 1,040,125.4 121,488.1 918,637.3 254,471.2 78,598.7 1,094,509.8
2010 - Mar 4,312,760.4 0.0 320,783.7 21,503.6 4,655,047.7 4,680.9 4,659,728.6 424,677.8 388,398.9 3,846,652.0 0.0 4,230,369.9 1,055,342.0 110,519.1 944,822.8 203,357.5 77,296.3 1,070,883.9
Jun 4,460,441.4 0.0 322,830.9 20,341.3 4,803,613.7 4,161.3 4,807,775.0 467,977.7 390,742.1 3,949,055.2 0.0 4,335,636.0 1,302,191.5 111,697.0 1,190,494.5 210,804.6 85,099.2 1,316,199.9
Sep 4,886,921.4 0.0 364,738.7 74,613.4 5,326,273.5 5,215.0 5,331,488.5 529,089.3 442,616.3 4,359,783.0 0.0 4,797,184.3 1,130,017.2 147,462.3 982,554.9 221,472.2 57,367.9 1,146,659.2
Dec 5,322,872.3 0.0 354,768.8 60,860.8 5,738,501.8 5,272.6 5,743,774.4 514,204.0 430,171.5 4,799,399.0 0.0 5,224,297.9 1,353,121.8 146,511.8 1,206,610.0 188,971.6 69,372.9 1,326,208.8
2011 - Mar 5,046,837.3 0.0 371,467.7 84,022.5 5,502,327.5 5,372.6 5,507,700.1 539,634.7 452,674.6 4,515,390.8 0.0 4,962,692.8 1,352,865.5 150,881.9 1,201,983.7 329,414.4 220,010.4 1,311,387.7
Jun 5,253,125.0 0.0 397,912.9 24,281.7 5,675,319.6 5,906.9 5,681,226.5 578,194.2 484,942.9 4,618,089.4 0.0 5,097,125.4 1,410,944.4 223,061.0 1,187,883.3 248,066.0 250,004.3 1,185,945.0
Sep 5,239,065.2 0.0 401,612.4 30,899.9 5,671,577.5 2,200.1 5,673,777.6 584,387.3 488,043.4 4,601,346.9 0.0 5,087,190.2 1,514,742.8 191,755.7 1,322,987.1 173,365.5 81,089.3 1,415,263.3
Dec 5,491,281.6 0.0 375,910.7 -700.9 5,866,491.4 1,055.6 5,867,546.9 547,398.1 456,959.0 4,863,189.8 0.0 5,319,093.3 1,505,320.6 226,393.5 1,278,927.2 191,567.7 60,053.6 1,410,441.3
2012 - Mar 5,160,635.5 0.0 380,145.3 6,441.2 5,547,222.0 2,163.9 5,549,385.9 554,233.5 463,798.5 4,531,353.9 0.0 4,992,988.5 1,405,328.2 213,748.8 1,191,579.4 204,417.1 63,547.5 1,332,449.1
Jun 5,547,970.8 0.0 369,525.3 39,836.5 5,957,332.6 2,506.4 5,959,839.1 539,104.4 451,698.1 4,969,036.5 0.0 5,418,228.2 1,298,654.8 268,670.1 1,029,984.7 131,247.5 96,462.4 1,064,769.8
Sep 5,948,611.9 0.0 374,697.6 49,055.2 6,372,364.7 2,743.8 6,375,108.5 547,617.6 460,528.1 5,366,962.9 0.0 5,824,747.1 1,368,900.0 274,447.4 1,094,452.6 52,834.6 139,020.4 1,008,266.8
Dec 5,972,418.0 0.0 373,865.6 48,877.2 6,395,160.8 2,919.8 6,398,080.6 546,738.4 460,357.5 5,390,984.6 0.0 5,848,422.4 1,260,420.2 274,789.9 985,630.3 133,720.7 108,647.9 1,010,703.1
2013 - Mar 6,596,654.8 0.0 366,950.5 41,762.2 7,005,367.5 1,890.0 7,007,257.5 714,833.2 453,541.9 5,838,882.4 0.0 6,290,534.2 1,394,622.6 427,641.1 966,981.5 151,305.1 163,552.0 954,734.5
Jun 6,581,090.1 0.0 370,256.4 25,816.3 6,977,162.8 2,464.7 6,979,627.5 722,593.6 459,319.6 5,797,714.4 0.0 6,254,569.2 1,236,116.1 683,397.9 552,718.2 66,193.2 199,613.9 419,297.6
Sep 6,956,831.7 0.0 376,148.4 34,374.4 7,367,354.5 1,491.1 7,368,845.6 736,115.6 474,200.0 6,158,530.0 0.0 6,631,238.9 1,233,267.9 704,968.0 528,299.9 177,378.4 172,899.3 532,779.1
Dec 0.0 0.0Notes: SDRs = Special Drawing Rights RPF = Reserve Position in the Fund UFC = Use of Fund CreditSource: Bank of Tanzania
End of Period Liquidity Foreign Other ForeignNet Official
Position
Bank of Tanzania Commercial banksCentral Govern
ment
Foreign exchange
Official Reserve Assets
Total Foreign Assets
Other Foreign Assets
Net Foreign Assets
Gold Reserves
98

5.0 External Debt Developments
Table 5.1: External Debt DevelopmentsMillions of USD
Sep-11 Dec-11 Mar-12 Jun-13 Sep-12 Dec-12r Mar-13r Jun-13r Sep-13P Dec-13P
1. Overall Total Debt Committed2 11,336.1 14,098.1 16,694.4 11,807.2 11,729.3 12,064.0 14,098.1 13,498.1 13,790.4 16,414.2 16,694.4 17,333.7 17,655.4 Disbursed outstanding debt 7,843.7 8,873.0 10,693.4 8,124.5 8,165.5 8,460.2 8,873.0 8,958.9 9,141.8 10,233.9 10,693.4 11,425.1 11,699.1 Undisbursed debt 3,492.4 5,225.1 6,001.0 3,682.7 3,563.8 3,603.8 5,225.1 4,539.2 4,648.6 6,180.3 6,001.0 5,908.6 5,956.32. Disbrsed Debt by Creditor Category2 7,843.7 8,873.0 10,693.4 8,124.5 8,165.5 8,460.2 8,873.0 8,958.9 9,141.8 10,233.9 10,693.4 11,425.1 11,699.1 o/w Bilateral debt 978.7 1,015.8 940.9 1,055.4 1,009.7 1,009.2 1,015.8 1,004.9 970.4 1,226.7 940.9 1,034.2 1,030.3 Multilateral debt 5,250.2 5,615.8 6,265.5 5,253.6 5,111.2 5,426.5 5,615.8 5,652.6 5,901.5 5,882.3 6,265.5 6,662.4 6,853.3 Commercial debt 1,037.9 1,628.7 2,813.2 1,224.9 1,423.9 1,422.7 1,628.7 1,633.6 1,649.4 2,444.7 2,813.2 3,015.6 3,050.3
Export credits 576.9 612.7 673.8 590.5 620.7 601.8 612.7 667.8 620.5 680.2 673.8 713.0 765.23. Disbursed Debt by Borrower Category2 7,843.7 8,873.0 10,693.4 8,124.5 8,165.5 8,460.2 8,873.0 8,958.9 9,141.8 10,233.9 10,693.4 11,425.1 11,699.1 o/w Central Government 6,057.9 7,141.3 8,716.7 6,210.1 6,372.5 6,724.0 7,141.3 7,202.3 7,447.5 8,217.6 8,716.7 9,377.3 9,605.9 Public Corporations 557.8 404.6 454.8 550.3 544.7 474.3 404.6 411.9 410.9 511.2 454.8 523.6 524.1 Private Sector 1,228.0 1,327.0 1,521.9 1,364.1 1,248.4 1,261.9 1,327.0 1,344.6 1,283.4 1,505.1 1,521.9 1,524.2 1,569.14. Disbursed Debt by Use of Funds2 7,843.7 8,873.0 10,693.4 8,124.5 8,165.5 8,460.2 8,873.0 8,958.9 9,141.8 10,233.8 10,693.4 11,425.1 11,699.1
o/w Balance of payment support 2,348.5 2,522.0 2,533.9 2,403.3 1,870.5 2,511.6 2,522.0 1,754.2 1,908.7 2,423.8 2,533.9 2,422.4 2,120.3 Transport & Telecommunication 990.4 1,391.3 1,757.1 1,048.8 833.3 939.5 1,391.3 1,427.4 1,552.1 1,859.5 1,757.1 2,750.5 3,105.9 Agriculture 837.4 761.5 926.3 897.7 867.3 940.8 761.5 983.8 1,045.1 925.2 926.3 1,001.9 1,153.3 Energy & Mining 728.4 652.7 878.2 747.0 603.4 668.6 652.7 591.4 617.0 579.6 878.2 1,014.7 1,172.8 Industries 201.7 193.0 216.5 210.3 171.1 196.8 193.0 192.1 179.9 216.5 216.5 231.1 235.4 Social Welfare & Education 1,201.1 1,620.7 2,157.6 1,139.9 1,531.5 1,434.6 1,620.7 2,076.7 2,309.7 2,127.5 2,157.6 1,978.9 2,059.7 Finance and Insurance 188.9 326.5 344.6 318.6 286.0 325.6 326.5 295.4 296.2 318.7 344.6 346.4 361.6 Tourism 123.2 119.1 100.6 136.0 146.2 122.8 119.1 110.9 101.4 100.7 100.6 102.3 105.4 Others 1,224.2 1,286.3 1,778.6 1,223.0 1,856.2 1,319.8 1,286.3 1,527.0 1,131.6 1,682.3 1,778.6 1,576.9 1,384.75. Total Amount of Loans Contracted1 473.6 515.9 1,073.6 12.3 9.6 19.6 474.4 53.8 40.3 628.5 147.0 75.8 2.2 Government 312.7 414.5 674.5 0.0 0.0 0.0 414.5 0.0 0.0 600.0 134.6 0.0 0.0 Public Corporations 0.0 0.0 149.2 0.0 0.0 0.0 0.0 0.0 0.0 0.0 0.0 0.0 0.0 Private 161.0 101.4 250.0 12.3 9.6 19.6 59.9 53.8 40.3 28.5 12.4 75.8 2.26. Disbursement1 540.6 1,287.0 2,173.2 381.5 232.7 116.5 556.2 152.7 150.6 818.2 659.5 267.1 270.9 Government 438.6 1,091.5 1,874.0 293.6 185.6 116.0 496.3 150.0 148.1 644.7 657.8 263.3 270.3 Public Corporations 0.0 0.0 114.1 0.0 0.0 0.0 0.0 0.0 0.0 114.1 0.0 0.0 0.0 Private 102.0 195.4 185.0 87.9 47.1 0.5 59.9 2.7 2.5 59.4 1.7 3.8 0.67. Scheduled Debt Service1 392.8 28.9 28.9 0.0 0.08. Actual Debt Service1 104.3 99.4 148.3 17.3 15.5 30.8 35.7 16.2 46.8 38.0 44.7 42.9 56.5 Principal 59.3 44.5 53.3 8.9 8.4 13.7 13.5 8.7 17.7 11.8 15.1 12.8 29.7 Interest 45.0 48.6 61.8 8.5 7.1 17.1 16.0 4.8 16.2 11.2 29.6 29.3 26.7 Others 0.0 6.3 30.5 0.0 0.0 0.0 6.3 2.7 12.9 14.9 0.0 0.8 0.19. Net Transfers1 436.3 1,187.6 1,635.2 364.2 217.2 85.7 520.5 136.5 103.7 780.2 614.8 224.2 214.410.Total Arrears by Creditor Category2 3,088.1 2,634.1 2,770.8 3,108.4 2,849.8 2,445.8 2,634.1 2,806.4 2,772.0 2,808.3 2,770.7 2,747.2 2,943.9 o/w Principal 1,294.3 1,152.4 1,375.0 1,338.3 1,076.8 1,007.0 1,152.4 1,289.2 1,248.9 1,309.8 1,374.9 1,428.0 1,447.3 Bilateral 459.6 403.3 356.5 466.3 408.8 395.5 403.3 380.9 373.1 361.7 356.5 366.3 369.9 Multilateral* 15.1 6.4 19.8 16.2 9.8 3.8 6.4 7.6 9.3 14.8 19.8 24.3 25.3 Commercial 492.9 464.8 674.6 504.3 346.8 350.0 464.8 599.8 583.9 636.7 674.6 696.4 700.5 Other Private Creditors 326.7 277.9 324.0 351.5 311.4 257.8 277.9 300.9 282.6 296.6 324.0 340.9 351.6 Interest 1,793.8 1,481.6 1,395.8 1,770.1 1,772.9 1,438.8 1,481.6 1,517.2 1,523.1 1,498.5 1,395.8 1,319.2 1,496.6 Bilateral 730.9 770.5 767.2 742.0 753.3 763.2 770.5 777.6 792.8 782.0 767.2 783.6 801.7 Multilateral* 17.4 7.5 5.4 16.9 14.9 6.6 7.5 6.9 7.5 6.7 5.4 8.9 6.6 Commercial 697.2 567.9 516.1 660.9 622.7 543.5 567.9 591.9 597.6 582.5 516.1 418.5 548.5 Other Private Creditors 348.3 135.7 107.1 350.3 382.0 125.5 135.7 140.7 125.2 127.3 107.1 108.4 139.811. External Debt Stock 9,637.5 10,354.6 12,089.2 9,894.6 9,938.4 9,899.0 10,354.6 10,476.1 10,664.9 11,732.4 12,089.2 12,744.3 13,195.712. Domestic Debt Stock 2,364.1 2,650.6 3,519.4 2,448.1 2,469.7 2,672.3 2,650.6 2,947.1 3,277.8 3,424.9 3,424.9 3,829.7 3,831.713. Total Debt Stock 12,001.6 13,005.2 15,608.6 12,342.7 12,408.1 12,571.3 13,005.2 13,423.1 13,942.7 15,157.3 15,514.1 16,574.0 17,027.414. Export of Goods and Services 6,446.8 7,305.8 7,566.7 1,855.6 1,801.8 1,781.0 1,867.4 2,080.8 2,134.7 1,683.6 1,667.6 1,689.2 2,513.515. GDP at Market Prices-Current Prices 22,095.8 26,212.6 30,265.216. External Debt Stock as % of GDP 43.6 39.5 39.917. Total Debt Stock as % of GDP 54.3 49.6 51.618. External debt service as % of exports 1.6 1.4 2.0 0.9 0.9 1.7 1.9 0.8 2.2 2.3 2.7 2.5 2.2End of Period Exchange Rate (TZS/USD) 1,579.7 1,568.9 1,602.7 1,631.2 1,669.2 1,575.0 1,568.9 1,569.3 1,571.6 1,590.5 1,602.7 1,604.9 1,578.6 Notes: * Multilateral arrears are those owed by the private sector. 1 During the period 2 End of period, cummulative
P = Provisional r = Revised
Source: Bank of Tanzania
2013/142012/132012/132011/12 2011/12Item 2010/11
99

6.0 International Economic and Financial Developments
Table 6.1: Economic Performance in G-7 Countries and the Euro AreaPercent
Mar Jun Sep Dec Mar Jun Sep Dec Mar Jun Sep Dec Mar Jun Sep Dec Mar Jun Sep DecCanada
Real GDP1 2.8 2.7 0.5 -2.6 3.3 2.6 2.0 -1.8 -0.7 0.2 1.2 1.4 0.6 0.3 0.8 0.9 -0.1 0.9 1.0 1.8 1.9 1.7 1.3 1.4 n.a n.a n.a
Inflation1 2.0 2.2 2.3 0.3 1.8 2.9 1.5 1.2 0.1 -0.9 0.8 1.6 1.4 1.8 2.3 2.6 3.4 3.0 2.7 2.3 1.6 1.2 0.9 0.9 0.8 1.1 n.a
Interest rates2 4.0 4.3 1.8 0.4 0.6 1.0 1.0 0.8 0.5 0.5 0.5 0.2 0.3 0.8 1.0 1.0 1.0 1.0 1.0 1.0 1.0 1.0 1.0 1.0 1.0 1.0 n.a
France
Real GDP1 2.2 2.4 0.2 -2.7 1.4 1.7 0.2 -1.5 0.1 0.2 0.6 0.2 0.5 0.4 0.3 0.9 -0.1 0.3 0.2 0.4 0.3 -0.2 0.3 -0.2 0.5 0.8 n.a
Inflation1 1.9 1.6 2.8 0.8 1,53 2.1 2.0 0.7 -0.3 -0.5 0.4 1.3 1.6 1.8 1.7 1.8 2.1 2.2 2.4 2.3 2.0 2.0 1.5 -0.2 0.8 0.9 0.6
Interest rates2 2.4 2.9 3.6 0.7 0.4 0.7 0.0 1.1 0.7 0.4 0.4 0.3 0.3 0.4 0.6 0.6 1.0 0.8 0.4 0.1 0.1 0.0 0.0 0.0 0.0 0.1 0.1
Germany
Real GDP1 3.2 2.5 1.3 -4.7 3.6 3.1 0.9 -3.4 0.5 0.7 0.3 0.5 1.9 0.8 0.5 1.3 0.3 0.5 0.7 1.2 1.0 0.6 0.6 0.0 1.6 n.a n.a
Inflation1 1.8 2.3 2.6 0.3 1.1 2.3 2.0 0.8 0.3 -0.4 0.3 0.8 1.0 1.2 1.7 2.1 2.4 2.5 2.3 2.2 1.9 2.0 2.0 1.5 1.5 1.6 1.3
Interest rates2 2.8 3.9 3.8 0.6 0.4 0.8 n.a 1.3 0.7 0.3 0.3 0.3 0.3 0.4 0.6 0.6 1.0 0.9 0.7 0.3 0.3 n.a n.a n.a n.a n.a n.a
Italy
Real GDP1 2.0 1.5 -1.3 -5.0 1.3 0.4 -2.1 -2.9 -0.3 0.4 -0.1 0.4 0.4 0.3 0.1 0.1 0.3 -0.2 -0.7 -1.4 -2.6 -2.9 -2.4 -0.6 -0.3 -0.1 n.a
Inflation1 2.2 2.0 3.3 0.8 1.5 2.7 3.0 1.3 0.9 0.1 0.7 1.3 1.4 1.7 2.0 2.3 2.6 2.8 3.3 3.0 3.1 3.4 2.5 1.9 1.2 1.1 0.7
Interest rates2 3.1 4.3 4.7 1.3 1.0 2.7 2.1 2.1 1.4 0.9 0.7 0.7 0.9 1.0 1.6 2.0 2.4 3.0 3.6 2.4 1.5 2.0 2.6 0.9 n.a n.a 0.7
Japan
Real GDP1 2.0 2.4 -1.2 -5.2 3.9 -0.6 2.0 -4.2 2.4 -0.4 1.0 1.5 0.5 1.0 -0.6 -1.7 -0.5 1.4 -0.2 5.3 0.7 0.0 0.2 1.1 0.9 0.3 n.a
Inflation1 0.3 0.0 1.4 -1.3 -0.7 -0.3 0.0 -0.1 -1.0 -2.2 -2.0 -1.2 -0.9 -0.8 0.1 -0.5 -0.4 0.1 -0.3 0.3 0.2 -0.4 -0.2 -0.6 -0.3 0.9 n.a
Interest rates2 0.1 0.5 0.3 0.1 0.1 0.1 0.1 0.3 0.3 0.3 0.3 0.1 0.1 0.1 0.1 0.1 0.1 0.1 0.1 0.1 0.1 0.1 0.1 0.1 0.1 0.1 0.1
UK
Real GDP1 2.8 2.7 0.1 -4.9 1.4 0.0 -0.2 -2.5 -0.6 -0.3 0.4 0.3 1.1 0.7 -0.5 0.2 -0.1 0.6 -0.3 -0.1 -0.5 0.0 0.0 0.5 0.8 0.8 0.7
Inflation1 2.3 2.3 3.8 2.2 3.3 4.5 2.8 3.0 2.1 1.5 2.1 3.3 3.4 3.1 3.4 4.1 4.4 4.7 4.7 3.5 2.7 2.4 2.7 2.8 2.7 2.7 2.1
Interest rates2 4.8 5.7 4.7 0.5 0.5 0.5 0.5 1.0 0.5 0.5 0.5 0.5 0.5 0.5 0.5 0.5 0.5 0.5 0.5 0.5 0.5 0.5 0.5 0.5 0.5 0.4 0.3
USA
Real GDP1 3.2 2.8 0.0 -2.6 3.0 1.8 2.3 -4.9 -0.7 1.6 5.0 3.9 3.8 2.5 2.3 0.4 1.3 1.8 3.0 2.0 1.3 2.0 1.9 0.3 0.6 1.1 0.8
Inflation1 3.2 2.8 3.9 0.3 1.6 3.2 2.1 -0.1 -0.9 -1.5 1.4 2.4 1.8 1.9 1.3 2.1 3.4 3.8 3.3 2.8 1.9 1.7 1.9 1.7 1.4 1.6 1.2
Interest rates2 6.3 4.8 0.9 0.2 0.2 0.1 0.1 0.5 0.5 0.5 0.5 0.1 0.2 0.2 0.2 0.2 0.1 0.1 0.1 0.1 0.2 0.1 0.2 0.1 0.1 0.1 0.1
EURO AREA
Real GDP1 3.0 2.7 0.5 -4.1 3.1 1.4 -0.4 -2.5 -0.2 0.4 0.2 0.3 1.0 0.4 0.3 0.8 0.2 0.1 -0.3 0.0 -0.4 -0.8 -0.7 -0.2 0.3 0.3 n.a
Inflation1 2.2 2.1 3.3 0.3 1.6 2.7 2.5 1.0 0.2 -0.4 0.4 1.1 1.5 1.7 2.0 2.5 2.8 2.7 2.9 2.7 2.5 2.5 2.3 1.8 1.4 1.3 0.8
Interest rates2 2.8 3.9 3.9 1.0 0.5 0.8 0.1 1.4 1.3 0.9 0.7 0.7 0.4 0.5 0.7 0.8 1.1 0.9 0.4 0.2 0.1 0.0 0.0 0.0 0.0 0.1 0.1
Notes: 1 Percent change from preceding quarter 2 Percent n.a = not available Source: IMF World Economic Outlook, Bloomberg system.
20122012
20062009
2009 20102013
G-7 2007 20082010
20112011
100

6.0 International Ecnomic and Financial Development
Q1 Q2 Q3 Q4 Q1 Q2 Q3 Q4 Q1 Q2 Q3 Q4 Q1 Q2 Q3 Q4
Coffee (Arabica) US$/Kg 3.08 3.17 4.32 5.98 4.11 3.54 3.92 4.69 5.14 6.20 6.37 5.98 5.36 4.87 4.00 4.00 3.57 3.36 3.20 2.98 2.89
Cotton (A index) US$/Kg 1.58 1.38 2.28 2.74 1.96 1.79 1.99 2.05 3.30 2.21 3.87 2.59 2.28 2.21 1.99 1.86 1.80 1.98 2.04 2.03 1.93
Sisal ( UG grade) US$/ton 1,156.50 1,059.25 948.34 1,385.83 1,451.25 850.00 850.00 916.67 1,176.67 1,233.33 1,366.67 1,500.00 1,443.33 1,400.00 1,400.00 1,451.67 1,553.33 1,433.33 1400.00 1,400.00 1400
Tea** US$/Kg 2.22 2.52 2.56 2.92 2.88 2.87 2.39 2.43 2.56 2.81 2.66 2.75 2.66 2.67 2.82 3.03 3.00 2.87 2.55 2.23 2.31
Gold US$/troy ounce 853.53 973.00 1,224.75 1,568.17 1,669.07 1,109.00 1,196.00 1,227.00 1,367.00 1,384.00 1,507.00 1,700.00 1,681.67 1,692.00 1,612.00 1,656.00 1,718.00 1,631.00 1,415.10 1,328.60 1,224.00
Note: ** Mombasa Auction price replaces London Auction price beginning July 1998.Q = Quarter
Source: http://www.imf.org and worldbank.org/prospects
Table 6.2: World Market Prices for Selected Commodities
Commodity 20122012 2013201120112008 2009 2010 2010Unit Price
101

End Mean of Rate
Period Purchases Sales Buying Selling TZS/US$2007 423.87 422.43 1236.92 1263.25 1250.092008 453.21 448.63 1193.17 1221.08 1207.122009 352.90 351.44 1316.70 1335.70 1326.202010 323.93 339.50 1415.81 1438.13 1426.972011 335.05 335.44 1547.15 1575.31 1561.232012 381.36 382.93 1555.06 1581.04 1568.05
2006 - 1st Quarter 104.64 104.16 1,185.00 1,205.00 1195.002nd Quarter 84.47 85.81 1,234.33 1,252.67 1243.503rd Quarter 98.40 98.82 1,279.62 1,302.00 1290.814th Quarter 87.22 86.83 1,269.00 1,294.00 1281.50
2007 - 1st Quarter 98.01 97.08 1,266.67 1,289.00 1277.842nd Quarter 96.94 96.71 1,258.67 1,279.67 1269.173rd Quarter 113.26 113.64 1,264.67 1,281.33 1273.004th Quarter 115.66 115.00 1,157.67 1,203.00 1180.34
2008 - 1st Quarter 106.67 106.45 1,172.33 1,196.33 1184.332nd Quarter 114.78 108.25 1,193.00 1,227.00 1210.003rd Quarter 124.80 127.76 1,158.00 1,181.67 1169.844th Quarter 107.09 106.30 1,249.33 1,279.33 1264.33
2009 - 1st Quarter 84.26 84.04 1,323.00 1,343.07 1333.042nd Quarter 88.93 89.14 1,318.40 1,345.66 1332.033rd Quarter 97.63 97.06 1,309.33 1,325.99 1317.664th Quarter 82.07 81.21 1,316.07 1,328.09 1322.08
2010 - 1st Quarter 82.27 81.47 1,333.31 1,352.25 1342.782nd Quarter 84.68 87.61 1,391.35 1,415.04 1403.193rd Quarter 76.33 88.81 1,473.98 1,501.40 1487.694th Quarter 80.65 81.61 1,464.61 1,483.83 1474.22
2011 - 1st Quarter 82.43 82.60 1,474.38 1,497.50 1485.942nd Quarter 85.13 85.82 1508.06 1533.08 1520.573rd Quarter 86.85 86.80 1574.41 1596.19 1585.304th Quarter 80.64 80.21 1631.75 1674.48 1653.11
2012 - 1st Quarter 77.88 79.80 1570.90 1591.82 1581.362nd Quarter 94.91 93.95 1530.67 1581.33 1556.003rd Quarter 99.94 99.47 1545.33 1567.33 1556.334th Quarter 108.63 109.72 1573.33 1583.67 1578.50
2012 - 1st Quarter 128.11 105.90 1592.33 1613.67 1603.002nd Quarter 141.70 148.29 1615.67 1626.00 1620.833rd Quarter 114.60 111.62 1607.67 1616.33 1612.00
Source: Bank of Tanzania
Table 6.3: Bureau de Change Quartertly Transactions
6.0 International Economic and Financial Developments
Volume of Transactions Exchange Rates(Millions of US$) (Average TZS/US$)
102
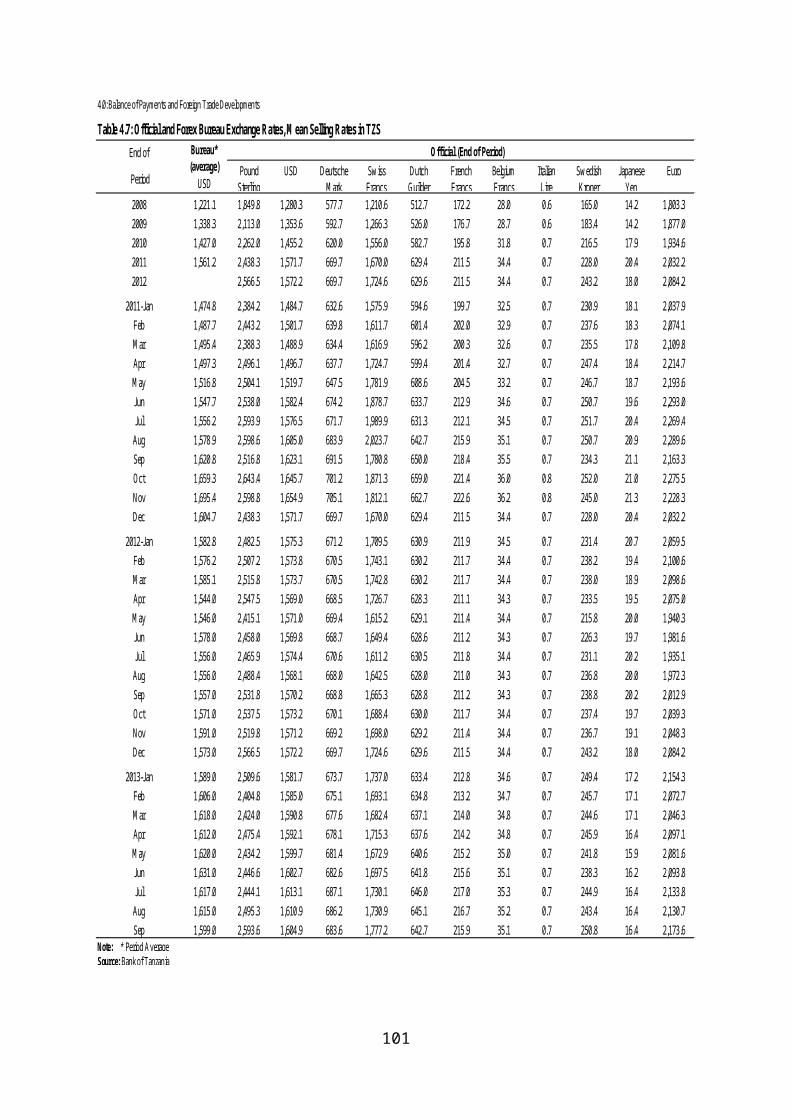
A2: LIST OF MANAGEMENT
Name Title Telephone Direct
EXECUTIVE OFFICE
Prof. B. J. Ndulu Governor 022 2233020/1/2Dr. N. E. Mwamba Deputy Governor (EFP) 022 2233040/1J. H. Reli Deputy Governor (AIC) 022 2233042/3L. H. Mkila Deputy Governor (FSD) 022 2233044/5
1. GOVERNOR’S OFFICE
M. D. Nampesya Private Assistant to the Governor 022 2233203
Anti-Money Laundering and Combating of Terrorism UnitN. D. Mukirya Associate Director 022 2233248
Independent Departments:
Conference and Events Management and Bank Networking DepartmentM. A. Mugo Associate Director 022 223 3164/5
Regional Integration DepartmentDr. P. F. Mlozi Manager 022 223 3398/9
Public Relations & Protocol DepartmentZ. K. Mbeo Manager 022 2233166/7
Procurement DepartmentR. P. Wanga Manager 022 2235194/5
2. DIRECTORATE OF STRATEGIC PLANNING AND PERFORMANCE REVIEW
S. S. Mrutu Director 022 2233423/4
Strategic Planning and Performance Review DepartmentC. S. Assey Manager 022 2233425/6
Technical Assistance and Program Coordination Department……………… Manager 022 2233434/5
Organization and Methods Department
103

F. N. Kazimoto Manager 022 2233475/6Project Management DepartmentG. B. Mwakibolwa Manager 022 2233278/9
3. DEPOSIT INSURANCE BOARD
A. M. Rasmin Director 022 2235389/90
Finance and Administration DepartmentR. J. Malisa Manager 022 2235391/2
Operations DepartmentR. J. Tesha Manager 022 2235393/4
4. RISK MANAGEMENT
Dr. M. F. Kipilimba Director 022 2235297/8
Financial Management Risk DepartmentN. L. Mapogha Manager 022 2235118/9
Investment Risk DepartmentV. N. Lema Manager 022 2233206/7
Systems Risk Department G. M. Mahinya Manager 022 2233204/5
5. DIRECTORATE OF HUMAN RESOURE AND ADMINISTRATION
L. L. Kisarika Director 022 2235144/5
Administrative and General Services Department C. A. Gama Associate Director 022 2235194/5
Human Resource Department R. L. Wambali Manager 022 2235148/9
Estate Management Department J. A. Malile Manager 022 2235098/9
Facilities Management DepartmentE. M. Twininge Manager 022 2235555/6
6. DIRECTORATE OF BANKING
E. M. Boaz Director 022 2235415/6
104

Banking Department H. M. Mnjovu Manager 022 2235134/5
Currency Department J. C. Rushaka Manager 022 2235672/3
7. DIRECTORATE OF BANKING SUPERVISION
A. E. Kobello Director 022 2235482/3
Banks Supervision Department K. A. Nyoni Manager 022 2235530/1
Financial Institutions Supervision DepartmentS. A. Kazimoto Manager 022 2235480/1
Licensing, Policy and Operations Review Department A. N. Hotay Manager 022 2235576/7
Microfinance and Bureaux de Change Supervision DepartmentA. A. Ukhotya Manager 022 2235585/6
8. DIRECTORATE OF ECONOMIC RESEARCH AND POLICY
Dr. J. L. Masawe Director 022 2233328/9
Monetary & Financial Affairs Department H. E. Mmbaga Manager 022 2233349/50
International Economics and Trade Department J. J. Nyella Manager 022 2233303/4
Debt Management Department Y. A. Mchujuko Manager 022 223378/9
Research Department P. L. Kadesha Manager 022 2233330/1
Real Sector & Microfinance Department F. L. Rutabanzibwa Manager 022 2233280/1
9. DIRECTORATE OF FINANCE
J. R. Angelo Director 022 2235126/7
Domestic Payments and Settlements Department
105

M. P. Kobello Manager 022 2235624/5Foreign Payments and Settlements Department S. S. Mwakalukwa Manager 022 2235628/9
Budgeting and Financial Reports DepartmentJ. J. Ngelime Manager 022 2235676
10. DIRECTORATE OF FINANCIAL MARKETS
…………….. Director 022 2233564/5
Domestic Markets Department P. A. Maganga Manager 022
2233529/30 Foreign Markets Department E. J. Akaro Manager 022 2233520/1
Credit Guarantee Scheme DepartmentC. H. Kimaro Manager 022 2233568/9
11. DIRECTORATE OF MANAGEMENT INFORMATION SYSTEMS
A. W. Massawe Director 022 2235136/7
Information System and Services Department R. S. Rashid Manager 022 2235373/4
Systems Design and Administration Department Y. L. Simon Manager 022 2233732/3
Networks and Office Automation Department L. L. Masano Manager 022 2233730/1
12. DIRECTORATE OF NATIONAL PAYMENTS SYSTEMS
L. S. Kinunda Director 022 2235432/3
Payment System Oversight and Policy Department G. K. Tabaro Manager 022 2235439/40
System Development & Support DepartmentB. J. Dadi Manager 022 2235434/5
13. DIRECTORATE OF INTERNAL AUDIT
106

……………… Director 022 2235240/1
Systems Audit Department N. M. Malekani Manager 022 2235242/3
Operational Audit Department J. S. Juma Manager 022 2235255/6
14. DIRECTORATE OF FINANCIAL STABILITY
A. M. Msutze Director 022 2233471/2
Macro-Surveillance DepartmentA. A. Tuni Manager 022 2233160/1
Micro-Surveillance DepartmentDr. E. M. Mung’ong’o Manager 022 2235510/1
Crisis Management DepartmentJ. A. Rubuga Manager 022 2233352/3
15. OFFICE OF THE SECRETARY TO THE BANK
Y. E. Tongola Secretary to the Bank 022 2233240/1
Litigation and Investigation DepartmentM. K. Ismail Associate Director 022 2233225/6
Internal Security Department T. P. Mramba Manager 022 2235573/4
Board Services & Exchange Management DepartmentI. N. Kihwili Manager 022 2233242/3
Legislation DepartmentR. K. Sinamtwa Manager 022 2233248/9
16. BANK OF TANZANIA TRAINING INSTITUTE (MWANZA)
…………….... Principal 028 2500352 …………….... Associate Director, Learning & Development 028 2500068M. K. Mziya Director of Studies 028 2500982 C. P. Yamo Manager, Finance & Administration 028 2502697
16. BOT BRANCHES
107

Arusha O. H. Kitine Director 027 2545482J. H. Kimwaga Manager, Operations 027
2504047S. M. Chiguma Manager, Economics 027 2548443 E. Y. Ndesingo Manager, Finance & Administration 027 2504009
Mbeya ………………… Director 025 2504158 H. O. Katundu Manager, Operations 025 2502055 Dr. B. Y. Kibesse Manager, Economics 025 2502839 R. J. Jizwalo Manager, Finance & Administration 025 2502700
Mwanza G. C. Maganga Director 028 2501015 T. A. Mpelwa Manager, Operations 028 2500024 M. N. Rububura Manager, Economics 028 2500622 C. A. Kiponda Manager, Finance & Administration 028 2500025
Zanzibar .................... Director 024 2234503 M. M. Diallo Manager, Operations 024 2234506 N. K. Mboje Manager, Economics 024 2234507 A. H. Hamisi Manager, Finance & Administration 024 2234504
108

8.0 GLOSSARY
Average Inflation RateInflation is defined as the rate at which the average level of domestic prices is increasing over a period of time.
Currency in Circulation outside BanksNotes and coin accepted as legal tender in the domestic economy, excluding amounts held by the banking system.
Bank RateThe Central Bank Rate which is determined by the Monetary Policy Committee for signalling the direction of the monetary policy.
Discount Rate The interest rate Bank of Tanzania charges on loans it extends to banks and to the Government. It uses Bank rate as a base plus a loaded factor, which change from time to time depending on the liquidity situation in the market.
Exchange RateThe price at which one currency can be purchased with another currency, e.g. TZS per US dollar.
Lombard FacilityAn overnight facility introduced by the Bank on 1st December 2003 to enable commercial banks to borrow at their own discretion, by pledging of eligible government securities as collateral.
Lombard RateThe rate payable for the use of the Lombard Facility. The rate is based on the prevailing weighted average yield of 35-day T-bill, Repo (7 days) or overnight inter-bank rate whichever is higher in the market plus 20 percent.
Money Supply, MThe sum of currency in circulation outside the banking system and deposits of residents with banks defined in various levels of aggregation. In Tanzania, three aggregates of money supply are compiled and reported, namely: narrow money (M1), broad money (M2), and extended broad money (M3).
Narrow Money (M1)This consists of currency in circulation outside banking system and demand deposits.
Broad Money (M2)
109

This is equivalent to narrow money (M1) plus time (fixed) and savings deposits.
Extended Broad Money (M3)It consists of broad money (M2) plus residents’ foreign currency deposits.
Transferable DepositsComprise of all deposits that are immediately convertible into currency and directly usable for making payments by cheque, draft, giro order, direct debit/credit or other payment facility without any kind of significant restriction or penalty.
Non-transferable DepositsInclude all claims reflecting evidence of deposit other than transferable deposits. Typical examples are saving deposits and time deposits.
Non-Food Inflation RateThis is a measure of price movements caused by factors other than food prices.
Repurchase Agreement (REPO)These are agreements to purchase/sale by the BoT government securities from/to financial institutions at agreed rate for a specified period, with an understanding that the financial institutions will repurchase/resell the securities to the BoT at the end of the period.
Reserve Money (M0)The Bank of Tanzania’s liabilities in the form of: currency in circulation outside the banking system, cash held by banks in their vault and deposits of banks kept with the Bank of Tanzania in national currency. Reserve money is also referred to as base money or high powered money.
Weighted Annualized Yields of Treasury Bills of all MaturitiesThis is the average yield of Treasury bills, which is weighted by the volume sold of 35-day, 91-day, 182-day, and 364-day Treasury bills, expressed in percentage per year.
110

