downloads.hindawi.comdownloads.hindawi.com/journals/jchem/2019/4932837.f1.docx · web viewother...
TRANSCRIPT
Journal of Chemistry
Adsorption characteristics and transport behavior of Cr(VI)
in shallow aquifers surrounding a chromium ore
processing residue (COPR) dumpsiteYu Liu,1, 2, Yin Li,2 Yucheng Hu,2 Khan M. G. Mostofa,1 Siliang Li,1 and Zhenying Liu3
1 Institute of Surface-Earth System Science, Tianjin University, Weijin Road 92, Tianjin 300072, China.2 Tianjin Hydraulic Science Research Institute, Youyi Road 60, Tianjin 300061, China.3 School of Environmental Science and Safety Engineering, Tianjin University of Technology, Tianjin 300191, China.Correspondence should be addressed to Dr. Yu Liu; [email protected]
Number of Pages: 18Number of Figures: 7Number of Tables: 5Journal: Journal of Chemistry
Sampling Continuous core samples were collected using a drilling rig (SY-1, DPP100) and a
triple-tube core barrel. The drilling minimizes mechanical breaks and provides cores that reflect in-situ fracture distributions. Due to site conditions, drillcore samples were collected over an interval of 6 to 20 m below the ground surface. Immediately after obtaining each drill core, a Φ75 × 6000 mm PVC pipe was filled into the drilled hole to construct the groundwater monitoring well. At the same time, ten soils were collected from per metre of core and then mixed into one sample. Core samples were immediately wrapped with aluminum foils and parafilms, and vacuum-sealed to preserve moisture and other physical properties. Top soils (5-10 cm) were collected using a 5-point sampling method and squaring method and then packaged into a polyethylene plastic bag. The collected soil samples were pretreated to remove impurities, naturally air-dried at room temperature, ground to pass through a 100
Corresponding author. Tel.: +86 15822711360, E-mail address:
1
2
3
4
5
6789
101112
13
14151617
18
192021222324252627282930
12
mesh sieve, and stored in pre-cleaned glass containers for further use. The water depth of each monitoring well was measured using ultrasonic water level monitor (GL-100). Baylor tube samplers were applied to collect the groundwater.
Characteristics of soils and aquifersCore samples were taken to determine their physical characteristics in terms of in
situ bulk density, porosity, and grain size distribution by using the standard for soil test method (National Standards of People's Republic of China, GB/T 50123-1999). Other parameters including pH, organic matter (OM) content, and cation exchange capacity (CEC) were also analyzed [1]. Cr(VI) concentration of groundwater samples were determined by using UV-vis spectrophotometer (TU-1810) at 540 nm wave length by using 1, 5-diphenylcarbazide as a color complexing agent. Total chromium in top soils and shallow aquifers were extracted and measured based on the determination criterion of total chromium in the soil (National environmental protection standards of the People's Republic of China, HJ 491-2009). Firstly, total chromium in top soils and shallow aquifers were extracted by the digestion method with hydrochloric acid, nitric acid, hydrofluoric acid, and perchloric acid. Afterwards, the digestion solution were determined by flame atomic absorption spectrophotometry [2].
ExperimentsFirstly, batch adsorption experiments were carried out to determine the adsorption
characteristics. Conical flasks were filled with 10 g dried aquifers and Cr(VI) solution for various initial concentrations ranging from 0.1 to 100 mg/L. The conical flasks were shaken at a constant speed of 200 rpm for a period of time till the adsorption reached equilibrium. Total volume of the Cr(VI) solution was kept constant at 100 mL. Samples were withdrawn at regular time intervals. These samples were filtered by filters (0.45μm) coupled to syringes and then analyzed for residual Cr(VI) concentration by UV-vis spectrophotometer. According to the actual in situ condition of the groundwater, the temperature of batch adsorption experiments was fixed at constant 288 K except the adsorption isotherm and thermodynamics studies. Also, the pH was fixed to 7-8 except where the effect of the solution pH on the adsorption of Cr(VI) was investigated. The pH was adjusted by using NaOH and HCl.
Secondly, to reveal the adsorption-desorption behavior of Cr(VI) in aquifers and provide model parameters for Cr(VI) transfer, continuous dynamic column studies were conducted in plexi-glass columns with a diameter of 5.0 cm. A schematic diagram of a column set-up is depicted in Supplementary material (Figure S3). The packing status of columns and operating condition for the adsorption/desorption column study are mentioned in Supplementary material (Table S2). A 5 cm layer of gravels was placed at the bottom of the column in order to provide a uniform outlet flow. After the columns were filled, column beds were saturated by flowing distilled water. One week later, Cr(VI) solution flowed through the filled columns at a desired flow rate by controlling the valve of the Cr(VI) stock tank shown in Figure S3. Based on the Cr(VI) content of shallow groundwater adjacent to the contaminated site, the
313233
34
3536373839404142434445464748
49
5051525354555657585960616263646566676869707172
Cr(VI) solution was prepared to be 550 mg/L. The column experiments were carried out under fixed water head conditions. The samples were collected at regular time intervals. The column saturation was monitored by analyzing the Cr(VI) concentration of inlet and outlet in the column. The adsorption column experiment finished when the Cr(VI) concentration of final effluent in the outlet exceeded 99.9% of the concentration at the inlet. After the adsorption column study, distilled water flowed through the Cr(VI) loaded column to study the desorption behavior of the chromium contaminated aquifers.
According to the physicochemical properties analysis of all aquifers samples, the aquifers used in experiments were collected outside the distance of 1 km from the COPR dumpsite, because they were not polluted by chromium. The Cr(VI) solution was prepared using K2Cr2O7 and distilled water. Cr(VI) concentration of all samples were determined by using UV-vis spectrophotometer (TU-1810). All chemicals used in this study were of analytical grade and without further purification. All experiments were conducted in triplicate and the average values were used for data analysis.
737475767778798081828384858687
Figure captions:Figure S1. Photos of Chromium Ore Processing Residue (COPR) dumpsite in Tianjin
Former Tongsheng Chemical Factory in 2012.Figure S2. Photos of core drilling and groundwater sampling.Figure S3. Schematic of adsorption column packed with aquifers.Figure S4. The concentrations of total Cr in top soils (5-10 cm) of 11 sampling sites.Figure S5. The concentrations of total Cr in aquifers at different depths of 1-6 m of
11 sampling sites.Figure S6. Pseudo-second-order kinetics for adsorption of Cr(VI) onto clay, silty clay
and silt. Cr(VI) solution 1.0 mg/L, aquifers 0.1 g/mL, pH 7-8, 288 K.Figure S7. Effect of temperature on Cr(VI) adsorption by clay, silty clay and silt.
Cr(VI) solution 1.0 mg/L, aquifers 0.1 g/mL, pH 7-8.
88
8990919293949596979899
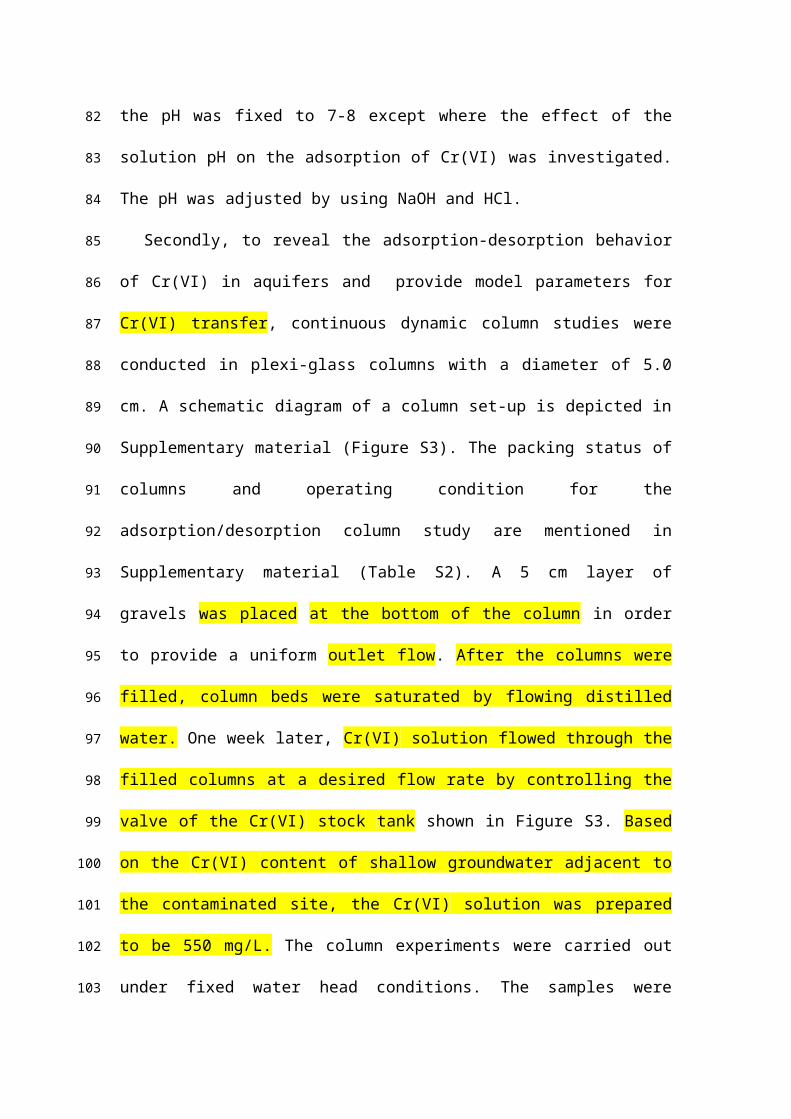
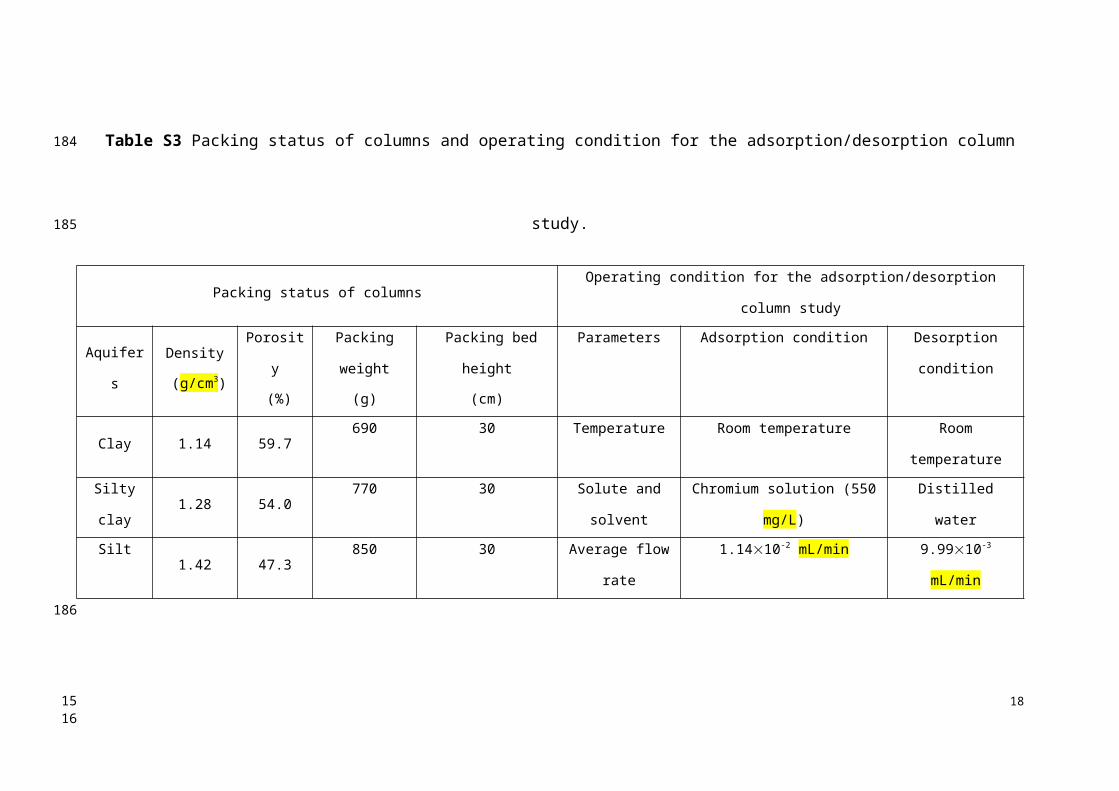
Table captions:Table S1 Geographical locations of the drilling sampling sites.Table S2 Vertical distribution of local geological formations.Table S3 Packing status of columns and operating condition for the
adsorption/desorption column study.Table S4 The physicochemical properties of different aquifers.Table S5 The concentration of Cr(VI) and total Cr of groundwater in monitoring
wells of 11 sampling sites.
100
101102103104105106107

Figure S1. Photos of Chromium Ore Processing Residue (COPR) dumpsite in Tianjin Former Tongsheng Chemical Factory in 2012.
108
109
110111
Figure S2. Photos of core drilling and groundwater sampling.112113
Figure S3. Schematic of adsorption column packed with aquifers.
114
115
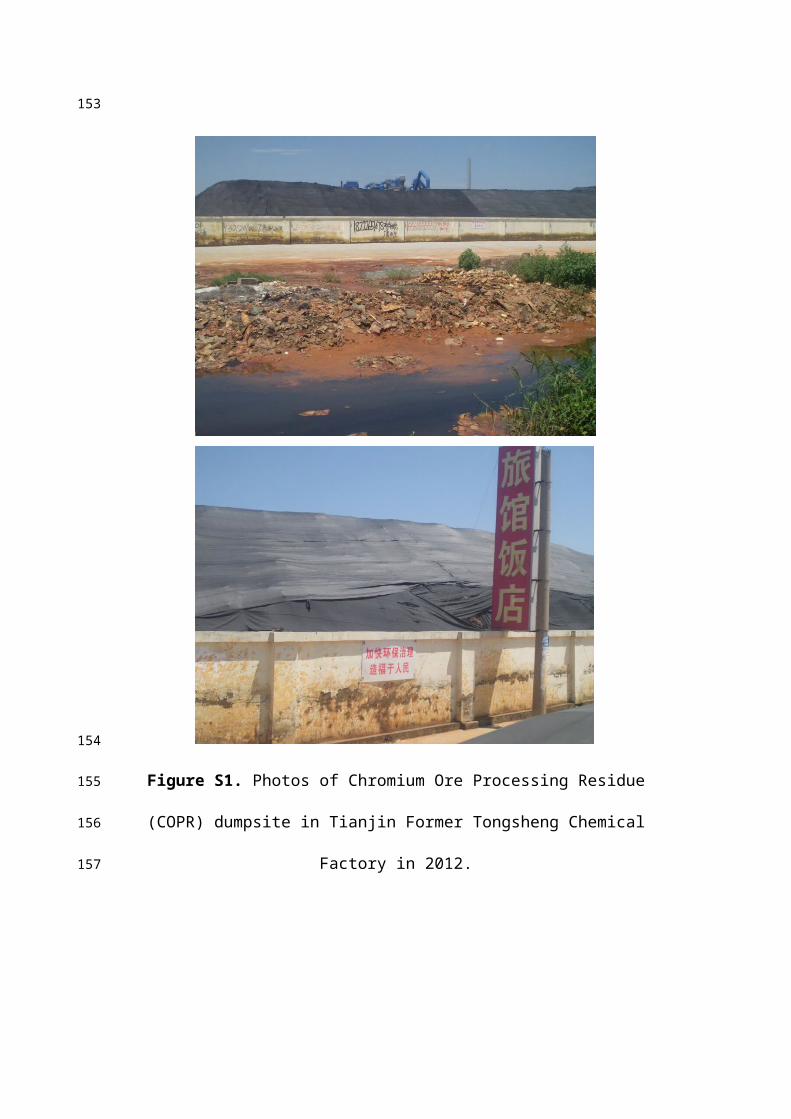
Figure S4. The concentrations of total Cr in top soils (5-10 cm) of 11 sampling sites.
9
116
117
34
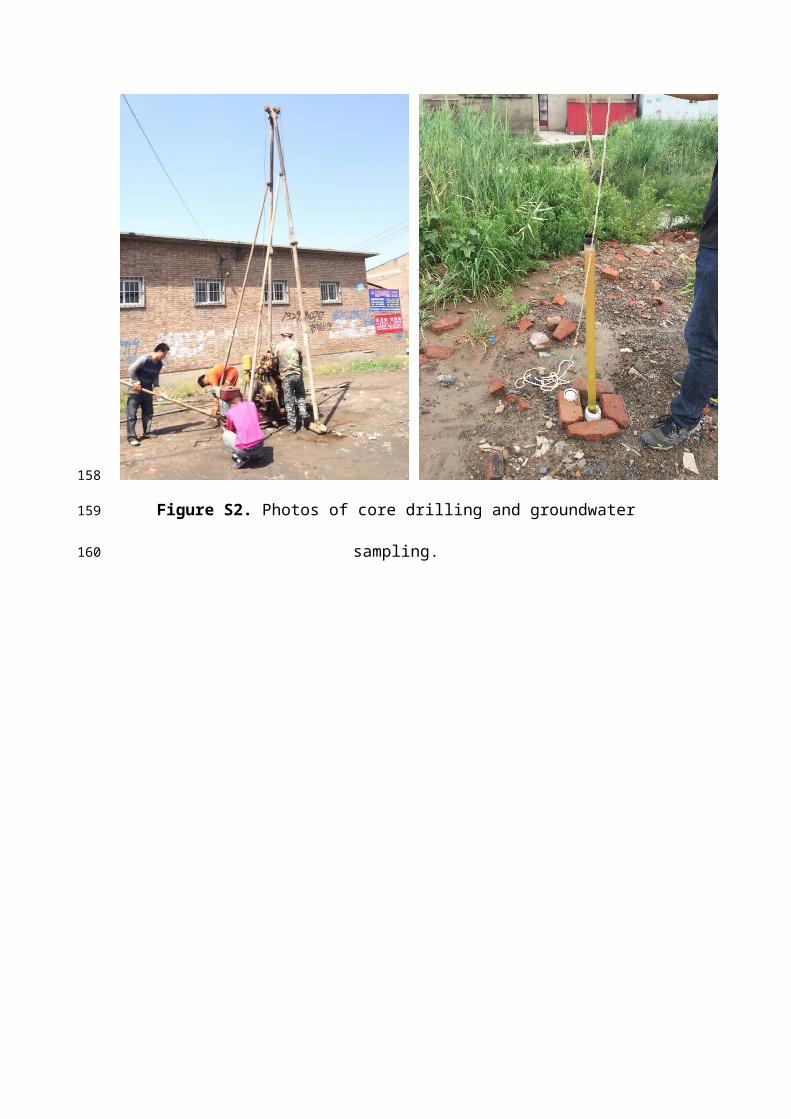
Figure S5. The concentrations of total Cr in aquifers at different depths of 1-6 m of 11 sampling sites.
10
118
119120
56
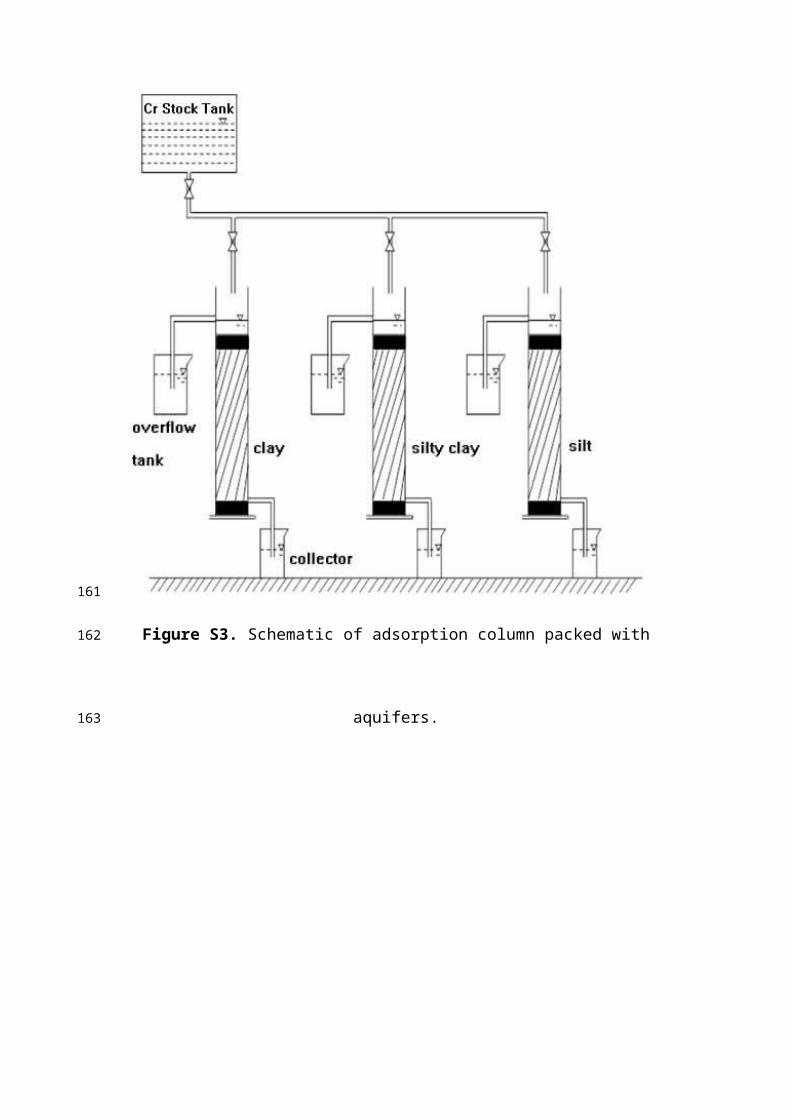
Figure S6. Pseudo-second-order kinetics for adsorption of Cr(VI) onto clay, silty clay and silt. Cr(VI) solution 1.0 mg/L, aquifers 0.1 g/mL, pH 7-8, 288 K.
11
121122123124
78
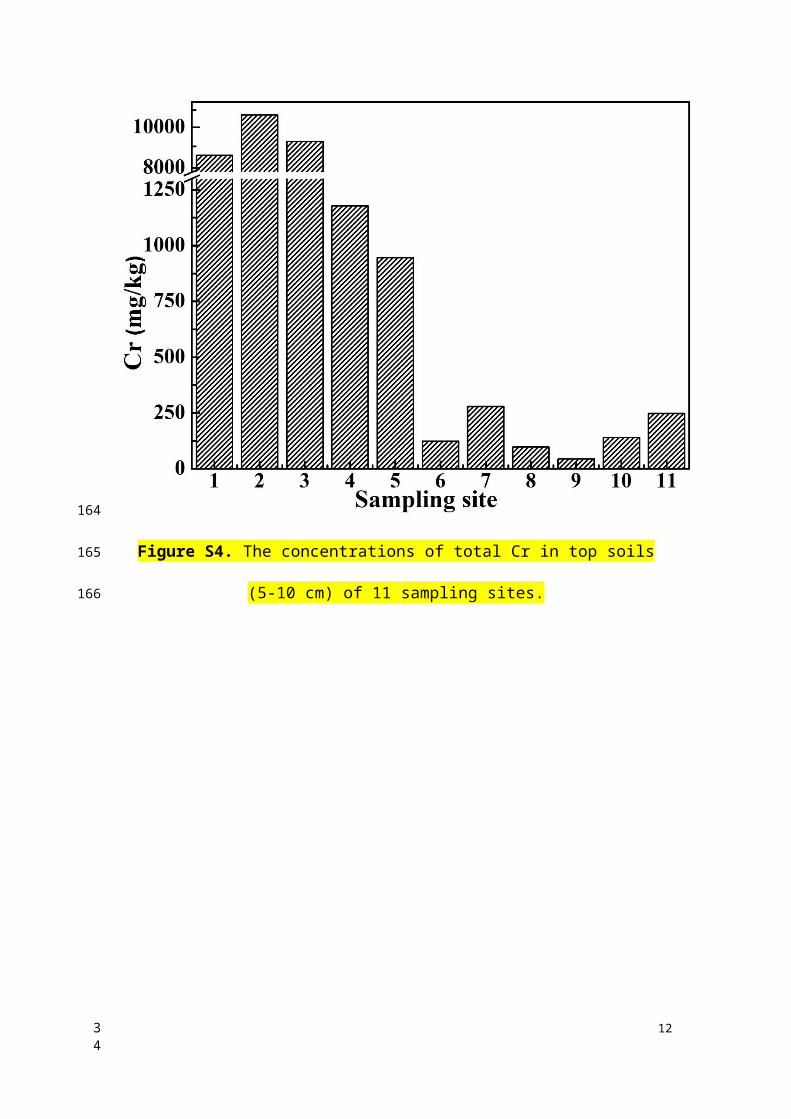
Figure S7. Effect of temperature on Cr(VI) adsorption by clay, silty clay and silt. Cr(VI) solution 1.0 mg/L, aquifers 0.1 g/mL, pH 7-8.
12
125
126127128
910
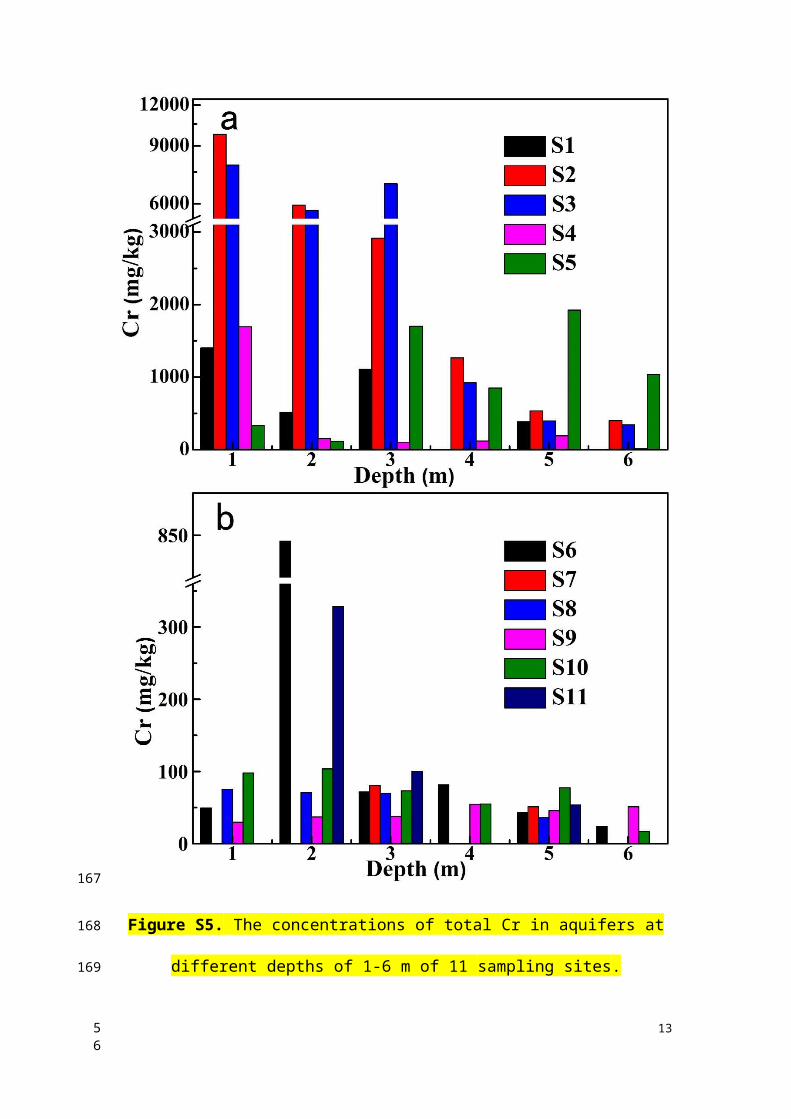
Table S1 Geographical locations of the drilling sampling sites.
Sampling sites Latitude LongitudeS1 39°14′18.5″N 117°06′27.2″ES2 39°14′19.0″N 117°06′28.2″ES3 39°14′19.6″N 117°06′29.7″ES4 39°14′17.3″N 117°06′25.3″ES5 39°14′21.9″N 117°06′23.7″ES6 39°14′11.7″N 117°06′28.4″ES7 39°14′45.8″N 117°06′32.4″ES8 39°14′24.4″N 117°06′45.9″ES9 39°14′7.9″N 117°06′38.7″ES10 39°14′7.6″N 117°06′44.2″ES11 39°14′28.3″N 117°06′56.6″E
13
129
1112
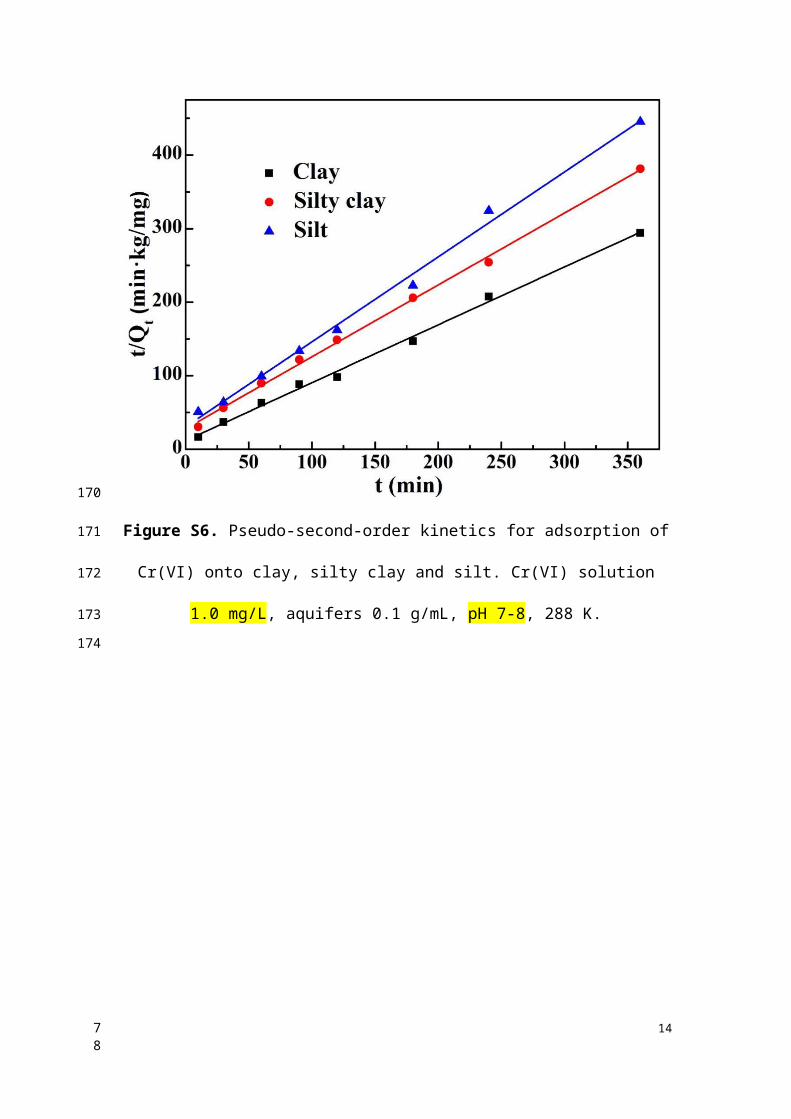
Table S2 Vertical distribution of local geological formations.
Stratum formation timeDepth
(m)Thickness
(m)Geological
symbolGround
name
Artificial Fill Layer( Qml) 1.40 1.40 Plain fill
New Alluvium ( Q4
3Nal)2.10 1.00 Silt
Holocene Upper Group lagoon-facies sedimentary layer
(Q43l+h)
4.80 2.40 Clay
Holocene Middle Group marine-facies sedimentary layer
( Q42m)
11.00 6.80 Silty clay
Holocene Lower Group continental-
facies alluvium( Q4
1al)
20.00This layer was
not drilled through.
Silty clay
14
130
1314
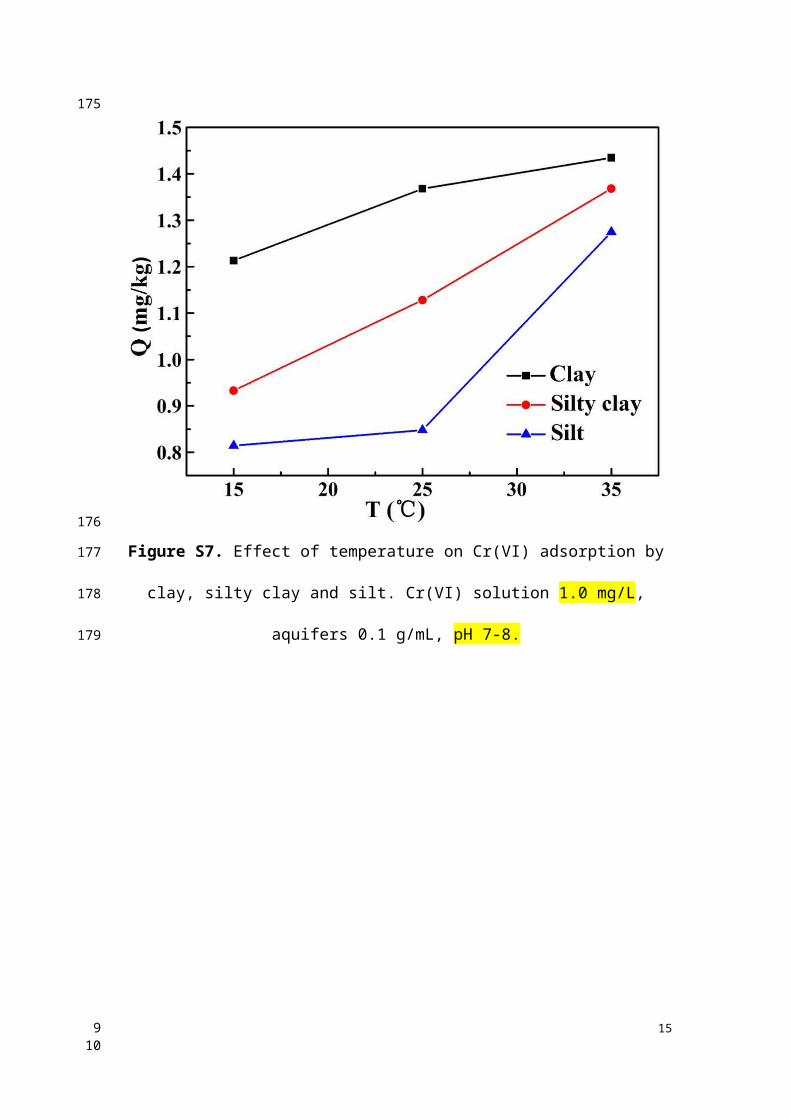
Table S3 Packing status of columns and operating condition for the adsorption/desorption column study.
Packing status of columns Operating condition for the adsorption/desorption column study
AquifersDensity
(g/cm3)
Porosity
(%)
Packing weight
(g)
Packing bed height
(cm)
Parameters Adsorption condition Desorption condition
Clay 1.14 59.7 690 30 Temperature Room temperature Room temperature
Silty clay 1.28 54.0770 30 Solute and solvent Chromium solution (550
mg/L)
Distilled water
Silt1.42 47.3
850 30 Average flow
rate
1.1410-2 mL/min 9.9910-3 mL/min
15
131
132
1516
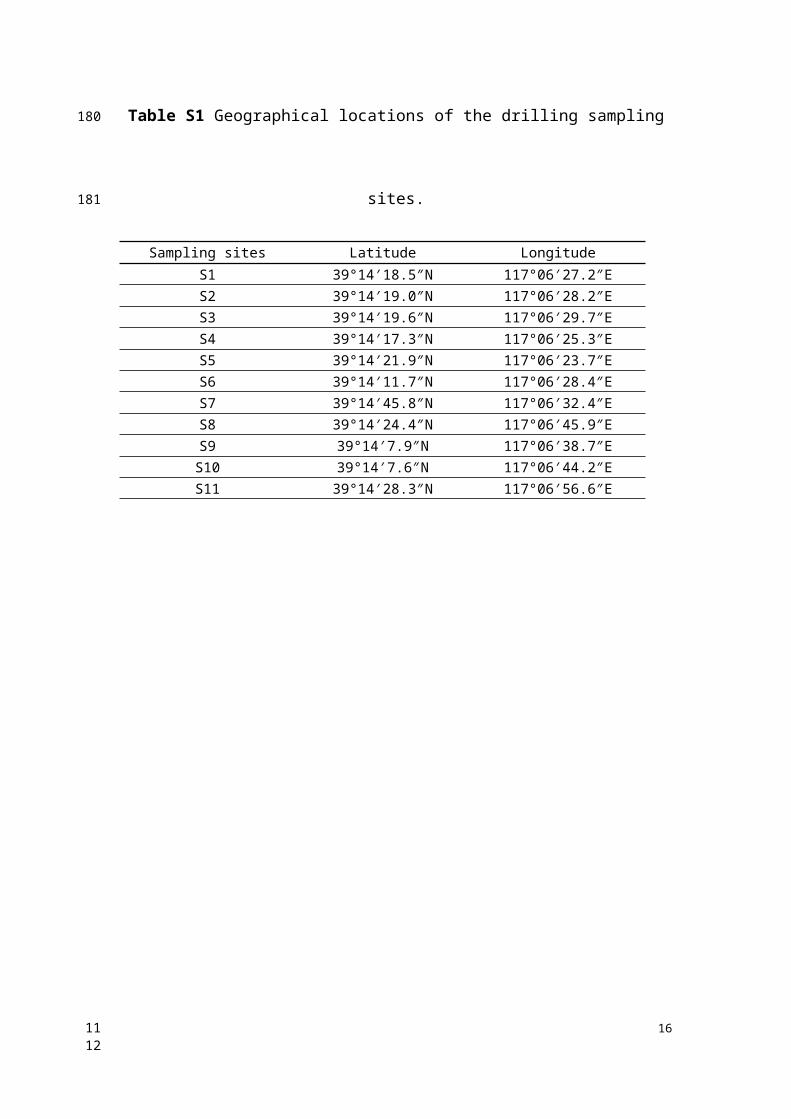
Table S4 The physicochemical properties of different aquifers.
AquifersDensity
(g/cm3)
Porosity
(%)pH
CEC
(cmol/kg3)
OM
(%)
Particles composition(%)Sand particles
2-0.075mm
Silt particles 0.075-
0.005mm
Clay particles
<0.005mm
Clay 1.42 48.5 8.22 203.4 2.85 6.8 64.2 29.0
Silty clay 1.46 46.4 8.39 153.7 2.21 8.8 69.9 21.3
Silt 1.48 45.0 8.01 54.0 1.96 12.1 71.6 16.3
16
133
1718
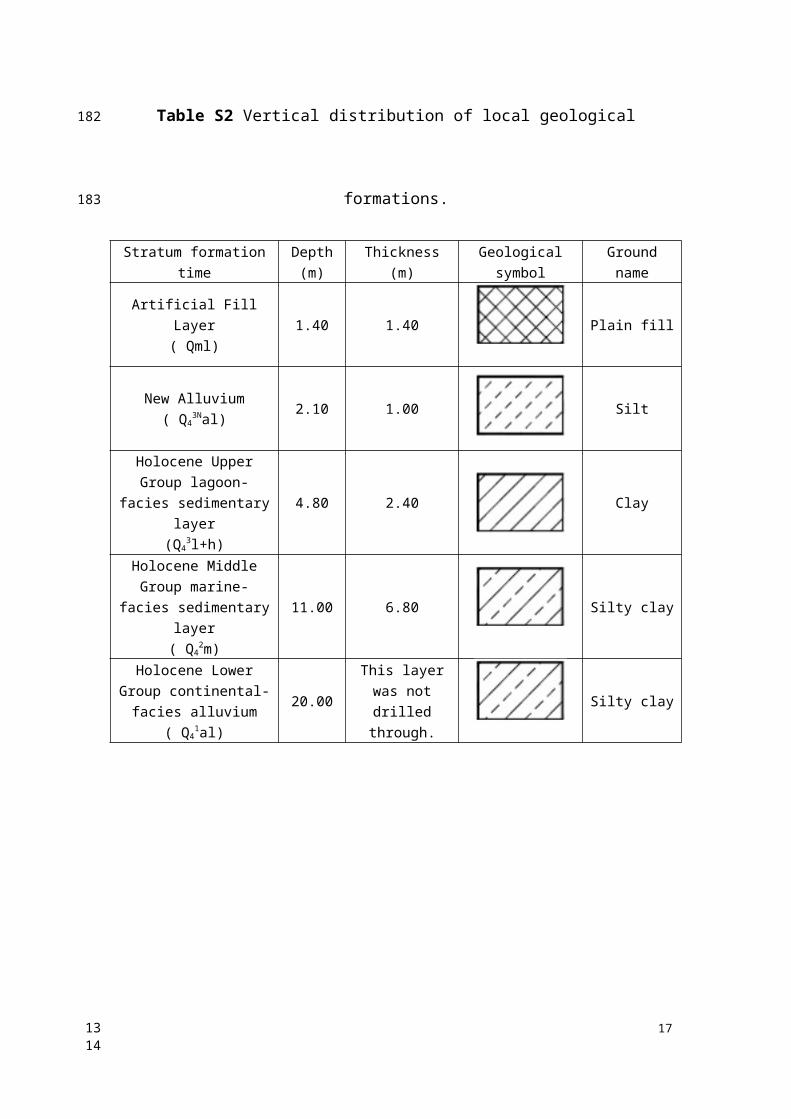
Table S5 The concentration of Cr(VI) and total Cr of groundwater in monitoring wells of 11 sampling sites.
Groundwater monitoring
wells at sampling sitesS1 S2 S3 S4 S5 S6 S7※ S8 S9 S10 S11
Cr(VI) (mg/L) 766.9 1347.5 1063.4 0.008 0.58 0.045 --- 0.006 0.022 0.007 0.005
Total Cr (mg/L) 776.3 1369.1 1080.4 0.031 0.59 0.048 --- 0.009 0.025 0.008 0.009
※ The drilled hole S7 collapsed during the drilling so the PVC pipe was unable to be set up, therefore the groundwater data for sampling site S7 was not obtained.
17
134
135
1920
References
[1] APHA. "Standard Methods for the Examination of Water and Waste Water," American Public Health Association, USA. ISBN: 978-0-87553-287-5, 2017.
[2] X. Zhao, P. A. Sobecky, L. Zhao, P. Crawford, M. Li, "Chromium(VI) transport and fate in unsaturated zone and aquifer: 3D Sandbox results," Journal of Hazardous Materials, vol. 306, pp. 203-209, 2016.
18
136
137138139140141
2122