€¦ · web viewlogistics and economic freedom as determinants of bric countries’ value- added...
TRANSCRIPT

LOGISTICS AND ECONOMIC FREEDOM AS DETERMINANTS OF BRIC
COUNTRIES’ VALUE- ADDED IMPORTS
Abstract
World trade is one of the main growth engines of emerging countries such as the
BRICs. Analysis of their position in global value chains is critical in order to focus
development policies on aspects where they lag behind. This research paper proposes an
analysis of the determinants of their value-added imports from their main trading
partner, the EU-28. The paper estimates gravity models extended with aspects that, a
priori, would appear to be key to international trade, namely economic freedom and
logistics. The analysis is carried out for two very different years encompassing a period
of severe economic turbulence in Europe, 2005 and 2014. The results show that the
emerging countries have come out of this recession stronger by specializing in specific
links of the production chains. This has enabled them to gradually draw level with more
advanced economies. Certain components of economic freedom and logistics that were
of vital importance in 2005 continue to be so in 2014, albeit less markedly so. The
development policies of the BRICs should essentially be targeted at achieving progress
in the different pillars of logistics performance, as this is shown to be an important
determinant of their imports.
Keywords: BRIC, Global Value Chain, EU, gravity models, value-added imports
JEL codes: C21; C67; F14
1. Introduction
The growth of world trade coupled with the gradual elimination of tariff barriers have
been at the forefront of the process of globalization, affecting almost all countries. This
in turn has required modified production and marketing techniques, and opened the door
to the concept of global value chains (GVCs). Although there is a great deal of recent
1

literature on the subject, GVCs dates back to the late 1970s when Hopkins and
Wallerstein (1977) defined commodity chains. Their work focused on tracking the
multiple inputs and the transformations required to produce a final good suitable for
consumption. The concept of global chains, which builds on this terminology, is more
ambitious since it includes industrial contributions that go beyond national borders
(Bair, 2005). In this context, Gereffi and Fernandez-Stark (2016) define GVCs as the set
of activities carried out by companies to produce a good that meets a human need,
affecting a wide range of industries in very diverse countries.
GVCs provide valuable information that enables an understanding of the
interconnections between economies, where the quest for efficiency determines the
competitiveness of exports. All countries have gone down the path of specialization,
optimally positioning themselves in each production chain. Nowadays, the
denomination "made in" has become largely meaningless as goods and services do not
come from a single country but rather from a series of factories dotted around the world.
And it is here that emerging economies are gaining ground on advanced ones.
The research carried out by UNIDO (2002) leads to the conclusion that the driving
forces of value chains can be classified according to whether they are powered by
producers or buyers. The first type comprises capital- and technology-intensive
industries where certain countries lead the chain, controlling the central core of know-
how. Conversely, chains driven by buyers are labour-intensive. The creation of GVCs is
initiated by developed economies; their firms have sizeable distribution channels and an
established brand image. They use the production frameworks of the emerging countries
as suppliers not only of production processes but also of distribution networks. Hence,
developed countries are the decision-makers when it comes to the location of the supply
chain, the distribution of production and the chosen suppliers for the GVC, while their
2

emerging partners are limited to following and supporting them (Sun et al., 2010).
However, in the not too distant future, as emerging economies gain international market
share, they will begin to play a more active role, allowing them to adopt appropriate
strategies and boost their competitiveness.
The BRICs are currently in a position to displace their developed business partners,
which were hit hard by the economic and financial crisis of 2008. The growth that these
countries have experienced, together with their sociodemographic characteristics, is
helping them to gain independence and strategically position themselves in value
chains. The benefits resulting from this progress can be seen in the creation of more,
better-quality jobs, allowing them to compete on equal terms, generating notable
national development (Gereffi & Fernandez-Stark, 2016).
As set out by Kaplinsky and Farroki (2011) and Jednak (2017), the world market has
adapted to the new scenario in which the sustained growth of emerging economies, such
as China and India, has been the focal point of the stimulus for change in global
demand, production structures and innovation. At the same time, developing countries
have been forced to sell cheaper and less processed final goods, reducing the quality and
their participation in the global economy.
BRIC-EU trade relations are becoming stronger, with BRIC countries now being the
primary destination for European products (Srinavasan, 2014; Kallioras & Pinna, 2017).
In this context, Fedoseeva and Zeidan (2016) study trade factors relevant for European
exporters in the BRIC markets across industries, using monthly data on six export
sectors of three European countries (Germany, France and Italy) over the 1999-2013.
Results show that exchange rates, relative prices and foreign demand are relevant for
European exports to the BRICs although theirs impact is heterogeneous across countries
and industries.
3

Following this line of research, the aim of this paper is to determine the extent to which
the BRIC1 countries have been able to structurally adapt to the new global demands,
appropriately positioning themselves in GVCs. A comparative study of the determinants
of BRIC imports from the EU28 is carried out for two very different years of the
economic cycle (2005 and 2014), in order to identify and assess the effect of the
economic situation on trade between these emerging countries and the old continent.
First, the value added is calculated to avoid the double counting problem inherent in the
gross import statistics provided by international agencies. Then, using gravity models,
the variables of the basic model as well as the index of economic freedom and the
logistics performance index are analysed as possible drivers of the change that has taken
place in world trade, specifically BRIC-EU trade. Finally, in order to provide more
precise information, each one of the pillars that make up these indexes is analysed
individually.
The novelty of this paper lies in extending the gravity model with two factors that, from
a theoretical perspective, are determinants of the volume of international trade: logistics
and economic freedom. The regular publication of these indexes facilitates this type of
study, the results of which can in turn help explain possible trade alliances between
developed and emerging countries, arising from the need to improve competitiveness in
each production stage. In addition, the conclusions drawn can serve as a guide to
emerging countries, helping them to improve their positions in GVCs by focusing their
economic policies on addressing and overcoming their shortcomings.
The rest of the article is structured as follows: Section 2 details the specific
characteristics of the countries that make up the BRIC group, with a particular focus on
their scores in the analysed indexes. Section 3 presents the regression model and the
1 South Africa has been excluded from the study as it does not have the required statistical information.
4

variables used in the empirical analysis. Section 4 describes the results obtained for the
two years under study. Finally, section 5 summarizes the main conclusions.
2. BRICs in the international context: the index of economic freedom and the
logistics performance index
The acronym BRIC dates back to 2001, when O'Neill used it to refer to Brazil, Russia,
India and China as the developing countries characterized by high growth rates which
seemed to challenge the world's established economies and yet had little sway in
international decisions (Castro, 2012). There were initially grouped together on the
basis of their physical and economic similarities; however, they soon began to
strengthen their relationships, examining the possibility of creating cooperative
relationships with one another. The first formal meeting was held in 2009, led by Russia
(Roberts, 2010).
The BRICs have grouped together as a friendly coalition of emerging nations, albeit
with no major commitments, due to latent differences that are difficult to overcome in
the short term: widely differing sectors, degrees of openness to foreign countries,
exchange rate regimes and trade balances. In short, these are countries whose rapid
incorporation into the international economic order, together with their vast land areas,
offer synergies that their leaders seek to take advantage of.
5
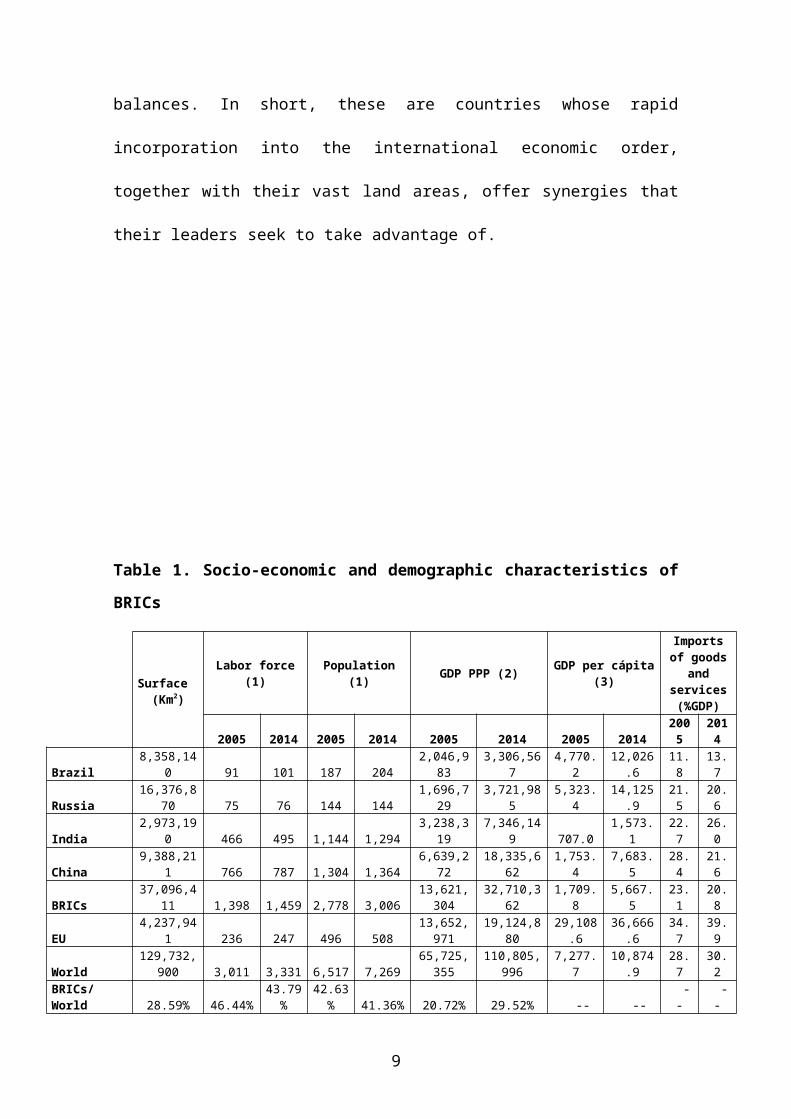
Table 1. Socio-economic and demographic characteristics of BRICs
Surface (Km2)
Labor force (1) Population (1) GDP PPP (2) GDP per cápita (3)
Imports of goods and services (%GDP)
2005 2014 2005 2014 2005 2014 2005 2014 2005 2014
Brazil 8,358,140 91 101 187 204 2,046,983 3,306,567 4,770.2 12,026.6 11.8 13.7
Russia 16,376,870 75 76 144 144 1,696,729 3,721,985 5,323.4 14,125.9 21.5 20.6
India 2,973,190 466 495 1,144 1,294 3,238,319 7,346,149 707.0 1,573.1 22.7 26.0
China 9,388,211 766 787 1,304 1,364 6,639,272 18,335,662 1,753.4 7,683.5 28.4 21.6
BRICs 37,096,411 1,398 1,459 2,778 3,006 13,621,304 32,710,362 1,709.8 5,667.5 23.1 20.8
EU 4,237,941 236 247 496 508 13,652,971 19,124,880 29,108.6 36,666.6 34.7 39.9
World 129,732,900 3,011 3,331 6,517 7,269 65,725,355 110,805,996 7,277.7 10,874.9 28.7 30.2
BRICs/World 28.59% 46.44% 43.79% 42.63% 41.36% 20.72% 29.52% -- -- -- --
EU/World 3.27% 7.85% 7.40% 7.61% 6.99% 20.77% 17.26% -- -- -- --Note: (1) millons of people, (2) millons of current international $, (3) current $Source: Own elaboration. Word Bank data.
Certain socio-economic aspects position BRICs well ahead of advanced economies such
as the EU as a whole. In terms of geographical area, as shown in Table 1, these four
countries occupy 28.6% of the world’s surface, with their workforce and population
representing more than 41% of the world total. In the period 2005-2014, their GDP in
terms of purchasing power parity (PPP) underwent growth of more than 140%; in 2014,
it far surpassed that of the EU, representing more than 29.5% of the world total. In
addition, according to data from the International Monetary Fund (IMF), over the last
decade, the average annual growth of this group of emerging countries has been above
8%, compared to 2% in advanced economies.
Similarly, while the BRICs’ GDP per capita remains at levels far below the EU and the
world average, their high rates of economic growth together with population control
have led to substantial increases. As a result, in the not too distant future, they could be
on a par with the levels of more advanced economies. Although China is notably ahead
of the rest of the members, it could be argued that this group of countries - which now
6

counts South Africa as a member - could form an international financial alliance
capable of capturing substantial market share.
The 2008 financial crisis only reaffirmed the BRICs’ position in the international
context, to the detriment of the major world powers, such as the United States (US) and
European countries. China’s position as the largest holder of official currency reserves
became apparent, along with the growing openness of these economies. Thus, in 2009,
the Asian giant became the world's leading importer of agricultural raw materials and
metals, Brazil the ninth largest exporter of agricultural raw materials and the fifth
largest of metals, and Russia the largest exporter of fossil fuels and seventh in metals
(Orgaz et al., 2011).
Brazil, Russia, India, China and South Africa (BRICS) currently constitute a
cooperation group that calls for the major international organizations, the World Bank
and the IMF, to change their representation quotas to paint a more realistic picture of the
main actors on the international scene. All the countries in the BRICS are members of
the G-20, indicating their interest in maintaining international financial stability and
dealing with issues that are beyond the scope of action of other lower-level
organizations. However, according to Katz (2012), there is a lack of cohesion in the
group, due to the qualitative difference between China and Russia, on the one hand, and
the rest of the partners on the other. Added to this are the insurmountable geographical
and historical issues, and the group’s military asymmetry with the US, preventing them
from forming a long-term alliance to combat American supremacy.
This new power group should be analysed in a broader context within the globalization
process, and understood as a phenomenon of cultural, economic, environmental,
political and social integration, where GVCs become an important substitute for gross
trade volumes. According to the Heckscher-Ohlin theory, when countries have identical
7

production technologies, their comparative advantages depend on their factor
endowments. Hence, less advanced economies, with limited access to capital and an
abundance of low-skilled labour, should exploit market niches that require natural
resources and labour-intensive work, allowing for low human capacity (Chen & De
Lombaerde, 2014).
Another aspect that underlines the lack of cohesion of the BRICs is their general
struggle to position themselves in value chains. They all consider this the best way to
consolidate their situation on the international stage and thus absorb the knowledge of
advanced economies, enabling them to develop technologies and improve their
competitiveness. However, this group’s trade is characterized by low-tech
manufacturing intensive in low-skilled labour; Brazil and Russia are mainly suppliers of
raw materials, while China and India provide manufactured goods and services,
respectively. This different specialization is reflected in their backward/forward2
participation in GVCs (Figure 1).
Figure 1. BRICs' share of GVCs in 2005 (% of gross exports)
2 See Koopman et al. (2010)
8
Source: Own elaboration. TiVA data (OCDE)
Russia notably leads the BRIC group in terms of GVC participation, with a 57.5% share
of its gross exports. Forward participation (49.3%) far exceeds backward (8.2%), as
shown in Figure 1. As mentioned above, Russia is a nation rich in raw materials,
specifically energy resources (large deposits of oil, coal and natural gas) as well as a
leading producer of steel and aluminium. These goods are exported to other countries to
be incorporated into their production processes, in what has been termed forward
participation. At the same time, the fact that Russia has little need to buy intermediate
goods from abroad is reflected in its more limited backward participation. Conversely,
China’s participation accounted for 48.6%, with a much greater emphasis on backward
linkages (36.4%) than forward (12.2%). The Asian country has a very high volume of
imports; it fulfils a natural role as an assembler of intermediate goods used in the
manufacture of finished products, thus positioning itself closer to the final consumer.
Lastly, both India and Brazil are more like Russia in that their natural resources mean
they engage in more forward participation and are therefore positioned in the initial
links of the GVC, a situation very similar to that of other developing countries.
However, the BRIC countries as a group are driven by the same desire to increase their
participation in GVCs and become an essential part of production chains.
In line with the main aim of this research, the BRICs are analysed below in terms of the
index of economic freedom (IEF) and the logistics performance index (LPI), in order to
understand their current situation and the possible influence on these countries’ value-
added imports.
2.1 Economic freedom and logistic performance indexes of the BRICs
9

The IEF is a joint annual publication of the Heritage Foundation and The Wall Street
Journal, which analyses a wide range of fundamental factors to assess countries’
economic freedom. In some years, it has reported on more than 180 countries. The joint
evaluation of all the assessed factors reveals that countries with higher levels of
economic freedom enjoy greater political stability and higher income levels, with higher
scores generally associated with larger economies and more social progress. In addition,
citizens of such countries benefit from more mobility, facilitating access to innovation
jobs and high levels of development. The IEF is composed of four pillars of economic
freedom, defined by the following factors:
- Rule of law: property rights and government integrity.
- Government size: tax burden and government spending.
- Regulatory efficiency: business freedom, labor freedom and monetary freedom.
- Market openness: trade freedom, investment freedom and financial freedom.
IEF values can range between 0 and 100, calculated as an average of all its components,
with equal weight assigned to each one. It provides valuable information for analysing
the different countries, in terms of politics and development, in a globalized
environment. Table 2 presents the index value and scores for the individual components
for the years under study, calculating the IEF for the group of BRIC countries and for
the EU28 as the average of the scores obtained by each member.
10

Table 2. Economic Freedom Index 2005 and 2014. BRICs and EU28
IEF Rule of law Government size
Regulatory efficiency
Market openness
2005 2014 2005 2014 2005 2014 2005 2014 2005 2014
Brazil 60.9 56.6 44.5 46.0 77.7 59.7 65.3 58.4 56.3 59.9
China 53.6 52.7 32 30.0 78 75.6 62.6 63.1 42.7 42.3
India 52.2 54.6 39 45.5 75.3 78.9 63.2 52.4 34.7 46.5
Russia 52.4 52.1 29 24.0 77.1 72.0 63.2 66.4 40.9 43.3
BRICs 54.8 54.0 36.1 36.4 77.1 71.5 63.6 60.1 43.6 48.0
EU28 68.3 69.0 65.9 66.6 51.2 49.9 74.8 73.4 74.7 78.9
Source: Own elaboration. The Heritage Foundation data.
The IEF has shown little change over the years under analysis (2005 and 2014),
registering a slight decline in the case of the BRICs but an improvement in the EU. In
both economic zones, government size and regulatory efficiency scores have fallen,
whereas great advances have been made in terms of open markets. The years under
analysis represent very different points in the world economic cycle, that is, they span a
period in which all economies have had to adapt their structures to overcome the severe
crisis that has affected them all to a greater or lesser extent. In the case of the BRICs,
progress has been made in terms of greater integration in the international scene,
however the IEF indicates that there is still a long way to go to match the levels of the
European countries. Overall, the EU28 holds at least a 10-point advantage over the
BRICs, and as much as 30 points in the open markets pillar.
The IEF has been used both in studies on foreign direct investment (Dellis et al., 2017;
Sayari et al., 2018) and in the field of international trade (McGowan & Milner, 2011).
In the latter, trade costs are related to the freedom index, demonstrating that economic
policy variables can be a key component influencing costs. Following this approach,
and as stated in the objectives, this research focuses on analysing the relationship
between economic freedom and value-added imports.
11

In addition, these countries’ position in terms of logistics is evaluated through the LPI
published by the World Bank (Arvis et al., 2007, 2016). Trade facilitation is currently
considered one of the key factors in international trade, making tariff barriers
increasingly less important. The LPI is a good indicator of trade facilitation for a broad
group of countries. The index values logistics differ between countries and provide a
general picture of customs procedures, logistics costs and the quality of the
infrastructure necessary for overland and maritime transport.
The aggregate index is calculated by analysing six main components using the
following indicators: customs, infrastructure, international shipments, logistics quality
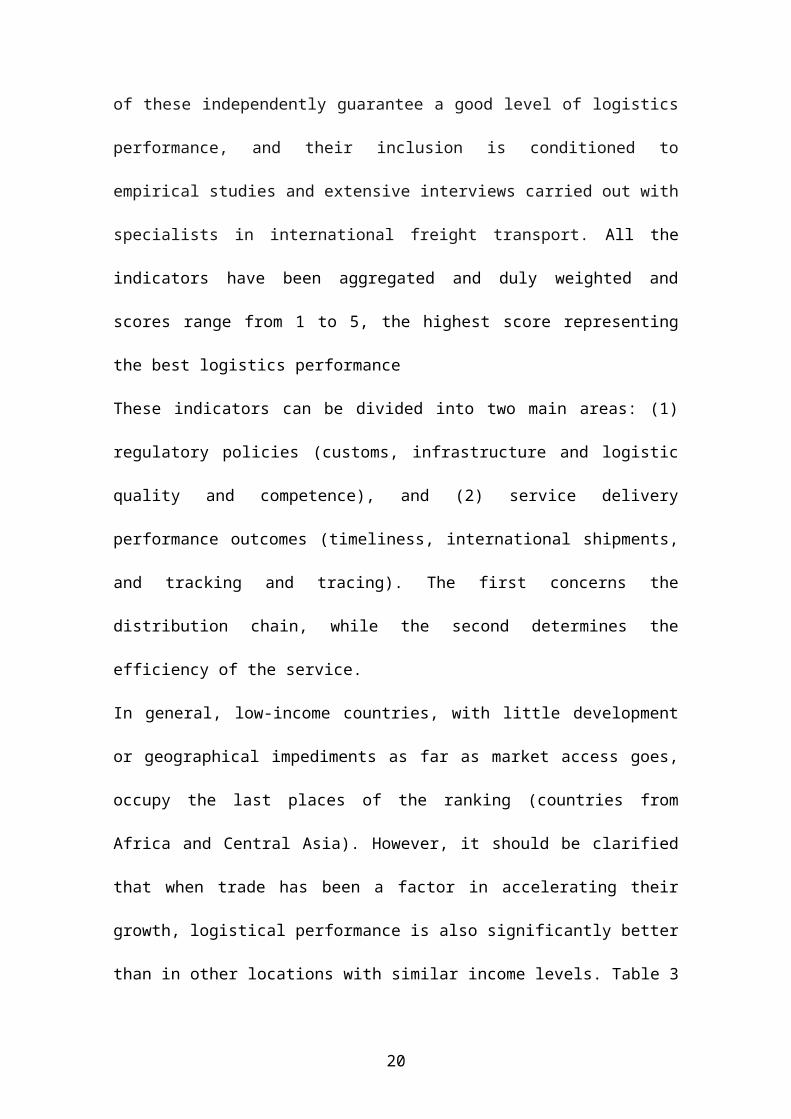
and competence, tracking and tracing, and timeliness. None of these independently
guarantee a good level of logistics performance, and their inclusion is conditioned to
empirical studies and extensive interviews carried out with specialists in international
freight transport. All the indicators have been aggregated and duly weighted and scores
range from 1 to 5, the highest score representing the best logistics performance
These indicators can be divided into two main areas: (1) regulatory policies (customs,
infrastructure and logistic quality and competence), and (2) service delivery
performance outcomes (timeliness, international shipments, and tracking and tracing).
The first concerns the distribution chain, while the second determines the efficiency of
the service.
In general, low-income countries, with little development or geographical impediments
as far as market access goes, occupy the last places of the ranking (countries from
Africa and Central Asia). However, it should be clarified that when trade has been a
factor in accelerating their growth, logistical performance is also significantly better
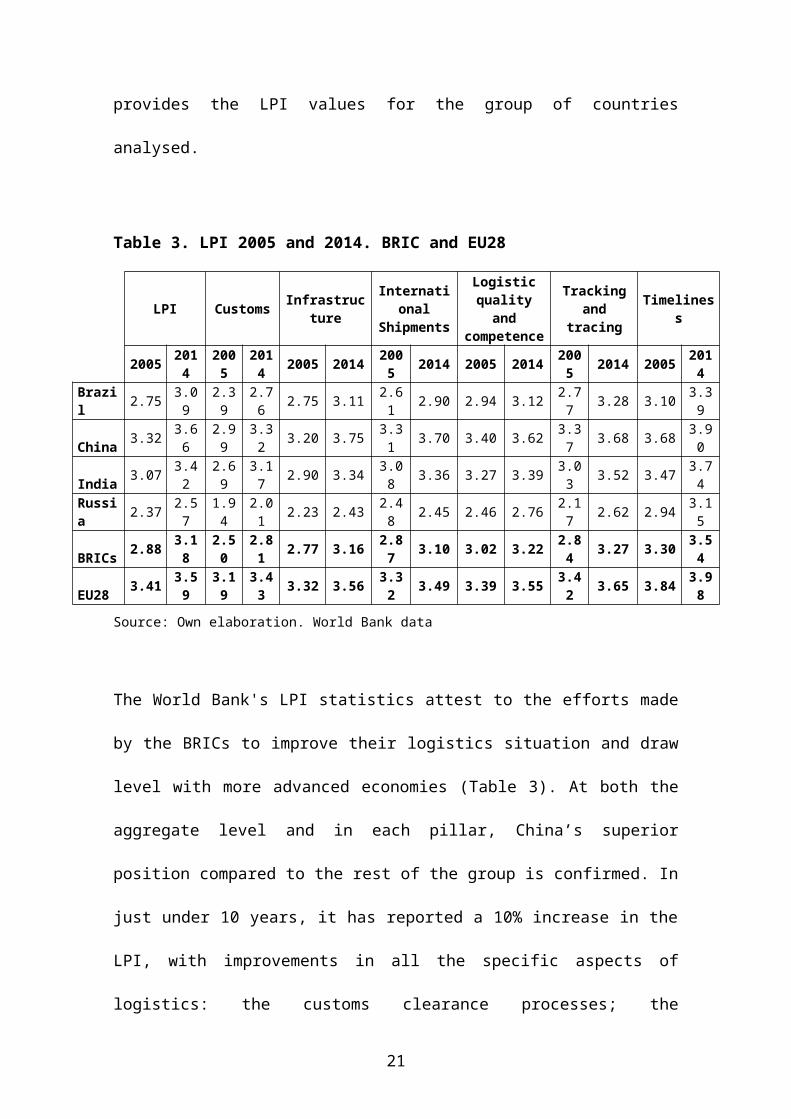
than in other locations with similar income levels. Table 3 provides the LPI values for
the group of countries analysed.
12
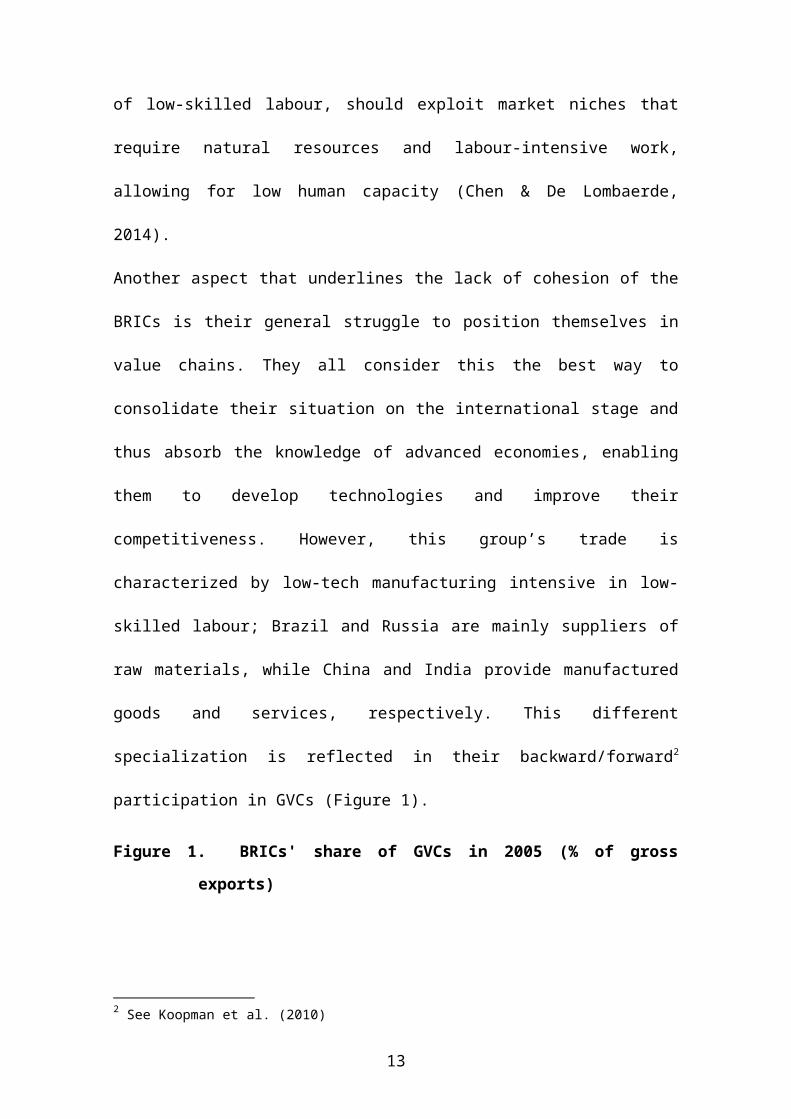
Table 3. LPI 2005 and 2014. BRIC and EU28
LPI Customs Infrastructure International Shipments
Logistic quality and competence
Tracking and tracing Timeliness
2005 2014 2005 2014 2005 2014 2005 2014 2005 2014 2005 2014 2005 2014
Brazil 2.75 3.09 2.39 2.76 2.75 3.11 2.61 2.90 2.94 3.12 2.77 3.28 3.10 3.39
China 3.32 3.66 2.99 3.32 3.20 3.75 3.31 3.70 3.40 3.62 3.37 3.68 3.68 3.90
India 3.07 3.42 2.69 3.17 2.90 3.34 3.08 3.36 3.27 3.39 3.03 3.52 3.47 3.74
Russia 2.37 2.57 1.94 2.01 2.23 2.43 2.48 2.45 2.46 2.76 2.17 2.62 2.94 3.15
BRICs 2.88 3.18 2.50 2.81 2.77 3.16 2.87 3.10 3.02 3.22 2.84 3.27 3.30 3.54
EU28 3.41 3.59 3.19 3.43 3.32 3.56 3.32 3.49 3.39 3.55 3.42 3.65 3.84 3.98
Source: Own elaboration. World Bank data
The World Bank's LPI statistics attest to the efforts made by the BRICs to improve their
logistics situation and draw level with more advanced economies (Table 3). At both the
aggregate level and in each pillar, China’s superior position compared to the rest of the
group is confirmed. In just under 10 years, it has reported a 10% increase in the LPI,
with improvements in all the specific aspects of logistics: the customs clearance
processes; the infrastructure for transporting goods; the ease of arranging competitively
priced shipments; the timeliness of the delivery and receipt of shipments; the quality of
the logistic services offered; and the ability to track and trace consignments, and
subsequently resolve problems. The Asian country has made enormous economic
efforts to improve its trade framework and better its position in the world market. In
2014, it surpassed the European average, not only in aggregate terms (3.66 compared to
3.59 for Europe), but in each of the components. It is closely followed by India, while
Brazil and Russia have further to go to match the levels of the advanced economies.
A key objective of this paper is to consider the LPI variable and its components as
determinants of trade. Logistics as an explanatory variable of gross exports has been
analysed in a number of studies in the literature (Hertel & Mirza, 2009; Felipe &
13

Kumar, 2012; Marti & Puertas, 2017). They all confirm the importance of this variable
in explaining trade. Hence, in the empirical part of this research, the LPI is used as a
proxy for logistics, to analyse its importance in the trade of intermediate goods.
3. Methodology and sample
The gravity model is based on Newton’s law of universal gravitation, according to
which the gravity between two bodies is directly proportional to the product of their
masses and inversely proportional to the square of the distance between them. The
tenets of this theorem shaped the studies of Tinbergen (1962) and Pöyhönen (1963),
leading to the development of the methodology now widely used in the analysis of
international trade. It was completed with the theoretical foundations provided by
Anderson (1979) and Bergstrand (1985, 1989). This well-established technique focuses
on assessing the determinants of bilateral trade between countries (Anderson & van
Wincoop, 2003; Anderson & Yotov, 2012; Head & Mayer, 2014; Cirera et al., 2016).
A discussion has recently arisen in the literature about whether it is more appropriate to
use gross trade flows or value-added trade. On the one hand, Kowalski et al. (2015)
point out in their research the disadvantages involved in interpreting the results of the
gravity equations when using value added as a dependent variable, revealing a
significant increase in the sensitivity of the indirect effects. However, there has been
increasing use of value added rather than gross trade statistics in studies such as those of
López (2012), Noguera (2012), Kohl et al. (2016) and the IMF (2016), which report
robust results regarding global and sectorial trends in GVCs. In this vein, Choi (2013)
and Auer et al. (2017) conclude that the use of the latter leads to an overestimation of
the elasticities of trade, with more accurate results obtained when using value-added
trade instead.
14

The model specification includes not only the variables of the basic gravity model
(GDP, population and distance), but also those providing additional information on
patterns in trade relationships, giving rise to an extended model. In line with the aim of
the proposed research, this specification of the gravity model includes the IEF, the LPI
and each of their respective components. In order to avoid multicollinearity problems,
the indexes and their pillars have been analysed individually, so that a total of 24 gravity
models have been estimated for the years 2005 and 2014.
Log (Mijt) = 0+ 1 Log (Dij)+ 2 Log (GDPit) +3 Log (GDPjt) + 4 Log (Pit) +
5 Log (Pjt) +6 Indexit + 7Indexjt + uijt
(1)
where, Mijt: Quantity imported by country i to country j at time t (add value import)Dij: Distance between country i and country jGDPit: GDP nominal of country i at time tGDPjt: GDP nominal of country j at time tPit: Population of country i at time tPjt: population of country j at time tIndexit: Index/pillar analised for country i (ILE, LPI or components)Indexjt: Index/pillar analised for country i for country j (ILE, LPI or components)uij: Standard error
The dependent variable M represents the goods and services imported by the BRICs
from the EU28. As stated above, the analysis of GVCs involves substituting gross
imports for value-added imports, which have been calculating using the method
proposed by Koopman et al. (2014). It involves matrix calculations using international
input-output tables (IOTs), which enables a determination of the value-added traded
with third countries. The double counting problem inherent in official trade statistics
can thus be avoided. This will result in a GN by G value-added production matrix as:
Value added production=⌈
V̂ 1 0 … 00 V̂ 2 … 0⋮ ⋮ ⋱ ⋮0 0 ⋯ V̂ G
⌉ ⌈X11 X12 … X1G
X 21 X22 … X2G
⋮ ⋮ ⋱ ⋮XG1 XG2 ⋯ X ¿
⌉ (2)
15
Vs: denotes a 1 by N row vector of direct value-added coefficient in “s”Xsr: is a Nx1 gross output vector that gives gross output produced in s and absorbed
in r
Exports of value-added can be defined as the elements in the off-diagonal columns of
this matrix (Equation 2¿. Obviously, it excludes value-added produced by the home
country that returns home after being processed abroad.
The information used in this paper to calculate value-added has been sourced from
World Input-Output Database (WIOD). This database includes annual series of input-
output tables from 1995 to 2014, containing information on 43 countries (plus an
aggregate representing the rest of the world), and the data are disaggregated into 56
sectors. They are based on officially published input–output tables merged with national
accounts data and international trade statistics. In addition, the WIOD provides data on
factor inputs enlarging the scope of potential applications considerably. The columns in
the World Input Output Table (WIOT) contain information on production processes.
When expressed as ratios to gross output, the cells in a column provide information on
the shares of inputs in total costs. Such a vector of cost shares is often referred to as a
production technology. Products can be used as intermediates by other industries, or as
final products by households and governments (consumption) or firms (stocks and gross
fixed capital formation). The distribution of the output of industries over user categories
is indicated in the rows of the table. An important accounting identity in the WIOT is
that gross output of each industry (given in the last element of each column) is equal to
the sum of all uses of the output from that industry (given in the last element of each
row)3.
The independent variables satisfy the original hypothesis that all of them have a
significant impact on trade, and the signs are coherent with the postulates of economic
3 See a more detailed explanation in Timmer et al (2015).
16

theory. Distance, as an indication of transport costs, is problematic when assumed to be
independent of the mode of transport used and the capitals or economic centres of the
country. The effect of distance between countries (1) should be negative because
closeness promotes more trade. It is expressed in kilometres and has been obtained from
CEPII (Centre d´Etudes Prospectives et d´Informations Internationals), serving as a
first approximation given the complexity of determining the location of production
areas, which are often distributed throughout a given territory.
Theoretically, the GDP coefficients of both the importer and exporter (2 and 3) will be
positive, and with more economic value, there is an expectation that imports, and
exports will be more significant. However, the population coefficient for the importer
(4) can be positive or negative depending on whether the more populous country
exports less due to an absorption effect of domestic production or exports more due to
the predominance of technological and logistic variables associated with the level of
economic development. In turn, the population coefficient of the exporter (5) also has
an ambiguous sign for the same reasons that have been presented above. The GDP data
(expressed in dollars) and population have been obtained from the United Nations
database.
IEF and LPI (Index) provides both qualitative and quantitative measurements, helping
to build socio-economic and logistical profiles for countries, and to measure
performance throughout the entire supply chain. Values of IEF and LPI for both
importer and exporter and each of its pillars are included individually in the gravity
model coefficients (6 and 7), a positive sign is expected in both cases.
Table 4 shows the main descriptive statistics of the dependent variable (value-added
imports) as well as the set of independent variables that define the gravity model for the
two years under analysis, 2005 and 2014.
17

Table 4. Main descriptive statistics
VALUE-ADDED IMPOR
T1
DISTANCE2
GDPIMPORT1
GDPEXPOR
T1
POPULATION
IMPORT3
POPULATION
EXPORT3
IEF EXPORT
IEF IMPORT
LPI EXPO
RT
LPI IMPO
RT
2005MEAN 1,795.7 6,346.9 1,194,127 514,722 688.8 17.7 68.3 54.8 3.4 2.9
Maximum 29,553.9 11,316.1 2,308,800 2,861,339 1,290.2 82.7 82.2 60.9 4.2 3.3
Minimum 0.7 794.1 764,016 6,393 144.0 0.4 53.6 52.2 2.7 2.4Stand. error 3,750.1 3,064.9 648,068 804,245 528.9 22.5 6.8 3.6 0.5 0.4
2014MEAN 4,457.3 6,346.9 4,257,212 663,374 753.6 18.1 69.0 54.0 3.6 3.2
Maximum 103,714.5 11,316.1 10,534,526 3,879,276 1,369.4 80.6 76.8 56.6 4.2 3.7
Minimum 18.0 794.1 2,030,972 10,737 143.4 0.4 54.0 52.1 2.8 2.6
Stand. error 11,331.9 3,064.9 3,643,808 1,016,503 582.4 23.0 5.6 1.8 0.4 0.4
Note: (1) milions of $, (2) Km2 , (3) milions of peopleSource: Own elaboration
The statistics confirm emerging economies’ growing predominance over European
economies (Table 4). In terms of value-added imports, there has been nearly a four-fold
increase in volume traded, thus consolidating the BRICs position in GVCs, as well as
the steady increase in international market share. In just under nine years, a period
marked by the severe global crisis that hit almost all advanced economies, the GDP of
the BRICs has gone from an average of almost $1.2 billion to more than $4.25 billion.
In this same period, this group’s population has grown at a more moderate pace, thereby
resulting in an improvement in the standard of living of its inhabitants, coinciding with
the greater dynamism of its external sector. Furthermore, the IEF values show that,
although there are no notable changes in the EU or the BRICs, the BRICs show less
variation in the sample. In other words, the levels reached by these four countries
18

converge around similar values, making the group more uniform. Finally, the LPI of
both the importer and the exporter have improved, though the improvement is more
noticeable in the former. This is due to the fact that the growth of value-added imports
has required them to improve their logistics structures in order to adapt to the demands
of developed countries and to be able to compete on equal terms with more advanced
economies.
4. Determinants of BRICs-EU28 bilateral trade: gravity model
In order to model value-added imports to the BRICs from the EU, the following
specification of equation (1) was estimated. The four importers are Brazil, Russia, India
and China; it should be noted that although South Africa joined the group in 2011, it
could not be included due to the lack of input-output tables in the WIOD database that
are required to calculate its value added. With respect to exporters, all 28 countries that
were part of the EU in 2014 are considered, despite the fact that not all of them
belonged to this economic group in 2005. The aim of the research is to analyse the
differences between these two years, and so the same countries should be included;
otherwise, their omission may affect the results in such a way as to obscure the changes
that actually occurred.
A total of 24 gravity models were estimated in order to individually analyse the
influence of economic freedom and logistics, as well as each of their pillars, on the
bilateral trade between these two powers, BRIC and EU28, in 2005 and 2014. These
two years were selected in order to determine whether or not the results obtained were
affected by the economic circumstances of this period. All the coefficients shown in
Tables 5, 6 and 7 have been standardised to avoid differences between the units of
19
measurement of the variables used, so that a comparative analysis can be made of all the
variables used.
Table 5. Gravity model 2005 and 2014: IEF and LPI
IEF LPI2005(1)
2014(2)
2005(3)
2014(4)
Distance -0.621*** -0.409*** -0.618*** -0.431***
GDP import 0.162*** 0.452*** -0.002 0.284***
GDP export 1.010*** 0.808*** 0.917*** 0.728***
Population import 0.430*** -0.040* -0.693*** -0.388***
Population export -0.196*** -0.101** -0.163* -0.061
IEF import 0.413*** 0.171*** - -
IEF export 0.048 0.074*** - -
LPI import - - 1.126*** 0.478***
LPI export - - 0.087 0.076*
Adj R-squared 0.905 0.958 0.910 0.953Observations 112 112 112 112Dependet variable: import of added valueNote: *** p-value<0.01; ** p-value<0.05; * p-value<0.1Source: Own elaboration
The results of the four gravity models estimated reveal that the independent variables
explain more than 90% of the value-added imports to the BRICs from the EU.
Moreover, the signs of all significant coefficients are consistent with economic theory
of international trade. With the exception of model 3, the GDP of the exporter is the
most important variable in all the estimated models, with a direct relationship revealed
between the level of national production and the export volume. However, it can be seen
that in 2014, although this remains the most important variable, importer GDP is closing
20
the gap. The vertiginous growth experienced by these emerging economies has led to an
increase in the purchase of intermediate goods required to complete the link in the
production chain where they are competitive.
Likewise, the geographical distance between buyers and sellers is a determinant of their
business relationships, with a negative coefficient indicating that this distance still
makes connections difficult in 2014. That said, just as with the wealth of the exporter,
this variable has become less important; BRIC countries have been able to make
progress in certain key aspects that have allowed them to overcome the serious
disadvantages in terms of transport associated with long distances between countries.
The population coefficient is negative and significant in all the estimates, except for
model 1, where the coefficient for the importer is positive, and model 4, where the
coefficient for the exporter is not significant. These results are consistent with the
international trade theory: in the case of imports of intermediate goods and services, the
amount traded would not necessarily be determined the size of the population; the
specialization of the sector of the population dedicated to transforming the imported
goods will play a more important role. Hence, the sign of the coefficient of this variable
is not decisive.
Regarding the determinants that extend the basic gravity model, IEF and LPI, a notably
greater effect on the importer than on the exporter can be observed. In all cases, the
coefficients have turned out to be positive with maximum significance, again in line
with economic theory. The degree of economic freedom of the emerging countries has
become a less important determinant of their imports. Whereas in 2005 it was much
more influential than GDP and comparable to the population variable, by 2014 it has
decreased by more than half. This could be explained by the agreements signed between
2005 and 2014 to facilitate the free movement of goods and services, which have
21

lessened the need to make institutional improvements to aspects that may have been
decisive a decade ago. Something similar emerges with the coefficients of the LPI:
whereas in 2005 (model 3, Table 5) the importer’s logistics performance was the most
influential variable for the volume of products acquired by the emerging countries, in
2014, this variable— although still relevant—is less important than the exporter's GDP.
At aggregate level, the two indexes are not at all important with respect to European
countries, since their positioning and status as advanced economies enables them to
operate in more favourable conditions than their emerging counterparts. Nevertheless,
the emerging countries should continue to adopt policies that facilitate world trade and
help them to draw even closer to their partners; the European economies enjoy an
advantage given their dominance in international markets.
The individual pillars that make up the economic freedom and logistics indexes have
also been specifically analysed. To that end, a gravity model was estimated for each
component and year, thus providing a more detailed analysis of the fundamental aspects
driving trade between the BRICs and the EU. This will help identify which particular
aspects require more work in order to achieve greater integration. First, Table 6 shows
the results obtained from estimating the models including all of the IEF pillars.
Table 6. Gravity model 2005 and 2014: Pillars of IEF
2005 2014
(5) (6) (7) (8) (9) (10) (11) (12)Distance -0.626*** -0.634*** -0.641*** -0.614*** -0.440*** -0.454*** -0.440*** -0.409***
GDP import 0.455*** -2.497*** 0.361*** -0.049 0.527*** 0.331*** 0.735*** 0.427***
GDP export 0.904*** 1.054*** 1.079*** 1.008*** 0.750*** 0.981*** 0.865*** 0.761***
Population import 0.070** 2.618*** 0.421*** 0.669*** -0.148*** 0.222*** -0.392*** 0.031Population export -0.106 -0.247*** -0.265*** -0.190*** -0.054 -0.249*** -0.161*** -0.070Rule of law imp 0.385*** 0.228***
Rule of law exp 0.089* 0.065**
Goverment size imp 2.370*** -0.278***
Goverment size exp -0.012 0.060***
22
Regulatory efficiency imp 0.472*** -0.394***
Regulatory efficiency exp -0.006 0.034**
Market opennes imp 0.530*** 0.179***
Market opennes exp 0.063** 0.080***
Adj R-squared 0.906 0.903 0.903 0.907 0.953 0.955 0.953 0.958Observations 112 112 112 112 112 112 112 112
Dependet variable: import of added valueNote: *** p-value<0.01; ** p-value<0.05; * p-value<0.1Source: Own elaboration
All the economic freedom pillars for the BRICs have a greater impact on the value-
added imports in 2005 than in 2014, and are also shown to be more important than for
European countries (Table 6). Among the pillars, it is worth highlighting that the
government size pillar includes not only taxes but also government spending. In 2005,
for each unit increase in this pillar, the standard deviations of the BRIC imports more
than doubled. Next most important is the degree of market openness, followed by
regulatory efficiency and, finally, rule of law. It can be concluded that the aspects that
determine economic freedom have had a decisive effect on these countries’ inclusion in
the international trade framework, set by advanced economies such as the European
countries. This is shown by the significance of the pillars of the IEF index in models 5
to 8. In 2014, following the economic strains suffered by most of the advanced
economies, the aspects related to economic freedom have faded in importance, with
European GDP, importer GDP and distance becoming the key factors that determine the
volume traded between the BRICs and the EU28. In addition, the new world order has
opened up possible new scenarios where excessive government intervention and
legislative effectiveness can lead to a reduction in these economies’ market share (-
0.278 and -0.394, respectively).
Economic freedom does not exclusively consist in the absence of restrictions imposed
by the authorities; rather, it should involve a feeling of freedom prevailing in all sectors
of society. However, it is not incompatible with the need to promote peaceful societal
23

progress; certain norms of civil conduct have to be respected. In less advanced
economies, these parameters determine their development to a certain extent, becoming
less influential as they draw level with more developed world powers.
In short, economic freedom is an important factor in business relationships. However,
logistics has an even greater impact on bilateral trade between emerging and developed
economies (models 3 and 4). Table 7 shows the results of the estimations carried out to
analyse each of the individual components that comprise the countries’ logistics
performance.
24
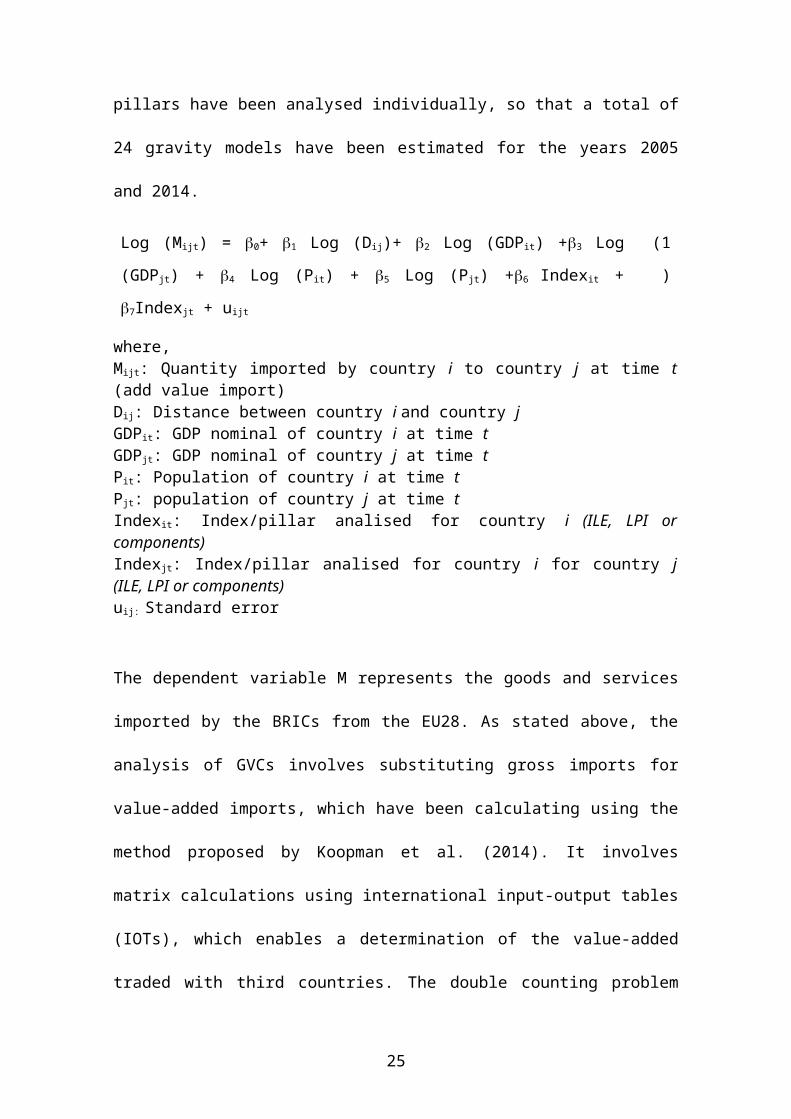
Table 7. Gravity model 2005 and 2014: Pillars of LPI
2005 2014
(13) (14) (15) (16) (17) (18) (19) (20) (21) (22) (23) (24)Distance -0.604*** -0.622*** -0.618*** -0.611*** -0.648*** -0.654*** -0.420*** -0.437*** -0.431*** -0.407*** -0.446*** -0.440***
GDP import 0.017 0.031 -1.325*** 0.174*** 0.042 -0.617*** 0.349*** 0.257*** 0.213*** 0.244*** 0.334*** 0.190***
GDP export 0.803*** 0.730*** 0.937*** 0.884*** 1.136*** 1.174*** 0.729*** 0.774*** 0.655*** 0.656*** 0.801*** 0.768***
Population import -0.529*** -0.318*** -5.985*** -0.523*** -0.424*** -2.807*** -0.314*** -0.292*** -0.559*** -0.404*** -0.295*** -0.849***
Population export -0.071 -0.018 -0.191*** -0.151* -0.296*** -0.321*** -0.062 -0.095 -0.009 -0.021 -0.120** -0.082Customs import 0.953*** 0.364***
Customs export 0.141** 0.079**
Infrastucture import 0.771*** 0.416***
Infrastucture export 0.180** 0.054Inter.shipments import 7.261*** 0.686***
Inter.shipments exp 0.095** 0.123***
Log.qual./compet. import 0.845*** 0.503***
Log.qual./compet. export 0.112* 0.121***
Track./tracing import 0.874*** 0.376***
Track./tracing export -0.041 0.048Timeliness import 3.640*** 0.985***
Timeliness export -0.066 0.059**
Adj R-squared 0.907 0.908 0.907 0.906 0.903 0.905 0.954 0.952 0.959 0.957 0.952 0.953Observations 112 112 112 112 112 112 112 112 112 112 112 112
Dependet variable: import of added valueNote: *** p-value<0.01; ** p-value<0.05; * p-value<0.1Source: Own elaboration
25

In 2005, the components comprising logistics performance were the most important
determinants of the BRIC countries’ value-added trade (models 13-18, Table 7), ahead
of traditional variables such as the GDP of the exporting country or distance. These
economies have had to make substantial progress in aspects that may seem trivial to
European nations, such as ease of arranging shipments or timeliness. Nevertheless,
given the characteristics of this group, such components play a decisive role in their
insertion in the international arena.
Just as with the IEF, in 2014 all the logistics components play a less prominent role,
although they continue to determine the course of action (models 19-24, Table 7). In
addition, the relatively greater importance of the importer’s logistics performance
compared to the exporter’s is confirmed again. Timeliness, the quality of the logistic
services on offer, and ease of arranging shipments once more predominate over the
other elements, registering similar values to the GDP of the exporter, and at times even
surpassing that variable.
The comparison between 2005, as a year prior to the economic crisis, and 2014, as a
point on the way to recovery, confirms the existence of significant changes in the
determinants of value-added trade. Estimates reveal a lesser impact of the independent
variables in relation to imports. The difference between the coefficients of the importers
and the exporters is also less marked, reflecting the fact that the BRICs are advancing
ever closer to the performance of the European economies.
5. Conclusions
The development and growth of international trade witnessed this century has been
characterized by the incorporation of new actors, along with a gradual reduction in tariff
barriers and a more important role played by GVCs. As a result, emerging countries are
26

positioning themselves at the levels typical of advanced economies. International trade
figures reveal that the BRICs, currently considered one of the most influential groups of
emerging nations, have become the main destination for European intermediate
products. Thanks to their economic and social development, they have assumed a
dominant position in the GVCs controlled by the old continent.
The calculation of value-added imports and the estimation of a gravity model have
enabled an analysis of the determinants of the BRICs-EU28 trade. The aim was to
quantify the relative importance of all those determinants and draw attention to those
aspects that require greater effort following the severe recession of 2008. The results
reveal that the BRICs have strengthened their position to the detriment of European
countries. The growth of their GDP has led to an enormous improvement in their
position in GVCs, at times reaching critical levels that enable continuity in the
production process.
In recent years, a growing uniformity has been observed among BRIC countries;
however, China’s predominance over the others is notable, more in terms of logistics
than economic freedom. The Asian giant has understood how to make the most of its
resources and has managed to exploit those niche markets where it enjoys comparative
advantages. It has thus developed all aspects of logistics to reach levels comparable to
advanced economies. India is close behind, whereas Brazil and Russia must step up
their efforts.
Moreover, it has been shown that economic freedom and the level of logistics
performance in emerging countries are key to ensuring their position in production
chains. The BRICs are still emerging economies that must compete not only with the
most advanced economies, but also with developing countries seeking a niche in the
international market through competitive prices. Their efforts should be aimed at
27

achieving greater freedom, and eliminating tariffs and trade quotas in order to foster the
free movement of goods and services. Actions such as these, together with the
development of policies that promote business opportunities and economic expansion,
will result in job creation and a boost to competitiveness.
Recently, the greater specialization of these countries has enabled them to gain an
increased share of world trade. That said, just as the efforts made in logistics have
begun to bear fruit, when it comes to certain pillars of economic freedom, they lag well
behind the developed economies.
References
Anderson, J.E. (1979). A theoretical foundation for the gravity equation. American Economic Review, 69 (1), 106-116.
Anderson, J.E., & van Wincoop, E. (2003). Gravity with gravitas: A solution to the border puzzle. American Economic Review, 93(1), 170-192.
Anderson, J.E., & Yotov, Y.V. (2012). Gold standard gravity. NBER working paper 17835.
Arvis, J.F., Mustra, M., Panzer, J., Ojala, L., & Naula, T. (2007). Connecting to Compete 2017: Trade Logistics in the Global Economy--The Logistics Performance Index and Its Indicators. Washington DC: The World Bank.
Arvis, J.F., Saslavsky, D., Ojala, L., Shepherd, B., Busch, C., Raj, A., & Naula, T. (2016). Connecting to Compete 2016: Trade Logistics in the Global Economy--The Logistics Performance Index and Its Indicators. Washington DC: The World Bank.
Auer, R., Borio, C., & Filardo, A. (2017). The globalization of inflation: the growing importance of global value chains. Working Papers, 602.
Bair, J. (2005). Global capitalism and commodity chains: Looking back, going forward. Competition & Chang 9(2), 153-180.
Bergstrand, J. (1985). The gravity equation in International trade: Some microeconomic foundations and empirical evidence. Review of Economics and Statistics, 67(3), 474-481.
Bergstrand, J. (1989) The generalized gravity equation, monopolistic competition, and the factor-proportions theory in international trade. Review of Economics and Statistics, 71(1), 143-153.
Castro, A. (2012). The BRICS as a Coalition: Analysing the Cooperation of Brazil, Russia, India, China and South Africa in the International Monetary Fund and the G-20. Social Science Research Network. Available at SSRN: https://ssrn.com/abstract=2304399
28

Chen, L., & De Lombaerde, P. (2014). Testing the relationships between globalization, regionalization and the regional hubness of the BRICs. Journal of Policy Modeling, 36, 111-131.
Choi, N. (2013). Measurement and determinants of trade in value added. KIEP, Working Paper, 13-01
Cirera, X., Foliano, F., & Gasiorek, M. (2016). The impacto of preferences on developing countries’ exports to the European Union: bilateral gravity modelling at the product level. Empirical Economics, 50, 59-102.
Dellis, K., Sondermann, D., & Vansteenkiste, I. (2017). Determinants of FDI Inflows in Advanced Economies: Does the Quality of Economic Structures Matter? ECB Working Paper 2066.
Fedoseeva, S., & Zeidan, R. (2016). A dead-end tunnel or the light at the end of it: The role of BRICs in European exports. Economic Modelling, 59, 237-248.
Felipe, J., & U. Kumar. (2012). The Role of Trade Facilitation in Central Asia: A Gravity Model. Eastern European Economics, 50, 5-20.
Gereffi, G. & Fernandez-Stark, K. (2016). Global value chain analysis: A primer. North Carolina: Center on Globalization, Governance & Competitiveness. Duke University.
Head, K., & Mayer, T. (2014). Gravity Equations: Workhorse,Toolkit, and Cookbook. Handbook of International Economics 4, 131-195.
Hertel, T., & Mirza T. (2009). The Role of Trade Facilitation in Soth Asian Economic Integration. In Australian Government ADB (Ed.). Study on Intraregional Trade and Investment in South Asia (pp. 12-39). Mandaluyong City: Asian Development Bank.
Hopkins, T., & Wallerstein, I. (1977). Patterns of development of the modern world-system, Review, 1(2), 157-170.
IMF. (2016). World Economic Outlook: Subdued Demand: Symptoms and Remedies. Washington, D.C.: International Monetary Fund.
Jednak, S. (2017). Emerging economies development: BRICS vs East European Countries. European Project Management Journal, 7(1), 36-47
Kallioras, D., & Pinna AM. (2017). Trade activity between the EU and its neighbouring countries: trends and potential. Tijdschrift voor economische en sociale geografie, 108(1), 36-51.
Kaplinsky, R., & Farroki, M. (2011). What are the Implications for Global Value Chains When the Market Shifts from the North to the South? International Journal of Technological Learning, Innovation and Development, 4(1-3), 13-38.
Katz, C. (2012). El ajedrez global de la crisis, Revista Batalla de Ideas, 3, 17-37.
Kohl, T., Kaplan, L. & Martinez-Zarzoso, I. (2016). The effects of the CEECS´s accession on sectoral trade: A value added perspective. Goettingen: Center for European Governance and Economic Development.
Koopman, R., Wang, Z., & Wei, S.J. (2014). Tracing value-added and double counting in gross export. American Economic Review, 104(2), 459-494
29

Koopman, R., Powers, W., Wang, Z., & Wei, S.J. (2010). Given credit where credit is due: Tracing value added in global production chains. NBER Working Paper 16426.
Kowalski, P., Lopez, J., Ragoussis, A., & Ugarte C. (2015). Participation of Developing Countries in Global Value Chains: Implications for Trade and Trade-Related Policies. Paris: OECD Publishing.
Lopez, J. (2012). Vertical Specialisation and New Regionalism. University: Tesis Doctoral
McGowan, D., & Milner, C. (2011). Trade Costs and Trade Composition. Research Paper 2011/11. Series Globalisation, Productivity and Technology
Marti, L., & Puertas, R. (2017). The importance of export logistics and trade costs of emerging countries. Maritime Economics & Logistics, 19(2), 315-333.
Noguera, G. (2012). Trade Costs and Gravity for Gross and Value Added Trade. New York: Columbia University
O’Neill, J. (2001). Building better global economic BRIC. New York: Goldman Sachs, Global Economic Paper 66.
Orgaz, L., Molina, L., & Camasco, C. (2011). El creciente peso de las economías emergentes en la economía y gobernanza mundial. Los países BRIC. Documentos ocasionales nº 1101. Banco de España, Eurosistema.
Pöyhönen, P. (1963). A tentative model for the volume of trade between countries. WeltwirschaftlichesArchiv, 16, 93-99.
Roberts, C. (2010). Challengers or Stakeholders? Brics and the Liberal World Order. Policy, 42(1), 1-13.
Sayari, N., Sari, R., & Hammoudeh, R. (2018). The impact of value added components of GDP and FDI on economic freedom in Europe. Economic Systems. Available at doi.org/10.1016/j.ecosys.2017.03.003
Srinavasan, T.N. (2014). BRICS and the EU: An Oxymoron? CESifo Forum 15 (4), 31-36.
Sun, S.L., Chen, H., & Pleggenkuhle-Miles, E.G. (2010). Moving upward in global value chains: the innovations of mobile phone developers in China. Chinese Management Studies, 4(4), 305-321.
Timmer, M.P., Dietzenbancher, E., Los, B., Stehrer, R., & Vries, G.J. (2015). An illustrated User Guide to the World Input-Ouput Database: The case of Global Automotive Production. Review of International Economics, 23(3), 575:605.
Tinbergen, J. (1962). Shaping the world economy: Suggestions for international economic policy. New York: The Twentieth Century Inc.
UNIDO. (2002). Industrial development report 2002/2003: Competing through innovation and learning. Viena: United Nations Industrial Development Organization.
30