· web viewcommittee on commodity problems. joint meeting of the thirty-eighth session of the...
TRANSCRIPT

November 2015 CCP:HF/JU 15/CRS 2
COMMITTEE ON COMMODITY PROBLEMS
JOINT MEETING OF THE THIRTY-EIGHTH SESSION OF THE INTERGOVERNMENTAL GROUP ON HARD FIBRES AND
THE FORTIETH SESSION OF THE INTERGOVERNMENTAL GROUP ON JUTE, KENAF AND ALLIED FIBRES
Bogota, 25 – 27 November 2015
CURRENT MARKET SITUATION AND OUTLOOK – ANNEXED TABLES
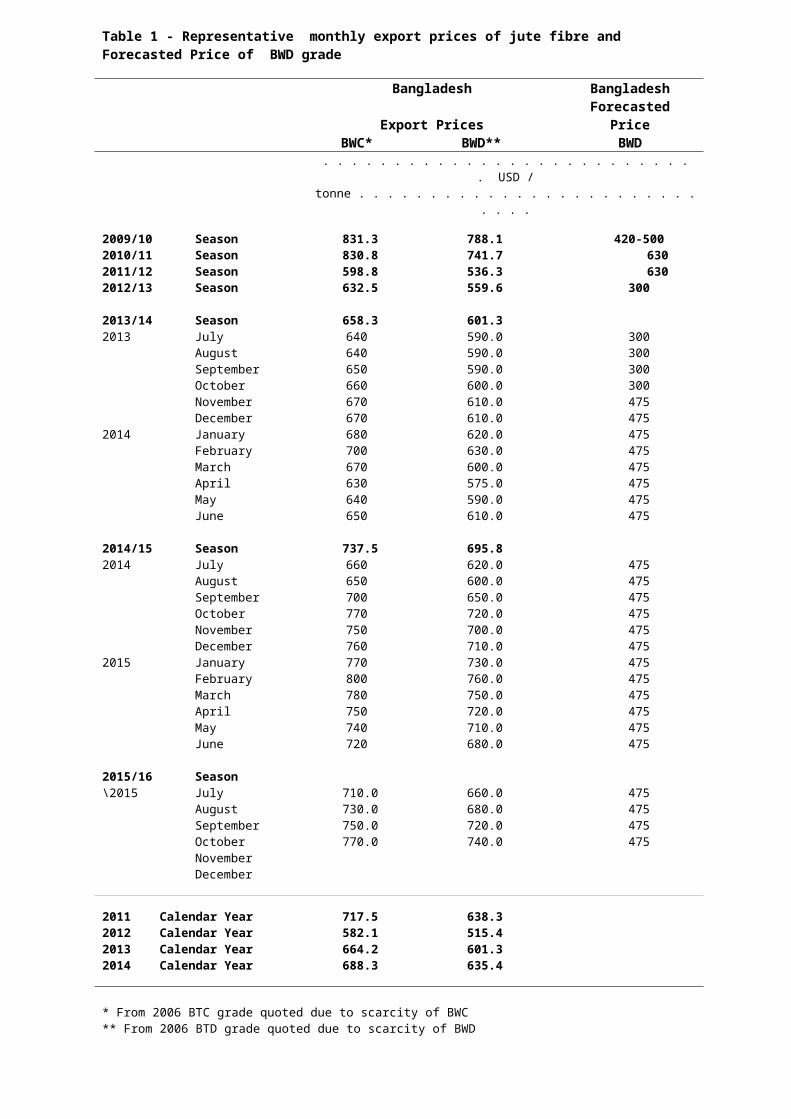
Table 1 - Representative monthly export prices of jute fibre and Forecasted Price of BWD grade
Bangladesh BangladeshExport Prices Forecasted Price
BWC* BWD** BWD . . . . . . . . . . . . . . . . . . . . . . . . . . . USD / tonne . . . . . . . . . . . . . . . . . . . . . . . . . . . .
2009/10 Season 831.3 788.1 420-5002010/11 Season 830.8 741.7 6302011/12 Season 598.8 536.3 6302012/13 Season 632.5 559.6 300
2013/14 Season 658.3 601.32013 July 640 590.0 300
August 640 590.0 300September 650 590.0 300October 660 600.0 300November 670 610.0 475December 670 610.0 475
2014 January 680 620.0 475February 700 630.0 475March 670 600.0 475April 630 575.0 475May 640 590.0 475June 650 610.0 475
2014/15 Season 737.5 695.82014 July 660 620.0 475
August 650 600.0 475September 700 650.0 475October 770 720.0 475November 750 700.0 475December 760 710.0 475
2015 January 770 730.0 475February 800 760.0 475March 780 750.0 475April 750 720.0 475May 740 710.0 475June 720 680.0 475
2015/16 Season\2015 July 710.0 660.0 475
August 730.0 680.0 475September 750.0 720.0 475October 770.0 740.0 475NovemberDecember
2011 Calendar Year 717.5 638.32012 Calendar Year 582.1 515.42013 Calendar Year 664.2 601.32014 Calendar Year 688.3 635.4
* From 2006 BTC grade quoted due to scarcity of BWC** From 2006 BTD grade quoted due to scarcity of BWD

Table 2 - World production of jute, kenaf and allied fibres (crop year, July-June)
2009/10 2010/11 2011/122012/1
3 2013/14 2014/15 (prelimina
ry)
(.........................................thousand tonnes...........................................)
Jute fibre:
World 2 580.8 3 088.4 3 132.6 2 932.9 2 860.3 2 821.0
Developing countries 2 580.8 3 088.4 3 132.6 2 932.9 2 860.3 2 821.0
Far East 2 580.8 3 088.4 3 132.6 2 932.9 2 860.3 2 821.0 Bangladesh 1 070.1 1 404.4 1 404.9 1 363.0 1 354.0 1366.0 India 1 488.8 1 660.0 1 705.0 1 554.0 1 490.0 1 438.0 Myanmar 4.3 9.6 8.2 1.0 0.6 1.0 Nepal 17.7 14.4 14.4 15.0 15.7 16.0
Kenaf and Allied fibres:
World 282.6 280.7 277.8 248.7 251.5 232.8
Developing countries 275.8 273.9 271.0 241.9 244.7 226.0
Far East 226.3 227.6 218.6 196.3 198.5 179.8 China 75.2 75.2 68.5 68.5 61.2 63.0 India 131.2 140.0 140.0 120.0 130.0 110.0 Indonesia 3.8 4.0 4.0 4.0 4.0 4.0 Thailand 2.0 1.7 1.7 1.3 1.0 0.7 VietNam 12.1 5.0 3.2 1.2 1.0 0.7 Cambodia 0.5 0.3 0.3 0.3 0.3 0.3 Pakistan 1.5 1.5 1.0 1.0 1.0 1.0
Latin America and Caribbean 35.6 30.8 35.2 28.2 28.9 28.9 Brazil 14.9 14.2 16.7 9.8 10.0 10.0 Cuba 10.0 6.6 6.6 6.6 7.0 7.0 Other 10.7 10.1 11.9 11.9 11.9 11.9 Africa 10.3 12.1 13.8 13.9 13.9 13.9 Near East 3.6 3.4 3.5 3.5 3.4 3.4 Developed countries 6.7 6.7 6.9 6.9 6.9 6.9
Total Jute, Kenaf and Allied Fibres:
World 2 863.4 3 369.1 3 410.4 3 181.7 3 111.9 3 053.8
Developing countries 2 856.6 3 362.3 3 403.6 3 174.8 3 105.0 3 047.0
Far East 2 807.1 3 316.0 3 351.2 3 129.3 3 058.8 3 000.8 Bangladesh 1 070.1 1 404.4 1 404.9 1 363.0 1 354.0 1 366.0 China 75.2 75.2 68.5 68.5 61.2 63.0
India 1 620.0 1 800.0 1 845.0 1 674.0 1 620.0 1 548.0 Indonesia 3.8 4.0 4.0 4.0 4.0 4.0 Myanmar 4.3 9.6 8.2 1.0 0.6 1.0 Nepal 17.7 14.4 14.4 15.0 15.7 16.0 Thailand 2.0 1.7 1.7 1.3 1.0 0.7 VietNam 12.1 5.0 3.2 1.2 1.0 0.7 Other 2.0 1.8 1.3 1.3 1.3 1.3
Latin America and Caribbean 35.6 30.8 35.2 28.2 28.9 28.9 Africa 10.3 12.1 13.8 13.9 13.9 13.9
Near East 3.6 3.4 3.5 3.5 3.4 3.4
Developed countries 6.7 6.7 6.9 6.9 6.9 6.9

Table 3 - Area, production and yield of jute, kenaf and allied fibres in major producing countries
BANGLADESH CHINA INDI
AMYANMA
R NEPAL THAILAND
AREA(thousand ha)2010/11 587.0 18.8 900.0 12.6 13.1 1.42011/12 620.0 19.3 905.0 11.1 10.6 1.42012/13 657.5 19.3 911.0 2.0 10.6 1.32013/14 666.0 20.0 950.0 1.0 11.0 1.02014/15 (estimated) 665.0 20.0 920.0 1.6 11.0 0.7
(thousand acres)2010/11 1 450.6 46.5 2 224.0 31.1 32.4 3.52011/12 1 532.1 47.7 2 236.3 27.5 26.1 3.52012/13 1 624.7 47.7 2 251.2 4.9 26.1 3.22013/14 1 645.7 49.4 2 347.5 2.5 27.2 2.52014/15 1 643.3 49.4 2 273.4 3.9 27.2 1.8
Y I E L D(tonne / ha)2010/11 2.39 4.00 2.00 0.77 1.10 1.182011/12 2.27 3.55 2.04 0.74 1.37 1.182012/13 2.07 3.55 1.84 0.49 1.42 1.002013/14 2.03 3.06 1.71 0.63 1.43 1.012014/15 2.05 3.15 1.68 0.63 1.45 0.95
(bales / acre)2010/11 5.38 8.99 4.50 1.72 2.47 2.652011/12 5.09 7.98 4.58 1.67 3.07 2.652012/13 4.66 7.98 4.13 1.11 3.19 2.252013/14 4.57 6.88 3.83 1.41 3.21 2.272014/15 4.62 7.08 3.78 1.42 3.27 2.13
PRODUCTION(thousand tonnes)2010/11 1 404.4 75.2 1 800.0 9.6 14.4 1.72011/12 1 404.9 68.5 1 845.0 8.2 14.4 1.72012/13 1 363.0 68.5 1 674.0 1.0 15.0 1.32013/14 1 354.0 61.2 1 620.0 0.6 15.7 1.02014/15 1 366.0 63.0 1 548.0 1.0 16.0 0.7
(lakh bales)2010/11 78.02 4.18 100.00 0.54 0.80 0.092011/12 78.05 3.80 102.50 0.46 0.80 0.092012/13 75.72 3.81 93.00 0.05 0.83 0.072013/14 75.22 3.40 90.00 0.03 0.87 0.062014/15 75.89 3.50 86.00 0.06 0.89 0.04
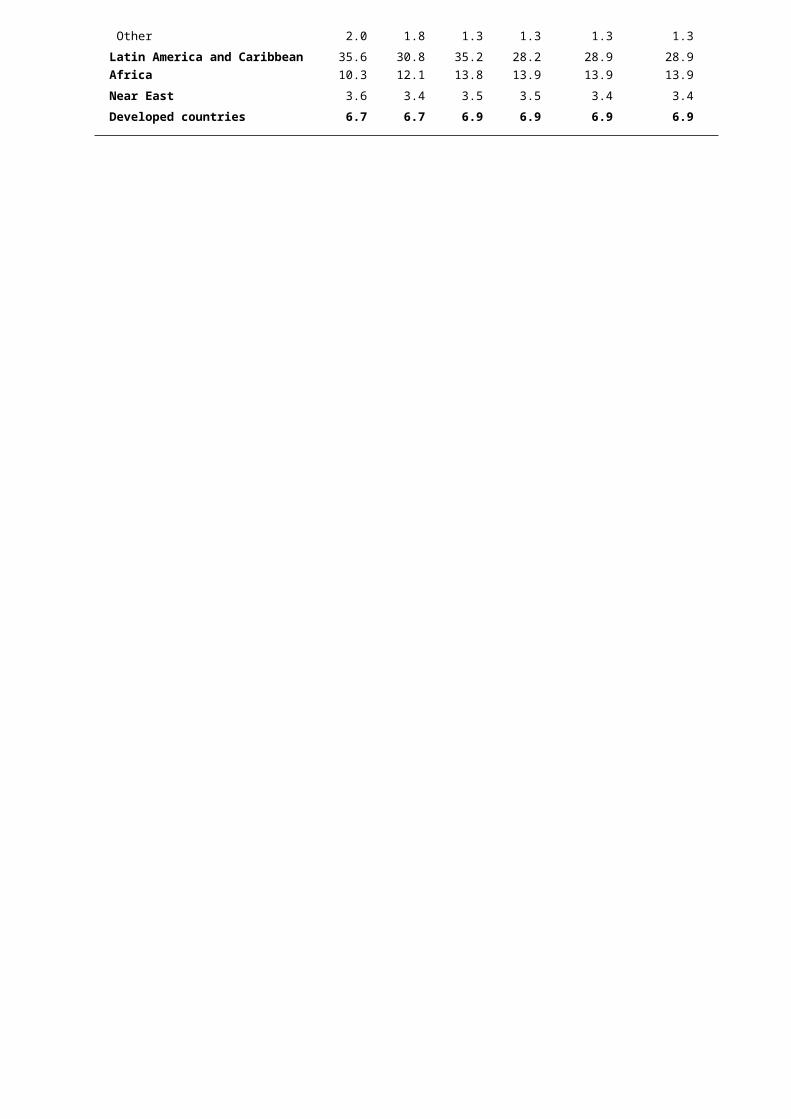
Table 4 - World exports of raw jute, kenaf and allied fibres (crop year, July-June)
2009/10 2010/11 2011/12 2012/13 2013/14 2014/15
(preliminary)
(.........................................thousand tonnes...........................................)
Jute fibre:
World 331.6 450.1 468.7 420.8 237.0 235.6
Developing countries 325.8 443.5 460.1 409.0 226.1 223.0
Far East 324.8 442.8 457.6 407.5 224.3 220.1
Bangladesh 287.8 380.3 411.1 370.1 177.1 180.1
Other 37.0 62.5 46.4 37.4 47.2 39.9
Developed countries 5.8 6.6 8.6 11.9 10.9 12.7
Kenaf and Allied fibres:
World 1.5 1.5 1.5 1.6 1.4 2.8
Developing countries 1.5 1.5 1.5 1.6 1.4 2.8
Far East 1.5 1.5 1.5 1.6 1.4 2.8
China 0.1 0.7 0.1 0.0 0.0 0.0
Thailand 0.0 0.2 0.1 0.3 0.1 1.6
Other 1.4 0.6 1.3 1.3 1.3 1.2
Other developing 0.0 0.0 0.0 0.0 0.0 0.0
Developed countries 0.0 0.0 0.0 0.0 0.0 0.0
Total Jute, Kenaf and Allied Fibres:
World 333.1 451.6 470.2 422.4 238.4 238.4
Developing countries 327.3 445.0 461.6 410.6 227.5 225.7
Far East 326.3 444.3 459.1 409.1 225.7 222.8
Bangladesh 287.8 380.3 411.1 370.1 177.1 180.1
China 0.1 0.7 0.1 0.0 0.0 0.0

Thailand 0.0 0.2 0.1 0.3 0.1 1.6
Other 38.4 63.1 47.8 38.6 48.5 41.1
Other Developing 1.0 0.7 2.5 1.5 1.8 2.9
Developed countries 5.8 6.6 8.6 11.9 10.9 12.7

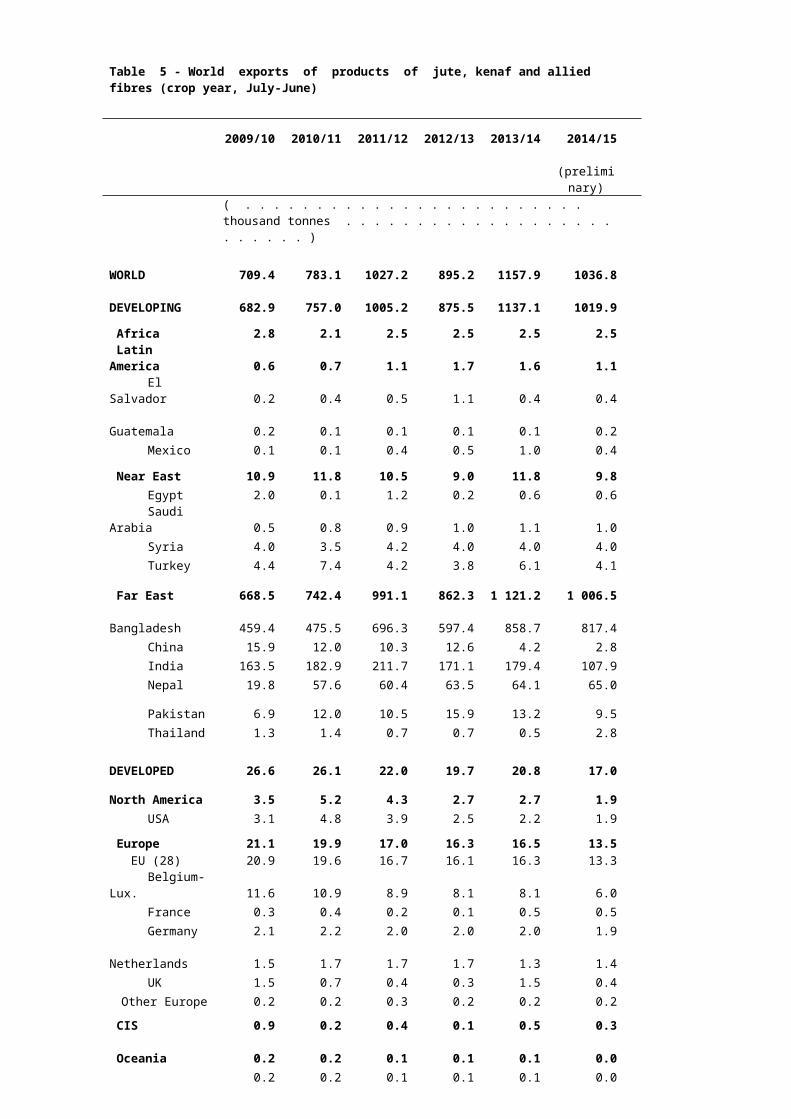
Table 5 - World exports of products of jute, kenaf and allied fibres (crop year, July-June)
2009/10 2010/11 2011/12 2012/13 2013/14 2014/15 (prelim
inary)
( . . . . . . . . . . . . . . . . . . . . . . . . thousand tonnes . . . . . . . . . . . . . . . . . . . . . . . . . )
WORLD 709.4 783.1 1027.2 895.2 1157.9 1036.8
DEVELOPING 682.9 757.0 1005.2 875.5 1137.1 1019.9
Africa 2.8 2.1 2.5 2.5 2.5 2.5
Latin America 0.6 0.7 1.1 1.7 1.6 1.1
El Salvador 0.2 0.4 0.5 1.1 0.4 0.4 Guatemala 0.2 0.1 0.1 0.1 0.1 0.2 Mexico 0.1 0.1 0.4 0.5 1.0 0.4
Near East 10.9 11.8 10.5 9.0 11.8 9.8 Egypt 2.0 0.1 1.2 0.2 0.6 0.6 Saudi Arabia 0.5 0.8 0.9 1.0 1.1 1.0 Syria 4.0 3.5 4.2 4.0 4.0 4.0 Turkey 4.4 7.4 4.2 3.8 6.1 4.1
Far East 668.5 742.4 991.1 862.3 1 121.2 1 006.5 Bangladesh 459.4 475.5 696.3 597.4 858.7 817.4 China 15.9 12.0 10.3 12.6 4.2 2.8 India 163.5 182.9 211.7 171.1 179.4 107.9 Nepal 19.8 57.6 60.4 63.5 64.1 65.0
Pakistan 6.9 12.0 10.5 15.9 13.2 9.5 Thailand 1.3 1.4 0.7 0.7 0.5 2.8
DEVELOPED 26.6 26.1 22.0 19.7 20.8 17.0
North America 3.5 5.2 4.3 2.7 2.7 1.9 USA 3.1 4.8 3.9 2.5 2.2 1.9
Europe 21.1 19.9 17.0 16.3 16.5 13.5 EU (28) 20.9 19.6 16.7 16.1 16.3 13.3
Belgium-Lux. 11.6 10.9 8.9 8.1 8.1 6.0 France 0.3 0.4 0.2 0.1 0.5 0.5 Germany 2.1 2.2 2.0 2.0 2.0 1.9 Netherlands 1.5 1.7 1.7 1.7 1.3 1.4 UK 1.5 0.7 0.4 0.3 1.5 0.4
Other Europe 0.2 0.2 0.3 0.2 0.2 0.2
CIS 0.9 0.2 0.4 0.1 0.5 0.3
Oceania 0.2 0.2 0.1 0.1 0.1 0.0 Australia 0.2 0.2 0.1 0.1 0.1 0.0
Other Developed 0.9 0.7 0.2 0.5 1.1 1.3 Japan 0.1 0.3 0.0 0.1 0.1 0.0 South Africa 0.8 0.4 0.2 0.4 1.0 1.2

Table 6 - World imports of raw jute, kenaf and allied fibres
2009 2010 2011 2012 2013 2014
(preliminary)
( . . . . . . . . . . . . . . . . . . . . . . . thousand tonnes . . . . . . . . . . . . . . . . . . . . . . . . . )
WORLD 421.8 385.1 482.4 475.2 314.6 265.7
DEVELOPING 399.7 364.4 458.0 445.9 288.2 235.3
Africa 14.6 22.3 14.5 22.2 18.3 16.2
Côte d’Ivoire 6.7 17.6 2.3 16.6 12.1 10.7
Ethiopia 3.7 3.5 4.6 3.0 4.7 3.8
Ghana 0.1 0.1 4.9 0.0 0.0 0.0
Mozambique 0.1 0.0 0.0 0.0 0.0 0.0
Nigeria 0.1 0.1 0.1 0.2 0.0 0.2
Tanzania 0.3 0.1 0.0 0.1 0.0 0.0
Tunisia 3.6 0.9 2.6 2.4 1.5 1.5
Latin America 5.3 14.6 11.8 7.5 4.6 7.6
El Salvador 0.4 0.6 1.3 2.0 1.0 0.5
Nicaragua 0.2 0.2 0.2 0.0 0.0 0.0
Cuba 2.9 3.0 2.0 2.0 2.0 1.2
Brazil 1.8 10.9 8.3 3.5 1.6 6.0
Near East 2.1 1.8 1.7 1.6 1.3 1.1
Egypt 0.4 0.3 0.2 0.2 0.0 0.1
Iran 0.4 0.3 0.1 0.1 0.1 0.1
Jordan 0.2 0.2 0.3 0.3 0.2 0.3
Saudi Arabia 1.1 1.0 1.0 1.0 1.0 0.5
Turkey 0.0 0.0 0.0 0.0 0.0 0.1
Far East 377.8 325.6 430.0 414.6 264.0 210.4
China 95.7 104.1 109.6 100.6 60.5 33.7
India 102.9 59.7 157.1 148.8 53.0 44.1
Indonesia 2.2 0.5 2.1 2.8 2.8 1.1
Nepal 23.3 46.2 45.0 50.0 50.5 50.5

Pakistan 128.6 98.5 96.6 93.9 84.9 73.6
Thailand 15.8 0.9 3.9 9.7 4.1 0.6
DEVELOPED 22.1 20.7 24.4 29.3 26.4 30.4
North America 1.8 2.7 2.2 2.9 2.5 2.6
United States 1.7 2.4 2.2 2.8 2.4 2.4
Europe 15.3 13.9 15.2 16.1 15.1 17.7
EU (28) 14.0 12.6 13.8 14.8 13.9 16.0
Belgium-Lux. 1.0 1.5 0.5 0.9 1.4 1.8
Germany 2.0 2.5 3.2 6.0 5.1 5.5
Netherlands 0.1 0.0 0.1 0.1 0.1 0.2
Spain 0.8 1.3 2.0 1.3 1.4 1.8
United Kingdom 4.5 1.9 2.6 1.8 1.7 2.1
Other EU 5.7 5.4 5.3 4.7 4.3 4.8
Other Europe 1.3 1.3 1.4 1.3 1.2 1.7
CIS 2.6 2.8 5.4 8.7 8.2 8.8
Oceania 1.5 0.8 0.8 1.0 0.5 0.6
Australia 1.5 0.8 0.8 1.0 0.5 0.6
Other Developed 0.9 0.5 0.8 0.5 0.2 0.6
Japan 0.6 0.4 0.8 0.4 0.1 0.3
Table 7 - World imports of products of jute, kenaf and allied fibres
2009 2010 2011 2012 2013 2014 (preliminary)
( . . . . . . . . . . . . . . . . . . . . . . . thousand tonnes . . . . . . . . . . . . . . . . . . . . . . . . )WORLD 699.7 738.7 814.3 973.0 954.1 967.8DEVELOPING 533.3 552.0 634.8 810.6 792.0 809.1 Africa 44.9 45.0 68.5 59.9 62.1 61.8
Algeria 5.8 7.7 8.6 10.0 8.4 8.4 Cameroon 1.9 2.0 2.0 2.0 2.0 2.0 Ghana 12.8 6.9 24.3 14.0 25.5 27.0 Kenya 5.1 3.0 3.5 3.5 3.0 4.0 Morocco 3.8 4.0 4.1 4.5 4.1 4.2 Tanzania 2.3 5.3 5.6 8.1 2.1 1.6 Zimbabwe 2.2 3.0 7.7 4.8 4.8 2.6
Latin America 12.8 13.5 20.0 15.3 13.5 15.7 Argentina 1.2 1.2 1.2 0.8 0.6 0.5 Brazil 3.1 4.1 9.9 5.3 2.6 7.9 Costa Rica 0.6 0.8 0.9 0.9 0.8 0.9 Mexico 0.5 0.7 1.7 2.5 4.7 1.8 Uruguay 1.0 1.0 0.3 0.2 0.2 0.2
Near East 290.9 347.0 330.9 372.6 372.1 427.2
Egypt 8.8 21.8 15.8 17.4 20.0 15.0 Iran 56.4 66.1 60.9 50.0 50.0 60.0 Saudi Arabia 4.8 16.4 17.8 18.6 17.4 22.0 Sudan 43.0 38.5 30.4 40.4 30.0 35.0 Syria 32.0 32.3 30.0 30.0 30.0 40.0 Turkey 136.9 160.0 165.0 206.1 213.7 240.3 Other 9.0 12.0 11.0 10.0 11.0 15.0
Far East 184.7 146.5 215.4 362.8 344.3 304.4 China 7.9 14.3 54.3 66.3 97.8 119.5 India 112.8 87.1 117.9 141.9 99.6 130.7 Indonesia 22.5 26.6 23.0 35.5 32.8 31.8 Korea Rep. 4.3 4.0 4.1 3.5 3.7 3.3 Malaysia 3.7 1.6 1.6 1.4 2.1 1.6 Pakistan 4.2 9.4 1.3 2.8 3.7 3.0 Sri Lanka 2.5 3.0 2.4 2.9 2.8 2.7
DEVELOPED 166.4 186.7 179.5 162.4 162.1 158.6 North America 28.4 33.8 35.2 34.8 35.9 41.5
United States 25.1 30.9 31.7 32.0 33.1 39.0 Europe 86.2 99.9 89.6 74.5 74.9 73.0
EU (28) 84.7 98.2 88.0 73.8 74.4 72.1 Belgium-Lux. 38.6 46.3 33.5 26.0 25.8 22.3 Germany 9.7 10.6 11.9 10.0 9.5 10.7 Netherlands 9.9 12.2 14.0 11.0 10.8 10.3 Spain 3.7 3.9 4.7 4.3 5.1 5.7 United Kingdom 7.4 8.4 7.4 7.2 7.3 7.3
Other Europe 1.5 1.7 1.6 0.7 0.5 0.9CIS 13.5 16.8 20.4 25.4 22.3 19.5
Russian Federation 10.5 12.7 15.0 15.4 13.9 11.1 Oceania 21.8 20.6 23.9 17.1 19.4 14.9
Australia 18.6 17.4 20.3 14.0 16.1 12.0 Other Developed 16.5 15.6 10.4 10.6 9.6 9.7
Israel 0.6 0.7 0.5 1.0 1.2 1.0 Japan 14.2 13.0 8.0 7.7 6.5 6.7 South Africa 1.7 1.9 1.9 1.9 1.9 2.0
Table 8 - Production of sisal, henequen and other similar hard fibres
2009 2010 2011 2012 2013 2014
( . . . . . . . . . . . . . . . . . . . . . . thousand tonnes . . . . . . . . . . . . . . . . . .)
SISAL:
Africa total (Continent) 52.9 71.9 75.0 76.1 76.7 77.8 Angola 0.3 0.5 0.6 0.6 0.7 0.7 Ethiopia 0.5 0.5 0.6 0.7 0.7 0.7 Kenya 21.5 24.1 28.1 27.9 26.0 26.0 Madagascar 6.9 9.1 8.0 8.2 8.8 8.9 Mozambique 0.7 0.7 0.7 0.7 0.7 0.7 South Africa 1.0 1.2 1.3 1.4 1.4 1.4 Tanzania 21.1 34.8 34.5 35.6 37.5 38.5 Others 1.0 1.0 1.1 1.1 1.1 1.1
Latin America 111.7 114.0 127.1 83.2 89.9 110.7 Brazil 94.9 97.9 111.2 69.9 74.6 95.4 Others 16.8 16.0 15.9 13.3 15.3 15.3
Other countries 46.9 47.3 49.9 63.7 60.0 64.0 China 45.9 46.3 48.9 62.7 59.0 63.0

TOTAL SISAL 211.4 233.2 252.0 222.9 226.6 252.5
Henequen :
Cuba 1.4 1.4 1.4 1.4 1.4 1.4 Mexico 19.8 17.5 20.1 20.1 20.1 22.0 Other countries 3.5 3.5 3.5 3.5 3.5 3.5
Total Henequen 24.7 22.4 25.0 25.0 25.0 26.9
Total Sisal & Henequen 236.2 255.5 277.1 248.0 251.6 279.4
Other Hard Fibres: Fique (Colombia) 21.6 24.0 22.0 19.7 18.3 20.5 Phormium tenax 2.3 2.3 2.3 2.3 3.3 3.3 Other hard fibres 12.0 12.0 12.0 12.0 12.0 12.0
Total Above Fibres 272.1 293.8 313.4 282.0 285.3 315.2

Table 9 - Sisal and henequen fibres and manufactures: Exports from producing countries
2009 2010 2011 2012 2013 2014
( . . . . . . . . . . . . . . . . . . . . . thousand tonnes . . . . . . . . . . . . . . . . . . . )
Brazilfibre 27.4 30.5 39.1 36.1 30.9 40.6cordage 31.1 24.6 31.1 29.9 23.0 22.3oth. manuf.(Yarn-Carpets) 9.1 11.2 9.9 7.0 6.2 6.7Total 67.5 66.3 80.2 73.1 60.1 69.6
Haitifibre 0.0 0.0 0.0 0.0 0.0 0.0cordage 3.5 3.5 3.5 3.5 3.5 3.5Total 3.5 3.5 3.5 3.5 3.5 3.5
Kenyafibre 18.7 20.0 23.9 24.1 24.0 23.0cordage 0.3 0.7 1.0 0.6 0.6 0.3Total 19.0 20.6 24.9 24.6 24.5 23.3
Madagascarfibre 5.9 7.8 6.5 7.1 7.2 6.4cordage 0.7 0.7 0.8 1.0 1.0 0.6Total 6.6 8.5 7.2 8.1 8.2 6.9
Mexico
fibre 0.0 0.0 0.0 0.0 0.0 0.0cordage 1.2 1.5 1.7 1.9 1.9 1.9Total 1.2 1.5 1.7 1.9 1.9 1.9
Mozambiquefibre 0.1 0.1 0.1 0.1 0.1 0.1cordage 0.5 0.5 0.5 0.0 1.1 1.2Total 0.6 0.6 0.6 0.1 1.2 1.3
Tanzaniafibre 8.3 11.6 13.8 15.5 16.9 18.2cordage 5.3 3.3 6.0 5.3 5.5 5.2Total 13.6 14.9 19.8 20.8 22.4 23.5
Chinafibre 0.0 0.0 0.2 0.2 0.1 0.2cordage 7.7 10.0 7.2 6.8 5.8 4.8
Total 7.7 10.0 7.4 7.0 6.0 4.9
Europefibre n.a. n.a. n.a. n.a. n.a. n.a.manufactures 9.9 11.8 12.8 11.0 12.1 9.0Total
Other countriesfibre n.a. n.a. n.a. n.a. n.a. n.a.cordage 12.1 11.8 13.4 12.2 12.8 10.1Total
WORLD
Fibre (from major exporters) 60.3 69.9 83.6 83.1 79.2 88.6
Manufactures 81.3 79.6 88.0 79.3 73.6 65.5
Total 141.7 149.5 171.6 162.4 152.8 154.1

Table 10 - Sisal: Prices of representative grades, 2009-2015
Brazil
3L UG Forecasted Price UG No.3* Forecasted Price No.3
( . . . . . . . . . . . . . . . . . . . . . . . USD per tonne f.o.b. . . . . . . . . . . . . . . . . . . . . )
2009 830 773 800 - 1000 676 620 - 680
2010 1 111 1 010 800 - 1000 689 700 - 800
2011 1 435 1 327 800 - 1000 791 700 - 800
2012 1 600 1 483 900 - 1200 899 750 - 850
2013 1 502 1 396 900 - 1200 1 059 750 - 850
YEAR 2014 avg. 1 698 1 598 1 394January 1 525 1 425 1500 - 1700 1 290 1250 - 1350February 1 525 1 425 1500 - 1700 1 290 1250 - 1350March 1 550 1 450 1500 - 1700 1 290 1250 - 1350April 1 550 1 450 1500 - 1700 1 290 1250 - 1350May 1 625 1 525 1500 - 1700 1 290 1250 - 1350June 1 650 1 550 1500 - 1700 1 320 1250 - 1350July 1 745 1 645 1500 - 1700 1 390 1250 - 1350August 1 770 1 670 1500 - 1700 1 450 1250 - 1350September 1 800 1 700 1500 - 1700 1 475 1250 - 1350October 1 850 1 750 1500 - 1700 1 530 1250 - 1350November 1 880 1 780 1500 - 1700 1 550 1250 - 1350December 1 905 1 805 1500 - 1700 1 560 1250 - 1350
YEAR 2015 avg. 2 092 1 975 1 592January 1 935 1 835 1500 - 1700 1 580 1250 - 1350February 1 950 1 850 1500 - 1700 1 580 1250 - 1350March 1 975 1 875 1500 - 1700 1 580 1250 - 1350April 2 050 1 925 1500 - 1700 1 600 1250 - 1350May 2 050 1 925 1500 - 1700 1 600 1250 - 1350June 2 090 1 965 1500 - 1700 1 600 1250 - 1350July 2 120 1 995 1500 - 1700 1 610 1250 - 1350August 2 175 2 050 1500 - 1700 1 610 1250 - 1350September 2 275 2 150 1500 - 1700 1 610 1250 - 1350October 2 300 2 175 1500 - 1700 1 550 1250 - 1350NovemberDecember
* From January 2013 Bahia Type 3DB
East African
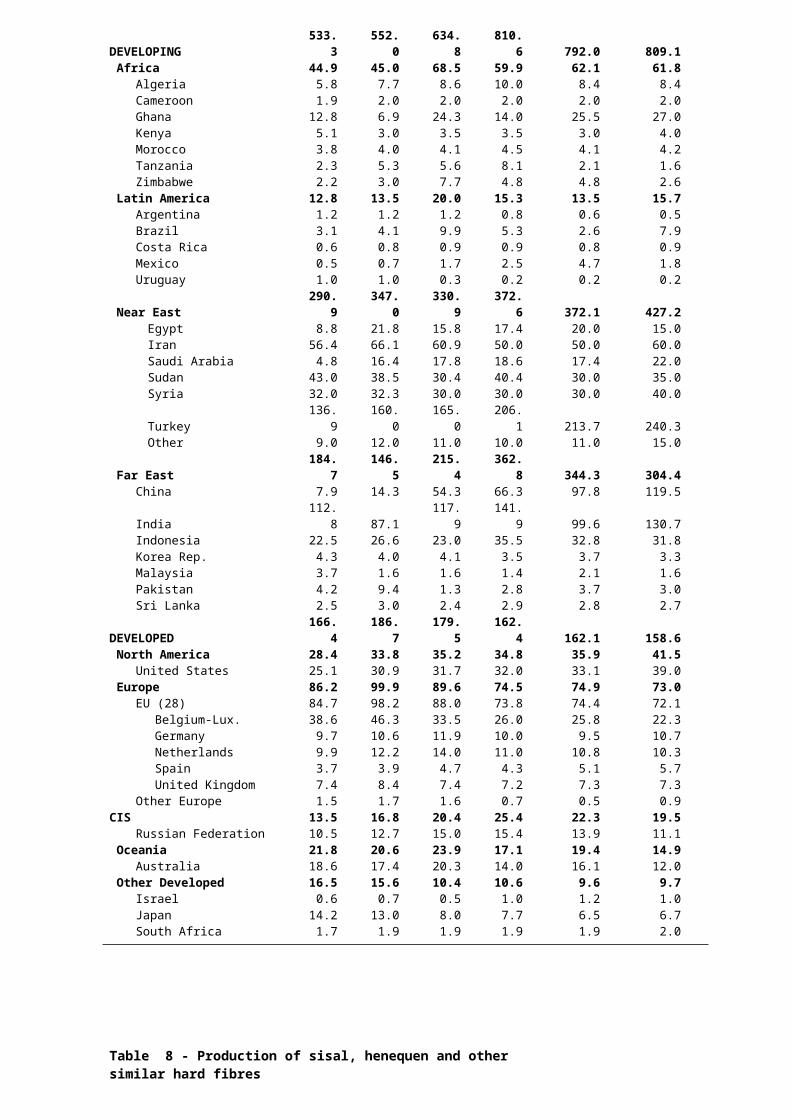
Table 11 - Sisal : Imports of raw fibre
2009 2010 2011 2012 2013 2014
( . . . . . . . . . . . . . . . . . . . . . . . . . thousand tonnes . . . . . . . . . . . . . . . . . . . . . . . . . . . )
WORLD 63.6 64.1 81.2 81.6 76.5 86.7
DEVELOPED 18.9 19.0 23.0 23.1 20.9 23.1
North America 0.2 0.1 0.1 0.2 0.1 0.1
Europe 17.8 17.8 21.5 22.2 19.8 21.9
CIS 0.1 0.1 0.3 0.0 0.2 0.2
Oceania 0.0 0.0 0.0 0.0 0.1 0.1
Other Developed 0.8 1.0 1.1 0.7 0.8 0.8
DEVELOPING 44.7 45.1 58.2 58.6 55.6 63.6
Africa 7.0 6.8 8.5 11.3 8.9 10.5
Latin America 4.2 4.9 3.3 4.1 4.1 2.8
Near East 3.9 3.5 4.6 5.6 4.6 4.4 Far East 29.7 29.9 41.8 37.5 38.0 45.9

Table 12 - Sisal : Imports of manufactures
2009 2010 2011 2012 2013 2014
( . . . . . . . . . . . . . . . . . . . . . . . . . thousand tonnes . . . . . . . . . . . . . . . . . . . . . . . . )
WORLD 79.4 73.7 74.5 71.4 69.1 64.3
DEVELOPED 62.8 53.7 51.8 51.9 49.9 44.7 North America 45.5 35.5 34.0 35.0 29.8 28.4 Canada 3.0 2.6 2.8 2.6 2.6 1.5 U.S.A. 42.5 32.9 31.2 32.3 27.2 26.9 Europe 15.0 16.2 15.2 14.6 18.0 14.2
EU (28) 14.6 15.9 15.0 14.1 17.8 14.0 Austria 0.1 0.2 0.1 0.2 0.1 0.2 Belgium-Lux 2.4 3.0 2.9 2.0 4.0 1.7 Denmark 0.9 0.5 0.6 0.5 0.5 0.3 Finland 0.3 0.3 0.3 0.3 0.1 0.2 France 2.9 3.0 3.1 3.1 4.4 3.6 Germany 2.8 3.0 2.8 3.0 3.0 2.6 Greece 0.2 0.1 0.2 0.2 0.3 0.2 Ireland 0.1 0.1 0.0 0.0 0.1 0.1 Italy 0.9 1.1 1.2 1.1 0.7 0.7 Netherlands 0.8 0.9 0.6 0.9 1.5 1.7 Portugal 0.7 0.9 0.9 0.6 0.4 0.2 Spain 0.3 0.4 0.4 0.5 0.6 0.5 Sweden 0.3 0.4 0.3 0.2 0.2 0.2 U.K. 0.7 1.1 0.7 0.8 0.5 0.6 Other EU 1.3 0.8 1.0 0.8 1.3 1.4 Other Europe 0.3 0.3 0.2 0.4 0.2 0.2
CIS 0.0 0.1 0.1 0.1 0.2 0.1
Oceania 0.5 0.6 0.7 0.6 0.5 0.7 Australia 0.4 0.4 0.5 0.5 0.4 0.6 New Zealand 0.2 0.2 0.2 0.2 0.1 0.1
Other Developed 1.8 1.4 1.8 1.6 1.4 1.3 Japan 1.3 1.0 1.3 1.0 0.9 0.8 South Africa 0.5 0.4 0.4 0.5 0.4 0.3
DEVELOPING 16.6 20.0 22.7 19.5 19.1 19.6
Africa 3.1 4.1 3.4 3.0 2.7 2.5
Latin America and Caribbean 1.7 1.9 4.1 2.0 2.6 3.5 Argentina 0.1 0.2 0.1 0.2 0.1 0.1 Bahamas 1.4 1.5 3.7 1.5 2.3 1.9
El Salvador 0.1 0.1 0.1 0.1 0.1 0.2
Near East 1.2 2.5 3.4 3.6 2.6 3.1 Egypt 0.6 0.3 0.2 0.5 0.1 0.7 Jordan 0.1 0.1 0.1 0.0 0.2 0.1 Saudi Arabia 0.5 2.1 3.1 3.0 2.2 2.2 Far East 6.0 6.5 5.8 6.0 6.2 6.0 China 0.2 0.5 0.3 0.3 0.4 0.2 Indonesia 0.9 0.8 0.9 1.2 1.1 1.0 Thailand 0.9 1.0 0.7 0.9 0.7 0.7 VietNam 1.3 2.0 2.0 1.5 1.4 1.4
Other 4.5 5.0 6.0 5.0 5.0 4.5

Table 13 - Production of abaca
2009 2010 2011 2012 2013 2014
( . . . . . . . . . . . . . . . . . . . . . . . . . thousand tonnes . . . . . . . . . . . . . . . . . . . . . . . )
Ecuador 10.4 10.2 9.6 11.1 9.4 8.4 Philippines 54.6 57.2 73.3 64.8 56.0 66.0 Other countries 2.9 2.8 3.4 3.1 3.2 3.2
Total Above Countries 67.9 70.2 86.2 78.9 68.5 77.5
Table 14 - Abaca: Exports of fibre and manufactures from producing countries
2009 2010 2011 2012 2013 2014
( . . . . . . . . . . . . . . . . . . . . . . . . . thousand tonnes . . . . . . . . . . . . . . . . . . . . . . . )
Ecuador
Fibre 10.4 10.2 9.6 11.1 9.4 8.4Cordage 0.0 0.0 0.0 0.0 0.0 0.0Total 10.4 10.2 9.6 11.1 9.4 8.4
PhilippinesFibre 7.4 11.3 9.8 4.5 3.3 9.8Cordage 5.3 7.0 7.5 5.0 4.2 5.1Pulp 12.0 20.9 29.8 21.5 17.6 20.9Other 1.3 1.6 1.4 2.4 2.0 2.5Total 26.0 40.7 48.5 33.3 27.2 38.3
TOTAL EXPORTS 36.4 50.9 58.1 44.4 36.6 46.7
Total Exports in Fibre equivalentFibre 17.8 21.5 19.4 15.5 12.7 18.1Cordage 5.6 7.3 7.9 5.2 4.5 5.4Pulp 24.1 41.8 59.5 43.0 35.2 41.8Other 1.4 1.8 1.5 2.6 2.2 2.8TOTAL 48.9 72.3 88.4 66.4 54.6 68.1
Of which: Philippines 38.5 62.1 78.8 55.4 45.2 59.8 Ecuador 10.4 10.2 9.6 11.1 9.4 8.4

Table 15 - Abaca: Prices of representative grades, 2009-2015
PHILIPPINES
Hand-cleaned non-Davao
S2 G JK Forecasted Price
f.o.b. Manila port f.o.b. c.i.f. USD per 125 Kg. bale USD / bale USD / tonne
Annual average
2009 201.6 181.3 163.7 182.2 1 657.6
2010 193.7 176.8 154.8 175.1 1 600.7
2011 211.9 192.1 170.2 191.4 1 731.1
2012 220.0 197.0 174.3 197.1 1 776.7
2013 222.7 200.3 177.0 200.0 1 800.0
2014 average 235.8 214.8 190.7 213.8 1 910.0
January 233.0 211.0 192.0 212.0 1 896.0February 229.0 208.0 189.0 208.7 1 869.3March 229.0 208.0 188.0 208.3 1 866.7April 229.0 208.0 188.0 208.3 1 866.7May 229.0 208.0 188.0 208.3 1 866.7June 229.0 208.0 188.0 208.3 1 866.7July 242.0 221.0 192.0 218.3 1 946.7August 242.0 221.0 192.0 218.3 1 946.7September 242.0 221.0 192.0 218.3 1 946.7October 242.0 221.0 192.0 218.3 1 946.7November 242.0 221.0 192.0 218.3 1946.7December 242.0 221.0 195.0 219.3 1954.7
2015 average 254.4 231.3 215.3 233.7 2 069.6
January 247.0 221.0 204.0 224.0 1 992.0February 247.0 221.0 204.0 224.0 1 992.0March 247.0 226.0 204.0 225.7 2 005.3April 252.0 230.0 214.0 232.0 2 056.0May 253.0 231.0 216.0 233.3 2 066.7June 256.0 234.0 220.0 236.7 2 093.3July 260.0 237.0 222.0 239.7 2 117.3September 263.0 240.0 226.0 243.0 2 144.0October 265.0 242.0 228.0 245.0 2 160.0NovemberDecember

Table 16 - Abaca : Imports of fibre and manufactures
2009 2010 2011 2012 2013 2014
( . . . . . . . . . . . . . . . . . . . . thousand tonnes . . . . . . . . . . . . . . . . . . . . . . . . )
FIBRE
WORLD 18.9 25.2 23.8 16.7 15.4 21.0
DEVELOPED 16.6 22.1 21.1 15.7 14.7 19.4
Europe 12.6 14.7 13.6 11.6 9.4 12.7
EU (28) 12.6 14.7 13.6 11.6 9.4 12.7
Other Developed 4.1 7.4 7.5 4.1 5.3 6.7 Japan 3.7 7.3 7.3 4.0 5.0 6.2 Others 0.3 0.1 0.2 0.1 0.3 0.5 DEVELOPING 2.2 3.1 2.7 1.0 0.7 1.5
MANUFACTURES 1/
WORLD 20.9 31.4 41.0 29.8 23.8 27.7
DEVELOPED 15.5 25.9 33.2 22.7 20.0 23.7
North America 3.6 6.3 7.7 4.5 3.5 5.1
Canada 0.1 0.1 0.2 0.2 0.2 0.2 U.S.A. 3.4 6.2 7.5 4.3 3.4 4.9
Europe 8.6 14.8 20.4 13.9 12.6 14.5 EU (28) 8.6 14.8 20.4 13.9 12.6 14.5
Other developed 3.4 4.8 5.1 4.2 3.9 4.1Japan 3.1 4.5 4.5 3.6 3.3 3.5
DEVELOPING 5.4 5.5 7.7 7.1 3.8 4.0
Far East 4.0 4.9 6.4 4.9 3.4 3.8
1/ - Includes Pulp

Table 17 - Production of coir fibre
2009 2010 2011 2012 2013 2014
( . . . . . . . . . . . . . . . . . . . . thousand tonnes . . . . . . . . . . . . . . . . . . . . . . . . )
India (Brown Fibre) * 394.0 415.5 425.0 431.5 455.8 458.8
Sri Lanka * 169.6 149.8 135.0 131.2 123.7 150.4
Thailand 64.6 63.7 49.9 61.7 64.8 68.1
VietNam 91.1 103.0 97.6 115.1 105.9 143.3
Other countries 57.7 66.5 81.9 84.8 79.3 97.6
Total Above Countries 777.1 798.5 789.5 824.3 829.4 918.3
White Fibre - India 97.0 100.0 100.5 100.0 80.4 81.0Curled Fibre - India 49.5 54.2 59.0 63.8 63.8 64.7
TOTAL 923.6 952.7 949.0 988.1 973.6 1 064.0
* India and Sri Lanka production data does not include coir pith
Table 18 - Production of coir yarn
2009 2010 2011 2012 2013 2014
( . . . . . . . . . . . . . . . . . . . . thousand tonnes . . . . . . . . . . . . . . . . . . . . . . . . )
India 292.9 296.5 299.5 318.9 321.7 323.9 Sri Lanka 6.5 7.4 7.3 9.6 9.1 12.3 Thailand 2.0 2.0 2.0 2.0 2.0 2.0
Total Above Countries 301.4 305.9 308.8 330.5 332.8 338.2
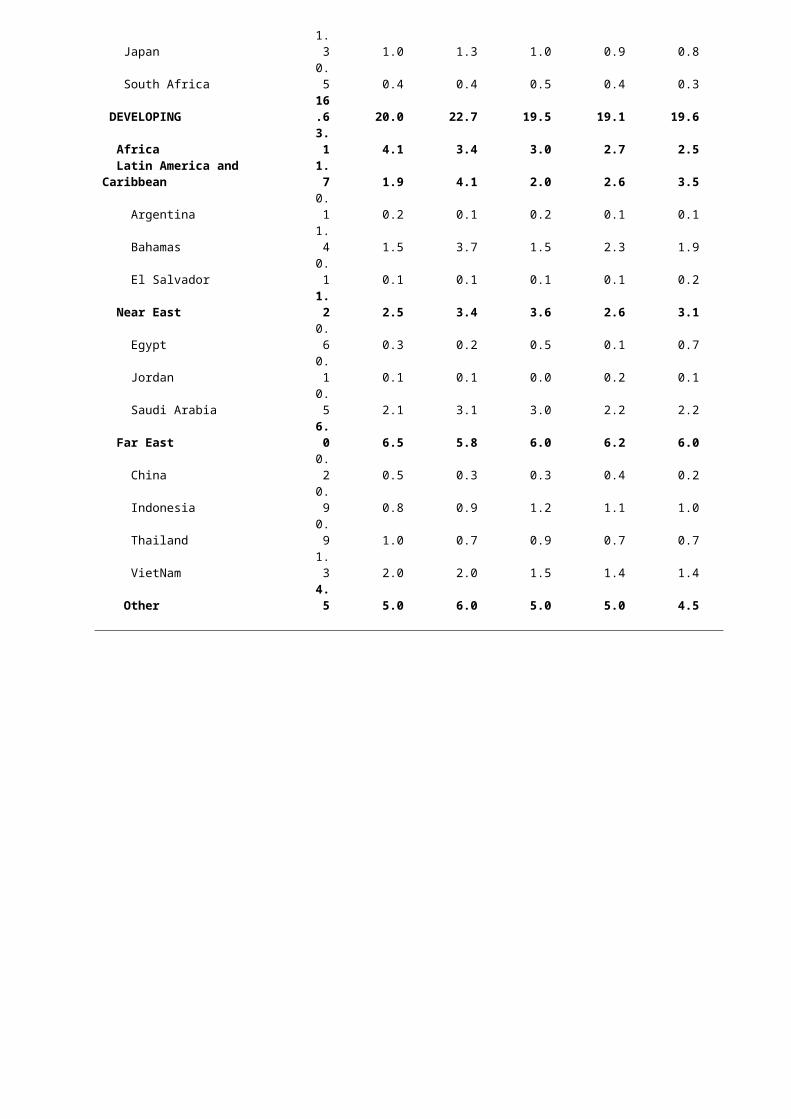
Table 19 - Exports of coir fibre
2009 2010 2011 2012 2013 2014
( . . . . . . . . . . . . . . . . . . . . . . . thousand tonnes . . . . . . . . . . . . . . . . . . . . . . . . . )
DEVELOPED 6.2 6.7 7.1 9.3 10.3 12.0
EU (28) 5.4 6.0 6.3 8.3 9.3 10.7Bel-Lux
DEVELOPING 504.4 595.9 641.5 711.6 740.9 905.3
Far East 502.1 592.6 638.8 708.6 738.1 902.4
Sri Lanka 143.7 126.9 114.4 111.2 104.8 127.5 of which: bristle fibre 8.3 6.3 9.5 8.2 10.3 16.4
twisted fibre 51.5 36.9 26.8 45.1 41.4 74.7mattress fibre 83.9 83.7 78.2 57.9 53.1 36.3
China 1.0 1.1 1.0 0.8 0.7 0.1
India* 158.7 259.5 321.0 366.0 407.5 505.6
Indonesia 27.8 31.8 46.9 46.2 25.8 35.3
Malaysia 22.4 14.2 12.6 14.0 18.6 11.9
Philippines 9.2 10.2 9.2 10.4 26.5 33.3
Thailand 53.8 53.1 41.6 51.4 54.0 56.8
Singapore 0.2 0.3 0.5 0.7 0.8 1.6
VietNam 85.3 95.5 91.7 107.8 99.5 130.3
Africa 0.0 0.0 0.0 0.0 0.0 0.0
Near East 0.1 0.1 0.1 0.1 0.1 0.1
Latin America 2.3 3.2 2.6 2.9 2.7 2.8
Mexico 1.3 3.2 2.6 2.9 2.7 2.8 Venezuela 1.0 0.0 0.0 0.0 0.0 0.0
Total Above Countries 510.6 602.5 648.6 720.9 751.3 917.3
Sri Lanka coir pith 82.8 119.5 131.9 133.5 143.9 157.2
Total Including Coir Pith 593.4 722.1 780.5 854.4 895.2 1074.5
* Includes Coir Pith
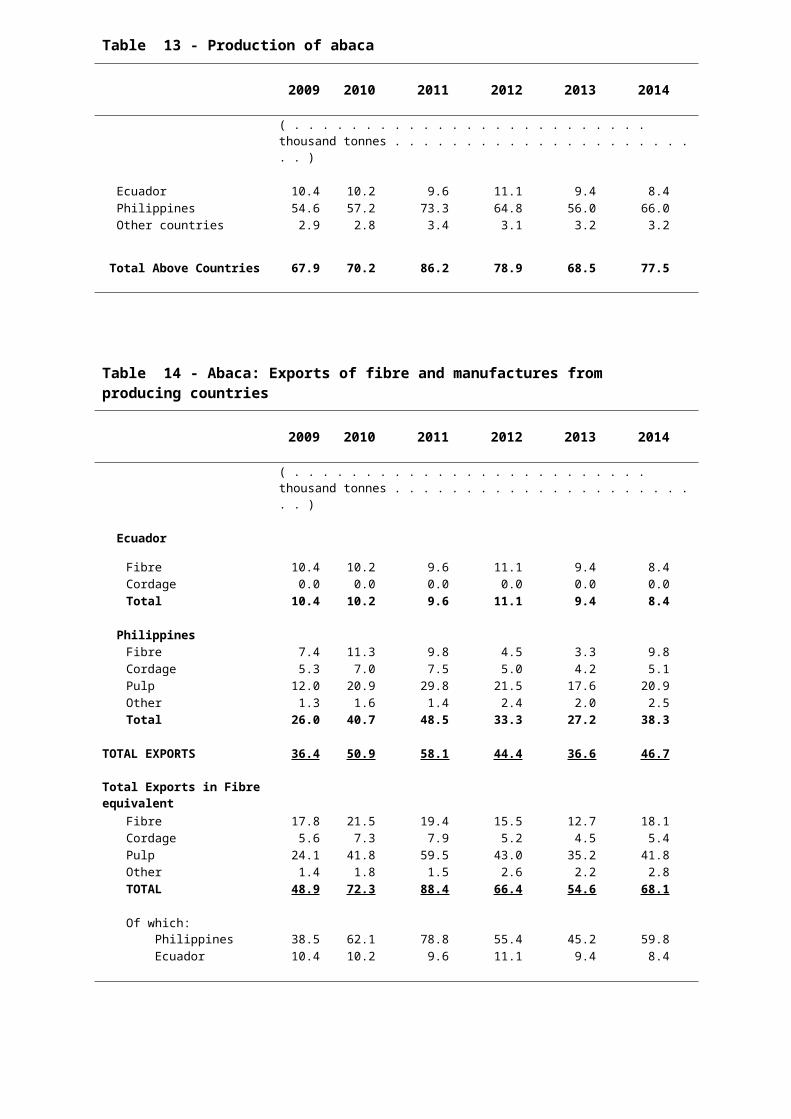
Table 20 - Exports of coir yarn from producing countries
2009 2010 2011 2012 2013 2014
(. . . . . . . . . . . . . . . . . . . . . thousand tonnes . . . . . . . . . . . . . . . . . . . . . )
DEVELOPED 1.0 0.8 0.9 0.5 0.5 0.5EU (28) 1.0 0.8 0.9 0.5 0.5 0.5
DEVELOPING 14.0 12.7 12.9 13.8 13.2 14.7 India 5.6 5.3 5.6 4.5 4.4 4.2 Sri Lanka 7.3 6.2 6.2 8.2 7.7 10.4
Others 1.1 1.1 1.1 1.1 1.1 0.1
Total Above Countries 15.0 13.5 13.7 14.3 13.7 15.2
Table 21 - Exports of coir mats, mattings and rugs from principal exporting countries
2009 2010 2011 2012 2013 2014
(. . . . . . . . . . . . . . . . . . . . thousand tonnes . . . . . . . . . . . . . . . . . . . . . . )
DEVELOPED 5.0 4.7 4.4 3.0 3.1 2.9
EU (28) 5.0 4.7 4.4 3.0 3.1 2.9 Austria 0.1 0.1 0.1 0.0 0.1 0.1
Belgium/Lux 0.0 0.0 0.0 0.0 0.0 0.0 Denmark 0.1 0.1 0.1 0.1 0.0 0.1 France 0.0 0.0 0.0 0.0 0.0 0.1 Germany 1.0 0.5 0.3 0.3 0.4 0.2 Italy 0.0 0.3 0.3 0.3 0.1 0.2 Netherlands 2.8 3.1 2.8 1.6 1.3 1.7 Portugal 0.0 0.1 0.0 0.0 0.0 0.0
Sweden 0.1 0.1 0.1 0.1 0.1 0.1 United Kingdom 0.3 0.3 0.3 0.2 0.2 0.2 Other EU 0.2 0.2 0.1 0.2 0.5 0.1
DEVELOPING 50.9 49.6 49.0 45.6 43.5 51.2India 2/ 41.5 37.7 35.6 31.1 30.3 34.8Sri Lanka 2/ 4.1 6.6 7.4 8.3 7.1 9.8China 0.3 0.3 0.4 0.6 0.5 0.5Other 5.0 5.0 5.6 5.6 5.6 6.0
Total Above Countries 55.9 54.3 53.4 48.6 46.6 54.1
2/ - Includes Coir Geo Fabrics

Table 22 - Sri Lanka: Prices of coir fibres and yarn
SRI LANKAExport Prices FOB Colombo
Mattress Fibre Bristle Fibre Coir Yarn Coir Twine Coir Fibre Pith
Annual average
2009 264 499 731 1 035 253
2010 309 536 716 961 272
2011 392 605 793 1 058 298
2012 360 625 937 1 156 306
2013 311 484 763 958 315
2014 average 383 401 782 707 318
January 319 442 639 985 303
February 278 410 651 512 285
March 316 383 661 545 292
April 329 421 943 533 290
May 395 363 727 624 311
June 412 349 918 727 346
July 428 359 816 790 343
August 470 430 725 755 322
September 405 450 738 610 320
October 393 515 685 798 339
November 422 358 845 839 327
December 431 330 1 034 768 343
2015 average 365 510 715 1 104 284
January 369 489 737 1 188 294
February 336 495 739 1 066 267
March 390 545 669 1 057 291
April
May
June
July
August
September
October
December
( . . . . . . . . . . . . . . . . . . . . . . . . . . . . . . . . . USD / tonne. . . . . . . . . . . . . . . . . . . . . . . . . . . . . . . . . . )

Table 23 - Imports of coir fibre
2009 2010 2011 2012 2013 2014
( . . . . . . . . . . . . . . . . . . . thousand tonnes . . . . . . . . . . . . . . . . . . . . . . . . . )
DEVELOPED 137.6 152.9 190.0 187.1 150.3 181.8
North America 41.0 58.0 85.2 76.7 39.9 55.2
Canada 33.3 52.3 76.6 66.3 29.1 45.2
USA 7.7 5.7 8.6 10.3 10.8 10.1
Europe 88.0 81.6 89.9 93.9 92.2 107.7
EU (28) 86.7 80.3 88.8 92.1 90.4 106.6
Other Europe 1.3 1.3 1.1 1.8 1.8 1.1
Russian Federation 0.5 2.4 3.7 4.2 5.7 5.9
Oceania 3.5 4.1 4.3 5.9 5.7 6.1Australia 2.0 2.4 2.5 4.2 3.8 4.4New Zealand 1.5 1.8 1.8 1.7 1.9 1.7
Other Developed 4.6 6.8 6.8 6.5 6.7 6.8Japan 2.2 3.5 3.3 2.0 2.3 2.9South Africa 2.4 3.3 3.5 4.5 4.4 3.9
DEVELOPING 387.2 427.7 475.5 574.5 624.4 667.1
China 352.9 387.0 412.2 505.2 515.0 572.2Taiwan 5.9 5.8 6.1 4.8 4.9 5.3Korea, Republic of 17.7 23.5 38.9 51.6 90.8 76.5Pakistan 3.6 4.8 11.4 4.1 3.0 1.3Saudi Arabia 4.0 3.1 4.4 5.0 4.1 5.0Malaysia 1.9 2.0 1.2 2.6 1.4 1.5
Others 1.3 1.5 1.3 1.1 5.2 5.3
Total Above Countries 524.8 580.6 665.5 761.6 774.6 848.9

Table 24 - Imports of coir yarn into principal importing countries
2009 2010 2011 2012 2013 2014
( . . . . . . . . . . . . . . . . . . thousand tonnes . . . . . . . . . . . . . . . . .. . . )
DEVELOPED 13.6 11.5 14.0 18.0 15.9 19.1
North America 5.5 3.0 2.6 4.2 3.5 4.2
USA 5.5 3.0 2.6 4.2 3.5 4.2
Europe 5.2 5.6 5.4 4.5 4.2 5.1
EU (28) 5.1 5.5 5.3 4.4 4.1 5.0
Belgium 0.8 0.6 0.7 0.3 0.4 0.3
France 0.7 0.6 0.5 0.4 0.3 0.2Germany 0.3 0.3 0.4 0.4 0.8 1.7
Italy 0.9 1.4 1.0 0.8 0.6 1.1Netherlands 1.4 1.7 1.9 1.4 1.4 1.1
Portugal 0.1 0.1 0.0 0.4 0.0 0.2Spain 0.5 0.5 0.5 0.2 0.2 0.1
United Kingdom 0.2 0.2 0.2 0.3 0.2 0.2
Other EU 0.1 0.0 0.1 0.1 0.0 0.0
Russian Federation 1.6 1.5 4.2 7.2 6.2 7.8
Other Developed 1.4 1.5 1.7 2.2 2.1 2.0Australia 0.2 0.1 0.2 0.2 0.2 0.2Japan 1.2 1.4 1.6 2.0 1.9 1.8
DEVELOPING 1.9 1.6 1.9 1.7 1.7 1.4
Total Above Countries 15.5 13.1 15.9 19.7 17.7 20.5

Table 25 - Imports of coir mats, matting and rugs into principal importing countries
2009 2010
( . . . . . . . . . . . . . . . . . . . thousand tonnes . . . . . . . . . . . . . . . . . . . . . . . )
DEVELOPED 41.8 38.7
Europe 25.6 20.3
EU (28) 25.2 20.0 Austria 0.4 0.4 Belgium/Lux 1.2 0.7 Denmark 0.5 0.4 Finland 0.0 0.1 France 3.2 2.6 Germany 4.2 1.8 Greece 0.3 0.3 Ireland 0.0 0.0 Italy 3.7 3.6 Netherlands 1.3 1.6 Portugal 0.2 0.3 Spain 1.8 1.9 Sweden 0.4 0.2 United Kingdom 5.3 4.6 Other EU 2.9 1.5
Other Europe 0.4 0.3
Russian Federation 0.2 0.3
North America 13.6 15.6 United States 11.9 13.6 Canada 1.7 2.0
Other Developed 2.4 2.5 Australia 1.4 1.2 Japan 0.5 0.6
DEVELOPING 2.7 2.7
Total Above Countries 44.5 41.4

OUTLOOK TABLES

Table 1: Abaca Production(000 tonnes)Actual Projected Growth rates
2002-04 2012-14 2024 2012-14/2002-04 2024/2012-14
% %
World 84.8 75.0 75.0 -1.2 0.0
Developing 84.8 75.0 75.0 -1.2 0.0
Africa Developing 0.4 0.3 0.3 -1.9 -0.1
Latin Am and Caribbean 14.4 10.7 10.1 -2.9 -0.6
Costa Rica 1.3 1.1 1.3 -1.7 1.2
Ecuador 13.1 9.6 8.8 -3.0 -0.8
Near East 0.0 0.0 0.0 - -
Asia 70.0 63.9 64.6 -0.9 0.1
Philippines 68.5 62.3 62.9 -1.0 0.1
Developed 0.0 0.0 0.0 - -
Table 2: Abaca Exports (000 tonnes)Actual Projected Growth rates
2002-04 2012-14 2024 2012-14/2002-04 2024/2012-14
% %
World 31.7 18.4 20.4 -5.3 1.0
Developing 30.7 16.8 18.6 -5.8 0.9
Africa Developing 0.0 0.0 0.0 - -
Latin Am and Caribbean 13.1 9.6 8.8 -3.0 -0.8
Ecuador 13.1 9.6 8.8 -3.0 -0.8
Near East 0.0 0.0 0.0 - -
Asia 17.6 7.2 9.8 -8.5 2.9
China 0.1 0.4 0.4 9.3 0.9
Philippines 16.5 5.9 8.4 -9.9 3.3
Developed 1.0 1.6 1.9 4.7 1.5
European Union 0.3 1.1 1.1 12.1 0.3
United States 0.7 0.5 0.8 -2.7 3.8

Table 3: Abaca Imports (000 tonnes)
Actual Projected Growth rates
2002-04 2012-14 2024 2012-14/2002-04 2024/2012-14
% %
World 28.1 18.2 20.7 -4.3 1.2
Developing 0.8 1.4 1.8 5.7 2.1
Africa Developing 0.0 0.0 0.0 - -
Latin Am and Caribbean 0.0 0.0 0.0 -100.0 -
Ecuador 0.0 0.0 0.0 -100.0 -
Near East 0.0 0.0 0.0 - -
Asia 0.8 1.4 1.8 6.0 2.1
China 0.1 0.4 0.9 11.7 6.3
Philippines 0.1 0.5 0.5 16.7 0.0
Developed 27.4 16.8 19.0 -4.7 1.1
European Union 17.9 11.2 12.4 -4.5 0.9
Japan 8.1 5.1 5.8 -4.6 1.3
United States 1.2 0.5 0.8 -8.0 3.7

Table 4: Abaca Consumption (000 tonnes)
ActualProjected Growth rates
2002-04 2012-14 2024 2012-14/2002-04 2024/2012-14
% %
World 81.3 74.8 75.3 -0.8 0.0
Developing 55.0 59.6 58.2 0.8 -0.2
Africa Developing 0.4 0.3 0.3 -1.9 -0.1
Algeria 0.0 0.0 0.0 - -
Angola 0.0 0.0 0.0 - -
Cameroon 0.0 0.0 0.0 - -
Democratic Republic of Congo 0.0 0.0 0.0 - -
Congo 0.0 0.0 0.0 - -
Central Africa 0.0 0.0 0.0 - -
Cote d'Ivoire 0.0 0.0 0.0 - -
Egypt 0.0 0.0 0.0 - -
Ethiopia 0.0 0.0 0.0 - -
Ghana 0.0 0.0 0.0 - -
Guinea 0.0 0.0 0.0 - -
Equatorial Guinea 0.4 0.3 0.3 -2.1 0.0
Kenya 0.0 0.0 0.0 0.0 -1.2
Libya 0.0 0.0 0.0 - -
Madagascar 0.0 0.0 0.0 - -
Malawi 0.0 0.0 0.0 - -
Mali 0.0 0.0 0.0 - -
Morocco 0.0 0.0 0.0 - -
Mozambique 0.0 0.0 0.0 - -
Nigeria 0.0 0.0 0.0 - -
Senegal 0.0 0.0 0.0 - -
Sudan 0.0 0.0 0.0 - -
Tanzania 0.0 0.0 0.0 - -
Tunisia 0.0 0.0 0.0 - -
Uganda 0.0 0.0 0.0 - -
Zimbabwe 0.0 0.0 0.0 - -
Other Africa 0.0 0.0 0.0 - -
Latin Am and Caribbean 1.3 1.1 1.3 -1.7 1.2
Argentina 0.0 0.0 0.0 - -
Brazil 0.0 0.0 0.0 - -
Bahamas 0.0 0.0 0.0 - -
Bolivia 0.0 0.0 0.0 - -
Chile 0.0 0.0 0.0 - -
Columbia 0.0 0.0 0.0 - -
Costa Rica 1.3 1.1 1.3 -1.7 1.2
Cuba 0.0 0.0 0.0 - -
Dominican 0.0 0.0 0.0 - -
Ecuador 0.0 0.0 0.0 -100.0 -
El Salvador 0.0 0.0 0.0 - -
Guatemala 0.0 0.0 0.0 - -
Haiti 0.0 0.0 0.0 - -
Honduras 0.0 0.0 0.0 - -
Jamaica0.0 0.0 0.0 - -
Mexico0.0 0.0 0.0 - -

Table 4: Abaca Consumption (000 tonnes) .....continued
Actual Projected Growth rates (%)
2002-04 2012-14 2014 2012-14/2002-04 2014/2012-14
Nicaragua 0.0 0.0 0.0 - -
Panama 0.0 0.0 0.0 - -
Peru 0.0 0.0 0.0 - -
Uruguay 0.0 0.0 0.0 - -
Venezuela 0.0 0.0 0.0 - -
Other L.A. 0.0 0.0 0.0 - -
Near East 0.0 0.0 0.0 - -
Iran 0.0 0.0 0.0 - -
Iraq 0.0 0.0 0.0 - -
Jordan 0.0 0.0 0.0 - -
Qatar 0.0 0.0 0.0 - -
Saudi Arabia 0.0 0.0 0.0 - -
Syria 0.0 0.0 0.0 - -
Turkey 0.0 0.0 0.0 - -
Other Near East 0.0 0.0 0.0 - -
Asia 53.2 58.1 56.6 0.9 -0.3
Bangladesh 0.0 0.0 0.0 - -
Bhutan 0.0 0.0 0.0 - -
Cambodia 0.0 0.0 0.0 - -
China 0.0 0.1 0.5 - 16.6
Hong Kong 0.0 0.0 0.0 - -
India 0.6 0.6 0.6 -0.3 0.0
Indonesia 0.3 0.1 0.1 -12.2 -2.7
Malaysia 0.0 0.0 0.0 - -
Myanmar 0.0 0.0 0.0 - -
Nepal 0.0 0.0 0.0 - -
Pakistan 0.0 0.0 0.0 - -
Philippines 52.1 56.9 55.0 0.9 -0.3
Singapore 0.0 0.0 0.0 - -
Sri Lanka 0.0 0.0 0.0 - -
Taiwan 0.0 0.0 0.0 - -
Thailand 0.0 0.0 0.0 - -
Vietnam 0.0 0.0 0.0 - -
Other Asia 0.0 0.0 0.0 - -
Residual attributed to Asia 0.3 0.5 0.4 6.5 -0.5
Developed 26.4 15.3 17.1 -5.3 1.1
European Union 17.5 10.2 11.3 -5.3 0.9
Other Europe 0.0 0.0 0.0 - -
Russian Federation 0.0 0.0 0.0 - -
Belarus 0.0 0.0 0.0 - -
Kyrgyzstan 0.0 0.0 0.0 - -
Other CIS 0.0 0.0 0.0 - -
Australia 0.0 0.0 0.0 - -
Canada 0.0 0.0 0.0 -100.0 -
Israel 0.0 0.0 0.0 - -
Japan 8.1 5.1 5.8 -4.6 1.3
Korea 0.0 0.0 0.0 -100.0 -
New Zealand 0.0 0.0 0.0 - -
South Africa 0.1 0.0 0.0 -18.1 -4.3
United States 0.5 0.0 0.0 -32.6 1.1

Table 1: Coir Production (000 tonnes)Actual Projected Growth rates
2002-04 2012-14 2024 2012-14/2002-04 2024/2012-14
% %
World 584.2 1008.6 1217.4 5.6 1.6
Developing 584.2 1008.6 1217.4 5.6 1.6
Asia 584.2 1008.6 1217.4 5.6 1.6
India 388.2 599.9 680.0 4.4 1.0
Indonesia 1.0 37.6 51.0 43.9 2.6
Malaysia 26.0 24.5 26.4 -0.6 0.9
Philippines 5.6 24.0 50.2 15.8 6.8
Sri Lanka 62.6 135.1 165.3 8.0 1.8
Thailand 37.6 64.9 81.7 5.6 1.8
Vietnam 62.2 121.5 161.4 6.9 2.6
Table 2: Coir Exports (000 tonnes)Actual Projected Growth rates
2002-04 2012-14 2024 2012-14/2002-04 2024/2012-14
% %
World 184.7 796.2 1027.7 15.7 2.2
Developing 180.8 785.8 1018.0 15.8 2.2Latin Am and Caribbean 2.1 2.8 2.8 3.0 -0.1
Mexico 1.6 2.8 2.8 6.0 -0.1
Asia 178.7 783.0 1015.2 15.9 2.2
India 28.7 426.4 537.3 31.0 1.9
Indonesia 0.9 35.8 49.1 43.9 2.7
Malaysia 0.5 14.8 21.8 40.1 3.8
Philippines 2.7 23.4 49.8 24.1 7.0
Sri Lanka 53.0 114.5 135.4 8.0 1.5
Thailand 31.3 54.1 70.0 5.6 2.1
Vietnam 61.2 112.5 150.0 6.3 2.6
Developed 3.9 10.4 9.7 10.4 -0.5
European Union 3.1 9.4 8.9 11.7 -0.5
United States 0.7 1.0 0.9 2.7 -0.8

Table3: Coir Imports (000 tonnes)Actual Projected Growth rates
2002-04 2012-14 2024 2012-14/2002-04 2024/2012-14
% %
World 204.4 796.3 1032.4 14.6 2.2
Developing 121.7 551.8 721.4 16.3 2.3
Africa Developing 0.2 0.1 0.1 -4.5 1.6
Latin Am and Caribbean 2.1 2.8 2.8 2.8 -0.1
Mexico 1.6 2.8 2.8 5.9 -0.1
Near East 0.1 4.7 6.6 47.0 2.8
Saudi Arabia 0.1 4.7 6.6 47.0 2.8
Asia 119.3 544.2 711.9 16.4 2.3
China 103.4 530.8 697.6 17.8 2.3
Hong Kong 0.4 0.1 0.1 -14.8 -0.8
Malaysia 2.9 1.8 1.7 -4.5 -0.8
Pakistan 1.0 2.8 3.3 10.5 1.2
Taiwan 10.0 5.0 6.2 -6.7 1.7
Vietnam 0.5 0.0 0.0 -100.0 -
Developed 82.7 244.4 311.0 11.4 2.1
European Union 53.3 96.4 128.9 6.1 2.6
Russian Federation 1.3 5.3 4.9 14.6 -0.7
Australia 1.2 4.1 5.9 12.9 3.1
Canada 2.6 10.4 12.2 14.7 1.3
Japan 5.1 2.4 4.0 -7.3 4.7
Korea 2.4 73.0 79.0 40.6 0.6
New Zealand 0.4 1.8 1.8 15.2 0.1
South Africa 2.5 4.3 4.5 5.6 0.4
United States 13.8 46.9 69.8 13.0 3.5

Table 4: Coir Consumption (000 tonnes)Actual Projected Growth rates
2002-04 2012-14 2024 2012-14/2002-04 2024/2012-14
% %
World 603.9 1008.6 1222.0 5.3 1.6
Developing 525.1 774.6 920.8 4.0 1.4
Africa Developing 0.1 0.1 0.1 -0.5 1.6
Algeria 0.0 0.0 0.0 - -
Angola 0.0 0.0 0.0 - -
Cameroon 0.0 0.0 0.0 - -
Democratic Republic of Congo 0.0 0.0 0.0 - -
Congo 0.0 0.0 0.0 - -
Central Africa 0.0 0.0 0.0 - -
Cote d'Ivoire 0.0 0.0 0.0 - -
Egypt 0.0 0.0 0.0 - -
Ethiopia 0.0 0.0 0.0 - -
Ghana 0.0 0.0 0.0 - -
Guinea 0.0 0.0 0.0 - -
Equatorial Guinea 0.0 0.0 0.0 - -
Kenya 0.0 0.0 0.0 -100.0 -
Libya 0.0 0.0 0.0 - -
Madagascar 0.0 0.0 0.0 - -
Malawi 0.0 0.0 0.0 - -
Mali 0.0 0.0 0.0 - -
Morocco 0.1 0.1 0.1 0.4 1.6
Mozambique 0.0 0.0 0.0 - -
Nigeria 0.0 0.0 0.0 - -
Senegal 0.0 0.0 0.0 - -
Sudan 0.0 0.0 0.0 - -
Tanzania 0.0 0.0 0.0 - -
Tunisia 0.0 0.0 0.0 - -
Uganda 0.0 0.0 0.0 - -
Zimbabwe 0.0 0.0 0.0 - -
Other Africa 0.0 0.0 0.0 - -
Latin Am and Caribbean 0.0 0.0 0.0 -6.2 -3.5
Argentina 0.0 0.0 0.0 - -
Brazil 0.0 0.0 0.0 -5.8 -4.5
Bahamas 0.0 0.0 0.0 - -

Table 4: Coir Consumption (000 tonnes) .....continued
Actual Projected Growth rates (%)
2002-04 2012-14 2024 2012/14/2002-04 2024/2012-14
Bolivia 0.0 0.0 0.0 - -
Chile 0.0 0.0 0.0 - -
Columbia 0.0 0.0 0.0 - -
Costa Rica 0.0 0.0 0.0 - -
Cuba 0.0 0.0 0.0 - -
Dominican 0.0 0.0 0.0 - -
Ecuador 0.0 0.0 0.0 - -
El Salvador 0.0 0.0 0.0 - -
Guatemala 0.0 0.0 0.0 - -
Haiti 0.0 0.0 0.0 - -
Honduras 0.0 0.0 0.0 - -
Jamaica 0.0 0.0 0.0 - -
Mexico 0.0 0.0 0.0 0.0 -2.2
Nicaragua 0.0 0.0 0.0 - -
Panama 0.0 0.0 0.0 - -
Peru 0.0 0.0 0.0 - -
Uruguay 0.0 0.0 0.0 - -
Venezuela 0.0 0.0 0.0 -100.0 -
Other L.A. 0.0 0.0 0.0 - -
Near East 0.1 4.7 6.6 47.0 2.8
Iran 0.0 0.0 0.0 - -
Iraq 0.0 0.0 0.0 - -
Jordan 0.0 0.0 0.0 - -
Qatar 0.0 0.0 0.0 - -
Saudi Arabia 0.1 4.7 6.6 47.0 2.8
Syria 0.0 0.0 0.0 - -
Turkey 0.0 0.0 0.0 - -
Other Near East 0.0 0.0 0.0 - -
Asia 524.8 769.7 914.0 3.9 1.4
Bangladesh 0.0 0.0 0.0 - -
Bhutan 0.0 0.0 0.0 - -
Cambodia 0.0 0.0 0.0 - -
China 103.2 530.3 696.6 17.8 2.3
Hong Kong 0.4 0.1 0.1 -14.8 -0.8
India 359.6 173.5 142.7 -7.0 -1.8
Indonesia 0.0 1.8 1.9 43.9 0.7

Table 4: Coir Consumption (000 tonnes) .....continued Act
ual Projec
ted Growth rates (%)
2002-04 2012-14 2024 2012-14/2002-04 2024/2012-14
Malaysia 28.4 11.5 6.3 -8.6 -5.4
Myanmar 0.0 0.0 0.0 - -
Nepal 0.0 0.0 0.0 - -
Pakistan 1.0 2.8 3.3 10.5 1.2
Philippines 2.8 0.6 0.4 -14.7 -2.5
Singapore 0.0 0.0 0.0 - -
Sri Lanka 9.5 20.6 30.0 8.0 3.4
Taiwan 10.0 5.0 6.2 -6.7 1.7
Thailand 6.3 10.8 11.8 5.6 0.7
Vietnam 1.6 8.9 11.5 18.7 2.1
Other Asia 1.0 3.7 3.0 13.9 -1.8
Residual attributed to Asia 0.8 0.2 0.4 -14.1 7.3
Developed 78.8 234.0 301.2 11.5 2.2
European Union 50.1 86.9 120.0 5.7 2.9
Other Europe 0.0 0.0 0.0 - -
Russian Federation 1.3 5.3 4.9 14.6 -0.7
Belarus 0.0 0.0 0.0 - -
Kyrgyzstan 0.0 0.0 0.0 - -
Other CIS 0.0 0.0 0.0 - -
Australia 1.2 4.1 5.9 12.9 3.1
Canada 2.6 10.4 12.2 14.7 1.3
Israel 0.0 0.0 0.0 - -
Japan 5.1 2.4 4.0 -7.3 4.7
Korea 2.4 73.0 79.0 40.6 0.6
New Zealand 0.4 1.8 1.8 15.2 0.1
South Africa 2.5 4.3 4.5 5.6 0.4
United States 13.1 45.9 68.9 13.4 3.6
Table 1: Jute Production (000 tonnes)
Actual Projected Growth rates
2002-04 2012-14 2024 2012-14/2002-04 2024/2012-14
% %

World 3030.2 3234.7 3217.7 0.7 0.0
Developing 3023.3 3227.8 3210.9 0.7 0.0
Africa Developing 16.4 17.3 22.8 0.5 2.5
Congo 5.7 6.5 9.7 1.2 3.8
Mali 1.4 1.6 2.1 1.6 2.5
Mozambique 3.2 3.0 3.1 -0.5 0.4
Sudan 3.3 3.2 4.3 -0.3 2.7
Latin Am and Caribbean 25.5 30.8 34.0 1.9 0.9
Brazil 9.3 12.1 14.1 2.7 1.4
Chile 8.1 9.3 10.5 1.4 1.1
Cuba 4.7 6.7 7.0 3.6 0.4
El Salvador 3.0 2.1 1.8 -3.6 -1.0
Near East 0.0 0.1 0.1 12.7 0.2
Asia 2981.4 3179.7 3154.1 0.6 -0.1
Bangladesh 893.7 1374.0 1519.3 4.4 0.9
China 121.9 66.1 60.3 -5.9 -0.8
India 1830.0 1713.0 1547.6 -0.7 -0.9
Indonesia 8.0 4.0 4.2 -6.7 0.5
Myanmar 44.9 3.3 3.0 -23.0 -0.8
Nepal 16.8 15.0 16.9 -1.1 1.1
Pakistan 1.9 1.0 1.3 -6.0 2.3
Thailand 47.9 1.3 0.6 -30.2 -6.4
Vietnam 15.9 1.8 0.4 -19.6 -13.1
Developed 6.9 6.9 6.8 -0.1 -0.1
United States 6.0 6.0 5.8 0.0 -0.3
Table 2: Jute Exports (000 tonnes)
Actual Projected Growth rates
2002-04 2012-14 2024 2012-14/2002-04 2024/2012-14
% %

World 376.7 411.6 332.1 0.9 -1.9
Developing 363.4 401.2 319.2 1.0 -2.1
Africa Developing 0.1 1.9 2.1 34.0 1.0
Latin Am and Caribbean 0.0 0.0 0.0 - -
Asia 363.2 399.2 317.0 1.0 -2.1
Bangladesh 333.7 357.0 274.0 0.7 -2.4
China 1.4 0.0 0.0 -31.3 -0.6
India 8.5 32.5 35.5 14.4 0.8
Myanmar 17.2 0.0 0.0 -100.0 -
Nepal 0.0 2.9 2.7 - -0.6
Pakistan 0.1 3.4 2.5 48.0 -2.5
Thailand 1.1 0.2 0.4 -16.7 7.4
Vietnam 1.1 1.5 0.5 3.1 -10.1
Developed 13.3 10.4 13.0 -2.4 2.0
European Union 10.5 8.7 11.0 -1.8 2.1
United States 2.6 1.5 1.8 -5.2 1.4
Table 3: Jute Imports (000 tonnes)
Actual Projected Growth rates
2002-04 2012-14 2024 2012-14/2002-04 2024/2012-14
% %
World 354.9 441.3 364.1 2.2 -1.7
Developing 318.7 406.0 327.4 2.5 -1.9
Africa Developing 44.2 28.5 30.9 -4.3 0.7
Cote d'Ivoire 17.2 10.3 14.2 -4.9 3.0
Ethiopia 3.6 4.1 4.0 1.3 -0.1
Latin Am and Caribbean 12.3 10.2 7.1 -1.9 -3.2
Brazil 9.6 4.5 2.0 -7.4 -7.2
Near East 7.3 5.1 4.5 -3.5 -1.1
Iran 3.3 0.1 0.1 -28.9 0.1
Asia 254.8 362.2 284.9 3.6 -2.2
China 27.3 90.2 23.4 12.7 -11.5
India 108.0 119.6 70.3 1.0 -4.7
Pakistan 86.0 91.8 90.3 0.6 -0.1
Thailand 29.9 5.9 0.1 -15.0 -30.7
Developed 36.3 35.3 36.7 -0.3 0.4
European Union 19.4 14.2 15.8 -3.1 1.0

Table 4: Jute Consumption (000 tonnes)Actual Projected Growth rates
2002-04 2012-14 2024 2012-14/2002-04 2024/2012-14
% %
World 3008.5 3264.4 3249.7 0.8 0.0
Developing 2978.6 3232.7 3219.1 0.8 0.0
Africa Developing 60.5 43.9 51.6 -3.2 1.5
Algeria 0.0 0.0 0.0 - -
Angola 0.7 0.9 1.2 2.5 3.0
Cameroon 0.1 0.1 0.1 0.0 0.0
Democratic Republic of Congo 0.0 0.0 0.0 - -
Congo 5.7 6.5 9.7 1.2 3.8
Central Africa 0.1 0.1 0.1 -0.7 -0.3
Cote d'Ivoire 17.2 10.3 14.2 -4.9 3.0
Egypt 3.0 0.4 0.4 -19.2 -0.1
Ethiopia 3.6 4.1 4.0 1.3 -0.1
Ghana 0.3 1.6 1.6 18.4 0.1
Guinea 0.0 0.0 0.0 - -
Equatorial Guinea 0.0 0.0 0.0 - -
Kenya 0.0 0.0 0.0 - -2.6
Libya 0.0 0.0 0.0 - -
Madagascar 0.5 0.3 0.3 -5.1 0.0
Malawi 0.0 0.0 0.0 - -
Mali 1.4 1.6 2.1 1.6 2.5
Morocco 0.1 0.0 0.0 -100.0 -
Mozambique 3.2 1.7 1.6 -6.4 -0.6
Nigeria 1.3 1.5 1.7 1.8 1.2
Senegal 0.0 0.0 0.0 - -
Sudan 3.3 3.2 4.3 -0.3 2.7
Tanzania 0.1 0.0 0.0 -22.8 1.4
Tunisia 1.4 2.1 1.8 4.6 -1.5
Uganda 0.0 0.0 0.0 - -
Zimbabwe 0.0 0.1 0.1 - -1.9
Other Africa 18.6 9.4 8.3 -6.6 -1.2
Latin Am and Caribbean 37.8 40.9 41.1 0.8 0.0
Argentina 0.0 0.0 0.0 - -
Brazil 18.9 16.6 16.1 -1.3 -0.3
Bahamas 0.0 0.0 0.0 - -
Bolivia 0.0 0.0 0.0 - -
Chile 8.1 9.3 10.5 1.4 1.1
Colombia 0.0 0.0 0.0 - -
Costa Rica 0.0 0.0 0.0 - -
Cuba 6.1 8.7 8.9 3.7 0.1
Dominican 0.0 0.0 0.0 - -
Ecuador 0.0 0.0 0.0 - -
El Salvador 3.6 3.5 3.1 -0.3 -1.2
Guatemala 0.4 0.3 0.3 -3.9 -0.1
Haiti 0.0 0.0 0.0 - -

Honduras 0.0 0.0 0.0 - -
Jamaica 0.0 0.0 0.0 - -
Mexico 0.0 0.0 0.0 - -1.9
Nicaragua 0.0 0.1 0.0 - -2.8Table 4: Jute Consumption (000 tonnes) .....continued
Actual Projected Growth rates (%)
2002-04 2012-14 2024 2012-14/2002-04 2024/2012-04
Panama 0.0 0.0 0.0 - -
Peru 0.1 0.3 0.3 7.6 0.1
Uruguay 0.0 0.0 0.0 - -
Venezuela 0.0 0.0 0.0 - -
Other L.A. 0.7 2.2 2.0 11.7 -0.6
Near East 7.3 5.1 4.5 -3.4 -1.1
Iran 3.3 0.1 0.1 -28.9 0.1
Iraq 0.0 0.0 0.0 - -
Jordan 0.0 0.3 0.3 - 0.0
Qatar 0.0 0.0 0.0 - -
Saudi Arabia 0.8 1.0 0.5 2.8 -6.6
Syria 0.0 0.3 0.3 - 0.0
Turkey 0.9 0.0 0.0 -33.5 -0.2
Other Near East 2.2 3.4 3.3 4.4 -0.2
Asia 2873.0 3142.7 3122.0 0.9 -0.1
Bangladesh 560.0 1016.9 1245.3 6.1 1.9
Bhutan 0.0 0.0 0.0 - -
Cambodia 0.5 0.3 0.3 -4.6 0.1
China 147.8 156.3 83.7 0.6 -5.5
Hong Kong 0.0 0.0 0.0 - -8.3
India 1929.5 1800.1 1582.4 -0.7 -1.2
Indonesia 10.5 6.5 6.5 -4.7 -0.1
Malaysia 0.8 1.8 2.6 8.9 3.2
Myanmar 27.7 3.3 3.0 -19.2 -0.8
Nepal 16.8 60.6 108.8 13.7 5.5
Pakistan 87.8 89.4 89.1 0.2 0.0
Philippines 0.0 0.0 0.0 - -
Singapore 0.0 0.0 0.0 - -
Sri Lanka 0.1 0.0 0.0 -8.2 2.1
Taiwan 0.0 0.0 0.0 - -
Thailand 76.7 7.1 0.4 -21.2 -23.7
Vietnam 14.8 0.3 0.0 -31.9 -100.0
Other Asia 0.0 0.0 0.0 -18.0 -0.4
Residual attributed to Asia 0.0 0.0 0.0 - -
Developed 29.8 31.8 30.6 0.6 -0.3
European Union 8.9 5.4 4.8 -4.9 -1.2
Other Europe 1.4 1.2 1.2 -1.8 -0.1
Russian Federation 5.4 7.4 9.0 3.2 1.8
Belarus 0.0 0.1 0.1 27.9 -0.1
Kyrgyzstan 0.7 0.0 0.0 -100.0 -
Other CIS 0.6 0.1 0.1 -19.4 3.5
Australia 2.4 0.8 0.7 -11.0 -0.4
Canada 0.1 0.0 0.1 -11.6 7.6
Israel 0.0 0.0 0.0 - -
Japan 1.9 0.4 0.4 -13.8 -0.8
Korea 3.6 8.6 6.9 9.0 -1.9

New Zealand 0.0 0.0 0.0 - -
South Africa 1.0 0.9 1.1 -0.7 2.2
United States 3.8 6.9 6.2 6.3 -1.0
Table 1: Sisal Production (000 tonnes)
Actual Projected Growth rates
2002-04 2012-14 2024 2012-14/2002-04 2024/2012-14
% %
World 253.8 235.1 255.8 -0.8 0.6
Developing 252.4 233.7 254.4 -0.8 0.6
Africa Developing 61.6 76.6 83.8 2.2 0.5
Kenya 24.6 26.6 26.4 0.8 -0.4
Madagascar 8.1 8.7 9.3 0.7 0.6
Malawi 0.1 0.1 0.1 2.9 0.0
Tanzania 24.8 37.2 43.8 4.2 1.1
Latin Am and Caribbean 150.4 94.6 89.2 -4.5 -0.6
Brazil 139.9 80.0 72.5 -5.4 -1.0
Haiti 5.5 9.0 10.1 5.1 0.9
Jamaica 0.2 0.4 0.4 6.7 0.1
Venezuela 4.1 4.2 5.2 0.3 1.9
Near East 0.0 0.0 0.0 - -
Asia 40.4 62.6 81.4 4.5 2.2
China 40.4 61.6 80.4 4.3 2.2
Developed 1.4 1.4 1.4 -0.6 0.3
Table 2: Sisal Exports (000 tonnes)
ActualProjecte
d Growth rates
2002-04 2012-14 2024 2012-14/2002-04 2024/2012-14
% %
World 102.9 90.3 84.7 -1.3 -0.8
Developing 97.1 83.9 76.7 -1.4 -1.0
Africa Developing 39.2 47.6 53.7 2.0 0.8
Kenya 19.7 23.7 22.9 1.9 -0.6
Tanzania 11.7 16.9 23.4 3.8 2.5
Latin Am and Caribbean 57.3 35.9 22.5 -4.6 -4.1
Brazil 57.3 35.9 22.5 -4.6 -4.1
Near East 0.0 0.0 0.0 -100.0 -
Asia 0.6 0.5 0.5 -3.1 0.5
Developed 5.8 6.4 8.0 1.0 2.2
European Union 5.3 6.1 7.7 1.4 2.3

Table 3: Sisal Imports (000 tonnes)
ActualProjecte
d Growth rates
2002-04 2012-14 2024 2012-14/2002-04 2024/2012-14
% %
World 94.3 78.8 73.9 -1.8 -0.8
Developing 57.1 56.3 51.5 -0.2 -1.1
Africa Developing 5.3 8.5 9.4 4.8 0.7
Algeria 0.9 2.2 2.4 8.9 0.7
Egypt 1.0 1.2 1.4 2.4 0.8
Morocco 3.0 4.7 5.3 4.6 0.7
Latin Am and Caribbean 17.7 3.7 2.9 -14.6 -2.3
Chile 1.6 0.0 0.0 -100.0 -
Columbia 1.9 0.1 0.1 -25.7 0.0
Cuba 1.6 0.3 0.3 -15.9 0.7
Mexico 11.9 2.5 1.7 -14.5 -3.8
Near East 3.3 3.7 4.2 1.2 0.7
Saudi Arabia 2.3 3.4 3.9 3.9 0.8
Asia 30.8 40.5 35.1 2.8 -1.6
China 27.0 35.0 29.6 2.6 -1.8
India 1.2 3.1 3.1 9.5 -0.1
Indonesia 1.3 1.6 1.6 1.8 -0.3
Developed 37.2 22.5 22.4 -4.9 -0.1
European Union 33.5 21.3 21.0 -4.4 -0.2
Japan 1.1 0.2 0.3 -14.0 2.0
New Zealand 0.5 0.0 0.0 -21.7 -1.6
South Africa 1.2 0.5 0.5 -7.7 0.4
United States 0.4 0.2 0.2 -8.5 0.6

Table 4: Sisal Consumption (000 tonnes)Actual Projected Growth rates
2002-04 2012-14 2024 2012-14/2002-04 2024/2012-14
% %
World 245.2 223.6 245.0 -0.9 0.6
Developing 212.4 206.1 229.2 -0.3 0.8
Africa Developing 27.7 37.5 39.5 3.1 0.3
Algeria 0.9 2.2 2.4 8.9 0.7
Angola 0.4 0.6 0.6 3.9 -0.1
Cameroon 0.1 0.1 0.1 5.4 -0.4
Democratic Republic of Congo 0.0 0.0 0.0 - -
Congo 0.0 0.0 0.0 - -
Central Africa 0.3 0.2 0.2 -3.1 0.1
Cote d'Ivoire 0.0 0.0 0.0 - -
Egypt 0.9 1.2 1.4 2.6 0.8
Ethiopia 0.6 0.7 0.6 0.2 -0.1
Ghana 0.0 0.0 0.0 - -
Guinea 0.7 0.7 1.0 0.7 3.1
Equatorial Guinea 0.0 0.0 0.0 - -
Kenya 4.9 3.1 3.5 -4.6 1.0
Libya 0.0 0.0 0.0 - -
Madagascar 1.2 1.8 2.1 4.1 1.1
Malawi 0.1 0.1 0.1 2.9 0.0
Mali 0.0 0.0 0.0 - -
Morocco 3.0 4.7 5.3 4.8 0.7
Mozambique 0.2 0.6 0.6 10.0 0.1
Nigeria 0.0 0.0 0.0 - -
Senegal 0.1 0.0 0.0 -100.0 -
Sudan 0.0 0.0 0.0 - -
Tanzania 13.1 20.3 20.3 4.5 -0.2
Tunisia 0.1 0.1 0.1 -3.9 -0.1
Uganda 0.0 0.0 0.0 - -
Zimbabwe 0.0 0.0 0.0 - -
Other Africa 1.1 1.1 1.1 0.0 0.0
Latin Am and Caribbean 110.8 62.4 69.6 -5.6 0.8
Argentina 0.0 0.0 0.0 -100.0 -
Brazil 82.7 44.1 50.0 -6.1 1.0
Bahamas 0.0 0.0 0.0 - -
Bolivia 0.0 0.0 0.0 - -
Chile 1.6 0.0 0.0 -100.0 -
Columbia 1.9 0.1 0.1 -25.6 0.0
Costa Rica 0.0 0.0 0.0 - -
Cuba 1.8 1.3 1.2 -3.4 -0.6
Dominican 0.5 0.0 0.0 -23.2 0.6
Ecuador 0.0 0.0 0.0 - -
El Salvador 0.5 0.5 0.4 -0.1 -1.4
Guatemala 0.0 0.0 0.0 - -
Haiti 5.5 9.0 10.1 5.1 0.9
Honduras 0.0 0.0 0.0 - -
Table 4: Sisal Consumption (000 tonnes) .....continued
Actual Projected Growth rates (%)
2002-04 2012-14 2024 2012-14/2002-04 2024/2012-14
Jamaica 0.2 0.4 0.4 6.7 0.1
Mexico 11.9 2.5 1.7 -14.4 -3.8
Nicaragua 0.0 0.0 0.0 - -
Panama 0.0 0.0 0.0 - -
Peru 0.1 0.0 0.0 -100.0 -
Uruguay 0.0 0.0 0.0 - -
Venezuela 4.1 4.5 5.6 0.8 1.9
Other L.A. 0.0 0.0 0.0 - -
Near East 3.3 3.7 4.2 1.2 0.7
Iran 0.0 0.0 0.0 - -
Iraq 0.0 0.0 0.0 - -
Jordan 0.1 0.1 0.1 -3.9 -0.1
Qatar 0.0 0.0 0.0 - -
Saudi Arabia 2.3 3.4 3.9 3.9 0.8
Syria 0.3 0.1 0.1 -10.4 -0.1
Turkey 0.5 0.1 0.1 -15.8 1.1
Other Near East 0.0 0.0 0.0 - -
Asia 70.6 102.6 116.0 3.8 0.9
Bangladesh 0.0 0.0 0.0 - -
Bhutan 0.0 0.0 0.0 - -
Cambodia 0.0 0.0 0.0 - -
China 67.3 96.4 109.8 3.7 0.9
Hong Kong 0.0 0.0 0.0 -100.0 -
India 0.9 3.0 3.0 12.4 -0.2
Indonesia 1.1 2.4 2.4 8.0 -0.2
Malaysia 0.0 0.0 0.0 -100.0 -
Myanmar 0.0 0.0 0.0 - -
Nepal 0.0 0.0 0.0 - -
Pakistan 0.5 0.3 0.3 -2.8 0.0
Philippines 0.5 0.2 0.2 -7.2 0.8
Singapore 0.0 0.0 0.0 -100.0 -
Sri Lanka 0.0 0.1 0.1 13.7 -0.1
Taiwan 0.0 0.0 0.0 - -
Thailand 0.2 0.1 0.1 -7.0 -0.1
Vietnam 0.0 0.0 0.0 - -
Other Asia 0.0 0.0 0.0 - -
Residual attributed to Asia 0.0 0.0 0.0 - -
Developed 32.8 17.5 15.8 -6.1 -1.0
European Union 28.2 15.2 13.4 -6.0 -1.3
Other Europe 0.0 0.0 0.0 - -
Russian Federation 0.0 0.1 0.2 26.9 2.9
Belarus 0.0 0.0 0.0 - -
Kyrgyzstan 0.0 0.0 0.0 - -
Other CIS 0.0 0.0 0.0 - -
Australia 0.1 0.0 0.0 -19.4 -0.9
Canada 0.3 0.0 0.0 -20.1 -1.5
Israel 0.0 0.0 0.0 - -
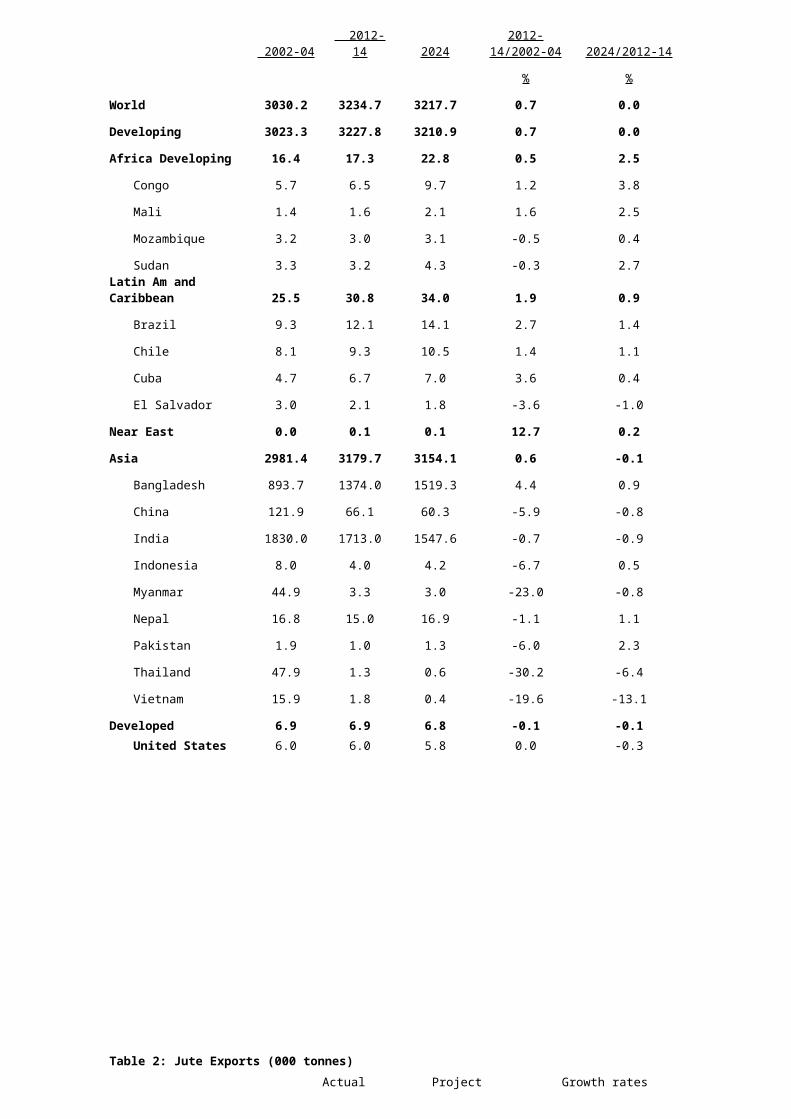
Table 4: Sisal Consumption (000 tonnes) .....continued
Actual Projected Growth rates (%)
2002-04 2012-14 2024 2012-14/2002-04 2024/2012-14
Japan 1.1 0.2 0.3 -14.0 2.0
Korea 0.0 0.0 0.0 -100.0 -
New Zealand 0.5 0.0 0.0 -22.1 -1.7
South Africa 2.5 1.8 1.9 -3.3 0.3
United States 0.0 0.0 0.0 -9.9 0.1