web seb ar-18 eng hr 190301 · the bank will also assess its total assets under management – this...
TRANSCRIPT

2018
Annual Report

Contents 2018 in brief
This is SEB CoverStatement from the Chair 2Statement from the President 3
Strategy 4Business environment 4A long-term perspective 9Business plan 10Overall targets and outcome 14Long-term value creation 16
Stakeholders 18Customers 18Society 24Employees 26Shareholders and the SEB share 29
REPORTOFTHEDIRECTORS
Financial review of the group 32Result and profitability 32Financial structure 35Divisions and business support 38Geographic markets 40
Risk, capital and liquidity management 44
Regulatory requirements 50
Corporate governance 52Board of Directors 56Group Executive Committee 60Remuneration report 64Internal control over financial reporting 66
Sustainability report 67
Financial statements and notes 74SEB Group 75Skandinaviska Enskilda Banken 80Notes to the financial statements 85Five-year summary 180Proposal for the distribution of profit 182
Auditor’s report 183
Definitions 187
Calendar and other information Cover
Important events and trends
SEB’s updated strategy and new three-year businessplan were presented.
Both large and smaller companies used SEB’s tradi-tional lending, advisory and cash managementservices to a higher degree, driving the 2018 result.
Customers increasingly utilised digital meetingsand apps and SEB continuously introduced newfunctionality.
Payments and card transactions increased in thepositive macroeconomic environment.
Late 2018 financial markets declined and volatilityrose which improved Markets' result while the valueof assets under management decreased.
Assets managed under SEB’s sustainability criteriaamounted to SEK 188bn.
Operating expenses were below the cost cap forthe ninth year in a row.
Corporate transactions involving SEB Pension andUC AB resulted in a total capital gain of SEK 4.5bn.
Key figures2018 2017
Operating income, SEK m 45,868 45,561
Operating profit before itemsaffecting comparability, SEK m 22,779 22,655
Operating profit, SEK m 27,285 20,759
Return on equity excluding itemsaffecting comparability, per cent 13.4 12.9
Return on equity, per cent 16.3 11.7
Cost/income ratio 0.48 0.48
Earnings per share, SEK 10.69 7.47
Proposed total dividend per share, SEK 6.50 1) 5.75
Common equity tier 1 capital ratio, per cent 17.6 2) 19.4
Leverage ratio, per cent 5.1 5.2
Liquidity Coverage Ratio (LCR), per cent 147 145COVER: Power Sharing Planet, by Olafur Eliasson. a part of SEB’s art collectionat the offices at Arenastaden, Solna. The office building won the award Sweden’sbest-looking office in 2017 (Sveriges snyggaste kontor).
1) Ordinary dividend SEK 6.00 and extraordinary dividend SEK 0.50.2) New rules in 2018. With the old rules outcome was 20.1 %.see page 47.

Who we areOur commitment to creating value for our customers is basedon the tradition of entrepreneurship, an international outlookand a long-term perspective coupled with a continuous abilityto adapt and to drive change.
As a bank we have an important role to play in the shiftto a more sustainable world.
Our purposeWe believe that entrepreneurial minds andinnovative companies are key to creatinga better world. We are here to enable themto achieve their aspirations and succeedthrough good times and bad.
Our visionDeliver world-class service to ourcustomers.
Our strategic priorities• Leading customer experience• Maintaining resilience and flexibility• Growing in areas of strength.
Our sustainability aimBe a role model in sustainabilitywithin the financial industry.
With our vision and strategy…
Our financial targets and outcomeOutcome
2018 1)Outcome
2017 1)
Dividend payout ratio at 40 per centor more of earnings per share2)
Ordinary dividend 70% 70%
Extraordinary dividend 6%
Total dividend 76% 70%
Common Equity Tier 1 capital ratio ofaround 150 basis points over requirement3) 17.6% 19.4%
Return on equity competitive with peers4) 13.4% 12.9%
1) Outcome excludes items affecting comparability.See note 13.2) Board proposal: an ordinary dividend of SEK 6.00, an extraordinary
dividend of SEK 0.50, in total SEK 6.50 (5.75). Outcome includingitems affecting comparability 61% (77).
3) New rules in 2018. With the old rules outcome was 20.1%.See p. 47.Regulatory requirement estimated by SEB: 14.9% (17.2)
4) Outcome including items affecting comparability: 16.3% (11.7%)
20181990 2000 2010
+5%2)
+4%2)
+8%2)
46
2223
1383
1) Excluding itemsaffectingcomparability.
2)Compound AnnualGrowth Rate(CAGR).
Income Expenses Operating profit
Our profit development 1990–20181), SEK bn

What we doSEB plays an active part in the development of the societies in which the bankis operating, by helping our customers realise their ambitions through our strongcustomer relationships. In Sweden and the Baltic countries our offer includes financialadvice and a wide range of financial services aimed at all types of customers. In theother Nordic countries, Germany and the United Kingdom, we are a full-servicelarge corporate and institutional bank.
…via our areas of strength…
Financial value created by SEB, 2018
Regulatory fees
Taxes and social charges
Payments to suppliers
Salaries, pensions and benefits to employees
Dividends paid to shareholders
Interest paid to customers18
SEK 63bn
14
11
10
7
3
SEB Nordic peers European peers (largest in terms of total assets)
Size of circle indicates CET 1 ratio (<13%, 13–17%, >17%)1) For SEB and two Nordic peers, excluding items affecting comparability.
SEB is profitable, efficient and well capitalised
Long-termcustomer
relationships
Comprehensive offering. We provideeverything from banking to pensionsand life insurance – for companies,institutions and private individuals.
Long-term relationships. Customerrelations are based on deep knowledgeabout our customers and valuable advice.We are there for them in good times and bad.
International perspective.We support our Nordic, German,British and Baltic customers aroundthe world and give internationalinstitutions access to Nordic markets.
Active ownership. Through Investorthe Wallenberg family serves as anactive owner with a long-termperspective.
Stability and trust. We safeguard ourfinancial resilience, always acting withtransparency, high ethics and a proactiveapproach to sustainability.
Tradition of enterprise. With more than160 years in the service of enterprise, weprovide banking services to the largestNordic companies in every sector.
1
0.5
00
Return onequity (%) 1)205 10 15
Cost/income ratio1)

Whom we serveOur customers are served by around 15,000 committed and experiencedemployees working as a team to create customer value by buildingstrong customer relationships in all the markets where we operate.
2,300 Large corporationsSEB’s corporate customers in the Nordic regionare among the largest in their respective industries.In Germany and the UK they range from largemid-corporate to large multinational companies.
700 Financial institutionsSEB’s institutional clients operate both inthe Nordic countries and internationally.
400,000 Small and medium-sized companiesIn all, SEB serves approximately 400,000small and medium-sized companies in Swedenand the Baltic countries. Of these, some 267,000are home bank customers.
4,000,000 Private individualsSEB has approximately 4 million private individualsamong its customers in Sweden and the Baltic countries.Of these some 1.4 million are home bank customers.
…we serve our customers.
SEB – strong diversified businessShare of income, %
0 20 40 60 80 100
Large corporates and institutionsLife insurance (unit-linked)Asset managementRetail banking
ESTONESTONIESTONINIANI
FFFFINLANDF
NNNNNNNSWEDENSWEDENSWSW
DENENENENEN AAAAMAAARARMARMARKKKKNMARNMARRKRK
NYNYGGGERMANYGERMANYUNITEDUNITUNITKINGDOMKINGDOKINGDO
NONNNORWAYNO
LATLATVIALATVIAIAVIAAATHLITLITITITLITHLITHLL NIANIANIANIAHUANIAHUANIATHUTHU
St. Petersburetersburgetersbur
KievKievKievKievWWWarsawWarsa
embourgembourgembourgembourgembourgembourgLuxembourLuxembour
New York
São PauloSão PSão P
ShanghaiShangShang
BeijingBeijingBeijingBeijingBeijingBeijingBeijingBeijingBeijing
Hong KongHong KHong K
SingaporeSingaporSingaporSingSingSingaporeSingapore
New DNewDNeNewDelhiw DelhiNew DelhiNew Delhi
Home markets ● International network
1) Income breakdown forSwedbank, SHB, Nordea,Danske Bank and DNB.Business units only(indicative).
Nordicpeers1)
SEB
We serve customers in our home markets and abroad

At SEB we know our customerswell and always strive to under-stand their existing and futureneeds better. Based on quali-fied advice, swiftly executed
transactions, and a strong balance sheet,we have been able to develop close anduniquely strong relations with customersin our part of the world.
In the face of rapid change we continu-ously adapt to our customers’ growingneeds for more sophisticated services,more proactive advice and advanceddigital solutions. We also need to closelymonitor the long-term economic, geopoli-tical, technological and demographictrends.
In this increasingly complex world, witha global debate tilting towards protection-ism, accommodating monetary policies,market volatility and an ever-changingregulatory environment in the financialindustry, it is required that we acceleratethe pace of our assessments and decision-making – without losing focus on the long-term effects of these changes on thefinancial strength and stability of SEB.
The development of artificial intelli-gence is expected to transform one sectorafter another. The increase in data, accessto cloud technology and algorithms formachine learning are enabling us to inter-act with our customers in new ways.With artificial intelligence, we can makeimprovements in everything from back-office operations to the customer experi-ence, product distribution, marketing,compliance and risk management. Block-chain is another technology that couldchange conditions in the financial sectorby reducing the need for intermediariesin all types of transactions and contracts.
Disruption is also taking place as indus-try shifts into the Fourth Industrial Revolu-
tion – the breakthroughs unfolding in thewake of the Internet of Things – whereconnected, autonomous systems commu-nicate with each other. In a world whereproduction chains can steer themselves,financial services can be seamlessly inte-grated with companies’ value chains. Newbusiness opportunities will emerge in newindustrial ecosystems. We need to contin-uously develop our product and serviceoffering to meet future customer demand.
As a bank we also have an importantrole to facilitate and finance our custom-ers’ shift to sustainable business models.Innovation and entrepreneurship will helpachieve the Sustainable DevelopmentGoals that the UN has set for 2030. In thisregard, the financial sector plays a keyrole in directing capital to the necessaryinvestments in infrastructure, renewableenergy and low-carbon technology. AtSEB, we believe that sustainable businessis better business – to the benefit of ourcustomers, shareholders and employees.
SEB’s most important assets are ourtrust and financial stability, which enableus to stand by our customers in good timesand bad. We, the Board, have thereforededicated a great deal of time to the newtypes of risks that SEB is facing, partly asa result of rapid technological develop-ments throughout the banking landscape.We are investing substantial resources inprotecting SEB from cyber threats, moneylaundering and other financial crimes, aim-ing to maintain trust and safeguard a solidand robust financial position. We upholdour trust and our brand best by adheringto the highest standards of corporate gov-ernance, sustainability, transparency andbusiness ethics.
Tomorrow’s winners in banking will bethose that identify market potential earlyand address the associated challenges.
SEB needs to embrace change while actingswiftly and decisively, at the same time aswe navigate according to our long-termstrategy to ensure stability in times ofuncertainty and disruption.
As the Board, our role is to worktogether with the Group Executive Com-mittee to gain an understanding of thestrategic landscape. We need to continueto question established truths and provenbusiness models. In our view, banking inthe future will still be focused on uncom-promising customer centricity and world-class service, but it will be based on real-time data and require an openness to thedigital platforms our customers prefer –regardless of whether those exist onour own channels or in new financialecosystems.
During 2018, SEB’s President JohanTorgeby and the Group Executive Commit-tee revisited and updated SEB’s Vision2025 as a foundation for a new three-yearbusiness plan. With a strategic focus onadvisory leadership, operational excel-lence and extended presence, we areinvesting in the future to strengthen ourability to create value for our customersand thus for you as shareholders. Thismeans that we are now taking the nextstep into an exciting future – on a journeywe have been on for more than 160 years.
Stockholm, February 2019
Marcus WallenbergChairBoard of Directors
Building trust and financial stabilityin an ever-changing landscape
Marcus WallenbergChair
As a bank we live in symbiosis with our customers andthe societies in which we operate. We are a mirror of ourcustomers’ success, but also a requirement for it. SEB seesit as its mission to contribute to innovation, entrepreneurshipand a thriving business sector; these form the foundationfor long-term shareholder value and sustainable societaldevelopment.
Statement from the Chair
Building trust and financial stability in an ever-changing landscape
As a bank we live in symbiosis with our customers and the societies in which we operate. We are a mirror of our customers’ success, but also a requirement for it. SEB sees it as its mission to contribute to innovation, entrepreneurship and a thriving business sector; these form the foundation for long-term shareholder value and sustainable societal
SEB Annual Report 20182

Entering the next phase ofour transformation journey
As the global economy movespast peak growth in the cycle,change has also become thenew normal in the banking land-scape. Our ability to balance
our long-term perspective with speed andswiftness in our daily operations will beessential to our success going forward.
In 2018, the financial market’s long-lasting resilience came to a halt towardsthe end of the year as positive businessand market sentiment turned into latecyclical concerns. Being a universal bankwith a diversified business, we benefitedfrom our exposure across customer seg-ments, products and geographies. Corpo-rate customers were the main drivers ofour financial performance growth in 2018,while financial institutions compensatedpositively for the decrease in assets undermanagement as market volatility and theresulting customer activity picked uptowards the end of the year. Householdmortgage volumes increased modestlythroughout the year.
As we enter 2019, we are embarking onthe next phase of our transformation jour-ney towards our vision of delivering world-class service to our customers. During2018 we revisited our long-term strategicdirection to ensure we remain the pre-ferred choice for our customers, and thebusiness plan for 2019–2021 is our firststep of putting this vision into action.
In response to the continuous transfor-mation of customer behaviours and tech-nology as well as the regulatory and com-petitive landscapes, we have identifiedthree strategic areas on which we willfocus our efforts: strengthening our advi-sory capabilities, accelerating operationalspeed, and extending our digital distribu-tion and offering.
Along with new technology and increas-
ing competition, where transactionalbanking products are becoming more andmore standardised, we believe that qualityof advice – through digital and humaninteraction – will be a key differentiator forSEB to remain relevant to customers goingforward. While having the right skills andcompetences is a prerequisite, we aim tobetter respond to specific customer needsand behaviours by applying new technol-ogy and enhancing the use of data in all ourcustomer interactions.
New technology will also be imple-mented to accelerate speed in our ongoingdigitalisation and automation journey, aim-ing to increase productivity and improvecost efficiency in response to the everchanging banking landscape. This willalso enhance the customer experienceby providing our customers with smarter,faster and safer solutions.
With financial services becoming moreintegrated into the daily life of customers,we also aim to leverage this increasinglyinterconnected banking landscape bywidening SEB’s distribution network.Through partnerships and new technol-ogy we will offer our products and ser-vices to customers outside SEB whilealso identifying new, cutting-edgesolutions from third-party providers tointegrate in SEB’s full-service offering.
In addition to developing our corestrengths, we also aim to leverage thenew adjacent opportunities that emergeas the industry continues to change. Inorder to accelerate growth and furtherenhance profitability, SEB will invest in aselection of strategic initiatives as part ofour new three-year business plan. Sustain-ability is one of these initiatives and is aresponse to the increasing demand fromcustomers and our determination tobecome a role model in sustainability
within the financial industry. With the trustput in us by our customers, shareholdersand employees, we believe SEB is well-positioned to innovate and drive the devel-opment in sustainable financial services.While continuing to integrate sustainabilityinto our processes, we will also ensure weremain compliant and adhere to best-in-class code of conduct in order to positionSEB as the go-to financial institution in thearea of sustainability.
By investing in our future, we want toconfirm our position as the leading Nordicbank for corporations and institutions,and a top universal bank in Sweden andthe Baltic countries. In order to achievethis, people will remain at the core ofeverything we do. I am very proud to bepart of the SEB team who relentlesslystrive to reach our vision of world-classservice and deliver long-term value toour customers and shareholders.
Stockholm, February 2019
Johan TorgebyPresident and Chief Executive Officer
Ever since SEB was founded in 1856 we have beencommitted to delivering long-term value to our customersand shareholders. Based on leading customer experiencecombined with a robust balance sheet and sound creditexposure, we aim to serve our customers through goodtimes and bad.
Statement from the President
Entering the next phase of our transformation journey
Ever since SEB was founded in 1856 we have been committed to delivering long-term value to our customers and shareholders. Based on leading customer experience combined with a robust balance sheet and sound credit exposure, we aim to serve our customers through good times and bad.
SEB Annual Report 2018 3

BusinessenvironmentDuringmost of 2018 the global economic boom remainedresilient to political uncertainty and global imbalances ina highly indebted world. New customer behaviours, newtechnology and new regulations are changing the playingfield for the financial sector.

Signs from the global financialcrisis in 2008, which startedwith the Lehman Brotherscollapse, are still tangible. Dueto resolute action, authorities
and central banks succeeded in mitigatingthe crisis and avoiding a full-scale depres-sion. Since then a succession of regula-tions have created a more robust, trans-parent and highly capitalised bankingsystem. The supervisory authorities arecollaborating globally, financial resolutionfacilities are in place in the most impor-tant markets, and the global economicrecovery continues, though with signsof slowdown.
But the cost has been negative interestrates and record-high indebtedness. Theglobal debt level of households, non-
financial corporations and governmentshas increased from 210 per cent of thegross domestic product in 2007, to morethan 240 percent. This is due both to theacute crisis management following theLehman Brothers collapse and the mone-tary stimulus packages that were adoptedby many Western economies. In Swedenthe prolonged period of low interest rateshas contributed to a higher level of privatedebt and rising asset prices. In late 2018,the Swedish central bank announced itsfirst repo rate hike in seven years; 25 basispoints to –0.25 percent.
Complex risk scenarioAt a more overarching socio-political level,the financial crisis has resulted in largersocioeconomic gaps and global imbalances,
which in turn have contributed to growingpopulism and nationalism in the politicalarena. In addition, protectionism came intodisplay in 2018 in the form of trade barriersand the complications of the Brexit process,among other things. Environmental andclimate issues are also high on the agenda.The prolonged economic upswingcombined with growing political uncer-tainty contribute to the complex riskscenario.
Comprehensive servicesLarge corporations and financial insti-tutions have broadened their contactinterfaces with banks and want to seeseamless digital integration alongsideproactive and value-creating advisoryservices. They expect banks to use theirextensive sources of data to createcustomised analyses and make recom-mendations. They have high demandsthat their banks’ advisers have solidindustry knowledge, specialist expertiseand access to sophisticated tools.
The same development can be seenamong small and medium-sized enter-prises, which have come to expect bothproactive advice and digital services ontheir terms. In this area development ismoving at a fast pace as companies wantto be able to manage their paymentsdirectly in their own systems in order toeliminate duplicate work.
In the private market, customers expectservices that are smarter, faster, moresecure and designed according to theirterms. Among customers in the PrivateBanking segment relationship banking
continues to be important and there is anexpectation for individualised advice com-bined with comprehensive, convenientand sophisticated digital services.
Among other private customers as wellthere is a preference for personalisedadvice that is available in the form andchannel of customers’ choosing. Theyput great trust in banks and are open tosharing their personal data if it leads tosmarter, more relevant and timely adviceand services.
Willingness to embrace digital solutionsis great. Customers are increasingly usingmore than one provider of financialservices.
SavingsAmong private customers there is greaterawareness that the demographic trends ofan ageing population and strong migrationpressure are challenging social welfareprogrammes. This is increasing the needfor financial security and social welfaresolutions. Attitude surveys show that halfof all private individuals want to increasetheir long-term savings as long as they arepresented with interesting and relevantsolutions.
Personal meetingsDespite the keen interest in and strongdevelopment of digital solutions, personalcontact with customers is at least equallyimportant when the need arises, whichputs demands on flexible, accessible andmodern meeting places and video calls.
High expectations for service amongbusinesses and private individuals
Ten years after the financial crisis
Repo rate in Sweden
<0%since February 2015
SEB Annual Report 2018 5
Business environment Strategy

Digital developmentThe digital revolution is impacting many aspectsof society. Business models, relationships and'economic truths' are being re-examined.Company ideas are quickly becoming outdated,and new ones are emerging just as fast. Forbanks, the business model is being evaluatedin the same way, and with digitalisation comesnew opportunities to reach customers andcreate new services. At the same time risks forfraud, cybercrime and money laundering areincreasing. New technologies provide SEB withnew capabilities to identify suspicious activitiesand improve transaction reporting.
Open BankingNew banking rules enable third-party develop-ers to build their customer applications aroundbanks' systems and data through the use ofapplication programming interfaces (APIs). Thisdevelopment, which is known as Open Banking,entails both opportunities and challenges.Banks have large customer bases and greattrust capital among their customers, whichmakes collaboration with new partners a greatbusiness opportunity. Banks with qualityservices also have the opportunity to use OpenBanking to reach new customers. Open Bankingregulations differ between markets, challengingcross-border solutions. In the EU, however,implementation of Payment Services Directive(PSD 2) has established a common ground.
Data analysisCustomers are increasingly expecting custom-ised services based on their personal situation.Using artificial intelligence, machine learningand its extensive data, banks can build smarterand more sophisticated services to meetcustomer needs. Customer benefit, ethical use
of sensitive data as well as customer integritymust be weighted in the process.
Evolving technologiesThe rapid pace of technology developmentimplies great exploitation potential. Throughartificial intelligence (AI) and machine learning,accurate forecasts can be made on the basis ofanalysis of large amounts of data. Therefore,AI will be a game changer in the banking sectorwhen it comes to providing advice based ondata analysis. Blockchain technology, whichenables transaction to be verified andprocessed in real time, may transform the waypayments and business transactions areconducted while cloud computing may changehow IT infrastructure and IT applications aremanaged and developed.
Agile developmentNew, dynamic ways of working that are basedon agile development and service design inclose interaction with customers are rapidlybeing implemented in the industry for all typesof processes. For instance, banks now havethe opportunity to move away from large-scaleIT projects that were previously conductedwithin the financial sector, in favour of newstep-by-step solutions that are more flexibleand can meet customer needs more quickly.
CompetenceAs more and more services becomedigital, customers’ expectations for value crea-tion and proactive advice are growing. In thisregard, a bank’s ability to support the compe-tence development of its employees and attracttop talent is decisive for its future success.
New regulations changing the playing fieldDuring the year the financial sectorcontinued to be characterised by anextensive agenda of regulation, whichhas required banks to implement majorIT and operational adaptations.
Consumer protectionAs of the beginning of 2018 the EU’sMarkets in Financial Instruments Direc-tive (MiFID II) came into force, whichseeks to improve consumer protectionand transparency in securities trading.
Payment servicesImplementation of the EU’s revisedPayment Services Directive (PSD 2) alsobegan in 2018, aiming to make banks’information on customers’ account andpayment services available externally.
This entails both opportunities and chal-lenges for the banks’ existing businessmodels as banks and other companies– via standardised interfaces – will beable to access each other’s customerinformation.
Anti-money launderingThe regulations addressing money laun-dering and financing of terrorism weresharpened in 2017, and as the regulatoryauthorities subsequently stepped uptheir monitoring activities, these issuesattracted greater attention in the mediaand political agendas. Several banks –both in the Nordic countries and interna-tionally – have found themselves in thespotlight due to ineffective routines forcountering money laundering.
Sustainability requirementsIn 2018 the EU Commission presented anaction plan for how the financial sectorshall contribute to the EU’s achievementof the climate and energy targetsrequired to meet the 2°C target. TheCommission has recommended that thefinancial sector play a key role in steer-ing capital flows towards a more sustain-able economy, and in the years immedi-ately ahead will formulate bindingrequirements and goals for this work.
Other new regulationsThe extensive new accounting standardIFRS 9 Financial Instruments went intoforce as of January 2018, and in May2018 the EU’s General Data ProtectionRegulation (GDPR) took effect.See p. 50.
inontinu
w rehe y
ND
SEB Annual Report 20186
Strategy Business environment

»Focus on sustainability
SEB’s analysis of the business environment has resultedin seven conclusions, which contributed to updating thebank’s strategy and new three-year plan.
Customers expect smarter and fasterservices, secure and accessible on theirterms.
Long-term customer relationships andtrust are built on valuable advice, basedon best-in-class data capabilities.
The customer offering can be enhancedthrough digitalisation, automation andpartnerships with external suppliers.
Sustainability will grow in importancefor customers, employees and otherstakeholders.
People are at the core of everything wedo and will be determinant for our success.
The ability to manage risk and attractassets will be key.
Regulatory pressures are expectedto remain.
SEB’s conclusions
See p. 8–13 for SEB’s strategy and business plan.
One clear and enduring trend in thegeneral operating environment is therising focus on sustainability. Customersin all segments expect banks to take greatresponsibility, and there is growingdemand for sustainable products, wherecustomers – through their choices of
financial services – can participate in and influence develop-ment towards a more sustainable society.
Many companies are putting sustainability work high up ontheir own agendas and are beginning to implement the UN’sSDGs in practice. In order to transform their business to be moresustainable, they seek the assistance and products that bankscan provide.
At the global level, climate change is undoubtedly a greatchallenge. The UN’s 17 Sustainable Development Goals (SDGs)that were adopted in 2015 represent a uniform, integratedapproach and harmonise the three core elements of sustainabledevelopment: economic growth, social inclusion and environ-mental protection. Many scientists believe that the possibilitiesto achieve the sustainability goal of limiting Earth’s temperaturerise to 2°C are small given the current pace of change. Breakingthis trend will require a radical shift in most industries combinedwith innovative solutions and investments in infrastructure.The financial sector has a relatively small direct environmentalimpact, but by meeting customers’ needs for sustainability-related financing and offering products with a sustainabilityperspective, it has the potential to make a great impact.
Sustainable development goals in focus at SEB
Decent work and economic growth
Industry, innovation and infrastructure
Climate action
Peace, justice and strong institutions
7
Business environment Strategy

Strategy forworld-classserviceSEB’s long-term vision, to deliver world-class service to ourcustomers, recognises that customer satisfaction is a prerequisitefor all activities. By seizing opportunities that emerge in acontinuously changing banking landscape the bank is pursuingcustomer satisfaction.

StrategyDelivering world-class services to customers is as crucial todayas in 2015 when SEB established its long-term Vision 2025. Areview of the current and future business environment form thebasis for the updated Vision 2025 as well as the new strategyand business plan.
While maintaining and improving the current business opera-tions, SEB aims to enhance customer services based on opportu-nities captured from new customer behaviours, emerging tech-
nologies and changing market conditions. This aims to ensurecustomer satisfaction and create sustainable shareholder valuethrough long-term growth.
The ambition to be the undisputed leading Nordic corporateand institutional bank as well as the top universal bank in Swedenand the Baltic countries remains unchanged.
SEB’s strategy has three main focus areas: advisoryleadership, operational excellence and extended presence.
A long-term perspectiveFounded in the service of enterprise more than 160 years ago, SEB has through the years operated from a base ofthree pillars on which the present strategy and business plan are built.
Leading customer experience Develop long-term relationships based on valuable advice, customers’trust in SEB as well as their appreciation of SEB’s services.
Resilience and flexibility Maintain resilience and flexibility, based on capital and liquiditystrength, to enable adaptation to prevailing market conditions.
Growth in areas of strength Focus on profitable organic growthin areas of strength.
Operationalexcellence
Enhance customer value andincrease process efficiencyand speed by acceleratingdigitalisation and automationwhile extending the use of data.
Provide customers with pro-active, customised and valu-able advice, based on customerinsight and data analysis –through human and digitalinteraction.
Advisoryleadership
Broaden the offering by supply-ing customers with externalproducts and extend SEB'spresence by providing productsand services in customers’digital ecosystems.
Extendedpresence
SEB Annual Report 2018 9
A long-term perspective Strategy

Business plan 2019–2021Business plan 2019–2021The current business operations will be further developed withinthe strategic focus areas of advisory leadership, operationalexcellence and extended presence. Within these areas, strategic
initiatives will also be undertaken in order to accelerate transfor-mation by leveraging the business opportunities emerging fromthe changing banking landscape.
Overall targetsShareholder value is created through profitable growth andimproved efficiency, while maintaining strong capital efficiency.
As part of the planning for the next three years, the Boardreviewed its three financial targets. They remain unchanged:
Ayearly dividend that is 40 per cent or moreof earnings per share.
ACommonEquity Tier 1 (CET 1) capital ratio ofaround 150 basis points above the current requirementfrom the Swedish Financial Supervisory Authority.
A return on equity that is competitive with peers.
In the long term, SEB aspires to reach a sustainable returnon equity of 15 per cent.
SEB will continue to operate with a strict cost discipline ensuringthat its current operations are cost efficient. The new strategicinitiatives, on an accumulated basis, are estimated to lead tototal additional investments of SEK 2–2.5bn over the threeyears. This translates into an annual cost increase of SEK 1bnby 2021 (compared with 2018) and a new total cost target ofaround SEK 23bn, assuming 2018 foreign exchange rates. Thepace of investments will be dependent on progress and willgradually increase over the next three years. The strategicinitiatives are expected to lead to both revenue growth andcost efficiency.
The overall progress of the business plan will also be moni-tored in terms of customer satisfaction, employee engagementand efficiency as well as sustainability.
Further development Strategic initiatives
• Strengthen and expand the large corporate andinstitutional business in SEB's home markets byoffering proactive and improved customerservices and platforms.
• Focus on sustainable growth in the Balticcountries, while carefully monitoring risks.
• Providemore relevant and targeted advice tosmall and medium-sized companies using dataanalytics.
• Make SEB the leading pension provider in Swedenand the Baltic countries and improve customerservices by combining the savings and insuranceoffer.
• Strengthen SEB’s position in sustainablefinancing and investment.
• Savings and investments–enhance the bancassuranceoffering and develop invest-ment management capabili-ties.
• Corporate and investmentbanking– enhance advisorycapacity, with special focuson opportunities in renewa-ble energy and new technol-ogies.
• Private banking– improvethe private banking offeringand expand in the Nordicmarkets.
• Accelerate innovation insustainable financial services.See p. 12.
An attractive full-service customer offering based on high-quality proactive advice andproducts will distinguish SEB when certain banking services and products are becomingmore standardised.
By turning data into insight through data analysis, SEB will better meet customerneeds and behaviours which will add value to the advisory services.
Advisoryleadership
SEB Annual Report 201810
Strategy Business plan

Further development Strategic initiatives
• Enhance the full-service offering and take part inOpen Banking-related opportunities in order to,for example, distribute SEB’s products to newmarkets.
• Develop the Greenhouse concept for small andmedium-sized companies through a full-serviceoffering complemented by adjacent services suchas legal advice and recruitment services fromexternal providers.
• Continue to engage in new partnerships andparticipate in industry initiatives, for instance onblockchain and other new technology.
• Explore new business models and services adja-cent to banking, while also building competencein new technologies and innovation.
• Invest in fintech companies through SEB’s venturecapital business to foster new relationships bene-fitting customers.
• OpenBanking– develop thebusiness in co-operation withexternal parties.
• ERP integrator– collaboratewith ERP (enterpriseresource planning) vendorsfor better customer service.
• ScalingMarkets’ system–increase digital indirect distri-bution channels to utilise theexisting trading system moreefficiently.
• SEBx– explore and utilisenew technology to meetfuture customer needs inde-pendently from the bank'soperations.
Financial services are becoming more integrated in customers' daily life and operations.In order to meet customers’ demand, SEB will extend the offering by integrating productsand services from third-party providers. The distribution network will also be extendedby offering SEB products and services to customers on platforms of their choice.
By using new distribution channels and platforms SEB aims to explore new businessmodels, enter new markets and attract new customers.
Further development Strategic initiatives
• Provide customers with improved advice and newproducts, through new methods of using theunique data that SEB holds.
• Invest in new technology.
• Enhance accessibility and convenience forprivate customers across all channels, forinstance digital agreement signing and digitalcustomer onboarding.
• Free up time for more advisory meetings throughleverage of self-service and data.
• Improve the efficiency of the risk and compliancefunctions by using digital methods.
• End-to-end automationof selected customer andinternal processes.
• Data-driven improvementof competitiveness throughadvanced analytics of bigdata.
• Agile processes expansionto increase the speed ofdevelopment.
• Adaptation of employeeskills and competence tomatch future needs.
Customers demand smarter, faster and more secure services while fierce compe-tition requires SEB to continuously become more efficient.
Focus will lie on efficiency and speed – enabling swift transaction executionthrough the use of new technology and data. By digitalising and automating end-to-end processes SEB will improve the customer offering and increase productiv-ity and cost efficiency.
Operationalexcellence
Extendedpresence
SEB Annual Report 2018 11
Business plan Strategy

In a world characterised by great uncertainty from both economic and sustainability perspectives, customers and other stake-holder groups raise their expectations on the bank to provide innovative and responsible solutions and actively contribute to a sustainable future.
Since several years, SEB has had the ambition to be a role model in sustainability within the financial industry. In 2018, SEB strengthened its focus even further on sustainability which is now a key component of the bank’s business plan 2019–2021.
Classifying and transforming portfoliosIn view of the ongoing climate change, SEB will, in supporting its customers in their ambition to be more sustainable, start to clas-sify and gradually transform its credit portfolio. The bank will also assess its total assets under management – this in addition to assets already assessed in SEB's fund company – and increase the share of assets managed according to sustainability criteria.
Simultaneously, SEB will enhance sustainability advisory capa-bilities to customers, based on market insight and the bank’s expertise and thought leadership.
Additionally, SEB will establish an innovation centre where emphasis will be on creating new financing and investment opportunities, such as development of sustainable capital mar-ket products and services, this in addition to the daily product development in the divisions. The bank aims to provide a range of sustainability and impact products in all customer segments.
Among the areas for product development are:• sustainable corporate loans, bonds and consumer credits• financing and investment products based on the UN
Sustainability Development Goals• tools for sustainability-related advice to companies and
financial institutions• digital solutions for private customers to support sustainable
consumption.
Strengthening policies and processesSEB will continue to include sustainability aspects as a natural part of its business. Policies and processes will be continuously strengthened and aligned with international and national requirements. The bank together with its employees shall always aim to conduct business in a responsible manner. The Code of Conduct, SEB’s core values and culture shall be starting points in decision-making and behaviour. Learning and training in sustainability matters will be enhanced.
Aligning incentiveSEB sees the importance of aligning incentive structures within the company and has therefore decided that senior management members will also be evaluated on their contribution to the bank’s journey towards a sustainable future.
Read more about SEB’s sustainability work on p. 67–73.
Transformation towards a sustainable future
Risk managementThe Chief Risk Officer (CRO) has evaluated and supports the busi-ness plan from a risk perspective. The risk tolerance statementsof the Board of Directors reflect the bank’s view on risk taking andmanagement in light of the business plan.See p. 44.
In order to better manage non-financial risks, the risk toleranceframework has been broadened to include metrics on cyber andinformation risk as well as compliance risk.
Strategy Business plan
12 SEB Annual Report 2018

Closing the business plan 2016–2018The business plan for 2016– 2018 targetedcompetitive profitability, a strong capitalposition and long-term dividend growth. Inorder to achieve this, the bank aimed to beleading within customer service and to be
the most attractive employer. The businessplan also focused on growth in areas ofstrength and transformation to capturethe full potential of digitalisation to addcustomer value and drive efficiency.
Return on equity excluding items affectingcomparability, improved to 13.4 per centfrom 12.9 per cent.3)
SEBwas the onlyNordic bank included intheDowJones Sustainability Index duringthe period.
SEB’s capitaladequacy bufferremained aboveregulatoryrequirementdespite dividendincreases andstricter measure-ment rules. 4)
Employeeengagement,efficiency andtrust remainedabove financialsector average.2)
The dividendincreased by SEK0.25 each year.5)
Expenseswerebelow the costcap of SEK 22bneach year.
1) All comparisons in this section are made with 1 January 2016.
2)See page 14–15.
3) Including items affecting comparability, the return on equityimproved from 12.2 to 16.3 per cent.
4) On 1 January 2016 the buffer was 2.8 per cent; on31 December 2018 – 2.7 per cent.
5) For 2018, proposed to the AGM. In addition, an extraordinarydividend of SEK 0.50 per share was proposed for 2018.
6) Includes corporate and SME customers.
Outcome business plan1) Selected indicatorsGrowth Since 1January2016
Accelerate growthin Sweden
150 new large corporatecustomers
Expand business withNordic and Germanlarge corporations andinstitutions
Growth in total corporatecredits6) SEK 148bn
Expand savingsoffering to privateindividual and corpo-rate customers
Net inflow of assets undermanagement amounted intotal to SEK 136bn
Transformation Since 1January2016
Create leadingcustomer experienceof world-classservice
Increase in private customerusage of mobile services inSweden 87 per cent
Use digitalisationfor customisedadvisory toolsand interfaces
12,349 remote advisorymeetings in the Baltic coun-tries.
Continuous learningfor employees
2,878 employees in leader-ship/talent managementprogrammes.
Sustainabilitysuccess factor Since 1January2016
Increase loansunder SEB’s greenframework
Loans classified accordingto SEB’s green frameworkincreased to SEK 16bn
Increase sustainableinvestments
Funds managed withsustainability criteriareached SEK 188bn
Support innovationand entrepreneurship
Contribution toentrepreneurial andinnovation partnershipsSEK 41 million
All customer segments ranked SEB highlyand customer satisfaction, measured ascustomers’ willingness to recommend SEBas bank, developed positively during theplan period for SEB’s four main customersegments. 2)
13SEB Annual Report 2018
Business plan Strategy

TargetLeading position in selected customersegments and meeting or exceedingthe internal customer satisfactiontargets.
Prospera – overall performanceIn Prospera’s overall performanceevaluation, SEB was ranked as no. 2by Nordic large corporations, downone notch from 2017. Swedish largecorporations ranked SEB as no.1.Both Nordic and Swedish financialinstitutions ranked SEB as no. 1.
Swedish Quality IndexIn the Swedish Quality Index measure-ment of customer satisfaction banks’scores improved for the first time inseveral years. SEB’s private custom-ers were somewhat more satisfiedwhile companies’ satisfaction wasunchanged.
ActionThe new business plan focuses onimproving the customer offer in manyways and thereby customer satisfac-tion.
TargetSEB shall maintain a Common EquityTier 1 (CET1) capital ratio that isaround 1.5 percentage points abovethe regulatory requirement. Per31 December 2018 SEB’s buffer was2.7 percentage points. SEB’s estimateof the current CET1 requirement fromthe Swedish Financial SupervisoryAuthority was 14.9 per cent at year-end 2018.
Overall targetsandoutcomeThe progress of the strategy and three-year business plan is monitored and measuredat many levels. These selected metrics provide a progress overview.
1) According to Prospera2) According to SEB’s Net Promoter Score method
2018
2017
2016
2018
2017
2016
20181)
2017
2016
2018
2017
2016
2018
2017
2016
2017
2018
2016
2018
2017
2016Customer experienceand satisfactionVarious internal and externalmetrics are used to measurecustomer satisfaction. Custom-ers’ willingness to recommendSEB is one of the key measuresof the bank’s progress.
Financial targetsThrough the resilience andflexibility that come from astrong capital base, goodaccess to funding, high creditratings and cost efficiency,SEB can create shareholdervalue in varying market condi-tions. The Board of Directorssets three financial targetsthat contribute to financialstrength.
Outcome excluding items affecting comparability in grey box.1) Based on the proposed dividend of SEK 6.50 for 2018 which consists of
SEK 6.00 as ordinary dividend and SEK 0.50 as extraordinary dividend.
TargetSEB shall generate a competitivereturn on equity. This means thatthe bank in the long term aspires toachieve a 15 per cent return on equity.
Target40 per cent or more of earnings pershare. SEB strives for long-termgrowth in dividend per share. The sizeof the dividend takes into accountSEB’s financial position, the prevailingeconomic situation, earnings, regula-tory requirements and opportunitiesfor growth.
Nordic large corporations 1)
Customers’ willingness to recommend SEB
Common EquityTier 1 capital ratio, per cent
Small companies in Sweden 2)
Return on equity, per cent
Nordic financial institutions 1)
Private individuals in Sweden 2)
Dividend payout ratio, per cent
Customers
Shareholders
3.8
>35 >35
3.7
3.8
>45
11.3
75
>45
3.7
3.8
>45
12.9
13.4
70
76
>50
3.74.2
47
17.61)
19.4
16.3
11.7
61
77
47
4.0
4.2
40
41
7.8
113
41
3.9
4.1
IndustryaverageOutcome
Outcome
Outcome
Outcome
Industryaverage
TargetTarget
18.8
37
3.9
Outcome excluding items affecting comparability in grey box.
1) Calculation changed in 2018. Without the change theoutcome would have been 20.1 per centSee p. 47.
SEB Annual Report 201814
Strategy Overall targets and outcome

2018
2017
2016
TargetSEB’s target is tobe themostattractiveemployer in the financial sector.Progress ismeasured through theemployeesurvey Insight.
CommentSEBcontinues tooutperformthe finan-cial sectoronemployeeengagement,performanceexcellenceaswell aswill-ingness to recommendSEBasaplacetowork. Theoutcome inperformanceexcellencewasanall-timehigh.
ActionThebank isaddressing the findingsofInsight inmanyways.Theemployees’need forbetteraccess to ITand tech-nology ispart of thebusinessplan.Inclusionanddiversity issuesareaddressedby, amongother things, theappointmentofan inclusion&diversitymanagerand theBoardhas in itspolicyset the framework for thecontinuedwork.
TargetReduce thegap to theno. 1 in the indus-tryand in the long termhave thestrongest reputationamong industrypeers.
CommentThe long-termtrend inSweden isstable. SEBkept its no.2 ranking ,withascore thatwasabovemarketaverage.
ActionSEBwill continue to takeanactivepartin society, promotingentrepreneurshipandcontributing toasustainableecon-omy.
CommentSEBaims togradually transformcreditand investmentportfolios towardsasustainableprofile.
ActionSustainabilityhasbeendefinedasastrategic initiative in thebusinessplan.Roles, responsibilitiesand targetswillbedeveloped tomeetSEB’s commit-mentsandstakeholders’ expectations.
Sustainable investmentsShare of assets under managementbeing managed according to sustaina-bility criteria.
Gradually increase theshareofassetsundermanagementbeingmanagedaccording to sustainability criteria.
TargetReduceCO2 emissionsby20percentbetween2016and2020, reaching18,500tonnesCO2. Themeasurementmethodand therefore the targetchanged in2018.See p. 73.
CommentThedecrease inCO2 emissions ismainlydue toasmaller office space.See p. 73 for more information.
2018
2017
2016
2018
2017
2016
2018
2017
2016
2018
2017
2016
Motivation and engagementThe annual employee survey,Insight, measures employeeengagement, efficiency andtrust. It also measures employ-ees’ willingness to recommendSEB as a place to work.
ReputationSEB monitors the results ofKantar Sifo’s Corporate Repu-tation Index, which measuresthe bank’s reputation amongconsumers and businessowners.
SustainabilityAs a bank, SEB has relativelylow direct environmentalimpact. However, the ambitionis to lower the internal CO2impact.
1) Corporate reputation among the general public,according to Kantar Sifo’s Corporate Reputation Index.
2) SEB, SHB, Swedbank, Nordea,Danske Bank.
2018
2017
2016
Employee engagement, IndexEngagement
Corporate reputation1), IndexSweden
Employees, IndexWillingness to recommendSEB as a place to work
Performance excellence, IndexEfficiency and trust
Sustainable financing, SEK bnGreen loan portfolio
CO2 emissionsTonnes
Employees
Society
73
73
73
74
40
18,500
76
74
75
38
33
18,500
18,500
77
7879
82
42
43
13.2
23,797
16.0
23,198
82
77
78
78
45
11.8
24,054
81
81
Outcome
Outcome
Outcome
Outcome
Outcome
Financialsector
average
Financial sectoraverage
Average 2)
Target for2020
Financialsector
average
77
SEB Annual Report 2018 15
Overall targets and outcome Strategy

Long-termvalue creationCustomer centricity, long-term perspectives and financial strength formthe foundation for meeting the expectations of customers, employees and societyat large. Ultimately, this creates value for the shareholders.
StrategyLong-term strategySEB’s strategy is built on developing deep customer relationships with a long-term perspective. See p. 9.
ServiceCustomer-oriented offeringProactive quality advice and a holistic, digital and personal, offering are provided at the customers’ convenience, based on customer insight. See p. 18–23.
Business developmentAgile and proactive process Products and services are developed proactively and with agility, based on customer preferences and market outlook. See p. 9 and 27.
IT and dataSecure and functional ITThe IT structure promotes stability in the daily opera-tions, manages large amount of data and promotes agile development of products and services. See p. 38.
Customers1.7million corporate andprivate home bank customersThe customers’ needs are at the core ofthe bank’s business. Customers’ highexpectations on both personal and digi-tal service, on quality advice and onsustainable solutions drive the bank’sbusiness development and offerings.
Employees15,000 employeesSEB’s employees build and deepencustomer relationships. Their commit-ment, skills and continuous learningare key success factors for the bank’sbusiness and future development.
SocietySociety at largeBanks play an integral role in societyand are vital for creating economicgrowth and social value. With thiscomes an expectation that the banktakes great responsibility for how itacts, to enable society to continue todevelop in a sustainable way.
Shareholders261,000 shareholdersThe capital provided by SEB’s sharehold-ers is a prerequisite for conducting thebank’s business. The shareholdersexpect a competitive and sustainablereturn on their capital. Many of the majorowners have a long-term perspective ontheir engagement in the bank.
ITand
data
Business
Meeting stakeholders’ expectations via SEB’s business model
Serv
ice
Stra
te
gy
SEB Annual Report 201816
Strategy Long-term value creation

For customersBy providing proactive advice and awide range of convenient services,SEB supports its customers’ long-term aspirations and adds value inall phases of life of individuals anddevelopment stages of companiesand institutions.See p. 18–23.
ResilienceFinancial strengthFinancial strength gives the resilience and flexibility required to serve customers in good times and bad. See p. 44.
GovernanceSolid corporate governanceCorporate governance is based on clear allocation of responsibility, a well devel-oped structure for internal control and owner involvement. See p. 52.
RiskSound risk cultureTo meet customers’ needs SEB assumes and manages risks. SEB knows its custo-mers well and risks are mitigated by prudence, risk awareness and expertise throughout the organisation. See p. 44.
Distribution offinancial valueSEK63bn for 2018
Interest paidto customers
SEK 18bn
Dividendspaid toshareholders
SEK 14bn
Salaries,pensions andbenefits toemployees
SEK 11bn
Paymentsto suppliers
SEK 10bn
Taxes andsocial charges
SEK 7bn
Regulatory fees
SEK 3bn
For employeesThe employees take part in, and value,the opportunities for learning andfurther development that are inte-grated in SEB’s business. Employeesalso participate in the many partner-ships that SEB supports to help commu-nities develop and prosper.See p. 26.
For society at largeSEB intermediates financial solutions,provides payment services and managesrisks, which together promote economicgrowth and prosperity. SEB pays taxesand fees according to local rules whereit operates. SEB takes responsibility asa provider of financing and as an assetmanager and works proactively withenvironmental, social and governanceissues.See p. 24.
For shareholdersDividends and potential increase inmarket value over time contributeto shareholders’ financial securityand enable new investments. SEB’scompetitiveness is increased andlong-term risks are reduced throughthe integration of environmental,social and governance aspects inbusiness operations.See p. 29.
Value creation based on trustBanks play a fundamental role in society by acting as an interme-diary providing, and advising on, a wide range of financing andsavings solutions, risk management and payment services. SEB’soperations impact – and is impacted by – customers, sharehold-ers, employees and society. Their trust is a prerequisite for SEB’slicense to operate. This is why the bank adapts to a changing envi-ronment, acts in accordance with expectations and regulations,
and provides services that are proactive, insightful, transparentand accessible on customers’ terms.
In addition, high ethical standards are being upheld internallyin order to maintain stakeholders’ trust. SEB’s code of conductand internal rules are in place supported by a culture based onopenness, business acumen and SEB’s core values.Read more about the Code of Conduct on p. 28 and on sebgroup.com
development
Risk
ResilienceG
overnance
creates sustainable value
SEB Annual Report 2018 17
Long-term value creation Strategy

CustomersCustomers demand both smart digital solutionsand personal meetings. They want a partner whois proactive, who provides a long-term perspective,and can offer objective advice in order for them toreach their ambitions.

Customer segments
Owing to the improved business climate, largecorporations in all segments increased their levelof activity during the year. Companies began in-creasing their investments in capacity and newtechnology. This resulted in an increase in credit
demand after several years at an unchanged level. The positivebusiness climate also led to demand for a wide range of ser-vices such as advice, trade finance and custody management.
Financial institutions were more active in 2018 in pacewith growing market volatility. Implementation of MiFID IIgave rise to a larger volume of transactions on electronicplatforms at the same time as greater transparency led togreater competition and stronger pressure on margins in themarket.
For small and medium-sized companies, the year wascharacterised by a high level of activity, and credit demand
increased both in Sweden and the Baltic countries. InSweden SEB continued to advance its position as a corpo-rate bank.
Household economies remained strong in the wake of thestrong economy and low interest rates. Customer activitywas high, and the use of digital services was rising both inSweden and the Baltic countries. In Sweden, 33,800 privateindividuals became customers in an entirely digital mannerduring the year, and nearly a third of all applications for mort-gage commitments were submitted digitally. In the Balticcountries a new version of the mobile app was launched,and the number of users increased by more than 50 per cent.Customers appreciate the possibility of obtaining advice viaweb-based video meetings, and more than a third of saleswere made via digital channels.
Customer activity 2018
Large corporationsSEB has an enduring and uniquely strongrelationship with large corporations inSweden and the other Nordic countries,where the bank has supported them intheir business and their internationalexpansion, and has stayed with them as apartner through both good times and bad.Today SEB serves some 2,300 largecorporations across a broad spectrum ofindustries. Most conduct extensive inter-national operations and many of them areglobal market leaders. In the Nordic coun-tries these companies are among the larg-est in their respective industries, while inGermany and the United Kingdom custom-ers range from the mid-corp segment up tomultinational corporations.
Readmoreon page 20
Small and medium-sized companiesSEB has an established position as thebank for entrepreneurs and small businessowners, and currently serves some400,000 small and medium-sized compa-nies in all. Of these, 166,000 are home bankcustomers in Sweden and 101,000 in theBaltic countries. The segment includesapproximately 650 mid-corp, many withinternational operations, and public sectorcustomers in Sweden such as governmentagencies, state-owned companies andmunicipalities.
Readmoreon page 22
Financial institutionsSEB serves some 700 financial institu-tions, comprising a broad spectrum ofpension and asset managers, hedge funds,insurance companies, state-owned invest-ment funds and other banks. Customersrange from Nordic actors to global institu-tions seeking Nordic exposures.
Readmoreon page 21
Private individualsSEB is one of the major banks in Sweden,Estonia, Latvia and Lithuania. In SwedenSEB has a solid reputation and is one of themarket leaders in private banking. In col-laboration with its corporate customerbusiness in the Nordic countries, Germanyand the United Kingdom, SEB has estab-lished private banking operations in thesecountries.
In total SEB has approximately 4 millionprivate customers in Sweden and the Balticcountries. Of these 489,000 are home bankcustomers in Sweden and 950,000 in theBaltic countries. In private banking SEB hasapproximately 35,000 customers.
Readmoreon page 23
SEB Annual Report 2018 19
Customer segments Customers

Largecorporations
Large corporations are in need of a bank with a long-termperspective that can serve as a partner and support themon their journey of growth. They expect smooth systemsolutions and proactive, value-creating advice.
Easy-to-use integrated servicesSEB has for many years built integratedsolutions that allow large corporates tomanage and automate payments, accountreporting and reconciliations directly intheir business systems instead of via thebank’s internet service C&I Online. Thisdevelopment is continuing at an acceler-ated pace with the emergence of OpenBanking, which is creating new opportuni-ties to gather customer data from variousactors in consolidated services.
One example of product developmentin this area is Advanced Analytics, a ser-vice that is imbedded in C&I Online. It isan easy-to-use and flexible service withfunctions for trend analysis, simulations,searches and data mining, where custom-ers can, for example, combine data fromaccounts they have with SEB with datafrom accounts they have with otherbanks.
Green financingThe sustainability perspective– mani-fested in sector policies and positionstatements, among other things – haslong been an integral part of SEB’s creditprocess and continuing dialogue withcorporate customers.
SEB has been one of the key playersbehind the emergence of the market forgreen bonds, an investment form thatcombines favourable returns with docu-mented environmental benefits. The mar-ket for green financing solutions is grow-
ing, and in 2018 SEB participated asadviser and arranger when the propertycompany Vasakronan was first in theworld to issue a green certificate forfinancing of defined green assets.
In 2017 SEB issued its own green bond ofSEK 4.9bn, which has been used to providegreen loans to customers for environmentalinvestments such as in renewable energy,sustainable forestry, green buildings andclean transports in Sweden, Norway andFinland.
Corporate transactionsLarge corporates appreciate SEB’s special-ised business and advisory services inconnection with mergers and acquisitionand other corporate finance activities. In2018 the bank facilitated 19 mergers andacquisitions and 24 equity capital markettransactions in the Nordic countries. For
example, SEB was contracted as solefinancial adviser when the Norwegianfurniture group Ekornes was acquired bythe furniture maker Qumei. SEB was alsofinancial adviser in Atlas Copco’s spin-offof Epiroc.
Advice on digital businessDuring 2018 SEB established a corporatefinance function specialising in advice ondigital business models and strategies. Bybuilding up cutting-edge competence onnew high-tech companies with businessmodels based on digital technology, SEBcan increase the relevance of its strategicdialogues with large corporations.
Our needs and prefer-ences are at the top of
SEB’s list of priorities.”
Kion is Europe’s largest manufacturer ofindustrial trucks and forklifts and a lead-ing provider of logistics solutions forfactories, warehouses and distributioncentres.
With operations on six continents,Kion has a need for several banks, butSEB is the group’s core bank providingfinancing solutions, cash management inthe Nordic countries, and various typesof derivative services coupled to cur-rency management.
“What’s most important in a bankingrelationship is that the bank has a long-term commitment, not least when itcomes to financing. You must be able totrust that the bank will be there for youover the years. I feel we are importantfor the bank and that our needs and pref-erences are at the top of their prioritieslist. It’s reassuring”, says Dirk Baltzer.
Read more on sebgroup.com
Meetoneof our customers
KionGroupDirk BaltzerSenior Director Corporate Treasury
SEB’s position statementsand sector policies
See sebgroup.com/about-seb/sustainability
Arms and DefenceSector policy
Policy for the SEB GroupDerived from the Instruction for thePresident and Chief Executive Officer.
Adopted by the President and Chief Executive Officer of Skandinaviska Enskilda Banken AB (publ) on 20 August 2014
Mining and MetalsSector policy
Statement for the SEB GroupDerived from the Instruction for thePresident and Chief Executive Officer.
Adopted by the President and Chief Executive Officer of Skandinaviska Enskilda Banken AB (publ) on 18 February 2011
Renewable EnergySector policy
Statement for the SEB GroupDerived from the Instruction for thePresident and Chief Executive Officer.
Adopted by the President and Chief Executive Officer of Skandinaviska Enskilda Banken AB (publ) on 20 August 2014ShippingSector policy
Adopted by the President and Chief Executive Officer of Skandinaviska Enskilda Banken AB (publ) on 18 February 2011
Statement for the SEB GroupDerived from the Instruction for thePresident and Chief Executive Officer.
Adopted by the President and Chief Executive Officer of Skandinaviska Enskilda Banken AB (publ) on 18 February 2011
ForestrySector policy
Statement for the SEB GroupDerived from the Instruction for thePresident and Chief Executive Officer.
Adopted by the President and Chief Executive Officer of Skandinaviska Enskilda Banken AB (publ) on 18 February 2011
Fossil FuelSector policy
Statement for the SEB GroupDerived from the Instruction for thePresident and Chief Executive Officer.
Adopted by the President and Chief Executive Officer of Skandinaviska Enskilda Banken AB (publ) on 18 February 2011Adopted by the President and Chief Executive Officer of Skandinaviska Enskilda Banken AB (publ) on 18 February 2011
Statement for the SEB GroupDerived from the Instruction for thePresident and Chief Executive Officer.
FreshwaterPosition statement
Adopted by the President and Chief Executive Officer of Skandinaviska Enskilda Banken AB (publ) on 18 February 2011
Adopted by the President and Chief Executive Officer of Skandinaviska Enskilda Banken AB (publ) on 18 February 2011Adopted by the President and Chief Executive Officer of Skandinaviska Enskilda Banken AB (publ) on 18 February 2011
Child LabourPosition statement
Statement for the SEB GroupDerived from the Instruction for thePresident and Chief Executive Officer.
Adopted by the President and Chief Executive Officer of Skandinaviska Enskilda Banken AB (publ) on 18 February 2011
Adopted by the President and Chief Executive Officer of Skandinaviska Enskilda Banken AB (publ) on 18 February 2011Adopted by the President and Chief Executive Officer of Skandinaviska Enskilda Banken AB (publ) on 18 February 2011
Statement for the SEB Group.Derived from the Instruction for thePresident and Chief Executive Officer.
Climate ChangePosition statement
AdoptedAdopted by by the the President President and and Chief Chief Executive Executive Officer Officer of of Skandinaviska Skandinaviska Enskilda Enskilda Banken Banken AB AB (publ) (publ) on on 6 6 November November 2015. 2015.
SEB Annual Report 201820
Customers Large corporations

Financialinstitutions
Financial institutions have a need for accessibility, delivery,customised advice, sustainable investment alternatives andeffective financial infrastructure.
Growth for InvestorWorldDuring the year SEB successfully rolledout its Investor World concept on the mar-ket. It consists of, among other things, aglobal custody services platform that hasbeen created in partnership with theUS-based financial services firm BrownBrothers Harriman. Customers are offeredSEB’s services from a new technical plat-form, giving them greater opportunitiesboth from service and technology per-spectives. In 2018 more than 30 custom-ers chose to switch to this platform, ofwhich the ten largest customers in globalcustody services.
Within the Investor World frameworkSEB offers a range of services that supportthe investment process regardless of assetclass. Customers gain access to clearing
for derivatives, collateral management,risk and appraisal services, and adminis-trative back office services. Togetherwith a comprehensive offering in currencytrading, cash management and corporatetransactions, financial institutions canthereby focus on their core businessesof creating value for their customers.
Through Investor World SEB hasadvanced its positions among all institu-tional customers in the Nordic countries.
Sustainable investmentsFinancial institutions are showing a dis-tinctly keener interest in sustainability, asevidenced by higher demand for sustaina-ble investment alternatives and advicesurrounding sustainability-related issues.SEB has a well-established position in thisarea and was one of the first banks in theworld to include sustainability aspects inits asset management.
Interest is also growing for other typesof investments that can help solve globalsociety challenges and social problems.
Financial institutions have shown greatinterest in SEB’s microfinance funds,which funnel capital to small businessowners in developing countries, who donot have access to the traditional bankingsystem. Since 2013 SEB has launched sixmicrofinance funds with combined capitalof close to SEK 7bn that works for the ben-efit of more than 23 million small businessowners in developing countries.
Confident and happycustomers are created
through a long-term approachand high efficiency. We arevery pleased with SEB andgreatly value our relation.”
Alecta is a mutual occupational pensioncompany providing services for manyofficials and companies in Sweden.
The focus is on creating long-term sus-tainable pensions through good returnsand efficient management. Sustainabil-ity is an integral part of the business,due to customer demand and as animportant part of risk management.
Alecta has a long-term banking rela-tionship with SEB, where it primarilyuses capital market services and cashmanagement. Since 1948, the companyhas also been an owner of SEB.
Read more on sebgroup.com
Meetoneof our customers
AlectaMagnusBilling, CEO
SEB Annual Report 2018 21
Financial institutions Customers

Small andmedium-sizedcompanies
We feel that SEB is atthe forefront when it
comes to sustainability, whichis important for us since wework with sustainabilityacross our entire value chain.”
BioGaia is a research-based healthcarecompany that develops probiotic dietarysupplements, that is, products thatcontain living micro-organisms withclinically proven health benefits. BioGaiahas 130 employees, holds 440 patents,and sells its products in 100 markets.
BioGaia has relied on SEB as its homebank since 2016 to manage paymentflows, for currency hedging and foranalysis services.
“Banks’ services are virtually identi-cal, so personal relationships are impor-tant. We think SEB are professional, theyoffer a high level of service and theyoffer interesting seminars and talks”,says Margareta Hagman.
Read more on sebgroup.com
Meetoneof our customers
BioGaiaABIsabelle Ducellier, CEOMargaretaHagman, CFO
Small and medium-sized companies are looking forproactivity and engagement, and they want convenientdigital solutions that are accessible in the channels oftheir choosing.
Support to growth companiesIn Sweden SEB continued developing itsGreenhouse concept, which provides aholistic solution for supporting growthcompanies. This is done by providingsupport and advice both from the bank’sown experts and from selected businesspartners. The concept consists ofeverything from wide-ranging seminars tocustomised programmes. Through Green-house and the bank’s collaboration withorganisations in all steps of the entrepre-neur staircase (see p. 25), SEB continuesto strengthen its position as the bank ofchoice for entrepreneurs.
Comprehensive coverSEB is one of the few actors that offersa combination of traditional bankingservices and comprehensive insurancecover for small business owners. Thisincludes services for their employees’needs for financial security and pensionsolutions as well as for a prompt return towork following an illness. SEB also helpssmall business owners to plan for theirpensions and offers health insuranceplans that can give small business ownersthe same level of protection as employeesof larger organisations.
Open Banking creating new servicesThe trend towards Open Banking entailsthat over time banking services will beaccessible and possible to integrate withother actors’ systems and channels –regardless of whether they are banks orentirely different kinds of companies. Inthe same way, banks will be able to inte-grate others’ services in their channels.This trend is noticeable in many ways. Forexample, during the year SEB’s developerportal was made accessible for externalusers. The portal features Application Pro-gramming Interfaces (APIs), which arestandardised communication protocolsthat are coupled to payment and accountinformation from SEB.
SEB is also working actively on buildingintegration with vendors of businesssystems as well as bookkeeping andpayroll services firms. These types ofsolutions make it possible for companiesto use automation to make payments,reconcile accounts and conduct book-keeping at one and the same location,either in their own business systems orthrough their bookkeeping and payrollservices firms. SEB has since previouslyestablished integration with VismaAutoplay, and in 2018 the bank enteredinto partnerships with Capcito andPE Accounting.
Digital servicesCompanies are in search of a greater offer-ing of proactive and digital services andautomated solutions. During the year SEBmade it possible to digitally sign for arounda dozen products via the corporate inter-net bank. During the year, a pilot for a digi-tal new-customer process was initiated,which enables a simple onboardingprocess and enhances customer experi-ence, while ensuring that the bank is incompliance with know-your-customerand anti-money laundering regulations.
SEB Annual Report 201822
Customers Small and medium-sized companies

Privateindividuals
Private individuals want digital solutions that make everydaylife easier. They want to be acknowledged and understood,and they expect custom-tailored, personalised advice indigital channels as well as in face-to-face meetings.
Personal and digital adviceIn 2018 SEB launched a digital advice toolthat gives customers the opportunity toobtain a diagnosis of their personal econo-mies. In contrast with most competitors,SEB uses a function that draws on thecustomer’s total financial situation andnot only an investment perspective.
The diagnosis is based on a number ofquestions that the customer answersalong with automatically retrieved infor-mation about the customer’s assets and
liabilities with SEB. On the basis of thisinformation, advice is provided accordingto a priority of factors. For some custom-ers the advice is to start risk-based saving,while others are advised to first considertheir debt or build up a savings buffer tobe able to manage unforeseen events.The advice provided digitally is savedin the bank’s customer system, so thatadvisers can continue the dialogue at aphysical meeting based on this.
Green investmentsAmong private individuals there is alsoclearly a growing interest in sustainability,as evidenced by strong growth in thebank’s sustainability funds, among otherthings. In 2018 SEB was the first bank inSweden to launch green mortgages, whichoffer a lower interest rate for people wholive in climate-smart houses. Theseinclude homes that meet the SwedishNational Board of Housing, Building andPlanning’s energy classification criteria,homes with the Nordic Swan ecolabel,Sweden Green Building Council certifica-tion, and passive house certification.
Homemortgagemarket developmentSeveral factors contributed to a weaken-ing in the Swedish housing market duringthe year. New regulations, such as newamortisation requirements, made it diffi-cult for customers to borrow more thanfour and a half times their annual incomes.Expectations for higher interest rates fromRiksbanken have prompted customers tolock in a larger share of their mortgages atfixed rates. Competition from new actorswith niche offerings increased somewhat.
Managing crucial steps in lifeAside from digital tools, customers also value theability to meet competent and engaged advisersface to face. SEB continues to develop its branchesas meeting places with extended office hours andgenerous space for meetings and events.
In 2018 the bank also launched a holistic advisoryconcept based on customers’ important life events.Using pedagogic methods SEB offers advice andtools for managing crucial steps in life such as mov-ing in with a partner, getting married, and havingchildren. The bank’s financial advice in these areasis an integrated part of customers’ everyday livesand day-to-day situations.
I really like my adviser.She is pleasant and
helpful, and always tries tofind the best solution for me.”
Marje Michalski works as a financialmanager at a dental clinic in Tallinn. Shehas been an SEB customer since 2000.Marje uses the internet bank to manageher daily finances, and she has her homemortgage, debit card, mutual funds andpension savings with SEB.
“I like the possibility to round off cardpurchases upward and have the differ-ence going into my Digital Coin Jar1). It’s aconvenient way of saving without havingto think about it.”
1) A form of savings account offered to SEB’sBaltic customers.
Meetoneof our customers
MarjeMichalskiPrivate customer at SEB inTallinn, Estonia
SEB Annual Report 2018 23
Private customers Customers

SEB in societySEB is an integral part of society and wants to empowerfuture generations. The bank is promoting entrepreneurshipand innovation while contributing to a sustainable economy.The bank also works for financial literacy and social inclusion.

Banks play a key role in socie-ty’s infrastructure and areinstrumental in contributingto economic growth andsocial values. SEB assistshouseholds, entrepreneurs
and businesses with financing, invest-ments, payments and savings, therebypromoting economic development,growth, new jobs and international trade,and contributing to financial security.
Since its start SEB has been driven by anaspiration to connect ideas, people andcapital. As an example, the bank has longpartnered with a number of entrepreneur-ship organisations that support businessowners at various levels – from new smallbusinesses via Junior Achievement (UngFöretagsamhet) and Venture Cup, to theentrepreneurial elites recognised in theEntrepreneur of the Year awards.
In 2018 the bank began a collaborationwith Base10, a start-up hub where techcompanies can meet with aspiring entre-preneurs. During the year SEB also ran anEntrepreneur Camp, a summer initiativewhere teens could attend presentationson company law and private finance, andget advice and inspiration from businessangels, mental coaches and rhetoricexperts. In the Baltic countries SEB runseAcadeemia, a web-based platform fornewly started companies and entrepre-neurs. It offers practical tips, tools forimplementing ideas, and recommendationsfrom established small business ownersfor achieving success. The platform had115,000 page visits during the year.
MentorSince 1997 SEB has partnered withMentor, an organisation dedicated tobuilding relationships and trust betweenyoung people and adults. Through Mentor,SEB’s employees can support young teensand contribute to society while at thesame time working on their own personaldevelopment and leadership skills. During2018 a total of 6,944 youths met with 159SEB employees in the Mentor programme.
Supporting social entrepreneursSocial entrepreneurs play an ever moreimportant role in societies where socialand economic gaps as well as inequality
are growing. SEB collaborates with Inklud-era, an umbrella organisation for socialentrepreneurs that provides supportto groups in society who are at risk ofexclusion.
Expand financial literacySEB strives to support young people insociety to make informed financial deci-sions. The bank sponsors Ungdomar.se,one of Sweden’s largest digital meetingplaces for young people aged 13 to 25. TheWe Change tour is an initiative that inspiresand includes young people in societaldevelopment and helps them find solutionsthat contribute to achievement of the UN’sSustainable Development Goals.
In 2018 SEB participated in several loca-tions in Sweden, among other things byhelping to build up young people’s financialliteracy and demonstrating tools for reduc-ing inequality in Sweden and the world.
In the Baltic countries SEB has for manyyears arranged a Financial Literacy Road-show, where SEB employees have visitedschools with the aim of increasing youngpeople’s financial literacy. During the lastthree years more than 20,000 youths havegained better knowledge about salariesand taxes, budgeting and long-termsavings while gaining inspiration for thefuture. In 2018 some 400 employeeshave run the training for 6,500 youths.
Sustainable communitiesThe UN’s global goals ensure ever-greaterfocus on sustainable development.Climate change is one of today’s mostimportant challenges. SEB recognises theimportance of working actively to reduceenvironmental impact and carbon foot-print. SEB has an indirect impact throughits lending and asset management activi-ties, and in these areas SEB is developingproducts and ways of working to addressthese challenges. The bank is working tomitigate its direct impacts primarily byfurther reducing emissions related to busi-ness travel as well as reducing its ownenergy and paper consumption.Readmore in the Sustainability Report, p. 67.
SEB’s entrepreneurial staircase
Based on her experiences as a social worker, MoaGürbüzer created the best-selling non-alcoholicsparkling wine in Sweden. She was named Settlerof the year 2016 and the female rising star in west-ern Sweden, in the competition Entrepreneur ofthe year 2018.
• Entrepreneur of the year• The Golden Gavel• Settler of the year
• Junior Achievement • Prince Daniel’s Fellowship
• Venture Cup • Business Challenge
• Enterprise agencies • Startup Sthlm • Uppstart Malmö
Praise
• SUP46 • YEoS • Connect
• Inkludera • Base10 • Minc • E-Commerce Park
Grow
Develop
Start
Plan
Inspire
SEB Annual Report 2018 25
Society Stakeholders

Towork at SEB is to be a positive force in society by virtueof helping customers achieve their goals. As an employerSEB will always support people with aspirations, and thebank firmly believes that diversity and inclusion aredecisive for success.
SEB’semployees
Employee event at the Arenastaden office forpresentation of the new three-year BusinessPlan 2019–2021.

SEB Annual Report 2018 27
Employees Stakeholders
The annual employee survey, Insight, shows thatthe bank’s employees are engaged and motivated.Insight also shows that employees understand andare inspired by the bank’s vision, and that they feelinvolved in decisions that affect them. The KPIs for
employee engagement and performance excellence were athistorically high levels and are high compared with the bank’speers in the international financial sector.
Workingmethods for business developmentThe methods for driving business development are based toa growing extent on cross-functional teams, transparency andtime-efficient processes. The customer journey – a methodi-cal analysis of the customer’s needs and experiences with thebank – forms the basis for this development. To engage moreand more employees to embrace new methods in their work,SEB offers internal training and inspirational initiatives likeThe Buzz, where more than 1,000 employees were invited tospend a full day learning more about and testing differentways of working in the area of agile methods.
AndraAltoa
WhySEB:SEB is a model of innovative thinking. Our commitment to innova-tion is not only appreciated by customers and employees, it isalso a source of inspiration for other companies and sectors.My personal interest in ground-breaking innovation makes SEBa great place to work.
The best thing aboutmy job:My personal development is in constant motion. There is nevera quiet moment, and I’m constantly faced with a challenge inwhich my own initiatives are appreciated.
Mysource of inspiration:There are many talented people at SEB who I’m inspired by.And then my internal curiosity is a source of inspiration thatgives me courage to challenge and to change.
Viktor Sjöberg
WhySEB:SEB offers an opportunity to go on a transformation journey in alarge organisation and in an industry in which a lot is happeningright now. On top of this I’m a strong believer in SEB’s sustainabil-ity work and entrepreneurial spirit.
The best thing aboutmy job:Working together with customers to create the bank and meetingplace of the future. Customers come to the Experience Center notonly for assistance, but also to be inspired.
Mysource of inspiration:The feedback we receive from customers, event attendees,entrepreneurs and colleagues, who confirm that we are on theright path toward the future.
Transformative and inclusive leadership
SEB’s management philosophy is designed to preparemanagers to lead in a complex and rapidly changingworld. An important role for leaders involves buildingwell-functioning teams, which requires the capability tolisten in an empathetic way. Focus is on driving change,promoting innovation and ensuring that the corporateculture reflects the bank’s values, vision and purpose.
To better understand each other and to meet custom-ers’ needs, SEB fosters diversity and an inclusive cultureat all levels of the bank. During the year a new managerrole was created with responsibility for driving theseissues.
SEB undertakes to:• Foster an inclusive, value-driven culture in which
employees feel valued, respected and involved irre-spective of who they are, what they believe in, andwhere they come from
• Enable learning about inclusion and diversity, includingaddressing unconscious bias and fostering inclusiveleadership
• Increase diversity in teams
• Actively appoint more women to key leadership roles
• Recruit, develop and promote employees with an inter-national background
• Ensure that SEB’s teams and management groups arebalanced with respect to gender, age, competencesand geographical backgrounds.
Meet Andra and Viktor
Age:43
Role:Head of Strategyand Customer Insight,SEB Baltic Division
Works for SEB since:2007
Age:26
Role:Co-worker at theExperience Center in Stockholm
Works for SEB since:2015

SEB Annual Report 201828
Stakeholders Employees
economics students and now also usesinteractivity and new formats such asarranging hackathons and knowledge-sharing seminars. In addition, SEB worksactively with its talent programmes,where the IT programme for young talentshas now celebrated 10 years. This conceptcontinues to be relatively unique in themarket, and to date more than 100 special-ists in technology and IT have joined thebank via this channel.
To ensure that it nurtures relationshipswith talented individuals already em-ployed by the bank, SEB uses its GlobalTalent Review programme, which involvesa yearly review to identify individuals withfuture potential for a key role or manage-ment position. More than 10 per cent ofemployees are included in this talent pooland are considered for review, whereamong other things they get an opportu-nity to broaden their networks by partici-pating in various development projectsoutside of their ordinary units.
Labour law and unionsSEB’s employees are covered by collectiveor local agreements. SEB has a Europeanworks council with representatives fromall EU and EES countries in which the bankis represented.
Learning for the futureThe pace of change in society is constantlyaccelerating. This applies also for the typeof competences that are needed for thebank to continue to be successful. Towardthis end, every year SEB conducts strate-gic planning of future needs in which everybusiness unit identifies future key compe-tences, identifies development needs forexisting roles, and conducts successionplanning. The results are then used todesign internal training and for recruit-ment.
SEB’s philosophy is that competencedevelopment is achieved above allthrough continuous learning in the dailywork and through collaboration with oth-ers. This is complemented with trainingactivities for a large share of employees.One such initiative is Boost your service,where the purpose is to support and giveemployees tools on their journey towardSEB’s vision of providing world-class ser-vice. SEB’s employees are also offered acourse catalogue for both internal andexternal training. During the year the bankentered into several partnerships where,for example, instruction in service designis conducted in collaboration with theStockholm School of Economics.
The search for competenceSEB has a strong employer brand accord-ing to annual rankings conducted amongstudents and young professionals. In pacewith the ongoing competence shift andgrowing recruitment need in new com-petence areas, the bank is working onstrengthening its attractiveness amongtalents who are targeted by IT companiesand tech start-ups. Today SEB hasexpanded its reach beyond participationat traditional recruitment fairs for
Employee statistics2018 2017 2016
Employees, averagefull-time equivalents 14,751 14,946 15,279
Employees, average 15,683 15,946 16,260
Sweden 7,972 8,053 8,222
Other Nordiccountries 1,121 1,304 1,369
Baltic countries 5,348 5,213 5,125
Other countries 1,243 1,376 1,544
Employees at year-end 15,562 15,804 16,087
Employee turnover, % 12.9 12.8 10.7
Sick leave, %(in Sweden) 2.9 2.9 3.0
Female managers, % 45 47 46
Insight
Employeeengagement 79 77 77
Performanceexcellence 82 81 81
Health andwork environment
SEB works long term and preventivelyto offer a safe and sound workplacein an effort to ensure employee well-being and a healthy work/life balance.
In Sweden, SEB’s level of sick leaveremains low, at 2.9 per cent, com-pared with other industries as well asthe financial sector. In the employeesurvey, Insight, SEB’s index for healthand work environment was nearly10 percentage points higher than theindustry average.
At the bank’s new offices in Arena-staden, the existing fitness centerwas expanded during the year with agym and spinning room, and in theemployee canteens a wide range ofhealthy dishes are always offered.It should be easy to live a healthylife at SEB.
SEB’s core values serve as the foun-dation for the bank’s ways of workingand culture. In combination with thebank’s vision – to deliver world-classservice – they serve to motivate andinspire employees, managers and theorganisation as a whole. These valuesare described in SEB’s Code of Conduct,which provides guidance on ethicalmatters for all employees.
Customers firstWe put our customers’ needs first,always seeking to understand howto deliver real value.
CommitmentWe are personally dedicated to thesuccess of our customers and areaccountable for our actions.
CollaborationWe achieve more working together.
SimplicityWe strive to simplify what is complex.
Read the Code of Conduct onsebgroup.com
SEB’s core values

Share capitalSEB’s share capital amounts to SEK 21,942m distributed on2,194.2 million shares. Each Class A share entitles the holderto one vote and each Class C share to 1/10 of a vote.
Stock exchange tradingThe SEB shares are listed on Nasdaq Stockholm, but are alsotraded on other exchanges.
Compared to year-end 2017 the value of the SEB Class Ashare decreased by 11 per cent. The OMX Stockholm 30 Index(OMXS30) decreased at the same rate while the MSCI EuropeBanks Index decreased by 27 per cent. Total turnover in SEBshares in 2018 was SEK 324bn (312) of which SEK 139bn (124)on Nasdaq Stockholm. Market capitalisation by year-end wasSEK 189bn (211). The share is part of the Dow Jones SustainabilityIndex and the FTSE4Good Index, which facilitate investments incompanies which are globally recognised for their corporateresponsibility.
Dividend policySEB strives to achieve long-term dividend growth without nega-tively impacting the fulfilment of the group’s capital targets.The annual dividend per share shall correspond to 40 per cent ormore of earnings per share. Each year’s dividend is assessed in thelight of prevailing economic conditions and the group’s earnings,growth possibilities, regulatory requirements and capital position.
Proposed dividend for 2018The Board of Directors proposes to the Annual General Meetingan ordinary dividend of SEK 6.00 per Class A and Class C share,which corresponds to a 56 per cent dividend payout ratio.Further, the Board of Directors proposes an extraordinarydividend of SEK 0.50 per Class A and Class C share. Thus theproposed dividend amounts to SEK 6.50 per Class A and Class Cshare, which corresponds to a 61 per cent dividend payout ratio.The proposed record date for the dividend is 28 March 2019.If the Annual General Meeting resolves in accordance with theproposal, the share will be traded ex-dividend on 27 March 2019and dividend payments will be disbursed on 2 April 2019.
Shareholdersand the SEB shareThe closing price of the SEB Class A sharewas SEK 86.10 (96.30). The share pricedecreased in line with the development of the OMX Stockholm 30 Index (OMXS30) in2018. Earnings per share amounted to SEK 10.69 (7.47). The Board proposes an ordinarydividend of SEK 6.00 and an extraordinary dividend of SEK 0.50 per share for 2018.
Trading in SEB Class A-shares
By type of trading, per cent By stock exchange, per cent
Number of outstanding shares 31 December 2018
ShareClass A
ShareClass C
Total no. ofshares
Total numberof issued shares 2,170,019,294 24,152,508 2,194,171,802
Repurchased own sharesfor equity-basedprogrammes 1) –30,276,332 0 –30,276,332
Repurchased ownshares for capitalpurposes 2) 0 0 0
Total number ofoutstanding shares 2,139,742,962 24,152,508 2,163,895,470
1) Utilisation of authorisation from the Annual General Meeting 2018 toacquire own shares for the equity-based programmes.
2) 2018 AGM decision, no repurchases made.
Distribution of shares by size of holding
Size of holding No. of shares Per centNo. of
shareholders
1 – 500 31,004,695 1.4 167,766
501 – 1,000 30,557,642 1.4 39,987
1,001 – 5,000 96,755,424 4.4 43,837
5,001 – 10,000 41,475,196 1.9 5,798
10,001 – 20,000 32,069,047 1.5 2,291
20,001 – 50,000 33,051,214 1.5 1,060
50,001 – 100,000 19,980,793 0.9 278
100,001 – 500,000 57,159,865 2.6 256
500,001 – 1,000,000 45,106,063 2.1 62
1,000,001 – 1,807,011,863 82.4 111
2,194,171,802 100.0 261,446Source: Euroclear and Holdings
2018 2017
Traditional trading 57 56
Off-book 18 37
Anonymous trades 2 5
Other 23 2
Source: Fidessa
2018 2017
Nasdaq Stockholm 39 40
Chicago Board ofExchange 48 36
London StockExchange 7 9
Turquoise 3 4
Other 3 11
SEB Annual Report 2018 29
Shareholders and the SEB share Stakeholders

Shareholder structure Per cent
Percentage holdings of equity on 31 December 2018
The largest shareholders 31 December 2018
No. of shares
Of whichClass Cshares
Share ofcapital %
Shareof votes %
2018 2017
Investor AB 456,198,927 4,000,372 20.8 20.8 20.8
Alecta 153,952,500 7.0 7.1 6.5
Trygg Foundation 114,673,802 5.2 5.3 5.3
Swedbank RoburFunds 92,984,015 4.2 4.3 4.7
AMF 88,173,815 4.0 4.1 3.6
BlackRock 52,164,287 2.4 2.4 2.1
SEB Funds 34,201,886 1.6 1.6 1.5
SEB own shareholding1) 30,276,332 1.4 1.4 1.2
Nordea Funds 27,148,008 1.2 1.2 1.2
Vanguard 26,060,775 71,784 1.2 1.2 1.2
XACT Funds 25,321,316 1.2 1.2 1.1
Fourth SwedishNational Pension Fund 23,447,866 1.1 1.1 1.2
First Swedish NationalPension Fund 21,662,731 1.0 1.0 1.0
Didner & Gerge Funds 18,678,843 0.9 0.9 0.9
AFA Insurance 16,730,016 0.8 0.8 0.7
1)See table Number of outstanding shares on p. 29
Source: Euroclear and HoldingsDifferent voting power of class A shares (voting power 1) compared to C shares(voting power 0.1) gives minor differences in share of votes vs. share of capital.
Market capitalisation SEK m
2018 2017 2016 2015 2014
Year-end marketcapitalisation 1) 188,925 211,293 209,645 194,146 218,384
Volume of sharestraded 2) 139,134 123,889 133,790 142,188 113,566
1) Based on Nasdaq Stockholm share price of SEK 86.10 forClass A-shares and SEK 86.40 for Class C-shares.
2) Shares traded at Nasdaq Stockholm.
Changes in share capital
Year Transaction SEK
Change innumber of
shares
Accumulatednumber of
issued shares
SharecapitalSEK m
1972 5,430,900 543
1975 Rights issue 1:5 125 1,086,180 6,517,080 652
1976 Rights issue 1:6 140 1,086,180 7,603,260 760
1977 Split 2:1 7,603,260 15,206,520 760
1981 Rights issue 1B:10 110 1,520,652 16,727,172 837
1982 Bonus issue 1A:5 3,345,434 20,072,606 1,004
1983 Rights issue 1A:5 160 4,014,521 24,087,127 1,204
1984 Split 5:1 96,348,508 120,435,635 1,204
1986 Rights issue 1A:15 1) 90 8,029,042 128,464,677 1,284
1989 Bonus issue 9A+1C:10 128,464,677 256,929,354 2,569
1990 Directed issue 2) 88.42 6,530,310 263,459,664 2,635
1993 Rights issue 1:1 20 263,459,664 526,919,328 5,269
1994 Conversion 59,001 526,978,329 5,270
1997 Non-cash issue 91.30 61,267,733 588,246,062 5,882
1999 Rights Issue 1:5 3) 35 116,311,618 704,557,680 7,046
2005 Reduction of theshare capital –17,401,049 687,156,631 6,872
2009 Rights issue 11:5 10 1,507,015,171 2,194,171,802 21,942
1) The recorded share capital as of 31 December 1986 was SEK 1,204m sincethe proceeds from the rights issue were not paid in full until early 1987.
2) The issue was directed at the member banks of Scandinavian BankingPartners.
3) Subscribed and paid shares were not registered as share capital in thebalance sheet until the rights issue had been registered which took placein January 2000.
Through splits in 1977 (2:1) and 1984 (5:1). the nominal value of the shareswas changed from SEK 100 to SEK 10.
The majority of the banks 261,400 shareholders are private individualswith small holdings. The ten largest shareholders account for 49 percent of capital and votes.Source: Euroclear and Holdings
Swedish shareholders 74
Institutions and foundations 63
Private individuals 11
Foreign shareholders 26
Data per share2018 2017 2016 2015 2014
Basic earnings, SEK 10.69 7.47 4.88 7.57 8.79
Diluted earnings, SEK 10.63 7.44 4.85 7.53 8.73
Shareholders’ equity, SEK 68.76 65.18 65.00 65.11 61.47
Net worth, SEK 74.74 73.60 73.00 72.09 68.13
Net expected credit losses 1), SEK 0.54 0.37 0.46 0.40 0.06
Dividend per A andC share, SEK 6.502) 5.75 5.50 5.25 4.75
Year-end share price 3), SEK
per Class A share 86.10 96.30 95.55 89.40 99.55
per Class C share 86.40 96.05 95.20 88.85 97.65
Highest price paid 3), SEK
per Class A share 102.70 109.00 99.75 111.50 100.60
per Class C share 103.60 109.90 101.10 112.50 99.10
Lowest price paid 3), SEK
per Class A share 79.16 94.05 67.75 83.45 82.25
per Class C share 80.50 95.15 70.35 83.75 77.45
Dividend as a percentage ofearnings (payout ratio),% 60.8 77.0 112.8 69.4 54.0
Dividend yield, % 7.5 6.0 5.8 5.9 4.8
P/E (share price atyear-end/earnings) 8.1 12.9 19.6 11.8 11.3
Number of outstandingshares, million
average 2,164.4 2,167.6 2,177.6 2,191.2 2,186.8
at year-end 2,163.9 2,167.0 2,169.0 2,193.3 2,188.7
1) 2018: Net ECL level based on IFRS 9 expected loss model.2014–2017: Credit loss level based on IAS 39 incurred loss model.
2) As proposed by the Board of Directors an ordinary dividend of SEK 6.00per share and an extraordinary dividend of SEK 0.50 per share.
3) Source: Nasdaq Stockholm.
SEB Annual Report 201830
Stakeholders Shareholders and the SEB share

Ownerwith a long-term perspectiveSEB is one of the core investments of Investor AB, the largestindustrial holding company in Northern Europe. As a long-term,engaged owner, Investor exercises its influence through theBoard of Directors. The Board of Directors’ prioritises a balancebetween risk and return and regulatory compliance enforcement.Additionally, the Board’s view on operations extends acrossseveral business cycles ensuring that the bank’s strategic posi-tion and profitability are maintained and that financing is securedalso in more difficult times. Further, the long-term perspectiverepresented by Investor ensures that the bank’s vision and strat-egy are upheld at times of organisational or management change.
Unique customer baseAround 70 per cent of SEB’s corporate customers operate on aglobal basis. Since global growth is expected to be about twicethe growth of Sweden over time, this provides an opportunity forhigher growth for SEB compared to banks with more domesticexposures. The global economy is also more diversified than inSweden, which means that over time credit risk is expected tobe lower, all else equal.
In the customer segment private individuals in Sweden, SEB’smarket share is around 15 per cent. However, in metropolitanareas where growth and disposable income is higher, the corre-sponding market share is almost 25 per cent. This customer seg-ment is in greater need of such savings and pension products thatare provided by SEB.
Return on investmentThe return on an investment in SEB depends on both the shareprice development and the dividend. In 2018, SEB’s share pricedropped by 11 per cent while the dividend increased and the totalshareholder return (TSR), i.e. share price development andreinvested dividends per share, was –5 per cent for 2018 (6).The average TSR for the Nordic peer group was –14 per cent (6)in 2018. Over the past five years, TSR for the SEB share has been6 per cent on average.
SEB’s Board of Directors has proposed to the Annual GeneralMeeting that in total SEK 6.50 shall be distributed for 2018. Thedividend yield, i.e. the dividend in relation to the share price atyear-end 2018 was 7.5 per cent (6.0) based on the proposeddividend.
Beta value and volatility of the SEB shareThe beta value of SEB’s share price in 2018 was 0.90 (0.99). Thismeasure shows how the share price moves in relation to the stockmarket as a whole, in this case represented by OMXS30. A betavalue of 1.00 indicates that the share price development is thesame as the market.
The volatility of SEB’s share price was 21 per cent for 2018 (15).The corresponding value for the Nordic peer groupwas 22 percent (17). The measure shows the daily change in share pricecompared with its average for a given time period.
Why invest in SEB?Over the years SEB has capitalised on its long-standing strong position as the leading corporate bank in theNordic region and on its financial strength. SEB stands out among Nordic banks due to its committed ownerand by virtue of its unique customer base.
Earnings and dividend 1)
per share
Earnings/share(SEK)
Dividend/share(SEK)
Dividendpayoutratio (%)
Share price developmentSEB Class A share Index 1 January 2014=100
SEB Class Ashares
OMXS30
MSCI EuropeBanks Index
2014 2015 2016 2017 2018
0
50
150
100
200
250
0
3
6
9
12
15
20182017201620152014
SEK Per cent
0
60
30
90
120
150
1) An ordinary dividend of SEK 6.00 per share and an extraordinarySEK 0.50 per share is proposed for 2018.
SEB Annual Report 2018 31
Shareholders and the SEB share Stakeholders

Financial reviewof thegroupThe business sentiment in SEB’s markets of operationswas in general positive.SEB’s operating profit, before items affecting comparability, increased by 1 per cent.The bank’s financial position is strong and a total dividend of SEK 6.50 per share isproposed.
Result and profitabilityOperating profit before items affecting comparability increased by1 per cent and amounted to SEK 22,779m (22,655). Items affect-ing comparability amounted to SEK 4,506m (–1,896). Operatingincome (including items affecting comparability) was SEK27,285m (20,759) and net profit was SEK 23,134m (16,197).
Operating incomeTotal operating income increased by 1 per cent and amounted toSEK 45,868m (45,561).
Net interest income amounted to SEK 21,022m, which representedan increase of 6 per cent compared with 2017 (19,893), in spite of anincrease in regulatory fees compared with 2017. The Swedish reporate which was –0.5 per cent throughout the year pressured theinterest margins affecting the net interest income negatively.
Customer-driven net interest income increased by SEK 1,423mcompared with 2017. The net interest income increased primarilyfrom the growth in lending volumes whereas the lending marginswere stable. The negative interest rate environment continued tohave a negative effect on deposit margins.
Net interest income from other activities (such as treasury andfunding) was SEK 294m lower than 2017. Funding costs relatingto both senior and subordinated debt were lower in 2018 than2017. Certain supervisory fees are accounted for as net interestincome. The lower financing costs were counteracted by a super-visory resolution fund fee that increased by 3.5 basis points to12.5 basis points applied to certain business volumes. Thereforeregulatory fees, including both resolution fund and deposit guar-antee fees, were SEK 697m higher than 2017 and amounted toSEK 2,495m (1,798). The resolution fund fee in 2019 will be9 basis points.
Net fee and commission income increased by 4 per cent toSEK 18,364m (17,677). The very high activity among corporateand institutional customers in the capital markets in 2017 was notfully matched in 2018 and net securities commissions decreasedby SEK 669m to SEK 8,220m even though a pick-up was notedtowards the end of the year.
Gross fee income from custody and mutual funds, excludingperformance fees, increased by SEK 172m to SEK 7,855m drivenby increased volumes and market values, despite the large drop
Important events and trends in 2018First quarter• Geopolitical uncertainty and volatile equity markets dampened
customer activity.• Most of SEB’s business in Germany was transferred from
SEB AG to the German branch of SEB AB.• A number of new regulatory requirements – MiFID II, AML 4,
IFRS 9 and IFRS 15 – with direct impact on SEB’s operations,results and reporting entered into force.
Second quarter• Corporate customers benefitted from the positive macro-
economic development and the demand for both advice andfunding increased.
• The SEB Pension divestment was completed at an in principletax-exempt capital gain of SEK 3.6bn and as a consequencethe assets under management decreased by SEK 116bn.
• Asiakastieto Group acquired UC AB. SEB’s share of the trans-action resulted in a tax-exempt capital gain of SEK 941m.
• The Baltic division completed the divestment of its invest-ment properties and procedures to close the real estateholding companies are ongoing.
Third quarter• Corporate customer activity remained high despite a
seasonal slowdown.• For the third year in a row SEB qualified for inclusion in the
Dow Jones Sustainability Index as the only Nordic bank.• SEB acted as adviser and arranger of the world’s first
reen certificate for financing of predefined green assets.
Fourth quarter• SEB presented its updated strategy and the new business
plan for 2019–2021.• Stock market values decreased lowering the value of SEB’s
assets under management and custody.• As market volatilities increased, institutional customers
became more active, which benefitted Markets’ operations.
SEK m 2018 2017 Change, %
Customer-driven netinterest income 23,217 21,794 7
Net interest income from otheractivities –2,195 –1,901 15
Total 21,022 19,893 6
SEB Annual Report 201832
Report of theDirectors Financial review of the group

in market values towards the end of the year. One purpose of thenew regulations under MiFID II was to increase transparencyon fees. The implementation in SEB resulted in a change in howcompensation to and from fund companies is paid. The effectwas a decrease in net fees by approximately SEK 146m comparedwith 2017. With the more challenging financial market conditionsin late 2018, performance fees decreased by SEK 130m toSEK 227m.
High customer activity fuelled an increase in net fees relatingto payments and cards of SEK 397m to SEK 3,851m. Gross lendingfees increased by SEK 273m to SEK 2,527m as credit volumesincreased. The net life insurance commissions related to the unit-linked insurance business increased by SEK 222m to SEK 1,283m.
Net financial income decreased by 12 per cent to SEK 6,079m(6,880). Financial institutions reviewed their positions and wereincreasingly interested in risk management services in the latterpart of the year when market volatilities increased. Change incredit spreads affected the value of counterparty risk (CVA) andown credit risk in derivatives (DVA). The change compared to lastyear was SEK –329m and amounted to SEK –119m.
Other life insurance income, net, decreased by SEK 754m toSEK 984m. The main reason was the divestment of SEB Pension,SEB’s life business in Denmark.see Items affecting comparabil-ity below.
Net other income decreased by 64 per cent to SEK 402m (1,112).Realised capital gains as well as unrealised valuation and hedgeaccounting effects were included in this line item. There werefewer such items this year.
Operating expensesTotal operating expenses were virtually unchanged at SEK21,940m (21,936), below the cost cap for 2018 of SEK 22bn. SEB’scost target for 2019–2021 is outlined in the new business plan.See page 10.
Staff costs were unchanged, while other expenses increasedby 4 per cent, offset, however, by lower depreciation and amor-tisation expense. The average number of full-time equivalentsdecreased to 14,751 (14,946). Approximately 250 employeesmoved to Danica with the divestment of SEB Pension (see itemsaffecting comparability). Ordinary fees to financial supervisoryauthorities amounted to SEK 153m (168). Combined with theSEK 2,495m that is accounted for as net interest income, totalregulatory fees amounted to SEK 2,648m (1,966).
Net expected credit lossesNet expected credit losses amounted to SEK 1,166m. Assetquality remained high and the net expected credit loss levelwas low at 6 basis points.
Items affecting comparabilityThe items affecting comparability for 2018 amounted toSEK 4,506m (–1,896). In 2018 there were two items affectingcomparability.
SEB divested all shares in SEB Pensionsforsikring A/S andSEB Administration A/S (SEB Pension) to Danica Pension Livs-forsikringsaktieselskab (Danica), a subsidiary to Danske Bank.The capital gain from the transaction, which was in principletax-exempt, amounted to SEK 3,565m.
The acquisition by the listed Finnish credit information com-pany Asiakastieto Group Plc (Asiakastieto) of UC AB was final-ised. SEB received shares in Asiakastieto, equivalent to 10.2 percent of the company, and SEK 0.3bn in cash. The transactionresulted in a tax-exempt capital gain of SEK 941m.See note 13.
Net interest income SEK bn
Customerloans
Customerdeposits
Other
Fee and commission income, gross SEK bn
–5
0
5
10
15
20
25
2016 2017 2018
0
2
4
6
8
10
2016 2017 2018
Operating income SEK bn
Net inter-est income
Net fee andcommissionincome
Net finan-cial income
Net otherincome0
5
10
15
20
25
-16 -17 -18 -16 -17 -18 -16 -17 -18 -16 -17 -18
Payments, cards, structured lending,deposits, guarantees and other fee
Secondary market & derivatives
Custody & mutual funds
New issues & advisory fees
Life insurance income
Operating expenses SEK bn
Staff costs
Otherexpenses
Deprecia-tion/impair-ment0
3
6
9
12
15
2016 2017 2018
SEB Annual Report 2018 33
Financial review of the group Report of theDirectors

Income tax expenseIncome tax expense amounted to SEK 4,152m (4,562) corre-sponding to an effective tax rate of 15 per cent (22).
Income tax expense and the effective tax rate were low forthree reasons. The divestments of UC and SEB Pension werelargely tax exempt since they were held for business purposes.In addition, the decision to reduce the Swedish corporate tax ratefrom 22 per cent to 21.4 per cent in 2019 and to 20.6 per cent in2021 led to a revaluation of deferred taxes, which reducedincome tax expense. Finally, the Administrative Court in Stock-holm decided in favour of SEB in an issue related to a tax-exempttreatment of a sale of a subsidiary. The combined effect of thetwo latter reasons was SEK 608m, which reduced the incometax expense.
Return on equityReturn on equity for 2018 was 16.3 per cent (11.7). Excluding itemsaffecting comparability return on equity was 13.4 per cent (12.9).
Other comprehensive incomeOther comprehensive income consists of items that have aneffect on the balance sheet, but the effect is not reported inthe income statement. In total other comprehensive incomeamounted to SEK –923m (–1,036).
The change in value of the pension plan assets is reportedas other comprehensive income. The value of the pension planassets exceeded the defined benefit obligations. The discountrate used for the pension obligation in Sweden was 2.0 per cent(2.2 at year-end 2017). The net value of the defined benefitpension plan assets and liabilities decreased which affectedother comprehensive income by SEK –846m (784).
The net effect from the valuation of balance sheet items thatmay later be reclassified to the income statement, i.e. cash-flowhedges and translation of foreign operations amounted toSEK –298m (–1,820).
Financial effects from IFRS9 and IFRS 15
As at 1 January 2018, IFRS 9 Financial Instruments and IFRS 15Revenue from Contracts with Customers entered into force.The presentation of the balance sheet was therefore changedto reflect business volumes under the new rules. The historicalinformation was restated per 1 January 2018. IFRS 15 changed
the accounting for deferred acquisition costs. The implementa-tion affected net fee and commission income, which led to arestatement of the 2017 result, return on equity and earningsper share.See note 53.
Holistic managementCreating sustainable value is a continuous process in an envi-ronment that is under constant change. The Board of Directorssets the conditions by deciding on the bank’s long-term strate-gic direction, financial targets, business plans and overall risktolerance. Profitability targets are set within the frameworkof the risk tolerance level and the capital adequacy targets.
In order to maximise customer and shareholder value, thefinancial consequences of business decisions are evaluatedand operations are managed proactively based on theseaspects:1. growth, mix and risk level of business volumes2. capital and liquidity requirements driven by the business3. profitability.
Pricing in accordance with risk is thereby a natural part of thebusiness and monitoring nominal and risk-based returns is animportant part of management.
The Board’s overarching risk tolerance statements conveythe direction and level of risk, funding structure, liquidity buff-ers and capital targets. SEB’s main risk is credit risk. Othermaterial risks include liquidity, market, operational (includingIT and information security), business, pension and insurancerisks. SEB strives to continuously identify and manage potentialfuture risks, for instance by using stress tests and scenarioanalysis. The capital buffer and liquidity reserves are heldto cover the risk in case of unforeseen events.
All activities are carried out responsibly based on economic,environmental and social aspects and in accordance withregulations and expectations – all in order to maintain theconfidence of the stakeholders.
Profitabilityrequirements
Risk, capitaland liquiditymanagement
Performancemanagement
Strategic,financial andoperational
plans
Riskstrategyand risk
tolerance
Pricing
SEB Annual Report 201834
Report of theDirectors Financial review of the group

Financial structureTotal assets, which at 31 December 2018 amounted to SEK2,568bn, increased by SEK 12bn since 1 January 2018 (2,556).
LoansLoans to the public reported in the balance sheet amounted toSEK 1,645bn, an increase of SEK 159bn year-on-year. Loans tocredit institutions increased by SEK 6bn to SEK 44bn.
The majority of the bank’s credit risk arises in the credit portfolio(in which loans, commitments and derivatives are included).Excluding credits to other banks where volumes are short-term andmore volatile, the credit portfolio increased by SEK 159bn to SEK2,220bn (2,061). The main growth was in the corporate portfolioacross all industries. In particular, the wholesale and retail segmentwas strong and growth amounted to SEK 20bn, as was the financeand insurance segment where growth amounted to SEK 54bn. TheSwedish and Baltic household mortgage credit portfolios increasedby SEK 17bn. In the area of public administration the credit portfoliodecreased by SEK 15bn.See p. 44–49 and note 41.
Debt securitiesDebt securities held for the purpose of serving customer riskmanagement and trading needs as well as internal liquiditymanagement on the balance sheet amounted to SEK 156bn (169).
SEB is also a market maker in certain debt securities. The shortposition (liability) in these debt securities amounted to SEK 10bn(11). SEB’s credit risk exposure in the bond portfolio, whichconsists of debt securities, certain credit derivatives and futuresamounted to SEK 141bn (156).See note 41a.
Equity instrumentsEquity instruments held for the purpose of customer risk man-agement and trading needs as well as in the bank’s role as amarket maker amounted to SEK 50bn (60). The short position
2018 2017 2016 2015 2014
Return on equity, % 16.34 11.70 7.80 12.24 15.25
Return on equity excluding items affecting comparability, % 13.36 12.86 11.30 12.85 13.07
Return on total assets, % 0.82 0.57 0.37 0.57 0.71
Return on risk exposure amount, % 3.66 2.64 1.80 2.71 3.23
Cost/income ratio 0.48 0.48 0.50 0.49 0.50
Basic earnings per share, SEK 10.69 7.47 4.88 7.57 8.79
Weighted average number of shares1), millions 2,164 2,168 2,178 2,191 2,187
Diluted earnings per share, SEK 10.63 7.44 4.85 7.53 8.73
Weighted average number of diluted shares2), millions 2,177 2,178 2,188 2,203 2,202
Net expected credit loss level3), % 0.06 0.05 0.07 0.06 0.09
Stage 3 loans/Total loans, gross, % 0.50
Stage 3 loans/Total loans, net, % 0.30
Liquidity Coverage Ratio (LCR)4), % 147 145 168 128 115
Risk exposure amount, SEK m 716,498 610,819 609,959 570,840 616,531
Risk exposure amount, expressed as own funds requirement, SEK m 57,320 48,866 48,797 45,667 49,322
Common Equity Tier 1 capital ratio, % 17.6 19.4 18.8 18.8 16.3
Tier 1 capital ratio, % 19.7 21.6 21.2 21.3 19.5
Total capital ratio, % 22.2 24.2 24.8 23.8 22.2
Leverage ratio, % 5.1 5.2 5.1 4.9 4.8
Number of full time equivalents5) 14,751 14,946 15,279 15,605 15,714
Assets under custody, SEK billion 7,734 8,046 6,859 7,196 6,763
Assets under management, SEK billion 1,699 1,830 1,749 1,668 1,689
1) The number of issued shares was 2,194,171,802. SEB owned 27,125,923 Class A shares for the equity-based programmes at year-end 2017. During 2018 SEBrepurchased 6,920,449 shares and 3,770,040 shares were sold. Thus, at 31 December 2018 SEB owned 30,276,332 Class A-shares with a market value ofSEK 2,607m.
2) Calculated dilution based on the estimated economic value of the equity-based programmes.3) 2018: Net ECL level based on IFRS 9 expected loss model. 2014–2017: Credit loss level based on IAS 39 incurred loss model.4) 2018: According to EU definition. 2014–2017: According to Swedish FSA regulations for respective period.5) Average for the year.
A five-year summary of the group and the parent bank’s income statements and balance sheets is available on p. 180–181.Definitions are available on p. 187–188.
Key figures
Loans to the public SEK bn
House-holds
Publicsector
Corporatesector
2016 2017 2018
0
300
600
900
1,200
1,500
SEB Annual Report 2018 35
Financial review of the group Report of theDirectors

(liability) in equity instruments amounted to SEK 13bn (14).See note 20 and 31.
Insurance assets and liabilitiesFinancial assets within the insurance operations amounted toSEK 295bn (305). Out of this, financial assets where the custom-ers bear the investment risk (mostly unit-linked insurance),amounted to SEK 270bn (283) and other assets (mostly traditionaland risk insurance) amounted to an additional SEK 25bn (22).
Liabilities in the insurance operations amounted to SEK 292bn(303). Out of this, SEK 271bn (284) was financial liabilities forwhich the customers bear the investment risk (mostly unit-linkedinsurance), while SEK 22bn (19) was related to insurance con-tracts (mostly traditional and risk insurance).See note 29, 43and 44.
DerivativesThe fair value of the derivative contracts is booked as assetsand liabilities on the balance sheet. They amounted to SEK 115bn(105) and SEK 97bn (85) respectively.
The mix and volumes of derivatives reflect the demand forderivatives by the bank’s customers for management of theirfinancial risks. The bank is a market maker for derivatives andalso uses derivatives for the purpose of protecting its own cashflows and fair value of its financial assets and liabilities from forinstance interest rate fluctuationsSee note 21.
Other assets and other liabilitiesOther assets decreased to SEK 44bn (225) while other liabilitiesdecreased to SEK 75bn (256). The main reason for the decreasewas the divestment of SEB Pension. The assets and liabilitieswere classified as other assets and liabilities when the transac-
tion was announced in 2017 and removed from the balance sheetwhen the transaction was finalised.
Intangible assets totalled SEK 8bn (8), of which 58 per cent rep-resented goodwill. Goodwill items are subject to a yearly impair-ment test. There was no impairment in 2018. Due to the implemen-tation of IFRS 15 the deferred acquisition costs in the insuranceoperations decreased by SEK2.6bn in 2018.See note 23.
Deposits and borrowingsThe financing of the group consists of deposits from the public(households, corporates, etc.), borrowings from financial institu-tions as well as issuance of money market instruments, bonds,covered bonds and subordinated debt.See p. 48 and note 41ffor information on liquidity management.
Shor
t-te
rmfu
ndin
gSt
able
fund
ing
OtherOther
Life insuranceLife insurance
Credit institutionsCredit institutions
Liquidity portfolio
DerivativesDerivatives Customer tradingCustomer trading
Central bank balances Central bank deposits
Household deposits
Household lending
Equity
Short-term funding
Long-term funding
Corporate and publicsector deposits
Corporate andpublic sector lending
“Ban
king
book
”Li
quid
asse
ts
Assets Liabilities and equity
Balance sheet structure 31 December 2018 Rating
Moody’s rates SEB’s long-term senior unsecured debt at Aa2with a stable outlook reflecting SEB’s asset quality and solidcapitalisation underpinned by strong earnings generationcapacity and good profitability.
Standard & Poor’s (S&P) rates SEB’s long-term seniorunsecured debt at A+ with a stable outlook. The rating isbased on the bank’s strong capitalisation and well-diversi-fied earnings in terms of geography and business areas.
Fitch rates SEB’s long-term senior unsecured debt at AA–with a stable outlook. The rating is based on SEB’s strongcapital and leverage ratios, sound asset quality and healthyliquidity profile.
Moody’s Standard&Poor’s FitchShort1) Long2) Short1) Long2) Short1) Long2)
P–1 Aaa A–1+ AAA F1+ AAA
P–2 Aa1 A–1 AA+ F1 AA+
P–3 Aa2 A–2 AA F2 AA
Aa3 A–3 AA– F3 AA–
A1 A+ A+
Outlook stable Outlook stable Outlook stable
Deposits from the public SEK bn
House-holds
Publicsector
Corporatesector
2016 2017 2018
0
300
600
900
1,200
1,500
1) Short-term debt and commercial paper2) Long-term senior unsecured debt
SEB Annual Report 201836
Report of theDirectors Financial review of the group

Deposits and borrowings from the public amounted toSEK 1,111bn (1,035). Household deposits increased by SEK 23bnwhile corporate deposits increased by SEK 39bn during the year.
Debt securities issuedShort-term funding, in the form of commercial paper and certifi-cates of deposit, increased by SEK 59bn during the year.
SEK 100bn of long-term funding matured during 2018 (of whichSEK 65bn covered bonds and SEK 35bn senior debt). Based on itsfavourable credit rating the bank was able to issue SEK 101bn (ofwhich SEK 67bn constituted covered bonds and SEK 34bn seniordebt) during the year. Issued subordinated debt amounted toSEK 35bn (32).See note 35.
Total equityTotal equity at the opening of 2018 amounted to SEK 141bn. Inaccordance with a resolution of the Annual General Meeting in2018, SEK 12.5bn of equity was used for the dividend (11.9). Netprofit amounted to SEK 23.1bn and other comprehensive incomedecreased equity by SEK –1bn. The final effect on equity fromimplementing IFRS 9 reduced equity by SEK 2.4bn. At year-end2018, total equity amounted to SEK 149bn.
DividendThe Board of Directors proposes to the Annual General Meetingan ordinary dividend of SEK 6.00 per Class A and Class C share,which corresponds to a payout ratio of 56 per cent. The totalordinary dividend amounts to SEK 13.0bn.
The Board of Directors also proposes to the Annual GeneralMeeting an extraordinary dividend of SEK 0.50 per Class A andClass C share.
Thus, the total dividend per Class A share and Class C share isSEK 6.50 (including the extraordinary dividend), which corre-sponds to a payout ratio of 61 per cent. The total ordinary andextraordinary dividend amounts to SEK 14.1bn (12.5), calculatedon the total number of issued shares as per 31 December 2018,excluding own shares held.
The payout ratio for the ordinary dividend based on the netprofit excluding items affecting comparability is 70 per cent.See the Board’s Proposal for the distribution of profit on p. 182.
Assets undermanagement and custodyAssets under management amounted to SEK 1,699bn (1,830).The net inflow of volumes was SEK 45bn. With the downturn inthe financial markets, the decrease in the value was SEK 60bn.In total, assets under management in the amount of SEK 116bnrelated to the divestment of SEB Pension were transferred out.
Assets under custody were also affected by the market down-turn and decreased to SEK 7,734bn (8,046).
Looking ahead
Changes in accounting policies – IFRS 16 LeasesIFRS 16 Leases replaces IAS 17 Leases and related interpreta-tions. The standard is effective as from 1 January 2019 and isendorsed by the EU. The new standard significantly changeshow SEB as a lessee accounts for leases by introducing a single,on-balance sheet lease accounting model requiring the recog-nition of lease assets (right-of-use assets) and lease liabilities.Upon transition to IFRS 16, the group has decided to apply themodified retrospective approach. The main impact on thegroup’s financial statements is from the accounting of propertyleases. The total of right-of-use assets amounts to SEK 5.7bnand will be recognised on the balance sheet, and an amount ofSEK 0.2bn will reduce equity. The implementation of IFRS 16will not significantly affect net profit in 2019 compared to 2018.
Risks and uncertaintiesSEB assumes credit, market, liquidity, IT and operational aswell as life insurance risks. The risk composition of the group,as well as the related risk, capital and liquidity management,are described on page 44–49 and notes 41 and 42, in the Capi-tal Adequacy and Risk Management Report for 2018 as wellas the quarterly additional Pillar 3 disclosures and in the FactBook.
Global growth levelled out towards the end of the year. Thegeopolitical uncertainty and the large global economic imbal-ances remain. The potential reduction of liquidity support tofinancial markets from central banks world-wide may createdirect and indirect effects that are difficult to assess. In Janu-ary 2019, the Swedish repo rate was raised by 0.25 percentagepoints to –0.25 per cent and the expectation is that more hikeswill be made. There has been a gradual stabilisation in theSwedish residential real estate market. However, there is anoversupply of unsold newly constructed apartments in themain cities that may put pressure on prices.
Organisational changesAs per 1 January 2019, SEB reorganised and the division Life &Investment Management was split into two separate divisions.The new organisation will be reflected in the first quarterlyreport in 2019.
The Life division is headed by David Teare, who reports toMats Torstendahl, Head of division Corporate & Private Custom-ers. David Teare is an additional member of the Group ExecutiveCommittee.
From mid-2019 the Investment Management division will beheaded by Javiera Ragnartz who will report to the Presidentand CEO.
Assets under management SEK bn
2018 2017 20161)
Start of period 1,830 1,749 1,668
Inflow 536 491 255
Outflow –491 –477 –178
Acquisition/disposal, net –116 0 0
Change in value –60 66 4
End of period 1,699 1 ,830 1,749
1) Pro forma
SEB Annual Report 2018 37
Financial review of the group Report of theDirectors

Divisions and business supportDivision Business offering
Larg
eC
orpo
rate
s&
Fina
ncia
lIns
titu
tion
s
Co-heads: Joachim AlpenWilliam Paus
The division serves 2,300 large corporate customers and 700 financial institutions and offersadvisory-driven commercial and investment banking services in the Nordic region, Germany,United Kingdom and through an international presence. The division has a full-service offeringsupporting enterprises with capital and offering investment opportunities for pension funds andother investors.
Customers are offered equity and debt capital markets transaction services, bilateral andsyndicated loans as well as advice relating to acquisitions, divestments and mergers; productsand services for managing customers’ working capital and trade finance; brokerage and tradingin foreign exchange, securities, interest rates, commodities and other derivatives; funds andother investment products; post trade investor services such as custody, risk and valuationservices and collateral management; macroeconomic analysis and securities research.
Cor
pora
te&
Priv
ate
Cus
tom
ers
Head:Mats Torstendahl
The division serves some 489,000 private and 166,000 corporate home bank customers inSweden with universal banking services through digital meeting points, 116 physical meetingplaces and a contact centre with 24/7 accessibility.
The division has a broad offering to both private and corporate customers, ranging fromeveryday banking services to private individuals and smaller companies, to private banking ser-vices with global reach to high net worth individuals in the Nordic countries. In addition complexbanking and advisory services are provided to medium-sized companies (mid-corp). The divisionalso issues cards in the Nordic countries under SEB’s own brand as well as under Eurocard,Diners Club and several partner brands.
Bal
tic
Head:Riho Unt
The division provides universal banking and advisory services to private individuals and allcorporate customer segments in Estonia, Latvia and Lithuania, with significant market sharesacross key segments and products in all three countries. The division has 75 branch offices inthe three Baltic countries and serves approximately 950,000 private home bank customers and101,000 SME and corporate customers. Services are increasingly provided through digital meet-ing places such as mobile applications, electronic document signing and remote video advice.
SEB’s Baltic real estate holding companies also formed part of the division, but are now in aliquidation process after the last properties were divested during 2018.
Life
&In
vest
men
tM
anag
emen
t1)
Head:David Teare
The division provides life insurance and asset management products and services for privateindividuals, companies and financial institutions primarily in the Nordic and Baltic regions.
The insurance offering covers mainly unit-linked, portfolio bond, and traditional insurance aswell as health and sickness insurance.
The asset management offering is composed of a broad range of mutual funds and tailoredportfolios for institutional investors as well as retail and private banking clients. The aim is tobe the advisory leader with an ambition to include sustainability in all products, services andprocesses. SEB actively engages in ownership dialogues on sustainability matters to offeringa wide range of products with a clear sustainable profile, i.e. sustainability and microfinancefunds.
1) The bank reorganised as of 1 January 2019.See p.53.
Unit Function
Bus
ines
sSu
ppor
t
Head:Martin Johansson
Business Support is a cross-divisional function with the responsibility to support business oper-ations with proactive IT development and execution of back-office services as well as to ensurestable daily operations of the IT systems – all carried out with focus on cost efficiency.
The IT development is done step-by-step, taking many small initiatives and using agile waysof working. In this way fast delivery and outcome in line with customer and business needs areensured.
Reliable services are provided to SEB’s customers, by ensuring that digital channels arerunning without disruption and payments and other transactions are handled efficiently.
SEB Annual Report 201838
Report of theDirectors Financial review of the group

Operating income and profit Comments on the result Divisions’ relative share of:
Operating profit decreased to SEK 8,733m.Net interest income increased primarilyrelated to cash management services.Net fee and commission income washigher as a result of improved investmentbanking activity. Net financial incomedecreased somewhat in the challengingmacro environment. Operating expenseswere slightly down. Asset quality re-mained high with a net expected creditloss level of 7 basis points.
Operating profit decreased toSEK 7,845m. Net interest income wasvirtually unchanged. Net fee andcommission was affected negativelyby lower compensation from fundcompanies related to MiFID II. Net finan-cial income was unchanged while oper-ating expenses decreased somewhat.Asset quality remained high witha net expected credit loss level of5 basis points.
Operating profit, which included positivecurrency effects, increased toSEK 2,600m. Net interest incomeincreased due both to volume growthand margin expansion. Net fee andcommission income was higher mainlyfrom increased customer activity. Oper-ating expenses increased. Asset qualityremained strong with a net expectedcredit loss level of 3 basis points.
Operating profit decreased toSEK 3,382m. Net fee and commissionincome increased mainly because ofMiFID II restrictions – certain compen-sation is no longer paid out by the fundcompanies of the division. Net financialincome decreased mainly due to thedivestment of SEB Pension Denmark.Operating expenses decreased. Ex-cluding SEB Pension operating profitincreased by 15 per cent.
Automation drives efficiency Comments
In 2018 the Operations unit processed310 million transactions with an automa-tion grade of 93 per cent. Robotic tech-niques, used to automate manual tasks,covered more than one million trans-actions in 2018. By expanding GlobalServices in Riga and Vilnius the produc-tivity increased.
2018
Large Corporates &Financial Institutions 13%
Corporate &Private Customers 24%
Baltic 16%
Life & InvestmentManagement 9%
Business support 26%
Staff and other 11%
2018
Large Corporates &Financial Institutions 39%
Corporate & PrivateCustomers 35%
Baltic 12%
Life & InvestmentManagement 15%
2) Excluding other
2018
Large Corporates &Financial Institutions 42%
Corporate & PrivateCustomers 35%
Baltic 10%
Life & InvestmentManagement 13%
1) Excluding other
Operating income 1)
Operating profit 2)
Employees
Large Corporates & Financial Institutions
Operatingincome
Operatingprofit
Return onbusinessequity, %
Corporate & Private Customers
Operatingincome
Operatingprofit
Return onbusinessequity, %
Baltic
Operatingincome
Operatingprofit
Return onbusinessequity, %
Life & Investment Management
Operatingincome
Operatingprofit
Return onbusinessequity, %
Sweden& sites
Globalservices
Transac-tions peryear,milllions
0
5
10
15
20%
0
5
10
15
20
20182016 2017
SEK bn
0
5
10
15
20%
0
5
10
15
20
20182016 2017
SEK bn
0
5
10
15
20
0
5
10
15
20%
20182016 2017
SEK bn
0
10
20
30
40%
0
5
10
15
20
20182016 2017
SEK bn
300
0
600
900
1,200
1,500Employees
150
200
250
300
350Transactions
201820172016
SEB Annual Report 2018 39
Financial review of the group Report of theDirectors

Geographic marketsMarket Comment Per country
Globalwith Sweden
Retail and corporate bankingSweden is SEB’s main market with a complete banking, pension andinsurance offering to a wide range of customers. Despite negativeinterest rates corporate customers above all were active.
Johan TorgebyPresident and CEO
Estonia Retail and corporate bankingEstonia was one of the fastest growing economies in the Eurozonewhich was reflected in a positive development of SEB. Focus lies onfurther increasing efficiency and introducing a number of digitalnovelties to customers. SEB is the second biggest bank in Estonia.
Allan ParikCountry manager
Latvia Retail and corporate bankingPrivate consumption remained the primary GDP growth driver and theeconomy developed strongly despite the liquidation of the third largestbank in the country. Latvia was an early adopter of financial technologyand SEB was among the first banks in Europe to offer EU instantpayments.
Ieva TetereCountry manager
Lithuania Retail and corporate bankingThe economic landscape in Lithuania remained sound. SEB furtherdeveloped modern banking solutions and remote advisory servicesand opened an Innovation Centre. SEB is the leading bank in Lithuaniameasured in terms of loan volumes.
Raimondas KvedarasCountry manager
Denmark Corporate bankingThe banking activities continued to show positive development in linewith the robust macro climate in Denmark. In particular, growing busi-ness volumes improved revenues in Corporate Banking, InvestmentBanking and in Asset Management with inflow from both domesticand international investors. SEB Pension was divested.
Peter HøltermandCountry manager
Norway Corporate bankingThe Norwegian economy was boosted by increasing oil prices inthe beginning of the year. Despite tough competition and pressuredmargins, SEB was involved in a large number of bond issuancetransactions and the demand for financing services was high.
John TuressonCountry manager
Finland Corporate bankingThe macroeconomic conditions in Finland improved during the yearand SEB cemented the position as the leading bank for an increasingnumber of core customers. Customer activity was solid across allsegments with focus on expanding existing customer relationships.
Marcus NysténCountry manager
Germany Corporate bankingThe German banking market continued to be highly competitive. Thetrade dispute with the US had a dampening effect on larger corpora-tions but SEB’s customers were relatively active. Customers requesteddebt financing as well as trade financing products. The main businessof SEB AG was transferred to the German branch of SEB AB.
Johan AnderssonCountry manager
United Kingdom Corporate bankingGeneral market conditions led to a muted start to the year, with Brexitcontributing to uncertainty. Thereafter, customer activity picked upacross the product spectrum partly since customers took action inimplementing contingency measures ahead of Brexit.
Mark LuscombeCountry manager
Other markets Corporate bankingSEB continued to serve customers in its branch offices in Luxembourg,Poland, Russia, Ukraine, China, Hong Kong, Singapore, India, UnitedStates and Brazil.
The internationalnetwork
Share of SEB’s operatingprofit 2018 1) Per cent
Share of SEB’semployees 2018 Per cent
2018
Sweden 57
Denmark 9
Norway 6
Finland 5
Germany 3
Estonia 5
Latvia 2
Lithuania 6
United Kingdom 2
Other markets 5
1) Operating profit before itemsaffecting comparability
2018
Sweden 51
Denmark 2
Norway 3
Finland 2
Germany 2
Estonia 7
Latvia 7
Lithuania 10
Global services inLatvia/ Lithuania 9
Great Britain 1
Other 5
Report of theDirectors Financial review of the group
SEB Annual Report 201840

Market shares and customer contactsHousehold savings, Sweden Per cent
Market shares, Sweden Per cent
SEB SHB Nordea Swedbank
Household savings in Sweden - bank accounts and mutual funds at atotal of SEK 5,886bn as of 31 December 2018.
201820172016
15
20
25
30
201820172016
15
20
25
30
201820172016
30
25
20
15
201820172016
15
20
25
30
2018
SEB 11
Swedbank 18
SHB 13
Nordea 12
Länsförsäkringar 4
Skandia 2
AMF 2
Other 38
Households, deposits
Corporations, deposits
Households, lending
Corporations, lending
Financial review of the group Report of theDirectors
SEB’s market shares and market growth Per cent
2018 2017
Totalmarket,SEK bn
2018Marketgrowth
Lending to general public
Sweden 14.1 14.2 6,305 6
Lending to households 12.5 12.7 3,996 5
Lending to companies 17.0 16.8 2,309 6
Estonia 1) 25.5 24.8 195 3
Lending to households 26.5 26.0 88 4
Lending to companies 24.7 23.9 107 2
Latvia 1) 20.9 18.5 140 –6
Lending to households 18.3 16.9 54 –5
Lending to companies 22.6 19.6 86 –7
Lithuania 1) 31.4 31.0 204 7
Lending to households 28.8 28.7 95 6
Lending to companies 33.6 33.1 109 8
Deposits fromgeneral public
Sweden 16.0 15.6 2,962 7
Deposits from households 11.4 11.5 1,907 7
Deposit from companies 24.3 22.8 1,055 6
Estonia 1) 22.8 21.9 183 3
Deposits from households 22.6 22.5 79 5
Deposit from companies 23.0 21.5 105 1
Latvia 1) 16.4 11.7 160 –24
Deposits from households 17.9 16.7 83 –3
Deposit from companies 14.8 8.3 76 –38
Lithuania 1) 28.5 27.1 214 4
Deposits from households 29.5 28.7 129 4
Deposit from companies 26.9 24.9 85 4
Equity trading
Stockholm 5.9 5.5 8,907 7
Oslo 3.1 3.1 2,742 24
Helsinki 3.9 2.7 2,810 7
Copenhagen 2.7 2.4 3,840 1
SEK-denominatedcorporate bonds 18.8 16.5 156 5
Mutual funds, total volumes2)
Sweden 11.4 11.9 3,978 –1
Finland 2.5 2.8 1,130 –1
Unit-linked insurance,premium income
Sweden 16.0 16.3 66 3
Total life insurance,premium income
Sweden 8.6 7.8 230 9
1) Excluding financial institutions & leasing. Estonia, Latvia and Lithuania perSeptember 2018. Market growth in local currency.
2) Excluding third-party funds.Sources: Statistics Sweden, Estonian Finantsinspektsioon, Finance LatviaAssociation, Association of Lithuanian Banks, Swedish Insurance Federation,Nasdaq etc.
Customer contacts 2018 2017 2016
Number of syndicated loans inNordic countries 69 61 73
Number of equity capital markettransactions in the Nordic countries 24 31 24
Number of Nordic mergers and acquisitions 19 16 24
International private banking branches 12 12 12
Number of Swish payments via SEB’s app (million) 37 28 18
Number of life insuranceintermediaries and brokers 1,850 2,200 2,500
Number of branch offices 189 196 219
Number of ATMs 1) 2,504 2,649 2,757
1) of which 1,900 jointly owned by major Nordic banks
SEB Annual Report 2018 41

The macroeconomic situation is of great importance for cus-tomer behaviour and, together with the bank’s own actions,it is a major factor impacting the business and the result.
In times of positive economic development both businessesand private individuals are more likely to invest and consume.This may lead to increased lending, more payments, a highernumber of corporate transactions, etcetera, all of which affectnet interest and net commission income positively.
In an unfavourable part of the business cycle, customersmay be more restrictive and growth in business and transactionvolumes may level out while credit losses may increase. On theother hand customers hedge their risks in uncertain and volatiletimes, which may increase net financial income.
SEB’s total result is less volatile over time than each line item inthe income statement stand-alone. For instance net fee commis-sion income tends to increase when financial income decreasesand vice versa.
Profit related to business volumesCustomers’ financial needs are the source of SEB’s business volumes and result.Here, the general relationships between customer-driven business volumes reportedon- and off-balance sheet, the income statement and external factors are outlined.
Selected business volumes outside the balance sheet (in accordance with accounting principles) SEK bn
Business volumes on the balance sheet, 31 Dec. 2018 SEK m
Report of theDirectors Financial review of the group
2018
18 Assets undermanagement
Customers invest in for instance mutualfunds 1,699
18 Assets undercustody
The bank safekeeps securities and admin-istrates dividends and interest on custom-ers’ behalf 7,734
18 Commitments Preapproved customer credits 589
18 Guarantees The bank assists customers with creditrisk management 136
18 Payments and cashmanagement
Customers make payments and manage accountbalances
18 Card transactions Customers make card payments
18 Securitiestransactions
Customers use the bank as an intermediary insecurities transactions, for instance equity trading.
18 Corporatetransactions
Corporate customers seek advice and assistancefor various corporate transactions, such asacquisitions, IPOs, etc.
ASSETS 2018
1 Cash and cash balances with central banks 209,115
2 Loans to central banks 33,294
3 Loans to credit institutions 44,287
4 Loans to the public 1,644,825
5 Debt securities 156,128
6 Equity instruments 50,434
7Financial assets for which thecustomers bear the investment risk 269,613
8 Derivatives 115,463
Other assets 44,357
TOTALASSETS 2,567,516
LIABILITIES AND EQUITY 2018
9Deposits from central banksand credit institutions 135,719
10 Deposits and borrowings from the public 1, 111,390
11Financial liabilities for which thecustomers bear the investment risk 270,556
12 Liabilities to policyholders 21,846
13 Debt securities issued 680,670
14 Short positions 1) 23,144
- Of which equity instruments 13 ,498
- Of which debt securities 9,646
15 Derivatives 96,872
16 Other financial liabilities 3,613
Other liabilities 74,916
17 - Of which subordinated debt 34,521
Total equity 148,789
TOTAL LIABILITIESANDEQUITY 2,567,516
Income statement, simplified SEK m
2018
A Net interest income 21,022
B Net fee and commission income 18,364
C Net financial income 6,079
D Net other income 402
Total operating income 45,868
Total operating expenses –21,940
2 3
4 5Net expected credit losses and other –1,148
Operating profit before IAC 22,779
Items affecting comparability 4,506
Operating profit 27,285
Income tax expense –4,152
NETPROFIT 23,134
1) Short position – a negative item in the inventory held for customer trades
SEB Annual Report 201842

A Net interest income B Net fee andcommission income
C Net financial income D Net other income
Net interest income is the differ-ence between income from lend-ing and expenses associated withdeposits and borrowings. Marginsand business volumes have amajor bearing. Interest marginsdiffer in various markets, mainlydue to varying maturities and risk.
Net fee and commission incomeincreases with growing transac-tion volumes. Fund-relatedcommissions increase with highermarket values.
Net financial income includesboth the market value and realisedgains and losses on transactionswith securities, currencies andderivatives. Trends in the financialmarkets play a major role.
Items in net other income occursporadically with no clear linkto macroeconomic factors.
Customer loans and cashbalances generate interestincome over the life of the loan.Up-front fees on new loans aretreated as interest income.1 2 3 4
SEB participates in, or leads,syndications of loans leading tonet fee and commission incomeor expenses. 4
Loans
SEB maintains an inventory ofdebt securities for customertrades and liquidity management.They accrue interest over life.5 14
SEB holds debt securities forcustomer trading and liquiditymanagement. The customer trad-ing activity as well as the marketvalue of the inventory affect netfinancial income. 5 14 1)
Sales from the bank’s inventoryof debt securities held forliquidity management orinvestment affect this item. 5
Debt
instruments
Brokerage fees occur in equitytrading. 18
SEB holds equity instruments forcustomer trading and is a counter-part in equity swaps. The customertrading, changes in the marketvalue, dividends and realisedgains/losses affect this item. 6 14 1)
Dividend from the bank’s non-customer trading equity holdingsaffect the item. 6
EquityInstrum
ents
Interest rate derivatives that areused by SEB to reduce volatility inthe result (so-called hedging)accrue interest over life. 8 15
In certain cases, SEB charges andpays fees when trading in deriva-tives. 8 15
SEB is a counterparty for custom-ers wishing to manage risk (forinstance foreign exchange andinterest rate risk) using derivativeinstruments. Both customer tradesand the market value of the hold-ings affect financial income. 8 15
The market value of derivativesthat SEB uses for hedging. 8 15 D
erivatives
Customer deposits generateinterest expense. 9 10
Certain bank accounts generatefee income. 9 10
Deposits
andborrow
ings
SEB provides savings in unit-linkedinsurance, deposit insuranceand similar products where thecustomer bears the risk. Investedvolumes generate fee income. Inaddition, distribution generatesfee expenses. 7 11 18
SEB provides savings in traditionalpension with a certain guaranteedreturn, sickness and health insur-ance and related services. SEBinvests mainly in equity instru-ments and debt securities to safe-guard the outcome of insuranceclaims. 5 6 12
Insuranceand
savings
SEB’s operations are partlyfunded by long and short-terminterest- bearing securities, all ofwhich generate interest expense.13 17
Index-linked bonds generating feeincome are provided for thepurpose of customer investment.13 18
The market value including thecredit risk in SEB’s issued index-linked bonds affects the item.13
Early redemption by SEB of its debtinstruments affects this item. 13 17
Issuedsecurities
andsubordinateddebt
Various customer services areprovided which generate bothfee and commission income andexpense. Most fees are fixedand transaction based; someare market value based. 18
Business
volumes
outsidethe
balancesheet
1) Short position – a negative item in the inventory held for customer trades.
Customers’ business volumes and income
Financial review of the group Report of theDirectors
SEB Annual Report 2018 43

Risk development in 2018SEB continued to demonstrate resilience with high asset quality,low credit losses, robust capital adequacy and a stable liquidityposition.
Following many years of strong development, indications of aslowdown in global economic growth emerged towards the endof the year. Meanwhile central banks’ room to use monetarypolicy is limited.
Technological advances, customers’ expectations as well asregulations drive digitalisation in the banking industry. New typesof competitors and the movement towards Open Banking andsharing of information are reshaping the playing field for banks.In addition to the strategic opportunities and challenges thisentails, cyber and information risks are increasing and evolvingas perpetrators become more technically sophisticated and theattack surface expands.
Risk, capital andliquiditymanagementSEBworks to safeguard its strong financial position in order to meet stakeholders’needs and requirements. Assuming risk is an integral part of banking. In a dynamic world,SEB continuously develops its comprehensive risk, capital and liquidity management, inorder to create customer value while maintaining resilience in all possible situations.
RISKPROFILE
The Board of Directors decides on the overarching risk tolerance. The President is responsible for managing SEB's risksoverall and ensuring that the risk profile lies within the Board’s risk tolerance and capital adequacy targets.
Board’s risk tolerance statements in brief
Risk type SEB shall Comment
Credit riskandassetquality
Have a robust credit culture based on long-term relationships, knowledge about thecustomers and focus on their repaymentability. This will lead to a high quality creditportfolio.
• SEB has a well-balanced credit portfolio with main exposureto Nordic large corporates and households in Sweden.
• Asset quality remains strong with low credit losses.
Market risk Achieve lowearnings volatility by gener-ating revenues based on customer-drivenbusiness.
• Market risk arises in SEB’s customer-driven trading activityand in its liquidity portfolio. Generally, SEB’s market risk islow.
• Interest rate risk arises due to mismatches in rates andmaturities in the bank’s assets and liabilities, and is managedby the Treasury function.
Operationaland reputa-tional risk
Strive tomitigate operational risks in allbusiness activities and maintain the bank’sreputation.
• Low operational losses compared to European peers.• Managing and mitigating cyber and information risks are key
priorities to ensure secure and available information,services and products for customers.
Liquidityand fundingrisk
Have a soundly structured liquidity posi-tion, a balanced wholesale funding depend-ence and sufficient liquid reserves to meetpotential net outflows in a stressed scenario.
• SEB’s primary funding sources are customer depositsand wholesale funding.
• The funding base is diversified in terms of maturities andcurrencies to ensure that payment obligations are met asthey fall due.
Aggregatedriskandcapitaladequacy
Maintain satisfactory capital strength inorder to sustain aggregated risks, andguarantee the bank’s long-term survival andits position as a financial counterparty, whileoperating within regulatory requirementsand meeting rating targets.
• SEB is strongly capitalised in relation to regulatorycapital requirements, internal targets and peers.
• The aim is to hold a capital adequacy buffer of around150 basis points above the regulatory requirement.
For more information on risk, capital and liquidity management, refer to notes 41 and 42.
SEB Annual Report 201844
Report of theDirectors Risk, capital and liquidity management

Customers, investors and regulators are increasingly focusingon sustainability, including ESG and climate-related risks, andreporting requirements will increase. 2018 was characterisedby an increased, industry-wide focus on responsible bankingand on combating financial crime.
Credit portfolio driven by corporate growthThe strong macroeconomic development in SEB’s home marketsresulted in healthy growth in the credit portfolio (in which loans,commitments and derivatives are included). Most of the growthcame from the corporate segment while growth in the residentialmortgage-related portfolios was more subdued as a result of theslowdown of the Swedish housing market. The total credit portfolioamounted to SEK 2,316bn at year-end (2,170).
Over half of SEB’s credit portfolio consists of exposure to cor-porations, amounting to SEK 1,172bn (1,030) at year-end. Duringthe year, growth was strong across geographies and divisions.
SEB is unique among peers in that its corporate portfolio consistsprimarily of large corporations – mainly Nordic and German cus-tomers in a wide range of industries, the largest being manufac-turing. The exposure to small and medium-sized companies(SME) accounts for 12 per cent (12) of the bank’s corporate port-folio, and is mainly in Sweden. The portfolio grew to SEK 141bn(125) during the year.
Robust Swedish householdmortgage portfolioFor many years the Swedish residential housing market has beencharacterised by urbanisation, limited supply of housing andlow interest rates. Between 2013 and 2017, housing prices rosequickly, resulting in high household indebtedness in an interna-tional comparison. Since the peak in 2017, house prices havefallen by 5–10 per cent depending on location, driven by a largersupply of newly produced homes, and further tightened amorti-sation requirements in 2018. The price drop resulted in a more
SEB’s key risk development
Measurement Comment 2018 2017 Peer average, 2018
• Credit portfolio (SEK bn)
• Net expected credit loss (ECL)level 1) (%)
• Stage 3 loans/total loans, gross (%)
• Total loans, commitments and derivatives
• Expected credit losses in relation tototal exposure
• Share of loans that are classified as stage 3(credit impaired)
2,316
0.06
0.5
2,170
0.05 0.02 2,3)
1.2 2)
• Trading VaR average (SEK m) • A statistical measure of the largest lossthat can be expected in a ten-day period
90 91
• Operational losses/income (%) • Operational risk losses in relation to operatingincome
0.43 0.42 0.69 4)
• Liquidity coverage ratio 5)(%)
• Core gap ratio (%)
• Funds should be sufficient to cover short-termpayments
• The requirement is above 100 per cent
147
110
145
108
143 2)
• Risk exposure amount (SEK bn)
• Common Equity Tier 1 ratio (%)
• Leverage ratio (%)
• Risk-weighted business volumes
• Capital available to cover future losses– in relation to the risk exposure amount
• Capital in relation to total assets
716
17.66)
5.1
611
19.4
5.2
990 2)
16.4 2)
5.3 2)
1) 2018: IFRS 9 definition. 2017: IAS 39 definition2) Peers: Danske Bank, SHB, Nordea, Swedbank and DNB3) The low peer average is due to net reversals for
Danske Bank and DNB
4) ORX: Fourth quarter 2017–third quarter 20185) 2018: EU definition. 2017: Swedish FSA definition6) New rules for 2018. Under the old rules, the outcome would be 20.1. See p. 47.
SEB Annual Report 2018 45
Risk, capital and liquidity management Report of theDirectors

hesitant market, slower credit growth, as well as challenges forhousing developers and the construction sector.
SEB’s Swedish household mortgage portfolio has grown belowthe market growth rate for the last few years, and amounted toSEK 487bn as of year-end 2018 (478). The portfolio is of highquality with low historical credit losses, sound loan-to-value(LTV) ratios and with strong repayment ability among customers.
Lending is based on the borrower’s repayment capacity, includ-ing the ability to manage an interest rate of seven per cent, andnew mortgage loans cannot normally exceed five times thehousehold’s gross income. In 2018, 98 per cent of all new loanswith an LTV above 50 per cent had an amortisation plan.Property values are continuously assessed and monitored.
Robust real estate portfolioSEB’s credit exposure from residential real estate is mainlySwedish and consists of high quality, private and publicly ownedreal estate companies as well as institutional investors. Theportfolio was stable at SEK 111bn as of year-end (108). SEB alsohas SEK 63bn (61) in exposure to housing co-operative associa-tions, a common residential housing form in Sweden. SEB has noexposure to the smaller housing developers niched towards thepremium segment.
SEB’s exposure to commercial real estate companies consistsmainly of strong counterparties with sound financing structuresin the Nordic region. The portfolio increased slightly to SEK 186bn(179) due to growth in the Nordic markets which was partly off-set by a continued reduction in Germany.
For several years, SEB has governed its exposure to the realestate sector by a group-wide risk tolerance level for the com-mercial real estate portfolio, divisional volume growth limitsas well as a firm real estate credit policy set by the Board.
Stable development in the BalticsThe Baltic economies continued to develop favourably as a resultof growing exports, investments and private consumption,although labour shortages and wage inflation present challengesin all three countries. At year-end, SEB’s Baltic credit portfolioamounted to SEK 182bn (166). The portfolio consists mainly ofcorporate and household exposures, while the real estatemanagement portfolio is limited. Lithuania accounts for SEB’slargest market in terms of credit exposure in the Baltics, followedby Estonia and Latvia.
High asset qualityAsset quality of the credit portfolio remained high. In a historicperspective, credit losses remained at a very low level, supportedby the low interest rate environment and favourable economicdevelopment. Net expected credit losses according to IFRS 9amounted to SEK 1,166m, corresponding to a net ECL level of 6basis points (5). Stage 3 loans (loans which are credit-impaired)amounted to SEK 8.2bn compared with SEK 10.2bn at the begin-ning of the year, when IFRS 9 was implemented. This correspondsto 0.5 per cent of the gross lending.
Stablemarket risk in increasingly volatile financialmarketsThe risk in the customer-driven trading is measured as Value-at-Risk (VaR), which averaged SEK 90m (91) in 2018. This meansthat the bank does not expect to lose more than this amountduring a period of ten trading days, with 99 per cent probability.The VaR development during the year was driven by highervolatility, especially in foreign exchange and equity marketsand higher interest rate exposure.
Credit portfolio, distribution by geography Per cent
2018Sweden 62
Other Nordic countries 16
Baltic countries 8
Germany and the UK 11
Other 3
Distribution based onSEB’s operations.
Credit loss development 1) Per cent
20152014 2016 2017 20180
0.10
0.05
0.15
0.20
0.25
1) 2018: Net ECL level based on IFRS 9 expected loss model.2014–2017: Credit loss level, net, based on IAS 39 incurred loss model.
Credit portfolio, development by sector SEK bn
-14 -15 -16 -17 -18 -14 -15 -16 -17 -18 -14 -15 -16 -17 -18 -14 -15 -16 -17 -18 -14 -15 -16 -17 -18 -14 -15 -16 -17 -18
300
0
600
900
1,500
1,200
Corporations Households Real estatemanagement
Housing co-operativeassociations
Public administration Banks
SEB Annual Report 201846
Report of theDirectors Risk, capital and liquidity management

Lowand reduced insurance risksSEB’s life insurance business consists mainly of unit-linked prod-ucts, where the market risk remains with the customer. In 2018,unit-linked products represented 69 per cent of total premiumincome (67). SEB also offers traditional insurance, occupationalpension and private health insurance in Sweden. In the traditionalinsurance portfolios, the difference between the value of theassets and guaranteed benefits serves as a buffer against theinsurance risk for SEB. The buffer increased throughout the yearas a result of asset returns and new business volumes. SEB’sDanish life insurance business was divested in 2018 (see note13), which reduced SEB’s aggregate insurance risk.
Strong capital positionDespite strong risk management and risk culture, unexpectedlosses can occur in banking. SEB’s capital management shallensure that the bank has sufficient capital to absorb such unex-pected losses. The Board of Directors sets SEB’s capital targettaking into consideration financial stability requirements by theregulators, debt investors, business counterparties, as well as theBoard’s view of capital need and debt rating ambitions. Theserequirements need to be balanced with the shareholders’required rate of return.
The Swedish FSA’s requirement for the Common Equity Tier 1(CET1) capital ratio consists of two parts. Pillar 1 is a general mini-mum requirement for all banks. Pillar 2 is a specific requirementbased on an assessment of SEB’s risk, liquidity and capital posi-tion made in the Supervisory Review and Evaluation Process. Asof 31 December 2018, the Swedish FSA has moved the require-ment of the mortgage risk weight floor from Pillar 2 to Pillar 1. Thechange resulted in a decrease of the CET1 ratio of approximately260 bps. SEB estimates the Swedish FSA’s CET1 capital require-ment to 14.9 per cent as of year-end 2018.
The Board’s target is to maintain a CET1 capital ratio of around150 basis points above the Swedish FSA’s requirement. This con-stitutes a buffer against potential variability in the capital posi-tion deriving, in particular, from changes in foreign exchange ratesand interest rate risk in the pension obligations. This means thatthe CET1 capital ratio target currently is around 16.4 per cent.
At year-end, SEB’s CET1 capital ratio amounted to 17.6 percent(19.4), implying a buffer of 270bps above the regulatory require-
ment. The main reason for the change is an increase in the riskexposure amount to SEK 716bn (611) of which the transfer of themortgage risk weight floor from Pillar 2 to Pillar 1 contributedwith an increase of SEK 92bn. The CET1 capital base increasedto SEK 126bn (118).
Capital adequacy Per cent
CommonEquityTier 1 capi-tal ratio
Tier 1 capi-tal ratio
Totalcapitalratio
CET1require-ment0
5
10
15
20
25
2016 2017 2018
Development of riskexposure amount (REA) SEK bn
Credit risk Market risk Operational risk
Credit value adjustment Investment in insurance business
Other exposures Additional risk exposure amount
0 100 200 300 400 500 600 700
2018
2017
2016
Update on regulatory requirements affecting capital adequacy
The EU Banking Reform Package– further risk reductionmeasures
As per end of 2018, the EU finalised the so-called ’banking pack-age’, which includes a number of measures aimed at reducing riskin the banking industry. The package includes changes to regula-tion on bank capital requirements (CRR/CRD IV) and the recoveryand resolution of banks (BRRD). The package implements, forexample, a binding leverage ratio and a binding net stable fundingratio (NSFR) into EU legislation. It will harmonise the rules forcapital requirements and minimum requirements for own fundsand eligible liabilities (MREL) in EU legislation. Applicable capitaland MREL requirements for large Swedish banks are expected tobe aligned with the new EU rules when they are implemented.
Finalisation of the Basel III framework
In December 2017, the Basel Committee presented revisions tothe Basel III framework, the so-called Basel IV. The revised frame-work includes restrictions to internal risk measurement models,as well as an output floor based on the standardised method.While SEB has started to assess the capital effects of the revisedframework, it is still too early to have a firm opinion about sucheffects. This is due to the fact that a number of issues are to befinalised and adapted to European and national implementation.According to the Basel Committee, implementation should startin 2022. The EU is expected to present a proposal for the imple-mentation of Basel IV in 2020.
In a parallel initiative, the European Banking Authority (EBA) is,together with national supervisors, attempting to harmoniseand reduce variation in internal models for capital adequacy.EBA proposes to introduce requirements on definitions andmodel parameters, and prescribe more detailed requirementson decision processes. SEB is expected to be fully compliant byDecember 2020.
SEB Annual Report 2018 47
Risk, liquidity and capital management Report of theDirectors

SEB’s leverage ratio, a non-risk-based ratio between Tier 1 capitaland assets, was 5.1 per cent at year-end (5.2), above the pro-posed minimum requirement of 3 per cent.
The capital requirements for Swedish banks are currently sig-nificantly higher than EU minimum levels and the Swedish banksare well capitalised compared with banks elsewhere in Europe,both from a risk-weighted and non-risk-weighted perspective.
SEB’s strong capitalisation was confirmed in EBA’s bi-annualEU-wide stress test. In EBA’s adverse stress scenario, SEB’s CET1capital ratio would decline from 18.3% to 16.5%, implying astrong resilience in the stressed scenario.
Asound liquidity and funding strategyAccess to liquidity and funding markets is vital in all circum-stances. SEB’s liquidity and funding strategy is managed fromthree perspectives: (1) optimising the liquidity structure of thebalance sheet to ensure that less liquid assets are matched withstable funding, (2) monitoring wholesale funding dependence,and (3) ensuring that the bank has sufficient liquidity reservesto withstand a severely stressed scenario.
In 2018, SEB saw continued good market demand for its newissues of short- and long-term funding. A high credit rating is impor-tant as it is the basis for the cost for SEB’s wholesale funding.Seep. 36 for SEB’s credit ratings. SEB’s liquidity reserve, as defined bythe Swedish Bankers’ Association, amounted to SEK 473bn atyear-end (340). The size and composition of the reserve isregularly analysed and assessed against estimated needs.
The Core gap ratio, which is SEB’s internal measure of the extentto which long-term lending is matched by long-term funding, was110 per cent (108), which is well within the board’s risk toleranceof a sound liquidity structure. SEB also manages its liquidity posi-tion in line with the upcoming regulatory Net Stable Funding Ratio(NSFR) requirement of at least 100 per cent, which is anticipatedto be effective as of 2021.
The Liquidity Coverage Ratio (LCR) measures to what extentliquid assets are sufficient to cover short-term cash outflows ina stressed scenario. SEB’s LCR amounted to 147 per cent at year-end (145). This is in compliance with the minimum requirement of100 per cent. The EU’s definition of LCR is used starting 1 January2018. The previous year’s number was calculated according tothe Swedish FSA’s method.
Focus on operational and other non-financial risksOperational risks are an inherent part of all businesses. SEB workscontinuously to mitigate operational risks in the daily business andprocesses in order to minimise operational losses and, in particular,to avoid larger losses. By developing and improving governanceand risk practices, the bank strives to mitigate both existing andemerging risks. In 2018, focus has been on further strengtheningthe governance and framework for cyber and information securityrisk management as well as model risk, all stemming from theincreased digitalisation of banking services.
Important processes and tools used to manage operationalrisks include a New Product Approval Process (NPAP), business
Cyber and information riskmanagement
Cybercrime is a growing threat to companies in general and tofinancial institutions in particular. Threats include, for example,social engineering, Distributed Denial of Services (DDoS),targeted attacks and ransomware. The behaviour of criminalsis constantly changing and digital wallets, with card details,passwords and Bank ID, are attractive to modern digitalthieves. Fraud directly aimed at private individuals increasedduring 2018.
Cybersecurity is the protection of data and IT systems fromtheft or damage of hardware, software, or information, as wellas from disruption or misdirection of services that the systemprovides. Stability and reliability of the bank’s IT platform iscrucial and security matters related to how SEB protects andmanages its own and customers’ data is of utmost importance.
SEB works with a risk-based approach and control environ-ment with the aim to identify, protect against, detect, respond
to and recover from security breaches. The bank continuouslyinvests in its security organisation, and regular technical secu-rity updates and upgrades of systems are prioritised, everythingin order to further strengthen the resilience.
By gathering all security functions into one Group Security &Cyber Defence unit, SEB takes a holistic approach to securityand data protection covering traditional security functionsbut also procurement, financial crime and legal functions.In 2018, several precautionary actions to combat fraudulentcrime were taken and the bank is working to raise securityawareness among both employees and customers, throughtraining, information and communication. SEB also works closelywith national and international networks and alliances in thefinancial industry, law enforcement authorities and otherauthorities to fight cybercrime.
Liquidity coverage ratio and Core gap ratio Per cent
0
40
80
120
200
160
Liquiditycoverage ratio 1)
Coregap ratio
1) 2018: EU definition, 2016–2017:Swedish FSA definition.
2016
2017
2018
Liquiditycoverageratiorequire-ment
EBA stress test – effect on CommonEquity Tier 1 capital ratio Per cent
0 4 8 12 16 20
EBApeers’
average
SEB
Actual reported year-end 2017
Stressed outcome
SEB Annual Report 201848
Report of theDirectors Risk, capital and liquidity management

continuity management, risk self-assessments, and identityaccess management. Employees are regularly trained withinimportant areas such as cyber and information security, fraudprevention, anti-money laundering, the Know-Your-Customer(KYC) processes and personal data protection (GDPR).
SEB’s reputation is built on long-term customer relationshipsand a business and risk culture based on high ethical standards,social and environmental responsibility, and professional con-duct. SEB’s Code of Conduct and core values, mandatory training,and dialogues on ethical and value-related dilemmas strengthenawareness of the importance of conduct among employees.Through an external whistle-blowing procedure, employees andothers are encouraged to report unethical and illegal incidents.Net losses from operational incidents amounted to SEK 197m (185)in 2018. Benchmarking against members of the ORX, a global oper-ational risk association in the financial services sector, shows thatSEB’s operational losses are below international peer average.
Sustainability and climate-related riskClimate change and its repercussions, such as extreme weatherconditions, are becoming increasingly apparent risk factors. Therisk of damage caused by climate change and risks arising from atransition to a low-carbon economy could not only have a nega-tive impact on SEB’s credit portfolio, but also on customers’investments in SEB’s funds.
Increased transparency on how banks respond to and managerisks arising from climate change is requested by customers andinvestors, and regulators are extending their supervision to alsocover sustainability and climate-related risks. In 2018, SEB com-mitted to support the international, voluntary recommendationsof the Task Force for Climate-related Financial Disclosures(TCFD). The task force is an industry-led working group, set up ata request from the G20 Financial Stability Board.See p. 68–69.
As a bank, SEB has the ambition to inform its customers aboutthe way money entrusted to the bank is used, both to whom itlends money and where it invests. All transactions shall meetSEB’s group-wide policies on corporate sustainability, environ-ment, and human rights as well as position statements on climatechange, fresh water and child labour. Lending to companies incertain sectors is guided through SEB’s six sector policies, armsand defence, forestry, fossil fuels, mining and metals, renewableenergy and shipping.
Acknowledging the climate-related transition risks, SEB has notprovided new financing of coal mining and coal power plantssince 2015. In 2018, SEB’s fund company continued to reduce thefossil fuel exposure in its fund offering. The number of sustaina-ble funds increased and as a consequence, the volume of assetsmanaged under the strictest sustainability criteria increasedfrom 25 per cent to 30 per cent.See p. 71. The bank also workswith power companies to find other sources of energy than com-bustion coal. SEB has signed the international climate agreementMontreal Carbon Pledge, where part of the commitment is toreport the carbon footprint from equity funds.
Both in its customer onboarding and credit granting process,SEB considers environmental, social and governance risks (ESGrisks) and the extent to which such risks can impact a customer’sultimate repayment capacity. Tools for analysing, documentingand monitoring ESG risks are being further developed.
Violation of human rightsRespecting and promoting human rights is an obligation of allresponsible businesses. SEB assesses the risk for violationof human rights in line with SEB’s Human Rights Policy and inter-national agreements (see p. 68). The bank continuously worksto prevent and remedy any negative impact related to humanrights. A customer with poor human rights ambitions can quicklybecome a high credit risk for the bank. There is also a high reputa-tional risk in investing in such companies. Human rights risks areassessed and monitored in the credit and investment processes,as well as in screening of new suppliers.
SEB’s fund company has strict criteria for how the activelymanaged funds relate to holdings that verifiably breach interna-tional norms regarding human rights criteria. In 2018, 100 per cent(100) of SEB’s fund company’s assets under management weremanaged with human rights criteria. Moreover, SEB engagesdirectly in dialogue with companies’ managements and boardsof directors regarding how to make improvements.
Corruption,money launderingand terrorist financingSEB strives to prevent corruption, in line with rules and regula-tions, and does not tolerate to be involved in or associated withbribes.
With globalisation and cross-border mobility, money launder-ing and terrorist financing have become an international problemof significant size. In order to prevent and combat this problem,international agreements as well as common measures and rulesare necessary. In 2018, the EU commission announced plans toincrease the mandate of the EBA to better tackle cross-bordermoney laundering within EU, partly as a result of a number ofmoney laundering cases during the year.
In order to contribute to financial stability and maintain SEB’sgood reputation, it is vital to understand the risk that SEB’s ser-vices are used for money laundering and terrorist financing. Adiligent Know-Your-Customer (KYC) process, covering customeridentification, regular risk assessment and transaction monitor-ing, is a prerequisite for understanding the risk factors that needto be considered. An enhanced due diligence is applied for cus-tomers, products and countries where the bank is believed to bemost exposed.
SEB has a clear governance model for the preventive workaround anti-money laundering and combating of terrorist financ-ing. In 2018, steps were taken to further strengthen the govern-ance and coordinate the bank’s work in the area by the appoint-ment of an AML Senior Officer in the Group Executive Committee.
SEB continuously works to reinforce its internal controls andprocedures in all geographic locations, and conduct employeetraining to strengthen awareness.
If any suspicious activities are traced, a report is filed with therelevant authorities. In such cases, SEB will always consider toend or limit the business relationship if the emerging risk cannotbe managed.
SEB Annual Report 2018 49
Risk, capital and liquidity management Report of theDirectors

In 2018, SEB worked with some 15 major regulatory projects at anestimated total cost of SEK 520m. In addition, the bank is continu-ously working on implementing technical standards and guidelinesfrom the EU’s three supervisory authorities for banking, insuranceand the securities markets, as well as from national FinancialSupervisory Authorities including the Swedish (FSA). In pace withimplementation of these rules and regulations both the bank, in itsinternal processes, and the supervisory authorities step up theircontrols of compliance.
Regulations related to sustainabilityThe UN’s 17 Sustainable Development Goals balance the threecornerstones of sustainable development: economic growth,social inclusion and environmental protection. Together with the2015 Paris agreement, the goals form the basis for a number ofnew frameworks – voluntary and statutory. The aim of theseframeworks is to clarify the role and responsibility of companiesin the area of sustainability. The financial sector has an importantrole in the transformation towards a sustainable society, and theSwedish FSA views climate and sustainability issues as a naturalextension of its mission to promote financial stability, well-func-
tioning financial markets and strong consumer protection.Climate issues–and sustainability issues in general – mayrepresent risks that must be taken into account in banks’overall risk assessments.
Sustainability aspects have attained an increasingly prom-inent role in legislative texts in recent years. In 2018, the EUCommission adopted an action plan for sustainable financialmarkets. The plan sets forth three recommendations:• establish a common taxonomy for sustainable financial
activities• improve information about how institutional investors are
working to integrate environmental, social and governancefactors in their risk processes
• create performance measures that help investors comparethe carbon footprint of their investments.
The recommendations are currently under discussion by theEU member states and the European Parliament.
In Sweden, the government has specified that the FSA shallintegrate sustainability into existing and new regulations, aswell as into its financial oversight.
Implementation of new regulations 2018–2020 1)
2018 20202019
Regulatory requirementsCompliancewith anti-money laundering requirements characterised 2018. Inaddition, the final implementation steps were taken for a number of extensive regulationsin areas such as investor protection, financial information, personal data protection andOpen Banking. Meanwhile, new regulatory requirements were added and a discussionon new sustainability regulations was initiated.
Financial stabilityBasel committee’s final reform package
IFRS 16 – Accounting rules for leases
KRITA/AnaCredit – Reporting of corporate loans
Market conductAML 4 and 5 – Anti-Money Laundering Directives
CSDR – Central Securities Depositories Regulation
EMIR – European Market Infrastructure Regulation
MAD/MAR – Market abuse rules
MiFID II / MiFIR – Markets in Financial Instruments Directive & Regulation
PSD 2 – Payment Services Directive
SFTR – Securities Financing Transactions Regulation
Consumer protectionGDPR – General Data Protection Regulation
IDD – Insurance Distribution Directive
PRIIPs – Packaged Retail and Insurance-Based Investment Products Regulation
1) Implementation work may continue after a regulation has entered into force.Regulations automatically apply as law in each EU country whereas directives apply through their implementation into national law.
SEB Annual Report 201850
Report of theDirectors Regulatory requirements

High-impact regulations
Financialstability
Ensure that the financialsystem can withstandeconomic shocks anddisturbances and alsoprevent that the failure ofone financial institutionleads to a systemiccollapse.
Reformpackages for bank stabilitySince the financial crisis in 2008, the regulators have taken many initiatives toincrease the resilience and stability of the financial system and improvements arecontinuously made.
In 2017, the Basel Committee agreed on a reform package that includes restric-tions in internal risk models, implemented through EU-legislation. In 2018, the EUfinalised its Banking Reform Package which will lead to changed regulations forcapital requirements and the recovery and resolution of banks in distress. Mean-while, the European Banking Authority (EBA) was working to harmonise internalcapital adequacy models. All of these initiatives, which may affect the level of SEB’scapital, will be phased in over a number of years starting in 2022.See page 47 formore information.
Marketconduct
Promote efficient pricesetting and execution infinancial markets, andprevent market manipula-tion through transparencyand risk mitigation.
Open formore competitionThe EU’s revised Payment Services Directive (PSD 2) aims to make payments withinand between EU countries faster and safer and to open the payment market for newplayers. PSD 2 offers payment providers better access to customer information andaccess to the established banking infrastructure. This concept is referred to as OpenBanking.
By opening for more competition, PSD 2 will likely over time affect both themarket for payments and banks’ role in the payment market. For SEB, PSD 2 opensthe possibility to provide its services to a new customer base and to build new busi-ness relationships. Large investments in technical solutions will be required in orderto facilitate co-operation with third party providers under the new rules – whileupholding customer protection. The PSD 2 requirements began to apply in 2018and implementation will continue in 2019.
Consumerprotection
Ensure fair treatment ofcustomers and supportimproved financial literacythrough relevant andcorrect information. Thisentails requirements interms of marketing andpackaging of financialservices, and investmentadvice services.
Safeguarding personal dataThe EU’s General Data Protection Regulation (GDPR) came into force in 2018. Since itreplaces national laws (in Sweden: the Personal Data Act), it decreases the complex-ity and the risk of legal uncertainty within the EU. The rules apply to all businesses,but have a greater effect on the financial sector, since financial institutions handlelarge volumes of personal data. One important requirement is the right to be forgot-ten – meaning that when a customer wants to be forgotten, his or her data must bedeleted as long as other laws permit it. In addition, customers are to be provided easyaccess to their personal data and information about how their data are processed.It is also easier for customers to transfer personal data to other parties.
SEB’s large implementation project for GDPR was completed in 2018, and nowthe bank has a new governance structure with a specially appointed data protectionofficer.
High-impact regulationsIn 2018, extensive efforts to counter money laundering (AML)continued. A new governance model for AML was also imple-mented, based on the EU’s AML 4 directive. Improving routinesand processes related to both AML and Know Your Customer(KYC) continued to have high priority in the bank. In order toimprove the quality of the KYC information, an enhanced tool
for risk assessment of individual customers was introduced.In addition, a review of customers’ due diligence levels wasinitiated. Transaction monitoring was strengthened with newdetection scenarios.
Certain new regulations with a particularly large impact onthe bank’s organisation and operations are described below.
Aims of regulations
SEB Annual Report 2018 51
Regulatory requirements Report of theDirectors

To maintain the important societal function as a bank, itis of paramount importance for SEB that all stakeholdershave great confidence and trust in the bank’s opera-tions. Professional people who are guided by strong and proper business conduct are crucial, as is maintaininga sound risk culture.
The importance of corporate governanceTo maintain trust among customers, employees, shareholdersand other stakeholders and prevent conflicts of interest, rolesand responsibilities are clearly defined for shareholders, direc-tors, management and other stakeholders.
SEB’s work with corporate governance is focused on ensuringsmooth and effective operations with high standards, sound riskmanagement and robust internal control.
Rules and regulationsAs a Swedish public limited liability financial institution with secu-rities listed on Nasdaq Stockholm, SEB is subject to numerousrules and regulations. The external framework for SEB’s corpo-rate governance includes the following rules and regulations:• the Companies Act• the Annual Accounts Act• the Nasdaq Stockholm Issuer Rules• the Swedish Corporate Governance Code• the Banking and Financing Business Act• the rules and guidelines issued by the Swedish Financial
Supervisory Authority and other authorities.See p. 50 for information about new regulatory requirements.
In addition, SEB applies an internal framework, which amongother things includes the Articles of Association, adopted by thegeneral meeting of shareholders. Policies and instructions thatdefine the division of responsibility within the group are tools for
the Board of Directors (the Board) and the President and ChiefExecutive Officer (the President) in their governing andcontrolling roles. Such policies and instructions include, amongothers:• Rules of Procedure for the Board and the Instructions for
the Board committees• Instructions for the President and the SEB Group’s Internal
Governance• Group Credit Instruction and Risk Policy• Instruction for Handling of Conflicts of Interest• Instruction for procedures against Money Laundering and
Terrorist FinancingSee extract on sebgroup.com• Code of ConductSee sebgroup.com• Remuneration Policy• Information Security Policy• Corporate Sustainability PolicySee sebgroup.com• Inclusion & Diversity PolicySee sebgroup.com• Policies on Suitability, Diversity and Composition of the Board,
the Group Executive Committee (GEC) and other key functionholders.
SEB’s ethical and sustainability endeavours are an integral part ofthe business, and the Board continuously discusses these issues.SEB’s Code of Conduct describes SEB’s values, ethics and stand-ards of business conduct and provides guidance on how to live bythese values. Policies and instructions for sustainability and vari-ous group-wide position statements and industry sector policiesaddressing environmental, social and governance issues are alsoof vital importance.
The Corporate Governance Report has been prepared inaccordance with the Annual Accounts Act and the SwedishCorporate Governance Code (the Code). SEB strives to follow theCode where appropriate and has no deviations to report for 2018.More information about corporate governance is available on
sebgroup.com
Corporategovernance
During the year, the Board has reviewed the bank’s long-term strategy and decided on the new business
plan for 2019–2021. It reflects the opportunities and challenges of the growing customer demand for rapid digitalisation and auto-mation of financial services as well as the bank’s efforts to provide sustainable products and services. The increasing competition and pace of change – and cyber threats becoming more frequent – reinforce the importance of upholding a solid corporate govern-ance framework to defend our strongest assets: our brand and our credibility.”
Marcus Wallenberg, Chair, Board of Directors
SEB Annual Report 201852
Report of theDirectors Corporate Governance

Shareholders and general meetings of shareholders
SEB has approximately 261,000 shareholders. Around 168,000of them own less than 500 shares, while 111 hold more than1,000,000 shares, accounting for 82 per cent of the capital andvotes. SEB’s share capital consists of two classes of shares – Ashares and C shares. Each Class A share carries one vote and eachClass C share carries one-tenth of a vote.SEB’s largest share-holders and the shareholder structure are shown on p. 29–30.
The Annual General Meeting (AGM) of shareholders is held inSwedish in Stockholm. All shareholders listed in the shareholderregister who have duly notified their attendance have the right toparticipate at the AGM and to vote for the full number of theirshares. Shareholders who cannot attend may appoint a repre-sentative. The 2018 AGM was held on 26 March. A total of 1,114persons, representing 1,832 shareholders, were in attendanceat the AGM. An electronic system for televoters was used at theAGM.
The main resolutions made at the AGM were:• approval of the dividend of SEK 5.75 per share• decision on the number of directors of the Board to be eleven• re-election of eleven directors• re-election of Marcus Wallenberg as Chair of the Board• re-election of PricewaterhouseCoopers as external auditor• adoption of guidelines for remuneration of the President and
the other members of the GEC• approval of three long-term equity programmes• issuance of a mandate to the Board concerning the acquisition
and sale of own shares for SEB’s securities business, for thelong-term equity programmes and for capital managementpurposes
• issuance of a mandate to the Board to resolve on the issuanceof convertibles.The minutes from the AGM are available on sebgroup.com
Board of Directors
President and Chief Executive Officer
p. 54
p. 60
Risk & CapitalCommittee
Audit & ComplianceCommittee
Remuneration & HRCommittee
NominationCommittee p. 54
ExternalAuditor p. 63
p. 59 p. 58
CEO Committees• Group Executive Committee
• Group Risk Committee
• Asset & Liability Committee p. 60
p. 60
p. 60
p. 59
Head of GroupCompliance p. 63
Head of GroupCredits p. 62
Head ofGroup Risk p. 62
Head of GroupInternal Audit
p. 63
General Meeting of Shareholdersp. 53
Appointed by
Reporting to/informing/submitting proposals to
Chief RiskOfficer p. 62
Corporate governance structure
SEB’s organisationAs of 1 January 2019
President and Chief Executive Officer
Group Staff and Control Functions
Business Support
SEB’s business operations aremanaged, controlled and followedup in accordance with policies andinstructions established by theBoard and the President.
The shareholders’ influence is exercised at general meetings of shareholders through,among other things, election of directors of the Board and the external auditor.
Division Large Corporates& Financial Institutions
Division Life Division Investment Management
Division Corporate& Private Customers
Division Baltic
SEB Annual Report 2018 53
Corporate Governance Report of theDirectors

Nomination Committee
The Nomination Committee nominates the Chair, the directors ofthe Board and the external auditor as well as makes recommen-dations regarding directors’ fees and fees for committee work.
Pursuant to a decision by the AGM, the Nomination Committeeis to be composed of the Chair of the Board along with represent-atives of the bank’s four largest shareholders that are interestedin appointing a member. One of the independent directors shallbe appointed as an additional member of the NominationCommittee.
The composition of the Nomination Committee meets therequirements laid out in the Code. The Nomination Committeehas access to relevant information about the bank’s operationsand financial and strategic position provided by the Chair of theBoard and the additional member.
An important principle is that the size and composition of theBoard shall be such as to serve the bank in the best possible way.Therefore, as the starting point for its work, the Nomination Com-mittee is tasked with assessing the degree to which the Boardmeets the demands that will be placed on the Board as a resultof the bank’s operations, organisation and future direction.
The Board’s size and composition is discussed and reviewedin terms of whether they have adequate knowledge, skills andexperience, both in the financial and other sectors. The directorsshould also have sufficient time to perform their duties andunderstand the business and the main risks of the bank. TheNomination Committee also reviews the evaluations of the Boardand the Chair of the Board. (See page 55).
The composition of the Board shall adhere to applicable lawsand regulations and to the Policy on Suitability, Diversity andComposition of the Board of Directors, adopted by the Board.The Nomination Committee shall ensure diversity within theBoard in terms of educational and professional background,gender, age and geographical provenance of the directors.
Furthermore, the Nomination Committee discusses successionmatters with particular emphasis on continuity and long-termperspective in ensuring the Board’s competence and composition.
The Nomination Committee for the 2019 AGM was appointed inthe autumn of 2018. No special fee has been paid to the membersof the Nomination Committee.
Board of Directors
The Board has adopted Rules of Procedure that regulate theBoard’s role and ways of working as well as special instructionsfor the Board’s committees.
The Board has the following duties, among others:• deciding on the objective, strategy and framework for the
business activities as well as the business plan• regularly following up and evaluating the operations in relation
to the objectives and guidelines established by the Board• ensuring that the business is organised in such a way that the
accounting, treasury management and the risks inherent in thebusiness as well as financial conditions in all other respects arecontrolled in a satisfactory manner in accordance with externaland internal rules
• adopting policies and instructions for the business operations• deciding on major acquisitions and divestments as well as other
major investments• appointing or dismissing of the President, the members of the
GEC, the Chief Risk Officer (CRO), and the Head of Group InternalAudit, as well as setting the remuneration of these individuals.
The Chair of the Board organises and directs the work of theBoard and ensures among other things that the directors on a reg-ular basis receive information and education on changes in rulesconcerning the activities of SEB and on responsibilities of direc-tors of a listed financial company. Educational and specialisationseminars are held each year, and new directors are offered semi-nars with information on, and discussions about, the group’s vari-ous operations, including information about the control functions.
The directors are elected by the shareholders at the AGM for aone-year term. Since the 2018 AGM the Board shall consist ofeleven AGM-elected directors, without deputies, and of twodirectors with two deputies who serve as employee representa-tives and are appointed by the trade unions. In order for a quorumto exist at a Board meeting, more than half of the directors mustbe present. The President is the only AGM-elected directoremployed by the bank. The Nomination Committee has assessedthe directors’ independence in relation to the bank and the bank’smanagement as well as in relation to shareholders controlling10 per cent or more of the shares or votes and has found that thecomposition of the Board meets the requirements of the Code.
The work of the Board follows a yearly plan. In 2018, the Boardheld 17 meetings. The President attends all board meetingsexcept those dealing with matters in which the President hasan interest that may be in conflict with the interests of the bank,such as when the President’s work is evaluated. Other membersof the GEC participate whenever required.
Nomination Committee for the 2019 AGM
Member RepresentingVotes (%)
31Aug. 2018
Petra Hedengran, chair Investor 20.8
Magnus Billing Alecta 6.9
Lars Heikensten Trygg-Stiftelsen 5.3
Javiera Ragnartz AMF Försäkring och Fonder 4.2
Marcus Wallenberg SEB, Chair of the Board
37.2Tomas Nicolin, additional member, appointed by the Board.
Javiera Ragnartz represented AMF in the Nomination Committee until4 February 2019, when she was replaced by Anders Oscarsson. JavieraRagnartz left the Nomination Committee to assume a position at SEB.Swedbank Robur Fonder, which was the bank’s fourth largest shareholder,declined to appoint a member of the Nomination Committee.
The Nomination Committee’s proposals for decisions, includingmotivated account as regards directors, are available onsebgroup.com
The primary task of the Nomination Committee is to submitproposals to the AGM regarding the Chair and directors of theBoard as well as the external auditor.
The Board has overall responsibility for the organisation,management and operations of the SEB group.
SEB Annual Report 201854
Report of theDirectors Corporate Governance

Directors’ fees
The AGM in 2018 resolved that the total fees to the Board shouldamount to SEK 9,700,000. Directors’ fees are paid on a runningbasis during the mandate period. Following a recommendationby the Nomination Committee, the Board has adopted a policythat recommends that directors use 25 per cent of their fee topurchase and hold SEB shares up to an amount corresponding toone year’s fee. Neither the President nor the directors appointedby the employees receive any Director fee.
Board committees
At present, there are three committees: the Risk and CapitalCommittee (RCC), the Audit and Compliance Committee (ACC),and the Remuneration and Human Resources Committee (RemCo).These committees report to the Board on a regular basis. Animportant principle is that as many directors as possible shallparticipate in committee work. The Chair of the Board serves asvice chair of the three committees. Neither the President nor anyother officer of the bank is a member of the committees.
Evaluation of theBoard of Directors, thePresident and theGroup Executive Committee
The Board uses an annual self-assessment method, whichamong other things includes a questionnaire, followed bydiscussions within the Board. Through this process the activi-ties and work methods of the Board, the Chair of the Boardand the respective committees are evaluated. Among theissues examined are:• the extent to which the individual directors take an active
part in Board and committee discussions• whether directors contribute with independent opinions• whether the meeting atmosphere facilitates open
discussions.
The outcome of the evaluation is presented to and discussedby the Board and the Nomination Committee. The evaluationprocess and its outcome contribute to further improvementof the Board’s work and help the Nomination Committee todetermine the appropriate size and composition of theBoard.
The Chair of the Board formally evaluates each individualdirector’s work once a year. Marcus Wallenberg does notparticipate in the evaluation of the Chair’s work, which in2018 was directed by vice chair Jesper Ovesen. The Boardevaluates the work of the President and the GEC on a con-tinuous basis, without participation by the President or anyother member of the GEC.
On theBoard’s agenda in 2018
Q1 Q2 Q3 Q4
• AGM notification and AGMproposals
• Macroeconomic review• Balance sheet, capital and
dividend matters• Annual report 2017• Internal and external audit
reports as well as GroupCompliance report
• Financial governance modeland financial targets
• Remuneration of thePresident, the GEC andcontrol functions
• Statutory meeting• Group talent review and
succession planning• IT plan 2018• Appointment of GEC
members
• Review of the business areaMarkets within the divisionLarge Corporates & FinancialInstitutions
• Monitoring of business envi-ronment, focused on nichebanks
• Macroeconomic review• Internal Capital and Liquidity
Assessment (ICAAP andILAAP)
• Remuneration policy• Follow-up of compliance
with new regulations• SEB long-term strategy• Business plan 2019–2021
• SEB’s long-term strategy• Business plan 2019–2021• Review of operations in
SEB Germany• Employee survey
• Annual meeting with theDirector General of theFinancial SupervisoryAuthority
• Recovery and Resolutionplan
• Business plan 2019–2021,financial plans and forecasts
• Risk strategy• Annual review of policies
and instructions• SEB’s Code of Conduct• Board evaluation• Risk seminar• Media focus on SEB’s role
in money laundering andtax evasion
• Adoption of new Inclusionand Diversity Policy
SEB’s quarterly report, a report from the Board committees and a summary of SEB’s risk position,asset quality, credit portfolio and liquidity position are on the Board’s agenda each quarter.
SEB’s AGM in 2018 set total fees for the directors of the Boardand decided how these fees should be distributed among theBoard and its committees.
The Board’s overall responsibility cannot be delegated.However, the Board has established committees to handlecertain defined issues and to prepare such issues for decisionby the Board.
SEB Annual Report 2018 55
Corporate Governance Report of theDirectors

Board of Directors
1 MarcusWallenberg
2 SvenNyman
3 JesperOvesen
4 Johan H.Andresen
5 SignhildArnegård Hansen
Position Chair since 2005 Vice Chair since 2017 Vice Chair since 2014 Director Director
Committee lRCC lACC lRemCo lRCC lACC lRemCo
Year elected 2002 2013 2004 2011 2010
Born 1956 1959 1957 1961 1960
Education B.Sc. (Foreign Service) B.Sc. (Business and Econ.) B.Sc. (Econ.) and MBA B.A. (Government andPolicy Studies) and MBA
B.Sc. (Human Resources) andjournalism studies
Otherassignments
Chairman of Saab andFAM. Vice Chairman ofInvestor. Director of Astra-Zeneca Plc., TemasekHoldings Ltd and the Knutand Alice WallenbergFoundation.
Chairman of RAM RationalAsset Management. Direc-tor of RAM ONE, Ferd AS(Norway), Nobel Founda-tion’s Investment Commit-tee, Stockholm School ofEconomics, StockholmSchool of EconomicsAssociation and of Axeland Margaret Ax:sonJohnson’s Foundation.
Director of SunriseCommunications GroupAG (Switzerland) andConva Tec Group Plc. (UK).
Owner and Chairman ofFerd AS (Norway). Chair-man of Council on Ethicsfor the GovernmentPension Fund Global(Norway). Director ofSWIX Sport AS (Norway),NMI-Nordic MicrofinanceInitiative and JuniorAchievement Europe.
Chairman of SnackCo of Amer-ica Corp (USA). Vice Chairman ofthe Swedish-American Chamberof Commerce (SACC) (USA).Director of Business Swedenand Entrepreneurship and SmallBusiness Research Institute(ESBRI), SOS Children VillagesSweden and SACC New York.
Background Citibank in New York,Deutsche Bank, S GWarburg Co, Citicorp HongKong and Stora Feldmühle.Executive Vice Presidentof Investor and CEO ofInvestor. Several assign-ments as chairman anddirector of large publiccompanies.
Broad experience fromthe financial businessfield. Managerial positionswithin Investor. CEOand founder of LancelotAsset Management andArbitech. Several director-ships.
Price Waterhouse. VicePresident and later CEO ofBaltica Bank A/S. VicePresident and Head ofFinance of Novo NordiskA/S. CEO of Kirkbi Group.CFO of Den Danske BankA/S, LEGO Holding A/S andTDC A/S. Several director-ships.
International Paper Co.Partner of Ferd AS. CEO ofFerd AS.
President of the family-ownedcompany Svenska LantChips.Chairman of the Confederationof Swedish Enterprise. ViceChairman of Business Europe.Director of Innventia, IFL atStockholm School of Economics,Research Institute of IndustrialEconomics, Loomis, Universityof Lund, Magnora, King Carl XVIGustaf’s Foundation for YoungLeadership and TransatlanticBusiness Dialog.
Nationality Swedish Swedish Danish Norwegian Swedish
Own and closely relatedpersons’ shareholdings
753,584 Class A sharesand 720 Class C shares
10,440 Class A shares and10,200 Class C shares
25,000 Class A shares 100,000 Class A shares 5,387 Class A shares
Independentinrelationtobank/major share holders
Yes/No Yes/Yes Yes/Yes Yes/Yes Yes/Yes
Attendance at Board/Committee meetings1)
16 of 16 / 29 of 31 16 of 17 17 of 17 / 23 of 23 14 of 17 17 of 17 / 8 of 8
Remuneration,Board meetings, SEK
2,940,000 930,000 930,000 700,000 700,000
Remuneration,Committee meetings , SEK
805,000 – 815,000 – 387,500
13
14
10 5 1
8
7
lChair lVice Chair lMember1) Includes only the meetings that the Director could attend without conflict of interest.
SEB Annual Report 201856
Report of theDirectors Corporate Governance

6 SamirBrikho
7 WinnieFok
8 TomasNicolin
9 HelenaSaxon
10 JohanTorgeby
Director Director Director Director Director (President and CEO)
lRCC l ACC lRCClRemCo lACC
2013 2013 2009 2016 2017
1958 1956 1954 1970 1974
M.Sc. (Engineering,Thermal Technology),Hon. Dr. (Cranfield University).
Bachelor of Commerce B.Sc. (Econ.) andM.Sc. (Management)
M.Sc. (Business and Econ.) B.Sc. (Econ.)
UK Business Ambassador.Co-Chairman of the UK-UAE Busi-ness Council and the UK-ROKCEO Forum. Director of Euro-Chem Group AG. Member ofAdvisory Board of Stena. Chair-man of the Step Change Charity.
Director of Volvo Car Corpora-tion, G4S plc (UK). Member ofthe Investment Committee ofHOPU Investments Co, Ltd.(Asia), senior advisor to FAMand WFAB.
Chairman of Centre for Justice.Director of Nordstjernan, NobelFoundation and Axel andMargaret Ax:son Johnson’sFoundation. Member of theInvestment Committee of NiamProperty Fund.
CFO at Investor. Director ofSwedish Orphan Biovitrum.
Director of the Swedish Bank-ers’ Association and of the Insti-tute of International Financeand Mentor Sweden.
Broad international experiencefrom management and leader-ship, especially within the indus-trial sector. Leading positionswithin ABB, e.g. as Division Headand CEO of significant subsidiar-ies. Member of the GEC of ABBLtd. CEO of Amec Foster Wheelerplc.
Broad experience from thefinancial business field. Certi-fied Public Accountant inAustralia and in Hong Kong.Member of the Institute of Char-tered Accountants in Englandand Wales. Industrial advisorand senior advisor to Investorand Husqvarna. CEO and SeniorPartner of EQT Partners Asia Ltdand CEO of New Asia PartnersLtd.
Broad experience in the finan-cial sector as CEO of Alecta,Third National Swedish PensionFund and E. Öhman J:or Fond-kommission as well as a leadingposition in Handelsbanken.Several directorships.
Financial analyst at GoldmanSachs and Investor, CFO atSyncron International andHallvarsson & Halvarsson.Investment Manager atInvestor.
Portfolio Manager & MacroEconomist (Swedbank), Head ofNordic & Dutch Corporate DebtCapital Markets & Risk Manage-ment, Executive Director, Finan-cial Sponsors Group PrivateEquity at Morgan Stanley inLondon, Head of Client Cover-age, Merchant Banking. Co-headof division Large Corporates &Financial Institutions.
Swedish, Swiss British Swedish Swedish Swedish
0 shares 3,000 Class A shares 66,000 Class A shares 12,500 Class A shares 5,567 Class A shares, 84,809share rights and 138,037conditional share rights.
Yes/Yes Yes/Yes Yes/Yes Yes/No No/Yes
17 of 17/ 15 of 16 16 of 17 / 7 of 7 17 of 17 / 20 of 20 16 of 16 / 7 of 7 17 of 17
700,000 700,000 700,000 700,000 –
345,000 265,000 540,000 425,000 –
2
12 6
11
4
3
9
11 12 13 14
See information p. 58
Sara Öhrvall was a director of the Board until 30 June 2018, when she left at her ownrequest and joined the bank as Chief Digital, Customer Experience and Communications Officer.
SEB Annual Report 2018 57
Corporate Governance Report of theDirectors

When required, the ACC prepares, for decision by the Board, arecommendation for the appointment or dismissal of the Headof Group Internal Audit. The Committee maintains regularcontact with the bank’s external and internal auditors anddiscusses the co-ordination of their activities. The Committeealso ensures that any remarks and observations from the audi-tors are addressed, and evaluates the external auditor’s workand independence. When required, a proposal from the Presi-dent on appointment or dismissal of the Head of Group Compli-ance is subject to the Committee’s approval.
The ACC held seven meetings in 2018. The Head of GroupFinance, the external auditors, the Head of Group Internal Auditand the Head of Group Compliance submit reports for the Commit-tee’s consideration. In addition, the President, the Finance Directorand the CRO regularly participate in the meetings.See p. 66 forthe Report on Internal Control over Financial Reporting.
1 2
Directors appointed by the employees (See group photo on p. 56–57.)
11 Anna-KarinGlimström
12 HåkanWesterberg
13 AnnikaIsenborg
14 CharlottaLindholm
Position Director Director Deputy Director Deputy Director
Year elected 2016 2015 1) 2016 2) 2015
Born 1962 1968 1967 1959
Education University studies in mathemat-ics, statistics and law.
Engineering logistics. University studies in workingenvironment.
LLB
Other assignments Chairman of Financial SectorUnion of SEB group and FinancialSector Union Western section inSEB, Director EB-SB Fastigheterand EB-SB Holding.
Chairman of the Association ofUniversity Graduates at SEB.
First deputy Chairman of Finan-cial Sector Union of SEB andFinancial sector union regionalclub Group Operations of SEB.
Vice Chairman of the Associa-tion of University Graduates atSEB. Director of the Foundationof Alma Detthows.
Background Office manager and variousother positions in SEB. Variousspecialist and leader roleswithin Trygg-Hansa. Director ofSEB’s Profit Sharing Foundation.
Sales manager at Trygg-Hansa inthe property insurance business.SEB in various positions insystems management and ITdevelopment, currently SystemsManagement Advisor.
Employed at Fixed Income,Group Operations. Director ofSEB’s Profit Sharing Foundationand Result Premium Foundation.
Various client responsibilitypositions in several divisions andsubsidiaries in the SEB. Pres-ently client executive at PrivateBanking Foundations.
Nationality Swedish Swedish Swedish Swedish
Own and closely relatedpersons’ shareholdings
0 shares809 conditional share rights
4,005 Class A shares and809 conditional share rights
257 Class A shares and1,618 conditional share rights
221 Class A shares and809 conditional share rights
Attendance at Boardmeetings
16 of 17 17 of 17 16 of 17 15 of 17
Each business unit is responsible for the risks it takes – the first lineof defence. Long-term customer relationships and a sound risk cultureprovide a solid foundation for SEB’s risk-taking decisions. Initial riskassessments are made of both the customer and the proposed trans-action. The business units ensure that transactions are correctly pricedand that the assumed risks are managed throughout the life of thetransaction. Larger transactions are reviewed by a credit committee.The business units are responsible for ensuring that the activitiescomply with applicable group-wide policies and instructions and aresupported by a clear decision-making hierarchy.
The risk and compliance functionsconstitute the second line of defence.These units are independent from thebusiness. The risk function is responsiblefor identifying, measuring, monitoring andreporting risks. Risks are measured bothon detailed and aggregated levels. Inter-nal measurement models have beendeveloped for the majority of the credit
The 2008 financial crisis led toincreasingly demanding regulations,which in turn led to a significant increasein the need for internal control of regula-tory compliance and financial reporting.2018 was therefore characterised bycontinued intensive work on the imple-mentation of measures to ensure compli-ance with regulations such as GDPR,PSD 2 and IFRS . Another area that calledfor extra attention of the Committee in 2018 was the preparationfor election of new external auditor in accordance with the EUAuditing Regulation. The committee recommended that EY beproposed by the Nomination Committee as the bank’s new externalauditor at the 2019 AGM.”
Helena SaxonChair of the ACC
Three lines of defence in riskmanagement
Audit and Compliance Committee
ACCmembersHelena Saxon (Chair), Marcus Wallenberg (Vice Chair),Jesper Ovesen and Winnie Fok.
The ACC supports the Board with quality assurance of, andinternal control over, the financial reporting and the reportingto supervisory authorities. The ACC also monitors the effec-tiveness of internal controls in relation to compliance andaudit matters.
1) Deputy director 2011–20142) Deputy director 2014
SEB Annual Report 201858
Report of theDirectors Corporate Governance
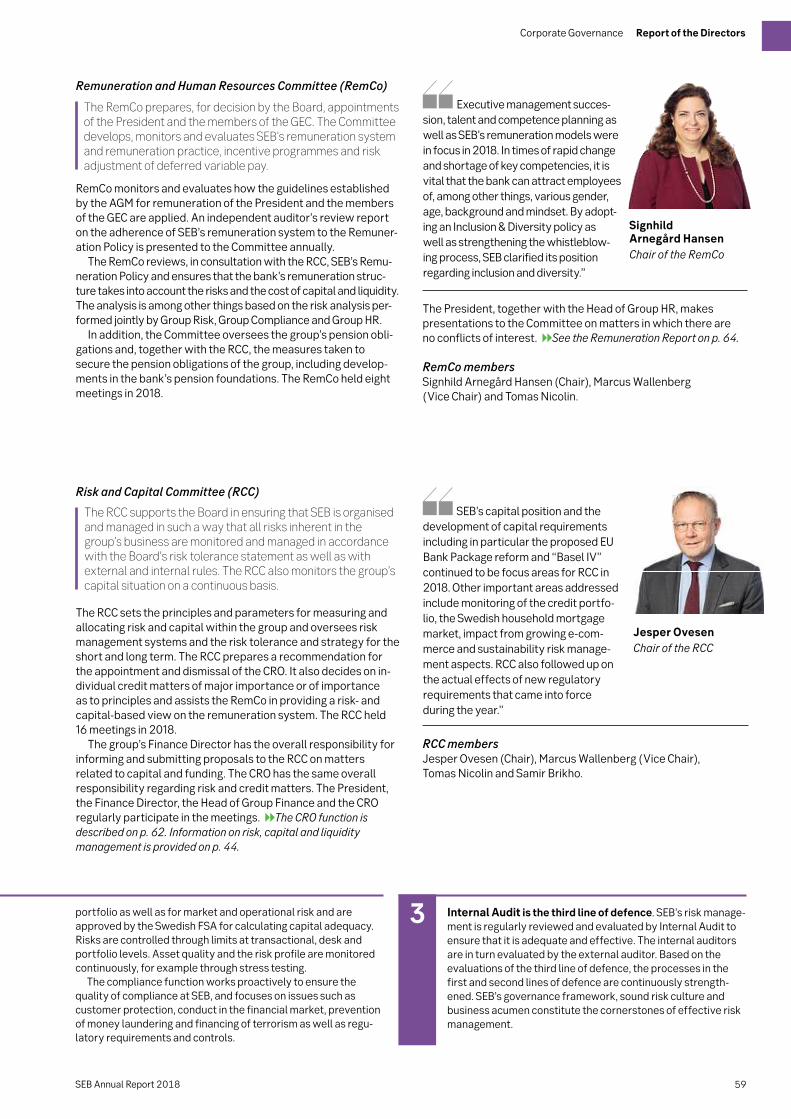
RemCo monitors and evaluates how the guidelines establishedby the AGM for remuneration of the President and the membersof the GEC are applied. An independent auditor’s review reporton the adherence of SEB’s remuneration system to the Remuner-ation Policy is presented to the Committee annually.
The RemCo reviews, in consultation with the RCC, SEB’s Remu-neration Policy and ensures that the bank’s remuneration struc-ture takes into account the risks and the cost of capital and liquidity.The analysis is among other things based on the risk analysis per-formed jointly by Group Risk, Group Compliance and Group HR.
In addition, the Committee oversees the group’s pension obli-gations and, together with the RCC, the measures taken tosecure the pension obligations of the group, including develop-ments in the bank’s pension foundations. The RemCo held eightmeetings in 2018.
The RCC sets the principles and parameters for measuring andallocating risk and capital within the group and oversees riskmanagement systems and the risk tolerance and strategy for theshort and long term. The RCC prepares a recommendation forthe appointment and dismissal of the CRO. It also decides on in-dividual credit matters of major importance or of importanceas to principles and assists the RemCo in providing a risk- andcapital-based view on the remuneration system. The RCC held16 meetings in 2018.
The group’s Finance Director has the overall responsibility forinforming and submitting proposals to the RCC on mattersrelated to capital and funding. The CRO has the same overallresponsibility regarding risk and credit matters. The President,the Finance Director, the Head of Group Finance and the CROregularly participate in the meetings.The CRO function isdescribed on p. 62. Information on risk, capital and liquiditymanagement is provided on p. 44.
3portfolio as well as for market and operational risk and areapproved by the Swedish FSA for calculating capital adequacy.Risks are controlled through limits at transactional, desk andportfolio levels. Asset quality and the risk profile are monitoredcontinuously, for example through stress testing.
The compliance function works proactively to ensure thequality of compliance at SEB, and focuses on issues such ascustomer protection, conduct in the financial market, preventionof money laundering and financing of terrorism as well as regu-latory requirements and controls.
Executive management succes-sion, talent and competence planning aswell as SEB’s remuneration models werein focus in 2018. In times of rapid changeand shortage of key competencies, it isvital that the bank can attract employeesof, among other things, various gender,age, background and mindset. By adopt-ing an Inclusion & Diversity policy aswell as strengthening the whistleblow-ing process, SEB clarified its positionregarding inclusion and diversity.”
SEB’s capital position and thedevelopment of capital requirementsincluding in particular the proposed EUBank Package reform and “Basel IV”continued to be focus areas for RCC in2018. Other important areas addressedinclude monitoring of the credit portfo-lio, the Swedish household mortgagemarket, impact from growing e-com-merce and sustainability risk manage-ment aspects. RCC also followed up onthe actual effects of new regulatoryrequirements that came into forceduring the year.”
SignhildArnegård HansenChair of the RemCo
Jesper OvesenChair of the RCC
Internal Audit is the third line of defence. SEB’s risk manage-ment is regularly reviewed and evaluated by Internal Audit toensure that it is adequate and effective. The internal auditorsare in turn evaluated by the external auditor. Based on theevaluations of the third line of defence, the processes in thefirst and second lines of defence are continuously strength-ened. SEB’s governance framework, sound risk culture andbusiness acumen constitute the cornerstones of effective riskmanagement.
Remuneration and Human Resources Committee (RemCo)
Risk and Capital Committee (RCC)
The President, together with the Head of Group HR, makespresentations to the Committee on matters in which there areno conflicts of interest.See the Remuneration Report on p. 64.
RemComembersSignhild Arnegård Hansen (Chair), Marcus Wallenberg(Vice Chair) and Tomas Nicolin.
RCCmembersJesper Ovesen (Chair), Marcus Wallenberg (Vice Chair),Tomas Nicolin and Samir Brikho.
The RCC supports the Board in ensuring that SEB is organisedand managed in such a way that all risks inherent in thegroup’s business are monitored and managed in accordancewith the Board’s risk tolerance statement as well as withexternal and internal rules. The RCC also monitors the group’scapital situation on a continuous basis.
The RemCo prepares, for decision by the Board, appointmentsof the President and the members of the GEC. The Committeedevelops, monitors and evaluates SEB’s remuneration systemand remuneration practice, incentive programmes and riskadjustment of deferred variable pay.
SEB Annual Report 2018 59
Corporate Governance Report of theDirectors

The President
The Board has adopted an instruction for the President’s dutiesand role. The President reports to the Board and submits at eachboard meeting a report on, among other things, the performanceof the business in relation to decisions made by the Board. ThePresident appoints the Heads of Divisions and Heads of the variousstaff and support functions that report directly to the President.
The President’s committees
The Group Executive Committee (GEC)To safeguard the interests of the group as a whole, the Presidentconsults with the GEC on matters of major importance or ofimportance as to principles. The GEC addresses, among otherthings, matters of common concern to several divisions, strategicissues, sustainability, business plans as well as financial fore-casts and reports. The GEC held 39 meetings in 2018. The Presi-dent has appointed seven managers as additional members ofthe GEC. They participate in GEC meetings from time to time toprovide expertise and insight within primarily their area ofresponsibility.
The Asset and Liability Committee (ALCO)The ALCO, chaired by the President and with the Finance Directoras vice chair, is a group-wide decision-making, monitoring andconsultative body. The ALCO, which held nine meetings in 2018,handles the following matters, among others:• financial stability, particularly in the new regulatory framework• strategic capital and liquidity issues, including internal capital
allocation and principles for internal pricing• structural issues and issues related to the bank’s balance
sheet and business volumes• financing of wholly-owned subsidiaries• the balance sheet and funding strategy for the group.
The Group Risk Committee (GRC)The GRC, chaired by the President and with the CRO as vice chair,is a group-wide, decision-making committee that addresses alltypes of risk, including sustainability and reputational risks,at group level in order to evaluate portfolios, products andcustomers from a comprehensive risk perspective. The GRCheld 66 meetings in 2018. The GRC is tasked with:• making important credit decisions• ensuring that all risks inherent in the group’s activities are
identified, measured, monitored and controlled in accordancewith internal and external rules
• supporting the President in ensuring that decisions regardingthe group’s long-term risk tolerance are followed in the busi-ness organisation
• ensuring that the Board’s guidelines for risk management andrisk control are implemented and that the necessary rulesand policies for risk-taking in the group are maintained andenforced.
JohanTorgeby
MagnusCarlsson
MagnusAgustsson
JeanetteAlmberg
JoachimAlpen
MartinJohansson
Position President and CEOsince 2017
Deputy President &CEO since 2014
Chief Risk Officersince 2017
Head of Group HumanResources since 2016
Executive Vice Presi-dent. Co-Head of theLarge Corporates &Financial Institutionsdivision since 2018
Head of BusinessSupport since 2011and Chief of Staffsince 2018
GECmember
since
2014 2005 2017 2016 2014 2009
SEBemployee
since
2009 1993 2009 2008 2001 2005
Born 1974 1956 1973 1965 1967 1962
Education B.Sc. (Econ.) B.Sc. (Econ.) C.Sc and M.Sc B.Sc. (Econ.) MBA, M.A. (Interna-tional relations)
B.Sc. (Econ.)
Nationality Swedish Swedish Icelandic and Finnish Swedish Swedish Swedish
Own and closelyrelated persons’
shareholdings
5,567 Class A shares,84,809 share rightsand 138,037 condi-tional share rights.
54,998 Class Ashares, 55,933 sharerights and 113,440conditional sharerights.
8,744 Class A shares,4,970 share rights and34,461 conditionalshare rights.
10,600 Class A shares,33,055 share rightsand 58,049 condi-tional share rights.
6,112 Class A shares,98,783 share rightsand 118,948 condi-tional share rights.
236 Class A shares,41,079 share rightsand 156,104 condi-tional share rights.
The President, who is also the Chief Executive Officer, isresponsible for the day-to-day management of the activitiesof SEB in accordance with the directives of the Board. ThePresident shall ensure that the organisation and administra-tion of SEB is appropriate. The President is overall responsiblefor managing all risks of SEB in accordance with the policiesand instructions of the Board and the intentions as stated inthe risk tolerance statements.
The President has three main committees at his disposalfor the purpose of managing the operations.
Group Executive Committee (as per 1 January 2019)
SEB Annual Report 201860
Report of theDirectors Corporate Governance

WilliamPaus
NinaKorfu-Pedersen
MatsTorstendahl
RihoUnt
MasihYazdi
SaraÖhrvall
Executive Vice Presi-dent. Co-Head of theLarge Corporates &Financial Institutionsdivision since 2018
Head of Group Financesince 2016
Executive Vice Presi-dent. Head of theCorporate & PrivateCustomers divisionsince 2018
Head of the Baltic divi-sion since 2016, GroupAML Senior Officersince 2018
Finance Director since2018
Chief Digital, CustomerExperience andCommunicationsOfficer since 2018
2018 2018 2009 2016 2018 2018
1992 2010 2009 2001 2013 2018
1967 1973 1961 1978 1980 1971
M.Sc. (Econ.) M Sc. (Econ) M.Sc. (EngineeringPhysics)
MBA, MA (PublicAdministration)
B.Sc. (Econ) M Sc. (Econ)
Norwegian Norwegian Swedish Estonian Swedish Swedish
52,900 Class A shares,75,962 conditionalshare rights, 6,481phantom share rightsand 27,386 conditionalphantom share rights.
436 Class A shares,11,477 share rights and22,014 conditionalshare rights.
104,218 Class Ashares, 50,494 sharerights and 184,391conditional sharerights.
1,063 Class A shares,7,773 share rights and56,574 conditionalshare rights.
10,257 Class A shares,11,587 share rights and46,189 conditionalshare rights.
1,150 Class A shares.
On theGEC agenda in 2018
• Macroeconomic development• Discussion on regulations, such as MiFID II, GDPR, AML4
and PSD 2• Annual accounts and quarterly reports• AGM preparations• Review of the bank’s various businesses and home markets• Follow up of current Business Plan 2016–2018• SEB long-term strategy and new Business Plan 2019–2021• Discussion on capital requirements, asset quality and risk• Quarterly reports from Group Compliance, Internal Audit
and Group Risk.• Review of, and discussion on, the digitalisation work
including development and launch of enhanced customerfunctionality as well as internal automation initiatives
• Review and discussion on IT, including investments, security,agile steering and cloud services
• Discussion on strategic investments and co-operationwith fintech and digitalisation companies
• Discussion on customer satisfaction, branding and imageposition as well as customer insight work
• Employee Insight survey 2018 – discussion of surveyresult and actions
• Development of corporate sustainability• Review of outsourced activities• Investor World update• Review process for handling of customer complaints• Know-Your-Customer and Anti-Money-Laundering training• Annual review of policies and instructions, including SEB’s
Code of Conduct• Discussion on inclusion and diversity• Review of competence and leadership development• Workshop on risks
Divisions and business areas
The Board regulates the activities of the group through aninstruction for internal governance which establishes how thegroup’s divisions, including the international activities conductedthrough branches and subsidiaries, are to be governed and organ-ised. The head or co-heads of a Division have overall responsibil-ity for the activities in the business areas and appoint, after
consultation with the President, heads of the business areaswithin the division.
A Country Manager is appointed in a country outside Swedenwhere SEB maintains business operations. The Country Managerco-ordinates the group’s business locally and reports to aspecially designated member of the GEC.
SEB’s business is organised in divisions. Each division isresponsible for the subsidiaries designated to the division.
SEB Annual Report 2018 61
Corporate Governance Report of theDirectors

The Chief Risk Officer (CRO) is appointedby the Board and reports to the Presi-dent. The CRO keeps the Board, theRCC, the ACC, the GEC, the ALCO andthe GRC regularly informed about riskmatters. The CRO has global functional responsibility, and theactivities of the CRO are governed by and set out in an instructionadopted by the Board. The CRO function is organised in threeunits: Group Risk, Group Credits and CRO Office.
The main objective for Group Risk is to ensure that all risks inSEB’s activities are identified, measured, monitored, controlledand reported in accordance with external and internal rules. Theyalso manage models for risk measurement. CRO Office aggre-gates and analyses data across risk types and the group’s creditportfolios and handles general matters surrounding risk govern-ance and risk disclosure. Group Credits is responsible for manag-ing the credit approval process, for certain individual credit deci-sions and for monitoring compliance with policies set by the RCCand the Board. Its activities are regulated by the group’s CreditInstruction, adopted by the Board. The chairs of the respectivedivisional credit committees have the right to veto credit deci-sions. Material exceptions to the group’s Credit Policy must beescalated to a higher level in the decision-making hierarchy.
Head of Group Risk and Head of Group Credits are appointedby the President, upon recommendation by the CRO, and reportto the CRO.For information about risk, capital and liquiditymanagement see p. 44.
Business support and Group staff functions
Business Support covers such areas as transaction processing,development, maintenance and operation of IT systems, andmanagement of SEB’s IT portfolio.
SEB’s Group staff functions have global responsibility andsupport the organisation with services in the areas of FinancialControl, Human Resources, Legal Affairs, Digital experience& Innovation, Communication, Marketing and CorporateSustainability.
The CRO function
Additionalmembers of theGroup Executive Committee (as per 1 January 2019)
JohanAndersson
PeterHøltermand
AusraMatuseviciene
NicolasMoch
MarcusNystén
DavidTeare 1)
JohnTuresson
Position Country ManagerSEB Germanysince 2016
Country ManagerSEB Denmarksince 2002
Head of Opera-tions since 2015
Chief InformationOfficer since 2018
Country ManagerSEB Finland since2010
Head of the Lifedivision since2019
Country ManagerSEB Norway since2018
Additionalmember
since
2009 2011 2018 2018 2014 2019 2018
SEBemployee
since
1980 1997 2002 2008 1998 2006 2006
Born 1957 1963 1973 1972 1960 1963 1978
Education B.Sc. (Econ.) B.Sc. (Econ.) MBA M.Sc. M.Sc. (Econ.) B. Comm. MBA
Nationality Swedish Danish Lithuanian Swedish andFrench
Finnish Canadian andBrittish
Swedish
Own andcloselyrelated
persons’share-
holdings
51,056 Class Ashares, 22 Class Cshares and 747conditional sharerights.
436 Class Ashares, 18,658share rights,83,157 conditionalshare rights, 7,616phantom sharerights, 49,470conditional phan-tom share rights.
9,890 Class Ashares, 12,558share rights and28,798 condi-tional sharerights.
3,689 Class Ashares, 5,457share rights and28,525 condi-tional sharerights.
119,847 Class Ashares, 53,493conditional sharerights, 7,027phantom sharerights and 32,786conditional phan-tom share rights.
54,932 Class Ashares, 50,071share rights and74,600 condi-tional sharerights.
0 Class A shares,24,524 condi-tional sharerights, 5,186phantom sharerights and 19,506conditional phan-tom share rights.
Magnus AgustssonChief Risk Officer
1) As Head of Division Life & Investment Management in 2018, David Teare was an ordinary member of the GEC in 2018
Business Support and Group staff functions are cross-divi-sional functions established to leverage economies of scaleand support to the business.
The CRO function is responsible foridentifying, measuring, analysing andcontrolling SEB’s risks and is independ-ent from the business.
SEB Annual Report 201862
Report of theDirectors Corporate Governance

Group Internal Audit
The main task of Group Internal Audit is to evaluateand give assurance to the Board and the President thatgovernance, risk management and internal controlsare adequate and effective. The work is done with arisk-based approach in accordance with the methodol-ogy developed by the Institute of Internal Auditors.
Each year the ACC adopts a plan for the work of Internal Audit. The Head ofInternal Audit reports the findings of completed audits, actions taken andthe status of previously reported findings to the ACC and also providesreports to the RCC and the Board.
The President and GEC are regularly informed about internal audit mat-ters. Group Internal Audit’s work is evaluated in a quality assessment, atleast every fifth year, by an independent party. Group Internal Audit co-ordi-nates its work covering the bank’s financial reporting with the bank’s exter-nal auditor. The bank’s external auditor relies to some extent on the work ofGroup Internal Audit in its assignment to review the group’s financial report-ing. This requires that the external auditor evaluates Group Internal Audit’swork. The conclusion of this evaluation is reported to the ACC and GroupInternal Audit.
Sustainability governance
The Board of Directors is responsible for deciding on SEB’sstrategy and sustainability approach, and for adopting theCorporate Sustainability Policy. The President takes decisionsin the Group Executive Committee (GEC) on the developmentof the sustainability work, in line with the strategy set by theBoard. An operational steering committee has been assignedby the President to take responsibility for and monitor thebank’s sustainability work.
Clear and effective structures for distribution of responsibilityensure that SEB’s sustainability efforts address relevantissues and that these are implemented across the entiregroup.
For a full description of SEB’s sustainability governance,see sebgroup.com
Group Compliance
The Group Compliance function advises the busi-ness and management, in order to secure that SEB’sbusiness is carried out in compliance with regula-tory requirements, and thereby promoting trustfrom customers, shareholders and the financialmarkets.
Special areas of responsibility are:• customer protection• conduct on the financial market• prevention of money laundering and financing of terrorism• regulatory systems and controls.
The Head of Group Compliance, who is appointed by the President afterapproval by the ACC, reports regularly on compliance matters to the Presi-dent, the GEC and the ACC, and annually to the RCC and the Board. Basedon an analysis of the group’s risks in this area, the President adopts, afterapproval by the ACC, an annual compliance plan. The Instruction for GroupCompliance is adopted by the Board.
Born 1966; Auditor of SEB, Partner in charge asof 2012. Authorised Public Accountant, Presidentof PwC Sweden.
Othermajor assignments:Sandvik and Fagerhult.
Previousmajor assignments:Ericsson, Securitas, Assa Abloy and Electrolux.
Information about the auditorAccording to SEB’s Articles of Association, thebank shall have at least one and not more thantwo auditors with at most an equal number ofdeputies. A registered auditing firm may beappointed auditor.
PricewaterhouseCoopers AB has been thebank’s auditor since 2000 and was re-electedin 2018 for the period up to and including the2019 AGM.
The fees charged by the auditor for the audit-ing of 2017 and 2018 financial years and for otherassignments invoiced during these periods areshown in the table below .
Fees to the auditor SEK m
2018 2017
Audit assignment 27 30
Audit-related services 12 21
Tax advisory 15 12
Other 21 5
Total 1) 75 69
1) Of which PricewaterhouseCoopers SEK 58m (65).
Peter NyllingeAuditor, PricewaterhouseCoopers
Gent JanssonHead of GroupCompliance
Björn RosenkvistHead of GroupInternal Audit
Group Internal Audit is a group-wide control func-tion commissioned by the Board to independentlyevaluate the group’s activities. The Head of GroupInternal Audit is appointed by the Board.
The Group Compliance function has the respons-ibility to inform, control and follow up on compli-ance matters. Group Compliance is independentfrom the business organisation.
SEB Annual Report 2018 63
Corporate Governance Report of theDirectors

SEB aims to attract and retain committed and competent employ-ees who are eager to continuously develop, embrace new waysof working and contribute to the bank’s long-term success.Employee remuneration shall build upon value creation, encour-age high performance and risk-taking that is aligned with the levelof risk tolerance set by the Board of Directors, and sound andresponsible behaviour based on SEB’s values. The ambition is topromote long-term commitment to creating sustainable value forcustomers and shareholders.
An employee’s remuneration shall reflect the complexity, respon-sibility and leadership qualities required of the role as well as his orher individual performance. SEB regularly monitors employee per-formance and development, among other things on the basis oftransparent, individual financial and non-financial goals.
Remuneration PolicySEB’s remuneration principles are laid out in the RemunerationPolicy, which is revised and adopted yearly by the Board of Direc-tors following a drafting process by Remuneration and HumanResources Committee (RemCo). The policy stipulates that remu-neration shall be aligned with the bank’s strategy, goals, valuesand long-term interests. It reflects Swedish and international rulesand regulations and shall ensure that conflicts of interest areavoided.For information on RemCo, see p. 59.
The Board’s Risk and Capital Committee (RCC) reviews the policyand remuneration structure to verify that SEB’s risks, long-termearnings capacity, and cost of liquidity and capital are taken intoaccount. The review is based on a risk analysis performed by GroupRisk.
The policy lays out the principles for identification and remunera-tion of employees in positions with a material impact on the group’srisk profile (Identified Staff). This also applies for employees whocan impact the risk profiles of mutual funds, who provide invest-ment advice, or who have a material impact on what services andproducts are offered. In 2018 a total of 974 employees (989) werecategorised as Identified Staff.
Employees in control functions shall be remunerated in a man-ner that is independent from the business areas they oversee,that is commensurate with their key roles in the organisation, andthat is based on goals that are compatible with their functions.
Remuneration structureThe bank’s remuneration structure consists mainly of base salary,variable remuneration as well as pensions and other benefits.
Base salaryThe base salary, which makes up most of an employee’s remuner-ation, shall be competitive and commensurate with the employ-ee’s experience, responsibility and long-term performance.It shall also be in line with industry peers in the respectivegeographical markets in which SEB operates.
Variable remunerationAll variable remuneration is based on SEB’s risk-adjusted perfor-mance and is adapted to applicable rules governing the maximumshare of an employee’s base salary, the deferred portion of remu-neration, shares and fund units, and the right to withhold andreduce remuneration that has not yet been paid out. For Identi-fied Staff, variable remuneration may not exceed 100 per cent oftheir base salary.
The models for variable remuneration are based on financialand non-financial key ratios at group level. Individual variableremuneration is also based on the performance of the employee’sunit and includes an annual evaluation of performance andbehaviours at the individual level. Non-financial goals take intoaccount such factors as the development of customer satisfac-tion, compliance and sustainability matters, for instance thebank’s own environmental impact and integration of sustainabil-ity in the business model. At the individual level, key parametersinclude compliance with rules and policies for risk-taking in thegroup, SEB’s Code of Conduct, and demands on internal controlsof the business areas.
Collective profit-sharingThe largest variable remuneration programme is the SEB AllEmployee Programme 2018 (AEP), which is the bank’s collectiveprofit-sharing programme that was adopted by the 2018 AnnualGeneral Meeting. It covers essentially all of the bank’s employ-ees. The purpose is to reward both short- and long-term valuecreation that is aligned with the customers’ and shareholders’interests. Half of the yearly outcome is deferred for three yearsand is paid in shares. The programme’s targets are coupled toSEB’s business plan and consist of the financial targets for returnon equity and the bank’s cost development, which are alsocommunicated externally, and the non-financial target forcustomer satisfaction. The outcome for 2018 was determinedto be 60 per cent (56) of the maximum amount, which in Swedenwas SEK 75,000.
Remuneration report
All Employee Programmes (AEP)
2018 1) 2017 2)
Number of participants 14,950 14,800
Outcome in relation to maximum amount 3), % 60 56
Shares allotted, thousands 3,200 2,538
Market value per 31 December, SEKm 270 244
Total outcome per participant 4) 45,000 42,000
Payout year: 1) 2022, 2) 2021, 3) SEK 75,000 in Sweden, 4) in Sweden
Base salary 8,200
Equity-basedprogrammes 393
Cash-based variableremuneration 350
All Employee Programme 487
Social charges 2,553
Pensions 1,263
Other staff costs 756
Total 14,004
Staff costs, 2018 SEK m
All Employee Programme consists of equity and cash.
SEB Annual Report 201864
Report of theDirectors Corporate Governance

Individual variable remunerationThe bank’s senior managers, other key employees and employeesin certain business units in which it is standard market practice,are offered individual, variable remuneration. The main ambitionis that this remuneration shall be deferred and paid out in SEBshares. Equity-based remuneration is a means of attracting andretaining employees with key competence. It also provides anincentive for employees to be shareholders of SEB, whichpromotes a long-term commitment that is aligned with the share-holders’ interests. In addition, the rules require that variableremuneration be largely paid out in the form of shares or fundunits.
The 2018 Annual General Meeting (AGM) resolved on twoseparate individual share programmes – the SEB Share DeferralProgramme 2018 (SDP) for members of the Group ExecutiveCommittee, certain other senior managers and a number of otherkey employees, and the SEB Restricted Share Programme 2018(RSP), for employees in certain business units. For regulatoryreasons, the latter programme also exists in a form in which theremuneration is deferred and paid out in fund units. Both pro-grammes include scope for risk adjustment for current and futurerisks. The final outcome may therefore subsequently be reducedor cancelled entirely in accordance with applicable rules, such astaking into account the bank’s result and the capital and liquidityrequired for the bank’s operations. Approximately 10 per cent ofemployees are eligible for individual variable remuneration.
For a limited group of employees variable remuneration consistspartly or entirely of cash that is paid out yearly or deferred for anumber of years in accordance with applicable rules. Approxi-mately 7 per cent of employees– such as those in investmentbanking – receive variable remuneration with a cash component,but only in cases where it entails a low or no residual risk for SEB.For employees who receive variable remuneration above a certainlevel, a portion of it must always be deferred and is revocable. In2018, cash-based variable remuneration accounted for 3 per cent(2) of SEB’s total staff costs.
Remuneration of the President andmembers ofthe Group Executive CommitteeSEB’s Board of Directors decides on the remuneration of thePresident and other members of the Group Executive Committee(GEC) based on an evaluation and recommendation by RemCo.Their remuneration shall be in line with the guidelines set by theAGM and consists of base salary, equity-based remuneration(the SEB Share Deferral Programme), and pensions and otherbenefits.
No cash-based variable remuneration is paid to membersof the GEC, nor are they eligible for the SEB All EmployeeProgramme (AEP). The pension plans are defined-contributionsolutions, with the exception of a defined-benefit componentprovided under collective agreements, and are in line with theSEB Group’s Pension Policy. A maximum of five days of vacationmay be saved per year.
For termination of employment initiated by the bank, a maxi-mum of 12 months’ severance pay is payable, after the noticeperiod. SEB has the right to deduct income earned from otheremployment from any severance pay.
The AGM guidelines are evaluated on a continuous basisthroughout the year. To perform this evaluation, RemCo obtainsinformation from the Head of Group Human Resources, the Headof Group Internal Audit and the external auditor, and with respectto the GEC members, also from the President. In addition, exter-nal remuneration analyses are performed yearly of relevant sec-tors and markets. This internal and external information makesup a vital component for ensuring that remuneration is alignedwith the market and is competitive.
Prior to the 2018 AGM the bank’s external auditor issued astatement to the Board assuring that SEB has adhered to theguidelines for salary and other remuneration for the Presidentand other GEC members set by the 2017 AGM.For information about SEB’s remuneration structure, see note 8
and the AGM information on sebgroup.com.
Share Deferral and Restricted Share Programmes
2018 2017
Restricted ShareProgramme
Share DeferralProgramme Total
Restricted ShareProgramme
Share DeferralProgramme Total
Number of participants 439 802 1,241 – 1,448 1,448
Shares allotted, thousands 1,450 3,385 4,835 – 4,646 4,646
Market value, 31 December, SEK m 125 335 460 – 447 447
Remuneration in SEB in 2018 SEK thousands
Basesalary
Cash-basedvariable
remuneration
Expensed amountlong-term equity based
programmes Benefits PensionsTotal
President and CEO Johan Torgeby 1) 11,000 1,250 346 12,596 3,834
Other members of the GEC 2) 57,644 8,259 2,165 68,068 16,964
Total 68,644 0 9,509 2,511 80,664 20,798
SEB excluding GEC 8,131,827 635,308 586,280 78,484 9,431,899 1,241,953
SEBTotal 8,200,471 635,308 595,789 80,995 9,512,563 1,262,751
1) During 2018, J. Torgeby did not exercise any share rights.2) The number and composition differ somewhat during the year but on average twelve members are included. At the end of the year the
number of members were twelve. During the year Other members of GEC have exercised rights to a value of SEK 25,128,614.
SEB Annual Report 2018 65
Corporate Governance Report of theDirectors

Internal Control over Financial Reporting (ICFR)is a well-established process designed toprovide reasonable assurance regarding thereliability of financial reporting and reduce therisk for misstatements. ICFR is based on theframework established by the Committee ofSponsoring Organizations of the TreadwayCommission (COSO) and is applied by SEBin a yearly cycle.
Perform risk assessmentIn order to identify and understand which risks exist,financial results and balance sheets are analysed atSEB group and unit levels. The outcome is used todetermine which units, processes and systems areto be covered by the ICFR process in the coming yearaccording to the materiality principle.
Identify risks and expected controlsPeople with expertise in the business divisionsand finance department evaluate if the controls areeffective, if new risks have been identified and ifnew controls need to be in place to mitigate the risksmore effectively. The controls are communicated toinvolved parties within the bank in order to clarifyexpectations and responsibilities. The frameworkconsists of group-wide controls as well as controlscovering business processes and IT – for exampleanalysis of the balance sheet and income statement,account reconciliations and controls of system accessrights.
PlanEvery year a plan is prepared based on the riskassessments and expected controls. The plan clari-fies who is responsible for evaluating the respectivecontrols within each unit, what type of evaluationshould be conducted and how the results are to bereported. At this stage the plan is coordinated withthe plans of internal and external audit.
Evaluate controlsThe controls are evaluated on a continuous basisthroughout the year by the control owners throughself-assessments. In this way the bank’s weaknessescan be identified, compensating controls imple-mented and improvements made. Furthermore,reporting is done quarterly by financial managers togive an assurance of the reported figures from eachunit. The evaluation describes material financialreporting risks (if any) and comments on materialdeviations compared with previous quarters.
ReportThe result of the evaluations of controls are analysedto assess the risk for misstatements in the financialreporting. Monitoring reports are submitted on aquarterly basis to the Finance Director and Head ofGroup Finance in connection with the quarterly exter-nal financial reporting. Reporting is also done to theAudit and Compliance Committee (ACC) once a year.
The group-level ICFR report includes a descriptionof the residual risk, an assessment of identified con-trol gaps and whether they are compensated by othercontrols, and how the work with remediation activi-ties is progressing. The report contributes to transpar-ency in the SEB organisation and enables prioritisationof improvement activities based on the residual risk.
Independent testingIn addition to this process, Internal Audit performsindependent testing of the ICFR framework.
1P
1PIn o1In ofin1finSE1Sde1deto b1to b12
Ide
2IdPeo2Peand f2aneff2effnew c2nemo2moinv2inv
4Eva
4EvaThe c4The cthro4throself-4selfcan b4can bmen4men4
5Rep
5ReThe r5The rto as5to arepo5repoqua5quaGrou5Gronal f5
nal f
3Pl
3PEv3Evas3asfie3fieco3cosh3shre3
re
Independent testing performed by Internal Audit
ICFR is anintegratedpart of dailyoperations
Report(quarterly)
Performrisk assess-ment (in Q3)
Plan(in Q1)
Identify risksand expectedcontrols(in Q4)
Evaluatecontrols
(continuously)
1
2 3
4
5
Internal control overfinancial reporting
Focus areas 2018In addition to the ongoing work during 2018, thefollowing main areas were in focus within theframework of internal controls:• Design and implementation of internal controls
over supervisory reporting (ICSR) to providereasonable assurance regarding its reliability.Reports to local supervisor are quality assuredprior to submission through a regular assess-ment process.
• Further development of controls for compli-ance with the reporting standard IFRS 9 Finan-cial Instruments (See note 53). The mainimprovement was the reconciliation routinesbetween the balance sheet and granularportfolio information.
SEB Annual Report 201866
Report of theDirectors Corporate Governance

The report describes SEB’s sustainability work, the indirect anddirect impact of the business, and is based on the most materialaspects of SEB’s sustainability framework. Descriptions coverprocedures in relation to human rights, labour rights and socialrelations, anti-corruption and the environment among otherthings. Risks related to these areas are described in the Risk,capital and liquidity management chapter.See p.48–49.
Other key aspects of SEB’s sustainability work, such as corpo-rate governance (including sustainability governance) and staffcomposition, remuneration and benefits, are included in applica-ble parts of the Report of the Directors. The diversity policyapplied for the Board is described in the Corporate GovernanceReport.See p. 52 and 54.
SEB reports in accordance with the Swedish Annual AccountsAct, chapter 6, and the Global Reporting Initiative, GRI Standards,core option. A description of SEB’s materiality analysis, stake-holder dialogues, a wide range of KPIs and the GRI Index arepresented in SEB’s Sustainability Fact Book & GRI Index onsebgroup.com.
PwC has performed limited assurance procedures for bothSEB’s Sustainability Report and SEB’s Sustainability Fact Book& GRI Index.
About SEB’s businessSEB is a leading Nordic financial services group. In Sweden andthe Baltic countries, SEB offers financial advice and a wide rangeof financial services to companies, financial institutions andprivate individuals. In Denmark, Finland, Norway, Germany and inthe United Kingdom focus is on a full-service offering to corporateand institutional customers. The bank strives to provide custom-ers with services that meet their needs and preferences includinglong-term sustainability aspects.Read more about SEB’s busi-ness model on p. 16–17.
Approach to sustainabilityAs a bank SEB is an integrated part of society. SEB aims to be arole model in sustainability and has a strong ambition to contrib-
ute to sustainable growth and to help customers and other stake-holders prosper. Through financing and investment activities thebank strives to facilitate the transition towards sustainable solu-tions. The world has common challenges and SEB can be a drivingforce and thereby part of the solution.
SEB aims to contribute to short-, medium- and long-term valuecreation from economic, social, governance and environmentalperspectives. In the course of its business, SEB impacts, bothdirectly and indirectly, markets and communities and at the sametime recognises the importance of responding and adapting totrends that impact the bank.
SEB aims to avoid or minimise negative impact of its productsand services and strives to identify business opportunities tocreate positive impact in line with the bank’s purpose, vision andstrategy.
Sustainability is integrated in SEB’s business activities throughthe sustainability framework, consisting of success factors andfundamental enablers. To get the greatest possible effect, SEBhas chosen to focus on four success factors:• Innovation and entrepreneurship – SEB is guided by a strong
belief that entrepreneurial minds and innovative companiesare the key to creating a better world. SEB supports innovationand entrepreneurship to drive sustainable economic develop-ment and contribute to creating new jobs and growth in society.
• Sustainable financing – SEB strives to contribute to reorientingcapital flows to low-carbon and sustainable activities, toincrease the share of positive impact financing and positivelyimpact customers’ sustainability focus.
• Sustainable investments – SEB aims to have a comprehensiveand competitive offering with environmental, social andgovernance factors fully integrated into all investmentprocesses.
• Responsible and proactive advice – SEB engages in under-standing its customers’ needs and preferences in the transitionto a more sustainable society. This is enabled by engaged andknowledgeable employees.
The fundamental enablers (blue boxes below) are at the core of
SEB’s sustainability framework
Successfactors
Fundamentalenablers
Responsible and proactive advice
Innovation and entrepreneurship
Sustainable financing Sustainable investments
Financial strengthand resilience
Riskmanagement
Business ethicsand conduct
Cyber and informa-tion security
and Data protectionPeople
Sustainability ReportThis report constitutes SEB’s statutory sustainability report 2018.The report covers the SEB group, that is the parent companySkandinaviska Enskilda Banken AB (publ) and its subsidiaries.
SEB Annual Report 2018 67
Sustainability Report Report of theDirectors

SEB’s long-term success. As a company in the business of trust,short-comings in any of these areas would limit the bank frombeing able to create long-term value for stakeholders.
During 2018, sustainability aspects were further integratedinto several core processes such as SEB’s business planningprocess where sustainability has been defined as one strategiccomponent of SEB’s business plan 2019–2021.See p. 10–12.
Guidelines and policiesSEB’s sustainability work is based on applicable laws, regula-tions, international agreements and initiatives. These include:• The UN Global Compact• The UN Universal Declaration of Human Rights• The ILO Core Conventions on Labour Standards• The UN Guiding Principles on Business and Human Rights• Children’s Rights and Business Principles• The OECD Guidelines for Multinational Enterprises• UN-supported Principles for Responsible Investments (PRI)• The UN Environment Programme Finance Initiative (UNEP FI)• The Equator Principles.
Over the years, SEB has developed various steering documents inthe area of sustainability. SEB abides by the Corporate Sustaina-bility Policy, the Environmental Policy, the Human Rights Policy,the Code of Conduct, the Code of Conduct for suppliers and theTax Policy. SEB has three position statements (Child Labour,Climate Change and Fresh Water) and six sector policies (Armsand Defence, Forestry, Fossil Fuel, Mining and Metals, RenewableEnergy and Shipping). These provide guidelines on best practiceas well as on the international conventions and standards thatthe bank encourages companies to follow. SEB aims to work withcustomers and portfolio companies towards improved businesspractices. Furthermore, SEB is committed to international agree-ments such as the Paris Agreement and the UN Sustainable
Development Goals and actively supports the EU CommissionAction Plan for Financing Sustainable Growth and the Task Forcefor Climate-related Financial Disclosures (TCFD).
UNSustainable Development GoalsThe UN Sustainable Development Goals (SDGs) have set theglobal agenda for nations, businesses and societies on how toapproach the major challenges of our time, how to achievesustainable economic growth, social inclusion and environmentalprotection.
As SEB’s customers are represented in all segments and in awide range of sectors, the bank can add value and contribute toall of UN’s SDGs, directly and indirectly. However, the bank hasidentified and prioritises four of the goals that are clearly linkedto the business strategy and sustainability approach, and wherethe operations have a fundamental impact:
Decent work and economic growth
Industry, innovation and infrastructure
Climate action
Peace, justice and strong institutions
In 2018, SEB continued to integrate the above SDGs into the busi-ness, and this report also visualises the connection to severalother SDGs.Read more on SEB and the SDGs on sebgroup.com.
The climate change challenge and TCFD recommendations
SEB believes that climate change is one of the most seriousglobal challenges the world is facing. It will have significantimpact across many sectors and the bank has an importantrole to ensure transparency around climate-related risks andopportunities. The 2018 report from United Nation’s Intergov-ernmental Panel on Climate Change (IPCC) pointed to thegrowing importance of nations, organisations and the businesscommunity strengthening their efforts to limit the globaltemperature rise to well below the 2°C target.
Climate change governance at SEBIn 2018, SEB endorsed the Task Force on Climate-related Finan-cial Disclosures (TCFD) recommendations, a global initiativeaiming to increase and harmonise companies’ climate-relatedfinancial disclosure to stakeholders. Since then, the bank hasinitiated work to implement the TCFD recommendations, underthe sponsorship of the Chief Risk Officer, targeting four corner-stones – governance, strategy, risk management, as well asmetrics and targets. SEB’s ambition is to further integrate theclimate challenge into its processes.
The Board of Directors has adopted the Corporate Sustaina-bility Policy, which includes SEB’s environmental commitment.The president has approved the bank’s position statement onclimate change. The Board of Directors also oversees SEB’s risk
management framework. SEB‘s governance around sustaina-bility starts with the oversight by the Board of Directors tooperational committees in the divisions.See p. 63 for moreinformation about sustainability governance.
Since 2018, the Group Risk Committee is the formal escala-tion forum for reputational and sustainability risk matters.
One priority of the Group Sustainability function in 2018was to further develop the key performance indicators inorder to measure progress within sustainability.
Climate change strategyTo date, a number of strategic decisions have been taken as aresult of the climate challenge. Examples include SEB’s decisionto lower its exposure to coal producers in both its credit portfo-lio and fund holdings. The ambition is also to grow the greenloan portfolio consisting of assets contributing to lower carbonemissions, as well as new products such as green mortgagessupporting energy efficient housing. Integrating sustainabilityin the business model, aiming to develop new sustainable prod-ucts and services, and enhancing corporate advisory capacityto capture opportunities in a transforming energy sector aresome of the initiatives in the bank’s business plan 2019–2021.
SEB Annual Report 201868
Report of theDirectors Sustainability Report

Innovation and entrepreneurshipSEB was founded over 160 years ago in the service of enterpriseand has since then been committed to supporting companies todevelop and create value for society. Thriving businesses lead togrowth and new jobs, as well as opportunities to solve environ-mental and societal challenges.
Through partnerships with Sweden’s leading entrepreneurshiporganisations at all levels, SEB strives to strengthen the businessclimate in Sweden.Read more on p. 25.
SEB regularly hosts events that connect entrepreneurs and inno-vators with investors, both in Sweden and the Baltic countries.One example is the Innovation Forum in Stockholm where newlystarted companies have the opportunity to pitch their ideas topotential investors among SEB’s customers. Since the start in2014, close to 50 per cent of them have secured funding. In 2018,more than 15,000 new start-ups were financed.
Sustainable financingResponsible financing and lending are cornerstones of SEB’s busi-ness, creating long-term sustainable value for customers andshareholders. SEB is committed to supporting its customers intheir work on transitioning to sustainable solutions. The bankintegrates risks and opportunities related to environmental,social and governance (ESG) aspects into customer dialogues,policies and processes. According to SEB’s Credit Policy onCorporate Sustainability, sustainability risks shall be consideredin all credit decisions, with focus on the repayment capacity ofthe customer, the underlying value of collateral, as well as repu-tational consequences for SEB. The aim is to identify, analyse andmanage these issues, including in the areas of human rights,anti-corruption, labour rights, social relations and environment.
SEB continuously strives to further integrate sustainabilityinto its business as well as into risk management and due dili-gence processes. The bank is convinced that increased knowl-edge and understanding among employees is crucial for suc-cess. In 2018, the bank therefore intensified this work. As anexample training and education in sustainability-related issueswere held for approximately 120 employees in group functions
including Group Risk, Compliance and Internal Audit. Externalspeakers have also conducted training for SEB employees onspecial matters. One example is Science Based Targets, amethodology to set climate transition targets, presented byWorld Wildlife Fund (WWF). Through increased knowledgeand understanding, the aim is to further integrate sustainabilityin due diligence processes, such as the Know-Your Customerprocess.
Supporting customersSEB supports its customers in their efforts to reduce negativeenvironmental impact on biodiversity and the environment.At the same time, SEB strives to identify opportunities associatedwith customers’ ambitions to choose sustainable solutions.
The bank does for example not provide financing for new coal-fired power plants, other than to customers committed to theuse of technologies such as “carbon capture”, which substantiallyreduce greenhouse gas emissions. SEB aims to support legacycustomers in making environmentally beneficial improvementsin their shift away from coal.
SEB’s climate disclosure basedon TCFD recommendations
Governance • Climate change governanceSee p. 68
• Sustainability governanceSee p. 63
• Environmental Policy and Climate Changeposition statementSee sebgroup.com
Strategy • Climate change strategySee p. 68
• Sustainability in the business planSee p. 12
• Sustainability and climate-related productsand initiativesSee p. 10–11, 20–23
Risk manage-ment
• Sustainability and climate-related riskSee p. 49
• Managing climate-related risksSee p. 68
Targets andmetrics
• SEB’s targets are set in relation to its indi-rect and direct impact.See p. 73 andSEB Sustainability Fact Book and GRI Index.
Managing climate-related riskClimate change can have an impact on SEB’s credit portfolio andfund holdings, and it is important that this is considered in the riskanalysis and management. The bank has developed a methodol-ogy to capture the more long-term effects of material sustainabil-ity and disruption issues in the credit analysis.Qualitative sector analyses are being performed on the mostaffected industries in the transition to a low-carbon environment,including energy, transport and the manufacturing industries.With regards to physical risk, industries such as real estate,forestry and insurance are deemed to be more impacted.
The implementation of the TCFD recommendation is a journey.It is SEB’s ambition to better understand the impact of differentclimate scenarios, in terms of a transition to a low-carbon envi-ronment and physical consequences of climate change, as well asopportunities and risks implied. This will be important for futurestrategic decisions and risk management.
SEB is also investigating ways to measure the climate impactof the credit portfolio and assets under management in terms ofcarbon emissions. One initiative is the Impact Metric Tool, whichSEB developed for customer use.See p. 71. SEB will also beliaising with the domestic and international financial communityin the development of definitions and standards.
SEB Annual Report 2018 69
Sustainability Report Report of theDirectors

Green financingFor more than a decade, SEB has supported large corporations andfinancial institutions in finding sustainable financing solutions, suchas green bonds. 2018 was the 10th anniversary of the world’s firstgreen bond for institutional investors, issued by the World Bankand initiated by SEB. Over the years, SEB has gradually developedits role as a global thought leader and has proactively contributedto setting the standard for this financing vehicle.
SEB recognises the need for further harmonising the greenbond market and thus supports the EU Commission’s action planfor sustainable finance and the ambition to create a green bondstandard among other things. In 2018, SEB was the fifth largestunderwriter and SEB’s global share of underwriting was 3.7 percent, corresponding to a volume of USD 5bn (source: Bloomberg).
SEB’s own green bondSEB’s first own green bond in the amount of EUR 500m wasissued in 2017. The proceeds are used to finance SEB’s green loanportfolio, which consists of assets and projects that contribute tolower carbon emissions and support the UN’s SDGs. SEB’s GreenBond Framework provides a clear definition of what is requiredfor assets to be eligible for green financing. The Green BondFramework and strategy, together with SEB’s EnvironmentalPolicy and the accompanying sector policies, provide a robustbasis for ensuring that SEB’s green bond activities promotelow-carbon and climate change resilient investments. In 2018,SEB’s green loan portfolio increased by SEK 3bn to SEK 16bn.SEB intends to further develop and expand sustainable financingover the next few years.See the SEB Green Bond InvestorReports at sebgroup.com
Contributing to green and social impactSEB has for several years focused on financing solutions for socialimpact. In 2018, Fannie Mae (FNMA), the US government-spon-sored enterprise and leading provider of financing for the UShousing market, engaged SEB to help introduce FNMA’s greenbond programme to socially responsible investors in Europe. Twogreen bond transactions with SEB as a lead manager followed.
SEB was also joint lead manager in the European InvestmentBank’s (EIB) inaugural Sustainable Awareness Bond (SAB), abond that demonstrates EIB’s commitment to supporting the UNSustainable Development Goals. While the proceeds of the inau-gural bond are used for investment in water supply, sanitationand flood protection, the SAB programme is expected to expandto other sectors such as health and education once detailedreporting frameworks are in place.
GreenmortgagesSEB offers sustainable financing solutions also for private individ-uals. In 2018, SEB was the first large bank in Sweden to launchgreen mortgages. This initiative meets increasing customerdemand for sustainable products, which is in line with SEB’s busi-ness strategy. The loans are available to anyone with housing thatfulfils specific requirements, for example Sweden’s NationalBoard of Housing, Building and Planning has assigned an A or Brating for energy efficiency. Going forward, SEB has the ambitionto issue a green covered bond, based on mortgages loans.
Partneringwith academiaDuring the year, SEB further strengthened its ties to the researchcommunity. SEB’s co-head of the Large Corporates & FinancialInstitutions division joined the board of the newly founded Stock-holm Sustainable Finance Centre. The centre will support financialactors in shifting capital to implement the global sustainabilityagenda. It is an initiative by the Swedish Government, StockholmEnvironmental Institute and Stockholm School of Economics.
Equator PrinciplesSEB adheres to the Equator Principles (EP) since 2007, a volun-tary set of guidelines used by financial institutions to assess thesocial and environmental impact of large projects and to helptheir customers to manage them. A review of EP is ongoing.During 2018 SEB took part in the work related to the update toEP IV, which is planned to be finalised in 2019.
In 2018, SEB had two project financing transactions underthe Equator Principles, one category A (projects with potentialsignificant adverse environmental and social risks and/or severeimpact), one category B (projects with potential limited adverseenvironmental and social risks and/or impact that are less severe.)
Sustainable investmentsSEB is one of the largest institutional investors in the Nordicregion with SEK 1,699bn in assets under management for private,corporate and institutional customers. In 2018, the assets undermanagement for funds within SEB amounted to SEK 622bn, ofwhich 100 per cent were managed according to the UN-sup-ported Principles for Responsible Investments, PRI (one indexfund excluded). SEB is a signatory of the PRI since 2008 and hassince then reported yearly on how SEB complies with the six PRIprinciples. In PRI’s grading of sustainable investments 2018, SEBreceived an A rating, which is an important confirmation of SEB’swork within sustainable investments.
SEB aims to integrate sustainability aspects into all types ofinvestments and in all asset classes, to meet customers' expecta-
tions and to contribute to the development of a sustainable soci-ety. The investment strategies are based on continuous engage-ment with the companies that SEB invests in on behalf of its cus-tomers, and on including companies that perform well in sustaina-bility or have well defined plans for a transition. In addition, compa-nies that do not abide by SEB’s sustainability criteria are excluded.
During 2018 SEB further raised the level of sustainability in itsown funds. At year-end, 30 (25) per cent, SEK 188bn, were man-aged according to SEB’s most stringent sustainability criteria.In SEB’s Strategy Funds about two thirds of the funds’ assetsadhere to its most stringent sustainability criteria. Of SEB’s totalassets under management, 11 (8.6) per cent were managedaccording to the same criteria.
SEB’s green loan portfolio by sector Per cent
Renewable energy 38
Sustainable forestry 18
Green buildings 18
Clean transportation 14
Energy efficiency 12
Water and wastewatermanagement 1
SEB Annual Report 201870
Report of theDirectors Sustainability Report

Inclusion of sustainable companiesOn the customers' behalf, SEB increasingly invests in businessesthat actively manage the environmental, social and governanceaspects of their operations and believes that these will be moresuccessful over time, adding value for customers, companies andsociety. As an example, fund managers strive to identify compa-nies that have a reduced impact on the climate, within areas suchas carbon emissions, water use and handling of toxic waste. Oneof these funds is SEB Sustainability Fund Global. SEB offers morethan 20 funds with a clear sustainability profile, and the customerdemand for this category of products is increasing. During 2018,SEB further transitioned funds to become sustainable, meaningthey adhere to the strictest sustainability criteria. Going forward,SEB will continue to develop products with positive impact.
Exclusion criteriaAll SEB's mutual funds exclude companies involved in the productionor marketing of controversial weapons and the development orproduction of nuclear weapons programmes. Furthermore, SEB’sfunds do not invest in companies that fail to respect internationalconventions and guidelines, such as the UN Universal Declaration ofHuman Rights and the UN Global Compact, the ILO Core Conventionson Labour Standards and the OECD Guidelines for MultinationalEnterprises. SEB does not invest in companies involved in thermalcoal extraction, that is, mining activities in which thermal coalaccounts for more than 20 per cent of the company’s or group’sturnover. SEB’s sustainability funds do not invest in companies thatextract coal, gas or oil. SEB reviews the fund holdings with its adviserISS-Ethix semi-annually.See the results on sebgroup.com.
Evaluation of external fundsMutual funds from suppliers other than SEB (external funds) areevaluated by a special fund analysis team. The sustainabilityanalysis process was implemented in 2017 with a focus onanalysing how fund companies integrate sustainability into theirinvestment processes.
During 2018, the sustainability analysis of all the funds in theoffering continued. At year-end 2018, 46 funds out of a total ofabout 65 had been analysed and assigned a sustainability ratingof A to C, where A is the highest rating. Furthermore, a number ofA-rated external funds with strong sustainability integration havebeen added to the offering. SEB’s ambition is to increase the levelof sustainability in the external fund offering over time.
All new external fund management companies are requiredto sign the Principles for Responsible Investments (PRI) and toexclude controversial weapons. At year-end 2018, 100 per cent(97) of these companies had signed the PRI.
Engagement for reducing carbon emissionsSEB has for several years been actively supported power genera-tion companies, where coal as an energy source exceeds 10 percent, in finding sources of energy other than coal. The focus of thework is primarily on European power companies. Since 2017 SEBis also engaged, together with Institutional Investors Group onClimate Change (IIGCC), in targeting the world’s 100 largestcarbon emitters in order to reduce emissions globally. In 2018,18 per cent of these 100 companies reported their officialsupport for, or had undertaken to implement, the recommenda-tions of TCFD. 22 per cent of the companies had set or committedto set a science-based target for reducing their greenhouse gasemissions or equivalent long-term target beyond 2030.
SEB has signed the Montreal Carbon Pledge and thereby com-
mits to annually report on its funds’ carbon footprint. In 2018, allof SEB’s equity funds were measured and reported on SEB’s web-site from all three central emission areas (scope 1–3) accordingto the Greenhouse Gas Protocol. The calculations are based onthe Swedish Investment Funds Association’s guidelines for fundcompanies operating in the Swedish market.
SEB engages directly in a dialogue with companies’ manage-ment and boards of directors regarding how to make improve-ments in issues related to human rights, labour rights and socialrelations, anti-corruption and environment. As regards interna-tional companies, SEB collaborates with other investors as wellas with partners like Hermes EOS, IIGCC, the Carbon DisclosureProject (CDP) and PRI Clearinghouse.
ImpactMetric ToolIn line with SEB’s business strategy, the bank continuously devel-ops sustainable products and services. In 2018, SEB launched theImpact Metric Tool, a quantitative framework for assessing thesustainability of any customer portfolio of listed equities or secu-rities. The aim is to increase the industry transparency regardingresponsible investment and provide investors with additionalinformation in the fund selection process, introduce new dimen-sions when constructing portfolios and evaluate investment poli-cies. The tool can be used to define global challenges throughthe UN’s SDGs. In 2018 more than 20 customer portfolios wereanalysed and the responses from customers were positive.In 2019 SEB will analyse all SEB-branded funds by this tool.
Impact investingSEB is one of the largest microfinance fund managers in Europe.By investing in microfinance institutions, investors can earn areturn while making a social impact. Through some 60 microfi-nance institutions, SEB’s microfinance funds offer loans to peoplewith lower income in developing countries, people who are oftenexcluded from the financial market. SEB manages 6 microfinancefunds with a total value of around SEK 7bn, reaching more than23 million entrepreneurs in about 50 developing countries.
In 2018, SEB broadened the impact investing offering with theSEB Impact Opportunity Fund. This fund has a broad investmentuniverse of which many areas, such as energy, financial inclusion,education and agricultural development, are directly linked to theUN’s SDGs. The fund has been developed in close collaborationwith a few institutional investors and has no set maturity datewhich allows the fund to work more long-term with selected pro-jects.
Investments for sustainable citiesIn 2018, SEB’s fund company and traditional insurance investedSEK 650m in a sustainability bond from the World Bank with aparticular focus on sustainable cities. The bond was designedby SEB and other investors within the framework of the SIDAnetwork Swedish Investors for Sustainable Development. Thebond finances projects aimed at supporting sustainable cities indifferent parts of the world through clean water and renewableenergy, among other things. Of the UN’s 17 Sustainable Develop-ment Goals, the investments will specifically support goalnumber 11, Sustainable Cities and Communities.
SEB’s intention, included in the three year business plan, is tofurther develop impact investment products in line with custom-ers’ needs and expectations. This is also part of SEB’s ambition toreorient capital flows to low-carbon and sustainable activities.Read more on p. 12.
SEB Annual Report 2018 71
Sustainability Report Report of theDirectors

Responsible and proactive adviceFor SEB, it is important to know its customers and their prefer-ences. The bank aims to have constructive dialogues and provideresponsible and proactive advice to customers about sustainabil-ity aspects as well as about the consequences of their activities.SEB is guided by global initiatives, international standards, andthe bank’s internal policies and position statements form a valua-ble base in the customer dialogues and help incorporate sustaina-bility aspects into decision-making.
In 2018, SEB’s Life & Pension insurance business began devel-oping tools to integrate sustainability into the advisory process.The aim is to explore customers’ sustainability preferences andto provide suitable solutions. In addition, this will help SEB under-stand the need for support among advisers in the organisationand help them to be proactive as national and internationalregulations evolve in this area.
250,000 customers in survey on the SDGsTo explore the preferences among private customers, in 2018SEB asked for the second consecutive year which sustainabilityareas they believe SEB should focus on. More than 250,000customers with savings in equity funds were asked to prioritisethe UN’s 17 Sustainable Development Goals. The answer showedthat, just like in 2017, customers assigned top priority to three ofthe goals, 13, Climate action, 6, Clean water and sanitation and4, Quality education. As a result of the customer survey, SEB willexpand its focus to include goal number 6. The fund company hasjoined the Carbon Disclosure Project (CDP) and will thus intensifyits focus on water management and encourage companies toreport their water usage and climate impact.
Identifying potential negative impactSEB strives to identify and assess areas within human rights,labour rights and social relations where the bank can potentiallyhave negative impact through its business relations. Based onprioritisation, proportionality and/or leverage, findings are actedupon to prevent, mitigate and remediate potential impact. SEB iswilling to work with customers with sustainability risk, providedthat there is a willingness and financial capacity to implement therequired corrective measures.
SEB expects its customers to respect all Human Rights and theILO Core Conventions on Labour Standards through appropriatedue diligence systems. Moreover, SEB is committed to identifyingand managing corruption risks in transactions. The bank continu-ously works to strengthen key processes from a sustainabilityperspective such as in the know-your-customer, credit grantingand risk management processes.Read more in Risk, capitaland liquidity management on p.47–48.
SEB’s approach to taxSEB pays taxes in accordance with applicable laws and regula-tions in all countries where the bank operates. SEB undertakes alldealings with tax authorities in a professional, transparent andtimely manner, both when it comes to its own tax matters and inreporting obligations regarding customers. SEB does not use norfacilitate tax evasion schemes. SEB works actively with riskassessments, frameworks and controls in order to ensure compli-ance by all SEB units. The bank does not use structures lackingbusiness rationale in order to avoid taxes. Neither does SEBprovide products or promote structures where the sole purposeis tax advantages. The bank does not co-operate with externalparties to facilitate tax evasion, nor to facilitate transactionswhich SEB is unwilling to provide itself, where the sole purpose istax advantages. During 2019 SEB is conducting a review of its taxpolicy.
Customer privacyThe trust of SEB’s customers is based on respect for and protec-tion of customers’ privacy. SEB has worked actively to be compli-ant with the General Data Protection Regulation (GDPR), the EUreformed data protection legislation that came into force in 2018and which has strengthened individuals’ rights in terms of howtheir data are handled by companies.Read more on p. 50–51.
SuppliersSEB has established, and maintains, procedures to evaluate andselect suppliers and contractors, based on financial, environmen-tal and social aspects. These aspects include human rights,labour rights and social relations, anti-corruption and are takeninto account in procurement decisions along with commercial
aspects. SEB monitors suppliers’ processes and performancewhere appropriate. During 2019 SEB will update its sustainabilityrequirements included in the supplier agreements and review theprocess of supplier screening, which is linked to SEB’s purchasingprocess.Read more about SEB’s process at sebgroup.com.
SEBactively contributes tosustainable development in the EU
SEB welcomes the European Commission’s Actionplan on Financing Sustainable Growth. The plansets out the necessary steps for the financial
system to contribute to sustainable development and hasthree main objectives:• reorient capital flows towards sustainable investment,
in order to achieve sustainable and inclusive growth• manage financial risks stemming from climate change,
environmental degradation and social issues and• to foster transparency and long-termism in financial and
economic activity.
Since 2018, SEB is represented in the Technical Expert Groupand is one of 35 members that, in collaboration, develop anEU classification system, a taxonomy, create an EU greenbond standard, improve the disclosure of climate-relatedinformation and develop a category of low-carbon indices.SEB believes that this work will be crucial for enhancing thefinancing of sustainable growth in EU.
SEB Annual Report 201872
Report of theDirectors Sustainability Report

PeopleAs an employer, SEB has a responsibility to ensure that allemployees are treated equally and with respect. Everyoneshould be given the same opportunities for professional andpersonal development. SEB rejects all forms of discriminationand harassment, whether this is based on an individual’s ethnicor national origin, gender, skin colour, faith, citizenship, age, disa-bility, civil status or sexual orientation. This is equally importantin relation to customers and other stakeholders as in relation tocolleagues. In 2018 SEB increased its focus on inclusion anddiversity in the organisation. SEB’s first Inclusion and DiversityPolicy was adopted by the Board in 2018. A governance struc-ture was established, which includes a steering group withmembers from the Group Executive Committee and divisionalmanagement, as well as an appointed Chief Inclusion & Diversity
Officer. Moreover, an Inclusion and Diversity Index was createdand integrated into SEB’s employee survey. In addition to empha-sis on gender, age, professional background and geographicalprovenance, special attention has been put on issues concerningsexual harassments where processes for raising concerns areestablished. Unethical or unlawful behaviours can be reportedvia both external and internal whistleblowing channels.
A safe and sound work environment combined with goodhealth and work/life balance form the foundation for SEB’semployees’ performance and job satisfaction. All of SEB’semployees are covered by collective or local agreements orlabour law. A continuous dialogue is carried on with employees,employee representatives and with trade unions. SEB has had aEuropean Works Council (EWC) since 2003.
Environment, direct impactSEB works to reduce its direct environmental impact, while itsgreatest environmental impact is indirect. SEB has set a goal toreduce its total carbon emissions by 20 per cent from 2016 to2020. In 2018, SEB reduced carbon emissions by approx. 2.5 percent, where, among other things, reduced office space contrib-uted to lower energy consumption. Emissions from businesstravel increased by about 5 percent. Going forward, SEB will
further focus on reducing emissions related to travel. In 2018,SEB updated the emission factors for the calculation of conver-sion from MWh to tonne. This resulted in the figures for carbonemissions being recalculated, and the target has been adjusted,from 17,000 tonnes to 18,500 tonnes.For a description of SEB’sdirect carbon footprint, see sebgroup.com.
Targets and key performance indicators related to sustainabilitySEB’s business plan 2019–2021 includes strengthened focus onsustainability. SEB will start to classify and gradually transformits credit and investment portfolios. This will be underpinned by
increased transparency and disclosures of progress. Metrics andtargets will continuously be developed and aligned with futurenational and international requirements and expectations.
1) Bloomberg2) Includes only SEB funds assessed with sustainability criteria3) Includes among others Micro Finance Funds, Impact Opportunity Fund,
Green Bond Fund
4) Includes consultants, excludes employees on leave of absence5) See comment about re-calculation above (Environment, direct impact)
Area Description Result 2018 Result 2017 Target 2019–2021
Innovation • Create sustainable finance innovation centre todevelop and launch new sustainable products and services
Decided Establish (2019)
Sustainablefinance
• Green loan portfolio• Green mortgages• Green bond issuance, ranking in the Nordic countries1)
• Gradually shift credit portfolio towardsincreased sustainable financing
SEK 16bnLaunched
1
SEK 13.2bn
1
IncreaseEstablish baseline (2019), increase
KeepClassify and set targets (2019)
Sustainableinvestment
• Total Assets under Management (AuM) managedwith sustainability criteria
• SEB funds managed with sustainability criteria, share of AuM• SEB funds managed with human rights criteria, share of AuM• SEB impact and thematic funds3), total AuM
11%2)
30%100%
SEK 8bn
8%2)
25%100%
Increase
IncreaseKeep
Increase
People • Integrate sustainability KPIs into incentiveprogrammes for senior managers
• Gender by management type, (m/f):- Group Executive Committee (GEC)- Senior management
Decided
77/23%66/34%
83/17%69/31%
Define and launch (2019)
Increase balance insenior management
Business ethicsand conduct
• Employees that have completed training in Code of Conduct4) 90% 85% 100%
Environment,direct impact
• Reduce total carbon emissions with 20% 2016–2020 23,198 tonnes 23,797 tonnes 18,500 tonnes 5) (2020)
SEB Annual Report 2018 73
Sustainability Report Report of theDirectors

SEB Annual Report 201874
Financial statements Contents
Financial statements – Contents
Note Page
The SEB GroupIncome Statement 75
Statement of comprehensive income 76
Balance sheet 77
Statement of changes in equity 78
Cash flow statement 79
Skandinaviska Enskilda BankenIncome Statement 80
Statement of comprehensive income 81
Balance sheet 82
Statement of changes in equity 83
Cash flow statement 84
Notes to the financial statementsCorporate information 85
1 Accounting policies 85
2 Operating segments 95
3 Geographical information 97
Income statement4 Net interest income 98
5 Net fee and commission income 99
6 Net financial income 100
7 Net other income 101
8 Staff costs 102
8a Remuneration 102
8b Pensions 105
8c Remuneration to the Board andthe Group Executive Committee 108
8d Share-based payments 109
8e Number of employees 111
9 Other expenses 112
10 Depreciation, amortisation and impairment oftangible and intangible assets 112
11 Gains less losses from tangible and intangible assets 112
12 Net expected credit losses 113
13 Items affecting comparability 113
14 Appropriations 113
15 Taxes 114
16 Earnings per share 115
Balance sheet17 Cash and cash balances at central banks 115
18 Loans 116
19 Debt securities 121
20 Equity instruments 122
21 Derivatives and hedge accounting 122
22 Investments in subsidiaries and associates 128
Note Page
23 Intangible assets 130
24 Properties and equipment 131
25 Investment properties 132
26 Other assets 132
27 Prepaid expenses and accrued income 132
28 Deposits 133
29 Liabilities to policyholders 133
30 Debt securities issued 134
31 Short positions 134
32 Other liabilities 134
33 Accrued expenses and prepaid income 134
34 Provisions 135
35 Subordinated liabilities 135
36 Untaxed reserves 136
37 Fair value measurement of assets and liabilities 136
38 Financial assets and liabilities by class 140
39 Assets and liabilities distributed by main currencies 142
40 Current and non-current assets and liabilities 143
Other notes41 Risk disclosures 143
41a Credit risk 144
41b Market risk 148
41c Operational risk 150
41d Business risk 150
41e Insurance risk 150
41f Liquidity risk 151
42 Capital adequacy 156
43 Life insurance operations 159
44 Assets in unit-linked operations 160
45 Interest in unconsolidated structured entities 160
46 Related parties 161
47 Financial assets and liabilities subject tooffsetting or netting arrangements 162
48 Pledged assets 163
49 Obligations 164
50 Future minimum lease payments for operational leases 164
51 Finance leases 165
52 Non-current assets and disposal groupsclassified as held for sale 165
53 IFRS 9 and 15 transition disclosures 165
54 IFRS 16 transition disclosures 179
The SEB Group – Five year summary 180
Skandinaviska Enskilda Banken – Five year summary 181
Proposal for the distribution of profits 182

SEB Annual Report 2018 75
Income Statement Financial statements
IncomeStatement
SEB GroupSEK m Note 2018 20171)
Interest income2) 39,299 36,472Interest expense3) –18,277 –16,580
Net interest income 4 21,022 19,893Fee and commission income 24,018 23,196Fee and commission expense –5,654 –5,519
Net fee and commission income 5 18,364 17,677Net financial income 6 6,079 6,880
Dividends 73 77Profit and loss from investments in associates 152 –38Gains less losses from investment securities –244 203Other operating income 421 870
Net other income 7 402 1,112
Total operating income 45,868 45,561
Staff costs 8 –14,004 –14,025Other expenses 9 –7,201 –6,947Depreciation, amortisation and impairment of tangible and intangible assets 10 –735 –964
Total operating expenses –21,940 –21,936
Profit before credit losses 23,928 23,625
Gains less losses from tangible and intangible assets 11 18 –162Net expected credit losses4) 12 –1,166Net credit losses5) 12 –808
Operatingprofit before itemsaffecting comparability 22,779 22,655
Items affecting comparability 13 4,506 –1,896
Operatingprofit 27,285 20,759
Income tax expense 15 –4,152 –4,562
NETPROFIT 23,134 16,197
1) The 2017 income statement and earnings per share have been restated for the transition to IFRS 15. For transition disclosures, see note 53.2) Of which interest income calculated using the effective interest method SEK 32,907m (29,167).3) Of which interest expense calculated using the effective interest method SEK 18,602m (16,620).4) IFRS 9 expected loss model.5) IAS 39 incurred loss model.
Attributable to shareholders 23,134 16,197
Basic earnings per share, SEK 16 10.69 7.47Diluted earnings per share, SEK 16 10.63 7.44

SEB Annual Report 201876
Financial statements Statement of comprehensive income
Statement of comprehensive income
SEB GroupSEKm 2018 2017
NETPROFIT 23,134 16,197Items thatmaybe reclassified subsequently to profit or loss:Valuation gains (losses) during the year –2,166Income tax on valuation gains (losses) during the year 397Transferred to profit or loss for the year1) 1,122Income tax on transfers to profit or loss for the year –261
Available-for-sale financial assets –909
Valuation gains (losses) during the year –1,118 –1,536Income tax on valuation gains (losses) during the year 249 338Transferred to profit or loss for the year2) –13 –11Income tax on transfers to profit or loss for the year 3 2
Cash flowhedges –880 –1,207
Translation of foreign operations 232 –17Taxes on translation effects 350 313
Translation of foreign operations 582 296
Items thatwill not be reclassified to profit or loss:Owncredit risk adjustmentOCA3) 221
Remeasurement of pension obligations, including special salary tax –981 –528Valuation gains (losses) on plan assets during the year –59 2,556Deferred tax on pensions 194 –1,244
Definedbenefit plans –846 784
OTHERCOMPREHENSIVE INCOME –923 –1,036
TOTALCOMPREHENSIVE INCOME 22,211 15,160
1) Other income.2) Net interest income.3) Own credit risk adjustment from financial liabilities FVTPL.
Attributable to shareholders 22,211 15,160
The method used to hedge currency risks related to investments in foreign sub-sidiaries creates a tax expense (tax income) in the parent company. Fair valuechanges on the hedging instruments impact the taxable result contrary to the
currency revaluation of the foreign operations. In the group this tax effect isreported in Other comprehensive income.

SEB Annual Report 2018 77
Balance sheet Financial statements
Balance sheet
SEB GroupSEK m Note 31Dec 2018 1 Jan 20181) 31 Dec 2017 1 Jan 20172)
Cash and cash balances at central banks 17 209,115 177,222 177,222 151,078Loans to central banks 18 33,294 12,778 12,778 66,730Loans to credit institutions 18 44,287 38,715 38,717 50,145Loans to the public 18 1,644,825 1,485,808 1,486,765 1,467,472Debt securities 19 156,128 168,928 169,269 253,443Equity instruments 20 50,434 60,087 59,204 74,172Financial assets for which the customers bear the investment risk 269,613 283,420 283,420 295,908Derivatives 21 115,463 104,868 104,868 212,356
Fair value changes of hedged itemsin a portfolio hedge of interest rate risk 67 93 93 111Investments in subsidiaries and associates 22 1,195 1,314 1,314 1,238Intangible assets 23 8,157 8,030 8,030 8,765Properties and equipment 24 1,300 1,130 1,130 908Investment properties 25 11 203 203 7,845Current tax assets 15 6,404 5,255 5,255 5,978Deferred tax assets 15 251 260 260 1,329Retirement benefit assets 8b 4,104 5,280 5,280 3,914Other assets 26 20,398 16,854 16,856 13,676Prepaid expenses and accrued income 27 2,471 2,232 2,232 2,350Non-current assets and disposal groups classified as held for sale 52 184,011 184,011 587
Other assets 44,357 224,662 224,664 46,701
TOTALASSETS 2,567,516 2,556,489 2,556,908 2,618,006
Deposits from central banks and credit institutions 28 135,719 95,504 95,489 119,864Deposits and borrowing from the public 28 1,111,390 1,034,704 1,032,048 991,950Financial liabilities for which the customers bear the investment risk 29 270,556 284,291 284,291 296,618Liabilities to policyholders 29 21,846 18,911 18,911 107,213Debt securities issued 30 680,670 614,087 614,033 668,880Short positions 31 23,144 24,985 24,985 19,598Derivatives 21 96,872 85,434 85,434 174,652Other financial liabilities 3,613 3,894 3,894 19,247
Fair value changes of hedged items in a portfolio hedge 22 178 1,046 1,537Current tax liabilities 15 1,734 978 1,463 2,184Deferred tax liabilities 15 7,141 8,082 8,079 8,474Other liabilities 32 23,995 26,572 26,572 21,039Accrued expenses and prepaid income 33 5,260 5,316 5,316 5,464Provisions 34 1,817 2,285 1,684 1,515Retirement benefit liabilites 8b 427 1,325 1,325 718Subordinated liabilities 35 34,521 32,390 32,390 40,719Liabilities of disposal groups classified as held for sale 52 178,710 178,710
Other liabilities 74,916 255,836 256,585 81,649
Total liabilities 2,418,727 2,417,647 2,415,671 2,479,670
Share capital 21,942 21,942 21,942 21,942Other reserves 2,244 3,167 4,403 5,439Retained earnings 124,604 113,732 114,893 110,955
Shareholders' equity 148,789 138,841 141,237 138,336
Total equity 148,789 138,841 141,237 138,336
TOTAL LIABILITIESANDEQUITY 2,567,516 2,556,489 2,556,908 2,618,006
1) IFRS 9 Financial Instruments is applied from 1 January 2018. For transition disclosures, see note 53.2) IFRS 15 Revenue from Contracts with Customers is applied retrospectively from 1 January 2018. For transition disclosures, see note 53.

SEB Annual Report 201878
Financial statements Statement of changes in equity
SEB GroupSEKm Other reserves
2018Share
capital3)
Available-for-sale
financialassets OCA7)
Cash flowhedges
Translationof foreign
operations
Definedbenefit
plansRetainedearnings Total equity4)
Opening balance 21,942 729 1,192 –897 3,379 114,893 141,237Effect of applying IFRS 95) –729 –507 –1,160 –2,396
Restatedbalance at 1January2018 21,942 –507 1,192 –897 3,379 113,732 138,841
Net profit 23,134 23,134Other comprehensive income (net of tax) 221 –880 582 –846 –923
Total comprehensive income 221 –880 582 –846 23,134 22,211
Dividend to shareholders1) –12,459 –12,459Equity-based programmes2) –111 –111Change in holding of own shares 307 307
CLOSINGBALANCE 21,942 –286 313 –315 2,533 124,604 148,789
2017
Opening balance 21,942 1,638 2,399 –1,193 2,595 113,595 140,976Effect of applying IFRS 156) –2,640 –2,640
Restatedbalanceat 1January2017 21,942 1,638 2,399 –1,193 2,595 110,955 138,336
Net profit 16,197 16,197Other comprehensive income (net of tax) –909 –1,207 296 784 –1,036
Total comprehensive income –909 –1,207 296 784 16,197 15,160
Dividend to shareholders1) –11,935 –11,935Equity-based programmes2) –246 –246Change in holding of own shares –78 –78
CLOSINGBALANCE 21,942 729 1,192 –897 3,379 114,893 141,237
1) Dividend paid in 2018 for 2017 was SEK 5.75 (5.50) per Class A share and SEK 5.75 (5.50) per Class C share. Proposed ordinary dividend for 2018 is SEK 6.00 and extra dividendSEK 0.50. Further information can be found in the chapter Shareholders and the SEB share on page 29–31 and on page 37. Dividend to shareholders is reported excluding dividendon own shares.
2) As of 31 December 2016 SEB owned 25.2 million Class A shares for the long-term incentive programmes. In 2017 5.0 million Class A shares were sold as stock options were exercised.During 2017, SEB also repurchased 7.0 million Class A shares. As of 31 December 2017 SEB owned 27.1 million Class A shares with a market value of SEK 2,612m. Another 3.8 millionClass A shares have been sold during 2018 as stock options were exercised. During 2018, SEB repurchased 6.9 million Class A shares. As of 31 December 2018 SEB owned 30.3 millionClass A shares with a market value of SEK 2,607m.
3) 2,170,019,294 Class A shares (2,170,019,294); 24,152,508 Class C shares (24,152,508).4) Information about capital requirements can be found in note 42 Capital adequacy.5) IFRS 9 Financial Instruments applied from 1 January 2018. For transition disclosures, see note 53.6) IFRS 15 Revenue from Contracts with Customers applied retrospectively from 1 January 2018. For transition disclosures, see note 53.7) Own credit risk adjustment from financial liabilities FVTPL.
Statement of changes in equity

SEB Annual Report 2018 79
Cash flow statement Financial statements
SEB GroupSEK m 2018 2017
Interest received 38,648 37,724Interest paid –19,113 –17,690Commission received 24,018 23,196Commission paid –5,654 –5,472Net received from financial transactions 3,997 14,748Other income –231 197Paid expenses –16,868 –21,200Taxes paid –5,029 –4,560
Cash flow from the income statement 19,768 26,943
Increase (–)/decrease (+) in portfolios 5,795 –8,683Increase (+)/decrease (–) in issued short-term securities 69,447 –55,228Increase (–)/decrease (+) in lending to credit institutions and central banks –23,059 69,280Increase (–)/decrease (+) in lending to the public –155,341 –34,853Increase (+)/decrease (–) in liabilities to credit institutions 40,391 –30,773Increase (+)/decrease (–) in deposits and borrowings from the public 79,507 43,010Increase (–)/decrease (+) in insurance portfolios 72 –180Change in other assets –11,916 17,343Change in other liabilities 3,597 21,141
Cash flow fromoperating activities 28,259 48,000
Sales of shares and bonds 115 761Sales of intangible and tangible fixed assets 6 70Dividends received 73 77Investments/divestments in subsidiaries 7,717Investments/divestments in shares and bonds 119 –86Investments in intangible and tangible assets –1,016 –259
Cash flow from investing activities 7,014 564
Repayment of subordinated loans –7,169Dividend paid –12,459 –11,935
Cash flow from financing activities –12,459 –19,104
NETCHANGE INCASHANDCASHEQUIVALENTS 22,814 29,460
Cash and cash equivalents at beginning of year 184,429 158,315Exchange rate differences on cash and cash equivalents 12,336 –3,346Net increase in cash and cash equivalents 22,814 29,460
CASHANDCASHEQUIVALENTSATENDOFPERIOD1) 219,579 184,429
1) Cash and cash equivalents include cash, cash equivalents and demand deposits.
Reconciliation of liabilities from financing activities
Opening balance 32,390 40,719Cash flows –7,169Non-cash flow, currency exchange 2,145 –327Non-cash flow, fair value changes –32 –600Non-cash flow, interest accruals 18 –233
TOTAL LIABILITIES FROMFINANCINGACTIVITIES 34,521 32,390
Cash flow statement

SEB Annual Report 201880
Financial statements Income Statement
IncomeStatementIn accordance with the Swedish Financial Supervisory Authority regulations
Skandinaviska Enskilda BankenSEK m Note 2018 2017
Interest income 38,071 32,285Leasing income 5,656 5,481Interest expense –21,867 –17,750
Net interest income 4 21,860 20,017Dividends received 9,130 6,981
Fee and commission income 13,281 12,153Fee and commission expense –3,218 –2,596
Net fee and commission income 5 10,064 9,557Net financial income 6 4,574 4,493Other income 7 1,770 1,342
Total operating income 47,398 42,390
Staff costs 8 –9,902 –9,335Other expenses 9 –5,361 –4,918
Administrative expenses –15,263 –14,252Depreciation, amortisation and impairment of tangible and intangible assets 10 –5,512 –6,377
Total operating expenses –20,775 –20,629
Profit before credit losses 26,623 21,761
Net expected credit losses1) 12 –1,020Net credit losses2) 12 –749Impairment of financial assets –2,928 –1,497
Operating profit 22,675 19,515
Appropriations 14 2,716 1,885Income tax expense 15 –3,789 –3,633Other taxes 15 118 43
NETPROFIT 21,720 17,811
1) IFRS 9 expected loss model.2) IAS 39 incurred loss model.

SEB Annual Report 2018 81
Statement of comprehensive income Financial statements
Statement of comprehensive income
Skandinaviska Enskilda BankenSEK m 2018 2017
NETPROFIT 21,720 17,811
Items thatmay be reclassified subsequently to profit or loss:Valuation gains (losses) during the year –1,920Income tax on valuation gains (losses) during the year 314Transferred to profit or loss for the year1) 933Income tax on transfers to profit or loss for the year –205
Available-for-sale financial assets –878
Valuation gains (losses) during the year –1,118 –1,536Income tax on valuation gains (losses) during the year 249 338Transferred to profit or loss for the year2) –13 –11Income tax on transfers to profit or loss for the year 2 2
Cash flowhedges –880 –1,207
Translation of foreign operations –11 –8
Translation of foreign operations –11 –8
OTHERCOMPREHENSIVE INCOME –891 –2,093
TOTALCOMPREHENSIVE INCOME 20,829 15,718
1) Other income.2) Net interest income.
The method used to hedge currency risks related to investments in foreign sub-sidiaries creates a tax expense (tax income) in the parent company. Fair valuechanges on the hedging instruments impact the taxable result contrary to the
currency revaluation of the foreign operations. In the group this tax effect isreported in Other comprehensive income.

SEB Annual Report 201882
Financial statements Balance sheet
Balance sheet
Skandinaviska Enskilda BankenSEK m Note 31Dec 2018 1 Jan 20181) 31 Dec 2017
Cash and cash balances at central banks 17 164,081 97,741 97,741Loans to central banks 18 29,665 8,832 8,832Loans to credit institutions 18 90,668 189,949 189,949Loans to the public 18 1,410,687 1,204,761 1,205,906Debt securities 19 119,227 124,732 125,070Equity instruments 20 36,993 50,981 50,098Derivatives 21 113,282 104,220 104,220
Fair value changes of hedged itemsin a portfolio hedge of interest rate risk 38 32 32Investments in subsidiaries and associates 22 51,600 51,599 51,599Intangible assets 23 1,776 1,597 1,597Properties and equipment 24 34,009 34,487 34,487Current tax assets 15 2,813 1,999 1,999Other assets 26 21,065 18,149 18,151Prepaid expenses and accrued income 27 2,371 2,481 2,481
Other assets 113,672 110,345 110,347
TOTALASSETS 2,078,275 1,891,561 1,892,163
Deposits from central banks and credit institutions 28 160,022 134,562 134,561Deposits and borrowing from the public 28 927,224 849,488 849,479Debt securities issued 30 680,396 610,292 610,292Short positions 31 23,144 24,985 24,985Derivatives 21 95,269 86,990 86,990Other financial liabilities 3,613 3,894 3,894
Current tax liabilities 15 655 278 684Deferred tax liabilities 15 85 336 336Other liabilities 32 16,543 19,467 19,467Accrued expenses and prepaid income 33 2,871 2,781 2,781Provisions 34 385 466 113Subordinated liabilities 35 34,521 32,390 32,390
Other liabilities 55,059 55,717 55,772
Total liabilities 1,944,725 1,765,929 1,765,973
Untaxed reserves 36 20,855 21,429 21,429
Share capital 21,942 21,942 21,942Statutory reserve 12,260 12,260 12,260Development cost reserve 1,039 1,166 1,166Fair value reserve 5 896 1,476Retained earnings 55,729 50,130 50,108Net profit 21,720 17,811 17,811
Total equity 112,695 104,204 104,762
TOTAL LIABILITIESANDEQUITY 2,078,275 1,891,561 1,892,163
1) IFRS 9 Financial Instruments is applied from 1 January 2018. For transition disclosures, see note 53.

SEB Annual Report 2018 83
Statement of changes in equity Financial statements
Statement of changes in equity
Skandinaviska Enskilda BankenSEK m Restricted equity Non-restricted equity4)
2018Share
capital3)Statutory
reserve
Develop-ment cost
reserve
Available-for-sale
financial assets5)
Cashflow
hedges5)
Translationof foreign
operations5)Retainedearnings
TotalEquity
Opening balance 21,942 12,260 1,166 580 1,193 –295 67,917 104,762
Effect of applying IFRS 9 6) –580 22 –558
Restatedbalanceat 1January2018 21,942 12,260 1,166 1,193 –295 67,939 104,204
Net profit 21,720 21,720Other comprehensive income (net of tax) –880 –11 –891
Total comprehensive income –880 –11 21,720 20,829
Dividend to shareholders1) –12,459 –12,459Equity-based programmes2) –185 –185Change in holding of own shares 307 307Other changes –127 125 –2
CLOSINGBALANCE 21,942 12,260 1,039 313 –308 77,449 112,695
2017
Opening balance 21,942 12,260 441 1,458 2,400 –287 63,160 101,374
Net profit 17,811 17,811Other comprehensive income (net of tax) –878 –1,207 –8 –2,093
Total comprehensive income –878 –1,207 –8 17,811 15,718
Dividend to shareholders 1) –11,935 –11,935Equity-based programmes2) –333 –333Change in holding of own shares –62 –62Other changes 724 –724
CLOSINGBALANCE 21,942 12,260 1,166 580 1,193 –295 67,917 104,762
1) Dividend paid in 2018 for 2017 was SEK 5.75 (5.50) per Class A share and SEK 5.75 (5.50) per Class C share. Proposed ordinary dividend for 2018 is SEK 6.00 and extra dividendSEK 0.50. Further information can be found in the chapter Shareholders and the SEB share on page 29–31 and on page 37. Dividend to shareholders is reported excluding dividendon own shares.
2) As of 31 December 2016 SEB owned 25.2 million Class A shares for the long-term incentive programmes. In 2017 5.0 million Class A shares were sold as stock options were exercised.During 2017, SEB also repurchased 7.0 million Class A shares. As of 31 December 2017 SEB owned 27.1 million Class A shares with a market value of SEK 2,612m. Another 3.8 millionClass A shares have been sold during 2018 as stock options were exercised. During 2018, SEB repurchased 6.9 million Class A shares. As of 31 December 2018 SEB owned 30.3 millionClass A shares with a market value of SEK 2,607m.
3) 2,170,019,294 Class A shares (2,170,019,294); 24,152,508 Class C shares (24,152,508).4) The closing balance is equivalent to Distributable items according to Regulation (EU) No 575/2013 (CRR).5) Fair value fund.6) IFRS 9 Financial instruments applied from 1 January 2018. For transition disclosures, see note 53.

SEB Annual Report 201884
Financial statements Cash flow statement
Cash flow statement
Skandinaviska Enskilda BankenSEK m 2018 2017
Interest received 38,795 30,730Interest paid –18,154 –11,230Commission received 13,033 12,516Commission paid –2,979 –2,965Net received from financial transactions 8,221 14,222Other income –3,221 –1,423Paid expenses –14,519 –13,399Taxes paid –3,619 –2,355
Cash flow from the profit and loss statement 17,556 26,096
Increase (–)/decrease (+) in trading portfolios –2,720 –3,871Increase (+)/decrease (–) in issued short-term securities 72,913 –54,279Increase (–)/decrease (+) in lending to credit institutions 71,941 102,644Increase (–)/decrease (+) in lending to the public –195,121 –27,417Increase (+)/decrease (–) in liabilities to credit institutions 25,444 –41,358Increase (+)/decrease (–) in deposits and borrowings from the public 77,719 39,847Change in other assets –5,876 2,144Change in other liabilities –2,997 8,733
Cash flow fromoperating activities 58,859 52,540
Dividends received 9,127 6,981Investments/divestments in shares and bonds 1,030 594Investments in intangible and tangible assets –855 –1,482
Cash flow from investment activities 9,302 6,094
Repayment of subordinated loans –7,169Dividend paid –12,459 –11,935
Cash flow from financing activities –12,459 –19,104
NETCHANGE INCASHANDCASHEQUIVALENTS 55,701 39,530
Cash and cash equivalents at beginning of year 126,287 91,932Exchange rate differences on cash and cash equivalents 5,713 –5,174Net increase in cash and cash equivalents 55,701 39,530
CASHANDCASHEQUIVALENTSATENDOFPERIOD 1) 187,701 126,287
1) Cash and cash equivalents are disclosed in note 17.
Reconciliation of liabilities from financing activities
Opening balance 32,390 40,719Cash flows –7,169Non-cash flow, currency exchange 2,145 –327Non-cash flow, fair value changes –32 –600Non-cash flow, interest accruals 18 –233
TOTAL LIABILITIES FROMFINANCINGACTIVITIES 34,521 32,390

Notes Financial statements
SEB Annual Report 2018 85
Notes to the financial statementsSEK m, unless otherwise stated.
1 Accounting policies
Significant accounting policies for the group
STATEMENT OF COMPLIANCEThe group’s consolidated accounts have been prepared in accordance with theInternational Financial Reporting Standards (IFRS) and interpretations of thesestandards as adopted by the EU. The accounting also follows the AnnualAccounts Act for Credit Institutions and Securities Companies (1995:1559) andthe regulation and general guidelines issued by the Swedish Financial Supervi-sory Authority, Annual Reports in Credit Institutions and Securities Companies(FFFS 2008:25). In addition to this the Supplementary Accounting Rules forGroups RFR 1 and the additional UFR statements issued by the Swedish Finan-cial Reporting Board have been applied.
BASIS OF PREPARATIONThe consolidated accounts are based on amortised cost, except for the fairvalue measurement of financial assets at fair value through other comprehen-sive income, financial assets and liabilities measured at fair value through profitor loss including derivatives and investment properties measured at fair value.The carrying amount of financial assets and liabilities subject to hedge account-ing at fair value has been adjusted for changes in fair value attributable to thehedged risk. The financial statements are presented in million Swedish kronor(SEK m) unless indicated otherwise.
CONSOLIDATIONSubsidiariesThe consolidated accounts combine the financial statements of the parent com-pany and its subsidiaries. Subsidiaries are companies, over which the group hascontrol. The group controls an entity when it has power over an investee, isexposed to, or has rights to, variable returns from its involvement and has theability to use its power to affect the amount of the returns. Control is deemed toexist when the parent company holds, directly or indirectly, more than 50 percent of the voting rights, unless there is evidence that another investor has thepractical ability to unilaterally direct the relevant activities of the entity. Compa-nies in which the parent company or its subsidiaries hold more than 50 per centof the votes, but are unable to exercise control due to contractual or legal rea-sons, are not included in the consolidated accounts. The group also assesses ifcontrol exists when it holds less than 50 per cent of the voting rights. This mayarise if the group has contractual arrangements with other vote holders. Thesize and dispersion of holdings of other vote holders may also indicate that thegroup has the practical ability to direct the relevant activities of the investee.
When voting rights are not relevant in deciding who has power over anentity, such as interests in some funds or special purpose entities (SPE), all
facts and circumstances are considered in determining if the group controls theentity. In the assessment whether to consolidate SPEs and any entities wherethere is not immediately clear where control rests, an analysis is made to iden-tify which party has power over the activities which most affects the returns ofthe entity and if that party is significantly exposed or have significant rights tothe returns from that entity.
The financial statements of the parent company and the consolidated sub-sidiaries refer to the same period and have been drawn up according to theaccounting policies applicable to the group. A subsidiary is included in the con-solidated accounts from the time of acquisition, being the date when the parentcompany gains control over the subsidiary. The subsidiary is included in theconsolidated accounts until the date when control over the company ceasesto exist.
The consolidated accounts are prepared in accordance with the acquisitionmethod. The acquisition value is measured as the fair value of the assets given,equity instruments issued and liabilities incurred or assumed.
The identifiable assets acquired, the liabilities and contingent liabilitiesassumed in a business combination are measured initially at their fair values onacquisition date, irrespective of any minority interest. The excess of the consid-eration transferred for the acquisition over the fair value of the group’s share ofthe identifiable acquired net assets is recorded as goodwill. If the considerationtransferred is less than the fair value of the net assets of the acquired subsidi-ary, the difference is recognised directly against profit or loss.
Goodwill is allocated between the cash-generating units or groups of unitswhich are expected to generate cash flows. The cash-generating units to whichgoodwill is allocated correspond to the lowest level within the group in whichgoodwill is monitored for internal management purposes.
Intra-group transactions, balance sheet items and unrealised gains andlosses on transactions between group companies are eliminated. The minorityinterest of the profit or loss in subsidiaries is included in the reported net profitin the consolidated income statement, while the minority share of net assets isincluded in equity in the consolidated balance sheet.
Associated companiesThe consolidated accounts also include associated companies that are compa-nies in which the group has significant influence, but not control. Significantinfluence means that the group can participate in the financial and operatingpolicy decisions of the company, whilst not determining or controlling suchfinancial and operating policies. A significant influence is generally deemed toexist if the group, directly or indirectly, holds between 20 and 50 per cent ofthe voting rights of an entity.
According to the main principle, associated companies are consolidated in
Corporate informationThe SEB Group provides corporate, retail, investment and private banking ser-vices. The group also provides asset management and life insurance services.
Skandinaviska Enskilda Banken AB (publ) is the parent company of thegroup. The parent company is a Swedish limited liability company with its regis-tered office in Stockholm, Sweden.
The parent company is included in the Large Cap segment of the NasdaqStockholm stock exchange.
The consolidated accounts for the financial year 2018 were approved forpublication by the Board of Directors on 19 February and will be presentedfor adoption at the 2019 Annual General Meeting.
Exchange rates used for converting main currencies in the group Consolidation
Profit and loss account Balance sheet
2018 2017 Change, % 2018 2017 Change, %
DKK 1.376 1.295 6 1.374 1.319 4EUR 10.257 9.633 6 10.263 9.822 4NOK 1.069 1.033 3 1.029 1.000 3USD 8.692 8.538 2 8.971 8.190 10

Financial statements Notes
SEB Annual Report 201886
accordance with the equity method. This means that the holding is initiallyreported at its acquisition cost. Associated companies are subsequently car-ried at a value that corresponds to the group’s share of the net assets. However,the group has chosen to designate investments in associates held by the group’sventure capital organisation at fair value through profit or loss on the basis thatthese are managed and evaluated based on fair value.
ASSETS HELD FOR SALEAssets (or disposal groups) are classified as held for sale at the time when anon-current asset or group of assets (disposal group) are available for immedi-ate sale in its present condition and its sale is deemed to be highly probable. Atthe time of the classification, a valuation of the asset or disposal group is madeat the lower of its carrying amount and fair value, less costs to sell. Any subse-quent impairment losses or revaluations are recognised directly in profit orloss. No gains are recognised in excess of accumulated impairment losses ofthe asset recognised previously. From the time of classification, no depreciationis made for property and equipment or intangible assets originating fromassets held for sale. Assets and liabilities held for sale are reported separatelyin the balance sheet until they are sold.
SEGMENT REPORTINGAn operating segment is identified on the basis of internal reports about com-ponents of the group that are regularly reviewed by the chief operating deci-sion maker in order to allocate resources to the segments and to assess theirperformance. The business divisions are identified as separate operating seg-ments. Business Support, Group Staff, Group Treasury and group wide itemsare included in the segment Other. In the context of defining the segments thePresident and Chief Executive Officer (CEO) is the group’s chief operating deci-sion maker.
FOREIGN CURRENCY TRANSLATIONForeign currency transactions are translated into the appropriate functionalcurrency using the exchange rates prevailing at the dates of the transactions.On subsequent balance sheet dates monetary items in foreign currency aretranslated using the closing rate. Non-monetary items, which are measured interms of historical cost in foreign currency, are translated using the exchangerate on the date of the transaction. Non-monetary items, which are measuredat fair value in a foreign currency, are translated applying the exchange rate onthe date on which the fair value is determined.
Gains and losses arising as a result of exchange rate differences on settle-ment or translation of monetary items are recognised in profit or loss. Transla-tion differences on non-monetary items, classified as financial assets or finan-cial liabilities at fair value through profit or loss, are included in the change infair value of those items. Translation differences from non-monetary items, e.g.financial assets at fair value through other comprehensive income, are recog-nised in other comprehensive income. Exchange rate differences referring tomonetary items comprising part of a net investment in a foreign operation arereported in other comprehensive income.
The income statements and balance sheets of group entities, with a func-tional currency other than the group’s presentation currency, are translated toSEK in the consolidated accounts. Assets and liabilities in foreign group entitiesare translated at the closing rate and income and expenses in the income state-ment are translated at the average exchange rate for the year. The exchangerate differences are recognised as a separate component of other comprehen-sive income.
Goodwill arising in conjunction with acquisitions of foreign group entities, aswell as adjustments to the fair value of assets and liabilities made in conjunc-tion with acquisitions are included in the assets and liabilities of the foreignentity in question and are translated at the closing rate.
FINANCIAL ASSETS AND LIABILITIESFinancial assets are recognised on the balance sheet when the group becomesa party to the contractual provisions of the instrument and are measured at fairvalue on initial recognition. Transaction costs are included in the fair value oninitial recognition except for financial assets at fair value through profit or losswhere transaction costs are expensed in profit or loss. Financial assets arederecognised when the rights to receive cash flows have expired, the group hastransferred substantially all risks and rewards and upon substantial modifica-tion. Transfers of financial assets with retention of all or substantially all risksand rewards include for example repurchase transactions and securities lend-ing transactions. Financial assets at fair value are recognised on the balancesheet on trade date, with exception of loans and reversed repos which are rec-ognised on settlement date. Financial assets measured at amortised cost arerecognised on settlement date.
Financial liabilities are measured at fair value on initial recognition. In thecase of financial liabilities measured at fair value through profit or loss, transac-tion costs directly attributable to the acquisition or the issuance of the financialliability are recognised in profit or loss. For other financial liabilities direct trans-action cost are recognised as a deduction from the fair value. Financial liabili-ties are derecognised when extinguished, that is, when the obligation is dis-charged, cancelled or expired.
Classification of financial assets and liabilities under IFRS 9as of 1 January 2018The group classifies and subsequently measures its financial assets in the fol-lowing categories: financial instruments at fair value through profit or loss; fairvalue through other comprehensive income and amortised cost. The classifica-tion will depend on if the financial asset is a debt instrument, an equity instru-ment or a derivative.
Debt instruments (Loans and debt securities)The classification is based on a combination of assessing the business modelfor managing the financial assets and whether the contractual cash flow char-acteristics consist of solely payments of principal and interest (‘SPPI’). Thebusiness model assessment is performed for homogenous portfolios identifiedbased on how the business is managed in the divisions of the group. The assess-ment is based on reasonable scenarios taking into consideration how the port-folio is evaluated and reported to management; the risks affecting the perfor-mance of the portfolio and how these risks are managed; how managers arecompensated; and the frequency, value and timing of sales including the rea-sons for the sales. In determining if the cash flows consist solely of principaland interest, the principal is defined as the fair value of the debt instrument atinitial recognition, which can change over the life if there are repayments or capi-talisation of interest. Interest cash flows are consistent with components per abasic lending arrangement including consideration for time value of money,credit risk, liquidity risk as well as administrative costs and profit margin. Ifthere are contractual features introducing an exposure to other risks or volatil-ity, it is not considered to consist of solely payments of principal and interest.Debt instruments are presented in the balance sheet items; Cash and cash bal-ances at central banks, Loans to credit institutions, Loans to the public and Debtsecurities, and include instruments in the following measurement categories.
Fair value through profit or loss: Debt instruments are classified in this cate-gory if not meeting the criteria for amortised cost or fair value through othercomprehensive income. This is the case if the business model is held for trad-ing; where financial assets are considered held for trading if they are held withthe intention to be sold in the short-term and for the purpose of generatingprofits. Debt instruments are mandatorily measured at fair value through profitor loss if the assets are managed and evaluated on a fair value basis or theassets are held with an intention to sell alternatively if the cash flows do notconsist of solely payments of principal and interest. Debt instruments thatwould otherwise be classified as fair value through other comprehensiveincome or amortised cost are also included in this category if, upon initial recog-nition, designated at fair value through profit or loss (fair value option). The fairvalue option can be applied only in situations where such designation reducesmeasurement inconsistencies.
Fair value through other comprehensive income: Debt instruments are classi-fied in this category if both of the following criteria are met (a) the businessmodel objective is to both hold assets to collect contractual cash flows and tosell the assets (b) the contractual cash flow characteristics consist of solelypayments of principal and interest. The assets are measured at fair value andgains and losses arising from changes in fair value are reported in other compre-hensive income and accumulated in equity. The cumulative gain or loss is reclas-sified from equity to profit or loss upon derecognition of the debt instrument.Interest calculated by applying the effective interest method on interest-bear-ing financial assets and expected credit losses are recognised in profit or loss.
Amortised cost: Debt instruments are classified in this category if both of thefollowing criteria are met (a) the business model objective is to hold assets tocollect contractual cash flows and (b) the contractual cash flow characteristicsconsist of solely payments of principal and interest. The gross carrying amountof these assets is measured using the effective interest method and adjustedfor expected credit losses.
Equity instrumentsEquity instruments are per default classified as financial assets at fair valuethrough profit or loss. An irrevocable election can be made on initial recognitionto classify equity instruments (not held for trading) at fair value through othercomprehensive income. This election has not been applied in the group.
DerivativesDerivatives are classified as fair value through profit or loss (held for trading)unless designated as hedging instruments. If designated as hedging instru-ments, the principles for hedge accounting are applied.
ReclassificationIn rare circumstances debt instruments (financial assets) excluding those des-ignated at fair value through profit or loss on initial recognition, can be reclassi-fied if there has been a change in the business model for managing the financialasset.
Financial liabilitiesFinancial liabilities at fair value through profit or loss: Financial liabilities at fairvalue through profit or loss are either classified as held for trading or desig-nated as fair value through profit or loss on initial recognition (fair value option).

Notes Financial statements
SEB Annual Report 2018 87
The fair value option can be applied for classification of financial liabilities ifmeeting either of the following criteria; the contracts include one or moreembedded derivatives, the instruments are managed and evaluated on a fairvalue basis or in situations where such designation reduces measurementinconsistencies. Liabilities to policyholders and some debt securities areincluded in this category. Financial liabilities held for trading are primarily shortpositions in interest-bearing securities, equity instruments and derivatives notdesignated as hedging instruments.
Other financial liabilities: The category other financial liabilities primarilyinclude the group’s short-term and long-term borrowings. After initial recogni-tion other financial liabilities are measured at amortised cost, using the effec-tive interest method. The balance sheet items Deposits from central banks andcredit institutions, Deposits and borrowings from the public and Debt securitiesissued are included in this category.
Embedded derivativesSome combined contracts contain both a derivative and a non-derivative com-ponent. In such cases, the derivative component is termed an embedded deriv-ative. If the host contract is a financial asset in scope of IFRS 9 the contract isassessed for classification in its entirety and the embedded derivative is notseparated. For other hybrid instruments (i.e. the host contract is not a financialasset in scope of IFRS 9) where the economic characteristics and risks of theembedded derivatives are not closely related to those of the host contract, theembedded derivative is bifurcated and reported at fair value with gains andlosses being recognised in the income statement. This does not apply if the hostcontract is carried at fair value through profit or loss.
Certain combined instruments are classified as financial liabilities at fairvalue through profit or loss according to the fair value option. The designationimplies that the entire combined instrument is measured at fair value throughprofit and loss.
Classification of financial assets and liabilities under IAS 39until 31 December 2017Financial assets at fair value through profit and lossFinancial assets at fair value through profit or loss consist of financial assetsclassified as held for trading and financial assets which, upon initial recognition,have been designated at fair value through profit or loss (fair value option).Financial assets are classified as held for trading if they are held with the inten-tion to be sold in the short-term and for the purpose of generating profits.Derivatives are classified as held for trading unless designated as hedginginstruments.
The fair value option can be applied to contracts including one or moreembedded derivatives, investments that are managed and evaluated on a fairvalue basis and situations in which such designation reduces measurementinconsistencies. The nature of the financial assets which have been designatedat fair value through profit or loss and the criteria for such designation aredescribed in the relevant notes to the financial statements.
Loans and receivablesLoans and receivables are non-derivative financial assets with fixed or deter-minable payments that are not quoted in an active market. Loans and receiva-bles are measured at amortised cost using the effective interest method. Thebalance sheet items Cash and cash balances at central banks, Loans to centralbanks, Loans to credit institutions and Loans to the public are included in thiscategory.
Available-for-sale financial assetsAvailable-for-sale financial assets are non-derivative financial assets that aredesignated as available-for-sale and are not classified into any of the other cat-egories described above. Available-for-sale financial assets are measured atfair value. Gains and losses arising from changes in fair value are reported inother comprehensive income and accumulated in equity. In the case of sale orimpairment of an available-for-sale financial asset, the accumulated gains orlosses previously reported in equity are recognised in profit or loss. Interest oninterest-bearing available-for-sale financial assets is recognised in profit orloss, applying the effective interest method. Dividends on equity instruments,classified as available-for-sale, are also recognised in profit or loss.
Investments in equity instruments without a quoted market price in anactive market are measured, if possible, at fair value on the basis of a recog-nised valuation method. Investments in equity instruments without a quotedmarket price in an active market and whose fair value cannot be reliably meas-ured are measured at cost.
Financial liabilities at fair value through profit or lossFinancial liabilities at fair value through profit or loss are either classified asheld for trading or designated as fair value through profit or loss on initial rec-ognition (fair value option). The criteria for classification of financial liabilitiesunder the fair value option are the same as for financial assets. Liabilities to pol-icyholders and some Debt securities are included in this category. Financial lia-bilities held for trading are primarily short positions in interest-bearing securi-ties, equities and derivatives not designated as hedging instruments.
Other financial liabilitiesThe category other financial liabilities primarily include the group’s short-termand long-term borrowings. After initial recognition other financial liabilities aremeasured at amortised cost, using the effective interest method. The balancesheet items Deposits from central banks and credit institutions, Deposits andborrowings from the public and Debt securities issued are included in this category.
Embedded derivativesSome combined contracts contain both a derivative and a non-derivative com-ponent. In such cases, the derivative component is termed an embedded deriv-ative. Where the economic characteristics and risks of the embedded deriva-tives are not closely related to those of the host contract, and the host contractitself is not carried at fair value through profit or loss, the embedded derivativeis bifurcated and reported at fair value with gains and losses being recognisedin the income statement.
Certain combined instruments are classified as financial assets or financialliabilities at fair value through profit or loss according to the fair value option.The designation implies that the entire combined instrument is measured at fairvalue through profit and loss.
Offsetting financial transactionsFinancial assets and liabilities are offset and the net amount reported in thebalance sheet when there is a legal right to offset transactions and an intentionto settle net or realise the asset and settle the liability simultaneously.
Repurchase agreementsSecurities may be lent or sold subject to a commitment to repurchase them(a ‘repo’) at a fixed price and at a predetermined date. Such securities areretained on the balance sheet and in addition included separately as collateralpledged for own liabilities when cash consideration is received. Depending onthe counterparty, payment received is recognised under Deposits by creditinstitutions or as Deposits and borrowing from the public.
Similarly, where the group borrows or purchases securities subject to a com-mitment to resell them (a ‘reverse repo’), the securities are not included in thebalance sheet. Payments made are recognised as Loans to credit institutions oras Loans to the public.
The difference between sale and repurchase price is accrued over the life ofthe agreements using the effective interest method.
Securities borrowing and lendingSecurities borrowing and lending transactions are entered into on a collateral-ised basis. Fair values of securities received or delivered are monitored on adaily basis to require or provide additional collateral. Cash collateral deliveredis derecognised from the balance sheet and a corresponding receivable is rec-ognised. Cash collateral received is recognised in the balance sheet and a cor-responding obligation to return it, is recognised. Securities lent remain on thebalance sheet and are in addition reported as pledged assets. Borrowed securi-ties are not recognised as assets. When borrowed securities are sold (shortposition), an amount corresponding to the fair value of the securities is bookedas a liability. Securities received in a borrowing or lending transaction are dis-closed as obligations.
ModificationThe group may renegotiate loans and modify contractual terms. If the newterms are substantially different from the original terms, the group derecog-nises the original financial asset and recognises a new asset. The group alsoassesses whether the new financial asset is credit-impaired at initial recogni-tion. If the terms are not substantially different, the modification does not resultin derecognition and the group recalculates the gross carrying amount basedon the new cash flows using the original effective interest rate of the financialasset and recognises a modification gain or loss.
Fair value measurementFair value is defined as the price that would be received to sell an asset or paidto transfer a liability in an orderly market between market participants at themeasurement date.
The fair value of financial instruments quoted in an active market is based onquoted market prices. If the asset or liability measured at fair value has a bidprice and an ask price, the price within the bid-ask spread that is most repre-sentative of fair value in the circumstances is used.
The fair value of financial instruments that are not quoted in an active mar-ket is determined by applying various valuation techniques with maximum useof observable inputs. The valuation techniques used are for example dis-counted cash flows, option pricing models, valuations with reference to recenttransactions in the same instrument and valuations with reference to otherfinancial instruments that are substantially the same. When valuing financialliabilities at fair value the group’s own credit standing is reflected.
Any differences between the transaction price and the fair value calculatedusing a valuation technique with unobservable inputs, the Day 1 profit, is amor-tised over the life of the transaction. Day 1 profit is then recognised in profit orloss either when realised through settlement or when inputs used to calculate

Financial statements Notes
SEB Annual Report 201888
fair value are based on observable prices or rates.Fair value is generally measured for individual financial instruments. In addi-
tion, portfolio adjustments are made to cover market risks and the credit riskof each of the counterparties on groups of financial assets and liabilities on thebasis of the net exposure to these risks. When assets and liabilities have offset-ting market risks mid-market prices are used for establishing fair value of therisk positions that offset each other. To reflect counterparty risk and own creditrisk in OTC derivatives, adjustments are made based on the net exposuretowards each counterpart.
Impairment of financial assets under IFRS 9 as of 1 January 2018MeasurementThe impairment requirements are based on an expected credit loss (ECL)model. The guiding principle of the ECL model is to reflect the general patternof deterioration or improvement in the credit quality of financial instruments.All financial assets measured at amortised cost and fair value through othercomprehensive income, as well as lease receivables, financial guarantees con-tracts, contract assets and certain loan commitments are in scope for expectedcredit loss.
ECLs on financial assets measured at amortised cost and lease receivablesare presented as allowances, i.e., as an integral part of the measurement ofthose assets in the balance sheet. The allowance reduces the gross carryingamount. ECLs on loan commitments and financial guarantee contracts are pre-sented as provisions, i.e., as a liability, in the balance sheet. Adjustment to theloss allowance and provision due to changes in ECLs is recognised in the incomestatement as Net expected credit losses.
The assessment of credit risk, and the estimation of ECL, shall be unbiasedand probability-weighted, and shall incorporate all available information whichis relevant to the assessment, including information about past events, currentconditions and reasonable and supportable forecasts of future events and eco-nomic conditions at the reporting date. SEB uses both models and expert creditjudgement (ECJ) for calculating ECLs.For further information please seepages 119 and 120.
The ECL model has a three-stage approach based on changes in the creditrisk. A 12-month ECL (Stage 1) applies to all items, unless there is a significantincrease in credit risk since initial recognition. For items where there is a signifi-cant increase in credit risk (Stage 2) or in default (Stage 3), lifetime ECL applies.
Significant increase in credit riskAt the end of each reporting period the group performs an assessment ofwhether credit risk has increased significantly since initial recognition. Theassessment of whether there has been a significant change in credit risk isbased on quantitative and qualitative indicators. Both historic and forward-looking information is used in the assessment.
For arrangements with an initial origination date as of 1 January 2018 orlater, the primary indicator is changes in lifetime probability of default (PD) bycomparing the scenario-weighted annualised lifetime PD at the reporting datewith the scenario-weighted annualised lifetime PD at initial recognition. Forarrangements with an initial origination date prior to 1 January 2018 changesin SEB’s internal risk classifications since initial origination are used as the pri-mary indicator.
Regardless of the quantitative indicator, a significant increase in credit riskis triggered if the following back-stop indicators occur:• payments are past due >30 days but <90 days; or• financial assets have been classified as watch-listed; or• financial assets are forborne (where due to the customer’s financial
difficulties the contractual terms of the loans have been revised andconcessions given)
Back-stop indicators normally overlap with the quantitative indicator of signifi-cant increase in credit risk.
In case there has been a significant increase in credit risk since initial recog-nition, an allowance for lifetime ECL shall be recognised and the financial instru-ment is transferred to Stage 2. The approach is symmetrical, meaning that insubsequent reporting periods, if the credit quality of the financial instrumentimproves such that there is no longer a significant increase in credit risk sinceinitial recognition, the financial assets moves back to Stage 1.
Definition of defaultFinancial instruments in default are in Stage 3. SEB applies a definition of defaultfor accounting purposes that is consistent with how it is defined in the capitalrequirements regulation, which includes financial assets past due more than90 days. All financial assets in Stage 3 are considered to be credit-impaired.
ModellingThe ECL is calculated as a function of the probability of default (PD), the expo-sure at default (EAD) and the loss given default (LGD), as well as the timing ofthe loss. The group’s IFRS 9 methodology for ECL measurement is based onexisting internal rating-based risk models (IRB) to the extent allowed underIFRS 9. As the objectives of these frameworks differ, the manner in which theexpected credit losses are calculated also differs and appropriate adjustmentsare made to the IRB parameters to meet IFRS 9 requirements. Adjustments
include the conversion of through-the-cycle and downturn parameters used inIRB risk models to point-in-time parameters used under IFRS 9 that considersforward-looking information.
PD represents the likelihood that a loan will not be repaid and will go intodefault in either a 12-month or lifetime horizon. The expected PD for each indi-vidual instrument incorporates a consideration of past events, current marketconditions and reasonable and supportable information about future economicconditions. SEB uses IFRS 9 specific PD models. The models are calibratedbased on a combination of geography, assets class and product type. EAD rep-resents an estimate of the outstanding amount of credit exposure at the time adefault may occur. For off-balance sheet amounts, EAD includes an estimate ofany further amounts to be drawn at the time of default. For IFRS 9, EAD modelsare adjusted for a 12-month or lifetime horizon. LGD is the amount that may notbe recovered in the event of default. LGD takes into consideration the amountand quality of any collateral held as well as the probability of cure, whereby theborrower repays all his past due obligations on the defaulted loan and recom-mences contractual repayments. SEB uses existing LGD models adjusted tomeet IFRS 9 requirements.
When measuring ECL, SEB uses the maximum contractual period duringwhich SEB is exposed to risk. All contractual terms are considered when deter-mining the expected life, including prepayment options and extension and rollo-ver options. For revolving facilities, such as credit cards, and retail mortgagefacilities the expected life is modelled based on historical behaviour. The resid-ual behavioural expected life for such facilities is based on historically observedsurvival curve and it is affected by the time since origination of the arrangement.
Forward-looking informationThe group uses internally developed macroeconomic forecasts as the basis forthe forward-looking information incorporated in the ECL measurement. In orderto ensure an unbiased estimation of credit losses under IFRS 9, at least threescenarios are used. One of the scenarios is the base case scenario, representingthe most likely outcome, which is also applied in the financial planning andbudgeting process, while other case scenarios represent more positive ornegative outcomes.
The forward-looking scenarios are prepared by SEB’s Economic ResearchDepartment. The scenarios are approved by the Group Risk Committee. A sce-nario consists of a qualitative description of the macroeconomic developmentand a quantitative part, with forecasts of key macroeconomic variables forthree subsequent years, as well as the likelihood of occurrence (scenario-weight). The scenarios are reviewed and updated on a quarterly basis. In caseof significant changes in the macroeconomic environment and outlook, the sce-narios will be updated more frequently. The base scenario variables are bench-marked to various external sources of similar forward-looking scenarios, e.g.from OECD, IMF, EU and National Statistics Offices.
Expert Credit Judgement (ECJ)The group uses both models and expert credit judgement (ECJ) in order todetermine ECLs. The degree of judgement that is required to estimate ECLdepends on the model outcome, materiality and the availability of detailedinformation. The model provides guidance and transparency as to how eco-nomic events could affect the impairment of financial assets. ECJ may beapplied to the modelled outcome to incorporate an estimated impact of factorsnot captured by the model. Such judgmental adjustment to the model-gener-ated ECLs may be applied to significant exposures at a counterparty level.The adjustments are decided by the relevant credit committee using the modelECLs as guidance. In addition, there may be a need for adjustments at a port-folio level, which is decided by the Group Risk Committee.
Impairment of financial assets under IAS 39 until 31 December 2017All financial assets, except those classified at fair value through profit or loss,are tested for impairment.
At each balance sheet date the group assesses whether there is objectiveevidence that financial assets not carried at fair value through profit or loss areimpaired. A financial asset or a group of financial assets are impaired andimpairment losses are incurred if there is objective evidence of impairment as aresult of one or more events occurring after the initial recognition of the asset,and if that loss event will have an impact on the estimated future cash flows ofthe financial asset or a group of financial assets that can be reliably measured.
Examples of objective evidence that one or more events have occurred whichmay affect estimated future cash flows include:– significant financial difficulty of the issuer or obligor;– concession granted to the borrower as a consequence of financial difficulty,
which normally would not have been granted to the borrower;– a breach of contract, such as a default or delinquency in the payment of
interest or principal;– the probability that the borrower will go bankrupt or undergo some other kind
of financial reconstruction;– deterioration in the value of collateral; and– a significant or prolonged decline in the fair value of an equity instrument
below its cost.

Notes Financial statements
SEB Annual Report 2018 89
An impairment loss is reported as a write off, if it is deemed impossible to col-lect the contractual amounts that have not been paid and/or are expected toremain unpaid, or if it is deemed impossible to recover the acquisition cost byselling any collateral provided. In other cases, a specific provision is recordedin an allowance account. As soon as the non-collectible amount can be deter-mined and the asset is written off, the amount reported in the allowanceaccount is dissolved. Similarly, the provision in the allowance account isreversed if the estimated recovery value exceeds the carrying amount.
Individual assessment of impairmentLoss events indicating objective evidence of impairment of individually assessedassets are when scheduled payments are past due by more than 90 days, or ifthe counterparty is expected to be in default or any other combination of eventsthat are deemed so negative that there will be a probable payment default in theforeseeable future. The debt instrument is impaired if the cash flows includingthe value of the collateral does not cover outstanding exposure.
Collective assessment of impairment when assets are not individually impairedAssets assessed for impairment on an individual basis and found not impairedare included in a collective assessed, of incurred but not identified, impairment.The collective assessment of incurred but not identified credit losses is basedon the SEB counterpart rating scale.
Loans assessed on a portfolio basisLoans with limited value and similar risk, homogenous groups, are assessed forimpairment on a portfolio basis. In assessing collective impairment the groupuses statistical models based on the probability of default and the amount ofloss incurred, considering collaterals and recovery rates. The outcome isadjusted for management’s judgement as to whether current economic andcredit conditions are such that the actual losses are likely to be greater or lessthan suggested by the models. Default rates and loss rates are regularly bench-marked against actual outcomes to ensure that they remain appropriate.
Recognition of impairment loss on financial assets carried at amortised costAn impairment of an individually assessed financial asset in the category loansand receivables carried at amortised cost is calculated on the basis of the origi-nal effective interest rate of the financial instrument. The amount of the impair-ment is measured as the difference between the carrying amount of the assetand the present value of estimated future cash flows (recoverable amount).If the terms of an asset are restructured or otherwise modified due to financialdifficulties on behalf of the borrower or issuer, impairment is measured usingthe original effective interest rate before modification of the terms and condi-tions. Cash flows relating to short-term receivables are not discounted if theeffect of the discounting is immaterial. The entire outstanding amount of eachloan for which a specific provision has been established is included in impairedloans, i.e. including the portion covered by collateral.
Recognition of impairment loss on Available-for-sale financial assetsWhen there is a decline in the fair value and there is objective evidence ofimpairment in an available-for-sale financial instrument, the accumulated lossshall be reclassified from equity to profit or loss. Equity instruments are consid-ered impaired when a significant or prolonged decline in the fair value hasoccurred. The amount of the accumulated loss that is transferred from equityand recognised in profit or loss is equal to the difference between the acquisi-tion cost and the current fair value, with a deduction of any impairment losseson that financial asset which had been previously recognised in profit or loss.
The incurred impairment of unquoted equities, measured at acquisition cost,is calculated as the difference between the carrying amount and the presentvalue of estimated future cash flows, discounted at the current market rate ofreturn for similar equities.
Impairment losses on bonds or other interest-bearing instruments classifiedas available-for-sale are reversed via profit or loss if the increase in fair valuecan be objectively attributed to an event taking place subsequent to the write-down. Impairment losses for equity instruments classified as available-for-saleare not reversed through profit or loss following an increase in fair value but arerecognised in other comprehensive income.
Restructured loansPortfolio assessed loans that would have been considered past due more than60 days if they were not restructured.
Hedge accountingDerivatives are used to hedge interest rate, exchange rate and equity expo-sures. Where derivatives are held for risk management purposes and whentransactions meet the required criteria, the group applies fair value hedgeaccounting, cash flow hedge accounting or hedging of a net investment in aforeign operation as appropriate to the risks being hedged. The group docu-ments and designates, at inception, the relationship between the hedged itemand the hedging instrument as well as the risk objective and hedge strategy.The group also documents its assessment, both at inception and on an ongoingbasis, whether the derivatives used are both prospectively, and retrospectively
highly effective in offsetting the hedged risk. As part of the prospective test thegroup also assesses and documents that the likelihood of forecasted transac-tions to take place is highly probable.More information regarding hedgeaccounting can be found in note 21 Derivatives and hedge accounting.
Hedge accounting is applied when derivatives are used to reduce risks suchas interest rate risks and currency risks in financial instruments. Furthermore,hedge accounting can be applied to liabilities hedging currency risk in netinvestments in subsidiaries. The group applies different hedge accountingmodels depending on the purpose of the hedge:– Hedges of fair value of recognised assets or liabilities (fair value hedge);– Hedges of the fair value of the interest rate risk of a portfolio (portfolio
hedge);– Hedges of highly probable future cash flows attributable to recognised
assets or liabilities (cash flow hedge);– Hedges of a net investment in a foreign operation (net investment hedge).
The group discontinues hedge accounting when:– The derivative has ceased to be highly effective as a hedging instrument;– The derivative expires, is sold, terminated, or exercised;– The hedged item matures, is sold or repaid; or– The forecast transaction is no longer deemed highly probable.
SEB has decided to continue applying hedge accounting requirements in IAS 39.
Fair value hedgeFair value hedges are used to protect the group against undesirable exposuresto changes in the market prices of recognised assets or liabilities. Changes infair value of derivatives that qualify and are designated as hedging instrumentsare recorded in the income statement, together with changes in the fair valueof the hedged asset or liability that are attributable to the hedged risk as Netother income.
Where the group hedges the fair value of interest rate exposure in a portfolioincluding financial assets or financial liabilities, so called portfolio hedging ofinterest rate risk, the gains or losses attributable to the hedged item arereported as a separate item under assets or as a separate item under liabilitiesin the balance sheet.
When hedge relationships are discontinued, any adjustment to the carryingamount of the hedged item is amortised to profit or loss over the period tomaturity of the hedged item.
Cash flow hedgeCash flow hedging is applied for the hedging of exposure to variations in futureinterest payments on assets or liabilities with variable interest rates. The por-tion of the gain or loss on the hedging instrument that is determined to be aneffective hedge is recognised in other comprehensive income. The ineffectiveportion of the gain or loss on the hedging instrument is recognised in profit orloss as Net other income.
Gains or losses on hedging instruments that have been accumulated inequity are recognised in profit or loss in the same period as interest incomeand interest expense from the hedged asset or liability.
When cash flow hedges are discontinued but future cash flows still areexpected to occur, accumulated gains or losses from the hedging instrumentwill remain as a separate item in equity until the hedged future cash flowsoccur. Accumulated gains or losses are subsequently reported in profit or lossin Net interest income in the same period in which the previously hedged inter-est flows are recognised in profit or loss.
Net investment hedgeHedge of a net investment is applied to protect the group from translation dif-ferences due to net investments in foreign subsidiaries. Foreign currency loansconstitute the major portion of hedging instruments in these transactions. Thetranslation differences arising on the hedging instruments are recognised inother comprehensive income and accumulated in equity as translation of for-eign operations, to the extent the hedge is effective. Any ineffective part is rec-ognised as Net financial income. When a foreign operation is partially disposedof or sold, exchange differences accumulated in equity are recognised in theincome statement as part of the gain or loss on the sale.
OPERATING INCOMEInterest income and interest expenseThe effective interest method is applied to recognise interest income and inter-est expenses in profit or loss for financial assets and financial liabilities meas-ured at amortised cost.
The effective interest method is a method of calculating the amortised costof a financial asset or a financial liability and of allocating interest income andinterest expenses. The effective interest rate is the rate that discounts esti-mated future cash payments or receipts through the expected life of the finan-cial instrument to the net carrying amount of the financial instrument. Whencalculating future payments, all payments included in the terms and conditionsof the contracts, such as advance payments, are taken into consideration. How-ever, future credit losses are not taken into account. The calculation of the

Financial statements Notes
SEB Annual Report 201890
effective interest rate includes fees and points to be received and paid thatare an integral part of the effective interest rate.
Once a financial asset or a group of similar financial assets has been writtendown as a result of an impairment loss, interest income is subsequently recog-nised applying the rate of interest used to discount the future cash flows for thepurpose of measuring the impairment loss.
Net fee and commission incomeThe recognition of revenue from contracts with customers is reported as feeand commission income.
Fees that are included in the calculation of the effective interest rate of afinancial instrument measured at amortised cost, such as loan origination fees,are allocated over the expected tenor of the instrument applying the effectiveinterest method and presented in Net interest income.
Fee and commission income is recognised to depict the transfer of promisedservices to the customers in an amount that reflects the consideration to whichSEB expects to be entitled in exchange for the service. The major types of feesare described below.
Fee and commission income for asset custody and asset management tocustomers is recognised as revenue over the period in which the services areprovided. Performance based fees are recognised when it is highly probablethat a significant reversal of recognised revenue will not occur, which is mostoften when the performance criteria are fulfilled.
Fee and commission income from loan syndications in which SEB acts asarranger are recognised as income when the syndication is completed and thegroup has retained no part of the loan or retained a part of the loan at the sameeffective interest rate as other participants. Brokerage fees, commission andfees from negotiating a transaction for a third party, such as arrangement ofacquisitions or purchase or sale of a business, are recognised on completion ofthe transaction.
Expenses that are directly related to the generation of fee and commissionincome are recognised as fee and commission expense.
Net financial incomeGains and losses arising from changes in fair value of financial assets and liabili-ties measured at fair value through profit or loss are reported under the itemNet financial income. For financial liabilities designated at fair value throughprofit or loss the change in fair value relating to change in own credit risk isaccounted for in other comprehensive income as of 2018.
Dividend incomeDividends are recognised when the entity’s right to receive payment is estab-lished.
Seized assetsSeized assets are assets taken over to protect a claim. SEB may refrain from aloan receivable and instead seize the asset that served as collateral for theloan. Seized assets may consist of financial assets, properties and other tangi-ble assets. Seized asset are recognised on the same line item in the balancesheet as similar assets that have been acquired otherwise. At inception seizedassets are measured at fair value. The fair value at initial recognition becomesthe acquisition value. Subsequently seized assets are measured according totype of asset with the exception of impairment on tangible seized assets that isreported as Gains less losses from tangible and intangible assets rather than asDepreciation, amortisation and impairment of tangible and intangible assets.The purpose is to better reflect the similar character of impairment of assetsthat are taken over to protect claims on counterparties and credit losses.
Tangible assetsTangible assets, with the exception of investment properties held in insuranceoperations, are measured at cost and are depreciated according to plan on astraight line basis over the estimated useful life of the asset. The maximumdepreciation period for buildings is 50 years. The depreciation period for othertangible assets is between 3 and 8 years.
Tangible assets are tested for impairment whenever there is an indication ofimpairment.
LeasingA finance lease is a lease that transfers, from the lessor to the lessee, substan-tially all risks and rewards incidental to the ownership of an asset. In the group,essentially all leasing contracts in which the group is the lessor are classified asfinance leases. Finance leases are reported as lending, which implies that theleasing income is reported within net interest income.
Investment propertiesInvestments in properties held in order to receive rental income and/or for capi-tal appreciation are reported as investment properties. The recognition andmeasurement of such properties differs, depending upon the entity owning theproperty. Investment properties held in the insurance operations, used to matchliabilities providing a yield directly associated with the fair values of specifiedassets, including the investment properties themselves, are accounted for using
the fair value model. Holdings of investment properties in the banking opera-tions are measured at depreciated cost.
Intangible assetsIntangible assets are identifiable, non-monetary assets without physical sub-stance. For an intangible asset to be recognised an entity must be able to dem-onstrate control of the intangible asset, which implies that the entity has theability to ensure that the future economic benefits flowing from the underlyingresource will accrue to the company. Intangible assets, other than goodwill, areonly recognised in the balance sheet if it is probable that the future economicbenefits attributable to the asset will accrue to the group and if the acquisitioncost of the asset can be measured in a reliable manner.
Intangible assets are measured initially at acquisition cost, and thereafterat cost less any accumulated amortisation and any accumulated impairmentlosses.
Intangible assets with finite useful lives, i.e. all intangible assets exceptgoodwill, are amortised on a straight line basis over their useful lives and testedfor impairment annually and whenever events or changes in circumstancesindicate that the carrying amount may not be recoverable. Internally generatedintangible assets, such as software development, are amortised over a periodof between 3 and 8 years.
Intangible assets with indefinite useful lives, i.e. goodwill, are not amortisedbut tested for impairment annually and whenever there is an indication that theintangible asset may be impaired. As regards goodwill, an impairment loss isrecognised in profit or loss whenever the carrying amount, with respect to acash-generating unit or a group of cash-generating units to which the goodwillis attributed, exceeds the recoverable amount. Impairment losses attributableto goodwill are not reversed, regardless of whether the cause of the impair-ment has ceased to exist.
The recoverable amount of an intangible asset is determined if there is indi-cation of a reduction in the value of the asset. An impairment loss is recognisedif the carrying amount exceeds the recoverable amount of the asset.
ProvisionsProvisions are recognised for present obligations arising as consequences ofpast events where it is more likely than not that a transfer of economic benefitwill be necessary to settle the obligation, and it can be reliably estimated. Pro-visions are determined by discounting the expected future cash flows at pre-tax rate that reflects current market assessments of the time value of moneyand, where appropriate, the risks specific to the liability.
Provisions are made for undrawn loan commitments and similar facilities ifit is probable that the facility will be drawn by a debtor in financial difficulties.
Provisions are evaluated at each balance sheet date and are adjusted asnecessary.
Financial guaranteesFinancial guarantees are contracts that require the group to make specifiedpayments to reimburse the holder for a loss it incurs because a specified debtorfails to make payment when due in accordance with the terms of a debt instru-ment. Financial guarantee liabilities are initially recognised at their fair value,which most often equals the premium received. The initial fair value is amor-tised over the life of the financial guarantee. The guarantee liability is subse-quently carried at the higher of this amortised amount and the best estimateof the expenditure required settling any financial obligation arising as a resultof the guarantee at the balance sheet date. Provisions and changes in provi-sions are recognised in the income statement as Net credit losses. The contrac-tual amounts according to financial guarantees are not recognised in the bal-ance sheet but disclosed as obligations.
Employee benefitsPensionsThere are both defined contribution and defined benefit pension plans withinthe group, of which most have plan assets. A defined benefit plan is a pensionplan that defines an amount of pension benefit that an employee will get onretirement depending on factors such as age, years of service and compensa-tion. A defined contribution plan is a pension plan where the group pays a con-tribution to separate entities and has no further obligation once the contribu-tion is paid.
The pension commitments of the group with respect to defined benefit plansare covered by the pension funds of the group or through insurance solutions.
The defined benefit obligation is calculated quarterly by independent actu-aries using the Projected Unit Credit Method.The assumptions upon whichthe calculations are based are found in note 8b Pensions All changes in the netdefined benefit liability (asset) are recognised as they occur, as follows: (i)service cost and net interest in the income statement; and (ii) remeasurementsof both defined benefit obligations and plan assets in other comprehensiveincome.
Pension costs for defined contribution pension plans are recognised as anexpense during the period the employees carry out the service to which thepayment relates.

Notes Financial statements
SEB Annual Report 2018 91
Share-based paymentsThe group operates a number of share-based incentive programmes, underwhich it awards SEB equity instruments to its employees. Equity-settled share-based incentive programmes entitle employees to receive SEB equity instru-ments. Cash-settled share-based incentive programmes entitle employeesto receive cash based on the price or value of equity instruments of SEB. Fairvalue of these rights is determined by using appropriate valuation models,taking into account the terms and conditions of the award and the group’s esti-mate of the number of rights that will eventually vest, which is reassessed ateach reporting date. Social security charges are accounted for over the vestingperiod and the provision for social security charges is reassessed on eachreporting date to ensure that the provision is based on the rights’ fair value atthe reporting date.
The cost of equity-settled share-based incentive programmes is measuredby reference to the fair value of equity instruments on the date they aregranted and recognised as an expense on a straight-line basis over the vestingperiod with a corresponding increase in equity. The vesting period is the periodthat the employees have to remain in service in SEB in order for their rights tovest. For cash-settled share-based incentive programmes, the servicesacquired and liability incurred are measured at the fair value of the liability andrecognised as an expense over the vesting period, during which the employeesrender service. Until settlement, the fair value of the liability is remeasured,with changes in fair value recognised in the income statement.
TAXESThe group’s tax for the period consists of current and deferred tax. Currenttax assets and liabilities for the current and prior periods are measured at theamount expected to be paid to or from tax authorities using the tax rates andtax laws that have been enacted or substantively enacted at the balance sheetdate. Current tax is calculated based on the taxable results for the period.Deferred tax arises due to temporary differences between the tax bases ofassets and liabilities and their carrying amounts.
Current tax and deferred tax are generally recognised in profit or loss. How-ever, tax that relates to items recognised in other comprehensive income is alsoreported directly in other comprehensive income. Examples of such items arechanges in the fair value of financial assets at fair value through other compre-hensive income, gains or losses on hedging instruments in cash flow hedges.
Deferred tax assets are recognised in the balance sheet to the extent that itis probable that future taxable profits will be available against which they canbe utilized. The group’s deferred tax assets and tax liabilities have been calcu-lated at the tax rate of 21.4 per cent and 20.6 per cent as of 2021 in Sweden,and at each respective country’s tax rate for foreign companies.
INSURANCE AND INVESTMENT CONTRACTSInsurance contracts are contracts under which the group accepts significantinsurance risk – defined as a transfer of an absolute risk of minimum 5 percentof the underlying value – from the policyholder by agreeing to compensate thepolicyholder or other beneficiaries on the occurrence of a defined insured event.Investment contracts are financial instruments that do not meet the definitionof an insurance contract, as they do not transfer significant insurance risk fromthe policyholder to the group.
Insurance contractsInsurance contracts are classified as short-term (non-life) or long-term (life).Short-term insurance comprise sickness, disability, health-care, and rehabilita-tion insurance. Long-term insurance comprises mainly traditional life insurance.In the group accounts short-term and long-term insurance are presented aggre-gated as Insurance contracts.
Measurement of short-term insurance contracts (non-life)The provision for unearned premiums is intended to cover the anticipated costof claims and operating expenses arising during the remaining policy period ofthe insurance contracts in force. The provision for unearned premiums is usu-ally strictly proportional over the period of the insurance contracts. If premiumsare judged to be insufficient to cover the anticipated cost for claims and operat-ing expenses, the provision for unearned premiums is strengthened with a pro-vision for unexpired risks.
For anticipated future claims that have been incurred but not yet paid, provi-sion for claims outstanding is recognised. The provision is intended to cover theanticipated future payment of all claims incurred, including claims incurred butnot reported (IBNR provisions). This provision should also cover all costs forclaims settlement. The provision for claims outstanding is not discounted, withthe exception of provisions for sickness annuities, which are discounted usingstandard actuarial methods.
Measurement of long-term insurance contracts (life)For long-term life insurance contracts, a liability for contractual benefits thatare expected to be incurred in the future is recorded when the premiums arerecognised. The liability equals the sum of the discounted value of expectedbenefit payments and future administration expenses, less any outstanding
future contractual premium payments. Liabilities for long-term life insuranceare discounted using standard actuarial methods.
Liability adequacy testSwedish actuarial procedures involve performing liability adequacy tests oninsurance liabilities. This is to ensure that the carrying amount of the liabilitiesis sufficient in the light of estimated future cash flows. The carrying amount ofa liability is the value of the liability itself less any related intangible asset orasset for deferred acquisition costs. The current best estimates of future con-tractual cash flows, as well as claims handling and administration costs, areused in performing these liability adequacy tests. These cash flows are dis-counted and compared to the carrying amount of the liability. Any deficit isimmediately recognised in profit or loss.
Revenue recognitionPremiums for insurance contracts are recognised as revenue when they arepaid by the policyholders. For contracts where insurance risk premiumsreceived during a period are intended to cover insurance claims arising in thatperiod those premiums are recognised as revenue proportionally during theperiod of coverage.
Recognition of expensesCosts for insurance contracts are recognised as an expense when incurred,with the exception of commissions and other variable acquisition costs thatvary with and are directly related to securing new contracts and the renewalof existing contracts. These costs are capitalised as deferred acquisition costs.These costs are mainly incremental acquisition costs paid to sales personnel,brokers and other distribution channels. Deferred acquisition costs are amor-tised as the related revenue is recognised. The asset is tested for impairmentevery accounting period, ensuring that the economic future benefits expectedto arise from the contracts exceed its face amount. All other costs, such as non-incremental acquisition costs or maintenance costs, are recognised in theaccounting period in which they arise. Insurance compensation is recordedas an expense when incurred.
ReinsuranceContracts with re-insurers, whereby compensation for losses is received by thegroup, are classified as ceded reinsurance. For ceded reinsurance, the benefitsto which the group is entitled under the terms of the reinsurance contract arereported as the re-insurers’ share of insurance provisions. Amounts recovera-ble from re-insurers are measured consistently with the amounts associatedwith the reinsurance contracts and in accordance with the terms of each rein-surance contract.
Investment contractsThe majority of the group’s unit linked insurance is classified as investment con-tracts where no significant insurance risk is transferred from the policyholderto the group. A minor part of the group’s unit linked insurance business is classi-fied as insurance contracts.
MeasurementInvestment contracts are financial commitments whose fair value is dependenton the fair value of the underlying financial assets. The underlying assets aremandatorily measured at fair value through profit or loss and the related liabili-ties are designated at fair value through profit or loss (fair value option). Thechoice to use the fair value option for the liabilities has been made for the pur-pose of eliminating the measurement inconsistency that would occur if differ-ent bases for measurement would have been used for assets and liabilities. Thefair value of the unit linked financial liabilities is determined using the fair valueof the financial assets linked to the financial liabilities attributed to the policy-holder on the balance sheet date. However, if the liability is subject to a surren-der option, the fair value of the financial liability is never less than the amountpayable on surrender.
Revenue recognitionAmounts received from and paid to policyholders are reported in the balancesheet as deposits or withdrawals. Fees charged for managing investment con-tracts are recognised as revenue. The revenue for these management servicesis evenly distributed over the tenor of the contracts.
Recognition of expensesIncremental costs of obtaining investment contracts with customers aredeferred if they are expected to be recovered. Incremental costs are costs toobtain a contract with a customer that would not have been incurred if the con-tract had not been obtained. These costs are up-front acquisition costs in theform of sales commissions paid for obtaining investment contracts. They areexpected to be recovered from the fee income earned from the investmentcontracts. Deferred acquisition costs are reported in profit or loss as therelated revenue is recognised. The asset is tested for impairment during eachaccounting period to ensure that the future economic benefits expected to

Financial statements Notes
SEB Annual Report 201892
arise from the contract exceed the carrying amount of the asset. All othercosts, such as commissions to brokers paid during the tenor of the investmentcontracts or commission to own staff acting as sales agents or ongoing adminis-tration cost, are recognised in the accounting period in which they arise.
Contracts with discretionary participation features (DPF)Some traditional pension saving contracts include a discretionary participationfeature. This feature entitles the policyholder to receive, as a supplement toguaranteed benefits, additional benefits or bonuses. All contracts that includea discretionary participation feature are reported as insurance contracts. Theamounts referring to the guaranteed element and to the discretionary partici-pation feature are reported as liabilities to policyholders.
Changes in accounting policies implemented 2018The following changes have been implemented in 2018:
The group adopted IFRS 9 Financial Instruments with a date of transition1 January 2018. The standard replaces IAS 39 Financial Instruments: Classifica-tion and Measurement and covers three areas; classification and measurement,impairment and hedge accounting. The group has elected to continue applyingthe principles in IAS 39 relating to hedge accounting. For transitional purposesthe quantitative indicator used for assessing significant increase in credit riskfor impairment purposes is based on risk class or equivalent. As permitted bythe transitional provisions in IFRS 9, the group has elected not to restate com-parative figures. Any adjustments to the carrying amounts of financial assetsand liabilities at the date of transition are recognised in the opening balance inequity as at 1 January 2018.
The group adopted IFRS 15 Revenue from Contracts with Customers with adate of transition 1 January 2018. IFRS 15 replaces all previous revenue stand-ards and related interpretations including IAS 11 Construction Contracts andIAS 18 Revenue but does not apply to financial instruments, insurance contractsor leasing contracts. IFRS 15 establishes the principles for reporting informa-tion about the nature, amount, timing and uncertainty of revenue and cashflows from contract with customers. SEB identified that the treatment of con-tract costs for investment contracts within Life will change and as a result ofthe new more specific requirements, a smaller part of deferred acquisitioncosts is recognised as an asset. The group chose to apply the standard retro-spectively to each prior reporting period presented. The transition effect istherefore recognised as a reduction of the opening retained earnings, as at 1January 2017.
IAS 12 Income Taxes has been amended regarding recognition of deferredtax assets for unrealised losses. IAS 7 Statement of Cash flows has beenamended with new disclosure requirements. Within the annual improvementcycle 2014–2016 the scope of IFRS 12 Disclosures of interests in other entitieshas been clarified. These amendments and interpretations are applied andhave been endorsed by the EU.
IFRS 4 Insurance Contracts has been amended regarding applying IFRS 9Financial Instruments together with IFRS 4 Insurance Contracts. The amendmentallows a temporary exemption from IFRS 9 for a limited period for insurerswhose activities are predominantly connected with insurance. An insurerapplying the temporary exemption continues to apply IAS 39 rather thanapplying IFRS 9. SEB has chosen to not apply the exemption in the Life division.
Changes in IFRSs not yet appliedConsideration will be given in the future to the implications, if any, of the follow-ing new and revised standards and interpretations. IFRS 16 Leases replacesIAS 17 Leases and related interpretations. The standard is effective as from1 January 2019 and is endorsed by the EU. For SEB’s accounting policies relatedto IFRS 16, see note 54.
IFRS 17 Insurance Contracts was published in May 2017. This standardshould be applied as from 1 January 2021 and has not yet been endorsed by EU.IFRS 17 establishes principles for the recognition, measurement, presentationand disclosure of issued insurance contracts. It also requires similar principlesto be applied to held reinsurance contracts and issued investment contractswith discretionary participation features. IFRS 17 replaces IFRS 4 InsuranceContracts. SEB is currently evaluating the impact of the change to the financialstatements of the group.
IFRIC 23 Uncertainty over Income Tax Treatments has been issued and speci-fies how to reflect the effects of uncertainty in accounting for income taxes.The interpretation is effective as of 1 January 2019 and is endorsed by the EU.
IAS 28 Interests in Associates and Joint Ventures has been amended so com-panies should apply IFRS 9 Financial Instruments to long-term interests in anassociate or joint venture that form part of the net investment in the associateor joint venture. Amendments have been made to IFRS 9 Financial Instrumentsregarding prepayment features with negative compensation. The interpreta-tion should be applied as from 1 January 2019 and is endorsed by the EU.
IAS 23 Borrowing Costs, IAS 12 Income Taxes, IFRS 3 Business Combinationsand IFRS 11 Joint Arrangements have been amended within the Annual improve-ment cycle 2015–2017. These amendments and interpretations should beapplied as from 1 January 2019 and have not been endorsed by the EU. Thechanges will not have a material effect on the financial statements of the groupor on capital adequacy and large exposures.
Amendments to IFRS 3 Business Combinations and the definition of business.The amendments are effective for business combinations for which the acquisi-tion date is on or after the beginning of the first annual reporting period begin-ning on or after 1 January 2020 and are not yet endorsed by the EU.
Significant accounting policies of the parent companySkandinaviska Enskilda Banken (SEB) AB is a public limited liability companywith corporate number 502032-9081 and with registered office in Stockholm,Sweden.
The financial statements of the parent company are prepared in accordancewith the Annual Accounts Act for Credit Institutions and Securities Companies(1995:1559), the regulation and general guidelines issued by the SwedishFinancial Supervisory Authority, Annual Reports in Credit Institutions and Secu-rities Companies (FFFS 2008:25) and statements from the Swedish FinancialReporting Board, RFR 2 and the additional UFR statements.
In accordance with the Financial Supervisory Authority’s regulation, the par-ent company applies statutory IFRS. This means that the International Finan-cial Reporting Standards (IFRS) and interpretations of these standards asadopted by the EU have been applied to the extent that is possible within theframework of Swedish legislation and considering the close tie between finan-cial reporting and taxation. The accounting principles of the parent companydiffer, in certain aspects, from the accounting principles applied by the SEBGroup. The essential differences are described below.
CHANGED ACCOUNTING POLICIESThe changed group accounting policies and future accounting developmentsalso applies to the parent company. The Swedish Annual Accounts Act forCredit Institutions and Securities Companies has been updated where the mainchange is new requirements to publish a sustainability and diversity report. Inall other material aspects the accounting policies, basis for preparation andpresentation for the parent company are unchanged in comparison with theannual report for 2017.
With effect from 1 January 2018 the regulations and general guidelines issuedby the Swedish Financial Supervisory Authority have been updated. The changesare mainly related to the implementation of IFRS 9 and IFRS 15, e.g. the presenta-tion of different items in the income statement and classification of seized assets.With effect from 1 January 2019 the regulations and general guidelines issued bythe Swedish Financial Supervisory Authority have been updated. The changesare mainly related to the implementation of IFRS 16 Leases.
PRESENTATION FORMATThe presentation format for the balance sheet and the profit and loss accountaccording to the Annual Accounts Act for Credit Institutions and SecuritiesCompanies is not in conformity with IFRS. Credit institutions and securitiescompanies applying IFRS as adopted by the EU in their consolidated financialstatements have the option to deviate from the presentation format for the bal-ance sheet as stipulated by law, but may not deviate from the stipulated profitand loss account.
HOLDINGS IN SUBSIDIARIES ANDASSOCIATED COMPANIESShares and participating interests in subsidiaries and associated companiesare measured at cost. Dividends on shares in subsidiaries and associated com-panies are recognised as income in profit or loss. Merger of subsidiaries throughabsorption are accounted for at consolidated values. The merger effect isreported in equity.
Financial assets and liabilitiesThe changed group accounting policies also applies to the parent company,with the exception of financial liabilities designated as fair value through profitor loss where the change in fair value relating to change in own credit risk isaccounted for in profit or loss.
LEASINGLeasing contracts which are classified as finance leases in the consolidatedaccounts are accounted for as operating leases in the parent company.
PENSIONSThe parent company does not apply the provisions of IAS 19 concerningaccounting for defined benefit plans. Instead, pension costs are calculated onan actuarial basis in the parent company in accordance with the provisions ofthe Act on Safeguarding Pension Obligations and the Swedish Financial Super-visory Authority’s regulations. This is a requirement by the Swedish tax regula-tion. In Sweden, actuarial pension commitments are guaranteed by a pensionfoundation.
The recognised net cost of pensions is calculated as pensions paid and pen-sion premiums less any compensation from the pension foundation. The net pen-sion cost for the year is reported under Staff costs in the parent company’s profitand loss account. Excess amounts as a result of the value of the plan assetsexceeding the estimated pension obligations are not recognised as an asset inthe parent company’s balance sheet. Deficits are recognised as a liability.

Notes Financial statements
SEB Annual Report 2018 93
GOODWILLANDOTHER INTANGIBLEASSETSIn accordance with IAS 38, goodwill is not amortised in the consolidated finan-cial statements. In the parent company financial statements, goodwill is amor-tised as any other intangible asset on a straight line basis.
TAXESIn the parent company, untaxed reserves are recognised as a separate item inthe balance sheet. Untaxed reserves comprise accelerated depreciation undertax regulations, including the deferred tax component. In the consolidatedfinancial statements, untaxed reserves are reported in retained earnings anddeferred tax liability.
GROUP CONTRIBUTIONSThe net of group contributions received and paid is reported in the parent com-pany as appropriations.
Critical judgements in applying the accounting policiesApplying the group’s accounting policies requires in some cases the use of esti-mates and assumptions that have a material impact on the amounts reported inthe financial statements. The estimates are based on expert judgements andassumptions that management believes are true and fair. The managementcontinuously evaluates these judgements and estimates. The most significantassumptions and estimates are associated with the areas described below:
CONSOLIDATIONOFMUTUAL LIFE INSURANCECOMPANIESANDFUNDSWithin the life insurance operations of the SEB Group Gamla Livförsäkrings ABSEB Trygg Liv operates as a mutual life insurance company. The entity is notconsolidated, as the judgement of the group is that it does not have control ofthe entity. Control is seen to imply the power to govern the financial and operat-ing policies of an entity in order to affect the amount of its returns from theentity. Life insurance entities operated as mutual life insurance companies can-not pay dividends which is why the group deems that it cannot obtain benefits.In Gamla Livförsäkrings AB SEB Trygg Liv there are specific policies specifyingthe composition of the board, which implies that the SEB Group is not able togovern the financial and operating policies of the entity.
In the assessment whether to consolidate funds, an assessment is madewhether the group is considered to be an agent or a principal. The group is con-sidered a principal, and hence controls the fund, when it is the fund manager,cannot be removed without cause, has significant right to returns from the fundby holding units and earning fee income and has the practical ability to influ-ence its return by using its power. Funds managed by the group in which entitieswithin the group owns more than 20 per cent are analysed further for consoli-dation.
The policyholders in SEB’s unit-linked company choose to invest in a varietyof funds. The insurance company providing unit-linked products invests in thefunds chosen by the customers. By doing so SEB might, in some cases, holdmore than 50 per cent of the funds, which it holds on behalf of the customersfor whom it acts as investment manager. Due to the legislation regarding fundoperations, SEB considers that it does not have the power to govern the finan-cial and operating policies of such investment funds to obtain benefits. Thisapplies irrespective of whether the funds held on behalf of customers aregreater or less than 50 per cent of a fund. It is the policyholders who carry theinvestment risk, not SEB. Consequently, the policyholders are entitled to all ofthe returns generated by the funds. SEB only charges fees, on market condi-tions, for managing the funds. SEB has come to the conclusion that these fundswhich it manages should not be consolidated. However, the shares that thegroup holds in such funds on behalf of its customers are recognised in the bal-ance sheet.
FAIR VALUEMEASUREMENT OF FINANCIAL INSTRUMENTSThe objective of the fair value measurement is to arrive at the price at which anorderly transaction would take place between market participants at themeasurement date under current market conditions. The best evidence of fairvalue is a quoted price for the instrument being measured in an actively tradedmarket. Where the market for a financial instrument is not active, fair value iscalculated using an established valuation technique. These valuation tech-niques involve a degree of estimation, the extent of which depends on theinstrument’s complexity and the availability of market-based data. When valu-ing financial liabilities at fair value own credit standing is reflected. Given theuncertainty and subjective nature of valuing financial instruments at fair value,it is possible that the outcomes in the next financial year could differ from theassumptions used.
For some of the group’s financial assets and liabilities, especially for certainderivatives, quoted prices are not available, and valuation models are used toestimate fair value. As part of the fair value measurement, valuation adjust-ments are made when valuing derivative financial instruments, to incorporatecounterparty and own credit risk. The methodologies for estimating valuationadjustments are continuously revised as a result of changing market practicesin response to regulatory and accounting policy changes, as well as generalmarket developments.
The group has an established control environment for the determination of fairvalues of financial instruments that includes a review, independently from thebusiness, of valuation models and prices. If the validation principles are notadhered to, the Head of Group Finance shall be informed. Exceptions withmaterial and principal importance require approval from the Valuation Commit-tee and the SEB ARC (Accounting Policy and Financial Reporting Committee).For disclosure purposes, fair values are classified in a fair value hierarchyaccording to the level of observability of the inputs, see note 37.
IMPAIRMENT TESTING OF FINANCIAL ASSETS ANDGOODWILLFinancial assets – impairment under IFRS 9 expected credit loss modelWhen calculating expected credit loss (ECL) there are a number of key con-cepts that require a high level of judgement. Estimating expected credit loss is,by its very nature, uncertain and the accuracy of these estimates depends onmany factors, e.g. macro-economic forecasts and involves complex modellingand judgements.
The assessment of significant increase in credit risk is a new concept underIFRS 9 Financial Instruments and will require significant judgement. At the endof each reporting period the group shall perform an assessment of whethercredit risk has increased significantly since initial recognition by consideringthe change in the risk of default occurring over the remaining life of the finan-cial instrument, using key risk indicators that are used in the group’s existingrisk management processes.
Another area requiring significant judgement is the incorporation of forward-looking information and macro-economic scenarios. IFRS 9 requires an unbi-ased and probability-weighted estimate of credit losses by evaluating a rangeof possible outcomes that incorporates forecasts of future economic condi-tions. SEB uses internally developed macro-economic forecasts as the basis forthe forward-looking information in the ECL measurement. SEB uses both mod-els and expert credit judgement (ECJ) in order to determine ECLs. The objectiveof applying ECJ is to incorporate the estimated impact of factors not capturedin the modelled ECL. The degree of judgement that is required to estimateexpected credit losses depends on the outcome from calculations, materialityand the availability of detailed information. The models, assessment andassumptions are regularly reviewed by the risk organisation of the group andapproved by the Group Risk Committee.
Financial assets – impairment under IAS 39When calculating loan impairment allowances on both individually assessedand collectively assessed loans critical judgements and estimates are applied.Assessing financial assets individually for impairment requires judgement toestablish the counterparty’s repayment capacity and the realisable value ofany collateral. The most important aspect when testing a group of financialassets collectively for impairment is to identify the events that indicateincurred losses. In assessing collective impairment the group uses statisticalmodels based on the probability of default and the amount of loss incurred,considering collaterals and recovery rates. The outcome is adjusted for man-agement’s judgement as to whether current economic and credit conditions aresuch that the actual losses are likely to be greater or less than suggested by themodels. Default rates and loss rates are regularly benchmarked against actualoutcomes to ensure that they remain appropriate.
Adjusting models for collective impairment testing to current market situa-tion also require a high degree of expert judgement to ensure a reliable esti-mate. The assessment and assumptions are regularly reviewed by the creditorganisation of the group.
GoodwillJudgement is involved in determining the cash-generating units. The annualimpairment test of goodwill is based on the value in use with forecasted cashflows for five years. The cash flows beyond five years are determined based onsustainable growth.
The estimation of future cash flows and the calculation of the rate used todiscount those cash flows involves a number of judgmental areas: the prepara-tion of cash flow forecasts for periods that are beyond the normal requirementsof management reporting and the assessment of the discount rate appropriateto the business.Note 23 describes tangible and intangible assets in more detail.
CALCULATIONOF INSURANCE LIABILITIESCalculation of the group’s insurance liabilities is based on a number of esti-mates and assumptions, both financial and actuarial, such as interest rates,mortality, health, expenses, inflation and taxes. One of the important financialassumptions is the interest rate used for discounting future cash flows.
Assumption on interest rates is based on regulations from each local Finan-cial Supervisory Authority (FSA). All other assumptions are based on internallyacquired experience.

Financial statements Notes
SEB Annual Report 201894
ASSETS RECOGNISED FROM THE COSTS TO OBTAIN OR FULFILA CONTRACT, DEFERRED ACQUISITION COSTSSEB recognise as an asset, costs to obtain contracts that would not haveincurred if the contract had not been obtained, mainly sales commissions toobtain insurance and investment contracts.
The amortisation period for the asset is based on assumptions about aver-age lifetime of the contracts including assumptions about surrenders andlapses.
FAIR VALUE OF INVESTMENT PROPERTYInvestment properties in the insurance operations are fair valued with theassistance of external expertise. The valuation method applied means that therelated expected cash flows are discounted to present value. The assumptionsconcerning expected cash flows are based on assumptions on future rents,vacancy levels, operating and maintenance costs, yield requirement and mar-ket interest. Assumptions are in line with the assessments that the market canbe expected to make under current market conditions. The yield requirementis based on local analysis of comparable property purchases.
VALUATION OF DEFERRED TAX ASSETSDeferred tax assets that are relying on future profitability can be recognisedonly to the extent they can be offset against future taxable income and the val-uation of deferred tax assets is influenced by management’s assessment ofSEB’s future profitability, future taxable profits and future reversals of existingtaxable temporary differences. The expected outcome of uncertain tax posi-tions is determined as the single most likely outcome.
PROVISIONSJudgement is involved in determining whether a present obligation exists, andin estimating the probability, timing and amount of any outflows. Provisions forclaims in civil lawsuits and regulatory matters typically require a higher degreeof judgement than other types of provisions.
ACTUARIAL CALCULATIONS OF DEFINED BENEFIT PLANSThe calculation of the group’s expense and obligations for defined benefitplans is based on actuarial, demographic and financial assumptions that havea significant impact on the recognised amounts. One of the important financialassumptions is the interest rate used for discounting future cash flows. Theestimation of the discount rate is subject to uncertainty whether corporatebond markets are deep enough, of high quality and also in connection to theextrapolation of yield curves to relevant maturities. The discount rate is basedon high quality corporate bonds in a deep market, in Sweden covered bonds.The covered bonds in Sweden are at least AAA-rated and the maturity is in linewith the estimated maturity of obligations for post-employment benefits. Thediscount rate for the defined benefit obligation is revised quarterly and otherassumptions are revised each year or when a significant change has occurred.Note 8b describing staff costs contain a list of the most critical assumptionsused when calculating the defined benefit obligation.

Notes Financial statements
SEB Annual Report 2018 95
2 Operating segmentsGroup business segments
Income statement, 2018
Large Corporates& FinancialInstitutions
Corporate& Private
Customers Baltic
Life &Investment
Management Other1) Eliminations Total
Interest income 19,620 12,447 3,049 –5 16,874 –12,685 39,299Interest expense –11,409 –2,974 –211 –49 –16,339 12,705 –18,277
Net interest income 8,211 9,473 2,837 –54 535 20 21,022Fee and commission income 10,956 7,182 2,091 8,635 172 –5,017 24,018Fee and commission expense –4,523 –1,712 –642 –3,717 –60 5,000 –5,654
Net fee and commission income 6,433 5,470 1,449 4,918 111 –17 18,364Net financial income 3,384 429 257 955 1,043 12 6,079Net other income 309 47 –21 –6 88 –14 402
Total operating income 18,337 15,418 4,522 5,813 1,777 1 45,868of which internally generated –1,765 –140 151 –2,303 4,056 1
Staff costs –3,858 –3,353 –811 –1,391 –4,608 18 –14,004Other expenses –4,990 –3,735 –1,021 –1,012 3,576 –19 –7,201Depreciation, amortisation and impairmentof tangible and intangible assets –55 –58 –53 –25 –544 –735
Total operating expenses –8,903 –7,146 –1,885 –2,429 –1,576 –1 –21,940
Gains less losses on disposals of tangible andintangible assets 1 19 –2 18Net expected credit losses –702 –427 –55 –2 25 –5 –1,166
Operating profit before itemsaffecting comparability 8,733 7,845 2,600 3,382 224 –5 22,779
Items affecting comparability 4,506 4,506
OPERATINGPROFIT 8,733 7,845 2,600 3,382 4,730 –5 27,285
Business equity, SEK bn 63.8 42.4 9.6 8.0Return on business equity, % 10.3 13.9 22.4 36.3Risk exposure amount, SEK bn 360 220 82 4 50 716Lending to the public2), SEK bn 600 781 148 18 1,547Deposits from the public2), SEK bn 473 421 138 76 1,108
20173)
Interest income 14,066 11,794 2,616 –3 14,491 –6,492 36,472Interest expense –6,022 –2,352 –243 –87 –14,415 6,540 –16,580
Net interest income 8,043 9,442 2,373 –90 76 48 19,893Fee and commission income 11,366 7,565 1,852 8,708 135 –6,430 23,196Fee and commission expense –5,130 –1,887 –532 –4,237 –108 6,376 –5,519
Net fee and commission income 6,236 5,678 1,320 4,471 27 –54 17,677Net financial income 3,465 441 231 1,674 1,008 60 6,880Net other income 573 87 –10 17 448 –4 1,112
Total operating income 18,318 15,648 3,914 6,072 1,558 51 45,561of which internally generated –1,773 2,742 53 –2,386 1,312 51
Staff costs –3,862 –3,298 –724 –1,561 –4,616 35 –14,025Other expenses –5,046 –3,872 –965 –963 3,984 –85 –6,947Depreciation, amortisation and impairmentof tangible and intangible assets –59 –57 –78 –37 –734 –964
Total operating expenses –8,967 –7,226 –1,766 –2,561 –1,365 –51 –21,936
Gains less losses on disposals of tangible andintangible assets 1 –164 1 –162Net credit losses –529 –276 –7 4 –808
Operatingprofit before itemsaffecting comparability 8,823 8,146 1,977 3,511 198 22,655
Items affecting comparability –1,896 –1,896
OPERATINGPROFIT 8,823 8,146 1,977 3,511 –1,698 20,759
Business equity, SEK bn 65.8 40.6 8.0 8.4Return on business equity, % 10.1 15.0 21.9 35.8Risk exposure amount, SEK bn 376 120 74 4 37 611Lending to the public2), SEK bn 551 744 129 6 1,430Deposits from the public2), SEK bn 416 384 114 86 999
1) Profit and loss from associated companies accounted for under the equity method are recognised in Net other income at an amount of SEK –9m (13).The aggregated investments are SEK 295m (334).
2) Excluding repos.3) The 2017 income statement has been restated for the transition to IFRS 15. For transition disclosures, see note 53.

Financial statements Notes
SEB Annual Report 201896
Note 2 continued Operating segments
Balance sheet
2018
Large Corporates& FinancialInstitutions
Corporate& Private
Customers Baltic
Life &Investment
Management Other Eliminations Total
Assets 1,407,180 857,821 176,175 313,838 2,439,209 –2,626,706 2,567,516Liabilities 1,330,962 806,043 164,108 305,100 2,439,233 –2,626,706 2,418,727Investments 71 51 161 353 739 1,376
2017
Assets 1,175,651 829,749 160,683 512,102 1,134,625 –1,255,900 2,556,908Liabilities 1,098,360 779,589 150,880 500,695 1,142,048 –1,255,900 2,415,671Investments 164 151 121 1,942 1,186 3,563
Parent company business segments
2018
Large Corporates& FinancialInstitutions
Corporate& Private
Customers Baltic
Life &Investment
Management Other Eliminations Total
Gross income 28,440 14,673 6 67 28,805 71,991Assets 1,306,705 774,421 51 455 1,430,837 –1,434,195 2,078,275Investments 66 47 751 865
2017
Gross income 26,664 15,544 22 295 20,795 –584 62,736Assets 964,428 753,406 169 252 896,077 –722,169 1,892,163Investments 162 145 1,176 1,483
Business segmentThe Business segments are presented on a management reporting basis.The different divisions assist different groups of customers. The customers’demands decide the type of products that are offered. Large Corporates &Financial Institutions offers wholesale and investment banking services tolarge corporations and institutions. Corporate & Private Customers offers prod-ucts and private banking services mainly to retail customers (private custom-
ers and small and medium-sized corporates). Division Baltic offers productsmainly to retail customers (private customers and small and medium-sized cor-porates) and private banking services in the Baltic countries. Life & InvestmentManagement performs asset management and offers life, sickness, healthcareand pension insurance. Other consists of business support units, treasury andstaff units. Eliminations of internal transactions between the business seg-ments are reported separately.
Gross income by product for external customersGroup Parent company
2018 2017 2018 2017
Core banking 38,699 35,672 28,212 24,191Capital market 11,665 12,477 10,844 11,283Asset management 8,681 8,483 2,227 2,279Life insurance and pension 2,832 3,445Other 7,921 7,583 30,709 24,983
TOTAL 69,799 67,660 71,991 62,736
Core banking consists of loan, leasing, card and payment related products. Cap-ital market consists of trading and issues on financial markets. Asset manage-ment consists of advisory, custody and fund management. Life insurance and
pension consists of unit-linked and traditional life insurance products. Otherconsists of income from treasury operations and other activities.

Notes Financial statements
SEB Annual Report 2018 97
3 Geographical informationGroup by country
2018 20177)
GrossIncome1)
Operatingprofit2)
Income taxexpense3) Assets Investments
GrossIncome1)
Operatingprofit2)
Income taxexpense3) Assets Investments
Sweden 46,119 17,533 –1,882 2,197,181 930 43,466 12,288 –2,703 2,043,346 2,103Norway 7,453 2,105 –502 117,872 24 5,206 1,859 –433 102,138 94Denmark 3,724 1,450 –306 168,226 3,775 1,918 –359 302,548 991Finland 2,333 1,118 –209 69,612 13 2,313 1,171 –224 89,619 72Estonia4) 1,900 1,035 –349 62,327 60 1,658 927 –72 54,815 64Latvia 1,299 461 38,532 52 1,207 368 –79 36,283 18Lithuania 2,522 1,328 –191 81,194 90 2,134 1,014 –155 75,218 68Germany5) 2,881 599 –329 98,244 5 3,482 –923 –120 162,745United Kingdom 1,802 555 –138 84,817 7 1,962 1,076 –225 68,997 5United States6) 6,461 142 –16 192,876 4,508 191 –31 146,661Ireland 561 155 –20 68,698 176 588 181 2 70,730 139Luxembourg 1,539 531 –101 41,291 3 1,484 385 –65 53,155 5Singapore 755 17 –17 30,424 10 679 66 –16 24,619 1China 646 139 –53 25,537 631 162 –50 24,097Russia 464 36 –16 6,666 4 370 28 –16 5,300 2Poland 168 55 –16 5,398 2 156 15 –14 8,224 2Hong Kong 184 40 3,770 144 29 2,199Ukraine 67 16 –5 600 1 54 3 –2 498Netherlands –14 –14 11Group eliminations –11,066 –18 –725,758 1 –6,155 –714,287
TOTAL 69,799 27,285 –4,152 2,567,516 1,376 67,660 20,759 –4,562 2,556,908 3,563
1) Gross income in the group is defined as the sum of Interest income, Fee and commission income, Net financial income and Net other income according to IFRS. The basis for the incomeallocation is SEB’s presence in each country, with the exception of when the local companies / branches serve as sales offices and receive commission payments and the transaction isbooked in the central unit.
2) Before tax.3) For more information about tax see note 15.4) Until and including 2017, no income tax is paid in Estonia unless profit is distributed as dividend.5) Restated to included Treasury activities 2017.6) Including Cayman Islands, where the parent company is represented by a branch office which is a United States tax resident entity, why tax expense related to Cayman income is
reported in US.7) 2017 has been restated for the transition to IFRS 15. For transition disclosures, see note 53.
Parent company by country2018 2017
Gross Income1) Assets Investments Gross Income1) Assets Investments
Sweden 54,650 1,729,789 814 49,760 1,661,054 1,297Norway 3,558 63,783 24 3,090 56,656 94Denmark 1,954 99,081 1,920 67,499 3Finland 1,550 42,899 11 1,278 5,927 71Other countries 10,279 142,723 16 6,688 101,027 18
TOTAL 71,991 2,078,275 865 62,736 1,892,163 1,483
1) Gross income in the parent company is defined as the sum of Interest income, Leasing income, Dividends, Fee and commission income, Net Financial income and Other income accord-ing to SFSA accounting regulations. The basis for the income allocation is SEB’s presence in each country, with the exception of when the local companies / branches serve as salesoffices and receive commission payments and the transaction is booked in the central unit.
Transfer pricingThe internal transfer pricing objective in the SEB Group is to measure net inter-est income, to transfer interest rate risk and liquidity and to manage liquidity.
The internal price is based on SEB’s actual or implied market-based cost offunds for a specific interest and liquidity term. Transactions between Businesssegments are conducted at arm’s length.

Financial statements Notes
SEB Annual Report 201898
4 Net interest incomeGroup Parent company
2018Averagebalance Interest Interest rate
Averagebalance Interest Interest rate
Loans to credit institutions and central banks 363,075 2,822 0.78% 409,394 2,568 0.63%Loans to the public 1,516,485 29,790 1.96% 1,302,034 24,062 1.85%Debt securities 19,164 294 1.54% 18,020 326 1.81%
Total interest earning assetsAmC 1,898,724 32,907 1.73% 1,729,447 26,956 1.56%
Debt securities 179,560 2,680 1.49% 154,391 2,529 1.64%Loans 100,609 –551 –0.55% 100,702 –552 –0.55%
Total interest earning assets at FVTPL 280,169 2,128 0.76% 255,093 1,976 0.77%
Total interest earning assets 2,178,894 35,035 1.61% 1,984,540 28,932 1.46%Derivatives and other assets 637,597 4,264 317,683 8,804
TOTALASSETS 2,816,491 39,299 2,302,224 37,737
Deposits from credit institutions 135,823 –1,253 –0.92% 186,993 –1,647 –0.88%Deposits and borrowing from the public 1,156,434 –5,414 –0.47% 985,460 –4,245 –0.43%Debt securities issued 682,160 –10,714 –1.57% 679,711 –10,714 –1.58%Subordinated liabilities 34,025 –1,220 –3.59% 34,025 –1,220 –3.59%
Total interest bearing liabilitiesAmC 2,008,442 –18,602 –0.93% 1,886,190 –17,826 –0.95%
Deposits 31,221 132 0.42% 23,307 490 2.10%Debt securities short position 24,195 –721 –2.98% 24,195 –721 –2.98%Debt securities issued 23,533 –830 –3.53% 21,509 –829 –3.86%
Total interest bearing liabilities at FVTPL 78,949 –1,419 –1.80% 69,011 –1,060 –1.54%
Total interest bearing liabilities 2,087,392 –20,020 –0.96% 1,955,201 –18,886 –0.97%
Derivatives and other liabilities 587,357 1,743 246,390 –2,646Equity 141,742 100,631
TOTAL LIABILITIESANDEQUITY 2,816,491 –18,277 2,302,223 –21,532
NET INTEREST INCOME 21,022 16,205
NETYIELDON INTERESTEARNINGASSETS 0.96% 0.82%
2017
Loans to credit institutions and central banks 418,221 2,198 0.53% 582,286 1,994 –0.34%Loans to the public 1,508,963 26,734 1.77% 1,168,445 20,156 –1.73%Debt securities 14,828 236 1.59% 26,951 –6 0.02%
Total interest earning assets LaR 1,942,013 29,167 1.50% 1,777,682 22,144 –1.25%
Debt securities 183,436 1,648 0.90% 153,404 1,702 –1.11%
Total interest earning assets at fair value 183,436 1,648 0.90% 153,404 1,702 –1.11%
Total interest earning assets 2,125,449 30,815 1.45% 1,931,086 23,846 –1.23%Derivatives and other assets 725,599 5,657 311,886 8,439
TOTALASSETS 2,851,049 36,472 2,242,972 32,285
Deposits from credit institutions 156,027 –686 –0.44% 222,199 –1,028 –0.46%Deposits and borrowing from the public 1,162,946 –4,450 –0.38% 929,878 –2,493 –0.27%Debt securities issued 668,670 –9,838 –1.47% 623,874 –9,907 –1.59%Subordinated liabilities 42,708 –1,646 –3.85% 41,628 –1,646 –3.95%
Total interest bearing liabilitiesAmC 2,030,351 –16,620 –0.82% 1,817,579 –15,074 –0.83%
Debt securities short position 26,719 –96 –0.36% 26,441 –96 –0.36%Debt securities issued 28,606 –660 –2.31% 26,357 –610 –2.31%
Total interest bearing liabilities at fair value 55,325 –756 –1.37% 52,798 –706 –1.34%
Total interest bearing liabilities 2,085,676 –17,376 –0.83% 1,870,377 –15,780 –0.84%
Derivatives and other liabilities 624,345 796 273,473 –1,970Equity 141,028 99,122
TOTAL LIABILITIESANDEQUITY 2,851,049 –16,580 2,242,972 –17,750
NET INTEREST INCOME 19,893 14,535
NETYIELDON INTERESTEARNINGASSETS 0.94% 0.75%
Net interest incomeParent company
2018 2017
Interest income 37,737 32,285Income from leases 1) 5,656 5,481Interest expense –21,532 –17,750Depreciation of leased equipment 1) –4,985 –4,817
TOTAL 16,877 15,200
1) In the group Net income from leases is classified as interest income. In the parent company depreciation of leased equipment is reported as Depreciation, amortisation and impairmentof tangible and intangible assets.

Notes Financial statements
SEB Annual Report 2018 99
5 Net fee and commission incomeGroup Parent company
2018 20171) 2018 2017
Issue of securities 451 724 745 1,035Secondary market 1,758 2,125 1,342 1,436Custody and mutual funds 8,082 8,040 3,654 3,690
Securities commissions 10,291 10,890 5,742 6,161
Payments 1,968 1,850 1,667 1,512Card fees 3,986 3,610 545 505
Payment commissions 5,955 5,460 2,212 2,017
Life insurance commissions 1,848 1,707
Advisory 599 443 585 393Lending 2,527 2,254 2,413 1,889Deposits 293 276 61 71Guarantees 598 541 573 380Derivatives 421 439 501 400Other 1,486 1,186 1,194 843
Other commissions 5,924 5,140 5,328 3,975
Feeand commission income 24,018 23,196 13,281 12,153
Securities commissions –2,071 –2,001 –1,446 –1,217Payment commissions –2,104 –2,006 –838 –619Life insurance commissions –565 –646Other commissions –914 –866 –934 –760
Feeand commission expense –5,654 –5,519 –3,218 –2,596
Securities commissions, net 8,220 8,889 4,296 4,944Payment commissions, net 3,851 3,454 1,375 1,398Life insurance commissions, net 1,283 1,061Other commissions, net 5,010 4,273 4,393 3,215
TOTAL 18,364 17,677 10,064 9,557
1) 2017 has been restated for the transition to IFRS 15. For transition disclosures, see note 53.
Fee and commission income by division
Group, 2018
Large Corpo-rates & Financial
Institutions
Corporate &Private
Customers BalticLife & Investment
ManagementOther1) &
eliminations Total
Issue of securities and advisory 996 35 17 2 1,050Secondary market and derivatives 1,694 465 22 4 –5 2,179Custody and mutual funds 3,519 1,700 192 6,223 –3,551 8,082Payments, cards, lending, deposits, guarantees and other 4,747 4,982 1,861 426 –1,158 10,858Life insurance commissions 1,982 –134 1,848
TOTAL 10,956 7,182 2,091 8,635 –4,846 24,018
2017
Issue of securities and advisory 1,118 34 14 2 1,167Secondary market and derivatives 1,920 803 24 6 –189 2,565Custody and mutual funds 4,112 2,102 177 5,931 –4,282 8,040Payments, cards, lending, deposits, guarantees and other 4,216 4,625 1,637 604 –1,366 9,717Life insurance commissions 2,167 –460 1,707
TOTAL 11,366 7,565 1,852 8,708 –6,295 23,196
1) Other consists of business support units, treasury and staff units and German run-off operations.
Fee and commission income is disaggregated in major types of service tied toprimary geographical markets and operating segments.
Revenue from Issue of securities, Advisory, Secondary market, Derivatives,
Payments, cards, lending and deposits are mainly recognised at a point in time.Revenue from Custody, Mutual funds and Life insurance commissions aremainly recognised over time.

Financial statements Notes
SEB Annual Report 2018100
6 Net financial incomeGroup Parent company
2018 2017 2018 2017
Equity instruments and related derivatives 637 1,400 398 1,333Debt instruments and related derivatives 636 –369 1,408 –429Currency and related derivatives 3,580 4,023 3,209 3,512Other life insurance income, net 984 1,738Other 242 88 –441 78
TOTAL 6,079 6,880 4,574 4,493
Gains (losses) on financial assets and liabilities held for trading are presentedon different rows based on type of underlying financial instrument. Changes inthe treasury result are due to changes in interest rates and credit spreads. Thenet effect from trading operations is fairly stable over time, but shows volatility
between rows. There were effects from structured products offered to thepublic in the amounts of approximately SEK 1,340m (975) in equity relatedderivatives and a corresponding effect in debt securities of SEK –640m (–505).
Group Parent company
2018 2017 2018 2017
Derivatives – counterparty risk –147 420 –173 429Derivatives – own credit standing 27 –180 46 –141Issued securities designated at fair value through profit or loss – own credit standing1) –31 –57
TOTAL –119 210 –127 231
1) Own credit standing from own issued securities is as of January 1st 2018 presented in Other comprehensive income. Valuation changes arising from own credit standing amounted toSEK –31m for the group and SEK –57m for the parent bank in 2017.
Group, 20181) FVHFT FVMPL FVDPL
Otherlife insurance
income, net Total
Equity instruments and related derivatives 100 537 637Debt instruments and related derivatives –1,233 –184 2,054 636Currency and related derivatives 3,580 3,580Other life insurance income, net 984 984Other 242 242
TOTAL 2,688 352 2,054 984 6,079
Group, 20172) HFT FVO AFS
Otherlife insurance
income, net Total
Equity instruments and related derivatives 1,388 22 –10 1,400Debt instruments and related derivatives 740 –1,109 –369Currency and related derivatives 4,024 4,024Other life insurance income, net 1,738 1,738Other 88 88
TOTAL 6,239 –1,087 –10 1,738 6,880
1) IFRS 92) IAS 39
Parent company, 20181) FVHFT FVMPL FVDPL Total
Equity instruments and related derivatives 106 292 398Debt instruments and related derivatives –525 –60 1,994 1,408Currency and related derivatives 3,209 3,209Other –441 –441
TOTAL 2,348 232 1,994 4,574
Parent company, 20172) HFT FVO Total
Equity instruments and related derivatives 1,333 1,333Debt instruments and related derivatives 640 –1,069 –429Currency and related derivatives 3,512 3,512Other 78 78
TOTAL 5,563 –1,069 4,493
1) IFRS 92) IAS 39

Notes Financial statements
SEB Annual Report 2018 101
7 Net other incomeGroup Parent company
2018 2017 2018 2017
Dividends1) 73 77
Investments in associates 152 –38Gains less losses from investment securities –275 203 1,175 624Gains less losses from tangible assets2) 20 27Gains less losses from divestment of shares in subsidiaries 31Other income 421 870 576 691
TOTAL 402 1,112 1,770 1,342
1) Reported separately in the Income Statement for parent company.2) See note 11 for the group.
Dividends
Equity instruments 73 77 217 51Investments in associates 9 514Dividends from subsidiaries 8,904 6,416
TOTAL 73 77 9,130 6,981
Gains less losses from investment securities
Equity instruments 119 722 8 614Debt securities 90Buy back liabilities2) 2 1,167 10
Gains 121 812 1,175 624
Equity instruments –87 –93Debt securities –7Loans1) –157 –508Buy back liabilities2) –121
Losses –365 –609
TOTAL –244 203 1,175 624
1) Loans at amortised cost (AmC) are realised as preparation activities related to the wind down of DSK Hyp AG (former SEB AG).2) Liabilities at amortised cost (AmC) are realised as preparation activities related to the wind down of DSK Hyp AG (former SEB AG) and active liability management.
Other income
Fair value adjustment in hedge accounting 33 205 –63 792Operating result from non-life insurance, run off 210 283Other income 178 382 638 –102
TOTAL 421 870 576 691
Fair value adjustment in hedge accounting
Fair value changes of the hedged items attributable to the hedged risk 125 3,751 126 3,757Fair value changes of the hedging derivatives –167 –3,721 –168 –2,936Amortisation of discontinued hedge items –21 188
Fair value hedges –63 218 –42 822
Fair value changes of the hedging derivatives –13 –10 –13 –10
Cash-flowhedges– ineffectiveness –13 –10 –13 –10
Fair value changes of the hedged items 5 –26 5 –52Fair value changes of the hedging derivatives –12 –79 –12 33Amortisation of discontinued hedge items 116 102
Fair valueportfolio hedgeof interest rate risk– ineffectiveness 109 –3 –7 –20
TOTAL 33 205 –63 792

Financial statements Notes
SEB Annual Report 2018102
8 Staff costsGroup Parent company
2018 2017 2018 2017
Base salary –8,200 –8,073 –5,868 –5,431Cash-based variable remuneration –635 –666 –487 –428Long-term equity-based remuneration –596 –616 –455 –462
Salaries andother compensations –9,432 –9,355 –6,810 –6,321
Social charges –2,553 –2,543 –1,886 –1,861Defined benefit retirement plans 1) –395 –472 4Defined contribution retirement plans 1) –867 –881 –644 –643Benefits and redundancies 2) –282 –271 –207 –169Education and other staff related costs –474 –502 –348 –340
TOTAL –14,004 –14,025 –9,891 –9,335
1) Pension costs in the group are accounted for according to IAS 19 Employee benefits. Pension costs in Skandinaviska Enskilda Banken are calculated in accordance with the Act onSafeguarding Pensions Obligations and the Swedish Financial Supervisory Authority’s regulations. Non-recurring costs of SEK 95m (196m) for early retirement have been chargedto the pension funds of the bank.
2) Includes costs for redundancies of SEK 201m (179) for the group and SEK 160m (126) for the parent company.
8a RemunerationPresented in note 8a is the statement of remuneration for the Consolidatedsituation and significant units within the group according to Regulation on pru-dential requirements for credit institutions and investment firms. In the SEB
Group 974 (989) positions are defined as Identified Staff. SEB has chosen toinclude the remuneration also in the insurance operations that are not part ofthe Financial group of undertakings but part of the SEB Group.
Remuneration by divisionGroup Parent company
Fixed1) Variable1) Fixed1) Variable1)
2018 Remuneration FTEs Remuneration FTEs Remuneration FTEs Remuneration FTEs
Large Corporates & Financial Institutions –2,521 1,986 –580 1,919 –2,251 1,895 –571 1,828Corporate & Private Customers –2,394 3,596 –196 3,588 –1,564 2,904 –156 2,895Baltic –541 2,377 –69 2,377Life & Investment Management –994 1,328 –101 1,322Other2) –3,294 5,465 –285 5,366 –2,905 4,271 –215 4,172
TOTAL –9,745 14,751 –1,231 14,570 –6,720 9,071 –942 8,896whereof collective variable pay3) –487 14,570
2017
Large Corporates & Financial Institutions –2,511 2,049 –613 1,979 –1,994 1,707 –565 1,637Corporate & Private Customers –2,375 3,531 –153 3,521 –1,654 2,818 –121 2,808Baltic –481 2,431 –61 2,431Life & Investment Management –1,120 1,478 –103 1,458Other2) –4,532 5,457 –352 5,432 –2,595 4,182 –204 4,084
TOTAL –11,019 14,946 –1,282 14,821 –6,243 8,707 –890 8,529whereof collective variable pay3) –546 14,821

Notes Financial statements
SEB Annual Report 2018 103
Note 8 a continued Remuneration
SEB Pank AS, Estonia SEB Banka AS, Latvia
Fixed1) Variable1) Fixed1) Variable1)
2018 Remuneration FTEs Remuneration FTEs Remuneration FTEs Remuneration FTEs
Baltic –165 706 –20 706 –163 621 –16 621Other4) –96 312 –16 312 –72 229 –6 229
TOTAL –261 1,018 –36 1,018 –235 850 –21 850
2017
Baltic –150 725 –20 725 –123 640 –16 640Other4) –88 316 –11 316 –56 246 –6 246
TOTAL –238 1,041 –31 1,041 –179 886 –22 886
SEB bankas AB, Lithuania
Fixed1) Variable1)
2018 Remuneration FTEs Remuneration FTEs
Baltic –216 1,020 –28 1,020Other4) –97 384 –9 384
TOTAL –313 1,404 –38 1,404
2017
Baltic –186 1,024 –24 1,024Other4) –89 373 –8 373
TOTAL –275 1,397 –32 1,397
1) Variable pay is defined as short-term cash-based remuneration and long-term equity-based remuneration. All other remuneration is reported as fixed remuneration and includes:base pay, pensions, severance pay, fees and benefits such as e.g. company car and domestic services, in accordance with FFFS 2011:1. The reported remuneration does notinclude social charges.
2) Including Life & Investment Management and Baltic in the parent company.3) Collective short-term and long-term remuneration. Collective short-term and long-term remuneration compared to expected outcome is reported in Other.4) Including Life & Investment Management in Baltic countries. In Lithuania also Large Corporates & Financial Institutions are included.
DSK Hyp AG (former SEB AG), Germany is no longer considered a significant subsidiary, as most of its business was transferred to Skandinaviska Enskilda Banken AB Frankfurtbranch 1 January 2018.
Remuneration by categoryGroup Parent company
2018
Remuneration FTEs Remuneration FTEs
IdentifiedStaff6)
Otheremployees Total
IdentifiedStaff6)
Otheremployees Total
IdentifiedStaff6)
Otheremployees Total
IdentifiedStaff6)
Otheremployees Total
Fixed remuneration1) –1,161 –8,584 –9,745 908 13,843 14,751 –632 –6,087 –6,720 537 8,534 9,071Variable pay1) –342 –889 –1,231 571 13,999 14,570 –173 –768 –942 336 8,560 8,896whereof:
Short-term cash-based –146 –489 –635 –65 –422 –487Long-term equity-based2) –195 –400 –596 –108 –347 –455
Deferred variable pay3) –232 –364 –596 –124 –331 –455Accrued and paidremuneration4) –1,532 –9,444 –10,976 –816 –6,845 –7,661Severance pay5) –209 491 –166 237Agreed not yet paidseverance pay –301 284 –274 218Highest single amount –8 –8
2017
Fixed remuneration1) –1,140 –9,879 –11,019 989 13,957 14,946 –617 –5,626 –6,243 585 8,122 8,707Variable pay1) –334 –948 –1,282 554 14,267 14,821 –166 –724 –890 311 8,218 8,529whereof:
Short-term cash-based –142 –524 –666 –64 –364 –428Long-term equity-based2) –192 –424 –616 –102 –360 –462
Deferred variable pay3) –218 –398 –616 –114 –348 –462Accrued and paidremuneration4) –1,490 –9,936 –11,426 –785 –6,350 –7,135Severance pay5) –622 547 –140 191Agreed not yet paidseverance pay –609 362 –147 170Highest single amount –2 –2

Financial statements Notes
SEB Annual Report 2018104
Note 8 a continued Remuneration
SEB Pank AS, Estonia SEB Banka AS, Latvia
Remuneration FTEs Remuneration FTEs
2018Identified
Staff 6)Other
employees TotalIdentified
Staff 6)Other
employees TotalIdentified
Staff 6)Other
employees TotalIdentified
Staff 6)Other
employees Total
Fixed remuneration1) –15 –246 –261 21 997 1,018 –11 –224 –235 16 834 850Variable pay1) –2 –34 –36 9 1,009 1,018 –1 –20 –21 11 839 850whereof:
Short-term cash-based –17 –17 –9 –9Long-term equity-based2) –2 –17 –19 –1 –11 –13
Deferred variable pay3) –2 –14 –16 –1 –12 –13Accrued and paidremuneration4) –18 –279 –297 –12 –245 –257Severance pay5) –2 19 –9 86
2017
Fixed remuneration1) –11 –227 –238 16 1,025 1,041 –8 –171 –179 15 871 886Variable pay1) –2 –29 –31 6 1,035 1,041 –1 –21 –22 9 877 886whereof:
Short-term cash-based –15 –15 –9 –9Long-term equity-based2) –2 –14 –16 –1 –12 –13
Deferred variable pay3) –2 –14 –16 –1 –12 –13Accrued and paidremuneration4) –13 –256 –269 –9 –192 –201Severance pay5) –1 20 –4 72
SEB bankas AB, Lithuania
2018
Remuneration FTEs
IdentifiedStaff 6)
Otheremployees Total
IdentifiedStaff 6)
Otheremployees Total
Fixed remuneration1) –20 –293 –313 22 1,382 1,404Variable pay1) –3 –35 –38 5 1,399 1,404whereof:
Short-term cash-based –15 –15Long-term equity-based 2) –3 –20 –23
Deferred variable pay3) –3 –20 –23Accrued and paidremuneration 4) –23 –328 –351Severance pay5) –12 78
2017
Fixed remuneration1) –14 –261 –275 13 1,384 1,397Variable pay1) –3 –29 –32 4 1,393 1,397whereof:
Short-term cash-based –13 –13Long-term equity-based 2) –3 –16 –19
Deferred variable pay3) –3 –16 –19Accrued and paidremuneration 4) –17 –290 –307Severance pay5) –8 58
1) Variable pay is defined as short-term cash-based remuneration and long-term equity-based remuneration. All other remuneration is reported as fixed remuneration and includes:base pay, pensions, severance pay, fees and benefits such as e.g. company car and domestic services, in accordance with FFFS 2011:1. The reported remuneration does not includesocial charges.
2) Long-term equity based remuneration encompasses three different programmes; All Employee Programme, Share Deferral Programme and Restricted Share Programme for aselected group of key employees.
3) The deferred variable pay is locked the first year. Short-term cash-based remuneration can thereafter be paid pro rata over three or five years after a possible risk adjustment.Long-term equity-based programmes are locked for a minimum of three years or paid out pro rata depending on programme.
4) In Accrued and paid remuneration amounts paid within the first quarter after the accrual is included. Deferred variable pay has been subject to risk adjustment.5) The amount also includes sign-on.6) Employees with material impact on SEB’s risk profile, in accordance with FFFS 2011:1.
Loans to ExecutivesGroup Parent company
2018 2017 2018 2017
Managing Directors and Deputy Managing Directors 1) 102 113 27 27Boards of Directors 2) 342 426 126 111
TOTAL 444 539 153 138
1) Comprises current President and Deputy President in the parent company and Managing Directors and Deputy Managing Directors in subsidiaries. Total number of executiveswas 39 (47) of which 11 (14) female.
2) Comprises current Board members and their substitutes in the parent company and subsidiaries. Total number of persons was 128 (156) of which 34 (43) female.
Pension commitments to Executives
Pension disbursements made 101 112 77 45Change in commitments 32 48 15 19Commitments at year-end 1,359 1,839 825 870
The above commitments are covered by the bank’s pensions funds or throughBank-owned endowment assurance schemes. They include active and retired
Presidents and vice Presidents in the parent company and Managing directorsand Deputy Managing directors in subsidiaries, in total 91 persons (115).

Notes Financial statements
SEB Annual Report 2018 105
8b PensionsRetirement benefit obligationsThe group has established pension schemes in the countries where businessis performed. There are both defined benefit plans and defined contributionplans. The major pension schemes are final salary defined benefit plans andare funded. The defined benefit plan in Sweden is closed to new employees anda defined contribution plan was established during 2013. In Germany a majorpart was transferred from SEB in 2018. The defined contribution plans followthe local regulations in each country. Multiemployer defined benefit plans existfor employees in some parts of the group. These plans are accounted for asdefined contribution plans since sufficient information of SEB’s share of theliability/asset and cost is not available.
Defined benefit plansThe major defined benefit plans exist in Sweden and Germany and cover mostemployees in these countries. Independent actuarial calculations according tothe Projected Unit Credit Method (PUCM) are performed quarterly to decidethe value of the defined benefit obligation. The benefits covered include retire-ment benefits, disability, death and survivor pensions according to the respec-
tive countries’ collective agreements. The plan assets are kept separate in spe-cific pension foundations. In case of a deficit in the pension obligation accordingto local rules SEB is obliged to meet this with contribution to the foundation orinsure a deficit. The asset allocation is determined to meet the various risks inthe pension obligations and is decided by the board/trustees in the pensionfoundations. The assets are booked at market value. The pension and interestcosts are presented in Staff costs.
Defined contribution plansDefined contribution plans exist both in Sweden and abroad. In Sweden asmaller part of the closed collective retirement agreement is defined contribu-tion based. Over a certain salary level the employees could also choose to leavethe defined benefit plan and replace it by a defined contribution plan. The cur-rent plan for new employees is fully contribution based. Most other countrieshave defined contribution plans except for the Baltic countries where the com-pany to a limited extent contributes to the employees retirement. The definedcontribution plans are not recognised in the balance sheet but accounted for asan expense among Staff costs.
DEFINED BENEFIT PLANS IN SEB GROUP
Net amount recognised in theBalance sheet2018 2017
Sweden1) Foreign1) Group1) Sweden1) Foreign1) Group1)
Defined benefit obligation at the beginning of the year 24,372 6,448 30,820 23,287 5,794 29,081Curtailment, acquisitions and reclassification2) –5,371 –5,371 891 891Service costs 494 15 509 509 39 548Interest costs 533 47 580 556 95 651Benefits paid –772 –148 –920 –735 –321 –1,056Exchange differences 84 84 177 177Remeasurements of pension obligation 809 172 981 755 –227 528
Definedbenefit obligation at the endof the year 25,436 1,245 26,682 24,372 6,448 30,820
Fair value of plan assets at the beginning of the year 29,652 5,123 34,775 27,201 5,076 32,277Curtailment, acquisitions and reclassification2) –4,263 –4,263Calculated interest on plan assets 644 49 694 645 85 730Benefits paid/contributions –751 –751 –686 –242 –928Exchange differences –36 –36 140 140Valuation gains (losses) on plan assets –5 –54 –59 2,492 64 2,556
Fair value of plan assets at the endof the year 29,541 818 30,359 29,652 5,123 34,775
Change in the net assets or net liabilities
Defined benefit obligation at the beginning of the year 5,280 –1,325 3,955 3,914 –718 3,196Curtailment, acquisitions and reclassification 1,108 1,108 –891 –891Total expense in staff costs –383 –13 –395 –420 –49 –469Pension paid 772 148 920 735 321 1,056Benefits paid/contributions –751 –751 –686 –242 –928Exchange differences –120 –120 –37 –37Remeasurements –814 –226 –1,040 1,737 291 2,028
NETAMOUNTRECOGNISED INTHEBALANCESHEET 4,104 –427 3,677 5,280 –1,325 3,955
1) The net defined benefit obligation is recognised in the balance sheet either as an asset or liability depending on the situation for each legal entity.2) The main part of the pension obligations and plan assets under the defined benefit plan in DSK Hyp AG (former SEB AG), has been transferred to
Versicherungsverein des Bankgewerbes a.G (BVV) in 2018.
In 2018 a contribution of SEK 15m (39) was paid to the German pension foundation. Contribution to the foundations cannot be ruled out in 2019 due to uncertainty in interest rate levels.

Financial statements Notes
SEB Annual Report 2018106
Note 8 b continued Pensions
Principal actuarial assumptions used2018 2017
Sweden Foreign Sweden Foreign
Discount rate 2.0% 2.0% 2.2% 1.9%Inflation rate 1.5% 1.8% 1.5% 1.8%Expected rate of salary increase 3.5% 2.5% 3.5% 2.5%Expected rate of increase in the income basis amount 3.0% 3.0%
The discount rate is based set on high-quality corporate bonds in a deep market,in Sweden covered bonds which are at least AAA-rated. An extrapolation ofthe maturity of the covered bonds is made based on government bonds andchecked against swaps. This extrapolated maturity is in line with the estimatedmaturity of obligations for post-employment benefits. Life expectancy assump-tions in Sweden are established by the Actuarial Research Board (FTN) and arebased on DUS14 for white-collar workers. In Germany the Heubeck Sterbetafelnis used. Weighted average duration for the obligation is 23 years in Sweden and14 years in Germany.
A decrease of the discount rate for Sweden of 0.5 per cent would implyan increase of the Swedish pension obligation by SEK 2,347m while the samechange in the inflation assumption for Sweden would have the opposite effectand decrease the obligation by SEK 2,006m. An increase of the discount rate
by same ratio would reduce the obligation with SEK 2,284m and an increasedinflation rate of 0.5 per cent gives an increased obligation of SEK 2,347m. Adecrease in assumption for expected salary increase in Sweden of 0.5 per centwould have a positive effect on the obligation by SEK 258m an increase wouldhave a negative effect of SEK 320m.
The obligation in Germany would increase with SEK 83m if the discount ratewas reduced by 0.5 per cent. An increase by the same percentage would de-crease the obligation by SEK 73m. If the inflation assumption for Germany in-creases by 0.25 per cent the pension obligation would increase by SEK 13mand corresponding decrease would be SEK 12m at a lower inflation assumption.A change in expected salary increases in Germany by 0.25 per cent would witha higher rate give an increase of the obligation with SEK 29m and with a lowerrate reduce the obligation with SEK 29m.
Allocation of plan assets2018 2017
Sweden Foreign Group Sweden Foreign Group
Cash and cash equivalents 719 198 918 573 60 633Equity instruments with a quoted market price in an active market 17,470 17,470 18,357 18,357Equity instruments not listed in an active market 4,907 4,907 5,068 1,063 6,131Debt instruments with a quoted market price in an active market 620 620 400 400Debt instruments not listed in an active market 3,621 3,621 3,405 3,600 7,005Properties 2,824 2,824 2,249 2,249
TOTAL 29,541 818 30,359 29,652 5,123 34,775
The pension plan assets include SEB shares with a fair value of SEK 1,213m (1,209). Buildings in Sweden are occupied by SEB.
Amounts recognised in Income statement
2018 2017
Sweden Foreign Group Sweden Foreign Group
Service costs –494 –15 –509 –509 –39 –548Interest costs –533 –47 –580 –556 –95 –651Calculated interest on plan assets 644 49 694 645 85 730
INCLUDED INSTAFFCOSTS –383 –13 –395 –420 –49 –469
Amounts recognised in Other comprehensive income
Remeasurements of pension obligation –809 –172 –981 –755 227 –528where of experience adjustments 175 –55 119 180 112 292where of due to changes in financial assumptions –984 –116 –1,100 –935 115 –820where of due to changes in demographic assumptions
Valuation gains (losses) on plan assets –5 –54 –59 2,492 64 2,556Deferred tax pensions 208 –15 194 –382 –862 –1,244
INCLUDED INOTHERCOMPREHENSIVE INCOME –606 –240 –846 1,355 –571 784
DEFINED CONTRIBUTION PLANS IN SEB GROUP
Net amount recognised in Income statement2018 2017
Sweden Foreign Group Sweden Foreign Group
Expense in Staff costs including special salary tax –880 –238 –1,119 –943 –239 –1,182

Notes Financial statements
SEB Annual Report 2018 107
Note 8 b continued Pensions
DEFINED BENEFIT PLANS IN SKANDINAVISKA ENSKILDA BANKENParent company
Net amount recognised in theBalance sheet 2018 2017
Defined benefit obligation at the beginning of the year 24,213 23,417Imputed pensions premium 227 299Interest costs and other changes 386 1,017Early retirement 95 196Pension disbursements –751 –716
DEFINEDBENEFITOBLIGATIONATTHEENDOFTHEYEAR 24,170 24,213
Fair value of plan assets at the beginning of the year 28,621 26,249Return on assets 635 3,058Benefits paid –751 –686
FAIRVALUEOFPLANASSETSATTHEENDOFTHEYEAR 28,504 28,621
The above defined benefit obligation is calculated according to tryggandelagen.Skandinaviska Enskilda Banken consequently adopts the discount rate set bythe Swedish FSA before year-end. The obligation is fully covered by assets inthe pension foundation and is not included in the balance sheet.
The assets in the foundation are mainly equity related SEK 21,575m (22,606)
and to a smaller extent interest earning SEK 4,187m (3,838). The assets includeSEB shares at a market value of SEK 1,170m (1,167) and buildings occupied by thecompany valued at SEK 2,742m ( 2,170). The return on assets was 2 per cent(12) before pension compensation.
Amounts recognised in Income statementParent company
2018 2017
Pension disbursements –751 –716Compensation from pension foundations 751 686
TOTAL 0 –30
Principal actuarial assumptions used
Gross interest rate 0.7% 0.6%Interest rate after tax 0.6% 0.5%
The actuarial calculations are based on salaries and pensions on the balance sheet date.
DEFINED CONTRIBUTION PLANS IN SKANDINAVISKA ENSKILDA BANKEN
Parent company
Net amount recognised in Income statement 2018 2017
Expense in Staff costs including special salary tax –644 –643
Pension foundationsPension commitments Market value of asset
2018 2017 2018 2017
SEB-Stiftelsen, Skandinaviska Enskilda Bankens Pensionsstiftelse 24,170 24,213 28,504 28,621SEB Kort AB:s Pensionsstiftelse 970 959 1,036 1,031
TOTAL 25,140 25,172 29,541 29,652

Financial statements Notes
SEB Annual Report 2018108
8c Remuneration to the Board and the Group Executive CommitteeGuidelines for remunerationThe guidelines for remuneration to the President and the other members ofthe Group Executive Committee (GEC) were prepared by the Board of Directorsand its Remuneration and Human Resources Committee and approved by theAnnual General Meeting 2018.
The remuneration structure for the President and the other members of theGEC is in accordance with the remuneration policy for the bank. No memberof the GEC has been entitled to cash based variable remuneration since 2009.Thus, the remuneration is based upon three main components; base pay,
equity-based remuneration and pensions and other benefits. Other benefitsmay consist of e.g. company car and domestic services.For more information, see page 64–65.
Identified staffThe President and all other members of the GEC are considered employeeswho have a material impact on SEB’s risk profile according to the SwedishFinancial Supervisory Authority regulations (FFFS 2011:1).
Remuneration to the Board1), SEK
2018 Base pay Directors’ fee Benefits2) Total
Chairman of the Board, Marcus Wallenberg 3,745,000 3,745,000Other members of the Board3) 9,187,500 9,187,500President and CEO, Johan Torgeby 11,000,000 345,965 11,345,965
TOTAL 11,000,000 12,932,500 345,965 24,278,465
2017
Chairman of the Board, Marcus Wallenberg 3,640,000 3,640,000Other members of the Board3) 9,128,183 9,128,183President and CEO, Johan Torgeby (29 March–31 December) 7,125,000 112,318 7,237,318President and CEO, Annika Falkengren (1 January–28 March) 2,875,000 168,307 3,043,307
TOTAL 10,000,000 12,768,183 280,625 23,048,808
1) The number of Board members decided by the AGM in 2018 is eleven (eleven). Sara Öhrvall left the Board 30 June 2018 to take up a position in the SEB Group.2) Includes benefits as domestic services, company car and holiday pay.3) Directors’ fee to the Board members on individual level is presented on page 56–57.
Sara Öhrvall has further invoiced SEK 1,880,775 (1,050,230) for consultancy services until she was employed by the bank.
Remuneration to the Group Executive Committee, SEK1)
Base pay Benefits Total
2018 57,643,578 2,164,512 59,808,0902017 49,224,511 1,853,522 51,078,033
1) GEC excluding the President and CEO. The members partly differ between the years but in average twelwe (eleven) members are included. At the end of the year the number ofmembers were twelve (eleven).
Additional members are not included.
Long-term equity programmesUnder the Share Deferral Programme members of the GEC may be grantedan individual number of conditional share rights based on the fulfilment ofpre-determined Group, business unit and individual target levels as outlinedin SEB’s business plan. The targets are set on an annual basis as a mix of thefinancial targets Return on Equity/Return on Business Equity and cost deve-lopment and the non-financial target customer satisfaction among others.For GEC the initial allotment may not exceed 100 per cent of the base pay.
Ownership of 50 per cent of the share rights are transferred to the partici-pant after a qualification period of three years, 50 per cent after a qualifica-tion period of five years. After each respective qualification period there isan additional holding period of one year after which the share rights can be
excercised. Each share right carries the right to receive one Class A sharein the bank. There is normally a requirement for vesting that the participantremains with SEB during the first three years, but some exemption apply.A further requirement for vesting is that the participant holds shares in SEBequal to a predetermined amount, for GEC equivalent to one year salary netof taxes, acquired no later than on a pro-rata basis during the initial threeyear vesting period.
The Share Matching Programme (SMP) 2014 vested in 2017 with 63 percent matching. GEC is not participating in the SMP 2012–2014 nor the AllEmployee Programme (AEP) except for outstanding rights earned beforebeing member of GEC.
Long-term equity programmes (expensed amounts for ongoing programmes), SEK
2018Share deferral
programme Total
President and CEO, Johan Torgeby 1,249,972 1,249,972Other members of the GEC1) 8,258,831 8,258,831
TOTAL 9,508,803 9,508,803
2017
President and CEO, Johan Torgeby 1,522,952 1,522,952Other members of the GEC1) 15,489,205 15,489,205
TOTAL 17,012,157 17,012,157
1) GEC excluding the President and CEO. The members partly differ between the years but in average twelwe (eleven) members are included. At the end of the year the number ofmembers were twelve (eleven).
Additional members are not included.
Some of the GEC members have previously received rights in the All Employee Programme. The corresponding calculated costs and number of outstanding rights/shares are notincluded in the tables.

Notes Financial statements
SEB Annual Report 2018 109
Note 8 c continued Remuneration to the Board and the Group Executive Committee
Number outstanding by 2018-12-31Number outstanding
Presidentand CEO
Johan TorgebyOther members
of the GEC TotalFirst day of
exercise Performance criteria
2012: Share matching rights 23,579 23,579 2015 final vesting 100%1)
2013: Share matching rights 36,401 64,723 101,124 2016 final vesting 92%2014: Share matching rights 18,658 26,242 44,900 2017 final vesting 63%2012: Share rights 14,896 14,896 2016;20182) –2013: Share rights 133,987 133,987 2017;20192) –2014: Conditional share rights/Share rights 96,933 96,933 2018;20202) –2015: Conditional share rights/Share rights 12,342 203,397 215,739 2019;20212) –2016: Conditional share rights 42,104 292,520 334,624 2020;20222) –2017: Conditional share rights 31,936 199,596 231,532 2021;20232) –2018: Conditional share rights 57,826 297,389 355,215 2022;20242) –
1) Share Matching Programme 2012 vested in 2015 with 100 per cent matching, since the programme had reached its cap the outcome after adjustment related to the cap was 92 per cent.2) The qualification period ends after three or five years respectively and are followed by a holding period of one year, thereafter there is normally an exercise period of three years.
During the year the President and CEO has exercised rights to a value of SEK 0 (0). The corresponding value for the GEC excluding the President is SEK 25,128,614 (23,030,558).
Pension and severance payThe pension agreement of the President is contribution-based and inviolable.The pension contribution is a fixed amount.
Termination of employment by the bank is subject to a maximum 12-monthperiod of notice and entitles to a severance pay of 12 months’ salary.
As regards pension benefits and severance pay the following is applicable
to the members of the GEC excluding the President. The pension plans areinviolable and defined contribution-based except for a portion in the collectiveagreement.
Termination of employment by the bank is subject to a maximum 12-monthperiod of notice and entitles to a severance pay of 12 months’ salary.
Pension costs (service costs, interest costs and defined contribution premiums), SEK
President and CEO,Johan Torgeby
President and CEO,Annika Falkengren
Other members ofthe Group Executive
committee1) Total
2018 3,834,302 16,963,710 20,798,0122017 2,625,000 1,250,000 16,917,548 20,792,548
1) GEC excluding the President and CEO. The members partly differ between the years but in average twelwe (eleven) members are included. At the end of the year the number ofmembers were twelve (eleven).
Additional members are not included.
For information about related parties see note 46.
8d Share-based paymentsLong-term equity-based programmes
2018Restricted share
programmeAll employee
programmeShare deferral
programmeShare matching
programme1)Performance
shares
Outstanding at the beginning of the year 10,564,099 17,750,711 1,967,361Granted2) 1,449,922 3,083,545 5,809,645 123,696Forfeited –8,600 –243,305 –5,395,913 –2,309Exercised3) –2,372,037 –1,397,553 –480,913Expired 0
OUTSTANDINGATTHEENDOFTHEYEAR 1,441,322 11,032,302 16,766,890 1,607,835of which exercisable 0 0 978,586 1,607,835
2017
Outstanding at the beginning of the year 10,142,015 14,046,597 2,957,797 1,274,019Granted2) 2,991,591 5,520,433 1,011,633Forfeited –610,833 –1,070,225 –5,540Exercised3) –1,958,674 –746,094 –1,996,529 –1,165,121Expired –108,898
OUTSTANDINGATTHEENDOFTHEYEAR 10,564,099 17,750,711 1,967,361of which exercisable 0 589,659 1,967,361
1) Numbers include investments done by participants, as well as allocated matching share rights.2) Including compensation for dividend.3) Weighted average share price for SMP and SDP at exercise SEK 89.59 (104.09).

Financial statements Notes
SEB Annual Report 2018110
Note 8 d continued Share-based payments
Total Long-term equity-based programmes
Original noof holders4)
No of issued(maximum
outcome)
No ofoutstanding
20185)
No ofoutstanding
20175)
A shareper option/
shareExercise
price ValidityFirst date of
exercise
2012: Share matching programme 432 7,024,168 677,895 874,084 4 2012–2019 20152)
2013: Share matching programme 213 3,485,088 627,663 702,408 4 2013–2020 20162)
2014: Share matching programme 96 1,300,288 302,277 390,869 4 2014–2021 20172)
2012: Share deferral programme – equity settled 86 1,199,504 276,644 854,226 1 2012–2021 2015/20173)
2013: Share deferral programme – equity settled 263 1,361,861 1,059,004 1,126,673 1 2013–2022 2016/20183)
2014: Share deferral programme – equity settled 622 1,909,849 1,520,505 1,993,157 1 2014–2023 2017/20193)
2015: Share deferral programme – equity settled 816 2,603,843 2,604,856 2,478,718 1 2015–2024 2018/20203)
2015: Share deferral programme – cash settled 513 1,717,150 1,705,862 1,622,652 2015–2021 2018/20203)
2016: Share deferral programme – equity settled 874 3,593,155 3,297,588 3,355,003 1 2016–2025 2019/20213)
2016: Share deferral programme – cash settled 500 2,017,622 1,953,743 1,913,887 2016–2022 2019/20213)
2017: Share deferral programme – equity settled1) 1,373 4,439,824 4,142,224 4,210,294 1 2017–2026 2020/20223)
2017: Share deferral programme – cash settled 75 206,125 206,464 196,101 2017–2023 2020/20223)
2018: Share deferral programme – equity settled1) 788 3,785,769 3,681,626 1 2018–2027 2021/20233)
2018: Share deferral programme – cash settled 14 97,770 97,770 2018–2024 2021/20233)
2018: Restricted Share programme – equity settled 411 1,378,367 1,369,767 1 2018–2022 2019/20223)
2018: Restricted Share programme – cash settled 28 71,555 71,555 2018–2022 2019/20223)
2013: All employee programme – equity settled 8,347 1,255,838 1 2013–2016 20172013: All employee programme – cash settled 5,358 532,184 2013–2016 20172014: All employee programme – equity settled 8,709 1,786,471 1,599,693 1 2014–2017 20182014: All employee programme – cash settled 5,216 964,436 765,734 2014–2017 20182015: All employee programme – equity settled 8,319 2,290,359 2,043,001 2,103,704 1 2015–2018 20192015: All employee programme – cash settled 6,745 1,220,463 993,735 1,041,755 2015–2018 20192016: All employee programme – equity settled 8,209 1,731,922 1,588,616 1,640,581 1 2016–2019 20202016: All employee programme – cash settled 6,517 933,905 831,973 874,726 2016–2019 20202017: All employee programme – equity settled 7,954 1,613,740 1,569,640 1,613,740 1 2017–2020 20212017: All employee programme – cash settled 6,867 924,166 848,781 924,166 2017–2020 20212018: All employee programme – equity settled 8,086 1,969,746 1,969,746 0 1 2018–2021 20222018: All employee programme – cash settled 6,863 1,186,810 1,186,810 0 2018–2021 2022
TOTAL 52,601,978 34,627,745 30,282,171
1) The exercise period for GEC members is extended during the period that they are GEC members.2) As soon as practically possible following the end of the performance period, the establishing of the outcome of number of Matching Shares and the allocation of the A shares and,
if applicable, the Matching Shares.3) As soon as possible following the end of the performance period the outcome is established. For the equity-settled programmes the ownership of the performance shares is
transferred upon registration, but the shares are withheld for one additional year. Cash-settled programmes are paid out in connection with the following payroll run.4) In total approximately 2,000 individuals (1,900) participated in any of the programmes, All Employee Programme excluded.5) Including additional deferral rights for dividend compensation.
Long-term equity-based programmes
The Annual General meeting 2018 decided on three Long-term equity basedprogrammes, one Share Deferral Programme, one Restricted Share Programmeand one All Employee Programme.
The first Share Deferral Programme was introduced in 2012 for the GroupExecutive Committee and certain other executive managers and key employeeswith critical competences. The participants are granted an individual number ofconditional share rights based on pre-determined Group, division/business unitand individual target levels, both financial (Return on Equity/Return on BusinessEquity and cost development) and non-financial (customer satisfaction andparameters such as compliance, employee commitment, SEB’s corporate sus-tainability and risk management), set on an annual basis.
For GEC members and other senior executives 50 per cent of the share rightsownership is transferred after a qualification period of three years and 50 percent after a qualification period of five years. For other participants the qualifi-cation period is three years. The requirement for vesting is normally that theparticipant remains with SEB during the first three years and that the partici-pant holds shares in SEB equal to a predetermined amount, acquired no laterthan on a pro-rata basis during the initial three year period. After each respec-tive qualification period there is an additional holding period of one year afterwhich the share rights can be exercised, normally during a period of threeyears. Each share right carries the right to receive one Class A share in the bank.In countries mainly outside Europe the participants receives so called phantomshares that gives the right to receive cash adjusted for the share price develop-ment during the qualification period and thereafter the total shareholder returnof the SEB A share at the end of the holding period.
In the 2018 programme the holders are only compensated for dividendsafter the qualification period, in the previous programmes the holders are com-pensated for dividends to the shareholders during the full period. Thus, thenumber of share rights will be recalculated, after the Annual General Meetingeach year, taking the dividend into account depending on programme. Theshare rights are not securities that can be sold, pledged or transferred toothers. However, an estimated value per share right has been calculatedfor 2018 to SEK 61 (83) for a qualification period of three years and SEK 57for a qualification period of five years (based upon an average closing priceof one SEB Class A share at the time of grant).
In 2018 a Restricted Share Programme was introduced in order to ensurea competitive and attractive remuneration model within certain business unitsand to comply with new regulations implemented. The participants are selectedemployees on the level below senior executives. They are granted an individual
number of conditional / share rights based on the fulfilment of pre-determinedGroup, business unit and individual targets as outlined in SEB’s business plan,set on an annual basis as a mix of financial and non-financial targets.
The ownership of the share rights are transferred to the participants duringa three year period in either three or four annual instalments. The share rightsare subject to restrictions in terms of e.g. certain regulatory and employmentrequirements during the period between initial allotment and the transfer of theownership. After the transfer of ownership there is an additional holding periodof one year before the share rights can be exercised. Each share right carries theright to receive one SEB Class A share. The share rights are not securities thatcan be sold, pledged or transferred to others. However, an estimated value pershare right has been calculated for 2018 to SEK 86 for the first installment toSEK 77 for the remaining instalments (based upon an average closing price ofone SEB Class A share at the time of grant).
In 2013 an All Employee Programme was introduced for most employees,where 50 per cent of the outcome is paid in cash and 50 per cent is deferredfor three years and paid in SEB A shares. Deferrals will normally only beobtained under the condition that the employee remains with SEB. In Swedenthe deferred part is paid out in SEB A shares, adjusted for dividends. In all othercountries the deferred part is paid out in cash adjusted for total shareholderreturn of the SEB A share. The initial outcome is capped at a maximum amount,which was adjusted in 2016, for each geography and is based on the fulfilmentof pre-determined Group targets outlined in SEB’s business plan, both financial(Return on Equity and cost development) and non-financial (customer satis-faction). The outcome in 2018 year’s programme was 60 per cent (56) of themaximum amount. In Sweden the maximum amount is SEK 75,000.
Previously allotted programmesFrom 2005 to 2010 the programmes were based on performance shares. Theyall have a maximum term of seven years, a vesting period of three years and anexercise period of four years. The number of allotted performance shares thatcan be exercised depends on the development of two predetermined perfor-mance criteria of equal importance. All programmes are vested and the exer-cise period for the 2010 years programme ended in 2017.
Between 2009 and 2014 a Share Matching Programme for a number ofselected senior executives and other key employees has been run. The pro-grammes are based on performance, have a vesting period of three years andare settled with SEB Class A shares. All programmes require own investment.The investment amount is pre-determined and capped for each participant.

Notes Financial statements
SEB Annual Report 2018 111
After three years, if still employed, the participant receives one Class A share /share rights for each invested share / share right and a conditional number ofperformance based matching shares for each invested share / share right. From2012 the settlement is in the form of share rights with an exercise period of fouryears. The 2014 programme was closed in 2017 with 63 per cent matching.
Between 2009 and 2014 a Share Matching Programme for a number ofselected senior executives and other key employees has been run. The pro-grammes are based on performance, have a vesting period of three years andare settled with SEB Class A shares. All programmes require own investment inSEB shares. The investment amount is pre-determined and capped for each par-ticipant. After three years, if still employed, the participant receives one ClassA share for each invested share and a conditional number of performance basedmatching shares for each invested share. From 2012 the settlement is in theform of share rights with an exercise period of four years. The 2014 programmewas closed in 2017 with 63 per cent matching.
In the 2014 years programme the number of performance based matchingshares depend on the development of two pre-determined performance crite-ria; measured as total shareholder return (TSR) in relation to the marketsrequired return based on the interest of Swedish government 10 year bonds i.e.long-term risk free interest rate (LTIR), two thirds, and the total shareholder
return in relation to SEB’s competitors, one third. Maximum outcome for theparticipants is three performance based matching shares. The outcome is alsosubject to risk adjustment.
The holders are compensated for dividends to the shareholders duringthe exercise period. Thus, the number of share rights will be recalculated, afterthe Annual General Meeting each year during the exercise period, taking thedividend into account.
Matching rights are not securities that can be sold, pledged or transferredto another party. However, an estimated value per matching right has beencalculated for 2014 to SEK 65 and for the performance based matching rightsto SEK 39. Other inputs to the options pricing model are; exercise price SEK 0;volatility 46 (based on historical values); expected dividend approximately4 per cent; risk free interest rate 1.13 and expected early exercise of 3 per centdue to staff turnover. In the value of the option the expected outcome of theperformance criteria described above are taken into account.
The programme is subject to a cap, if the share price at the time of vesting hasmore than doubled the number of matching shares and performance basedmatching shares that are transferred to a participant will be reduced proportion-ately so that the value corresponds to the doubled share price capped value.Further details of the outstanding programmes are found in the table above.
8e Number of employeesAverage number of employees Group Parent company
2018 Men Women Total Men Women Total
Sweden 3,913 4,059 7,972 3,348 3,393 6,741Norway 225 155 380 192 106 298Denmark 270 188 458 168 72 240Finland 155 129 284 118 95 213Estonia 284 894 1,178Latvia 423 1,137 1,560 186 328 514Lithuania 840 1,769 2,609 403 551 954Germany 232 160 392 57 46 103Poland 12 29 41 12 29 41Ukraine 18 36 54China 11 30 41 11 30 41United Kingdom 73 40 113 73 40 113Ireland 51 72 123Luxembourg 111 97 208Russia 23 66 89Singapore 32 73 105 28 66 94United States 30 18 48 24 16 40Other countries1) 15 14 29 15 14 29
TOTAL 6,719 8,964 15,684 4,635 4,786 9,421
2017
Sweden 3,957 4,097 8,053 3,393 3,476 6,869Norway 242 160 402 199 101 300Denmark 365 247 612 171 68 238Finland 154 137 291 109 91 200Estonia 293 920 1,212Latvia 415 1,111 1,526 156 276 432Lithuania 772 1,703 2,475 341 476 817Germany 289 201 490Poland 14 29 43 14 29 43Ukraine 20 38 58China 10 32 42 10 32 42United Kingdom 82 44 126 82 44 126Ireland 54 71 124Luxembourg 121 104 225Russia 23 64 87Singapore 34 72 106 31 63 94United States 31 18 49 24 17 41Other countries1) 16 13 28 16 13 28
TOTAL 6,889 9,057 15,946 4,546 4,686 9,232
1) Brazil and Hong Kong.

Financial statements Notes
SEB Annual Report 2018112
9 Other expensesGroup Parent company
2018 2017 2018 2017
Costs for premises1) –1,604 –1,644 –1,254 –1,260Data costs –3,377 –3,479 –2,406 –2,372Travel and entertainment –394 –387 –312 –277Consultants –731 –842 –564 –652Marketing –286 –301 –148 –144Information services –623 –549 –551 –476Other operating costs2) –186 254 –124 264
TOTAL –7,201 –6,947 –5,361 –4,9181) Of which rental costs –1,130 –1,158 –954 –954
2) Net after deduction for capitalised costs, see also note 23.
Fees and expense allowances to appointed auditors and audit firms1)
Group Parent company
2018 2017 2018 2017
Audit assignment –26 –29 –12 –12Audit related services –12 –21 –1 –1Tax advisory –12 –12 –8 –5Other services –8 –4 –2 –2
PricewaterhouseCoopers2) –58 –65 –24 –20
Audit assignment –1 –1Tax advisory –3 –1Other services3) –13 –2
Other audit firms –17 –3
TOTAL –75 –69 –24 –20
1) The parent company includes the foreign branches.2) Fees to PricewaterhouseCoopers AB from companies in the SEB group amount to SEK 22.1m (22.9). Out of this amount, SEK 12.4m (15.8) is related to the audit and SEK 9.7m (7.1) to
other services.3) Whereof SEK 13m consultation relating to operational effectiveness.
Audit assignment is defined as the audit of annual financial statements, theadministration of the Board of Directors and the President, other tasks restingupon the auditor as well as consulting and other assistance, which have beeninitiated by the findings in performing audit work or implementation of suchtasks. The audit related services include quarterly reviews, regulatory report-
ing and services in connection with issuing of certificates and opinions. Taxadvisory include general expatriate services and other tax services work.Other services include consultation on financial accounting, services related tomergers and acquisitions activities, operational effectiveness and assessmentsof internal control.
10 Depreciation, amortisation and impairment of tangible and intangible assetsGroup Parent company
2018 2017 2018 2017
Depreciation of tangible assets –250 –222 –159 –127Depreciation of equipment leased to clients1) –4,985 –4,817Amortisation of intangible assets –480 –607 –369 –462Impairment of tangible assets –4 –4Impairment of intangible assets –101 –870Retirement and disposal of intangible assets –30 –102
TOTAL –735 –964 –5,512 –6,377
1) In the group Net income from leases is classified as interest income. In the parent company depreciation of leased equipment is reported as Depreciation, amortisation andimpairment of tangible and intangible assets.
11 Gains less losses from tangible and intangible assetsGroup
2018 2017
Properties 34 62Other tangible assets 6 8
Gains 40 70
Properties –20 –229Other tangible assets –2 –3
Losses –22 –232
TOTAL 18 –162

Notes Financial statements
SEB Annual Report 2018 113
12 Net expected credit lossesGroup Parent company
2018 2017 2018 2017
Impairment gains or losses – Stage 1 –117 –106Impairment gains or losses – Stage 2 –134 –123Impairment gains or losses – Stage 3 –613 –506
Impairment gains or losses1) –864 –735Net provisions2) 12 –183
Write-offs and recoveries
Total write-offs –1,768 –1,367 –1,280 –797Reversals of allowances for write-offs 1,267 318 931 180
Write-offs not previously provided for –501 –1,050 –349 –617Recovered from previous write-offs 199 230 64 51
Netwrite-offs –302 –820 –285 –566
NETEXPECTEDCREDIT LOSSES1) –1,166 –1,020
NETCREDIT LOSSES2) –808 –749
1) IFRS 9 expected loss model. Consists of increases due to origination, decreases due to derecognition and changes due to changes in credit risk.2) IAS 39 incurred loss model.
Net ECL level, % 0.06 0.07Credit loss level, % 0.05 0.05
13 Items affecting comparabilityGroup
2018 2017
Other income 4,506 494
Total operating income 4,506 494
Staff costs –1,320Other expenses –92Depreciation, amortisation and impairment of tangible and intangible assets –978
Total operating expenses –2,390
Itemsaffecting comparability 4,506 –1,896
Income tax on items affecting comparability 22 215
ITEMSAFFECTINGCOMPARABILITYAFTERTAX 4,528 –1,681
Items affecting comparability 2018The total income in the income statement from Items affecting comparabilitywas SEK 4,506m before tax and SEK 4,528m after tax.
SEB PensionSEB divested all shares in SEB Pensionsforsikring A/S and SEB AdministrationA/S (SEB Pension) to Danica Pension Livsforsikringsaktieselskab (Danica),a subsidiary to Danske Bank. The entire business, including employees, cus-tomer contracts and systems, transferred from SEB to Danica on 7 June 2018.The in principle tax-exempt capital gain from the transaction amounted toSEK 3,565m.
UCOn 29 June 2018, the acquisition by the listed Finnish credit information com-pany Asiakastieto Group Plc (“Asiakastieto”) of UC AB (“UC”) was finalised.SEB received shares in Asiakastieto, equivalent to 10.2 per cent of the com-pany, and SEK 0.3bn in cash. The transaction resulted in a tax-exempt capitalgain of SEK 941m.
Items affecting comparability 2017The total expense in the income statement from Items affecting comparabilitywas SEK 1,896m before tax and SEK 1,681m after tax. In total, the itemsaffecting comparability, including the effect on other comprehensive incomeof SEK 494m, decreased equity by SEK 2,175m.
Visa SwedenThe settlement of the acquisition of Visa Europe by Visa Inc. consisted of a com-bination of cash and shares to be paid to the different Visa Europe members. Adividend of SEK 494m was received. There was no tax effect. The holdings inVisa have been classified as Available-for-sale asset where the change in valueis recognised in Other comprehensive income. The dividend received reducedthe amount in Other comprehensive income by SEK 494m.
SEB’s German businessThe operations in Germany were transformed and the core business was trans-ferred from SEB AG (renamed to DSK Hyp AG in 2018) to the German branchof the parent company as of 2 January 2018. The provisions related to redun-dancy and excess premises amounting to a total of SEK 521m were recognisedin 2017. In addition, SEB entered into an agreement to transfer the pension obli-gations under the defined benefit plan in SEB AG to Versicherungsverein desBankgewerbes a.G (BVV) at a total cost of SEK 891m.
Impairment and derecognition of IT assetsAn impairment and a derecognition of intangible IT assets led to an expensein an amount of SEK 978m. The positive tax effect was SEK 215m.
14 AppropriationsParent company
2018 2017
Group contribution 2,149 1,554Accelerated tax depreciation 568 332
TOTAL 2,716 1,885

Financial statements Notes
SEB Annual Report 2018114
15 Taxes
Major components of tax expenseGroup Parent company
2018 2017 2018 2017
Current tax –5,217 –4,554 –3,789 –3,633Deferred tax 618 –145
Tax for current year –4,599 –4,699 –3,789 –3,633Current tax for previous years 447 137 118 43
INCOMETAXEXPENSE –4,152 –4,562 –3,671 –3,590
Relationship between tax expenses and accounting profit
Net profit 23,134 16,197 21,720 17,811Income tax expense 4,152 4,562 3,671 3,590
Accountingprofit before tax 27,285 20,759 25,391 21,401
Current tax at Swedish statutory rate of 22.0 per cent –6,003 –4,577 –5,586 –4,708Tax effect relating to other tax rates in other jurisdictions 399 429Tax effect relating to not tax deductible expenses –799 –641 –998 –788Tax effect relating to non-taxable income 1,525 519 2,795 1,863Tax effect relating to a previously recognised tax loss,tax credit or temporary difference –362 156Tax effect relating to a previously unrecognised tax loss,tax credit or temporary difference 23 –440
Current tax –5,217 –4,554 –3,789 –3,633
Tax effect relating to origin and reversal of tax losses,tax credits and temporary differences 362 –156Tax effect relating to changes in tax rates or the imposition of new taxes 286Tax effect relating to a previously unrecognised tax loss,tax credit or temporary difference –30 11
Deferred tax 618 –145
Current tax for previous years 447 137 118 43
INCOMETAXEXPENSE 1) –4,152 –4,562 –3,671 –3,590
1) Total income tax expense was SEK 4,152m (4,562). The effective tax rate for the year was 15.2 per cent (21.9). Excluding Items affecting comparability, the effective tax rate was18.3 per cent (21.0). This was in line with SEB’s expected tax rate.
Deferred tax income and expense recognised in income statement
Accelerated tax depreciation 137 –30Pension plan assets, net 91 178Tax losses carry forwards –75 –133Other temporary differences 465 –161
TOTAL 618 –145
CURRENT TAX ASSETSGroup Parent company
2018 2017 2018 2017
Other 6,395 5,252 2,813 1,999
Recognised in profit and loss 6,395 5,252 2,813 1,999
Other 9 2
Recognised in Shareholders’ equity 9 2
TOTAL 6,404 5,255 2,813 1,999
DEFERRED TAX ASSETS
Tax losses carry forwards 75Pension plan assets, net 1 1Other temporary differences1) 252 188
Recognised in profit and loss 253 264
Unrealised losses in financial assets –2 –3
Recognised in Shareholders’ equity –2 –3
TOTAL 251 260
1) Temporary differences are differences between the carrying amount of an asset or liability in the balance sheet and its tax base.
Tax losses carried forward in the SEB Group for which the tax assets are notrecognised in the balance sheet amount to SEK 5,080m (4,662) gross. Theseare not recognised due to the uncertainty in the possibility to use them. This
includes losses where the amount can only be used for trade tax. The potentialtax asset not recognised is SEK 1,108m (919).

Notes Financial statements
SEB Annual Report 2018 115
Note 15 continued Taxes
CURRENT TAX LIABILITIESGroup Parent company
2018 2017 2018 2017
Other 1,734 1,463 655 684
Recognised in profit and loss 1,734 1,463 655 684
TOTAL 1,734 1,463 655 684
DEFERRED TAX LIABILITIES
Accelerated tax depreciation 6,084 6,388Pension plan assets and obligations, net –302 –211Other temporary differences1) 40 144
Recognised in profit and loss 5,822 6,321
Pension plan assets and obligations, net 1,164 1,372Unrealised profits in cash flow hedges 85 336 85 336Unrealised profits in available-for-sale financial assets 70 49
Recognised in Shareholders’ equity 1,318 1,758 85 336
TOTAL 7,141 8,079 85 336
1) Temporary differences are differences between the carrying amount of an asset or liability in the balance sheet and its tax base. Taxable temporary differences give rise to deferredtax assets and liabilities.
As from 2018, advance income tax payments on profits in Estonia at a rateof 14 per cent (0) are made quarterly. The income tax paid in advance can benetted against tax payable on dividend distributions, where the tax rate isbetween 20 and 14 per cent (20). No deferred tax liability is recognised
related to possible future tax costs on dividends from Estonia. Since 2018 noincome tax is paid in Latvia unless profit is distributed. No deferred tax liabilityis recognised related to possible future tax costs on dividends from Latvia. Thetax rate applicable to dividends in Latvia is 20 per cent (0).
16 Earnings per shareGroup
2018 20171)
Net profit attributable to shareholders, SEK m 23,134 16,197Weighted average number of shares, millions 2,164 2,168Basic earnings per share, SEK 10.69 7.47
Net profit attributable to shareholders, SEK m 23,134 16,197Weighted average number of diluted shares, millions 2,177 2,178Diluted earnings per share, SEK 10.63 7.44
Dilution2)
Weighted average number of shares, millions 2,164 2,168Adjustment for diluted weighted average number ofadditional Class A shares, millions 13 10Weighted average number of diluted shares, millions 2,177 2,178
1) 2017 has been restated for the transition to IFRS 15. For transition disclosures, see note 53.2) Calculated dilution based on the estimated economic value of the long-term incentive programmes.
17 Cash and cash balances at central banksGroup Parent company
2018 2017 2018 2017
Cash 2,249 1,960 155 132Cash balances at central banks 206,866 175,262 163,925 97,609
TOTAL 209,115 177,222 164,081 97,741

Financial statements Notes
SEB Annual Report 2018116
18 LoansGroup Parent company
20181) 20172) 20181) 20172)
Lending 33,294 12,444 29,665 8,498Reverse repos 334 334
Loans to central banks 33,294 12,778 29,665 8,832
Lending 37,631 31,862 84,694 181,221Margins of safety 5,197 6,800 5,774 8,672Reverse repos 1,458 56 200 56
Loans to credit institutions 44,287 38,717 90,668 189,949
Lending 1,490,771 1,415,603 1,256,596 1,133,727Margins of safety 56,118 28,931 56,164 29,949Reverse repos 97,936 42,230 97,926 42,230
Loans to thepublic 1,644,825 1,486,765 1,410,687 1,205,906
TOTAL 1,722,406 1,538,260 1,531,020 1,404,687
1) IFRS 9 expected loss model.2) IAS 39 incurred loss model.
Loans bymeasurement category
Group Parent company
20181) FVHFT FVMPL AmC Total FVHFT FVMPL AmC Total
Loans to central banks 33,294 33,294 29,665 29,665Loans to credit institutions 200 44,087 44,287 200 90,468 90,668Loans to the public 97,936 1,901 1,544,988 1,644,825 97,936 1,901 1,310,850 1,410,687
TOTAL 98,136 1,901 1,622,368 1,722,406 98,136 1,901 1,430,982 1,531,020
Group Parent company
20172) LaR Total LaR Total
Loans to central banks 12,778 12,778 8,832 8,832Loans to credit institutions 38,717 38,717 189,949 189,949Loans to the public 1,486,765 1,486,765 1,205,906 1,205,906
TOTAL 1,538,260 1,538,260 1,404,687 1,404,687
1) IFRS 9 expected loss model.2) IAS 39 incurred loss model.

Notes Financial statements
SEB Annual Report 2018 117
Note 18 continued Loans
Exposure and expected credit loss (ECL) allowances by stage
The table shows gross carrying amounts for exposures on balance measuredat amortised cost and nominal amounts for exposures off-balance divided bystage as a mean to put ECL allowances in context to total exposure. For trade
receivables a simplified approach based on past-due information is used tocalculate loss allowances. For opening balances 1 January 2018 see note 53.
Group, 2018
Stage1 (12-month ECL)Gross carrying amounts/
Nominal amounts ECL allowancesCarrying amounts/
Net amountsECL coverage
ratio, %
Debt securities 16,337 –1 16,336Loans1) 1,552,954 –643 1,552,311
Financial assets 1,569,291 –643 1,568,647Financial guarantees and Loan commitments 602,884 –195 602,689
Total 2,172,175 –838 2,171,337 0.04
Stage2 (lifetimeECL)
Loans1) 2) 70,125 –1,364 68,761
Financial assets 70,125 –1,364 68,761Financial guarantees and Loan commitments 16,712 –240 16,472
Total 86,837 –1,605 85,233 1.85
Stage3 (credit impaired/lifetimeECL)
Loans1) 3) 8,158 –3,331 4,827
Financial assets 8,158 –3,331 4,827Financial guarantees and Loan commitments 242 –38 203
Total 8,400 –3,370 5,030 40.11
Total
Debt securities 16,337 –1 16,336Loans1) 1,631,237 –5,338 1,625,899
Financial assets 1,647,574 –5,339 1,642,235Financial guarantees and Loan commitments 619,838 –474 619,365
TOTAL 2,267,412 –5,813 2,261,600 0.26
1) Excluding demand deposits credit institutions.2) Whereof gross carrying amounts SEK 1,169m and ECL allowances SEK 2m under Lifetime ECLs -simplified approach for trade receivables.3) Whereof gross carrying amounts SEK 1,281m and ECL allowances SEK 349m for Purchased or originated credit impaired loans.
Stage 3 loans / Total loans – gross, % 0.50Stage 3 loans / Total loans – net, % 0.30
Parent company, 2018
Stage1 (12-month ECL)Gross carrying amounts/
Nominal amounts ECL allowancesCarrying amounts/
Net amountsECL coverage
ratio, %
Debt securities 17,537 –1 17,536Loans1) 1,370,604 –534 1,370,070
Financial assets 1,388,141 –534 1,387,606Financial guarantees and Loan commitments 544,335 –177 544,158
Total 1,932,475 –711 1,931,764 0.04
Stage2 (lifetimeECL)
Debt securities 32 0 32Loans1) 2) 59,135 –1,104 58,031
Financial assets 59,167 –1,104 58,063Financial guarantees and Loan commitments 12,655 –195 12,460
Total 71,822 –1,299 70,523 1.81
Stage3 (credit impaired/lifetimeECL)
Loans1) 3) 4,587 –1,705 2,882
Financial assets 4,587 –1,705 2,882Financial guarantees and Loan commitments 70 –11 59
Total 4,656 –1,716 2,941 36.85
Total
Debt securities 17,569 –1 17,568Loans1) 1,434,325 –3,343 1,430,982
Financial assets 1,451,895 –3,344 1,448,551Financial guarantees and Loan commitments 557,060 –382 556,677
TOTAL 2,008,954 –3,726 2,005,228 0.19
1) Excluding demand deposits credit institutions.2) Whereof gross carrying amounts SEK 1,225m and ECL allowances SEK 2m under Lifetime ECLs -simplified approach for trade receivables.3) Whereof gross carrying amounts SEK 1,227m and ECL allowances SEK 296m for Purchased or originated credit impaired loans.
Stage 3 loans / Total loans, gross, % 0.32Stage 3 loans / Total loans, net, % 0.20

Financial statements Notes
SEB Annual Report 2018118
Note 18 continued Loans
Loans and expected credit loss (ECL) allowances by industry
The table shows gross carrying amounts for loans measured at amortised cost and ECL allowances as a mean to put ECL allowances in context to overall lending.
Gross carrying amounts ECL allowancesNet carrying
amount
Group, 2018
Stage 1(12-month
ECL)
Stage 2(lifetime
ECL)
Stage 3(credit
impaired/lifetime ECL) Total
Stage 1(12-month
ECL)
Stage 2(lifetime
ECL)
Stage 3(credit
impaired/lifetime ECL) Total Total
Banks 97,795 900 98,695 –2 –2 –4 98,691
Finance and insurance 97,670 670 15 98,355 –17 –4 –11 –32 98,323Wholesale and retail 80,168 3,357 557 84,082 –43 –83 –182 –308 83,774Transportation 35,245 755 107 36,107 –14 –7 –77 –98 36,008Shipping 50,158 969 1,694 52,821 –18 –5 –407 –430 52,391Business and household services 153,943 8,053 868 162,863 –144 –233 –352 –729 162,134Construction 12,743 1,554 225 14,522 –7 –17 –47 –71 14,451Manufacturing 91,680 3,712 731 96,122 –82 –74 –529 –684 95,437Agriculture, forestry and fishing 21,788 1,577 129 23,494 –8 –8 –40 –56 23,438Mining, oil and gas extraction 14,615 6,046 530 21,191 –30 –421 –97 –548 20,644Electricity, gas and water supply 39,045 764 2 39,810 –15 –44 –60 39,750Other 52,552 3,370 119 56,040 –57 –75 –237 –369 55,671
Corporates 649,606 30,826 4,977 685,409 –436 –971 –1,979 –3,386 682,023
Commercial real estate management 143,670 2,945 561 147,175 –18 –19 –188 –224 146,951Residential real estate management 92,395 1,276 93 93,764 –6 –1 –32 –39 93,726
Real EstateManagement 236,065 4,221 655 240,940 –23 –20 –220 –263 240,677
Housing co-operativeassociations 54,807 8,695 63,502 –1 0 –2 –4 63,498
PublicAdministration 13,026 280 2 13,309 –1 –4 –2 –7 13,302
Household mortgages 434,868 18,381 714 453,963 –39 –114 –227 –380 453,583Other 66,786 6,822 1,810 75,419 –139 –253 –902 –1,294 74,125
Households 501,655 25,204 2,524 529,383 –178 –367 –1,129 –1,674 527,708
TOTAL 1,552,954 70,125 8,158 1,631,237 –643 –1,364 –3,331 –5,338 1,625,899
Excluding demand deposits credit institutions and including trade and client receivables presented as other assets.
Stage 3 loans (credit-impaired) and collaterals by industry
The table shows gross carrying amounts and ECL allowances for credit-impaired loans divided by stage 3 and the fair value of collaterals for these assets.
Group, 2018Gross carrying
amounts ECL allowancesCarryingamounts
Fair value ofcollaterals
Banks 0 0 0 0Corporates 4,977 –1,979 2,998 2,920Real Estate Management1) 655 –222 433 526Public Administration 2 –2 1 1Household 2,524 –1,129 1,395 1,236
TOTAL 8,158 –3,331 4,827 4,683
1) Including co-operative associations.
Exposure by risk classification category
The table shows gross carrying amounts for exposures on balance and nominal amounts for exposures off-balance divided by stage and risk classificationcategory. The risk classification categories are further explained in note 41.
Group, 2018Stage 1
(12-month ECL)Stage 2
(lifetime ECL)
Stage 3(credit impaired/
lifetime ECL)1) Total
Investment grade 1,469,235 18,693 0 1,487,928Standard monitoring 702,940 42,885 0 745,825Watch list 0 25,260 0 25,260Default 0 0 8,400 8,400
TOTAL 2,172,175 86,837 8,400 2,267,412
1) Whereof gross carrying amounts SEK 1,281m and ECL allowances SEK 349m for Purchased or originated credit impaired loans.

Notes Financial statements
SEB Annual Report 2018 119
Note 18 continued Loans
Reconciliation of expected credit loss (ECL) allowances
Reconciliation of movements of allowance accounts for on balance exposures (Loans and Debt securities measured at amortised cost) and off balance exposures(Financial guarantees and Loan commitments).
Group Parent company
Loans and Debt securities
Stage 1(12-month
ECL)
Stage 2(lifetime
ECL)
Stage 3(credit
impaired/lifetime ECL) Total
Stage 1(12-month
ECL)
Stage 2(lifetime
ECL)
Stage 3(credit
impaired/life-time ECL) Total
ECL allowance as of 1 January 20181) 624 1,142 3,688 5,453 399 876 2,013 3,288New and derecognised financial assets, net 542 –361 158 339 520 –324 132 328Changes due to change in credit risk –448 543 614 710 –434 489 513 568Decreases in ECL allowances due to write-offs –1,267 –1,267 –931 –931Exchange rate differences –74 40 139 104 49 63 –21 91
TOTAL 643 1,364 3,331 5,339 534 1,104 1,705 3,344
Financial guarantees and Loan commitments
ECL allowance as of 1 January 20181) 164 283 229 676 133 109 140 381New and derecognised financial assets, net 68 –224 –86 –242 52 –230 –74 –253Changes due to change in credit risk –44 175 –73 58 –32 189 –64 92Exchange rate differences 8 7 –32 –18 25 128 10 162
TOTAL 195 240 38 474 177 195 11 382
Total Loans, Debt securities, Financial guarantees and Loan commitments
ECL allowance as of 1 January 20181) 787 1,425 3,917 6,129 532 985 2,152 3,669New and derecognised financial assets, net 610 –585 72 97 572 –554 58 75Changes due to change in credit risk –492 718 541 768 –466 678 448 660Decreases in ECL allowances due to write-offs –1,267 –1,267 –931 –931Exchange rate differences –66 46 107 87 74 191 –11 253
TOTAL 838 1,605 3,370 5,813 711 1,299 1,716 3,726
1) IFRS 9
The decrease in total ECL allowances in 2018 was due to write-offs of expo-sures in Stage 3.
ECL allowances in Stage 1 increased due to the growth in exposures.While Stage 2 exposures decreased the Stage 2 ECL allowances increased
as a result of negative migration of exposures with higher ECL cover ratio.There was also an outflow of exposures from Stage 2 to Stage 3 due to creditquality deterioration and to Stage 1 driven by improvements in data quality.
Stage 3 exposures and ECL allowances were significantly reduced by write-offs, partly off-set by an inflow of exposures to Stage 3 due to deterioration incredit risk.
Keymacroeconomic variable assumptions for calculating ECL allowancesThe group uses internally developed macroeconomic forecasts as the basis forthe forward-looking information incorporated in the ECL measurement. In orderto ensure an unbiased estimation of credit losses under IFRS 9, at least threescenarios are used. One of the scenarios is the base case scenario, representingthe most likely outcome, which is also applied in the financial planning andbudgeting process, while the other case scenarios represent more positive ornegative outcomes. The probability weights assigned to each scenario aredetermined using a combination of statistical analysis and expert judgment.The scenarios are reviewed four times a year, or more frequently when appro-priate due to rapid developments. The most significant macroeconomic varia-ble assumptions of the Base scenario used as of 31 December 2018, are set outbelow. Individual scenarios for SEB’s home markets are used.
2018 2019 2020 2021
Domestic GDP growth, SEB's home markets 1.4%–4.3% 1.8%–3.5% 1.7%–3.2% 1.7%–3.0%World GDP (PPP) growth 3.8% 3.6% 3.6% 3.4%Household consumption expenditure growth, Sweden 2.0% 1.8% 1.8% 2.0%Interest rate (STIBOR) –0.30% 0.2% 0.75% 1.55%Residential real estate price growth, Sweden –3.2% –3.0% 1.6% 4.0%Unemployment rate, Baltic countries 6.5–7.7% 6.2–7.0% 6.0–6.5% 6.4–6.5%
The most significant assumptions affecting the ECL allowance of the non-retail and retail portfolios, respectively, are as follows:
Non-retail portfolios
(i) GDP impact on companies' performance(ii) Real estate price growth impact on collateral valuations
Retail portfolios
(i) Household consumption expenditure growth impact on borrowers’ ability to meet their contractual obligations(ii) Residential real estate price growth impact on mortgage collateral valuations(iv) Unemployment rate impact on borrowers’ ability to meet their contractual repayments(ii) Interest rates impact on borrowers’ ability to meet their contractual obligations
As of 31 December 2018, the probability of the negative scenario was estimated to 20–25 per cent and the probability of the positive scenario was 15 per cent.

Financial statements Notes
SEB Annual Report 2018120
Note 18 continued Loans
Sensitivity analysis of macroeconomic assumptionsIn general, a worsening of the outlook on forecasted macroeconomic variablesfor each scenario or an increase in the probability of the negative scenariooccurring will both increase the number of loans migrating from Stage 1 toStage 2 and increase the estimated ECL allowances. On the other hand, animprovement in the outlook on forecasted macroeconomic variables or an
increase in the probability of the positive scenario occurring will have the oppo-site positive impact.
Should the positive and negative scenarios be assigned 100 per cent prob-ability of occurring, the model calculated ECL allowances would increase by8 per cent and decrease by 4 per cent, respectively compared to the weightedscenario.
ECL allowancesresulting from scenario
Difference from the probabilityweighted ECL allowances, %
Group Negative scenario 6,256 8%Positive scenario 5,570 –4%
Corporates & Private Customers Negative scenario 1,896 9%Positive scenario 1,638 –6%
Large Corporates & Financial Institutions Negative scenario 2,787 8%Positive scenario 2,553 –4%
Baltic Negative scenario 1,484 6%Positive scenario 1,358 –3%
Key assumptions for triggering significant increase in credit risk (SICR)For arrangements with initial origination date as of 1 January 2018 or later, theprimary indicator is changes in lifetime probability of default (PD) by compar-ing the scenario weighted annualised lifetime PD at the reporting date with
the scenario weighted annualised lifetime PD at initial recognition. For arrange-ments with an initial origination date prior to 1 January 2018 changes in SEBinternal risk classification since initial origination are used as the primary indi-cator.
Quantitativemeasures for triggering significant increase in credit risk (SICR)
For arrangements originatedprior to 1 January 2018
For arrangements originatedon or after 1 January 2018
Watch list 1) 1)
Investment grade 2–7 grades Annualised lifetime PD increaseby 200% and ≥ 50 basis pointsStandard monitoring 1–2 grades
1) Placement of a financial asset on watch list automatically classifies it as a significant increase in credit risk and places it in Stage 2.
Regardless of the quantitative indicator, a significant increase in credit riskis triggered if the following back-stop indicators occur:– payments are past due >30 days but <90 days, or– financial assets are forborne (where due to the customer’s financial diffi-
culties the contractual terms of the loans have been revised and concessionsgiven).
Back stop indicators normally overlap with the quantitative indicator ofsignificant increase in credit risk.
Sensitivity analysis of significant increase in credit risk (SICR) triggerassumptionsSensitivity of ECL to changes in the quantitative triggering approach is being
analysed regularly, including tests of the following alternative triggers:– recognizing as Stage 2 SICR all exposures that have worsened risk grade
of 1 grade or more;– reduction of Stage 2 SICR triggering thresholds to 30bp increase in annu-
alized lifetime PD, as prescribed in EBA stress test methodology.
The increase of total ECL as at 31 December 2018 resulting from the abovetests is below 1.5 per cent of the total ECL. Small change is due to the fact thatbackstop indicators capture large portion of exposures in Stage 2 regardlessof the changes in the quantitative trigger measures.
In addition, the impact of severe adverse macroeconomic developmentson loan portfolio is being tested as part of the regular ICAAP process, describedin more detail in note 42 Capital adequacy.
Past due loansGroup Parent company
2018 Loans Total Loans Total
≤ 30 days 3,540 3,540 1,708 1,708>30 ≤ 60 days 1,758 1,758 1,429 1,429>60 ≤ 90 days 803 803 633 633> 90 days 4,350 4,350 1,883 1,883
TOTAL 10,450 10,450 5,653 5,653
Past due loans that are not impairedGroup Parent company
2017 Corporates Households Other Total Corporates Households Other Total
<30 days 4,855 4,219 48 9,122 2,126 2,870 6 5,00131–60 days 154 423 2 579 67 228 295>60 days1) 316 322 3 641 114 99 2 214
TOTAL 5,325 4,965 52 10,342 2,306 3,197 7 5,510
1) Excluding portfolio assessed loans.
Forborne loansGroup Parent company
2018 2017 2018 2017
Total forborne loans 13,339 14,640 9,911 10,948of which performing1) 7,793 6,995 6,095 5,373
1) According to EBA definition.

Notes Financial statements
SEB Annual Report 2018 121
19 Debt securitiesGroup, 2018
Debt securities by issuersSwedish
governmentSwedish
municipalitiesSwedish mortgage
institutionsOther Swedish
issuersForeign
governmentOther foreign
issuers Total
Eligible debt securities1)Held for trading 3,786 7,652 2,168 13,607Fair value through profit or loss mandatorily 7,392 2,725 1,048 187 34,461 2,713 48,527Fair value through profit or loss designated 950 111 3,947 1,066 95 6,168Amortised cost 8,509 8,509
Total 12,128 2,836 4,995 187 51,688 4,976 76,811
Other debt securitiesHeld for trading 2,638 3,725 5 24,224 30,592Fair value through profit or loss mandatorily 377 3,840 9,396 4,049 912 21,434 40,008Fair value through profit or loss designated 50 1 22 152 225Amortised cost 7,649 7,649
Total 427 3,840 12,035 7,796 918 53,458 78,474
Accrued interest 844
TOTAL 12,555 6,676 17,030 7,983 52,606 58,435 156,128
Group, 2017
Eligible debt securities1)Loans to the public 6,875 6,020 12,895Securities held for trading 7,893 4,606 15,000 18,759 15 46,274Insurance assets at fair value 783 859 4,686 1,632 524 8,485Other financial assets at fair valuethrough profit or loss 6,259 876 7,135Available-for-sale financial assets 304 21,641 3,441 25,386
Total 8,980 5,465 19,686 55,167 10,877 100,175
Other debt securitiesSecurities held for trading 15,740 8,183 23 38,874 62,820Insurance assets at fair value 254 317 2,441 998 369 4,379Other financial assets at fair valuethrough profit or loss 813 813Available-for-sale financial assets 270 270
Total 254 16,057 10,624 2,104 39,243 68,283
Accrued interest 812
TOTAL 8,980 5,719 16,057 30,310 57,271 50,120 169,269
1) Eligible papers are considered as such if they, according to national legislation, are accepted by the Central bank in the country in which SEB is located.
Parent company, 2018
Debt securities by issuersSwedish
governmentSwedish
municipalitiesSwedish mortgage
institutionsOther Swedish
issuersForeign
governmentOther foreign
issuers Total
Eligible debt securities1)Held for trading 3,786 7,470 2,144 13,400Fair value through profit or loss mandatorily 6,840 2,725 11,409 1,486 21,261Amortised cost 8,509 8,509
Total 10,626 2,725 27,389 3,630 44,370
Other debt securitiesHeld for trading 2,638 3,725 24,179 30,543Fair value through profit or loss mandatorily 3,840 7,973 2,707 21,416 35,937Amortised cost 7,649 7,649
Total 3,840 10,612 6,432 53,244 74,128
Accrued interest 729
TOTAL 10,626 6,565 10,612 6,432 27,389 56,874 119,227
Parent company, 2017
Eligible debt securities1)Loans to the public 6,875 6,875Securities held for trading 7,893 4,606 15,000 18,546 46,045Available-for-sale financial assets 6,087 6,087
Total 7,893 4,606 15,000 31,508 59,007
Other debt securitiesSecurities held for trading 15,740 8,182 38,872 62,793Available-for-sale financial assets 2,575 29 2,604
Total 15,740 10,757 38,901 65,398
Accrued interest 665
TOTAL 7,893 4,606 15,740 25,757 31,508 38,901 125,070
1) Eligible papers are considered as such if they, according to national legislation, are accepted by the Central bank in the country in which SEB is located.

Financial statements Notes
SEB Annual Report 2018122
20 Equity instrumentsGroup Parent company
2018 2017 2018 2017
Fair value through profit or loss held for trading 33,192 48,371 33,191 48,370Fair value through profit or loss mandatorily1) 17,242 3,801Fair value option2) 8,880 9Available-for-sale2) 3) 1,952 1,719
TOTAL3) 50,434 59,204 36,993 50,098
1) IFRS 92) IAS 393) Of which seized shares for protection of claim SEK 29m (42).
21 Derivatives and hedge accountingGroup Parent company
Derivatives 2018 2017 2018 2017
Interest-related 56,262 59,908 54,598 58,750Currency-related 42,260 37,904 41,879 38,494Equity-related 4,428 3,349 4,432 3,355Other 12,513 3,708 12,373 3,621
Positive replacement values 115,463 104,868 113,282 104,220Interest-related 35,701 39,372 35,723 40,223Currency-related 41,976 40,669 40,490 41,438Equity-related 3,825 1,928 3,825 1,950Other 15,371 3,465 15,231 3,379
Negative replacement values 96,872 85,434 95,269 86,990
Positive replacement values Negative replacement values
Group, 2018 Nominal amount Book value Nominal amount Book value
Options 178,317 2,923 180,630 2,931Futures 2,003,207 75 1,822,075 57Swaps 4,534,026 53,264 3,925,372 32,713
Interest-related 6,715,550 56,262 5,928,077 35,701of which exchange traded 1,226 139 25 103
Options 227,898 1,658 130,787 1,863Futures 677,737 12,158 666,221 11,096Swaps 1,838,641 28,444 1,802,621 29,017
Currency-related 2,744,276 42,260 2,599,629 41,976of which exchange traded 9 60
Options 13,019 1,124 13,078 1,721Futures 991 1,104Swaps 36,170 2,314 15,921 1,000
Equity-related 49,189 4,428 29,000 3,825of which exchange traded 721 2,041
Options 37,252 3,010 58,610 3,065Futures 54,981 8,780 52,439 10,564Swaps 18,687 723 36,699 1,742
Other 110,920 12,513 147,748 15,371of which exchange traded 31,443 5,071 7,454 6,018
TOTAL 9,619,936 115,463 8,704,454 96,872of which exchange traded 32,669 5,941 7,479 8,222
Group, 2017
Options 127,819 2,719 194,210 3,949Futures 2,026,323 127 2,379,972 179Swaps 3,125,249 57,062 2,808,063 35,244
Interest-related 5,279,390 59,908 5,382,245 39,372
Options 202,288 2,082 195,228 2,225Futures 322,076 7,741 497,127 11,880Swaps 1,540,961 28,081 1,576,686 26,563
Currency-related 2,065,326 37,904 2,269,041 40,669of which exchange traded 3 42
Options 20,630 2,226 15,835 576Futures 62 29Swaps 120,991 1,060 168,563 1,322
Equity-related 141,621 3,349 184,398 1,928of which exchange traded 278 146
Options 43,648 1,801 58,023 2,550Futures 26,270 951 3,387 65Swaps 16,334 955 20,242 850
Other 86,252 3,708 81,652 3,465of which exchange traded 28,802 1,068 3,141 375
TOTAL 7,572,590 104,868 7,917,336 85,434of which exchange traded 28,802 1,349 3,141 563

Notes Financial statements
SEB Annual Report 2018 123
Note 21 continued Derivatives and hedge accounting
Positive replacement values Negative replacement values
Parent company, 2018 Nominal amount Book value Nominal amount Book value
Options 148,362 1,857 148,640 2,015Futures 2,001,981 74 1,822,050 57Swaps 4,538,798 52,667 3,928,277 33,651
Interest-related 6,689,140 54,598 5,898,967 35,723
Options 228,913 1,662 131,213 1,864Futures 501,649 12,152 509,422 11,081Swaps 1,831,138 28,066 1,811,430 27,544
Currency-related 2,561,699 41,879 2,452,065 40,490of which exchange traded 9 60
Options 13,019 1,124 13,063 1,721Futures 991 1,104Swaps 36,155 2,318 15,921 1,000
Equity-related 49,174 4,432 28,985 3,825of which exchange traded 721 2,041
Options 36,253 2,892 57,611 2,948Futures 53,838 8,758 51,296 10,542Swaps 18,687 723 36,699 1,742
Other 108,778 12,373 145,606 15,231of which exchange traded 29,301 4,931 5,312 5,878
TOTAL 9,408,792 113,282 8,525,623 95,269of which exchange traded 29,301 5,662 5,312 7,980
Parent company, 2017
Options 106,346 2,333 147,622 3,512Futures 2,026,323 127 2,379,972 179Swaps 3,135,062 56,290 2,825,626 36,531
Interest-related 5,267,731 58,750 5,353,220 40,223
Options 211,368 2,142 199,247 2,220Futures 349,973 8,272 492,378 11,783Swaps 1,553,851 28,080 1,640,304 27,434
Currency-related 2,115,192 38,494 2,331,929 41,438of which exchange traded 3 42
Options 20,665 2,232 15,803 599Futures 62 29Swaps 120,991 1,060 168,563 1,322
Equity-related 141,656 3,355 184,366 1,950of which exchange traded 278 146
Options 42,192 1,718 59,493 2,467Futures 25,890 948 3,767 62Swaps 16,334 955 20,242 850
Other 84,417 3,621 83,502 3,379of which, cleared 26,952 981 4,991 289
TOTAL 7,608,996 104,220 7,953,016 86,990of which exchange traded 26,952 1,263 4,991 477

Financial statements Notes
SEB Annual Report 2018124
Note 21 continued Derivatives and hedge accounting
Hedge accounting
Accounting policyAs the International Accounting Standards Board issued the new accountingstandard IFRS 9 they provided entities with an accounting policy choicebetween applying the hedge accounting requirements in IFRS 9 or continuingto apply the existing hedge accounting requirements in IAS 39 for all hedgeaccounting. SEB has decided to continue to apply hedge accounting require-ments in IAS 39.
Risk management strategyThe Board of Directors defines how much market risk is acceptable by settingthe overall market risk limits and general instructions. The market risk toler-ance and limits are defined for the trading book, banking book and definedbenefit plans. The Group Risk Committee delegates the market risk mandateto the divisions and the treasury function, which in turn further allocate thelimits internally. The treasury function has overall responsibility for managingthese risks, which are consolidated centrally.
Risk category and designated risk exposureInterest rate risk is the designated risk exposure for fair value and cash flowhedge accounting. Interest rate risk in the banking book arises from changesin market interest rates as a result of mismatches in interest terms and interestrate periods on the balance sheet.
Fair value hedges and portfolio hedgesThe group holds a portfolio of long-term fixed rate mortgages and long-termfixed rate issued debt securities of which are exposed to fluctuations in fairvalue due to movements in market interest rates. The interest rate risk compo-nent is determined as the change in fair value of the long-term fixed rate mort-gages and issued debt securities arising solely from changes in discountingrates such as applicable IBOR rates. The group hedges a portion of its existinginterest rate risk from these financial assets and financial liabilities againstchanges in fair value. For this purpose the group are entering pay fixed/receivefloating interest rate swaps for hedging of long-term fixed rate mortgages andreceive fixed/pay floating interest swaps for hedging of long-term fixed rateissed debt securities thus resulting in fixed interest rates on the hedged itembeing swapped to floating interest rates. The hedges are executed item by itemfor long-term fixed rate issued debt securities and by aggregation of itemsgrouped by maturity for long-term fixed rate mortgages.
Sources of hedge ineffectivenessThe effectiveness of the hedge strategy is assessed by the degree to whichchanges in fair value of the hedged item that are attributable to the changesin benchmark rate used for discounting are offset by changes in fair value of thehedging instrument. Possible sources of hedge ineffectiveness are as follows:(i) the discounted cash flow from floating rate payments from the hedging instru-
ment does not have an equivalent cash flow from the long-term fixed mort-gages or issued debt securities thus give rise to hedge inefficiencies;
(ii) deviations in critical factors between the hedged item and the fixed rate legin the hedging instrument (‘proxy bond’) will give rise to hedge inefficiencies;
(iii) different benchmark rates used for discounting of the hedged item and thehedging instrument. For example the use of either secured or unsecuredbenchmark rate depending on the collaterialised characteristisc of hedginginstrument while unsecured benchmark rates are applied for the hedged item;
(iv) funding value adjustments which impacts the fair value of hedging instru-ments for which central counterparty clearing is not applied. Equivalent fairvalue adjustment is not applicable for the hedged item.
Cash flow hedgesThe group holds a portfolio of lending and deposits with floating interest ratesof which are exposed to fluctuations in cash flow due to movements in marketinterest rates. The interest rate risk component is determined as the variabilityin cash flows from floating rate lending and floating rate deposits arising solelyfrom changes in applicable benchmark rates. The group hedges a portion of itsexisting exposure from these financial assets and financial liabilities againstvariability in cash flows. For this purpose the group are entering interest rateswaps where the net exposures of lending and deposits with floating rates areswapped to fixed interest. Group either pays or receives the fixed leg of theinterest rate swap depending on whether volumes on floating rate lending out-weighs floating rate deposits or vice versa. Interest flows from deposits andlending with floating interest rates are expected to be amortised to profit orloss during the period 2018 to 2037.
Sources of hedge ineffectivenessThe effectiveness of the hedge strategy is assessed by the degree to whichchanges in present value of the hedged expected future cash flows that areattributable to the changes in benchmark rate used for estimating future cashflows are offset by changes in fair value of the hedging instrument. Possiblesources of hedge ineffectiveness are as follows:(i) deviations in critical factors between the hedged item (‘hypothetical deriva-
tive’) and the floating rate leg in the hedging instrument will give rise to hedgeinefficiencies;
(iI) funding value adjustments which impacts the fair value of hedging instrumentsfor which central counterparty clearing is not applied. Equivalent fair valueadjustment is not applicable for the hedged item.
Net investment hedgesThe group hedges the currency translation risk of net investments in foreignoperations through currency borrowings. Borrowing in foreign currency at anamount of SEK 31,314m (33,357) were designated as hedges of net invest-ments in foreign operations. Ineffectiveness in the hedges has been reportedin Net financial income (note 6).
Hedging instrumentsPositive replacement values Negative replacement values
Group, 2018 Nominal amount Book valueChange in
value 2018 Nominal amount Book valueChange in
value 2018
Derivatives 386,505 4,372 –41 44,892 0 –126
Fair value hedges of interest rate risk 386,505 4,372 –41 44,892 0 –126
Derivatives 10,750 0 3 84,400 10 –15
Portfolio fair value hedges of interest rate risk 10,750 0 3 84,400 10 –15
Derivatives 39,990 723 –1,129 28,750 707 –15
Portfolio cash flowhedges of interest rate risk 39,990 723 –1,129 28,750 707 –15
TOTAL 437,245 5,095 –1,167 158,043 717 –157
Group, 2017
Derivatives 240,568 5,294 1,148 140,268 122 –4,869
Fair value hedges of interest rate risk 240,568 5,294 1,148 140,268 122 –4,869
Derivatives 4,000 21 13 72,650 0 –91
Portfolio fair value hedges of interest rate risk 4,000 21 13 72,650 0 –91
Derivatives 54,222 1,273 –1,622 50,115 741 65
Portfolio cash flowhedges of interest rate risk 54,222 1,273 –1,622 50,115 741 65
TOTAL 298,790 6,587 –461 263,033 863 –4,895

Notes Financial statements
SEB Annual Report 2018 125
Note 21 continued Derivatives and hedge accounting
Fair value hedges of interest rate risk
Group, 2018 Book value
The accumulated amount offair value hedge adjustmentson the hedged item included
in the carrying amount
The change in value ofthe hedged item used as thebasis for recognizing hedge
ineffectiveness for the period
Remainingaccumulated
adjustments fordiscontinuedmicro hedges
Hedgeineffectiveness
recognized inprofit or loss
IncomeStatementNet other Income –42
Balance sheetDebt securities issued 440,227 –3,913 125
Fair value hedges of interest rate risk 440,227 –3,913 125 –42
IncomeStatementNet other Income –7
Balance sheetLoans to the public 189,373Fair value changes of hedged itemsin a portfolio hedge 38 5 –7
Portfolio fair value hedges of interest rate risk 189,373 38 5 –7 –7
TOTAL 629,600 –3,876 130 –7 –49
Group, 2017
IncomeStatementNet other Income 30
Balance sheetDebt securities issued 388,685 –4,125 3,751 –16
Fair value hedges of interest rate risk 388,685 –4,125 3,751 –16 30
IncomeStatementNet other Income –105
Balance sheetLoans to the public 174,943Fair value changes of hedged itemsin a portfolio hedge 32 –26 985
Portfolio fair value hedges of interest rate risk 174,943 32 –26 985 –105
TOTAL 563,628 –4,093 3,725 969 –74
Portfolio cash flow hedges of interest rate risk
Group, 2018
The change in value ofthe hedged item used as thebasis for recognizing hedge
ineffectiveness for the period
The balancesin the cash flow
reserve
Hedging gains/losses ofthe reporting period thatwere recognized in other
comprehensive income
Hedgeineffectiveness
recognized inprofit or loss
IncomeStatement –13Net other Income
Statement of comprehensive incomeCash flow hedges –1,132
Balance sheetLoans to the public and deposits and borrowing from the public 1,132
EquityCash flow hedges 313
TOTAL 1,132 313 –1,132 –13
Group, 2017
IncomeStatement –10Net other Income
Statement of comprehensive incomeCash flow hedges –1,547
Balance sheetLoans to the public and deposits and borrowing from the public 1,547
EquityCash flow hedges 1,192
TOTAL 1,547 1,192 –1,547 –10

Financial statements Notes
SEB Annual Report 2018126
Note 21 continued Derivatives and hedge accounting
Hedging instrumentsPositive replacement values Negative replacement values
Parent company, 2018 Nominal amount Book valueChange in
value 2018 Nominal amount Book valueChange in
value 2018
Derivatives 386,505 4,372 –42 44,892 0 –126
Fair value hedges of interest rate risk 386,505 4,372 –42 44,892 0 –126
Derivatives 10,750 0 3 84,400 10 –15
Portfolio fair value hedges of interest rate risk 10,750 0 3 84,400 10 –15
Derivatives 39,990 723 –1,129 28,750 707 –15
Portfolio cash flowhedges of interest rate risk 39,990 723 –1,129 28,750 707 –15
TOTAL 437,245 5,095 –1,168 158,043 717 –157
Parent company, 2017
Derivatives 240,568 5,294 1,142 140,268 122 –4,869
Fair value hedges of interest rate risk 240,568 5,294 1,142 140,268 122 –4,869
Derivatives 4,000 21 13 72,650 0 20
Portfolio fair value hedges of interest rate risk 4,000 21 13 72,650 0 20
Derivatives 54,222 1,273 –1,622 50,115 741 65
Portfolio cash flowhedges of interest rate risk 54,222 1,273 –1,622 50,115 741 65
TOTAL 298,790 6,587 –468 263,033 863 –4,784
Fair value hedges of interest rate risk
Parent company, 2018 Book value
The accumulated amount offair value hedge adjustmentson the hedged item included
in the carrying amount
The change in value of thehedged item used as the
basis for recognizing hedgeineffectiveness for the period
Remainingaccumulated
adjustments fordiscontinuedmicro hedges
Hedgeineffectiveness
recognized inprofit or loss
IncomeStatementNet other Income –42
Balance sheetDebt securities issued 440,227 –3,913 126
Fair value hedges of interest rate risk 440,227 –3,913 126 –42
IncomeStatementNet other Income –7
Balance sheetLoans to the public 189,373Fair value changes of hedged itemsin a portfolio hedge 38 5
Portfolio fair value hedges of interest rate risk 189,373 38 5 –7
TOTAL 629,600 –3,876 131 0 –49
Parent company, 2017
IncomeStatementNet other Income 29
Balance sheetDebt securities issued 388,685 –4,125 3,757
Fair value hedges of interest rate risk 388,685 –4,125 3,757 29
IncomeStatementNet other Income –20
Balance sheetLoans to the public 174,943Fair value changes of hedged itemsin a portfolio hedge 32 –52
Portfolio fair value hedges of interest rate risk 174,943 32 –52 –20
TOTAL 563,628 –4,093 3,705 0 10

Notes Financial statements
SEB Annual Report 2018 127
Note 21 continued Derivatives and hedge accounting
Portfolio cash flow hedges of interest rate risk
Parent company, 2018
The change in value ofthe hedged item used as thebasis for recognizing hedge
ineffectiveness for the period
The balancesin the cash flow
reserve
Hedging gains/losses ofthe reporting period thatwere recognized in other
comprehensive income
Hedgeineffectiveness
recognized inprofit or loss
IncomeStatement –13Net other Income
Statement of comprehensive incomeCash flow hedges –1,132
Balance sheetLoans to the public and deposits and borrowing from the public 1,132
EquityCash flow hedges 313
TOTAL 1,132 313 –1,132 –13
Parent company, 2017
IncomeStatement –10Net other Income
Statement of comprehensive incomeCash flow hedges –1,547
Balance sheetLoans to the public and deposits and borrowing from the public 1,547
EquityCash flow hedges 1,192
TOTAL 1,547 1,192 –1,547 –10

Financial statements Notes
SEB Annual Report 2018128
22 Investments in subsidiaries and associatesGroup Parent company
2018 2017 2018 2017
Investments in associates 1,052 1,176 947 1,032Shares in subsidiaries 142 137 50,653 50,567
TOTAL 1,195 1,314 51,600 51,599
Investments in associates
Strategic investments 295 334 189 190Venture capital holdings 758 842 758 842
TOTAL 1,052 1,176 947 1,032
Strategic investments Assets1) Liabilities1) Revenues1) Profit or loss1) Book value Ownership, %
Bankomat AB, Stockholm 5,251 4,881 782 11 67 20BGC Holding AB, Stockholm 750 159 828 –45 103 33Getswish AB, Stockholm 119 57,175 89 6 19 20USE Intressenter AB, Stockholm 0 28
Parent companyholdings 189
Holdings of subsidiaries 17
Groupadjustments 88
GROUPHOLDINGS 295
1) Retrieved from respective Annual report 2017.
2018 2017
Venture capital holdings Book value Ownership, % Book value Ownership, %
Actiwave, Linköping 0 42Airsonett AB, Ängelholm 18 33 100 33Apica AB, Stockholm 39 28 60 25Avaj International Holding AB, Stockholm 149 18Avidicare Holding AB, Ängelholm 22 37 17 38Capres A/S, Copenhagen 136 42 39 45Coinify ApS, Herlev 12 18 15 16InDex Pharmaceuticals Holding AB, Stockholm 94 21 67 23Leasify AB, Stockholm 10 19 10 17Now Interact Nordic AB, Stockholm 11 11 15 10NuEvolution AB, Stockholm 156 20 167 24OssDsign AB, Uppsala 61 24 25 22Scandinova Systems AB, Uppsala 78 30 63 30Scibase Holding AB, Stockholm 7 13 16 13Senion AB, Linköping 19 34 19 34TSS Holding AB, Stockholm 95 43 80 43
Parent companyholdings 758 842
GROUPHOLDINGS 758 842
Information about the corporate registration numbers and numbers of shares of the associates is available upon request.
Strategic investments in associates in the group are accounted for usingthe equity method.
Investments in associates held by the venture capital organisation ofthe group have, in accordance with IAS 28, been designated as at fair valuethrough profit and loss.
Some entities, in which the bank has an ownership of less than 20 per cent,has been classified as investments in associates. The reason is that the bankis represented in the board of directors and participates in the policy makingprocesses of those entities.
All financial assets within the group’s venture capital business are managedand its performance is evaluated on a fair value basis in accordance withdocumented risk management and investment strategies.
Fair values for investments listed in an active market are based on quotedmarket prices. If the market for a financial instrument is not active, fair valueis established by using valuation techniques based on discounted cash flowanalysis, valuation with reference to financial instruments that is substan-tially the same, and valuation with reference to observable market transac-tions in the same financial instrument.

Notes Financial statements
SEB Annual Report 2018 129
Note 22 continued Investments in subsidiaries and associates
Shares in subsidiaries
Group Parent company
2018 2017 2018 2017
Swedish subsidiaries 15,646 14,228Foreign subsidiaries 1) 142 137 35,007 36,339
TOTAL 142 137 50,653 50,567of which holdings in credit institutions 33,755 33,264
2018 2017
Swedish subsidiaries Country Book value Dividend Ownership, % Book value Dividend Ownership, %
Aktiv Placering AB, Stockholm Sweden 38 100 38 100Enskilda Kapitalförvaltning SEB AB, Stockholm Sweden 0 100 0 100Försäkringsaktiebolaget Skandinaviska Enskilda Captive,Stockholm Sweden 100 100 100 100Parkeringshuset Lasarettet HGB KB, Stockholm Sweden 0 99 0 99Repono Holding AB, Stockholm Sweden 3,227 100 3,227 100SEB Förvaltnings AB, Stockholm Sweden 5 100 5 100SEB Internal Supplier AB, Stockholm Sweden 12 100 12 100SEB Investment Management AB, Stockholm Sweden 541 100 523 430 100SEB Kort Bank AB, Stockholm Sweden 3,760 508 100 2,360 1,096 100SEB Life and Pension Holding AB, Stockholm Sweden 6,424 5,000 100 6,424 2,500 100SEB Portföljförvaltning AB, Stockholm Sweden 1,115 100 1,115 100SEB Strategic Investments AB, Stockholm Sweden 424 100 424 100Skandinaviska Kreditaktiebolaget, Stockholm Sweden 0 100 0 100
TOTAL 15,646 5,508 14,228 4,026
Foreign subsidiaries
Baltectus B.V., Amsterdam Netherlands 0 214 100 167 100Domena Property Sp. Z o.o., Warsaw Poland 130 100Postep Property Sp. Z o.o., Warsaw Poland 55 100DSK Hyp AG, (former SEB AG), Frankfurt am Main Germany 16,563 300 100 18,521 100SEB Bank JSC, St Petersburg Russia 458 100 458 100SEB Banka, AS, Riga Latvia 1,853 730 100 1,682 701 100SEB bankas, AB, Vilnius Lithuania 6,750 1,107 100 6,423 1,175 100SEB Corporate Bank, PJSC, Kiev Ukraine 138 100 138 100SEB do Brasil Representacões LTDA, Sao Paulo Brazil 0 100 0 100SEB Fondbolag Finland Ab, Helsinki Finland 19 100SEB Fund Services S.A., Luxembourg Luxembourg 115 100 100SEB Hong Kong Trade Services Ltd, Hong Kong China 0 100SEB Kapitalförvaltning Finland Ab, Helsinki Finland 255 100SEB Leasing Oy, Helsinki Finland 4,555 100 4,273 82 100SEB Njord AS, Oslo Norway 0 100 0 100SEB Pank, AS, Tallinn Estonia 2,706 716 100 2,260 286 100SEB Securities Inc, New York USA 48 100 40 100Skandinaviska Enskilda Banken S.A., Luxembourg Luxembourg 1,528 214 100 1,422 145 100Skandinaviska Enskilda Ltd, London Great Britain 409 100 395 100
TOTAL 35,007 3,396 36,339 2,389
Information about the corporate registration numbers and numbers of shares of the subsidiaries is available upon request.
1) Some dormant subsidiaries in the group are consolidated using the equity method.
Significant restrictions on the ability to use assetsand settle liabilities of the groupSkandinaviska Enskilda Banken AB (Publ) can obtain distributions of capital,use assets and settle liabilities of members of the group within the limitation ofsome regulatory, statutory and contractual restrictions. These restrictions are:
Regulatory requirementsRegulated subsidiaries are subject to prudential regulatory capital require-ments in the countries in which they are regulated. These subsidiaries arerequired to maintain a certain level of own funds in relation to their exposures,restricting their ability to distribute cash or other assets to the parent com-pany. To meet these requirements the subsidiaries hold capital instrumentsand other forms of subordinated liabilities.
Statutory requirementsSubsidiaries are required to have a certain level of solvency and are restrictedto make distributions of capital and profits leading to a solvency below thatlevel.
Contractual requirementsThe group pledges some of its financial assets as collateral for financing andliquidity purposes. Encumbered assets can’t be transferred within the Group.Such assets are described further in the note 48 Pledged assets.

Financial statements Notes
SEB Annual Report 2018130
23 Intangible assetsGroup Parent company
2018 Goodwill1)
Deferredacquisition
costs
InternallydevelopedIT-systems
Otherintangible
assets Total Goodwill1)
InternallydevelopedIT-systems
Otherintangible
assets Total
Opening balance 4,727 4,941 4,623 3,475 17,765 1,377 4,320 882 6,579Additions from acquisitions and capitalisations 259 580 89 928 477 69 546Reclassifications 657 –213 444Retirements and disposals –293 –132 –425 –293 –120 –413Exchange rate differences 35 64 11 80 191 2 –1 1
Acquisition value 4,762 5,921 4,920 3,300 18,903 1,377 4,506 830 6,713
Opening balance –3,660 –3,012 –3,062 –9,734 –1,377 –2,917 –687 –4,982Current year’s amortisations –337 –343 –137 –817 –320 –48 –369Reclassifications –657 –192 333 –515Retirements and disposals 293 132 425 293 120 413Exchange rate differences –41 –4 –61 –106 0 1 0
Accumulateddepreciations 0 –4,694 –3,257 –2,796 –10,746 –1,377 –2,944 –616 –4,937
TOTAL 4,762 1,227 1,663 505 8,157 1,561 215 1,776
1) Goodwill has an indefinite useful life. All other intangible assets have a definite useful life. Amortisation methods are described in note 1.
2017
Opening balance 4,760 12,695 3,911 3,845 25,211 1,377 3,668 749 5,794Effect of applying IFRS 152) –8,029 –8,029
Restated balance at 1 January 2017 4,760 4,666 3,911 3,845 17,182Additions from acquisitions and capitalisations 225 908 215 1,348 804 205 1,009Reclassifications 3 –549 –546Retirements and disposals1) –202 –87 –290 –151 –71 –222Exchange rate differences –33 50 4 52 72 –2 –1 –3
Acquisition value 4,727 4,941 4,623 3,475 17,765 1,377 4,320 882 6,579
Opening balance –8,651 –1,986 –3,169 –13,806 –1,377 –1,913 –481 –3,771Effect of applying IFRS 152) 5,389 5,389
Restated balance at 1 January 2017 –3,262 –1,986 –3,169 –8,417Current year’s amortisations2) –329 –438 –169 –936 –408 –52 –460Current year’s impairments –661 –312 –973 –661 –210 –872Reclassifications 547 547Retirements and disposals1) 75 77 153 65 55 120Exchange rate differences –69 –2 –37 –108 1 1
Accumulateddepreciations –3,660 –3,012 –3,062 –9,734 –1,377 –2,917 –687 –4,982
TOTAL 4,727 1,280 1,611 413 8,030 1,403 195 1,597
1) Including Items affecting comparability, see note 13.2) IFRS 15 Revenue from Contracts with Customers applied retrospectively from 1 January 2018. The main effect from IFRS 15 on SEB relates to the treatment of contract costs for invest-
ment contracts within Life that has changed so that a smaller part of deferred acquisition costs (DAC) is recognised as an asset. The change has resulted in a decrease of the deferredacquisition cost in the balance sheet of SEK 2,640m. The effect has been recognised as a reduction of the opening balance of retained earnings as of 1 January 2017. Similarly, net feesand commissions in the 2017 income statement has been restated reducing income by SEK 47m. These changes are included in the restated balance sheet. For transition disclosures,see note 53.
Goodwill
The Cash Generating Units (CGU) structure is aligned with the business unit (BU) combined with geography to reflect the importance of steering and measuringthe customer-oriented organisation.
CGUsAcquisition
yearOpening
balance 2017Exchange rate
differencesClosing
balance 2017Exchange rate
differencesClosing
balance 2018
Card, Norway & Denmark1) 2002/2004 913 –33 880 35 915Life Sweden 1996/1997 2,343 2,343 2,343Investment Management Sweden 1997/1998 1,504 1,504 1,504
TOTAL 4,760 –33 4,727 35 4,762
1) The CGU:s are presented together since both acquisitions are related to the Eurocard business.
Impairment test 2018Result of impairment testThe yearly impairment test for 2018 was performed in the fourth quarter.The impairment test did not result in any indication of impairment.
Estimates and assumptions used: future cash flowsThe impairment test on goodwill is based on value in use and builds on the busi-ness plan for 2019–2021 and projected cash flows for 2022–2023. The long-term growth is based on expectations on inflation 1.5 per cent. The allocatedcapital is derived from the group’s internal capital allocation model that hasbeen aligned with the regulatory capital requirements including the manage-ment buffer. The cash flows in the business plan starts with the assumptionsfrom the most recent Nordic outlook published at the commencement of thisbusiness plan process. The main assumptions are; GDP growth in Sweden from2.2 per cent to 2.1 per cent over three years and other Nordic countries exclud-ing Sweden from 2.4 per cent to 2.0 per cent; inflation in Sweden 2.1 per cent
troughout the period and in Other Nordic countries from 1.5 per cent to 1.9 percent. The repo rate in Sweden is assumed to be 0.75 per cent end of 2020.
Estimates and assumptions used: Cost of Equity (CoE) – discount rateThe discount rate used is 9.5 per cent post-tax for SEB Group and is determinedbased on information from external sources and applied on all CGUs exceptInvestment Management. The higher discount rate for Investment Manage-ment, 11.5 per cent, is applied due to uncertainty related to limitations to retro-cessions, possible further margin squeeze and the current negative interestenvironment that can create squeezed asset prices and volatility.
SensitivitiesAn increase of one percentage of the discount rate (CoE), a decrease of theaverage growth rates by one percentage point for earnings before amortisa-tions during the projection period and a decrease of one percentage point ofthe long term growth was applied in the sensitivity analysis. The sensitivityanalysis carried out did not result in any indication of impairment.

Notes Financial statements
SEB Annual Report 2018 131
Impairment test 2017Result of impairment testThe yearly impairment test for 2017 was performed in the fourth quartercovering the four remaining CGUs with allocated goodwill. The impairmenttest did not result in any indication of impairment.
Estimates and assumptions used: future cash flowsThe impairment test on goodwill is based on value in use and builds on the busi-ness plan for 2018–2020 and projected cash flows for 2021–2022. The long-term growth is based on expectations on inflation 1.5 per cent. The allocatedcapital is derived from the group’s internal capital allocation model that hasbeen aligned with the regulatory capital requirements including the manage-ment buffer. The cash flows in the business plan starts with the assumptionsfrom the most recent Nordic outlook published at the commencement of thisbusiness plan process. The main assumptions are; GDP growth in Sweden from2.6 per cent to 2.2 per cent over three years and other Nordic countries exclud-ing Sweden from 2.3 per cent to 1.8 per cent; inflation in Sweden from 1.8 percent to 2.2 per cent and in Other Nordic countries from 1.1 per cent to 1.7 percent. The repo rate in Sweden is assumed to be 0.50 per cent end of 2019.
Estimates and assumptions used: Cost of Equity (CoE) – discount rateThe discount rate used is 9.0 per cent post-tax for SEB Group and is determinedbased on information from external sources and applied on all CGUs exceptInvestment Management. The higher discount rate for Investment Manage-ment, 11.0 per cent, is applied due to uncertainty related to limitations to retro-cessions, possible further margin squeeze and the current negative interestenvironment that can create squeezed asset prices and volatility.
SensitivitiesAn increase of one percentage of the discount rate (CoE), a decrease of theaverage growth rates by one percentage point for earnings before amortisa-tions during the projection period and a decrease of one percentage point ofthe long term growth was applied in the sensitivity analysis. The sensitivityanalysis carried out did not result in any indication of impairment.
24 Properties and equipmentGroup Parent company
2018 Equipment
Propertiesfor own
operations Total Equipment
Equipmentleased to
clients1)
Propertiesfor own
operations Total
Opening balance 2,500 28 2,528 1,410 48,903 2 50,316Additions from acquisitions and capitalisations 433 0 433 322 5,602 5,923Reclassifications –1 –1 –2Retirements and disposals –189 –189 –16 –5,616 –5,632Exchange rate differences 51 –2 49 6 6
Acquisition value 2,794 26 2,820 1,722 48,888 2 50,612
Opening balance –1,389 –9 –1,398 –568 –15,260 –15,829Current year’s depreciations –249 –1 –250 –160 –4,985 –5,144Current year’s impairments –3 –1 –4Reclassifications 1 0 2Retirements and disposals 179 1 180 13 3,995 4,008Exchange rate differences –50 1 –49 –16 377 361
Accumulateddepreciations –1,510 –9 –1,519 –731 –15,872 –16,603
TOTAL 1,284 17 1,300 991 33,016 2 34,009
2017
Opening balance 3,248 106 3,354 2,074 48,704 2 50,780Additions from acquisitions and capitalisations 562 563 473 5,158 5,631Reclassifications –63 –76 –138Retirements and disposals –1,281 –1 –1,282 –1,142 –4,959 –6,101Exchange rate differences 33 –1 32 6 6
Acquisition value 2,500 28 2,528 1,410 48,903 2 50,316
Opening balance –2,395 –51 –2,446 –1,582 –14,035 –15,617Current year’s depreciations –216 –5 –220 –127 –4,817 –4,944Current year’s impairments –4 –4Reclassifications –32 48 16Retirements and disposals 1,261 1 1,262 1,127 3,836 4,964Exchange rate differences –3 –3 –6 14 –246 –232
Accumulateddepreciations –1,389 –9 –1,398 –568 –15,260 –15,829
TOTAL 1,111 19 1,130 842 33,643 2 34,487
1) Equipment leased to clients are recognised as financial leases and presented as loans in the group. See note 51.

Financial statements Notes
SEB Annual Report 2018132
25 Investment properties2018 2017
Group
Investmentproperties
at cost
Investmentproperties
at fair value
Propertiestaken over for
protectionof claims Total
Investmentproperties
at cost
Investmentproperties
at fair value
Propertiestaken over for
protectionof claims Total
Opening balance 26 183 209 37 7,401 499 7,937Additions from acquisitions and capitalisations 11 4 15 6 768 3 777Reclassifications –9 –9 –7,097 –278 –7,375Retirements and disposals –22 –182 –204 –17 –1,374 –57 –1,449Exchange rate differences 1 5 6 53 16 69
Acquisition value 17 17 26 –250 183 –41
Opening balance –6 –5 –6 –86 –92Current year’s depreciations –1 –1 –1 –1 –2Current year’s impairments –57 –57Reclassifications 128 128Retirements and disposals 1 1 1 17 18Exchange rate differences 0 0 –1
Accumulateddepreciations –6 –6 –6 –5
Fair value changes 250 250
TOTAL 11 11 20 183 203
Net operating earnings from investment propertiesGroup
2018 2017
External income 563Operating costs1) –189
TOTAL 375
1) Direct operating expenses arising from investment property that did not generate rental income amounts to SEK 0m (0).
Net operating earnings from properties taken over for protection of claimsGroup
2018 2017
External income 7 19Operating costs –12 –41
TOTAL –5 –22
SEB may in specific cases acquire assets used as collateral when the loan is in default and the customer can no longer meetits obligations towards SEB. Properties are held and managed during a period with the intention to divest the assets whendeemed appropriate.
26 Other assetsGroup Parent company
2018 2017 2018 2017
Trade receivables 1,169 1,223 1,225 1,251Client receivables 12,826 11,817 12,429 11,620Other assets 6,403 3,816 7,411 5,280
TOTAL 20,398 16,856 21,065 18,151
27 Prepaid expenses and accrued incomeGroup Parent company
2018 2017 2018 2017
Prepaid expenses 1,775 1,500 1,762 2,323Accrued income 664 720 274 145Other 32 11 335 13
TOTAL 2,471 2,232 2,371 2,481

Notes Financial statements
SEB Annual Report 2018 133
28 DepositsGroup Parent company
2018 2017 2018 2017
Deposits 47,830 44,243 47,830 44,242
Deposits fromcentral banks 47,830 44,243 47,830 44,242
Deposits 70,002 40,646 95,262 81,014Margins of safety 17,296 8,930 16,915 8,575Repos 192 730 15 730Registered bonds1) 399 942
Deposits fromcredit institutions 87,889 51,247 112,192 90,319
General governments 26,712 16,834 16,956 7,781Financial corporations 226,434 213,345 206,272 195,648Non-financial corporations 461,219 431,805 414,352 378,162Households 323,100 300,318 236,954 226,820Margins of safety 49,424 35,325 49,292 35,184Repos 3,396 5,883 3,396 5,884Registered bonds1) 21,103 28,537
Deposits andborrowings from thepublic 1,111,390 1,032,048 927,224 849,479
TOTAL 1,247,109 1,127,538 1,087,246 984,039
1) Of which SEK 8,911m at Fair Value Through Profit or Loss Designated (FVDPL) for the group. The group’s contractual liability is SEK 6,951m. Difference between carrying amountand the amount the company is contractually obligated to pay to holders of registered bonds at maturity are, for the group SEK 1,960m. The accumulated impact from reflectingthe group’s own credit standing in the fair value measurement amounts to SEK 166m, of which SEK –210m relates to 2018.
For registered bonds at Fair Value Through Profit or Loss Designated (FVDPL)change in fair value attributable to change in credit risk is determined, by firstdetermining the changes due to market conditions which give rise to marketrisk, and then deducting those changes from the total change in fair value ofthe registered bonds. Market conditions which give rise to market risk include
changes in the benchmark interest rate.The company believes that this approach most faithfully represents the
amount of change in fair value due to own credit risk, as the changes in factorscontributing to the fair value of the registered bonds other than changes in thebenchmark interest rate are not deemed to be significant.
29 Liabilities to policyholdersGroup
Financial liabilities for which the customers bear the investment risk1) 2018 2017
Opening balance 284,291 296,618Reclassification to liabilities of disposal groups classified as held for sale –37,323Change in investment contract provisions2) –15,827 24,445Exchange rate differences 2,092 551
TOTAL 270,556 284,291
1) Insurance provisions where the policyholders are carrying the risk. The liabilities and the underlying assets are reported at fair value.2) The net of premiums received during the year, return on investment funds less payments to the policyholders and deduction of fees and
policyholders’ tax.
Group
Liabilities to policyholders 2018 2017
Opening balance 18,911 107,213Transfer of portfolios through divestments –792Reclassification to liabilities of disposal groups classified as held for sale –93,910Change in other insurance contract provisions1) 2,844 5,696Exchange rate differences 90 705
TOTAL 21,846 18,911
1) The net of premiums received during the year, allocated return on investment funds less payments to the policyholders and deduction offees and policyholders’ tax.

Financial statements Notes
SEB Annual Report 2018134
30 Debt securities issuedGroup Parent company
2018 2017 2018 2017
Senior bonds1) 203,729 197,691 203,528 196,659Covered bonds 334,244 333,272 334,244 330,641Commercial Papers/Certificates of Deposits 142,697 83,069 142,624 82,992
TOTAL 680,670 614,033 680,396 610,292
1) Of which SEK 18,518m (24,388) at Fair Value Through Profit or Loss Designated (FVDPL) for the group and 18,316m (23,356) at Fair Value Through Profit or Loss Designated (FVDPL)for the parent company. The group’s contractual liability is SEK 19,310m (22,190) and for the parent company SEK 19,110m (21,323). Difference between carrying amount andthe amount the company is contractually obligated to pay to holders of issed securities at maturity are, for the group SEK –792m (2,198) and for the parent company SEK –794m(2,033). The accumulated impact from reflecting the group’s own credit standing in the fair value measurement amounts to SEK 34m (264), of which SEK –113m (33) relates to2018. The corresponding amount for the parent company is SEK 34m (205), of which SEK –113m (57) relates to 2018.
For issued securities at Fair Value Through Profit or Loss Designated (FVDPL)change in fair value attributable to change in credit risk is determined, by firstdetermining the changes due to market conditions which give rise to marketrisk, and then deducting those changes from the total change in fair value ofthe issued securities. Market conditions which give rise to market risk includechanges in the benchmark interest rate. Fair value movements on the embed-
ded derivatives are excluded from the assessment of market risk fair valuechanges.
The company believes that this approach most faithfully represents theamount of change in fair value due to own credit risk, as the changes in factorscontributing to the fair value of the issued securities other than changes in thebenchmark interest rate are not deemed to be significant.
31 Short positionsGroup Parent company
2018 2017 2018 2017
Equity instruments 13,498 14,228 13,498 14,228Debt securities 9,646 10,757 9,646 10,757
TOTAL 23,144 24,985 23,144 24,985
32 Other liabilitiesGroup Parent company
2018 2017 2018 2017
Trade payables 1,305 2,248 1,023 1,939Client payables 9,572 10,894 8,509 9,843Other liabilities 13,117 13,430 7,010 7,685
TOTAL 23,995 26,572 16,543 19,467
33 Accrued expenses and prepaid incomeGroup Parent company
2018 2017 2018 2017
Accrued expenses 3,845 3,917 2,659 2,583Prepaid income 1,351 1,372 145 143Other 65 27 66 55
TOTAL 5,260 5,316 2,871 2,781

Notes Financial statements
SEB Annual Report 2018 135
34 ProvisionsGroup Parent company
2018 2017 2018 2017
Other restructuring and redundancy reserves 550 810 3 28Provisions for Financial guarantees and Loan commitments (note 18) 474 75 382 47Other provisions 793 799 38
TOTAL 1,817 1,684 385 113
Other restructuring and redundancy reserves
Opening balance 810 642 28 35Additions 1 429Amounts used –215 –278 –7Unused amounts reversed –3Other movements –80 –25Exchange differences 34 20
TOTAL 550 810 3 28
The main part of the reserve will cover redundancy costs to be used within four years.
Other provisions
Opening balance 799 829 38 45Additions 108 93 30Amounts used –113 –20 –68 –7Unused amounts reversed –15 –30Other movements –80Exchange differences 14 7
TOTAL 793 799 0 38
Other provisions mainly consist of costs for re-organisation within the groupto be used within five years and unsettled claims covering all operating seg-
ments; among others in the divested German retail business to be settledwithin one year.
35 Subordinated liabilitiesGroup Parent company
2018 2017 2018 2017
Debenture loans 18,987 18,171 18,987 18,171Debenture loans, perpetual 15,251 13,922 15,251 13,922Change in the value due to hedge accounting at fair value –7 25 –7 25Accrued interest 290 272 290 272
TOTAL 34,521 32,390 34,521 32,390
Debenture loans
CurrencyOriginal nom.
amount Book valueRate of
interest, %
2014/2026 EUR 1,000 10,263 2.5002016/2028 EUR 850 8,724 1.380
TOTAL 18,987
Debenture loans, perpetual
CurrencyOriginal nom.
amount Book valueRate of
interest, %
2017 EUR 500 5,383 5.6252014 USD 1,100 9,868 5.750
TOTAL 15,251

Financial statements Notes
SEB Annual Report 2018136
36 Untaxed reserves 1)
Parent company
2018 2017
Depreciation in excess of plan on office equipment/leased assets 20,855 21,423Other untaxed reserves 0 6
TOTAL 20,855 21,429
1) In the balance sheet of the group untaxed reserves are reclassified partly as deferred tax liability and partly as restricted equity.
Parent companyExcess
depreciationOther untaxed
reserves Total
Opening balance 21,755 6 21,761Reversals –332 –332
Closingbalance2017 21‚423 6 21‚429
Reversals –568 –568Exchange rate differencies –6 –6
CLOSINGBALANCE2018 20,855 0 20,855
37 Fair value measurement of assets and liabilities2018 Group Parent company
Assets
Quotedprices in
activemarkets(Level 1)
Valuationtechnique using
observableinputs (Level 2)
Valuationtechnique usingnon-observableinputs (Level 3) Total
Quotedprices in
activemarkets(Level 1)
Valuationtechnique using
observableinputs (Level 2)
Valuationtechnique usingnon-observableinputs (Level 3) Total
Loans 100,037 100,037 100,037 100,037Debt securities 62,812 76,976 4 139,792 34,711 66,948 101,659Equity instruments 38,697 3,835 7,902 50,434 33,317 1,576 2,099 36,993Financial assets for which the customersbear the investment risk 261,056 7,943 614 269,613Derivatives – Interest related 75 50,583 510 51,168 74 48,920 510 49,503Derivatives – Equity related 562 3,865 4,427 562 3,869 0 4,432Derivatives – Currency related 550 41,710 42,260 85 41,794 41,879Derivatives – Credit related 683 683 683 683Derivatives – Commodities related 11,690 11,690 11,690 11,690Derivatives – Other related 140 140Derivatives – Hedge accounting 5,095 5,095 5,095 5,095Investment in associates1) 256 501 758 256 501 758
TOTAL 364,148 302,417 9,531 676,096 69,005 280,614 3,110 352,729
Liabilities
Deposits 12,497 12,497 3,411 3,411Financial liabilities for which the customersbear the investment risk 262,029 7,924 603 270,556Liabilities to policyholders 21,752 95 21,847Debt securities issued 18,518 18,518Short positions debt securities 5,275 4,371 9,646 5,275 4,371 9,646Short positions equity instruments 13,435 63 13,498 13,435 0 63 13,498Derivatives – Interest related 57 34,453 473 34,983 57 34,486 473 35,015Derivatives – Equity related 1,408 2,416 3,824 1,409 2,416 3,825Derivatives – Currency related 1,011 40,965 41,976 46 40,443 40,490Derivatives – Credit related 1,744 1,744 1,744 1,744Derivatives – Commodities related 13,488 13,488 13,488 13,488Derivatives – Other related 140 140Derivatives – Hedge accounting 717 717 708 708Other financial liabilities 18 3,595 3,613 18 3,595 3,613Debt securities at fair value throughprofit and loss 18,316 18,316
TOTAL 305,125 140,783 1,139 447,047 20,240 122,976 536 143,753

Notes Financial statements
SEB Annual Report 2018 137
Note 37 continued Fair value measurement of assets and liabilities
2017 Group Parent company
Assets
Quotedprices in
activemarkets(Level 1)
Valuationtechnique using
observableinputs (Level 2)
Valuationtechnique usingnon-observableinputs (Level 3) Total
Quotedprices in
activemarkets(Level 1)
Valuationtechnique using
observableinputs (Level 2)
Valuationtechnique usingnon-observableinputs (Level 3) Total
Financial assets– policyholders bearing the risk 275,737 7,053 630 283,420
Equity instruments at fair value throughprofit and loss 51,971 3,493 1,787 57,251 47,599 599 181 48,379Debt securities at fair value throughprofit and loss 55,995 73,849 571 130,415 40,391 68,867 109,258Derivatives – Interest related 127 52,514 686 53,327 127 51,282 761 52,170Derivatives – Equity related 251 3,096 2 3,349 251 3,102 2 3,355Derivatives – Currency related 786 37,118 37,904 73 38,421 38,494Derivatives – Credit related 950 950 950 950Derivatives – Commodities related 2,672 2,672 2,672 2,672Derivatives – Other related 86 86Derivatives – Hedge accounting 6,580 6,580 6,580 6,580Equity instruments available-for-sale 111 1,080 627 1,818 69 1,049 474 1,592Debt securities available-for-sale 15,631 10,192 25,823 6,197 2,605 8,802Non-current assets and disposal groupsclassified as held for sale 89,229 63,657 29,550 182,436Investment in associates1) 251 592 843 250 592 842
TOTAL 490,175 262,254 34,445 786,874 94,957 176,127 2,010 273,094
Liabilities
Liabilities to policyholders– investment contracts 276,482 7,185 624 284,291
Short positions equity instruments 13,984 244 14,228 13,984 244 14,228Short positions debt securities 6,206 4,603 10,809 6,206 4,603 10,809Derivatives – Interest related 179 37,531 799 38,509 179 38,382 799 39,360Derivatives – Equity related 80 1,848 1,928 80 1,870 1,950Derivatives – Currency related 565 40,103 40,668 71 41,367 41,438Derivatives – Credit related 2,598 2,598 780 780Derivatives – Commodities related 780 780 2,598 2,598Derivatives – Other related 863 863Derivatives – Hedge accounting 86 86 863 863Other financial liabilities 3,842 3,842 3,842 3,842Debt securities at fair value throughprofit and loss 24,388 24,388 23,356 23,356Liabilities of disposal groups classifiedas held for sale 21,055 42,536 8,899 72,490
TOTAL 318,637 166,277 10,566 495,480 20,520 117,661 1,043 139,224
1) Venture capital activities designated at fair value through profit and loss.
Fair valuemeasurementThe objective of the fair value measurement is to arrive at the price at which anorderly transaction would take place between market participants at the meas-urement date under current market conditions.
The group has an established control environment for the determination of fairvalues of financial instruments that includes a review, independent from the busi-ness, of valuation models and prices. If the validation principles are not adheredto, the Head of Group Finance shall be informed. Exceptions of material and prin-cipal importance require approval from the GRMC (Group Risk MeasurementCommittee) and the ARC (Accounting Reporting Committee).
In order to arrive at the fair value of a financial instrument SEB uses differentmethods; quoted prices in active markets, valuation techniques incorporatingobservable data and valuation techniques based on internal models. For disclo-sure purposes, financial instruments carried at fair value are classified in a fairvalue hierarchy according to the level of market observability of the inputs.Group Risk classifies and continuously reviews the classification of financialinstruments in the fair value hierarchy. The valuation process is the same forfinancial instruments in all levels.
An active market is one in which transactions occur with sufficient volume andfrequency to provide pricing information on an ongoing basis. The objective is toarrive at a price at which a transaction without modification or repackagingwould occur in the principal market for the instrument to which SEB has immedi-ate access.
Fair value is generally measured for individual financial instruments, in addi-
tion portfolio adjustments are made to cover the credit risk. To reflect counter-party risk and own credit risk in OTC derivatives, adjustments are made based onthe net exposure towards each counterpart. These adjustments are calculatedon a counterparty level based on estimates of exposure at default, probability ofdefault and recovery rates. Probability of default and recovery rate informationis generally sourced from the CDS markets. For counterparties where this infor-mation is not available, or considered unreliable due to the nature of the expo-sure, alternative approaches are taken where the the probability of default isbased on generic credit indices for specific industry and/or rating. The impactfrom these adjustments are shown in note 6.
When valuing financial liabilities at fair value own credit standing is reflected.Fair values of financial assets and liabilities by class can be found in note 38.
In order to arrive at the fair value of investment properties a market partici-pant’s ability to generate economic benefit by using the asset in its highest andbest use are taken into account. The highest and best use takes into account theuse of the asset that is physically possible, legally permissible and financially fea-sible. The current use of the investment properties in SEB is in accordance withthe highest and best use. The valuation of investment properties is described inthe accounting policies in note 1. The valuation of the investment properties isperformed semi-annually, they are presented and approved by the board in eachreal estate company. The valuation principles used in all entities are in accord-ance with regulations provided by the local Financial Supervisory Authorities(FSA) which is in accordance with international valuation principles and inaccordance with IFRS.

Financial statements Notes
SEB Annual Report 2018138
Level 1: Quotedmarket pricesValuations in Level 1 are determined by reference to unadjusted quoted marketprices for identical instruments in active markets where the quoted prices arereadily available and the prices represent actual and regularly occurring markettransactions on an arm’s length basis.
Examples of Level 1 financial instruments are listed equity securities, debtsecurities, and exchange-traded derivatives. Instruments traded in an activemarket for which one or more market participants provide a binding price quota-tion on the balance sheet date are also examples of Level 1 financial instruments.
Level 2: Valuation techniqueswith observable inputsIn Level 2 valuation techniques, all significant inputs to the valuation models areobservable either directly or indirectly. Level 2 valuation techniques include usingdiscounted cash flows, option pricing models, recent transactions and the priceof another instrument that is substantially the same.
Examples of observable inputs are foreign currency exchange rates, bindingsecurities price quotations, market interest rates (Stibor, Libor, etc.), volatilitiesimplied from observable option prices for the same term and actual transactionswith one or more external counterparts executed by SEB. An input can transferfrom being observable to being unobservable during the holding period due toe.g. illiquidity of the instrument. Examples of Level 2 financial instruments aremost OTC derivatives such as options and interest rate swaps based on the Liborswap rate or a foreign-denominated yield curve. Other examples are instrumentsfor which SEB recently entered into transactions with third parties and instru-ments for which SEB interpolates between observable variables.
Level 3: Valuation techniqueswith significant unobservable inputsLevel 3 valuation techniques incorporate significant inputs that are unobserva-ble. These techniques are generally based on extrapolating from observableinputs for similar instruments, analysing historical data or other analytical tech-niques. Examples of Level 3 financial instruments are more complex OTC deriva-tives, long dated options for which the volatility is extrapolated or derivativesthat depend on an unobservable correlation. Other examples are instrumentsfor which there is currently no active market or binding quotes, such as unlistedequity instruments and private equity holdings.
If the fair value of financial instruments includes more than one unobservableinput, the unobservable inputs are aggregated in order to determine the classifi-cation of the entire instrument. The level in the fair value hierarchy within whicha financial instrument is classified is determined on the basis of the lowest levelof input that is significant to the fair value in its entirety.
Significant transfers and reclassifications between levelsTransfers between levels may occur when there are indications that market con-ditions have changed, e.g. a change in liquidity. The Valuation/Pricing committe ofeach relevant division decides on material shifts between levels. At the end of thethird quarter 2018 Equity instruments (Fund assets) within the insurance hold-ings at the amount of SEK 279m have been transferred from level 2 into level 3as a result of calibration of the classification methodology.
Changes in level 3
Group, 2018
Assets
Closingbalance
2017
Changes dueto IFRS 9
implementation
Gain/lossin Income
statement1) 2)
Gain/lossin Other
comprehen-sive income3) Purchases Sales
Settle-ments
Transfersinto
Level 3
Transfersout of
Level 3
Exchangerate
differences Total
Debt securities 571 –567 4Equity instruments 1,787 2,497 1,084 2,594 –447 279 108 7,902Financial assets for whichthe customers bear the investment risk 630 –53 105 –97 29 614Derivatives – Interest related 686 76 5 –121 –136 0 510Derivatives – Equity related 2 –1 0 0 –1 0Equity instruments available-for-sale 627 –627 0Investment in associates1) 592 –120 66 –42 5 501
TOTAL 4,895 1,303 986 2,770 –707 –136 279 141 9,531
Liabilities
Financial liabilities for whichthe customers bear the investment risk 624 –53 100 –96 0 28 603Short positions equity instruments 244 19 –203 3 63Derivatives – Interest related 799 –75 –114 5 –142 473
TOTAL 1,667 –109 –217 –91 –142 31 1,139
Group, 2017
AssetsOpeningbalance Reclassification
Gain/lossin Income
statement1) 2)
Gain/lossin Other
comprehen-sive income3) Purchases Sales
Settle-ments
Transfersinto
Level 3
Transfersout of
Level 3
Exchangerate
differences Total
Financial assets – policyholdersbearing the risk 4,425 –3,735 –65 3 –1 –40 43 630Equity instruments at fair valuethrough profit and loss 9,701 –8,655 140 1,055 –290 –229 65 1,787Debt securities at fair valuethrough profit and loss 1,779 –1,181 29 184 –20 –227 7 571Derivatives – Interest related 6,680 –5,948 –141 47 48 686Derivatives – Equity related 7 –1 –5 1 2Derivatives – Other related 1,454 –1464 10 0Equity instruments available-for-sale 611 100 –9 83 –219 61 627Investment in associates 789 129 74 –402 2 592Investment properties 7,401 –7,454 53 0
TOTAL 32,847 –28,438 187 –9 1,399 –932 47 61 –496 229 4,895
Liabilities
Liabilities to policyholders– investment contracts 4,410 –3,724 –66 –40 44 624Short positions equity instruments 271 –18 –14 3 2 244Derivatives – Interest related 1,774 –1,003 –12 28 12 799Derivatives – Other related 1,862 –1,875 13 0
TOTAL 8,317 –5,599 –1,087 –26 3 28 –40 71 1,667
1) Fair value gains and losses recognised in the income statement are included in Net financial income and Net other income.2) Gains/losses recognised in the income statement relating to instruments held as of 31 December are SEK 1,179m (1,154).3) Fair value gains and losses recognised in other comprehensive income are included as available for sale.

Notes Financial statements
SEB Annual Report 2018 139
Note 37 continued Fair value measurement of assets and liabilities
Changes in level 3
Parent company, 2018
Assets
Closingbalance
2017
Changes dueto IFRS 9
implementation
Gain/loss inIncome
statement1) 2)
Gain/lossin Other
comprehen-sive income3) Purchases Sales
Settle-ments
Transfersinto
Level 3
Transfersout of
Level 3
Exchangerate
differences Total
Equity instruments 181 1,485 323 233 –224 100 2,099Derivatives – Interest related 761 18 5 –121 –153 0 510Derivatives – Equity related 2 –1 0 0Equity instruments available-for-sale 474 –474 0Investment in associates1) 592 –120 66 –42 6 501
TOTAL 2,010 1,011 220 303 –387 –153 106 3,110
Liabilities
Short positions equity instruments 244 19 –203 3 63Derivatives – Interest related 799 –75 –114 5 –142 473
TOTAL 1,043 –56 –317 5 –142 3 536
Parent company, 2017
AssetsOpeningbalance Reclassification
Gain/loss inIncome
statement1) 2)
Gain/lossin Other
comprehen-sive income3) Purchases Sales
Settle-ments
Transfersinto
Level 3
Transfersout of
Level 3
Exchangerate
differences Total
Equity instruments at fair valuethrough profit and loss 256 –8 –72 5 181Derivatives – Interest related 832 –140 63 6 761Derivatives – Equity related 6 –5 1 2Equity instruments available-for-sale 432 161 22 82 –218 –5 474Investment in associates1) 753 142 75 –380 2 592
TOTAL 2,279 150 22 157 –670 63 9 2,010
Liabilities
Short positions equity instruments 271 –18 –14 3 2 244Derivatives – Interest related 941 –163 –12 28 5 799
TOTAL 1,212 –181 –26 3 28 7 1,043
1) Fair value gains and losses recognised in the income statement are included in Net financial income and Net other income.2) Gains/losses recognised in the income statement relating to instruments held as of 31 December are SEK 461m (139).
Sensitivity of Level 3 financial instruments to unobservable inputsThe table below illustrates the potential Profit or Loss impact of the relativeuncertainty in the fair value of assets and liabilities that for their valuation aredependent on unobservable inputs. The sensitivity to unobservable inputs isassessed by altering the assumptions to the valuation techniques, illustratedbelow by changes in index-linked swap spreads, implied volatilities, credit
spreads or comparator multiples. It is unlikely that all unobservable inputswould be simultaneously at the extremes of their ranges of reasonably possiblealternatives. There have been no significant changes during 2018. The largestopen market risk within Level 3 financial instruments is found within the insur-ance business.
2018 2017
Group Assets Liabilities Net Sensitivity Assets Liabilities Net Sensitivity
Derivatives AFV1) 2) 4) 510 –473 37 45 688 –798 –110 38Equity instruments AFV 3) 6) 1,957 –63 1,894 380 180 –244 –64Equity instruments AFS 3) 6) 336 336 63Investments in associates 3) 627 627 125 729 729 146Insurance holdings – Financial instruments 5 ) 7) 5,576 5,576 697 2,380 2,380 331Non-current assets and disposal groupsclassified as held for sale4 ) 5) 6 ) 7) 16,070 –2,395 13,675 1,657
1) Sensitivity from a shift of inflation linked swap spreads by 16 basis points (16) and implied volatilities by 5 percentage points (5).2) Sensitivity from a shift of swap spreads by 5 basis points (5).3) Valuation is estimated in a range of reasonable outcomes. Sensitivity analysis is based on 20 per cent (20) shift in market values.4) Shift in implied volatility down by 10 percentage points (10).5) Sensitivity analysis is based on a shift in private equity of 20 per cent (20), structured credits 10 per cent (10) and derivative market values of 10 per cent (10).6) Sensitivity from a shift of investment properties/real estate funds/infrastructure/infrastructure funds market values of 10 per cent (10).7) The sensitivity shows changes in the value of the insurance holdings which do not at all times affect the P/L of the group since any surplus in the traditional life portfolios are
consumed first.

Financial statements Notes
SEB Annual Report 2018140
38 Financial assets and liabilities by classGroup, 2018 Book value Fair value
Assets
FVTPLheld fortrading
FVTPLmanda-
torily
FVTPLdesig-nated
Hedgeinstru-ments
Amortisedcost Total
Quotedprices in
activemarkets(Level 1)
Valuationtechnique
usingobservable
inputs(Level 2)
Valuationtechniqueusing non-
observableinputs
(Level 3) Total
Loans 98,136 1,901 1,829,234 1,929,272 29,234 105,813 1,795,423 1,930,470Debt securities 44,461 88,896 6,435 16,336 156,128 68,871 87,254 4 156,129Equity instruments 33,192 17,242 50,434 38,697 3,835 7,902 50,434Financial assets forwhich the customersbear the investment risk 269,613 269,613 261,056 7,943 614 269,613Derivatives 110,368 5,095 115,463 1,327 113,626 510 115,463Other 67 17,127 17,194 2,249 14,945 17,194
Financial assets 286,158 377,652 6,502 5,095 1,862,697 2,538,104 401,434 318,471 1,819,398 2,539,303
Other assets (non-financial) 29,412
TOTAL 286,158 377,652 6,502 5,095 1,862,697 2,567,516
Liabilities
Deposits 3,586 8,911 1,234,613 1,247,109 35,054 18,636 1,192,268 1,245,958Financial liabilities for whichthe customers bear the instru-ments investment risk 270,556 270,556 262,029 7,924 603 270,556Debt securities issued 18,518 696,674 715,192 50 713,910 23 713,983Short positions debt securities 9,646 9,646 5,275 4,371 9,646Short positions equity instru-ments 13,498 13,498 13,435 63 13,498Derivatives 96,155 717 96,872 2,616 93,783 473 96,872Other 3,613 22 11,087 14,722 93 3,596 11,033 14,722
Financial liabilities 126,497 298,007 717 1,942,374 2,367,595 318,552 842,220 1,204,463 2,365,235
Liabilities to policyholders 21,847Other liabilities (non-financial) 29,285Total equity 148,789
TOTAL 126,497 298,007 717 1,942,374 2,567,516
Group, 2017 Book value Fair value
AssetsHeld fortrading
Designatedat fair valuethrough p/l /
Hedgeinstruments
Available-for-sale
Loans andreceivables Total
Quotedprices in
activemarkets(Level 1)
Valuationtechnique using
observableinputs
(Level 2)
Valuationtechniqueusing non-
observableinputs
(Level 3) Total
Loans 42,620 1,670,898 1,713,518 46,835 6,614 1,664,280 1,717,729Equity instruments 48,371 8,880 1,952 59,203 52,082 4,573 2,548 59,203Debt securities 109,512 20,902 25,824 13,030 169,268 71,626 97,171 571 169,368Derivatives 98,281 6,587 104,868 1,250 102,930 688 104,868Financial assets– policyholders bearing the risk 283,420 283,420 275,737 7,053 630 283,420Other 93 15,013 15,106 1,960 13,146 15,106
Financial assets 298,784 319,882 27,776 1,698,941 2,345,383 449,490 218,341 1,681,863 2,349,694
Other assets (non-financial) 211,525
TOTAL 298,784 319,882 27,776 1,698,941 2,556,908
Liabilities
Deposits 1,127,538 1,127,538 30,286 4,277 1,097,668 1,132,231Equity instruments 14,228 14,228 13,984 244 14,228Debt securities 10,809 24,388 622,035 657,232 6,254 653,229 2,677 662,160Derivatives 84,569 863 85,432 910 83,723 799 85,432Liabilities to policyholders– investment contracts 284,291 284,291 276,482 7,185 624 284,291Other 3,842 1,046 13,172 18,060 21 3,897 14,142 18,060
Financial liabilities 113,448 310,588 1,762,745 2,186,781 327,937 752,311 1,116,154 2,196,402
Other liabilities (non-financial) 228,890Total equity 141,237
TOTAL 113,448 310,588 1,762,745 2,556,908

Notes Financial statements
SEB Annual Report 2018 141
Note 38 continued Financial assets and liabilities by class
Parent company, 2018 Book value
Assets FVTPL held for trading FVTPL mandatorily FVTPL designated Hedge instruments Amortised cost Total
Loans 98,136 1,901 1,594,908 1,694,945Debt securities 44,172 57,486 17,568 119,227Equity instruments 33,191 3,801 50,653 87,646Derivatives 108,188 5,095 113,282Other 38 14,763 14,801
Financial assets 283,688 63,189 38 5,095 1,677,893 2,029,902
Other assets (non-financial) 48,373
TOTAL 283,688 63,189 38 5,095 1,677,893 2,078,275
Liabilities
Deposits 3,411 1,083,835 1,087,246Debt securities issued 18,316 696,600 714,917Derivatives 94,551 717 95,269Other 26,757 9,743 36,500
Financial liabilities 124,719 18,316 717 1,790,178 1,933,931
Other liabilities (non-financial) 10,794Total equity and untaxed reserves 133,550
TOTAL 124,719 18,316 717 1,790,178 2,078,275
Parent company, 2017 Book value
Assets Held for trading
Designated at fairvalue through p/l /
Hedge instruments Available-for-saleLoans and
receivables Total
Loans 1,480,014 1,480,014Equity instruments 48,370 9 52,286 100,665Debt securities 109,258 8,802 7,010 125,070Derivatives 97,640 6,580 104,220Other 36,349 36,349
Financial assets 255,268 6,589 61,088 1,523,373 1,846,318
Other assets (non-financial) 45,845
TOTAL 255,268 6,589 61,088 1,523,373 1,892,163
Liabilities
Deposits 949,690 949,690Equity instruments 14,228 14,228Debt securities 14,651 642,682 657,333Derivatives 86,127 863 86,990Other 46,132 46,132
Financial liabilities 115,006 863 1,638,504 1,754,373
Other liabilities (non-financial) 11,599Total equity and untaxed reserves 126,191
TOTAL 115,006 863 1,638,504 1,892,163
SEB has grouped its financial instruments by class taking into account thecharacteristics of the instruments:
Loans and deposits includes financial assets and liabilities with fixed ordeterminable payments that are not quoted in an active market. Loans arefurther specified in note 41a and 18.
Equity instruments includes shares, rights issues and similar contractualrights of other entities.
Debt instruments includes contractual rights to receive or obligationsto deliver cash on a predetermined date. These are further specified innote 41f and 19.
Derivatives includes options, futures, swaps and other derived products
held for trading and hedging purposes. These are further specified in note 21.Investment contracts include those assets and liabilities in the Life insuranceoperations where the policyholder is carrying the risk of the contractual agree-ment (is not qualified as an insurance contract under IFRS 4). The Life insur-ance operations are further specified in note 43.
Insurance contracts includes those assets and liabilities in the Life insuranceoperations where SEB is carrying the insurance risk of a contractual agreement(is qualified as an insurance contract under IFRS 4). The Life insurance opera-tions are further specified in note 43.
Other includes other financial assets and liabilities recognised in accordancewith IFRS 9, i.e. Trade and client receivables and payables.

Financial statements Notes
SEB Annual Report 2018142
39 Assets and liabilities distributed by main currenciesGroup, 2018 SEK EUR USD GBP DKK NOK Other Total
Cash and cash balances and loans to central banks 25,253 79,844 75,738 271 6,111 1,628 53,564 242,408Loans to credit institutions 3,163 7,568 19,201 2,656 896 1,450 9,353 44,287Loans to the public 942,874 368,465 134,514 25,688 79,289 61,950 32,045 1,644,825Other financial assets 356,893 113,651 79,282 5,267 18,424 26,898 6,169 606,584Other assets 1,124 25,746 947 111 892 236 357 29,412
TOTALASSETS 1,329,306 595,276 309,681 33,993 105,611 92,162 101,486 2,567,516
Deposits from central banks 411 3,582 20,534 797 16,731 5,775 47,830Deposits from credit institutions 18,410 12,129 32,712 645 3,156 13,058 7,779 87,889Deposits and borrowing from the public 538,153 274,963 153,034 48,810 26,378 42,495 27,556 1,111,390Other financial liabilities 555,042 265,362 249,171 32,140 9,983 4,199 4,589 1,120,487Other liabilities 30,545 10,623 3,160 672 2,340 1,844 1,946 51,131Total equity 148,789 148,789
TOTAL LIABILITIESANDEQUITY 1,291,350 566,659 458,611 83,064 41,857 78,327 47,645 2,567,516
2017
Cash and cash balances and loans to central banks 5,680 79,653 57,802 151 4,149 5,159 37,406 190,000Loans to credit institutions 1,524 10,366 14,231 3,645 897 819 7,236 38,717Loans to the public 895,639 322,623 120,092 21,653 48,965 58,572 19,221 1,486,765Other financial assets 389,583 127,540 73,548 7,749 17,516 23,474 6,802 646,213Other assets 20,091 46,687 31,341 235 96,447 –88 498 195,213
TOTALASSETS 1,312,516 586,870 297,012 33,434 167,974 87,937 71,164 2,556,908
Deposits from central banks 1,170 6,187 23,138 1,674 327 16,744 1,417 50,656Deposits from credit institutions 14,996 8,793 12,116 1,153 2,367 1,839 3,571 44,833Deposits and borrowing from the public 512,170 270,771 139,737 36,938 20,386 33,140 18,907 1,032,048Other financial liabilities 567,439 265,233 215,023 22,895 11,682 8,392 2,499 1,093,164Other liabilities 25,122 26,693 –19 2,404 138,945 –743 2,567 194,970Total equity 141,237 141,237
TOTAL LIABILITIESANDEQUITY 1,262,134 577,677 389,994 65,064 173,707 59,372 28,961 2,556,908
Parent company, 2018 SEK EUR USD GBP DKK NOK Other Total
Cash and cash balances at central banks 891 34,903 75,675 1,261 1,617 49,734 164,081Loans to credit institutions 35,172 38,121 20,475 3,612 8,559 5,900 8,494 120,333Loans to the public 906,762 188,945 132,227 22,030 75,444 55,143 30,135 1,410,687Other financial assets 118,923 83,189 76,209 5,396 18,430 26,758 5,897 334,801Other assets 17,540 24,459 1,209 1,132 892 2,786 356 48,373
TOTALASSETS 1,079,287 369,615 305,795 32,170 104,587 92,204 94,616 2,078,275
Deposits from central banks 411 3,582 20,534 797 16,731 5,775 47,830Deposits from credit institutions 25,110 22,259 37,903 984 3,182 14,471 8,283 112,192Deposits and borrowing from the public 533,911 116,319 142,857 47,550 25,797 39,869 20,920 927,224Other financial liabilities 321,998 224,158 249,791 32,131 9,939 4,162 4,506 846,685Other liabilities 2,208 648 2,821 545 1,761 901 1,911 10,794Shareholders’ equity and untaxed reserves 133,550 133,550
TOTAL LIABILITIESANDEQUITY 1,017,188 366,966 453,906 82,007 40,679 76,134 41,395 2,078,275
2017
Cash and cash balances at central banks 161 18 57,670 1,566 4,793 33,532 97,741Loans to credit institutions 15,839 137,810 18,503 5,969 6,415 5,708 8,537 198,781Loans to the public 857,445 104,274 111,599 16,115 48,277 51,308 16,888 1,205,906Other financial assets 147,025 77,687 69,123 5,206 17,615 23,111 4,123 343,891Other assets 17,597 21,235 1,560 1,601 946 2,540 365 45,845
TOTALASSETS 1,038,069 341,024 258,456 28,891 74,820 87,459 63,444 1,892,163
Deposits from central banks 339 3,529 21,127 1,605 165 16,502 975 44,242Deposits from credit institutions 30,866 25,170 20,356 1,866 2,910 4,737 4,416 90,319Deposits and borrowing from the public 503,479 116,728 129,120 35,332 20,874 30,118 13,827 849,478Other financial liabilities 320,528 202,458 205,997 22,177 11,394 5,986 1,793 770,334Other liabilities 3,381 964 3,554 319 304 966 2,111 11,599Shareholders’ equity and untaxed reserves 126,191 126,191
TOTAL LIABILITIESANDEQUITY 984,784 348,849 380,153 61,300 35,645 58,309 23,122 1,892,163

Notes Financial statements
SEB Annual Report 2018 143
40 Current and non-current assets and liabilitiesGroup
Assets
2018 2017
Current assetsNon-current
assets Total Current assetsNon-current
assets Total
Cash and cash balances at central banks 209,115 209,115 177,222 177,222Loans to central banks 33,294 33,294 12,778 12,778Loans to credit institutions 38,963 5,324 44,287 30,989 7,728 38,717Loans to the public 745,077 899,748 1,644,825 618,931 867,834 1,486,765Debt securities 156,128 156,128 169,269 169,269Equity instruments 50,434 50,434 59,204 59,204Financial assets for which the customers bear the investment risk 269,613 269,613 283,420 283,420Derivatives 115,463 115,463 104,868 104,868
Fair value changes of hedged items in a portfolio hedge 67 67 93 93Investments in subsidiaries and associates 1,195 1,195 1,314 1,314Intangible assets 817 7,340 8,157 1,564 6,466 8,030Properties and equipment 251 1,049 1,300 222 908 1,130Investment properties 11 11 203 203Current tax assets 6,404 6,404 5,255 5,255Deferred tax assets 251 251 260 260Retirement benefit plan assets 4,104 4,104 5,280 5,280Other assets 20,398 20,398 16,856 16,856Prepaid expenses and accrued income 2,471 2,471 2,232 2,232Non-current assets and disposal groups classified as held for sale 184,011 184,011
Other assets 34,522 9,835 44,357 215,716 8,948 224,664
TOTAL 1,652,609 914,907 2,567,516 1,672,398 884,510 2,556,908
2018 2017
LiabilitiesCurrent
liabilitiesNon-current
liabilities TotalCurrent
liabilitiesNon-current
liabilities Total
Deposits from central banks and credit institutions 133,501 2,218 135,719 91,561 3,928 95,489Deposits and borrowing from the public 1,088,202 23,188 1,111,390 993,621 38,427 1,032,048Financial liabilities for which the customers bearthe investment risk 744 269,812 270,556 10,902 273,389 284,291Liabilities to policyholders 1,494 20,352 21,846 8,176 10,735 18,911Debt securities issued 248,316 432,354 680,670 184,334 429,699 614,033Short positions 23,144 23,144 24,985 24,985Derivatives 96,872 96,872 85,434 85,434Other financial liabilities 3,613 3,613 3,894 3,894
Fair value changes of hedged items in a portfolio hedge 22 22 1,046 1,046Current tax liabilities 1,734 1,734 1,463 1,463Deferred tax liabilities 7,141 7,141 8,079 8,079Other liabilities 23,995 23,995 26,572 26,572Accrued expenses and prepaid income 5,260 5,260 5,316 5,316Provisions 1,817 1,817 1,684 1,684Retirement benefit plans liabilites 427 427 1,325 1,325Subordinated liabilities 290 34,231 34,521 272 32,118 32,390Liabilities of disposal groups classified as held for sale 178,710 178,710
Other liabilities 31,301 43,616 74,916 213,379 43,206 256,585
TOTAL 1,627,187 791,540 2,418,727 1,616,286 799,385 2,415,671
Assets and liabilities are classified as current assets and current liabilitieswhen they are cash or cash equivalents, are hold for trading purposes, areexpected to be sold, settled or consumed in normal business, and are expected
to be realised within twelve months. All other assets and liabilities are classi-fied as non-current.
41 Risk disclosuresSEB defines risk as the possibility of a negative deviation from an expectedfinancial outcome. SEB’s profitability is directly dependent upon its ability toevaluate, manage and price the risks encountered, while maintaining an ade-quate capital and liquidity position to meet unforeseen events. The Board ofDirectors is responsible for setting the maximum acceptable levels of risks tobe taken by the bank. The risk tolerance statements of the Board conveys thedirection and level of risk, funding structure, and necessary liquidity and capitalbuffers.
SEB’s main risk is credit risk. Other risks include market risk, operational risk,business risk, insurance and pension risk, and liquidity risk. In order to coverthe risks, SEB holds a capital buffer and liquidity reserves in case of unforeseen
events. SEB strives to continuously identify and manage risks in its operations,both existing and emerging risks, in a designated risk management process.The aggregate risk profile of SEB is regularly monitored and reported to theGRC and Board. In the annual capital adequacy process, the capital needs areevaluated based on the risk profile and future business strategy, taking intoconsideration the financial stability requirements of the regulators, debt inves-tors, business counterparties and shareholders’ required rate of return.Further information about SEB’s risk, liquidity and capital management is avai-lable on pages 44–49, notes 18 and 42 and in SEB’s report under Pillar 3: CapitalAdequacy and Risk Management Report (available on www.sebgroup.com).

Financial statements Notes
SEB Annual Report 2018144
41a Credit riskDefinitionCredit risk is the risk of loss due to the failure of an obligor to fulfil its obligationstowards SEB. The definition also comprises counterparty risk derived from thetrading operations, country risk, settlement risk, and credit concentration risk.
Credit risk is the main risk in SEB, which arises in the lending and commitmentsto customers, including corporates, financial institutions, public sector entitiesand private individuals. This is referred to as the credit portfolio. SEB’s total creditexposure consists of the credit portfolio as well as debt instruments and repos.
Risk managementCredit policies and approval processThe main principle in SEB’s general credit policy is that all lending is based oncredit analysis and is proportionate to the customer’s cash flow and ability torepay. The customer shall be known by the bank and the purpose of the loanshall be fully understood. The business units take full responsibility of the creditrisk until repayment.
A credit approval is based on an evaluation of the customer’s creditworthi-ness and the type of credit. Relevant factors include the customer’s current andanticipated financial position and protection provided by covenants and collat-eral. A credit approval takes the proposed transaction into account as well asthe customer’s total business with the bank. The credit decision also includes arisk classification of the customer based on this analysis. The process differsdepending on the type of customer (e.g., retail, corporate or institutional), risklevel, and size and type of transaction. For larger corporate customers, inde-pendent and professional credit analysis is particularly important, and the deci-sions are mostly taken by a credit committee. For private individuals and smallbusinesses, the credit approval is often based on credit scoring models. Everycredit decision of significance requires approval from an independent creditofficer. Credit decision-making is based on a hierarchical structure, with theGroup Risk Committee being the highest credit granting body, subject to limitedexceptions. Below the Group Risk Committee, there are divisional credit com-mittees and, in turn, local credit committees depending on the location of thecustomer, with small approval authorities for certain bank officers. The approvalmandates for each level are set on a risk-adjusted basis using both quantitativeand qualitative criteria.
SEB’s credit policies reflect the group’s approach to sustainability asdescribed in the Corporate Sustainability Policy, the Environmental Policy, theHuman Rights Policy, and the Credit Policy on Corporate Sustainability. Positionstatements on climate change, child labour, and access to fresh water, as wellas a number of industry sector policies, including Forestry, Fossil fuel, Miningand metals, Renewable energy and Shipping, shall be considered in the creditgranting process and are also used in customer dialogues. Environmental,social and governance risks shall be considered in the credit analysis.
Risk mitigationIn order to reduce the credit risk, a number of credit risk mitigation techniquesare used. The method used depends on its suitability for the product and thecustomer in question, its legal enforceability, and on SEB’s experience andcapacity to manage and control the particular technique. The most importantcredit risk mitigation techniques are collateral pledges, guarantees and nettingagreements. The most common types of pledges are real estate, floatingcharges and financial securities. For large corporate customers, credit risk isoften mitigated by the use of covenants. In the trading operations, daily marginarrangements are frequently used to mitigate net open counterparty exposuresat any point in time.
Limits and monitoringTo manage the credit risk for individual customers or customer groups, a limit isestablished that reflects the maximum exposure that SEB is willing to accept.Limits are also established for total exposure in countries in certain risk classes,certain customer segments and for settlement risks in the trading operations.
SEB continuously reviews the quality of its credit exposures. All limits andrisk classes are reviewed at least annually by a credit approval body (a creditcommittee consisting of at least two bank officers as authorised by the group’sCredit Instruction, adopted by the Board).
Weak or impaired exposures are subject to more frequent reviews. Theobjective is to identify credit exposures with an elevated risk of loss at an earlystage and to work together with the customer towards a solution that enablesthe customer to meet its financial obligations and SEB to avoid or limit creditlosses. In its core markets, SEB maintains local restructuring teams that areengaged in problem exposures. These are supported by a global restructuringfunction with overall responsibility for managing problem exposures.
Allowances are made for expected credit losses of financial assets in scopeof the accounting standard IFRS 9 Financial Instruments. The guiding principleof the expected credit loss model is to reflect the general pattern of deteriora-tion or improvement in the credit quality of the assets. Up until 31 December2017, SEB used an incurred loss model for providing for impairments.Fora description of the methodology to estimate the expected credit loss allowance,refer to note 1 and note 18.
Loans where the contractual terms have been amended in favour of the cus-tomer due to financial difficulties are referred to as forborne loans. Forbear-ance measures range from amortisation holidays (the most common measure)to refinancing with new terms and debt forgiveness. Changes in contractualterms may be so significant that the loan can also be considered impaired. Arelevant credit approval body shall approve the forbearance measures as wellas the classification of the loan as being forborne or not.
Credit portfolio analysis and stress testsThe risk organisation regularly reviews and assesses the aggregate creditportfolio based on industry, geography, risk class, product type, size and otherparameters. Risk concentrations in geographic and industry sectors as well asin large single names are thoroughly analysed, both in respect of direct and indi-rect exposures and in the form of collateral, guarantees and credit derivatives.As of year-end, the 20 largest corporate exposures (including real estate man-agement) corresponded to 87 per cent of the capital base (89). Stress testsof the credit portfolio, including reverse stress tests, are performed regularlyas a part of SEB’s annual internal capital adequacy assessment process. Spe-cific analyses and stress tests of certain sectors or sub-portfolios are per-formed as required.
RiskmeasurementCredit risk is measured for all exposures, both in the banking book and thetrading book. An internal ratings-based (IRB) risk classification systemapproved by the regulator is used for the majority of the bank’s portfoliosand reflects the risk of default on payment obligations. SEB received appro-val for a significant amendment of its risk classification system for the non-retail portfolio in the parent company at the end of 2015 and for SEB AG in2016. Approval for the Baltic subsidiaries was received in 2018.
For significant corporate portfolios, the risk classification system containsspecific rating tools and PD (probability of default) scales. Larger and mid-sized counterparties are measured on a risk class scale of 1–16, while Small-and Medium-sized Enterprises (SMEs) are measured on a scale of 1–12.Defaulted counterparties are given the highest risk class, and the three riskclasses prior to default are defined as “watch list”. For each risk class scale,SEB makes individual one-year, through-the-cycle probability of default esti-mates, which are based on more than 20 years of internal and external data.
For private individuals and small businesses, SEB uses credit scoring sys-tems to estimate PD for the customer. To achieve greater accuracy, SEB usesdifferent credit scoring models for different regions and product segments,as both data accessibility and customer characteristics normally vary bycountry and product.
The exposure weighted PD of the total credit portfolio increased to0.58 per cent at year-end (0.53).The risk distribution of the non-retailand household portfolios is shown on page 146.
Counterparty credit risk in derivative contractsSEB enters into derivative contracts primarily to support customers in the man-agement of their financial exposures. SEB also uses derivatives to protect cashflows and fair values of financial assets and liabilities in its own book from mar-ket fluctuations.
Counterparty credit risk in derivative contracts is the risk of a counterpartynot living up to its contractual obligations where SEB has a claim on the counter-party. The claim on the counterparty corresponds to a net positive exposure infavour of SEB. Since the market value of a derivative fluctuates during the termto maturity, the uncertainty of future market conditions must be taken intoaccount. The potential future exposure (PFE) is calculated by applying an add-on to current market value. The add-on is generated either through simulation(internal model method) or by applying a standard add-on which is set by afixed value depending on product type and time to maturity which reflectspotential market movements for the specific contract (standardised method).
SEB’s simulation-based approach for calculating potential future exposure(internal model method) is approved by the Swedish FSA for external capitalreporting of counterparty credit risk of repos, interest rate derivatives and FXderivatives in the parent company.
Counterparty credit risk in derivative contracts is reduced through the useof close-out netting agreements, where all positive and negative market valuesunder an agreement can be netted at the counterparty level, and through collat-eral arrangements.
Counterparty credit risk in derivative contracts affects the profit and lossthrough credit/debit valuation adjustments (CVA/DVA) reflecting the credit riskassociated with derivative positions. These adjustments depend on market riskfactors such as interest rate, foreign exchange rates and credit spreads. There isalso a regulatory capital requirement for credit valuation adjustments underBasel III.

Notes Financial statements
SEB Annual Report 2018 145
Note 41 a continued Credit risk
Credit exposure by industry
Total credit exposure comprises the group’s credit portfolio (loans, leasingagreements, contingent liabilities and counterparty risks arising from deriva-tive contracts), repos and debt instruments. Exposures are presented beforeallowances. Interest rate and foreign exchange derivatives and repos are cal-culated using the internal model method. Other derivatives are reported after
netting of market values but before collateral arrangements and include stand-ardised add-ons for potential future exposure. Debt instruments comprise allinterest-bearing instruments at nominal amounts, considering credit deriva-tives and futures. Debt instruments in the Life and Investment Managementdivision are excluded.
Loans Contingent liabilities Derivatives Total
Group 2018 2017 2018 2017 2018 2017 2018 2017
Banks 44,878 41,505 21,506 22,577 29,497 26,323 95,881 90,405
Finance and insurance 115,690 70,462 48,132 40,336 27,058 25,963 190,879 136,761Wholesale and retail 81,797 65,440 39,097 35,387 1,062 1,104 121,956 101,931Transportation 36,788 29,976 24,678 24,071 3,186 1,968 64,652 56,015Shipping 52,927 47,128 13,001 15,166 1,564 728 67,492 63,023Business and household services 137,314 117,056 96,724 89,668 4,067 4,266 238,106 210,990Construction 11,446 12,681 21,286 18,677 555 885 33,287 32,243Manufacturing 96,670 85,633 141,186 143,416 11,397 7,154 249,253 236,204Agriculture, forestry and fishing 21,275 17,019 3,138 3,292 74 325 24,487 20,636Mining, oil and gas extraction 21,660 23,946 27,146 22,597 1,121 1,352 49,927 47,894Electricity, gas and water supply 50,197 44,720 38,603 38,365 7,382 7,180 96,182 90,265Other 20,841 26,176 15,008 6,920 386 448 36,235 33,543
Corporates 646,605 540,236 467,999 437,896 57,854 51,374 1,172,457 1,029,506
Commercial real estate management 158,077 152,200 23,558 21,480 3,880 4,853 185,515 178,533Residential real estate management 98,857 93,968 7,205 8,411 4,452 5,927 110,514 108,307
Real EstateManagement 256,933 246,169 30,763 29,891 8,332 10,781 296,029 286,840
Housing co-operative associations 59,195 55,929 4,081 4,998 2 4 63,278 60,932
PublicAdministration 21,086 37,533 21,580 19,131 7,463 8,123 50,129 64,787
Household mortgage 521,912 504,885 29,809 30,446 551,720 535,331Other 44,447 42,421 42,197 41,240 15 20 86,659 83,681
Households 566,358 547,306 72,006 71,687 15 20 638,379 619,013
Margins of safety1) 18,994 18,994
Credit portfolio 1,595,055 1,487,672 617,935 586,180 103,162 96,625 2,316,153 2,170,477
Repos 8,537 1,846Debt instruments 141,174 156,000
TOTAL 2,465,864 2,328,323
1) Previously reported as Other assets.
Credit portfolio by industry and geography 1)
Total credit portfolio comprises the group’s loans, leasing agreements, contingentliabilities and counterparty risks arising from derivative contracts. Exposures arepresented before allowances. Interest rate and foreign exchange derivatives and
repos are calculated using the internal model method. Other derivatives arereported after netting of market values but before collateral arrangements andinclude standardised add-ons for potential future exposure.
Group, 2018 SwedenOther Nordic
countries Baltic countries Germany, UK Other Total
Banks 62,126 10,366 2,199 5,858 15,331 95,881
Finance and insurance 161,796 7,052 772 16,868 4,392 190,879Wholesale and retail 65,932 17,746 25,087 5,758 7,432 121,956Transportation 41,899 6,011 11,162 5,533 46 64,652Shipping 59,401 976 991 352 5,772 67,492Business and household services 201,469 11,027 9,281 13,414 2,914 238,106Construction 21,565 1,095 4,197 3,852 2,579 33,287Manufacturing 177,092 25,067 13,722 16,811 16,561 249,253Agriculture, forestry and fishing 15,682 416 8,283 105 24,487Mining, oil and gas extraction 43,053 4,516 815 1,225 318 49,927Electricity, gas and water supply 66,429 11,306 11,777 6,550 121 96,182Other 30,469 1,966 777 2,909 114 36,235
Corporates 884,788 87,180 86,864 73,377 40,248 1,172,457
Commercial real estate management 145,518 3,808 23,718 11,945 526 185,515Residential real estate management 106,704 23 3,787 110,514
Real EstateManagement 252,221 3,832 23,718 15,732 526 296,029
Housing co-operative associations 63,278 63,278
PublicAdministration 33,953 3,185 3,666 7,937 1,389 50,129
Household mortgage 487,253 1,302 57,044 6,121 551,720Other 45,274 29,609 8,857 6 2,913 86,659
Households 532,527 30,911 65,901 6 9,034 638,379
TOTAL 1,828,893 135,474 182,349 102,910 66,528 2,316,153

Financial statements Notes
SEB Annual Report 2018146
Note 41 a continued Credit risk
2017 SwedenOther Nordic
countries Baltic countries Germany, UK Other Total
Banks 57,160 9,694 991 7,826 14,734 90,405
Finance and insurance 87,949 6,939 962 36,065 4,846 136,761Wholesale and retail 48,939 16,049 22,568 8,378 5,997 101,931Transportation 31,439 5,593 8,543 10,372 68 56,015Shipping 54,586 887 917 377 6,256 63,023Business and household services 147,684 6,588 7,978 43,641 5,099 210,990Construction 20,931 1,439 4,198 3,190 2,485 32,243Manufacturing 153,926 21,705 12,838 32,908 14,826 236,204Agriculture, forestry and fishing 13,266 278 6,993 93 7 20,636Mining, oil and gas extraction 40,547 5,218 1,324 560 244 47,894Electricity, gas and water supply 42,220 11,806 11,970 24,138 130 90,265Other 27,286 2,800 722 2,683 53 33,543
Corporates 668,773 79,303 79,014 162,405 40,010 1,029,506
Commercial real estate management 130,156 4,007 22,075 22,285 10 178,533Residential real estate management 103,849 25 4,433 108,307
Real EstateManagement 234,005 4,031 22,075 26,718 10 286,840
Housing co-operative associations 60,932 60,932
PublicAdministration 36,764 2,412 4,900 20,710 1 64,787
Household mortgage 477,700 2,041 49,955 5,635 535,331Other 43,499 28,888 8,609 5 2,680 83,681
Households 521,199 30,929 58,564 5 8,316 619,013
Margins of safety2) 18,994
TOTAL 1,578,833 126,370 165,544 217,664 63,072 2,170,477
1) The geographical distribution is based on where the loan is booked. Amounts before allowances for expected credit losses.2) Previously reported as Other assets.
Credit portfolio by PD range
Group, 2018 Total, excluding households Households
CategoryProbability of
Default (PD) range S&P/Moody’s1) Banks CorporatesReal estate
managementHousing
Co-opsPublic
Admin. TotalHouseholds2)
PD range
Investment grade
0 < 0.01% AAA/Aaa 5.2% 0.8% 0.3% 0.0% 70.8% 3.4%0.01 < 0.03% AA/Aa 42.4% 11.2% 6.8% 0.0% 15.2% 11.9% 0 < 0.2% 65.0%0.03 < 0.12% A/A 32.2% 29.2% 10.0% 9.8% 12.6% 24.7% 0.2 < 0.4% 19.5%0.12 < 0.46% BBB/Baa 10.5% 37.3% 52.6% 86.1% 0.8% 39.1% 0.4 < 0.6% 0.4%
Standardmonitoring
0.46 < 1.74% BB/Ba 5.0% 16.5% 28.8% 4.0% 0.3% 17.0% 0.6 < 1% 7.3%1.74 < 7% B/B 1.7% 3.4% 1.2% 0.2% 0.1% 2.7% 1 < 5% 5.5%
Watch list7 < 9% B/B 0.6% 0.6% 0.0% 0.0% 0.0% 0.5% 5 < 10% 0.9%
9 < 22% CCC/Caa 2.3% 0.5% 0.1% 0.0% 0.0% 0.5% 10 < 30% 0.8%22 < 100% C/C 0.0% 0.1% 0.1% 0.0% 0.0% 0.0% 30 < 50% 0.3%
Default 100% D 0.0% 0.4% 0.2% 0.0% 0.0% 0.3% 50 < 100% 0.4%
TOTAL 100% 100% 100% 100% 100% 100% TOTAL 100%
2017
Investment grade
0 < 0.01% AAA/Aaa 4.3% 0.5% 0.1% 0.0% 57.6% 3.1%0.01 < 0.03% AA/Aa 43.4% 11.3% 5.0% 0.0% 28.2% 12.3% 0 < 0.2% 65.2%0.03 < 0.12% A/A 30.6% 26.0% 13.6% 9.7% 12.6% 22.7% 0.2 < 0.4% 19.3%0.12 < 0.46% BBB/Baa 12.5% 39.1% 50.0% 85.9% 1.4% 39.8% 0.4 < 0.6% 0.3%
Standardmonitoring
0.46 < 1.74% BB/Ba 4.7% 17.1% 29.6% 4.4% 0.3% 17.5% 0.6 < 1% 7.4%1.74 < 7% B/B 1.9% 4.2% 1.2% 0.1% 0.0% 3.1% 1 < 5% 5.4%
Watch list7 < 9% B/B 0.6% 0.3% 0.0% 0.0% 0.0% 0.3% 5 < 10% 0.9%
9 < 22% CCC/Caa 1.9% 0.7% 0.2% 0.0% 0.0% 0.6% 10 < 30% 0.9%22 < 100% C/C 0.0% 0.0% 0.1% 0.0% 0.0% 0.0% 30 < 50% 0.3%
Default 100% D 0.0% 0.8% 0.3% 0.0% 0.0% 0.6% 50 < 100% 0.4%
TOTAL 100% 100% 100% 100% 100% 100% TOTAL 100%
1) Estimated link between internal PDs and external ratings based on comparison of historical default outcomes.2) Household exposure based on internal ratings based (IRB) reported as exposure in the event of a default (EAD – exposure at default).

Notes Financial statements
SEB Annual Report 2018 147
Note 41 a continued Credit risk
Credit portfolio protected by guarantees, credit derivatives and collaterals1)
Group Parent company
2018Credit
portfolio
Protection viaguarantees
and creditderivatives
Protectionvia pledged
collaterals
Of which,financial
collateralsCredit
portfolio
Protection viaguarantees
and creditderivatives
Protectionvia pledged
collaterals
Of which,financial
collaterals
Banks 95,881 2,312 12,318 7,145 91,317 2,312 12,317 7,145Corporates, Real estate managementand Housing co-operative associations 1,531,763 24,397 353,424 23,789 1,376,188 22,793 292,092 23,033Public Administration 50,129 1,165 326 41,711 947 325Households 638,379 8 477,053 454 512,088 420,892 303
TOTAL 2,316,153 26,717 843,960 31,715 2,021,305 25,105 726,248 30,805
2017
Banks 90,405 2,579 17,106 16,266 84,682 645 16,652 14,678Corporates, Real estate managementand Housing co-operative associations2) 1,396,272 33,517 479,384 32,170 1,099,148 27,040 408,257 29,934Public Administration 64,787 5,234 7,716 3,495 37,023 3,615 5,536 2,598Households 619,012 3,577 467,703 3,704 502,096 338 417,691 338
TOTAL 2,170,477 44,907 971,909 55,635 1,722,949 31,638 848,135 47,548
1) Only risk mitigation arrangements eligible in capital adequacy reporting are represented in the tables above.2) Inclusive SEK 18,994m previously reported as Other assets.
For information on collaterals that have been taken in possession, see note 25 Investment properties and note 20 Equity instruments.
Debt instruments
At year-end 2018, SEB’s credit exposure in the bond portfolio amounted to SEK 141m (156). The exposure comprises all interest-bearing instruments at nominalamounts including certain credit derivatives and futures.
Distribution by geographyCentral & localgovernments Corporates Covered bonds
Asset-backedsecurities Financials Total
2018 2017 2018 2017 2018 2017 2018 2017 2018 2017 2018 2017
Sweden 13.8% 19.8% 0.8% 0.8% 9.4% 15.7% 7.0% 0.2% 31.0% 36.5%Germany 23.7% 20.6% 0.1% 0.1% 0.3% 0.2% 3.9% 0.1% 4.4% 24.2% 29.2%Norway 6.0% 3.5% 0.0% 0.3% 5.9% 3.9% 1.2% 0.9% 13.1% 8.7%Denmark 1.4% 0.1% 0.1% 0.1% 9.0% 8.0% 0.1% 0.4% 10.6% 8.5%US 6.6% 7.5% 0.0% 0.0% 0.0% 0.0% 0.0% 6.6% 7.5%Finland 2.8% 3.0% 0.1% 0.1% 1.7% 0.0% 0.1% 0.0% 4.7% 3.1%Luxembourg 3.2% 1.0% 0.3% 3.2% 1.3%Netherlands 0.4% 0.4% 0.0% 0.0% 0.0% 0.0% 0.4% 0.4%Spain 0.0% 0.0%Ireland 0.0% 0.0% 0.0% 0.0% 0.0%Portugal 0.0% 0.0%Europe, other 4.0% 3.0% 0.0% 0.0% 0.1% 0.0% 4.1% 3.1%Rest of world 2.0% 1.7% 0.0% 2.0% 1.7%
TOTAL 63.9% 60.5% 1.1% 1.5% 26.3% 27.9% 0.0% 3.9% 8.6% 6.2% 100.0% 100.0%
Distribution by rating
AAA 43.9% 42.5% 0.2% 0.2% 25.8% 27.4% 3.3% 0.1% 4.2% 70.0% 77.5%AA 12.1% 11.7% 0.0% 0.0% 0.1% 0.2% 0.2% 0.9% 12.5% 12.8%A 0.6% 0.9% 0.0% 0.1% 0.6% 0.2% 0.1% 0.9% 1.7%BBB 0.5% 0.2% 0.1% 0.1% 0.7% 0.3%BB/B 0.0% 0.2% 0.0% 0.0% 0.1% 0.2%CCC/CC 0.0% 0.0%No issue rating1) 7.2% 5.4% 0.4% 0.8% 0.3% 0.3% 7.9% 0.9% 15.8% 7.5%
TOTAL 63.9% 60.5% 1.1% 1.5% 26.3% 27.9% 0.0% 3.9% 8.6% 6.2% 100.0% 100.0%
1) Mainly German local governments (Bundesländer).

Financial statements Notes
SEB Annual Report 2018148
41b Market riskDefinitionMarket risk is the risk of losses in balance sheet positions and obligations,arising from adverse movements in market prices. Market risk can arise fromchanges in interest rates, foreign exchange rates, credit spreads, commodityand equity prices, implied volatilities, inflation and market liquidity. A clear dis-tinction is made between market risks related to trading activity, i.e., tradingbook risks, and structural market and net interest income risks, i.e., bankingbook risks. Whereas positions in the trading book are held with a trading intentand under a daily mark-to-market regime, positions in the banking book do nothave a trading intent and are typically held at amortised cost.
Risk managementMarket risk in the trading book arises from SEB’s customer-driven tradingactivities. The trading activities are carried out by the Large Corporates &Financial Institutions division in its capacity as market maker in internationalforeign exchange, equity and debt capital markets.
Market risk also arises in the form of interest rate risk in the banking bookas a result of balance sheet mismatches in currencies, interest terms and inter-est rate periods. The treasury function has overall responsibility for managingthese risks, which are consolidated centrally. The treasury function also man-ages a liquidity portfolio, which is part of SEB’s liquidity reserve. The marketrisk from the liquidity portfolio comes from credit spread risk and interest raterisk in pledgeable and higly liquid bonds. For capital adequacy purposes, theassets in this portfolio are classified as assets in the banking book as of 1 Janu-
ary 2018, while from a risk management perspective they are monitoredtogether with trading-related market risk.
Finally, market risk also arises in the bank’s traditional life insurance opera-tions and the defined benefit plans for employees as a result of mismatchesbetween the market value of assets and liabilities. Market risks in the pensionobligations and the life insurance business are not included in the market riskfigures below.Refer to note 41e for information on market risk in the lifeinsurance business.
The Board of Directors defines how much market risk is acceptable by set-ting the overall market risk limits. Limits are defined for the trading book, bank-ing book and defined benefit plans. The Group Risk Committee delegates themarket risk mandate to the divisions and the treasury function, which in turnfurther allocate the limits internally. The trading book risks are managed at thedifferent trading locations within a comprehensive set of limits including VaR,stop-loss, sensitivities and stress tests.
The risk organisation measures the market risk taken by the various unitswithin the group on a daily basis. The risk organisation also independently veri-fies the valuation of positions held at fair value and calculates the capital bufferfor prudent valuation. The risk control function is present in the trading roomsand monitors limit compliance and market prices at closing as well as valuationstandards and the introduction of new products. Market risks are reported atleast on a monthly basis to the Group Risk Committee and the Board’s Risk andCapital Committee.
SEB is exposed to the followingmarket risk types:
Risk type Defined as the risk of loss or reduced income due to Source
Interest rate risk Changes in interest rates Inherent in all banking business
Credit spread risk A change in the creditworthiness of an issuer of,for instance, a bond or a credit derivative
Primarily present in the bank’s bond holdings
Foreign exchange risk Variations in the exchange rates Foreign exchange trading and the bank’s operations in various markets
Equity price risk Variations in equity prices Market making and customer activity in equities and equity derivatives
Commodity price risk Variations in commodity prices Customer-driven activities in commodities
Volatility risk Changes in implied volatility Market making and customer activity of options across all asset classes
Inflation risk Change in inflation Bond holdings, value of assets on balance sheet
Market liquidity risk Bid-ask spread widenings Sale of assets or closing of positions
Credit value adjustment1) Variations in the counterparty credit risk basedon the expected future exposure
OTC derivative contracts
1) Credit value adjustment is fundamentally credit risk, but the exposure is calculated using market risk drivers (interest rate, currency, etc.).
Risk measurementWhen assessing the market risk exposure, SEB uses measures that capturelosses under normal and stressed market conditions. Market risks under nor-mal market circumstances are measured using Value at Risk (VaR), ExpectedShortfall (ES), as well as specific measures that are relevant for the various risktypes. These measures are complemented by stress tests and scenario analy-ses, in which potential losses under extreme market conditions are estimated.Since no method can cover all risks at all times, several approaches are used,and the results are assessed based on judgment and experience.
Value at Risk and Stressed Value at RiskVaR expresses the maximum potential loss that could arise during a certaintime period with a given degree of probability. SEB uses a historical simulationVaR model with a ten-day time horizon and 99 per cent confidence interval to
measure, limit and report VaR. The model aggregates market risk exposure forall risk types and covers a wide range of risk factors in all asset classes. SEBalso uses a stressed VaR measure, where VaR is calculated for the current port-folio using market data from a historic, turbulent time period covering theLehman Brothers’ default. The VaR model is validated using back-testing analysis.
A limitation of SEB’s VaR model is that it uses historical data to estimatepotential market changes. As such it may not predict all outcomes, especially ina rapidly changing market. Also, VaR does not take into account any actions toreduce risk as the model assumes that the portfolio is unchanged.
SEB’s VaR and stressed VaR models have been approved by the Swedish FSAfor calculation of regulatory capital requirements for all the general market risksin the bank’s trading book in the parent bank and the subsidiary SkandinaviskaEnskilda Banken S.A. in Luxembourg.
Value at Risk
TradingBook (99%, tendays)1)2018
31Dec 2018 Average2018 Average 2017Min Max
Commodities risk 6 47 15 19 18Credit spread risk 13 32 25 23 47Equity price risk 13 77 33 35 29Foreign exchange rate risk 17 81 28 41 28Interest rate risk 29 83 57 51 58Volatilities risk 14 41 34 27 19Diversification –98 –106 –108
TOTAL 49 131 95 90 91
1) 2018 excluding the liquidity portfolio, 2017 including the liquidity portfolio.
Banking Book (99%, ten days)1)
Credit spread risk 36 50 38 42 48Equity price risk 15 48 45 36 15Foreign exchange rate risk 0 2 1 0Interest rate risk 145 211 173 177 143Diversification –81 –89 –45
TOTAL 147 202 176 176 161
1) 2018 including the liquidity portfolio, 2017 excluding the liquidity portfolio.

Notes Financial statements
SEB Annual Report 2018 149
Expected ShortfallExpected Shortfall (ES) is the expected loss given a pre-defined time horizon,conditional that the loss is greater than the VaR for a specific confidence level.Thus, while VaR only shows the loss at a specific confidence level, ES takes thewhole loss distribution into account and calculates the expected loss of all ofthe worst outcomes. SEB currently uses ES to calculate the economic capitalfor market risk in the trading book.
Scenario analysis and stress testsScenario analysis and stress tests are a key part of the risk management frame-work, complementing the VaR measure. In particular, they test the portfoliosusing scenarios other than those available in the VaR simulation window, andcover longer time horizons. SEB stresses its portfolios by applying extrememovements in market factors which have been observed in the past (historicalscenarios) as well as extreme movements that could potentially happen in the
future (hypothetical or forward-looking scenarios). Reverse stress tests arealso used for the total trading portfolio as well as for individual divisions andbusiness units, to identify scenarios that would lead to a given significant loss,for instance, the breach of a stop-loss limit. This type of analysis provides man-agement with a view on the potential impact that large market moves in individ-ual risk factors, as well as broader market scenarios, could have on a portfolio.The risk tolerance framework includes limits on different stress test scenarios.
Specific risk measuresVaR and stress tests are complemented by specific risk measures includingDelta 1 per cent for interest risk, and Single and Aggregated FX for currency risk.
In addition, all units that handle risk for financial instruments valued at mar-ket are limited by a stop-loss limit. The stop-loss limit indicates the maximumloss a unit can incur before mitigating actions are taken.
CVA/DVA sensitivities
The credit and debit valuation adjustments (CVA/DVA) are sensitive to marketmovements, in particular to movements in interest rates, credit spreads andforeign exchange rates.
In order to monitor this sensitivity, SEB stresses these asset classes on a reg-ular basis and calculates the impact on the valuation adjustments. This is done
by comparing the original CVA/DVA numbers with the stressed CVA/DVA num-bers where the current rates and credit spreads have been moved up 100 basispoints and where SEK has appreciated 5 per cent to all other currencies com-pared with the current level.
2018 CVA DVA Total
Interest rates + 100bp 173 78 251Credit spreads + 100bp –696 387 –309SEK + 5% 21 –3 18
2017
Interest rates + 100bp 104 49 153Credit spreads + 100bp –685 373 –312SEK + 5% 11 –5 6
Interest rate risk
Interest rate risk refers to the risk that the value of the group’s assets, liabilitiesand interest-related derivatives will be negatively affected by changes in inter-est rates or other relevant risk factors.
The majority of the group’s interest rate risks are structural and arise withinthe banking operations when there is a mismatch between the interest fixing
periods of assets and liabilities, including derivatives.The table below shows the sensitivity to a +100 basis point change in the
interest rates on the banking and trading book by currency and in different buck-ets of maturity. This is calculated as the value change for a shift of 1 basis pointand then scaled up to reflect a 100 basis point move.
Interest rate sensitivity in trading book per time buckets
2018 < 3 months3–12
months 1–2 years 2–5 years 5–10 years >10 years Total
EUR 1 –137 617 –46 –268 –70 97SEK –19 –24 27 34 71 –29 60USD –44 48 –62 43 –35 1 –49Other –19 113 –505 31 208 192 20
TOTAL –81 0 77 62 –24 94 128
2017
EUR 20 –13 88 227 105 –256 171SEK 37 4 –53 213 152 11 364USD –91 –37 –140 –30 –32 –5 –336Other –2 –138 66 –232 –67 339 –33
TOTAL –36 –184 –39 178 158 89 166
Interest rate sensitivity in banking book per time buckets1)
2018 < 3 months3–12
months 1–2 years 2–5 years 5–10 years >10 years Total
EUR 14 –309 –221 –294 29 128 –653SEK –179 –675 –321 –586 –205 56 –1,910USD –7 36 39 –6 8 131 201Other –24 –92 –11 –33 –3 0 –163
TOTAL –196 –1,040 –514 –919 –171 315 –2,525
2017
EUR 16 –349 –16 –311 –7 116 –551SEK –199 –715 –397 –643 –258 70 –2,142USD 68 29 50 15 –4 149 307Other –15 –58 –5 –35 –4 –117
TOTAL –131 –1,093 –368 –973 –273 335 –2,503
1) by currency SEK m/100 bp

Financial statements Notes
SEB Annual Report 2018150
41c Operational riskDefinitionOperational risk is the risk of loss resulting from inadequate or failed internalprocesses, people and systems (e.g., breakdown of IT systems, mistakes, fraud,other deficiencies in internal control) or from external events (natural disas-ters, external crime, etc.). The definition includes conduct, compliance, legaland financial reporting, information-, cyber- and physical security, and ventureexecution risks, but excludes strategic and reputational risk.
Risk managementOperational risk is inherent in all of SEB’s operations and the responsibility tomanage operational risks rests with all managers throughout the bank. SEBaims to maintain a sound risk culture with low operational risk and loss levelthrough an effective internal control environment by ensuring a structuredand consistent usage of risk mitigating tools and processes.
All new or changed products, processes and/or systems as well as reorgani-sations are evaluated in a group-common New Product Approval Process(NPAP). The aim is to identify potential operational risks and ensure that pro-active measures are taken to protect SEB from entering into unintended risk-taking that cannot be immediately managed by the organisation. The processis also used for yearly reviews of significant outsourcing arrangements in thegroup.
All business units with significant risk embedded in their operations shallregularly complete Risk and Control Self-Assessments (RCSA) according to agroup-wide methodology. The assessments are designed to identify and miti-gate significant operational risks embedded in SEB’s various business and sup-port processes. There is comprehensive participation by each business unitthroughout the organisation. The RCSA framework is used to analyse SEB’soperational risk profile and help achieve operational excellence and highperformance.
SEB ensures that the organisation is prepared to respond to and operatethroughout a period of major disruption by identifying critical activities andmaintaining updated, tested and communicated business continuity plans ina group-wide system for this purpose.
All employees are required to escalate and register risk-related events orincidents so that risks can be properly identified, assessed, monitored, miti-gated and reported. SEB uses a group-wide IT application to capture risk eventsand other operational risk data for analysis and benchmarking towards peers.
SEB conducts regular training and education in key areas, including manda-tory training for all staff in information security, fraud prevention, anti-moneylaundering, know-your-customer procedures, GDPR and SEB’s Code of Conduct.SEB also has a formal whistle-blower procedure that encourages employeesto report improprieties and unethical or illegal conduct.
SEB’s approach to meet cyber and other security threats is to prioritise tech-nical protection, raise awareness and continuously enhance the cyber risk cul-ture among both employees and customers. Necessary security updates, sys-tem upgrades, and implementation of new features and secure measurementsare performed on a regular basis.
The risk organisation is responsible for measuring and reporting SEB’soperational risks. Significant incidents and the risk level, both on Group anddivisional/site level, are analysed and reported monthly to the Group ExecutiveCommittee, the Group Risk Committee and the Board’s Risk and Capital Com-mittee as well as local/divisional management. In 2018, the total losses fromoperational incidents amounted to SEK 197m (185).
Risk measurementSEB uses the Advanced Measurement Approach (AMA) to calculate the regula-tory capital requirement for operational risk.
41d Business riskDefinitionBusiness risk is the risk of lower revenues due to reduced volumes, pricepressure or competition. Business risk includes venture decision risk (relatedto undertakings such as acquisitions, large IT projects, transformations, out-sourcing, etc.). Strategic risk is close in nature to business risk, but focuses onlarge-scale or structural risk factors. Reputational risk is the risk arising fromnegative perception of SEB or the industry in general.
Risk managementBusiness, strategic and reputational risks are inherent in doing business.Digitalisation of the banking industry is accelerating and new types of competi-tors are emerging. The extensive new regulatory framework for banking andfinancial institutions is significantly impacting the industry. Corporate sustaina-bility plays an increasingly important part of a company’s reputation. SEB con-tinuously works to mitigate business, strategic and reputational risks in manyways, for example, with regular strategic business reviews, proactive cost man-agement, an agile step-by-step IT development approach, an ambitious corpo-rate sustainability agenda and active dialogues on regulatory matters.
41e Insurance riskDefinitionInsurance risk in SEB consists of all risks related to the group’s insurance opera-tions. SEB’s life insurance operations consist of unit-linked insurance and tradi-tional life insurance. The main risks include market risk and underwriting risk.
Market risk in the insurance business is the risk for losses on traditional lifeinsurance policies with guaranteed benefits due to changes in fair value ofassets and liabilities. Such changes in fair value can be caused by changes infor example interest rates, credit spreads, equity prices, exchange rates andimplied volatilities.
Underwriting risk pertains to the risk of loss or of negative changes in thevalue of insurance liabilities (technical provisions) due to inadequate pricingand/or provisioning assumptions. It includes factors such as average mortality,longevity, disability/morbidity (including risks that result from fluctuation in thetiming and amount of claim settlements), catastrophe risk (e.g., extreme orirregular events), expense risk and lapse risk (i.e., policyholder behaviour risk).
Risk management andmeasurementIn unit-linked insurance, the market risk is borne by the policyholder, while theunderwriting risk is limited. However, there is an indirect exposure to marketrisk through the policyholders’ investments, since a significant part of thefuture income stream of the life insurance business is based on assets undermanagement. The profitability for existing and new business is closely moni-tored.
Market risk in the traditional life insurance products with guaranteed returnsis mitigated through standard market risk hedging schemes and monitoredthrough asset/liability management (ALM) risk measures and stress tests. This
is supplemented by market risk tools such as VaR and scenario analysis. In thetraditional products, the difference between asset values and the guaranteedobligations constitutes a buffer which is intended to cover SEB’s risk.
Underwriting risks are controlled through the use of actuarial analysis andstress tests of the existing insurance portfolio. Mortality and disability/morbid-ity risks are reinsured for large individual claims or for several claims attributa-ble to the same event. Underwriting risk parameters are validated annually.Policyholders within certain traditional life insurance products are free to movetheir policies from SEB. The utilisation of this option has been very low histori-cally. Nevertheless, to safeguard against unplanned cash outflows, sufficientliquid investments are maintained. Regular cash flow analysis is conducted tomitigate this risk.
The risk organisation is responsible for measuring and controlling the risksinherent in SEB’s life insurance operations. Measurement and monitoring ofALM risk measures, VaR, scenario analysis and stress tests are performed ona regular basis for each insurance company. The risk organisation also has therole of independent risk management function in the respective insurance com-panies from a Solvency II perspective. Key risks are reported regularly to theGroup Risk Committee, the Board’s Risk and Capital Committee and to theboards of each insurance company.
Solvency II, effective as of 1 January 2016, is a harmonised regulatoryframework with respect to governance, internal control and capital require-ments across insurance companies in the EU. Solvency II calculations are per-formed at least monthly, and the required reporting is submitted to the financialsupervisors on a quarterly basis. Calculations show that SEB’s life companiesare financially strong and resilient to different stressed scenarios.

Notes Financial statements
SEB Annual Report 2018 151
41f Liquidity riskDefinitionLiquidity risk is the risk that the group is unable to refinance its existing assetsor is unable to meet the demand for additional liquidity. Liquidity risk alsoentails the risk that the group is forced to borrow at unfavourable rates or isforced to sell assets at a loss in order to meet its payment commitments.
Liquidity management and risk measurementThe Board of Directors has established a comprehensive framework for man-aging the bank’s liquidity requirements in the short- and long-term. The aim ofSEB’s liquidity risk management is to ensure that the group has a controlledliquidity risk situation, with adequate volumes of liquid assets in all relevantcurrencies to meet its liquidity requirements in all foreseeable circumstances,without incurring substantial cost.
The liquidity risk is managed through the limits set by the Board which arefurther allocated by the Group Risk Committee. Liquidity limits are set for thegroup, branches and specific legal entities, as well as for exposures in certaincurrencies. The treasury function has the overall responsibility for liquiditymanagement and funding, supported by local treasury centres in the group’smajor markets. The risk function regularly measures and reports limit utilisa-tion based on different market conditions and liquidity stress tests to the GroupRisk Committee and the Board’s Risk and Capital Committee.
Liquidity management and the structuring of the balance sheet from a liquid-ity point of view are built on three basic perspectives:(i) the structural liquidity perspective, in which stable funding is put in relation
to illiquid assets;(ii) the bank’s tolerance for short-term stress in the form of a shutdown of
the wholesale and interbank funding markets (wholesale funding depend-ence); and,
(iii) the bank’s tolerance to a severe stress scenario where, in addition to ashutdown of the funding market, the bank experiences a severe outflowof deposits.
Structural liquidity riskIn order to maintain a sound structural liquidity position, the structure of theliability side should be based on the composition of assets. The more long-termlending and other illiquid assets, the more stable funding is required. In SEB, this
is measured as the Core Gap ratio, which is conceptually equivalent to the BaselCommittee’s Net Stable Funding Ratio (NSFR). I.e. a ratio between stable fund-ing (over 1 year maturity) and illiquid assets (over 1 year maturity). The differ-ence between the internal Core Gap ratio and the external NSFR is that the CoreGap ratio is calculated on a more detailed level based on internal statistics,which results in different weightings of available and required stable funding.
Wholesale funding dependenceOne way of measuring tolerance for deteriorating market conditions is to assessthe time that SEB’s liquid assets would last if the wholesale and interbank fund-ing markets were closed. This measure, the maturing funding ratio, capturesthe bank’s liquid assets in relation to wholesale funding and net interbank bor-rowings that come to maturity over the coming months, or as the number ofmonths it would take to deplete the liquid assets in a scenario where all matur-ing funding must be repaid from liquid assets. Wholesale funding dependenceis also measured as the loan to deposit ratio, excluding repos and reclassifieddebt securities.
Stressed survival horizonSevere stress can be modelled by combining assumptions of a wholesale fund-ing market shutdown with assumptions of deposit outflows and drawdowns oncommitments, etc. The outcome is captured by the regulatory defined LiquidityCoverage Ratio (LCR) where, in a stressed scenario, modelled net outflows dur-ing a 30-day period are related to the amount of total liquid assets. SEB alsomeasures the time it would take for the liquid assets to be depleted in a severelystressed scenario, expressed as the stressed survival horizon. In addition, SEBmonitors various rating agencies’ survival metrics.
Internal liquidity adequacy assessment processLiquidity risk is not primarily mitigated by capital. However, there are stronglinks between a bank’s capital and liquidity position. Hence, an internal liquidityadequacy assessment process (ILAAP) complements the ICAAP. The ILAAP isdesigned to identify potential gaps against SEB’s long-term desired level ofliquidity adequacy, taking into account that effective liquidity management isa continuous process.
Liquidity reserve1)
2018 2017
SEK EUR USD Other Total SEK EUR USD Other Total
Cash and holdings in central banks 25,253 79,844 75,738 61,573 242,408 5,680 79,653 57,802 46,865 190,000Deposits in other banks available overnight 2,275 998 3,379 4,166 10,817 509 566 2,515 4,734 8,324Securities issued or guaranteed bysovereigns, central banks or multilateraldevelopment banks 9,863 11,232 24,149 6,604 51,848 3,611 19,699 18,613 988 42,911Securities issued or guaranteed bymunicipalities or other public sector entities 1,552 15,171 4,923 5,828 27,475 2,202 14,329 6,610 862 24,004Covered bonds issued by other institutions 60,409 668 456 53,928 115,460 34,099 463 413 32,878 67,852Covered bonds issued by SEB 1,478 1,478 –3,516 –3,516Securities issued by non-financialcorporations 319 –2 1 317 358 358Securities issued by financial corporations(not including covered bonds) 11,552 5,890 5,519 229 23,191 –114 5,341 4,284 287 9,797
TOTAL 112,701 113,801 114,164 132,328 472,995 42,828 120,052 90,236 86,614 339,730
1) The liquidity reserve is presented in accordance with the template defined by the Swedish Bankers’ Association. Assets included in the liquidity reserve should comply with thefollowing: Assets shall be under the control of the Treasury function in the bank, not be encumbered and be pledgeable with central banks. Furthermore, bonds shall have a maximumrisk weight of 20 per cent under the standardised approach to credit risk of the Basel II framework and a lowest rating of Aa2/AA–. Assets are disclosed using market values.
Liquidity risk management measures2018 2017
Core Gap ratio1) 110% 108%Loan to deposit ratio 137% 143%Liquidity Coverage Ratio2) 147% 145%
1) Core Gap ratio represents the Parent company, DSK Hyp AG (former SEB AG) (Germany),SEB Pank AS (Estonia), SEB Banka AS (Latvia) and SEB bankas AB (Lithuania).
2) 2018: EU definition. 2017: Swedish FSA definition.

Financial statements Notes
SEB Annual Report 2018152
Note 41 f continued Liquidity risk
Contractual maturities
The following tables present cash flows by remaining contractual maturities atthe balance sheet date and applies the earliest date on which the group can berequired to pay regardless of probability assumptions. The cash flows are not
discounted. Derivatives are reported at fair value. Obligations such as loancommitments are reported as when the obligation matures.
Group, 2018
Balance sheet(contractualmaturity dates)
Payable ondemand < 3 months1) 3–12 months 1–5 years >5 years
Notdistributed Subtotal
Discounteffect Total
Cash and cash balances at central banks 209,115 209,115 209,115Loans to central banks 24,346 8,491 476 0 33,313 –19 33,294Loans to credit institutions 10,812 20,268 8,049 4,857 506 44,492 –205 44,287
of which repos 1,461 1,461 –3 1,458General governments 420 5,283 2,316 6,341 5,396 19,756 –1,009 18,747Households 5,928 31,434 170,899 352,985 63,344 624,590 –26,822 597,768Corporates 50,402 349,863 138,686 415,092 110,825 1,064,868 –36,557 1,028,311
Loans to thepublic 56,750 386,580 311,901 774,418 179,565 1,709,213 –64,388 1,644,825of which repos 98,417 98,417 –481 97,936
Debt securities 16,747 26,576 94,183 24,353 161,859 –5,731 156,128of which eligible debt securities 14,570 14,827 39,834 10,049 79,280 –2,469 76,811of which other debt securities 1,803 11,332 54,313 14,288 81,736 –3,262 78,474
Equity instruments 50,434 50,434 50,434Derivatives 115,463 115,463 115,463Financial assets for whichthe customers bear the investment risk 269,613 269,613 269,613
Financial assets at fair value 16,747 26,576 94,183 24,353 435,510 597,370 –5,731 591,639Other 14,581 357 8 717 28,751 44,414 –57 44,357
of which other financial assets 14,425 5 564 9 15,003 –57 14,946
Total assets 301,023 446,667 347,358 873,466 205,141 464,261 2,637,916 –70,400 2,567,516of which accrued interest loans 2,423 2,423 2,423of which accrued interest debt securities 845 845 845
Deposits fromcentral banksand credit institutions 50,840 66,045 16,886 1,167 1,146 136,083 –364 135,719
of which repos 192 192 192General governments 9,609 8,130 5,321 782 3,006 26,848 –133 26,715Households 290,845 25,065 6,300 928 25 323,164 –63 323,101Corporates 558,381 175,884 8,624 10,113 9,217 762,219 –645 761,574
Deposits andborrowingsfrom thepublic 858,836 209,079 20,246 11,823 12,247 1,112,231 –841 1,111,390
of which deposits 761,616 170,390 10,008 7,169 5,960 955,143 –506 954,637of which borrowing 3,722 5 52 87 3,866 –8 3,858of which repos 3,400 3,400 –4 3,396
Financial liabilities forwhichthe customers bear the investment risk 270,556 270,556 270,556Liabilities to policyholders 10,875 1,050 3,103 6,818 21,846 21,846Certificates 33,316 107,164 3,739 144,219 –1,522 142,697Covered bonds 2,584 46,848 271,287 27,007 347,726 –13,482 334,244Other bonds 25,562 28,969 151,945 3,809 210,285 –6,556 203,729
Debt securities issued 61,462 182,981 426,971 30,816 702,230 –21,560 680,670Debt securities 70 7,008 3,144 10,222 –576 9,646Equity instruments 13,498 13,498 13,498Derivatives 96,872 96,872 96,872Other liabilities 1,315 2,047 285 3,647 –12 3,635
Financial liabilities at fair value 1,385 2,047 7,293 3,144 110,370 124,239 –588 123,651Other 11,820 1,049 605 869 26,065 40,408 –35 40,373
of which other financial liabilities 10,863 16 16 170 60 11,125 –35 11,090Subordinated liabilities 298 42,825 43,123 –8,602 34,521Equity 148,789 148,789 148,789
Total Liabilities andEquity 909,675 360,666 224,557 450,962 97,866 555,780 2,599,506 –31,990 2,567,516of which accrued interest depositsand borrowing 1,048 1,048 1,048of which accrued interest issued securities 3,704 3,704 3,704
Obligations
Loan commitments 7,453 241,376 50,268 262,779 26,780 376 589,032 589,032Acceptances and other financial facilities 16,577 26,474 27,759 26,394 39,076 154 136,434 136,434Operating lease commitments 249 746 2,757 3,466 7,218 7,218
Total liabilities, equity andobligations 933,705 628,765 303,330 742,892 167,188 556,310 3,332,190 –31,990 3,300,200

Notes Financial statements
SEB Annual Report 2018 153
Note 41 f continued Liquidity risk
Group, 2017
Balance sheet(contractualmaturity dates)
Payable ondemand <3 months1) 3–12 months 1–5 years >5 years
Notdistributed Subtotal
Discounteffect Total
Cash and cash balances at central banks 177,222 177,222 177,222Loans to central banks 5,872 6,615 305 12,791 –13 12,778Loans to credit institutions 7,881 18,206 5,510 6,397 883 38,877 –160 38,717
of which repos 56 56 56General governments 9,451 3,498 11,628 6,170 4,764 35,512 –956 34,556Households 5,760 32,957 151,106 352,485 57,388 599,696 –23,413 576,283Corporates 49,323 234,216 140,920 382,288 99,226 905,973 –30,047 875,926
Loans to thepublic 64,535 270,671 303,654 740,943 161,378 1,541,181 –54,416 1,486,765of which repos 42,417 42,417 –187 42,230
Debt securities 26,645 30,919 102,149 12,033 171,746 –2,477 169,269of which eligible debt securities 19,989 15,513 58,493 7,650 101,646 –1,471 100,175of which other debt securities 6,078 15,253 42,496 4,084 67,911 –1,006 66,905
Equity instruments 59,204 59,204 59,204Derivatives 104,868 104,868 104,868Financial assets for whichthe customers bear the investment risk 283,420 283,420 283,420
Financial assets at fair value 26,645 30,919 102,149 12,033 447,492 619,238 –2,477 616,761Other 1 14,602 446 1,496 218 207,883 224,646 18 224,664
of which other financial assets 13,097 29 1 13,127 18 13,145
Total assets 255,510 336,739 340,528 851,290 174,512 655,375 2,613,955 –57,048 2,556,908of which accrued interest loans 1,783 1,783 1,783of which accrued interest debt securities 812 812 812
Deposits fromcentral banksand credit institutions 29,055 60,645 2,230 1,956 1,756 95,642 –153 95,489
of which repos 731 731 –1 730General governments 7,783 5,257 116 190 3,650 16,996 –102 16,894Households 269,682 23,454 6,118 1,087 28 300,370 –51 300,319Corporates 514,053 162,319 5,424 21,833 11,895 715,523 –688 714,835
Deposits andborrowingsfrom thepublic 791,518 191,029 11,658 23,110 15,574 1,032,889 –841 1,032,048
of which deposits 383,696 94,067 4,881 3,689 5,874 492,207 –292 491,915of which borrowing 6,216 20 138 6,374 –10 6,364of which repos 5,889 5,889 –6 5,883
Financial liabilities forwhichthe customers bear the investment risk 284,291 284,291 284,291Liabilites to policyholders 9,414 909 2,686 5,901 18,911 18,911Certificates 46,452 28,831 8,585 83,868 –799 83,069Covered bonds 199 66,104 238,743 41,443 346,489 –13,217 333,272Other bonds 19,082 17,330 164,196 3,579 204,187 –6,496 197,691
Debt securities issued 65,733 112,265 411,524 45,023 634,545 –20,512 614,033Debt securities 506 365 6,773 3,713 11,357 –600 10,757Equity instruments 14,228 14,228 14,228Derivatives 85,434 85,434 85,434Other liabilities 1,452 2,220 231 3,903 –9 3,894
Financial liabilities at fair value 1,957 2,585 7,004 3,713 99,662 114,922 –609 114,313Other 238 17,349 1,099 530 180 204,816 224,212 –17 224,195
of which other financial liabilities 14,186 17 4 14,207 –17 14,190Subordinated liabilities 275 41,036 41,311 –8,921 32,390Equity 141,237 141,237 141,237
Total Liabilities andEquity 820,810 346,403 130,747 446,811 113,183 730,007 2,587,961 –31,053 2,556,908of which accrued interest depositsand borrowing 1,328 1,328 1,328of which accrued interest issued securities 4,227 4,227 4,227
Obligations
Loan commitments 13,129 106,972 47,541 223,644 7,307 100 398,693 398,693Acceptances and other financial facilities 12 22,890 37,497 23,213 30,671 114,283 114,283Operating lease commitments 261 782 2,628 4,523 8,193 8,193
Total liabilities, equity andobligations 833,951 476,526 216,566 696,295 155,684 730,107 3,109,130 –31,053 3,078,077
1) Includes items available overnight.

Financial statements Notes
SEB Annual Report 2018154
Note 41 f continued Liquidity risk
Parent company, 2018
Balance sheet(contractual maturity dates)
Payable ondemand <3 months1) 3–12 months 1–5 years >5 years
Notdistributed Subtotal
Discounteffect Total
Cash and cash balances at central banks 164,081 164,081 164,081Loans to credit institutions 23,619 67,330 14,388 14,784 640 120,761 –428 120,333
of which repos 200 200 200General governments 55 3,665 1,655 1,346 320 7,040 –136 6,904Households 5,346 22,314 162,301 324,270 13,630 527,861 –18,208 509,653Corporates 50,360 327,093 121,898 341,048 81,278 921,676 –27,546 894,130
Loans to thepublic 55,760 353,072 285,854 666,663 95,228 1,456,577 –45,890 1,410,687of which repos 98,377 98,377 –451 97,926
Debt securities 7,443 21,074 74,137 22,648 125,301 –6,074 119,227of which eligible debt securities 6,440 10,250 21,482 8,218 46,391 –2,021 44,370of which other debt securities 1,002 10,823 52,655 14,429 78,910 –4,053 74,857
Equity instruments 87,646 87,646 87,646Derivatives 113,282 113,282 113,282
Financial assets at fair value 7,443 21,074 74,137 22,648 200,928 326,230 –6,074 320,156Other 14,408 2,222 16,997 13,821 15,615 63,063 –44 63,019
of which other financial assets 13,143 5 558 38 13,743 –44 13,699
Total assets 243,460 442,252 323,538 772,581 132,336 216,543 2,130,711 –52,436 2,078,275of which accrued interest loans 1,936 1,936 1,936of which accrued interest debt securities 729 729 729
Deposits by credit institutions 36,025 89,482 25,665 8,509 944 160,626 –604 160,022of which repos 15 15 15
General governments 1,352 7,677 4,506 725 2,812 17,072 –113 16,959Households 225,810 8,481 2,286 398 236,975 –20 236,955Corporates 547,548 115,335 1,711 6,021 2,976 673,591 –281 673,310
Deposits andborrowingsfrom thepublic 774,710 131,493 8,503 7,144 5,787 927,638 –414 927,224
of which deposits 774,710 127,771 8,502 7,144 5,787 923,915 –409 923,506of which borrowing 3,722 3,722 –4 3,718of which repos 3,400 3,400 –4 3,396
Certificates 33,243 107,168 3,741 144,151 –1,527 142,624Covered bonds 2,584 46,851 271,324 27,016 347,775 –13,531 334,244Other bonds 25,562 28,970 151,756 3,811 210,099 –6,571 203,528
Issued securities 61,388 182,989 426,821 30,827 702,025 –21,629 680,396Debt securities 70 7,009 3,146 10,225 –579 9,646Equity instruments 13,498 13,498 13,498Derivatives 95,269 95,269 95,269Other liabilities 1,283 2,006 285 48 3,623 –10 3,613
Financial liabilities at fair value 1,353 2,006 7,294 3,146 108,815 122,614 –589 122,025Other 9,765 48 205 282 10,269 20,569 –31 20,538
of which other financial liabilities 9,574 15 16 170 9,774 –31 9,743Subordinated liabilities 0 298 42,825 43,123 –8,602 34,521Untaxed reserves 20,855 20,855 20,855Equity 112,695 112,695 112,695
Total Liabilities andEquity 810,735 293,483 219,509 449,973 83,811 252,634 2,110,144 –31,869 2,078,275of which accrued interest depositsand borrowing 873 873 873of which accrued interest issued securities 3,530 3,530 3,530
Obligations
Loan commitments 47,788 44,320 258,401 15,704 366,213 366,213Acceptances and other financial facilities 24,817 30,273 32,101 47,126 134,317 134,317Operating lease commitments 180 541 2,080 3,307 6,108 6,108
Total liabilities, equity andobligations 810,735 366,267 294,643 742,555 149,949 252,634 2,616,782 –31,869 2,584,914

Notes Financial statements
SEB Annual Report 2018 155
Note 41 f continued Liquidity risk
Parent company, 2017
Balance sheet(contractual maturity dates)
Payable ondemand < 3 months1) 3–12 months 1–5 years >5 years
Notdistributed Subtotal
Discounteffect Total
Cash and cash balances at central banks 97,741 97,741 97,741Loans to credit institutions 74,426 87,319 20,362 16,361 591 199,059 –278 198,781
of which repos 389 389 389General governments 9,096 664 284 377 170 10,590 –41 10,549Households 5,656 24,597 143,028 326,800 13,981 514,062 –16,954 497,108Corporates 52,137 200,717 115,844 295,698 54,271 718,666 –20,417 698,249
Loans to thepublic 66,888 225,978 259,155 622,875 68,421 1,243,318 –37,412 1,205,906of which repos 42,412 42,412 –182 42,230
Debt securities 21,245 28,874 70,767 8,713 129,598 –4,528 125,070of which eligible debt securities 17,764 11,298 27,725 4,115 60,902 –1,895 59,007of which other debt securities 3,481 17,575 43,042 4,598 68,696 –2,633 66,063
Equity instruments 100,665 100,665 100,665Derivatives 104,220 104,220 104,220
Financial assets at fair value 21,245 28,874 70,767 8,713 204,885 334,484 –4,528 329,956Other 15,711 2,015 20,580 17,411 4,346 60,064 –284 59,780
of which other financial assets 6,479 1,890 8,369 –284 8,085
Total assets 239,055 350,254 310,407 730,583 95,135 209,231 1,934,665 –42,502 1,892,163of which accrued interest loans 1,386 1,386of which accrued interest debt securities 824 824
Deposits by credit institutions 48,328 61,247 14,317 9,139 1,808 134,840 –279 134,561of which repos 731 731 –1 730
General governments 2,088 4,293 2 1,428 7,810 –29 7,781Households 214,857 9,432 2,172 371 226,832 –12 226,820Corporates 525,890 79,110 1,823 3,305 4,919 615,047 –170 614,877
Deposits andborrowings fromthepublic 742,835 92,835 3,998 3,676 6,347 849,690 –211 849,479
of which deposits 742,835 86,619 3,998 3,676 6,347 843,474 –207 843,267of which borrowing 6,216 6,216 –4 6,212of which repos 5,888 5,888 –4 5,884
Certificates 46,389 28,849 8,606 83,844 –852 82,992Covered bonds 204 63,667 239,123 41,702 344,696 –14,055 330,641Other bonds 18,908 17,342 163,699 3,601 203,550 –6,891 196,659
Issued securities 65,500 109,858 411,428 45,304 632,090 –21,798 610,292Debt securities 10 86 7,408 3,930 11,434 –677 10,757Equity instruments 14,228 14,228 14,228Derivatives 86,990 86,990 86,990Other liabilities 1,452 2,218 231 3,901 –7 3,894
Financial liabilities at fair value 1,462 2,304 7,638 3,930 101,218 116,553 –684 115,869Other 9,962 96 4,862 990 7,533 23,443 –62 23,381
of which other financial liabilities 6,055 3 4,840 10,898 –62 10,836Subordinated liabilities 280 41,008 41,288 –8,898 32,390Untaxed reserves 21,429 21,429 21,429Equity 104,762 104,762 104,762
Total Liabilities andEquity 791,163 231,007 130,854 436,743 99,388 234,941 1,924,095 –31,932 1,892,163of which accrued interest deposits andborrowing 826 826 826of which accrued interest issued securities 7,016 7,016 7,016
Obligations
Loan commitments 36,566 42,616 184,404 3,818 267,403 267,403Acceptances and other financial facilities 22,256 34,846 19,859 26,098 103,059 103,059Operating lease commitments 198 593 1,926 4,317 7,033 7,033
Total liabilities, equity andobligations 791,163 290,027 208,909 642,931 133,619 234,941 2,301,591 –31,932 2,269,659
1) Includes items available overnight.
Group Parent company
Average remainingmaturity (years) 2018 2017 2018 2017
Loans to credit institutions 0.60 0.86 0.56 0.39Loans to the public 2.45 2.61 2.11 2.15Deposits from credit institutions 0.24 0.37 0.38 0.45Deposits from the public 0.11 0.27 0.11 0.1Borrowing from the public 0.38 0.34 0.13 0.13Certificates 0.57 0.58 0.57 0.58Covered bonds 3.16 3.32 3.16 3.34Other bonds 2.42 2.63 2.42 2.63

Financial statements Notes
SEB Annual Report 2018156
42 Capital adequacyCapital managementSEB takes various types of risks in line with the bank’s strategy and businessplan. In order to sustain these risks and guarantee SEB’s long-term survival, thebank must maintain satisfactory capital strength. At the same time, SEB mustbalance the trade-off between financial reward and overall risk tolerance. Inparticular, SEB’s capital management balances the following dimensions:1. regulatory: the capital requirements established by the EU regulation and
directives through Swedish law on capital adequacy, and by the bank’ssupervisory authorities,
2. access to debt investors: the capitalisation level required to support acertain rating level in order to reach a debt investor base necessary forconducting SEB’s business activities,
3. access to financial products: the capital level required by corporate clientsand other counterparties to facilitate the bank’s activity in the capital mar-kets, including derivatives and foreign exchange, and
4. optimal return on equity: the balance between the shareholders’ expectedreturn on capital and risks taken.
To meet expectations of shareholders, supervisors and market participants,SEB’s capitalisation is based on an assessment of all risks incurred in SEB’s busi-ness, and forward-looking, aligned with long- and short-term business plansand with expected macroeconomic developments. Furthermore, the capitalisa-tion is stress-tested to identify the potential effect of adverse changes to SEB’sfinancial situation.
Internal capital adequacy assessment processThe internal capital adequacy assessment process (ICAAP) encompassesSEB’s internal views on material risks and their development as well as riskmeasurement models, risk governance and risk mitigants. It is linked to overallbusiness planning and establishes a strategy for maintaining appropriate capi-tal levels. Together with continuous monitoring and reporting of the capitaladequacy to the Board, this ensures that the relationship between sharehold-ers’ equity, economic capital, regulatory and rating-based requirements aremanaged so that the bank’s survival is not jeopardised. Thus, the ICAAP is inte-grated with SEB’s business planning, internal governance framework and inter-nal control systems.
SEB’s capital plan covers the strategic planning horizon and projects economicand legal capital requirements, as well as available capital resources and rele-vant ratios. It is forward-looking, taking into account current and planned busi-ness volumes as well as strategic initiatives. The capital plan is stress tested topotential down-turns in the macroeconomic environment, to strategic risk factorsidentified in the business planning, and to other relevant scenarios. The capitalplan is established annually, and updated as needs arise during the year.
Economic capital constitutes an important part of capital adequacy assessment.It is an internal measurement of risk, similar to the rules for capital adequacy inthat many of the underlying risk components are the same. The economic capi-tal calculation is based on a confidence level of 99.97 per cent, which is equiva-lent to the capital requirement for a very high rating. The economic capital orinternally assessed capital requirement for SEB Group including insurance riskamounted to SEK 67bn (64).
SEB employs an internal capital allocation framework for measuring returnon risk, named business equity. It is similar to regulatory capital models includingPillar 2 requirements and is calibrated with SEB’s capital targets.
The regulatory supervisors annually assess SEB and its ICAAP in accordancewith the parameters of the Supervisory Review and Evaluation Process (SREP).The assessment covers SEB’s capital adequacy, risk measurement models andrisk governance, among other things, and in the SREP 2018 it was concludedthat SEB is sufficiently capitalised and adequately measures and manages risks.
Regulatory requirementsThe capital adequacy requirements have evolved over the last few years,both in terms of which risks that are covered and in terms of the capital basecomponents. The requirements are split into Pillar 1 (general minimum require-ments for all institutions) and Pillar 2 (requirements based on an individualassessment of each institution). Pillar 1 requirements for CET1 is expressedas a REA ratio requirement and consists of the following components:
i) a legal minimum requirement of 4.5 per cent,ii) a capital conservation buffer of 2.5 per cent,iii) a systemic risk buffer of 3.0 per cent, andiv) countercyclical buffers for SEB’s credit exposures in Sweden, Norway,
Lithuania and UK, together amounting to 1.17%.
As opposed to Pillar 1, the Pillar 2 requirements for CET1 are not calculated as apercentage of the total REA. As a result, the Pillar 2 requirements, expressed ascapital ratio requirements (except the systemic risk requirement), are likely tovary in relation to REA over time. The Pillar 2 requirements consist of the follow-ing components:
v) specific own funds requirement for systemic risk (“Systemic risk require-ment”) expressed as a CET1 ratio requirement of 2.0 per cent; and
vi) other specific risks. The risks currently identified by the Swedish FSA thatapply to all Swedish banks are a) credit concentration risks, b) interestrate risk in the banking book, c) pension risk, and d) a maturity floor forcorporate exposures. In addition to this, SEB-specific requirements forother risks can be added as part of the SREP.
The requirements are specified below.
Ratio requirement (explicit or implicit)
Pillar 1 CET1 AT1 Tier 2 Total
Minimum requirement 4.5% 1.5% 2.0% 8.0%Capital conservation buffer 2.5% 2.5%Systemic risk buffer 3.0% 3.0%
Subtotal 10.0% 1.5% 2.0% 13.5%
Countercyclical buffer 1.2% 1.2%
TOTAL 11.2% 1.5% 2.0% 14.7%
Pillar 2 CET1 AT1 Tier 2 Total
Systemic risk requirement 2.0% 2.0%Credit concentration risk 0.3% 0.0% 0.1% 0.4%Interest rate risk in the banking book 0.5% 0.1% 0.1% 0.7%Pension risk 0.6% 0.1% 0.1% 0.8%Corporate exposures – maturity floor 0.3% 0.0% 0.1% 0.4%
TOTAL 3.7% 0.3% 0.3% 4.3%
Total requirement 14.9% 1.8% 2.3% 19.0%

Notes Financial statements
SEB Annual Report 2018 157
Note 42 continued Capital adequacy
Capital adequacy analysisConsolidated situation Parent company
2018 2017 2018 2017
Own fundsCommon Equity Tier 1 capital 125,857 118,204 108,336 101,810Tier 1 capital 141,108 132,127 123,587 115,733Total own funds 159,331 147,849 141,904 131,328
Own funds requirementRisk exposure amount 716,498 610,819 640,442 514,328Expressed as own funds requirement 57,320 48,866 51,235 41,146Common Equity Tier 1 capital ratio 17.6% 19.4% 16.9% 19.8%Tier 1 capital ratio 19.7% 21.6% 19.3% 22.5%Total capital ratio 22.2% 24.2% 22.2% 25.5%
Own funds in relation to own funds requirement 2.78 3.03 2.77 3.19
Regulatory Common Equity Tier 1 capital requirement including buffer 11.2% 10.9% 8.3% 8.2%of which capital conservation buffer requirement 2.5% 2.5% 2.5% 2.5%of which systemic risk buffer requirement 3.0% 3.0%of which countercyclical capital buffer requirement 1.2% 0.9% 1.3% 1.2%
Common Equity Tier 1 capital available to meet buffer1) 13.1% 14.9% 12.4% 15.3%
Transitional floor 80%of capital requirement according to Basel IMinimum floor own funds requirement according to Basel I 89,774 72,415Own funds according to Basel I 149,030 131,977Own funds in relation to own funds requirement Basel I 1.66 1.82
Leverage ratioExposure measure for leverage ratio calculation 2,773,608 2,519,532
of which on balance sheet items 2,311,250 2,140,093of which off balance sheet items 462,358 379,439
Leverage ratio 5.1% 5.2%
1) CET1 ratio less minimum capital requirement of 4.5 per cent excluding buffers. In addition to the CET1 requirements there is a total capital requirement of an additional 3.5 per cent.
Own fundsConsolidated situation Parent company
2018 2017 2018 2017
Total equity according to balance sheet1) 148,789 143,925 128,962 121,476
Deductions related to the consolidated situation and other foreseeable charges –14,227 –14,357 –14,017 –12,461
CommonEquity Tier 1 capital before regulatory adjustments2) 134,562 129,568 114,944 109,016
Additional value adjustments –868 –663 –839 –283Intangible assets –6,467 –6,225 –5,134 –4,955Deferred tax assets that rely on future profitability –75Fair value reserves related to gains or losses on cash flow hedges –313 –1,192 –313 –1,192Negative amounts resulting from the calculation of expected loss amounts –78 –1,307 –648Gains or losses on liabilities valued at fair value resulting from changes inown credit standing 8 99 –151 66Defined-benefit pension fund assets –816 –1,807Direct and indirect holdings of own CET1 instruments –172 –193 –172 –193
Total regulatory adjustments toCommonEquity Tier 1 –8,705 –11,364 –6,608 –7,205
CommonEquity Tier 1 capital 125,857 118,204 108,336 101,810
Additional Tier I instruments 15,251 13,922 15,251 13,922
Tier 1 capital 141,108 132,127 123,587 115,733
Tier 2 instruments 18,987 18,171 18,987 18,171Net provisioning amount for IRB-reported exposures 436 126 529Holdings of Tier 2 instruments in financial sector entities –1,200 –2,575 –1,200 –2,575
Tier 2 capital 18,222 15,722 18,316 15,596
TOTAL 159,331 147,849 141,904 131,328
1) For the parent company Total equity includes Untaxed reserves net of tax.2) The Common Equity Tier 1 capital is presented on a consolidated basis, and differs from total equity according to IFRS. The insurance business contribution to equity is excluded and
there is a dividend deduction calculated according to Regulation (EU) No 575/2013 (CRR).

Financial statements Notes
SEB Annual Report 2018158
Note 42 continued Capital adequacy
Risk exposure amountConsolidated situation Parent company
2018 2017 2018 2017
Credit risk IRB approach
Riskexposure
amountOwn funds
requirement1)
Riskexposure
amountOwn funds
requirement1)
Riskexposure
amountOwn funds
requirement1)
Riskexposure
amountOwn funds
requirement1)
Exposures to central governments orcentral banks 11,602 928 9,319 745 6,232 499 3,725 298Exposures to institutions 51,033 4,083 32,838 2,627 49,759 3,981 30,757 2,461Exposures to corporates 342,713 27,417 326,317 26,105 275,630 22,050 218,878 17,510Retail exposures 63,171 5,054 62,296 4,984 37,322 2,986 36,962 2,957
of which secured by immovable property 36,720 2,938 36,558 2,925 28,189 2,255 27,738 2,219of which retail SME 7,027 562 7,033 563 498 40 2,807 225of which other retail exposures 19,424 1,554 18,704 1,496 9,133 731 6,417 513
Securitisation positions 987 79 838 67 987 79 368 29
Total IRBapproach 469,506 37,560 431,607 34,529 369,931 29,594 290,691 23,255
Credit risk standardisedapproachExposures to central governments orcentral banks 2,241 179 4,060 325Exposures to institutions 649 52 844 68 17,793 1,423 49,917 3,993Exposures to corporates 14,539 1,163 18,197 1,456 11,072 886 8,039 643Retail exposures 13,310 1,065 12,084 967 7,881 630 7,488 599Exposures secured by mortgages onimmovable property 2,184 175 2,539 203 614 49 846 68Exposures in default 168 13 112 9 12 1 56 4Exposures associated with particularly high risk 761 61 866 69 761 61 866 69Securitisation positions 222 18Exposures in the form of collective investmentundertakings (CIU) 45 4 41 3Equity exposures 4,045 324 1,972 158 41,586 3,327 41,436 3,315Other items 5,885 471 7,801 624 4,456 356 5,946 476
Total standardisedapproach 43,827 3,506 48,739 3,899 84,176 6,734 114,594 9,167
Market riskTrading book exposures whereinternal models are applied 25,020 2,002 24,892 1,991 24,990 1,999 24,876 1,990Trading book exposures applyingstandardised approaches 7,711 617 9,881 790 7,534 603 9,786 783Foreign exchange rate risk 2,889 231 4,022 322 2,844 228 3,964 317
Totalmarket risk 35,620 2,850 38,794 3,104 35,368 2,829 38,626 3,090
Other own funds requirementsOperational risk advanced measurementapproach 47,151 3,772 48,219 3,858 35,310 2,825 35,014 2,802Settlement risk 9 1 38 3 9 1 38 3Credit value adjustment 7,605 608 6,767 541 7,428 594 6,095 488Investment in insurance business 16,633 1,331 16,633 1,331 16,633 1,331 16,633 1,331Other exposures 4,556 365 4,219 338Additional risk exposure amount2) 91,591 7,327 15,802 1,264 91,587 7,327 12,637 1,011
Total other own funds requirements 167,545 13,404 91,678 7,334 150,967 12,078 70,417 5,635
TOTAL 716,498 57,320 610,819 48,866 640,442 51,235 514,328 41,146
1) The Own funds requirement is 8 per cent of risk exposure amount according to Regulation (EU) No 575/2013 (CRR).2) At 31 December 2018 an amount of SEK 91,591m in Additional REA was established for SEB consolidated situation in compliance with the change in SFSA’s regulatory requirements,
according to Article 458, for risk-weight floors in the Swedish mortgage portfolio. At 31 December 2017, Additional REA amounted to SEK 15,802m for SEB consolidated situation,established in 2015 in agreement with the SFSA as a measure of prudence under Capital Requirements Regulation (EU) No 575/2013 (CRR) Article 3. This amount was removed inQ1 2018 following the approval of SEB’s recalibrated corporate PD model.
Average risk-weightConsolidated situation Parent company
2018 2017 2018 2017
Exposures to central governments or central banks 3.0% 3.3% 2.0% 2.1%Exposures to institutions 25.4% 24.0% 25.5% 23.9%Exposures to corporates 31.0% 31.6% 27.8% 26.5%Retail exposures 10.2% 10.4% 7.4% 7.5%
of which secured by immovable property 6.8% 7.0% 5.8% 5.9%of which retail SME 57.7% 59.6% 35.5% 42.5%of which other retail exposures 30.8% 30.7% 37.8% 37.2%
Securitisation positions 9.3% 10.6% 9.3% 12.7%
The consolidated SEB Group must also comply with capital requirements con-cerning combined banking and insurance groups, i.e. financial conglomerates.The combined capital requirement for the SEB financial conglomerate was
SEK 177,3bn while the Own funds amounted to SEK 207,5bn. In these total fig-ures, SEB Life and Pension Holding AB has contributed with Solvency II figuresfrom September 30, 2018.

Notes Financial statements
SEB Annual Report 2018 159
43 Life insurance operationsGroup
INCOME STATEMENT 2018 2017
Premium income, net 6,863 10,039Income investment contracts
– Own fees including risk gain/loss 1,471 1,525– Commissions from fund companies 1,899 1,928
3,371 3,453
Net investment income 747 5,103Other operating income 420 556
Total income, gross 11,401 19,151
Claims paid, net –4,901 –8,174Change in insurance contract provisions –1,984 –5,649
Total income, net 4,516 5,329Of which from other units within the SEB group 1,483 1,595
Direct acquisition costs investment and insurance contracts –953 –1,042Change in deferred acquisition costs –112 –122
–1,065 –1,164
Commissions received and profit share from ceded reinsurance 121 115Other expenses –1,653 –1,838
Total expenses –2,596 –2,888
Net expected credit losses –2
OPERATINGPROFIT 1,917 2,441
CHANGE IN SURPLUS VALUES IN DIVISION LIFE
Present value of new sales1) 1,054 1,045Return on existing policies 1,557 1,856Realised surplus value in existing policies –2,665 –2,999Actual outcome compared to assumptions2) –1,486 –39
Change in surplus values fromongoingbusiness, gross –1,541 –136
Capitalisation of acquisition costs –319 –316Amortisation of capitalised acquisition costs 431 439Change in deferred front end fees 23 21
Change in surplus values fromongoingbusiness, net3) –1,406 7
Financial effects due to short-term market fluctuations4) –1,664 769Change in assumptions5) –762 134
TOTALCHANGE INSURPLUSVALUES6) –3,833 910
Calculations of surplus value in the life insurance operations are based on assumptions of the future development of existing insurance contracts and a risk-adjusted discount rate. The most important assumptions (Swedish unit-linked – which represent 85 per cent (63) of the total surplus value).
Discount rate 7% 7%Surrender of endowment insurance contracts: contracts signed within 1 year / 1–4 years / 5 years / 6 years / thereafter 2% / 6% / 15% / 13% /8% 1% / 6% / 19% / 15% /9%Lapse rate of regular premiums 8.2% 8.3%Transfer rate 3.5% 3.1%Growth in fund units, gross before fees and taxes 5% 5%Inflation CPI / Inflation expenses 2% / 3% 2% / 3%Expected return on solvency margin 3% 3%Mortality The Group's experience The Group's experience
1) Sales defined as new contracts and extra premiums in existing contracts.2) The actual outcome of previously signed contracts is compared with previous assumptions and deviations are calculated. Important components are the duration of contracts and
cancellations.3) Acquisition costs are capitalised and amortised according to plan. Certain front end fees are also recorded on the balance sheet and recognized as revenue in the income statement
during several years. The reported change in surplus values is adjusted by the net effect of changes in deferred acquisition costs and front end fees during the period.4) Assumed investment return (growth in fund values) is 5.0 per cent gross before fees and taxes. Actual returns results in positive or negative financial effects.5) Effect of changes in assumptions such as frequency of surrenders, transfers out and assumed expenses.6) The calculated surplus value is not included in the SEB Group’s consolidated accounts. The surplus value is net of capitalised acquisition costs and deferred front end fees.
SUMMARISED FINANCIAL INFORMATION FOR GAMLA LIVFÖRSÄKRINGSBOLAGET SEB TRYGG LIV*
Income statement, condensed 2018 2017
Life insurance technical result 4,444 8,142Other costs and appropriations 16 60Taxes –291 –194
NETRESULT 4,169 8,008
Balance sheet, condensed
Total assets 176,190 181,308
TOTALASSETS 176,190 181,308Total liabilities 84,451 87,359Consolidation fund / equity 91,631 93,825Untaxed reserves 108 124
TOTAL LIABILITIESANDEQUITY 176,190 181,308
* SEB owns all shares of Gamla Livförsäkringsbolaget SEB Trygg Liv except for a golden share owned by Trygg-Stiftelsen. Gamla Livförsäkringsbolaget SEB Trygg Liv is not consolidatedas subsidiary of the group, since the ownership of SEB in Gamla Livförsäkringsbolaget SEB Trygg Liv does not result in control. Current year figures are unaudited.

Financial statements Notes
SEB Annual Report 2018160
44 Assets in unit-linked operationsWithin the unit-linked business SEB holds, for its customers’ account, a share ofmore than 50 per cent in 43 (26) funds, where SEB is the investment manager.
The total value of those funds amounted to SEK 124,353m (129,759) of whichSEB, for its customers’ account, holds SEK 89,547m (90,167).
45 Interest in unconsolidated structured entitiesGroup Parent company
Assets, 2018Special purpose
entitiesAsset
management1) TotalSpecial purpose
entitiesAsset
management1) Total
Loans to the public 9,778 184 9,962 9,778 184 9,962Financial assets 3 249,894 249,897 3 1,081 1,084
of which: derivatives 3 3 6 3 3 6
TOTAL 9,781 250,078 259,859 9,781 1,265 11,046
Liabilities
Deposits and borrowings from the public 375 230 605 375 230 605Financial liabilities 0 0 0 0 0 0
of which: derivatives 0 0 0 0 0 0
TOTAL 376 230 606 376 230 606
Obligations 341 341 341 341
TheGroup’smaximumexposure to loss 10,122 5,939 16,060 10,122 1,265 11,387
1) Investments in SEB- and non-SEB managed funds
Assets, 2017
Loans to the public 8,434 343 8,777 7,244 343 7,587Financial assets 2 277,606 277,608 2 1,012 1,013
of which: derivatives 2 5 7 2 5 7
TOTAL 8,435 277,949 286,384 7,246 1,355 8,600
Liabilities
Deposits and borrowings from the public 216 77 292 –87 –77 –164Financial liabilities 1 52 53 –1 –52 –53
of which: derivatives 1 52 53 –1 –52 –53
TOTAL 217 129 346 –88 –129 –217
Obligations 577 577 577 577
TheGroup’smaximumexposure to loss 9,012 20,638 29,650 7,823 1,355 9,177
1) Investments in SEB- and non-SEB managed funds
Interests in unconsolidated structured entities refers to cases when the grouphas interests in structured entities which it does not control. A structured entityis an entity that is designed so that voting or similar rights are not the dominantfactor in deciding who controls the entity, such as when any voting rights relateto administrative tasks only and the relevant activities are directed by means ofcontractual arrangements.
The group enters into transactions with structured entities in the normalcause of business for various reasons. Depending on the type of structuredentity the purpose is to support customer transactions, to engage in specificinvestment opportunities and to facilitate the start-up of certain entities.
The group has interests in the following types of structured entities:
Interests in fundsThe group establishes and manages funds to provide customers with invest-ment opportunities, SEB is considered to be the sponsor of those funds. Totalassets under management represent the size of a fund. Total assets under man-agement of funds managed by SEB are SEK 622bn (569). The total assets ofNon-SEB managed funds are not publically available and not considered mean-ingful for understanding related risks, and have therefore not been presented.In some cases the group facilitates the start-up of funds by holding units and itmay hold units in funds managed by the group or by a third party for investmentpurposes within the life business. The funds managed by the group generateincome in the form of management fees and performance fees based on theassets under management. The income from asset management is presented innote 5. The maximum exposure to loss is limited to the carrying amount of unitsheld by the group. This amount does not reflect the probable loss.
Interests in other structured entitiesThe group has had a role in establishing structured entities to support customertransactions. The purpose of these entities is to provide alternative funding andliquidity improvement to the sellers and investment opportunities to investorsby purchasing assets and obtain funding for the purchases with the assets ascollateral. The group provides senior revolving credit facilities and administra-tive services to the entities and earn fee and interest income on market basedconditions.
The group holds the most senior investments in debt instruments issued bybanks, through securitisation vehicles (SPV) whose purpose is to provide alter-native funding to the issuers and investment opportunities to investors. TheSPVs purchase pools of asset from the originating banks balance sheet, e.g.credit card loans, residential mortgage loans, loans to small and medium sizedenterprises and fund these purchases by issuing debt securities with the assetsas collateral. The securities have multiple tranches of subordination.
The maximum exposure to loss regarding investments in other structuredentities is limited to the carrying amount of the investments and may occur onlyafter losses by creditors with junior exposures. The maximum exposure to lossdoes not reflect the probability of loss and hedging or collateral arrangementsare not considered. The total assets for these entities are not considered mean-ingful information for the purpose of understanding the related risks and there-fore have not been presented.

Notes Financial statements
SEB Annual Report 2018 161
46 Related partiesGroup
Associated companies Key management Other related parties
Group, 2018Assets/
Liabilities InterestAssets/
Liabilities InterestAssets/
Liabilities Interest
Loans to the public 830 18 246 4 71 1Notional amount of derivatives 2,837Deposits and borrowings from the public 51 38 717
2017
Loans to the public 960 13 227 3 30Notional amount of derivatives 1,575Deposits and borrowings from the public 105 38 260
Parent company
Associated companies Group companies
Parent company, 2018Assets/
Liabilities InterestAssets/
Liabilities Interest
Loans to credit institutions 39,575 106Loans to the public 830 17 6,638 56Interest-bearing securities 1,233 32Positive replacement values of derivatives 580Other assets 5 726 5
TOTAL 835 17 48,752 199
Deposits from credit institutions 28,955 –470Deposits and borrowings from the public 51 1 13,884 –19Negative replacement values of derivatives 1,641Other liabilities 1 147 –4
TOTAL 52 1 44,627 –493
2017
Loans to credit institutions 138,931 126Loans to the public 11,887 68Interest-bearing securities 875 9 2,605 53Positive replacement values of derivatives 3,862Other assets 24,092
TOTAL 875 9 181,377 247
Deposits from credit institutions 46,490 –415Deposits and borrowings from the public 4 10,359 –52Negative replacement values of derivatives 6,228Other liabilities 240
TOTAL 4 63,317 –467
Key management above refers to the Board of Directors and the Group Execu-tive Committee. Entities with significant influence or significantly influenced bykey management in the group, and post-employment benefit plans are pre-sented as other related parties. Investor AB and the pension foundation SEB-stiftelsen are within this category as well as close family members to key man-agement. In addition the group has insurance administration and asset manage-ment agreements with Gamla Livförsäkringsbolaget SEB Trygg Liv based on
conditions on the market. SEB has received SEK 120m (120) under the insur-ance administration agreement and SEK 402m (381) under the asset manage-ment agreement. For more information on Gamla Livförsäkringsbolaget SEBTrygg Liv, see note 43.
The parent company is a related party to its subsidiaries and associates.See note 22 Investments in associates and subsidiaries for disclosures ofinvestments.

Financial statements Notes
SEB Annual Report 2018162
47 Financial assets and liabilities subject to offsetting or netting arrangementsFinancial assets and liabilities subject to offsetting or netting arrangements
Related arrangements Other instrumentsin balance sheet
not subject tonetting
arrangementsGroup, 2018Gross
amounts OffsetNet amounts inbalance sheet
Masternetting
arrangements
Collateralsreceived/
pledgedNet
amounts
Total inbalancesheet
Derivatives 119,346 –4,593 114,753 –59,473 –32,842 22,439 710 115,463Reversed repo receivables 158,494 –60,367 98,127 –2,892 –95,235 1,258 99,385Securities borrowing 28,690 28,690 –28,497 193 208 28,898Client receivables 190 –190 12,826 12,826
ASSETS 306,720 –65,150 241,570 –62,364 –156,574 22,632 15,002 256,572
Derivatives 100,059 –4,593 95,467 –59,473 –25,894 10,100 1,406 96,872Repo payables 63,433 –60,367 3,066 –2,892 175 522 3,588Securities lending 26,059 26,059 –25,388 670 3 26,062Client payables 190 –190 9,572 9,572
LIABILITIES 189,742 –65,150 124,591 –62,364 –51,283 10,945 11,502 136,094
2017
Derivatives 111,634 –7,826 103,808 –58,922 –29,374 15,512 1,060 104,868Reversed repo receivables 104,354 –61,735 42,620 –6,613 –36,007 42,620Securities borrowing 3,782 3,782 –3,165 –512 105 12,955 16,736Client receivables 11,817 11,817
ASSETS 219,770 –69,560 150,210 –68,701 –65,892 15,617 25,832 176,042
Derivatives 92,496 –7,826 84,670 –58,922 –18,293 7,455 763 85,434Repo payables 68,348 –61,735 6,613 –6,613 6,613Securities lending 9,604 9,604 –3,165 –6,152 287 911 10,515Client payables 10,894 10,894
LIABILITIES 170,448 –69,560 100,888 –68,701 –24,445 7,742 12,569 113,456
Financial assets and liabilities subject to offsetting or netting arrangements
Related arrangements Other instrumentsin balance sheet
not subject tonetting
arrangementsParent company, 2018Gross
amounts OffsetNet amounts inbalance sheet
Masternetting
arrangements
Collateralsreceived/
pledgedNet
amounts
Total inbalancesheet
Derivatives 113,282 113,282 –58,486 –32,642 22,154 113,282Reversed repo receivables 158,494 –60,367 98,127 –2,892 –95,235 98,127Securities borrowing 28,700 28,700 –6,966 –21,733 28,700Client receivables 190 –190 12,429 12,429
ASSETS 300,666 –60,557 240,109 –68,344 –149,610 22,154 12,429 252,538
Derivatives 95,269 95,269 –58,486 –25,894 10,888 95,269Repo payables 63,259 –60,367 2,892 –2,892 519 3,411Securities lending 25,388 25,388 –6,966 –18,422 25,388Client payables 190 –190 8,509 8,509
LIABILITIES 184,106 –60,557 123,548 –68,344 –44,316 10,888 9,029 132,577
2017
Derivatives 104,220 104,220 –57,904 –29,155 17,161 104,220Reversed repo receivables 104,354 –61,735 42,620 –6,613 –36,007 42,620Securities borrowing 3,468 3,468 –3,165 –303 35,153 38,621Client receivables 11,620 11,620
ASSETS 212,043 –61,735 150,308 –67,682 –65,465 17,161 46,773 197,081
Derivatives 86,990 86,990 –57,904 –18,293 10,793 86,990Repo payables 68,349 –61,735 6,614 –6,614 6,614Securities lending 8,505 8,505 –3,165 –5,340 35,254 43,759Client payables 9,843 9,843
LIABILITIES 163,844 –61,735 102,110 –67,683 –23,633 10,793 45,097 147,207
The table shows financial assets and liabilities that are presented net in thebalance sheet or with potential rights to off-set associated with enforceablemaster netting arrangements or similar arrangements, together with relatedcollateral.
Financial assets and liabilities are presented net in the balance sheet whenSEB has legally enforceable rights to set-off, in the ordinary cause of businessand in the case of bankruptcy, and intends to settle on a net basis or to realizethe assets and settle the liabilities simultaneously. Repos with central counter-party clearing houses that SEB has agreements with and client receivables andclient payables are examples of instruments that are presented net in the bal-ance sheet.
Financial assets and liabilities subject to enforceable master netting arrange-ments or similar arrangements that are not presented net in the balance sheetare arrangements that are usually enforceable in the case of bankruptcy ordefault but not in the ordinary course of business or arrangements where SEBdoes not have the intention to settle the instruments simultaneously.
Assets and liabilities that are not subject to offsetting or netting arrange-ments, i.e those that are only subject to collateral agreements, are presentedas Other instruments in balance sheet not subject to netting arrangements.

Notes Financial statements
SEB Annual Report 2018 163
48 Pledged assetsGroup Parent company
2018 2017 2018 2017
Pledged assets and comparable securities for own liabilities 510,424 477,220 489,784 447,925Pledged assets for own liabilities to insurance policyholders 292,402 436,890Other pledged assets and comparable securities 97,713 136,998 82,072 114,494
TOTAL 900,539 1,051,109 571,856 562,419
Pledged assets and comparable securities for own liabilities*
Repos 31,531 77,646 31,356 77,426Assets collateralised for issued mortgage covered bonds 342,758 346,057 332,889 331,073Assets collateralised for issued public covered bonds 7,042 9,530Other collateral 129,093 43,986 125,539 39,425
of which group internal 22 23
TOTAL 510,424 477,220 489,784 447,925
* Transfers that do not qualify for derecognition.
Pledged assets for own liabilities to insurance policyholders
Assets pledged for insurance contracts 21,846 114,578Assets pledged for investment contracts1) 270,556 322,312
TOTAL 292,402 436,890
1) Shares in funds.
Other pledged assets and comparable collateral
Bonds1) 58,652 57,390 58,652 57,390Securities lending 15,641 59,443 36,939Other 23,419 20,166 23,419 20,166
TOTAL 97,713 136,998 82,072 114,494
1) Pledged but unencumbered bonds.
Transferred financial assets entirely recognized1)
Transferred assets Associated liabilitiesAssociated
collateral received2)
Group, 2018Securities
lendingRepurchaseagreements Other3) Total
Securitieslending
Repurchaseagreements Other3) Total Securities lending
Equity instruments 13,255 1,211 14,467 3,734 939 4,674 8,852Debt securities 6,420 307 3,656 10,383 182 305 2,690 3,177 6,528
Financial assets held for trading 19,676 307 4,867 24,850 3,916 305 3,630 7,850 15,380
2017
Equity instruments 16,564 617 17,181 1,073 150 1,223 14,005Debt securities 13,276 5,743 200 19,220 149 5,736 2 5,886 12,748
Financial assets held for trading 29,841 5,743 817 36,401 1,222 5,736 152 7,109 26,753
Transferred assets Associated liabilitiesAssociated
collateral received2)
Parent company, 2018Securities
lendingRepurchaseagreements Other3) Total
Securitieslending
Repurchaseagreements Other3) Total Securities lending
Equity instruments 13,170 1,211 14,381 3,710 898 4,608 8,794Debt securities 6,420 307 732 7,459 177 305 481 5,940
Financial assets held for trading 19,590 307 1,943 21,840 3,886 305 898 5,089 14,734
2017
Equity instruments 16,492 617 17,109 1,041 1,041 13,916Debt securities 13,276 5,743 200 19,220 134 5,736 5,869 11,976
Financial assets held for trading 29,768 5,743 817 36,329 1,174 5,736 6,910 25,892
1) Carrying amount and fair value are the same.2) Other than cash collateral.3) Assets provided as collateral for derivatives trading, clearing etc.
Pledged assetsAssets are transferred for repurchase agreements and securities lending agree-ments. The counterpart has the right to sell or repledge the assets. Other trans-ferred assets refer to assets provided as collateral for derivatives trading, clear-ing etc., where the title to the instrument has been transferred to the counter-party. The assets continue to be recognised on SEB’s balance sheet since SEB isstill exposed to changes in the fair value of the assets. The carrying value and fairvalue of the assets transferred as collateral for liabilities or contingent liabilitiesare shown in the table above.
SEB issues covered bonds secured by mortgage loans pledged as securityaccording to the local legislation. The pledged securities are mainly residentialmortgages in single family homes, tenant owned homes or other residential
apartment buildings. The loan-to-value ratio does not exceed 75 per cent. In theevent of SEB’s insolvency, the holders of the covered bonds have priority to theassets registered as collateral.
Obtained collateralSEB obtains collateral under reverse repurchase agreements and securities bor-rowing agreements. Under the terms of standard financial market agreementsSEB has the right to sell or repledge the collateral, subject to returning equivalentsecurities on settlement of the transactions.
More information about the accounting of repurchase agreements and securi-ties lending can be found in the accounting principles.

Financial statements Notes
SEB Annual Report 2018164
49 ObligationsGroup Parent company
2018 2017 2018 2017
Contingent liabilities 136,435 122,896 134,317 103,059Commitments 589,032 563,181 535,168 435,488
TOTAL 725,467 686,077 669,486 538,547
Contingent liabilities
Ownacceptances 1,297 2,122 1,232 2,096Financial guarantees given1) 19,932 22,145 22,546 30,742
of which group internal 11,912 11,402Other guarantees given 115,206 98,629 110,539 70,221
of which group internal 3,129 7,760
Guarantees given 135,138 120,774 133,085 100,962
TOTAL 136,435 122,896 134,317 103,059
1) SEB does not regularly securitise its assets and has no outstanding own issues.
Other contingent liabilitiesThe parent company has undertaken to the Monetary Authority of Singaporeto ensure that its subsidiary in Luxembourg’s branch in Singapore is able to fulfilits commitments.
The parent company has issued a deposit guarantee for DSK Hyp AG (formerSEB AG) in Germany to the Bundesverband deutscher Banken e.V.
Legal proceedingsWithin the ordinary course of business SEB is engaged in various legal proceed-ings, both in Sweden and in other jurisdictions. SEB does not expect these cur-rent legal proceedings to have a significant adverse effect on the financial posi-tion of the group.
Risks and uncertaintiesThe German Federal Ministry of Finance issued a circular on 17 July 2017 withadministrative guidance in relation to withholding taxes on dividends in connec-tion with certain cross-border securities lending and derivative transactions;so-called cum-cum transactions. The circular states an intention to examinetransactions executed prior to the change in tax legislation that was enacted1 January 2016. Ongoing audits by the local tax administration have to dateresulted in preliminary minor reclaims on selected tax years. SEB has requestedthat these reclaims should be revoked.
Following a review, SEB is of the opinion that the cross-border securitieslending and derivative transactions of SEB in Germany up until 1 January 2016were conducted in compliance with then prevailing rules. Hence, to date no pro-visions have been made. Nevertheless, it cannot be ruled out that the outcomeof potential future tax claims may have a negative financial effect on SEB.
CommitmentsGroup Parent company
2018 2017 2018 2017
Granted undrawn credit facilities 377,440 333,917 361,371 266,966of which group internal 169 339
Unutilised part of overdraft facilities 104,027 132,161 66,183 75,802of which group internal 9,643 7,333
Repledged collaterals 99,239 90,160 99,289 90,237of which group internal 247 286
Other commitments given 8,325 6,944 8,325 2,484
Other commitments 589,032 563,181 535,168 435,488
TOTAL 589,032 563,181 535,168 435,488
Discretionary managed assetsDiscretionary managed assets in the parent company amounted to SEK 385bn (498).
50 Future minimum lease payments for operational leases*Group Parent company
2018 2017 2018 2017
Year 2018 1,042 791Year 2019 994 836 721 606Year 2020 888 694 645 486Year 2021 758 584 566 439Year 2022 629 514 479 394Year 2023 and later 3,948 4,523 3,695 4,317
TOTAL 7,217 8,193 6,108 7,033
* Leases for premises and other operational leases where SEB is the lessee.

Notes Financial statements
SEB Annual Report 2018 165
51 Finance leases*Group
2018 2017
Book value 63,240 62,107Gross investment 67,710 66,694Present value of minimum lease payment receivables 62,337 61,904Unearned finance income 4,254 4,391The unguaranteed residual value 684 480Reserve for impaired uncollectable minimum lease payments –176Expected credit losses allowances –178
* Financial leases where SEB is the lessor.
Group2018 Group 2017
Bookvalue
Grossinvestment
Presentvalue
Bookvalue
Grossinvestment
Presentvalue
Remaining maturity– maximum 1 year 7,503 7,994 7,668 8,097 8,377 8,113– more than 1 year but maximum 5 years 33,581 37,689 35,210 28,663 30,073 28,817– more than 5 years 22,156 22,027 19,459 25,347 28,244 24,974
TOTAL 63,240 67,710 62,337 62,107 66,694 61,904
The leased assets mainly comprise transport vehicles, machinery and facilities. The largest lease engagement amounts to SEK 5.6 billion (6.6).
52 Non-current assets and disposal groups classified as held for saleGroup
Non-current assets and disposal groups classified as held for sale 2018 2017
Financial assets at fair value through profit or loss 175,506Other assets 8,505
TOTAL 184,011
Liabilities of disposal groups classified as held for sale
Liabilities to policyholders 133,688Financial liabilities at fair value through profit or loss 34,469Other liabilities 10,553
TOTAL 178,710
In December 2017 SEB signed an agreement to sell all shares in SEB Pensions-forsikring A/S and SEB Administration A/S (SEB Pension) to Danica PensionLivsforsikringsaktieselskab (Danica, a subsidiary to Danske Bank). SEB Pensionconsists of a portfolio of life and pension contracts and approximately 275employees. All conditions for the sale have been fulfilled and the business
including employees, customer contracts and systems were transferred fromSEB to Danica on 7 June 2018. SEB Pension was reported in the Life & Invest-ment Management division.
During the second quarter 2018 the Baltic division completed the divest-ment of investment properties.
53 IFRS 9 and 15 transition disclosures – SEB GroupThe transition disclosures outline the changes to SEB’s financial statements asof 1 January 2018 from primarily three areas: (1) the effects of IFRS 15 Reve-nue from Contracts with Customers and the restatement of the income state-ment and the balance sheet, (2) a change in the presentation of SEB’s balancesheet to better reflect the new requirements under IFRS 9 Financial Instru-ments and (3) the effects of transition from IAS 39 to IFRS 9 as of 1 January2018. Additional information about SEB’s adoption of IFRS 15 and IFRS 9 isavailable in note 1 Acccounting policies.IFRS 15: The main effect from IFRS 15 is the change in the treatment of
contract costs for investment contracts within Life where a smaller part ofdeferred acquisition costs (DAC) is now recognised as an asset. This changehas resulted in a decrease of the deferred acquisition cost in the balance sheetof SEK 2,640m. The effect was recognised in the first quarter 2018, as a reduc-tion of the opening balance of retained earnings as of 1 January 2017. Similarly,net fees and commissions in the 2017 income statement were restated reduc-ing income by SEK 47m.IFRS9:As of 1 January 2018, IFRS 9 introduced new requirements for clas-
sification and measurement, impairment and hedge accounting. SEB’s balancesheet has been adjusted to better reflect the measurement categories andaccounting policies under IFRS 9. The new balance sheet applies from 1 Janu-ary 2018. In order to facilitate comparison, the balance sheet per 31 December2017 is presented in both the new and old format. The new balance sheet andmore detailed information about the differences between IAS 39 and IFRS 9are presented in note 53a and 53b.
The new requirements implied a change in the classification and measurementof financial assets and liabilities which reduced the 2018 opening balance forretained earnings by SEK 2,396m. The available-for-sale category under IAS 39,where fair value changes were reported in Other comprehensive income,ceased and valuations of fair value are reported in Net financial income. Cer-tain holdings in Treasury that were classified as available-for-sale are nowclassified as amortised cost and some equity instrument’s reclassificationsresulted in a posititve of SEK 884m. As a result, a net positive fair value in theamount of SEK 620m was recognised. Regarding the classification and meas-urement of financial liabilities, the rules entail a change of reporting the owncredit risk adjustment (OCA). Under IAS 39, the change in OCA was reportedin Net financial income and is now reported in Other comprehensive income.The classification of bonds issued by SEB AG (renamed to DSK Hyp AG) matur-ing beyond the year 2020 changed to fair value through profit or loss fromamortised cost. This reduced the opening balance of retained earnings bySEK 1,847m. An aggregate overview of the transitional effects from classifica-tion and measurement under IFRS 9, along with a detailed description for eachportfolio, is presented in note 53c and 53d.
The impairment model for credit losses was changed from an incurred lossmodel to an expected loss model which resulted in an increase of allowancesamounting to SEK 1,578m. The net effect after tax is a SEK 1,170m reductionof retained earnings. The increase in allowances was driven by three main fac-tors: First, all items in scope were each assigned a reserve. Second, there wasan increase of allowances for off-balance sheet commitments mainly in the

Financial statements Notes
SEB Annual Report 2018166
retail portfolios. Third, a forward-looking view of the macroeconomic develop-ment was incorporated in the calculation of expected credit losses. There arethree different scenarios that reflect SEB’s view on macroeconomic develop-ment. Further information on expected credit losses and gross carryingamounts is provided in note 53f.
Under the current Capital Requirements Regulation (CRR), any shortfallbetween accounting provisions and regulatory expected losses is deductedfrom Common Equity Tier 1 (CET1) capital, while any excess is added back to
Tier 2 capital. The first time application of the new expected credit loss modelhad a positive effect on SEB’s CET1 capital amounting to SEK 30m. The negativeeffect on equity from increased provisions was offset by a reduction in theshortfall deduction. Further, the total risk exposure amount (REA) decreasedby SEK 5bn due to lower capital requirements for defaulted exposures.
The net effect from IFRS 9 following shortfall adjustments and reducedREA reduced SEB’s CET1 ratio with 18 bps.
53a Transition disclosures – change in presentation of balance sheet – SEB Group
IFRS 15 Revenue from Contracts with Customers is applicable as of 1 January2018. The main effect from IFRS 15 on SEB relates to the treatment of contractcosts for investment contracts within Life that has changed so that a smallerpart of deferred acquisition costs (DAC) is recognised as an asset. The changehas resulted in a decrease of the deferred acquisition cost in the balance sheetof SEK 2,640m. The effect has been recognised in the first quarter 2018 as areduction of the opening balance of retained earnings as of 1 January 2017.Similarly, net fees and commissions in the 2017 income statement has beenrestated reducing income by SEK 47m. These changes are included in therestated balance sheet.
As of 1 January 2018, SEB has changed its presentation of the balance sheet inorder to better reflect the measurement categories and accounting principlesunder IFRS 9. The table demonstrates the remapping of SEB Group’s balancesheet, where the closing balances under IAS 39 (previous presentation layout)has been restated with respect to IFRS 15, and then presented under the newbalance sheet structure in order to facilitate for an efficient reconciliationbetween closing balances under IAS 39 and the opening balances under IFRS 9.The table also provides information on the amounts that have been movedbetween the balance sheet items under the previous presentation structureto the balance sheet items under the new presentation structure.
SEB (previous presentation)
RestatedClosing balance1)
31 December2017
Change inpresentation
Newpresentation ofClosing balance
31 December2017 SEB (new presentation)
Cash and cash balances at central banks 177,222 177,222 Cash and cash balances at central banksOther lending to central banks 12,778 12,778 Loans to central banksLoans to credit institutions 34,715 4,002 38,717 Loans to credit institutionsLoans to the public 1,484,803 1,962 1,486,765 Loans to the public
Securities held for trading 157,885 –157,885Derivatives held for trading 98,281 –98,281Derivatives held for hedging 6,587 –6,587Financial assets – designated at fair valuethrough profit or loss 313,203 –313,203
Financial assets at fair value through profit or loss 575,955 –575,955Available-for-sale financial assets 27,776 –27,776
169,269 169,269 Debt securities59,204 59,204 Equity instruments
283,420 283,420Financial assets for which the customersbear the investment risk
104,868 104,868 DerivativesFair value changes of hedged items ina portfolio hedge 93 93
Fair value changes of hedged items ina portfoliohedge of interest rate risk
Investment accounted for using the equity method 472Other investments in associates 842
Investments in subsidiaries and associates 1,314 1,314 Investments in subsidiaries and associatesIntangible assets1) 8,030 8,030 Intangible assetsProperty and equipment 1,130 1,130 Properties and equipmentInvestment properties 203 203 Investment properties
Tangible and intangible assets1) 9,364Current tax assets 5,255 5,255 Currrent tax assetsDeferred tax assets 260 260 Deferred tax assets
Tax assets 5,515Trade and client receivables 13,040 –13,040Other financial assets 19,007 –19,007Other non-financial assets 11,316 –11,316
Other assets 43,3625,280 5,280 Retirement benefit assets
16,856 16,856 Other assets2,232 2,232 Prepaid expenses and accrued income
Non-current assets and disposal groupsclassified as held for sale 184,011 184,011
Non-current assets and disposal groupsclassified as held for sale
Other assets1) 243,659 –18,994 224,664 Other assets
TOTALASSETS 2,556,908 0 2,556,908 TOTALASSETS
1) IFRS 15 Revenue from Contracts with Customers is applied retrospectively from 1 January 2018.

Notes Financial statements
SEB Annual Report 2018 167
Note 53 a continued Transition disclosures – change in presentation of balance sheet – SEB Group
SEB (previous presentation)
RestatedClosing balance1)
31 December2017
Change inpresentation
Newpresentation ofClosing balance
31 December2017 SEB (new presentation)
Deposits from central banks and credit institutions 89,076 6,413 95,489Deposits from central banks and creditinstitutions
Deposits and borrowing from the public 1,004,721 27,327 1,032,048 Deposits and borrowings from the public
Liabilities to policyholders – investment contracts 284,291 284,291Financial liabilities for which the customersbear the investment risk
Liabilities to policyholders – insurance contracts 18,911 18,911 Liabilities to policyholdersLiabilities to policyholders 303,202Debt securities issued 614,033 614,033 Debt securities issued
Liabilities held for trading 28,879 –28,879Derivatives held for trading 84,571 –84,571Derivatives held for hedging 863 –863
Financial liabilities at fair value throughprofit or loss 114,313 –114,313
24,985 24,985 Short positions85,434 85,434 Derivatives
3,894 3,894 Other financial liabilitiesFair value changes of hedged items ina portfolio hedge 1,046 1,046
Fair value changes of hedged items ina portfolio hedge of interest rate risk
Current tax liabilities 1,463 1,463 Current tax liabilitiesDeferred tax liabilities 8,079 8,079 Deferred tax liabilities
Tax liabilities 9,542Trade and client payables 13,142 –13,142Other financial liabilities 33,766 –33,766Other non-financial liabilities 18,720 –18,720
Other liabilities 65,62926,572 26,572 Other liabilities
5,316 5,316 Accrued expenses and prepaid incomeProvisions 3,009 –1,325 1,684 Provisions
1,325 1,325 Retirement benefit liabilitiesSubordinated liabilities 32,390 32,390 Subordinated liabilitiesLiabilities included in disposal groupsclassified as held for sale 178,710 178,710
Liabilities included in disposal groupsclassified as held for sale
Other liabilities 290,325 –33,740 256,585 Other liabilities
Total liabilities 2,415,671 0 2,415,671 Total liabilities
Share capital 21,942 21,942 Share capitalOther reserves 4,403 4,403 Other reservesRetained earnings1) 114,893 114,893 Retained earnings
Shareholders' equity1) 141,237 141,237 Shareholders' equity
Total equity1) 141,237 0 141,237 Total equity
TOTAL LIABILITIESANDEQUITY 2,556,908 0 2,556,908 TOTAL LIABILITIESANDEQUITY
1) IFRS 15 Revenue from Contracts with Customers is applied retrospectively from 1 January 2018.

Financial statements Notes
SEB Annual Report 2018168
53b Transition disclosures – from IAS 39 to IFRS 9 – SEB Group
The tables show the transition effects of IFRS 9 on SEB’s balance sheet asa result of new measurement categories and ECL allowance under the new
balance sheet structure, reconciling the closing balances under IAS 39 as of31 December 2017 with the opening balances under IFRS 9 as of 1 January 2018.
IFRS 9 Financial instruments
SEK m
New presentation ofClosing balance
31 December 2017Change of
classificationsChange in ECL
allowancesOpening balance1 January 2018
Cash and cash balances at central banks 177,222 177,222Loans to central banks 12,778 12,778Loans to credit institutions 38,717 –2 38,715Loans to the public 1,486,765 14 –972 1,485,808Debt securities 169,269 –341 –1 168,928Equity instruments 59,204 884 60,087Financial assets for which the customers bear the investment risk 283,420 283,420Derivatives 104,868 104,868
Fair value changes of hedged items in a portfolio hedge of interest rate risk 93 93Investments in subsidiaries and associates 1,314 1,314Intangible assets 8,030 8,030Properties and equipment 1,130 1,130Investment properties 203 203Currrent tax assets 5,255 5,255Deferred tax assets 260 260Retirement benefit assets 5,280 5,280Other assets 16,856 –2 16,854Prepaid expenses and accrued income 2,232 2,232Non-current assets and disposal groups classified as held for sale 184,011 184,011
Other assets 224,664 –2 224,662
TOTALASSETS 2,556,908 557 –977 2,556,489
IFRS 9 Financial instruments
SEK m
New presentation ofClosing balance
31 December 2017Change of
classificationsChange in ECL
allowancesOpening balance1 January 2018
Deposits from central banks and credit institutions 95,489 15 95,504Deposits and borrowings from the public 1,032,048 2,656 1,034,704Financial liabilities for which the customers bear the investment risk 284,291 284,291Liabilities to policyholders 18,911 18,911Debt securities issued 614,033 54 614,087Short positions 24,985 24,985Derivatives 85,434 85,434Other financial liabilities 3,894 3,894
Fair value changes of hedged items in a portfolio hedge of interest rate risk 1,046 –868 178Current tax liabilities 1,463 –72 –413 978Deferred tax liabilities 8,079 –2 5 8,082Other liabilities 26,572 26,572Accrued expenses and prepaid income 5,316 5,316Provisions 1,684 601 2,285Retirement benefit liabilities 1,325 1,325Subordinated liabilities 32,390 32,390Liabilities held for sale 178,710 178,710
Other liabilities1) 2) 256,585 –942 193 255,836
Total liabilities 2,415,671 1,783 193 2,417,647
Share capital 21,942 21,942Other reserves 4,403 –1,236 3,167Retained earnings1) 114,893 9 –1,170 113,732
Shareholders’ equity 141,237 –1,227 –1,170 138,841
Total equity 141,237 –1,227 –1,170 138,841
TOTAL LIABILITIESANDEQUITY 2,556,908 557 –977 2,556,489
1) Remeasurement of portfolio hedges (SEK –868m), current tax liabilities (SEK –72m) and deferred tax liabilities (SEK –2m).2) ECL allowance (SEK 601m), current tax liabilities (SEK –413m) and deferred tax liabilities (SEK 5m).

Notes Financial statements
SEB Annual Report 2018 169
53c Transition disclosures – overview of changes to measurement categories on transition to IFRS 9 – SEB Group
These tables provides a complete overview of the transition from measure-ment categories and carrying amounts under IAS 39 as of 31 December 2017to the measurement categories and carrying amounts under IFRS 9 as of 1 Jan-uary 2018. The change in carrying amounts following transition is a result ofnew measurement categories for financial assets and liabilities and ECL allow-
ance (expected credit losses) for financial assets valued at amortised cost andoff-balance sheet exposures under IFRS 9. For more details on the change inclassification and measurement, see the detailed classification and measure-ment tables in note 53d.
AssetsSEK m
Closing balance 2017-12-31 under IAS 39 measurement categories Opening balance 2018-01-01 under IFRS 9 measurement categories
HFT FVO AFS LaR Other1) Total FVHFT FVMPL FVDPL AmC Other1) Total
Cash and cashbalances at centralbanks 177,222 177,222 177,222 177,222Loans to centralbanks 12,778 12,778 334 12,444 12,778Loans to creditinstitutions 38,717 38,717 56 38,659 38,715Loans to the public 1,486,765 1,486,765 42,250 1,012 1,442,546 1,485,808Debt securities 109,513 20,902 25,824 13,030 169,269 33,983 108,135 7,647 19,162 168,928Equity instruments 48,371 8,880 1,952 59,204 48,371 11,716 60,087Financial assets forwhich the custom-ers bear the invest-ment risk 283,420 283,420 283,420 283,420Derivatives 98,281 6,587 104,868 98,281 6,587 104,868Other assets 13,041 211,623 224,664 13,039 211,623 224,662
TOTAL 256,165 313,203 27,776 1,741,554 218,211 2,556,908 223,275 404,283 7,647 1,703,072 218,211 2,556,489
LiabilitiesSEK m
Closing balance 2017-12-31 under IAS 39 measurement categories Opening balance 2018-01-01 under IFRS 9 measurement categories
HFT FVO AmC Other1) Total FVHFT FVDPL AmC Other1) Total
Deposits fromcentral banks andcredit institutions 95,489 95,489 731 63 94,710 95,504Deposits andborrowings fromthe public 1,032,048 1,032,048 5,893 11,831 1,016,980 1,034,704Financial liabilitiesfor which thecustomers bear theinvestment risk 284,291 284,291 284,291 284,291Liabilities to policy-holders 18,911 18,911 18,911 18,911Debt securitiesissued 24,388 589,645 614,033 24,630 589,457 614,087Short positions 24,985 24,985 24,985 24,985Derivatives 84,571 863 85,434 84,571 863 85,434Other financialliabilities 3,894 3,894 3,894 3,894Other liabilities 13,142 243,443 256,585 13,142 242,694 255,836Equity 141,237 141,237 138,841 138,841
TOTAL 113,450 308,679 1,730,325 404,455 2,556,908 120,074 320,815 1,714,289 401,310 2,556,489
1) Refers to non-financial assets and liabilities, equity and hedge accounting derivatives measured at fair value through profit and loss.
53d Transition disclosures – detailed presentation of changes to measurement categories on transition toIFRS 9 – SEB Group
The following tables reconcile the previous classification categories under IAS 39 as of 31 December 2017 with the classification categories under IFRS 9 as of1 January 2018.
Assets
Loans, SEK m Classification & Measurement ECL allowances
IAS 39 ClassificationCarrying amount
31 December 2017 Change Remeasurement ImpairmentCarrying amount
1 January 2018 IFRS 9 Classification
Loans and receivables 1,538,260 –1,538,260Reclassified to FVTPL held for trading 42,625 14 42,640 FVTPL held for tradingReclassified to FVTPL mandatorily 1,012 1,012 FVTPLmandatorilyTo Amortised cost 1,494,623 –974 1,493,649 Amortised cost
TOTAL 1,538,260 0 14 –974 1,537,300
As part of the business model assessment, SEB’s repurchase agreement port-folio (reverse repos) has been assessed to meet the criteria for a ‘held for trad-ing’ business model. As such, these instruments have been reclassified fromloans & receivables to fair value through profit or loss held for trading as of1 January 2018. The effect of this reclassification amounts to SEK 14m which
has been recorded in retained earnings as of 1 January 2018.As part of the business model assessment, a portion of loans within the loan
syndication business has been assessed to meet the criteria for a ‘hold to sell’business model. As such, these instruments have been reclassified from loans& receivables to fair value through profit or loss mandatorily.

Financial statements Notes
SEB Annual Report 2018170
Note 53d continued Transition disclosures – detailed presentation of changes to measurement categories on transition to IFRS 9 – SEB Group
Debt securities, SEK m Classification & Measurement ECL allowances
IFRS 9 ClassificationIAS 39 ClassificationCarrying amount
31 December 2017 Change Remeasurement ImpairmentCarrying amount
1 January 2018
Held for trading 109,513 –109,513Reclassified to FVTPL mandatorily 75,530 75,530 FVTPLmandatorilyTo FVTPL held for trading 33,983 33,983 FVTPL held for trading
TOTAL 109,513 0 109,513
As of 1 January 2018, SEB has reclassified SEK 76bn of securities held for trad-ing as fair value through profit or loss mandatorily. The portfolio is managed
and evaluated on a fair value basis and is no longer considered to meet the defi-nition of trading assets.
Fair value option 20,902 –20,902Reclassified to FVTPL mandatorily 13,255 13,255 FVTPLmandatorilyTo FVTPL designated 7,647 7,647 FVTPL designated
TOTAL 20,902 0 20,902
As of 1 January 2018, SEB will no longer apply fair value option for a portion ofits debt instruments. These instruments are managed and evaluated on a fair
value basis and are therefore mandatorily measured at fair value through profitor loss under IFRS 9.
Available-for-sale 25,824 –25,824Reclassified to FVTPL mandatorily 19,350 19,350 FVTPLmandatorilyReclassified to Amortised cost 6,474 –341 –1 6,132 Amortised cost
TOTAL 25,824 0 –341 –1 25,482
As part of the business model assessment, a portion of SEB’s debt securitiespreviously classified as available-for-sale has been assessed to meet the crite-ria for FVTPL mandatorily as these bonds are managed and evaluated on a fairvalue basis. As such, these instruments have been reclassified from available-for-sale to fair value through profit or loss mandatorily. The accumulated OCIfor these debt instruments was SEK 1m as of 31 December 2017 and has beenrecognised in retained earnings as of 1 January 2018.
As of 1 January 2018, SEB has measured a portion of its portfolio previouslyclassified as available-for-sale as debt securities at amortised cost. Theseinstruments are held in a “hold to collect” business model and meet the IFRS 9
(SPPI) criteria. The fair value of these instruments 31 December 2017 wasSEK 6 474m. The accumulated OCI for the debt securities was SEK 402m asof 31 of December 2017 and where a positive market valuation of SEK hasbeen removed as of 1 January 2018. The effect on equity from remeasurement(SEK 341m), accumulated OCI and tax adjustment was SEK 264m.
As of 31 December 2018 the fair value of the debt securities at amortisedcost, but previously classified as available-for-sale, was SEK 6,239m. A fairvalue loss of SEK 158m would have been recognised if the financial assets hadnot been reclassified.
Loans and receivables 13,030 –13,030To Amortised cost 13,030 0 13,030 Amortised cost
TOTAL 13,030 0 0 13,030
Equity instruments, SEK m Classification & Measurement ECL allowances
IAS 39 ClassificationCarrying amount
31 December 2017 Change Remeasurement ImpairmentCarrying amount
1 January 2018 IFRS 9 Classification
Held for trading 48,371 –48,371To FVTPL held for trading 48,371 48,371 FVTPL held for trading
TOTAL 48,371 0 48,371
Fair value option 8,880 –8,880Reclassified to FVTPL mandatorily 8,880 8,880 FVTPLmandatorily
TOTAL 8,880 0 8,880
As of 1 January 2018, SEB will no longer apply fair value option for a portion ofits equity instruments. Equity instruments are mandatorily measured at fair
value through profit or loss in line with IFRS 9 criteria.
Avalable-for-sale 1,952 –1,952Reclassified to FVTPL mandatorily 1,952 884 2,836 FVTPLmandatorily
TOTAL 1,952 0 884 2,836
Equity instruments are mandatorily measured at fair value through profit orloss in line with IFRS 9. The accumulated OCI for these equity instruments was
SEK 212m as of 31 December 2017 and this amount has been recognised intoretained earnings as of 1 January 2018.

Notes Financial statements
SEB Annual Report 2018 171
Note 53 d continued Transition disclosures – detailed presentation of changes to measurement categories on transition to IFRS 9 – SEB Group
Financial assets – policyholdersbearing the investment risk, SEK m Classification & Measurement ECL allowances
IAS 39 ClassificationCarrying amount
31 December 2017 Change Remeasurement ImpairmentCarrying amount
1 January 2018 IFRS 9 Classification
Fair value option 283,420 –283,420Reclassified to FVTPL mandatorily 283,420 283,420 FVTPLmandatorily
TOTAL 283,420 0 283,420
Financial assets where the policyholder bears the investment risk are managedbased on fair value. Under IAS 39 fair value option was applied for these instru-
ments, but under IFRS 9 these are mandatorily measured at fair value throughprofit or loss.
Derivatives, SEK m Classification & Measurement ECL allowances
IAS 39 ClassificationCarrying amount
31 December 2017 Change Remeasurement ImpairmentCarrying amount
1 January 2018 IFRS 9 Classification
Held for trading 98,281 –98,281To FVTPL held for trading 98,281 98,281 FVTPL held for trading
TOTAL 98,281 0 98,281
Other financial assets, SEK m Classification & Measurement ECL allowances
IAS 39 ClassificationCarrying amount
31 December 2017 Change Remeasurement ImpairmentCarrying amount
1 January 2018 IFRS 9 Classification
Loans and receivables 13,041 –13,041To Amortised cost 13,041 –2 13,039 Amortised cost
TOTAL 13,041 0 –2 13,039
Liabilities
Deposits, SEK m Classification & Measurement ECL allowances
IAS 39 ClassificationCarrying amount
31 December 2017 Change Remeasurement ImpairmentCarrying amount
1 January 2018 IFRS 9 Classification
Amortised cost 1,127,538 –1,127,538Reclassified to FVTPLheld for trading 6,613 11 6,624 FVTPL held for tradingReclassified to FVTPL designated 9,234 2,660 11,894 FVTPL designatedTo Amortised cost 1,111,690 1,111,690 Amortised cost
TOTAL 1,127,538 0 2,671 1,130,208
SEB has assessed that its repurchase agreement portfolio (repos) meetsthe criteria for held for trading liabilities. As such, these instruments havebeen reclassified from amortised cost to fair value through profit or loss as
of 1 January 2018.As of 1 January 2018, SEB has elected to apply the fair value option for a por-
tion of its deposit portfolio in order to avoid accounting mismatch.
Debt securities issued, SEK m Classification & Measurement ECL allowances
IAS 39 ClassificationCarrying amount
31 December 2017 Change Remeasurement ImpairmentCarrying amount
1 January 2018 IFRS 9 Classification
Fair value option 24,388 –24,388To FVTPL designated 24,388 24,388 FVTPL designated
TOTAL 24,388 0 24,388
Amortised cost 589,645 –589,645Reclassified to FVTPL designated 188 54 242 FVTPL designatedTo Amortised cost 589,457 589,457 Amortised cost
TOTAL 589,645 0 54 589,699
As of 1 January 2018, SEB has elected to apply the fair value option for aportion of the issued debt securities previously valued at amortised cost inorder to avoid an accounting mismatch.

Financial statements Notes
SEB Annual Report 2018172
53e Transition disclosures – impairment provisions – IAS 39 and IFRS 9 – SEB Group
The table reconciles the closing period’s impairment allowance measured inaccordance with the IAS 39 incurred loss model and the provisions for loancommitments and financial guarantee contracts in accordance with IAS 37to the new impairment allowance measured in accordance with the IFRS 9expected loss model at 1 January 2018. For each asset class the new measure-ment category under IFRS 9 is compared to the previous measurement cate-gory under IAS 39 and demonstrating the change in allowances between
IAS 39 and IFRS 9. The increase in the allowances is driven by three main fac-tors: Firstly, all items in scope are each assigned a reserve. Secondly, anincrease of allowances for off-balance sheet commitments mainly in the retailportfolios. Thirdly, the incorporation of a forward-looking view of the macroe-conomic development (based on three different scenarios reflecting SEB’sview on macroeconomic developments) in the calculation of expected creditlosses.
Classification Provision forimpairment IAS 39
31 Decembr 2017Changes in
allowances
ECL allowanceIFRS 9
1 January 2018Financial assets, SEKm IAS 39 IFRS 9
Cash and cash balances at central banks Loans and receivables Amortised costOther lending to central banks Loans and receivables Amortised costLoans to credit institutions Loans and receivables Amortised cost –2 –2Loans to the public Loans and receivables Amortised cost –4,476 –972 –5,448Debt securities Loans and receivables Amortised cost –1 –1Debt securities Available for sale Amortised costOther assets Loans and receivables Amortised cost –2 –2
TOTAL –4,476 –977 –5,453
Loan commitments andFinancial guarantees, SEK m
Provision forimpairment IAS 3731 December 2017
Changes inallowances
ECL allowanceIFRS 9
1 January 2018
TOTAL –75 –601 –676
53f Transition disclosures – exposure and expected credit loss (ECL) allowances by stage – SEB Group
The table shows gross carrying amounts for exposures on balance and nominalamounts for exposures off-balance divided by stage as a mean to put ECLallowances in context to overall exposure levels. For trade receivables a
simplified approach based on past-due information is used to calculate lossallowances.
Group, opening balance 1 January, 2018
Stage 1 (12-month ECL)
Gross carryingamounts/Nominal
amounts ECL allowancesCarrying amounts/
Net amountsECL coverage
ratio, %
Debt securities 19,166 –1 19,165Loans1) 1,410,243 –623 1,409,620
Financial assets 1,429,409 –624 1,428,785Financial guarantees and Loan commitments 471,674 –164 471,510
Total 1,901,083 –787 1,900,296 0.04
Stage 2 (lifetime ECL)
Loans1) 2) 84,466 –1,142 83,324
Financial assets 84,466 –1,142 83,324Financial guarantees and Loan commitments 16,561 –283 16,278
Total 101,027 –1,425 99,602 1.41
Stage 3 (credit impaired/lifetime ECL)
Loans1) 3) 10,225 –3,688 6,537
Financial assets 10,225 –3,688 6,537Financial guarantees and Loan commitments 1,212 –229 983
Total 11,437 –3,917 7,520 34.25
Total
Debt securities 19,166 –1 19,165Loans1) 1,504,934 –5,453 1,499,481
Financial assets 1,524,100 –5,453 1,518,646Financial guarantees and Loan commitments 489,447 –676 488,772
TOTAL 2,013,547 –6,129 2,007,418 0.30
1) Excluding demand deposits credit institutions and including trade and client receivables presented as other assets.2) Whereof gross carrying amounts SEK 1,223m and ECL allowances SEK 2m under Lifetime ECLs -simplified approach for trade receivables.3) Whereof gross carrying amounts SEK 0m and ECL allowances SEK 0m for Purchased or originated credit impaired loans.
Stage 3 loans / Total loans, gross, % 0.68Stage 3 loans / Total loans, net, % 0.44

Notes Financial statements
SEB Annual Report 2018 173
53g Transition disclosures – change in presentation of balance sheet – Skandinaviska Enskilda Banken
As of 1 January 2018, SEB has changed its presentation of the balance sheet inorder to better reflect the measurement categories and accounting principlesunder IFRS 9. The table demonstrates the remapping of SEB AB’s balancesheet, where the closing balances under IAS 39 (previous presentation layout)has been presented under the new balance sheet structure in order to facilitate
for an efficient reconciliation between closing balances under IAS 39 and theopening balances under IFRS 9. The table also provides information on theamounts that have been moved between the balance sheet items under theprevious presentation structure to the balance sheet items under the new pres-entation structure.
SEB (previous presentation)
Closing balance31 December
2017Change in
presentation
Newpresentation ofClosing balance
31 December2017 SEB (new presentation)
Cash and cash balances at central banks 97,741 97,741 Cash and cash balances at central banks8,832 8,832 Loans to central banks
Loans to credit institutions 192,591 –2,643 189,949 Loans to credit institutionsLoans to the public 1,196,824 9,082 1,205,906 Loans to the public
Securities held for trading 157,628 –157,628Derivatives held for trading 97,640 –97,640Derivatives held for hedging 6,580 –6,580Other financial assets at fair value throughprofit and loss 9 –9
Financial assets at fair value through profit or loss 261,857 –261,857Fair value changes of hedged items in a portfolio hedge 32 –32Available-for-sale financial assets 10,521 –10,521
125,070 125,070 Debt securities50,098 50,098 Equity instruments
104,220 104,220 Derivatives32 32 Fair value changes of hedged items in
a portfolio hedge of interest rate riskInvestments in associates 1,032 –1,032Shares in subsidiaries 50,567 –50,567
51,599 51,599 Investments in subsidiaries and associatesIntangible assets 1,597 1,597 Intangible assetsProperty and equipment 34,487 34,487 Properties and equipment
Tangible and intangible assets 36,084Current tax assets 1,999 1,999 Currrent tax assets
Tax assets 1,999Trade and client receivables 12,871 –12,871Other financial assets 22,282 –22,282Other non-financial assets 7,761 –7,761
Other assets 42,91418,151 18,151 Other assets
2,481 2,481 Prepaid expenses and accrued incomeOther assets 132,597 –22,250 110,347 Other assets
TOTALASSETS 1,892,163 1,892,163 TOTALASSETS
Deposits from central banks and creditinstitutions 127,539 7,022 134,561
Deposits from central banks and creditinstitutions
Deposits and borrowing from the public 822,151 27,327 849,479 Deposits and borrowings from the publicDebt securities issued 610,292 610,292 Debt securities issued
Liabilities held for trading 28,879 –28,879Derivatives held for trading 86,127 –86,127Derivatives held for hedging 863 –863
Financial liabilities at fair valuethrough profit or loss 115,869 –115,869
24,985 24,985 Short positions86,990 86,990 Derivatives
3,894 3,894 Other financial liabilitiesCurrent tax liabilities 684 684 Current tax liabilitiesDeferred tax liabilities 336 336 Deferred tax liabilities
Tax liabilities 1,021Trade and client payables 11,782 –11,782Other financial liabilities 34,350 –34,350Other non-financial liabilities 10,466 –10,466
Other liabilities 56,59719,467 19,467 Other liabilities
2,781 2,781 Accrued expenses and prepaid incomeProvisions 113 113 ProvisionsSubordinated liabilities 32,390 32,390 Subordinated liabilitiesOther liabilities 90,121 –34,350 55,772 Other liabilities
Total liabilities 1,765,973 0 1,765,973 Total liabilities
Untaxed reserves 21,429 21,429 Untaxed reserves
Share capital 21,942 21,942 Share capitalRestricted reserves 13,425 –13,425
12,260 12,260 Statutory reserve1,166 1,166 Development cost reserve
Other reserves 1,476 1,476 Fair value fundRetained earnings 50,108 50,108 Retained earningsNet profit 17,811 17,811 Net profit
Total equity 104,762 0 104,762 Total equity
TOTAL LIABILITIESANDEQUITY 1,892,163 0 1,892,163 TOTAL LIABILITIESANDEQUITY

Financial statements Notes
SEB Annual Report 2018174
53h Transition disclosures – from IAS 39 to IFRS 9 – Skandinaviska Enskilda Banken
The tables show the transition effects of IFRS 9 on SEB’s balance sheet asa result of new measurement categories and ECL allowance under the new
balance sheet structure, reconciling the closing balances under IAS 39 as of31 December 2017 with the opening balances under IFRS 9 as of 1 January 2018.
IFRS 9 Financial instruments
SEK m
New presentation ofClosing balance
31 December 2017Change of
classificationsChange in ECL
allowancesOpening balance1 January 2018
Cash and cash balances at central banks 97,741 97,741Loans to central banks 8,832 8,832Loans to credit institutions 189,949 0 189,949Loans to the public 1,205,906 14 –1,159 1,204,761Debt securities 125,070 –338 0 124,732Equity instruments 50,098 884 50,981Derivatives 104,220 104,220
Fair value changes of hedged items in a portfolio hedge of interest rate risk 32 32Investments in subsidiaries and associates 51,599 51,599Intangible assets 1,597 1,597Properties and equipment 34,487 34,487Currrent tax assets 1,999 1,999Other assets 18,151 –2 18,149Prepaid expenses and accrued income 2,481 2,481
Other assets 110,347 –2 110,345
TOTALASSETS 1,892,163 559 –1,161 1,891,561
Deposits from central banks and credit institutions 134,561 1 134,562Deposits and borrowings from the public 849,479 9 849,488Debt securities issued 610,292 610,292Short positions in securities 24,985 24,985Derivatives 86,990 86,990Other financial liabilities 3,894 3,894
Current tax liabilities 684 –74 –333 278Deferred tax liabilities 336 336Other liabilities 19,467 19,467Accrued expenses and prepaid income 2,781 2,781Provisions 113 352 466Subordinated liabilities 32,390 32,390
Other liabilities 55,772 –74 19 55,717
Total liabilities 1,765,973 –63 19 1,765,929
Untaxed reserves 21,429 21,429
Share capital 21,942 21,942Statutory reserve 12,260 12,260Development cost reserve 1,166 1,166Fair value fund 1,476 –580 896Retained earnings 50,108 1,202 –1,181 50,130Net profit 17,811 17,811
Total equity 104,762 622 –1,181 104,204
TOTAL LIABILITIESANDEQUITY 1,892,163 559 –1,161 1,891,561

Notes Financial statements
SEB Annual Report 2018 175
53i Transition disclosures – overview of changes to measurement categories on transition to IFRS 9– Skandinaviska Enskilda Banken
These tables provides a complete overview of the transition from measure-ment categories and carrying amounts under IAS 39 as of 31 December 2017to the measurement categories and carrying amounts under IFRS 9 as of1 January 2018. The change in carrying amounts following transition is a resultof new measurement categories for financial assets and liabilities and ECL
allowance (expected credit losses) for financial assets valued at amortisedcost and off-balance sheet exposures under IFRS 9. For more details on thechange in classification and measurement, see the detailed classification andmeasurement tables in note 53j.
Assets Closing balance 2017-12-31 under IAS 39 measurement categories Opening balance 2018-01-01 under IFRS 9 measurement categories
SEK m HFT FVO AFS LaR Other1) Total FVHFT FVMPL AmC Other1) Total
Cash and cashbalances at centralbanks 97,741 97,741 97,741 97,741Loans to centralbanks 8,832 8,832 334 8,498 8,832Loans to creditinstitutions 161,402 28,546 189,949 56 161,347 28,546 189,949Loans to the public 1,205,906 1,205,906 42,250 1,012 1,161,499 1,204,761Debt securities 109,258 6,197 9,615 125,070 33,727 75,530 15,474 124,732Equity instruments 48,370 9 1,719 50,098 48,370 2,611 50,981Derivatives 97,640 6,580 104,220 97,640 6,580 104,220Other assets 12,871 97,475 110,347 12,869 97,475 110,345
TOTAL 255,268 9 7,916 1,398,627 228,080 1,892,163 222,377 79,153 1,359,688 230,343 1,891,561
Liabilities Closing balance 2017-12-31 under IAS 39 measurement categories Opening balance 2018-01-01 under IFRS 9 measurement categories
SEK m HFT FVO AmC Other1) Total FVHFT FVDPL AmC Other1) Total
Deposits fromcentral banks andcredit institutions 134,561 134,561 730 133,832 134,562Deposits andborrowings fromthe public 849,479 849,479 5,884 843,604 849,488Debt securitiesissued 23,356 586,936 610,292 23,356 586,936 610,292Short positions insecurities 24,985 24,985 24,985 24,985Derivatives 86,127 863 86,990 86,127 863 86,990Other financialliabilities 3,894 3,894 3,894 3,894Other liabilities 11,782 43,990 55,772 11,782 43,935 55,717Untaxed reserves 21,429 21,429 21,429 21,429Equity 104,762 104,762 104,204 104,204
TOTAL 115,006 23,356 1,582,758 171,043 1,892,163 121,620 23,356 1,576,154 170,431 1,891,561
1) Refers to non-financial assets and liabilities, equity and hedge accounting derivatives measured at fair value through profit and loss.

Financial statements Notes
SEB Annual Report 2018176
53j Transition disclosures – detailed presentation of changes to measurement categories on transition toIFRS 9 – Skandinaviska Enskilda Banken
The following tables reconcile the previous classification categories under IAS 39 as of 31 December 2017 with the classification categories under IFRS 9 as of1 January 2018.
Assets
Loans, SEK m Classification & Measurement ECL allowances
IAS 39 ClassificationCarrying amount
31 December 2017 Change Remeasurement ImpairmentCarrying amount
1 January 2018 IFRS 9 Classification
Loans and receivables 1,376,141 –1,376,141Reclassified to Held for trading 42,625 14 42,640 FVTPL held for tradingReclassified to FVTPL mandatorily 1,012 1,012 FVTPLmandatorilyTo Amortised cost 1,332,504 –1,159 1,331,344 Amortised cost
TOTAL 1,376,141 0 14 –1,159 1,374,996
As part of the business model assessment, SEB’s repurchase agreement port-folio (reverse repos) have been assessed to meet the criteria of ‘held for trad-ing’ business model. As such, these instruments have been reclassified fromloans & receivables to fair value through profit or loss as of 1 January 2018. Theeffect of this reclassification amounts to 14 SEK m which has been recorded inretained earnings as of 1 January 2018.
As part of the business model assessment, a portion of loans related to the loansyndication business have been assessed to meet the criteria of ‘hold to sell’business model. As such, these instruments have been reclassified from loans& receivables to fair value through profit or loss mandatorily. The reclassifica-tion has not resulted in any change in the valuation of the assets.
Debt securities, SEK m Classification & Measurement ECL allowances
IAS 39 ClassificationCarrying amount
31 December 2017 Change Remeasurement ImpairmentCarrying amount
1 January 2018 IFRS 9 Classification
Held for trading 109,258 –109,258To Held for trading 33,727 33,727 FVTPL held for tradingReclassified to FVTPL mandatorily 75,530 75,530 FVTPLmandatorily
TOTAL 109,258 0 109,258
As of 1 January 2018, SEB has reclassified SEK 76m of held for trading securi-ties as fair value through profit or loss mandatorily. The portfolio is managed
and evaluated on a fair value basis and is no longer considered to meet the defi-nitions of trading assets.
Available-for-sale 6,197 –6,197Reclassified to Amortised cost 6,197 –338 0 5,859 Amortised cost
TOTAL 6,197 0 –338 0 5,859
As of 1 January 2018, SEB has measured a portion of its portfolio previouslyclassified as available-for-sale as debt securities at amortised cost. Theseinstruments are held in a “hold to collect” business model and meet the IFRS 9(SPPI) criteria. The fair value of these instruments 31 December 2017 wasSEK 6,197m. The accumulated OCI for the debt securities was SEK 402m as of31 of December 2017 and where a positive market valuation of SEK has been
removed as of 1 January 2018. The effect on equity from remeasurement(SEK 338m), accumulated OCI and tax adjustment was SEK 74m.
As of 31 December 2018 the fair value of the debt securities at amortisedcost, but previously classified as available-for-sale, was SEK 6,239m. A fairvalue loss of SEK 158m would have been recognised if the financial assets hadnot been reclassified.
Loans and receivables 9,615 –9,615To Amortised cost 9,615 0 9,614 Amortised cost
TOTAL 9,615 0 0 9,614

Notes Financial statements
SEB Annual Report 2018 177
Note 53 j continued Transition disclosures – detailed presentation of changes to measurement categories on transition to IFRS 9 – Skandinaviska Enskilda Banken
Equity instruments, SEK m Classification & Measurement ECL allowances IFRS 9
IAS 39 ClassificationCarrying amount
31 December 2017 Change Remeasurement ImpairmentCarrying amount
1 January 2018 IFRS 9 Classification
Held for trading 48,370 –48,370To Held for trading 48,370 48,370 FVTPL held for trading
TOTAL 48,370 0 48,370
Fair value option 9 –9Reclassified to FVTPL mandatorily 9 9 FVTPLmandatorily
TOTAL 9 0 9
As of 1 January 2018, SEB will no longer apply fair value option for a portion ofits equity instruments. Equity instruments have been classified at fair valuethrough profit or loss in line with IFRS 9 criteria.
Avalable-for-sale 1,719 –1,719Reclassified to FVTPL mandatorily 1,719 884 2,602 FVTPLmandatorily
TOTAL 1,719 0 884 2,602
Equity instruments have been classified to fair value through profit or loss inline with IFRS 9 criteria. The accumulated OCI reserve for these equity instru-
ments was SEK 178m as of 31 December 2017 and these amount has beenreversed into retained earnings as of 1 January 2018.
Derivatives, SEK m Classification & Measurement ECL allowances
IAS 39 ClassificationCarrying amount
31 December 2017 Change Remeasurement ImpairmentCarrying amount
1 January 2018 IFRS 9 Classification
Held for trading 97,640 –97,640To Held for trading 97,640 97,640 FVTPL held for trading
TOTAL 97,640 0 97,640
Other financial assets, SEK m Classification & Measurement ECL allowances
IAS 39 ClassificationCarrying amount
31 December 2017 Change Remeasurement ImpairmentCarrying amount
1 January 2018 IFRS 9 Classification
Loans and receivables 12,871 –12,871To Amortised cost 12,871 –2 12,869 Amortised cost
TOTAL 12,871 0 –2 12,869
Liabilities
Deposits, SEK m Classification & Measurement ECL allowances
IAS 39 ClassificationCarrying amount
31 December 2017 Change Remeasurement ImpairmentCarrying amount
1 January 2018 IFRS 9 Classification
Amortised cost 984,039 –984,039Reclassified to Held for trading 6,604 11 6,614 FVTPL held for tradingTo Amortised cost 977,436 977,436 Amortised cost
TOTAL 984,039 0 11 984,050
SEB has assessed that its repurchase agreement portfolio (repos) meets thecriteria for held for trading liabilities. As such, these instruments have been
reclassified from amortised cost to fair value through profit or loss as of1 January 2018.
Debt securities issued, SEK m Classification & Measurement ECL allowances
IAS 39 ClassificationCarrying amount
31 December 2017 Change Remeasurement ImpairmentCarrying amount
1 January 2018 IFRS 9 Classification
Fair value option 23,356 –23,356To FVTPL designated 23,356 23,356 FVTPL designated
TOTAL 23,356 0 23,356
Amortised cost 586,936 –586,936To Amortised cost 586,936 586,936 Amortised cost
TOTAL 586,936 0 586,936
As of 1 January 2018, SEB has elected to apply the fair value option for a por-tion of the issued debt securities previously valued at amortised cost in orderto avoid an accounting mismatch.

Financial statements Notes
SEB Annual Report 2018178
53k Transition disclosures – impairments – IAS 39 and IFRS 9 – Skandinaviska Enskilda Banken
The table reconciles the closing period’s impairment allowance measured inaccordance with the IAS 39 incurred loss model and the provisions for loancommitments and financial guarantee contracts in accordance with IAS 37to the new impairment allowance measured in accordance with the IFRS 9expected loss model at 1 January 2018. For each asset class the new measure-ment category under IFRS 9 is compared to the previous measurement cate-gory under IAS 39 and demonstrating the change in allowances between
IAS 39 and IFRS 9. The increase in the allowances is driven by three mainfactors: Firstly, all items in scope are each assigned a reserve. Secondly, anincrease of allowances for off-balance sheet commitments mainly in the retailportfolios. Thirdly, the incorporation of a forward-looking view of the macroe-conomic development (based on three different scenarios reflecting SEB’sview on macroeconomic developments) in the calculation of expected creditlosses.
Classification Provision forimpairment IAS 3931 Decembr 2017
Changes inallowances
ECL allowanceIFRS 9
1 January 2018Financial assets, SEK m IAS 39 IFRS 9
Cash and cash balances at central banks Loans and receivables Amortised costOther lending to central banks Loans and receivables Amortised costLoans to credit institutions Loans and receivables Amortised costLoans to the public Loans and receivables Amortised cost –2,108 –1,159 –3,267Debt securities Loans and receivables Amortised cost 0Debt securities Available for sale Amortised costOther assets Loans and receivables Amortised cost –2 –2
TOTAL –2,108 –1,161 –3,269
Loan commitments andFinancial guarantees, SEK m
Provision forimpairment IAS 3731 December 2017
Changes inallowances
ECL allowanceIFRS 9
1 January 2018
TOTAL –47 –324 –371
53l Transition disclosures – exposure and expected credit loss (ECL) allowances by stage– Skandinaviska Enskilda Banken
The table shows gross carrying amounts for exposures on balance and nominalamounts for exposures off-balance divided by stage as a mean to put ECLallowances in context to overall exposure levels. For trade receivables a simpli-
fied approach based on past-due information is used to calculate loss allow-ances.
Parent company, opening balance 1 January, 2018
Stage 1 (12-month ECL)
Gross carryingamounts/Nominal
amounts ECL allowancesCarrying amounts/
Net amountsECL coverage
ratio, %
Debt securities 12,869 12,869Loans1) 1,158,422 –389 1,158,033
Financial assets 1,171,291 –389 1,170,902Financial guarantees and Loan commitments 407,088 –128 406,960
Total 1,578,378 –517 1,577,861 0.03
Stage 2 (lifetime ECL)
Loans1) 2) 65,495 –868 64,627
Financial assets 65,495 –868 64,627Financial guarantees and Loan commitments 8,728 –109 8,620
Total 74,223 –976 73,247 1.32
Stage 3 (credit impaired/lifetime ECL)
Loans1) 3) 6,392 –2,013 4,379
Financial assets 6,392 –2,013 4,379Financial guarantees and Loan commitments 1,079 –134 945
Total 7,471 –2,147 5,324 28.74
Total
Debt securities 12,869 12,869Loans1) 1,230,308 –3,269 1,227,039
Financial assets 1,243,177 –3,269 1,239,908Financial guarantees and Loan commitments 416,895 –371 416,524
TOTAL 1,660,072 –3,641 1,656,432 0.22
1) Excluding demand deposits credit institutions and including trade and client receivables presented as other assets.2) Whereof gross carrying amounts SEK 1,251m and ECL allowances SEK 2m under Lifetime ECLs -simplified approach for trade receivables.3) Whereof gross carrying amounts SEK 0m and ECL allowances SEK 0m for Purchased or originated credit impaired loans.
Stage 3 loans / Total loans, gross, % 0.52Stage 3 loans / Total loans, net, % 0.36

Notes Financial statements
SEB Annual Report 2018 179
54 IFRS 16 transition disclosures – SEB GroupIFRS 16 Leases replaces IAS 17 Leases and related interpretations. The stand-ard is effective as from 1 January 2019 and is endorsed by the EU. The newstandard significantly changes how SEB as a lessee accounts for leases by intro-ducing a single, on-balance sheet lease accounting model requiring the recogni-tion of lease assets (right-of-use assets) and corresponding lease liabilities. Inthe income statement, the straight-line operating lease expense is replaced bydepreciation of the lease assets and an interest expense on the lease liability.The accounting requirements for lessors are in practice unchanged.
Upon transition to IFRS 16, the group has decided to apply the modified ret-rospective approach. For the purpose of applying the modified retrospectiveapproach to the leases, the group has elected, lease-by-lease, to measure theright-of-use assets either, (i) to an amount as if the group had applied IFRS 16since the commencement date using the incremental borrowing rate at thedate of initial application or, (ii) to an amount equal to the lease liability. In addi-tion, the group decided to apply the practical expedients to use hindsight whenassessing the lease term, not to recognise a right-of-use asset or lease liabilityto leases for which the lease term ends within 12 months of the date of initial
application and not to include assets of low value.The main impact on the group’s financial statements is from the accounting
of property leases. There is no significant impact on the income statement,although the presentation in the income statement changes as other expenseswill be replaced by depreciation of the right-of-use asset and interest expenseson the lease liability. There is no significant impact on large exposures and capi-tal adequacy.
The new standard also introduces new estimates and judgements thataffect the measurement of lease liabilities. SEB measures the lease liability atthe commencement date and may be required to revise it, e.g. the assessmentof whether an option is reasonably certain to be exercised. As this will increasefinancial statement volatility, this is revised and monitored by the group contin-uously. The new standard will not be applied in the legal entity reporting for theparent company.
The tables show the transition effects of IFRS 16 on SEB’s balance sheetreconciling the closing balances under IAS 17 as of 31 December 2018 withthe opening balances under IFRS 16 as of 1 January 2019.
SEK mClosing balance
31 December 2018 IFRS 16 transitionOpening balance
1 January 2019
Cash and cash balances at central banks 209,115 209,115Loans to central banks 33,294 33,294Loans to credit institutions 44,287 44,287Loans to the public 1,644,825 1,644,825Debt securities 156,128 156,128Equity instruments 50,434 50,434Financial assets for which the customers bear the investment risk 269,613 269,613Derivatives 115,463 115,463Other assets1) 44,357 5,939 50,296
TOTALASSETS 2,567,516 5,939 2,573,455
SEK mClosing balance
31 December 2018 IFRS 16 transitionOpening balance
1 January 2019
Deposits from central banks and credit institutions 135,719 135,719Deposits and borrowings from the public 1,111,390 1,111,390Financial liabilities for which the customers bear the investment risk 270,556 270,556Liabilities to policyholders 21,846 21,846Debt securities issued 680,670 680,670Short positions 23,144 23,144Derivatives 96,872 96,872Other financial liabilities 3,613 3,613Other liabilities2) 74,916 6,183 81,099
Total liabilities 2,418,727 6,183 2,424,910
Total equity 148,789 –244 148,545
TOTAL LIABILITIESANDEQUITY 2,567,516 5,939 2,573,455
1) Increase in Other assets comes from increases in Right-of-use assets SEK 5,747m, Deferred tax assets SEK 51m and Other assets SEK 141m.2) Increase in Other liabilities comes from an increase in Lease liabilities SEK 6,337m offset by decreases in Provisions SEK 122m and Other liabilities SEK 32m.
Bridge showing the transition from IAS 17 to IFRS 16 accounting for leases
SEK m
Future minimum payments for operational leases per 31 December 20181) 7,217Discounting2) –727
Present value for lease liabilities previously classified as operating leases applying IAS17 6,490
Short-term leases expensed on a straight-line basis over the lease term –43Leases for which the underlying assets is of low-value expensed on a straight-line basis –109Other –1
Lease liabilities as of 1 January2019applying IFRS16 6,337
1) Applying IAS 17, see note 50.2) The weighted average incremental borrowing rate is 1.53 per cent.

SEB Annual Report 2018180
Five-year summary The SEB Group
The SEBGroup
Income StatementSEKm 2018 20173) 20162) 20151) 2) 20141) 2)
Net interest income 21,022 19,893 18,738 19,020 19,943Net fee and commission income 18,364 17,677 16,628 18,345 17,547Net financial income 6,079 6,880 7,056 6,298 4,473Net other income 402 1,112 829 1,002 1,549
Total operating income 45,868 45,561 43,251 44,665 43,512
Staff costs –14,004 –14,025 –14,422 –14,436 –13,760Other expenses –7,201 –6,947 –6,619 –6,355 –6,815Depreciation, amortisation and impairmentof tangible and intangible assets –735 –964 –771 –1,011 –1,129
Total operating expenses –21,940 –21,936 –21,812 –21,802 –21,704
Gains less losses on disposals of tangible and intangible assets 18 –162 –150 –213 –121Net expected credit losses4) –1,166Net credit losses5) –808 –993 –883 –1,324
Operatingprofit before itemsaffecting comparability 22,779 22,655 20,296 21,767 20,363
Items affecting comparability 4,506 –1,896 –5,429 –902 2,985
Operating profit 27,285 20,759 14,867 20,865 23,348
Income tax expense –4,152 –4,562 –4,249 –4,284 –4,129
NETPROFIT 23,134 16,197 10,618 16,581 19,219
Attributable to non-controlling interests 1Attributable to shareholders 23,134 16,197 10,618 16,581 19,218
1) Comparable figures for 2015 and 2014 restated in line with changed reporting of life insurance business.2) Items affecting comparability restated.3) The 2017 income statement has been restated for the transition to IFRS 15. For transition disclosures, see note 53.4) IFRS 9 expected loss model5) IAS 39 incurred loss model.
Balance sheetSEKm 2018 20171) 2) 20161) 20151) 20141)
Cash and cash balances and loans to central banks 242,408 190,000 217,808 133,651 119,915Loans to credit institutions 44,287 38,717 50,527 58,542 90,945Loans to the public 1,644,825 1,486,765 1,467,960 1,359,092 1,368,808Other financial assets 606,584 629,907 842,817 894,161 1,011,338Other assets 29,412 211,520 41,534 50,518 50,240
TOTALASSETS 2,567,516 2,556,908 2,620,646 2,495,964 2,641,246
Deposits from central banks and credit institutions 135,719 95,489 119,864 118,506 115,186Deposits and borrowing from the public 1,111,390 1,032,048 991,950 911,829 968,375Other financial liabilities 1,120,487 1,059,241 1,230,863 1,187,794 1,278,323Other liabilities 51,131 228,892 136,993 135,037 144,786Total equity 148,789 141,237 140,976 142,798 134,576
TOTAL LIABILITIESANDEQUITY 2,567,516 2,556,908 2,620,646 2,495,964 2,641,246
1) 2017–2014 have been restated for changes in the presentation of the balance sheet, see note 53a.2) 2017 has been restated for the transition to IFRS 15. For transition disclosures, see note 53.
Key figures2018 20172) 2016 2015 2014
Return on equity, % 16.34 11.70 7.80 12.24 15.25Return on equity excluding items affecting comparability, % 13.36 12.86 11.30 12.85 13.07Basic earnings per share, SEK 10.69 7.47 4.88 7.57 8.79Cost/Income ratio 0.48 0.48 0.50 0.49 0.50Net ECL level, % 0.06Credit loss level, % 0.05 0.07 0.06 0.09Common Equity Tier 1 capital ratio1), % 17.6 19.4 18.8 18.8 16.3Tier 1 capital ratio1), % 19.7 21.6 21.2 21.3 19.5Total capital ratio1), % 22.2 24.2 24.8 23.8 22.2
1) Basel III.2) 2017 has been restated for the transition to IFRS 15. For transition disclosures, see note 53.

SEB Annual Report 2018 181
Skandinaviska Enskilda Banken Five-year summary
Skandinaviska Enskilda Banken
Income StatementSEK m 2018 2017 2016 2015 2014
Net interest income 21,860 20,017 19,242 19,488 19,783Net fee and commission income 10,064 9,557 8,843 9,200 9,235Net financial income 4,574 4,493 4,642 3,428 2,121Other income 10,900 8,323 7,398 9,165 5,089
Total operating income 47,398 42,390 40,125 41,281 36,228
Administrative expenses –15,263 –14,252 –15,039 –13,458 –13,909Depreciation, amortisation and impairmentof tangible and intangible assets –5,512 –6,377 –5,775 –5,447 –5,157
Total operating costs –20,775 –20,629 –20,814 –18,905 –19,066
Profit before credit losses 26,623 21,761 19,311 22,376 17,162
Net expected credit losses –1,020Net credit losses –749 –789 –520 –1,065Impairment of financial assets –2,928 –1,497 –3,841 –775 –2,721
Operatingprofit 22,675 19,515 14,681 21,081 13,376
Appropriations including pension compensation 2,716 1,885 2,437 781 966Taxes –3,671 –3,590 –2,740 –3,817 –2,053
NETPROFIT 21,720 17,811 14,378 18,045 12,289
Balance sheetSEKm 2018 20171) 20161) 20151) 20141)
Cash and cash balances at central banks 164,081 97,741 70,671 55,712 59,170Loans to credit institutions 120,333 198,781 287,059 164,852 190,631Loans to the public 1,410,687 1,205,906 1,192,569 1,090,488 1,069,896Other financial assets 334,801 343,890 401,831 508,072 614,485Other assets 48,373 45,845 47,714 47,480 51,960
TOTALASSETS 2,078,275 1,892,163 1,999,844 1,866,605 1,986,142
Deposits from central banks and credit institutions 160,022 134,561 168,852 134,816 144,776Deposits and borrowing from the public 927,224 849,479 812,506 718,345 731,713Other financial liabilities 846,685 770,333 885,528 877,577 977,501Other liabilities 10,794 11,599 9,823 14,621 17,587Total equity and untaxed reserves 133,550 126,191 123,135 121,246 114,565
TOTAL LIABILITIES, UNTAXEDRESERVESANDEQUITY 2,078,275 1,892,163 1,999,844 1,866,605 1,986,142
1) 2017–2014 have been restated for changes in the presentation of the balance sheet, see note 53g.
Key figures2018 2017 2016 2015 2014
Return on equity, % 18.1 16.3 12.6 16.5 11.8Cost/Income ratio 0.44 0.49 0.52 0.46 0.53Net ECL level, % 0.07Credit loss level, % 0.05 0.06 0.04 0.09Common Equity Tier 1 capital ratio1), % 16.9 19.8 18.8 19.2 16.2Tier 1 capital ratio1), % 19.3 22.5 21.7 22.1 20.0Total capital ratio1), % 22.2 25.5 26.1 25.0 23.1
1) Basel III.

Standing at the disposal of the AnnualGeneral Meeting in accordance with thebalance sheet of Skandinaviska EnskildaBanken AB:
SEKOther reserves 4,997,940Retained earnings 55,729,423,340Net profit for the year 21,720,056,940
Total1) 77,454,478,220
The Board proposes that, followingapproval of the balance sheet of Skandina-viska Enskilda Banken AB for the financialyear 2018, the Annual General Meetingshould distribute the earnings as follows:
SEKDividend to shareholders:
– SEK 6.50per Class A share 14,105,125,411
– SEK 6.50per Class C share 156,991,302
To be carried forward to:– retained earnings 63,192,361,507
Total 77,454,478,220
It is the assessment of the Board of Direc-tors that the proposed dividend is justifia-ble considering the demands which areimposed by the nature, scope, and risksassociated with the business and the sizeof the parent company’s and the group’sequity and need for consolidation, liquidityand financial position in general.
The Board of Directors and the President declare that the consoli-dated financial statements have been prepared in accordancewith IFRS as adopted by the EU and give a relevant and faithfulrepresentation of the group’s financial position and results ofoperations.
The financial statements of the parent company have beenprepared in accordance with generally accepted accounting
principles in Sweden and give a true and fair view of the parentcompany’s financial position and results of operations.
The Report of the Directors for the group and the parentcompany provides a fair review of the development of the group’sand the parent company’s operations, financial position and resultsof operations and describes material risks and uncertaintiesfacing the parent company and companies included in the group.
Stockholm 19 February 2019
Marcus WallenbergChair
Sven NymanVice Chair
Jesper OvesenVice Chair
Johan H. AndresenDirector
Signhild Arnegård HansenDirector
Samir BrikhoDirector
Winnie FokDirector
Tomas NicolinDirector
Helena SaxonDirector
Anna-Karin GlimströmDirector
Appointed by the employees
Håkan WesterbergDirector
Appointed by the employees
Johan TorgebyPresident and Chief Executive Officer
Director
Proposal for the distribution of profit
Signatures of the Board of Directors and the President
1) The parent company’s equity would have beenSEK 10,515m lower if assets and liabilities hadnot been measured at fair value in accordancewith Chapter 4, Section 14 of the SwedishAnnual Accounts Act.
SEB Annual Report 2018182
Proposal for the distribution of profit and signatures of the Board of Directors and the President

Report on the annual accountsand consolidated accounts
OpinionsWe have audited the annual accounts and consolidated accountsof Skandinaviska Enskilda Banken AB (publ) for the year 2018with the exception of the sustainability report on pages 67–73.The annual accounts and consolidated accounts of the companyare included on pages 32–182 in this document.
In our opinion, the annual accounts have been prepared inaccordance with the Annual Accounts Act for Credit Institutionsand Securities Companies and present fairly, in all materialrespects, the financial position of parent company as of 31 Decem-ber 2018 and its financial performance and cash flow for the yearthen ended in accordance with the Annual Accounts Act for CreditInstitutions and Securities Companies. The consolidated accountshave been prepared in accordance with the Annual Accounts Actfor Credit Institutions and Securities Companies and present fairly,in all material respects, the financial position of the group as of 31December 2018 and their financial performance and cash flow forthe year then ended in accordance with International FinancialReporting Standards (IFRS), as adopted by the EU, and the AnnualAccounts Act for Credit Institutions and Securities Companies.
A corporate governance report has been prepared. The reportof the directors and the corporate governance report are consist-ent with the other parts of the annual accounts and consolidatedaccounts and the corporate governance report is consistent withthe annual accounts act for Credit Institutions and SecuritiesCompanies.
We therefore recommend that the general meeting of share-holders adopts the income statement and balance sheet for theparent company and the group.
Our opinions in this report on the annual accounts and the con-solidated accounts are consistent with the content of the supple-menting report that has been presented to the audit committeeof the parent company and the group in accordance with the auditregulation (537/2014) article 11.
Basis for OpinionsWe conducted our audit in accordance with International Stand-ards on Auditing (ISA) and generally accepted auditing standardsin Sweden. Our responsibilities under those standards are furtherdescribed in the Auditor’s Responsibilities section. We are inde-pendent of the parent company and the group in accordance withprofessional ethics for accountants in Sweden and have otherwisefulfilled our ethical responsibilities in accordance with theserequirements.
This includes that, based on the best of our knowledge andbelief, no prohibited services referred to in the Audit Regulation(537/2014) Article 5.1 have been provided to the audited companyor, where applicable, its parent company or its controlled compa-nies within the EU.
We believe that the audit evidence we have obtained is suffi-cient and appropriate to provide a basis for our opinions.
Our audit approachAudit scopeWe designed our audit by determining materiality and assessing therisks of material misstatement in the consolidated financial state-ments. In particular, we considered where the Managing Directorand the Board of Directors made subjective judgements; for exam-ple, in respect of significant accounting estimates that involved mak-ing assumptions and considering future events that are inherentlyuncertain. As in all of our audits, we also addressed the risk of man-agement override of internal controls, including among other mat-ters consideration of whether there was evidence of bias that repre-sented a risk of material misstatement due to fraud.
We tailored the scope of our audit in order to perform sufficient
work to enable us to provide an opinion on the consolidated financialstatements as a whole, taking into account the structure of thegroup, the accounting processes and controls, and the industry inwhich the group operates.
The SEB group has centralized service centers, systems and pro-cesses and has a centralized finance function for its Swedish entitiesand branches in the Nordic countries and the UK. We have organizedthe audit work by having our central audit team to carry out the test-ing of all centralized systems and processes and the local auditteams to carry out additional testing based on our instructions.
Full scope audit and reporting is performed at entities with highsignificance and risk to the group. The audit is carried out in accord-ance with International Standards on Audit and local audit require-ments. The procedures applied generally include an assessmentand testing of controls over key business processes, analytical pro-cedures of individual account balances, tests of accounting recordsthrough inspection, observation or confirmation, and obtainingcorroborating evidential matter in response to inquiries.
For some entities, even though not considered to have high signifi-cance or risk, it is required from a group audit perspective to obtainassurance on certain accounting areas. In these cases, local auditteams are instructed to perform certain procedures and report backto us. The procedures applied generally include a detailed analyticalreview, reconciliation to underlying sub-ledgers, substantive testingfor specific processes, areas and accounts, discussion with manage-ment regarding accounting, tax and internal control as well asfollow-ups on known issues from previous periods.
As part of our audit we place reliance on internal controls for theapplications/systems and related platforms that support SEB’saccounting and financial reporting. Therefore, we perform auditprocedures to determine that systems and processes are designed,maintained, operated and kept secure in such a way as to provideassurance that the risk of error is minimised. The audit proceduresinclude walk-throughs of processes and evaluation of design andtest of effectiveness of controls. Substantive testing has also beenperformed. Where possible we have relied on management’s ownevaluation activities and audits performed by SEB Internal Audit.
Our audit is carried out continuously during the year with specialattention at each quarter end. In connection with the SEB group’sissuance of interim reports, we report our observations to the auditcommittee of the Board of Directors and issue interim reviewreports. At the end of the year, we also report our main observationsto the full Board of Directors.
MaterialityThe scope of our audit was influenced by our application of materi-ality. An audit is designed to obtain reasonable assurance whetherthe financial statements are free from material misstatement. Mis-statements may arise due to fraud or error. They are consideredmaterial if individually or in aggregate, they could reasonably beexpected to influence the economic decisions of users taken onthe basis of the financial statements.
Based on our professional judgement, we determined certainquantitative thresholds for materiality, including the overall materi-ality for the financial statements as a whole. These, together withqualitative considerations, helped us to determine the scope of ouraudit and the nature, timing and extent of our audit procedures andto evaluate the effect of misstatements, both individually and inaggregate on the financial statements as a whole.
Key audit mattersKey audit matters of the audit are those matters that, in our profes-sional judgment, were of most significance in our audit of theannual accounts and consolidated accounts of the current period.These matters were addressed in the context of our audit of, and informing our opinion thereon, the annual accounts and consolidatedaccounts as a whole, but we do not provide a separate opinion onthese matters.
Auditor’s reportTo the general meeting of the shareholders of Skandinaviska Enskilda Banken AB (publ), Corporate Identity Number 502032-9081
SEB Annual Report 2018 183
Auditor's Report

Key audit matterImpairment of loans to customersAccounting for impairment of loans to customers require subjec-tive judgement over both timing of recognition of impairmentand the size of any such impairment.
SEB makes provisions for expected credit losses (ECL) inaccordance with IFRS 9. Our work in relation to the implementa-tion of IFRS 9 is described in a separate Key audit matter. IFRS 9categorise loans into three stages depending on the level of creditrisk or changes in credit risk for each individual loan. Stage 1 rep-resenting a probable 12 month ECL applies to all loans unlessthere is a significant increase in credit risk since initial recognition.For loans where there is a significant increase in credit risk, stage2, or loans in default, stage 3, a lifetime ECL is calculated.
The ECL is calculated as a function of the probability ofdefault,the exposure at default and the loss given default, as wellas the timing of the loss.
IFRS 9 also allow for expert credit judgement to be applied toloan loss provisioning.
Refer to the Annual Report Note 41a – Credit risk and Note 18 –Loans.
How our audit addressed the Key audit matterOur audit included a combination of testing of internal controls overfinancial reporting and substantive testing. The testing of internalcontrols included procedures relating to the governance structure,segregation of duties and key controls in the lending processes.
In addition, our quantitative modelling experts have performeddetailed recalculations for a sample of loans and model outputs inorder for us to obtain comfort that the ECL is calculated correctlyand that it is in line with our expectations.
We have also audited adjustments related to expert credit judge-ment. We have assessed that rationale exists to have these adjust-ments accounted for at year end and we have reviewed minutes ofcredit committee and risk committee meetings to ensure that thecorrect governance procedures have been performed over theseexpert credit judgement adjustments.
Based on our work, we had no material observations for the over-all audit on the level of loan loss provisions as at 31 December 2018.
Key audit matterValuation of financialinstruments held at fair valueThe valuation of financial instruments held at fair value was anarea of audit focus due to their significance in presenting bothfinancial position and performance.
Determining fair value of financial instruments is inherentlycomplex as many instruments are complex and as input values tovaluation models such as risks and market prices are ever chang-ing. For some instruments there is also limited availability ofobservable prices or rates. Because of these factors, the valuationof some instruments involves significant management judgment.
The majority of SEB’s assets and liabilities measured at fairvalue are held for client facilitation, liquidity or hedging purposes.Between 98–99% of the positions are fair valued based onobservable prices or rates traded in active markets. The remain-ing 1–2% of the positions are valued based on models and aremainly venture capital holdings, strategic investments andcertain derivatives held for hedging purposes.
Refer to the Annual Report Note 19 – Debt securities, Note 20Equity instruments, Note 21 – Derivatives and hedge accounting,Note 22 – Investments in subsidiaries and associatesNote 30 – Debt securities issued, Note 31 – Short positions.
How our audit addressed the Key audit matterIn our audit, we assessed the design and tested the operating effec-tiveness of key controls supporting the identification, measurementand oversight of valuation risk of financial instruments.
In addition to test appropriate segregation of duties, we exam-ined SEB’s independent price verification process, model validationand approval processes, controls over data feeds and valuationinputs as well as SEB’s governance and reporting processes and
controls. We paid particular attention to controls relating to com-plex instruments.
For valuations dependent on unobservable inputs or modelswhich involved a higher degree of judgement for other reasons, weused our valuation specialists to evaluate the assumptions, method-ologies and models used by SEB. We performed independent valua-tions of a sample of positions.
Based on our work, we had no material observations for theoverall audit on the valuation of financial instruments held at marketvalue as at 31 December 2018.
Key audit matterIFRS 9 implementationIFRS 9, the new accounting standard for financial instrumentscame into effect on 1 January 2018. The standard replaces theprevious IAS 39 standard. The new standard had significanteffects on SEB’s opening balance for 2018. The two main areasaffecting SEB are:• Classification and measurement: How different types of finan-
cial instruments are to be classified and measured andaccounted for. Valuation and accounting is determined basedon the underlying business model.
• Impairment: The methodology for loan loss provisioning.The new model requires companies to use forward lookinginformation in an expected loss model instead of the currentlyused incurred loss model.
Refer to the Annual Report Note 53– IFRS 9 and 15 transitiondisclosures.
How our audit addressed the Key audit matterWe have audited the financial effects and disclosures related to thetransition from IAS 39 to IFRS 9. We have also audited overall gov-erning documents and the overall governance in SEB to ensureadherence to IFRS 9.
For Classification and measurement, we have examined SEB’sbusiness model assessments for a large number of contracts tovalidate the classifications made are in accordance with IFRS 9.
For Impairment, we have reviewed definitions made, datasources used and methodology in models used to validate adher-ence to IFRS 9. We have also tested a sample of impairment modelsto ensure that the model calculator is working as described in themodel documentation. The sample selected was risk basedaddressing either significant volumes or complex products.
Based on our work, we had no material observations for theoverall audit on the IFRS 9 implementation as at 1 January 2018.
Key audit matterProvision for uncertain tax positionsSEB is subject to taxation in many jurisdictions and, in manycases, the final tax treatment is not determined until resolvedwith the relevant tax authority. Consequently, SEB makes judge-ments about the probability and amount of tax liabilities whichare subject to assessments by tax authorities and potentiallyassociated with legal processes.
Additionally, tax legislation is under significant and rapidchange which, when becoming effective, affect both currentperiod tax costs and the valuation of tax assets.
Refer to the Annual Report Note 15 – Taxes and Note 32 –Other liabilities.
How our audit addressed the Key audit matterIn our audit of tax costs and valuation of tax assets and liabilities,we have tested internal controls and performed substantive testing.The testing of internal controls included procedures relating to thegovernance structure, segregation of duties and key controls in thetax process.
In the substantive testing we have used our tax specialists toexamine potential implications of ongoing tax audits and legal pro-cesses. We have followed correspondence with tax authorities andopinions SEB received from its external legal advisers. We have alsoindependently examined the matters in dispute and the provisionsmade by SEB.
SEB Annual Report 2018184
Auditor’s report

Based on our work, we had no material observations for the overallaudit on the level of provisions for uncertain tax positions as at31 December 2018.
Other Information than the annual accountsand consolidated accountsThis document also contains other information than the annualaccounts and consolidated accounts that is found on pages 1–31.The Board of Directors and the Managing Director are responsi-ble for this other information.
Our opinion on the annual accounts and consolidated accountsdoes not cover this other information and we do not express anyform of assurance conclusion regarding this other information.
In connection with our audit of the annual accounts and con-solidated accounts, our responsibility is to read the informationidentified above and consider whether the information is materi-ally inconsistent with the annual accounts and consolidatedaccounts. In this procedure we also take into account our knowl-edge otherwise obtained in the audit and assess whether theinformation otherwise appears to be materially misstated.
If we, based on the work performed concerning this informa-tion, conclude that there is a material misstatement of this otherinformation, we are required to report that fact. We have nothingto report in this regard.
Responsibilities of the Board of Directorsand theManaging DirectorThe Board of Directors and the Managing Director are responsi-ble for the preparation of the annual accounts and consolidatedaccounts and that they give a fair presentation in accordancewith the Annual Accounts Act for Credit Institutions and Securi-ties Companies and, concerning the consolidated accounts, inaccordance with IFRS as adopted by the EU and the AnnualAccounts Act for Credit Institutions and Securities Companies.The Board of Directors and the Managing Director are alsoresponsible for such internal control as they determine is neces-sary to enable the preparation of annual accounts and consoli-dated accounts that are free from material misstatement,whether due to fraud or error.
In preparing the annual accounts and consolidated accounts,The Board of Directors and the Managing Director are responsi-ble for the assessment of the company’s and the group’s abilityto continue as a going concern. They disclose, as applicable, mat-ters related to going concern and using the going concern basisof accounting. The going concern basis of accounting is howevernot applied if the Board of Directors and the Managing Directorintends to liquidate the company, to cease operations, or has norealistic alternative but to do so.
The Audit Committee shall, without prejudice to the Boardof Director’s responsibilities and tasks in general, among otherthings oversee the company’s financial reporting process.
Auditor’s responsibilityOur objectives are to obtain reasonable assurance about whetherthe annual accounts and consolidated accounts as a whole arefree from material misstatement, whether due to fraud or error,and to issue an auditor’s report that includes our opinions. Rea-sonable assurance is a high level of assurance, but is not a guar-antee that an audit conducted in accordance with ISAs and gen-erally accepted auditing standards in Sweden will always detecta material misstatement when it exists. Misstatements can arisefrom fraud or error and are considered material if, individually orin the aggregate, they could reasonably be expected to influencethe economic decisions of users taken on the basis of theseannual accounts and consolidated accounts.
A further description of our responsibility for the audit of theannual accounts and consolidated accounts is available on Revi-sorsinspektionen’s website: www.revisorsinspektionen.se/rn/showdocument/documents/rev_dok/revisors_ansvar.pdf. Thisdescription is part of the auditor s report.
Report on other legal and regulatory requirementsOpinionsIn addition to our audit of the annual accounts and consolidatedaccounts, we have also audited the administration of the Boardof Directors and the Managing Director of SkandinaviskaEnskilda Banken AB (publ) for the year 2018 and the proposedappropriations of the company’s profit or loss.
We recommend to the general meeting of shareholders thatthe profit be appropriated in accordance with the proposal inthe statutory administration report and that the members of theBoard of Directors and the Managing Director be dischargedfrom liability for the financial year.
Basis for OpinionsWe conducted the audit in accordance with generally acceptedauditing standards in Sweden. Our responsibilities under thosestandards are further described in the Auditor’s Responsibili-ties section. We are independent of the parent company and thegroup in accordance with professional ethics for accountants inSweden and have otherwise fulfilled our ethical responsibilitiesin accordance with these requirements.
We believe that the audit evidence we have obtained is suffi-cient and appropriate to provide a basis for our opinions.
Responsibilities of the Board of Directorsand theManaging DirectorThe Board of Directors is responsible for the proposal for appro-priations of the company’s profit or loss. At the proposal of a divi-dend, this includes an assessment of whether the dividend isjustifiable considering the requirements which the company’sand the group’s type of operations, size and risks place on thesize of the parent company’s and the group’s equity, consolida-tion requirements, liquidity and position in general.
The Board of Directors is responsible for the company’s organ-ization and the administration of the company’s affairs. Thisincludes among other things continuous assessment of the com-pany’s and the group’s financial situation and ensuring that thecompany’s organization is designed so that the accounting, man-agement of assets and the company’s financial affairs otherwiseare controlled in a reassuring manner. The Managing Directorshall manage the ongoing administration according to the Boardof Directors’ guidelines and instructions and among other mat-ters take measures that are necessary to fulfil the company’saccounting in accordance with law and handle the managementof assets in a reassuring manner.
Auditor’s responsibilityOur objective concerning the audit of the administration, andthereby our opinion about discharge from liability, is to obtainaudit evidence to assess with a reasonable degree of assurancewhether any member of the Board of Directors or the ManagingDirector in any material respect:• has undertaken any action or been guilty of any omission
which can give rise to liability to the company, or• in any other way has acted in contravention of the Companies
Act, the Banking and Financing Business Act, the AnnualAccounts Act for Credit Institutions and Securities Companiesor the Articles of Association.
Our objective concerning the audit of the proposed appropria-tions of the company’s profit or loss, and thereby our opinionabout this, is to assess with reasonable degree of assurancewhether the proposal is in accordance with the Companies Act.
Reasonable assurance is a high level of assurance, but is nota guarantee that an audit conducted in accordance with gener-ally accepted auditing standards in Sweden will always detectactions or omissions that can give rise to liability to the com-pany, or that the proposed appropriations of the company’sprofit or loss are not in accordance with the Companies Act.
A further description of our responsibility for the audit of the admin-istration is available on Revisorsinspektionen’s website: www.revi-sorsinspektionen.se/rn/showdocument/documents/rev_dok/revi-sors_ansvar.pdf. This description is part of the auditor’s report.
SEB Annual Report 2018 185
Auditor’s report

To the general meeting of the shareholders in SkandinaviskaEnskilda Banken AB, corporate identity number 502032-9081
IntroductionWe have been engaged by Skandinaviska Enskilda Banken AB(publ) (SEB) to undertake a limited assurance engagement of theSEB Sustainability Report for the year 2018 on pages 67–73,including the Sustainability Fact Book & GRI Index 2018 on SEB’swebsite (www.sebgroup.com). We refer to these publicationscollectively as the “Sustainability Report”.
Responsibilities of the Board andManagementThe Board of Directors and the Group Management are responsi-ble for the preparation of the Sustainability Report in accordancewith the applicable criteria. The criteria are explained on page 67,and are the parts of the GRI Sustainability Reporting Standards,which are applicable to the Sustainability Report, and theaccounting and calculation principles that the Company hasdeveloped. This responsibility includes the internal control rele-vant to the preparation of a Sustainability Report that is freefrom material misstatements, whether due to fraud or error.
Responsibilities of the AuditorOur responsibility is to express a conclusion on the SustainabilityReport based on the limited assurance procedures we haveperformed.
We conducted our limited assurance engagement in accord-ance with ISAE 3000 Assurance Engagements Other than Audits orReviews of Historical Financial Information issued by the Interna-tional Auditing and Assurance Standards Board (IAASB). A lim-ited assurance engagement consists of making inquiries, primar-ily of persons responsible for the preparation of the SustainabilityReport, and applying analytical and other limited assurance pro-cedures.
The procedures performed in a limited assurance engagementvary in nature from, and are less in extent than for, a reasonableassurance engagement conducted in accordance with IAASB’s
Standards on Auditing and other generally accepted auditingstandards in Sweden. The procedures performed consequentlydo not enable us to obtain assurance that we would becomeaware of all significant matters that might be identified in a rea-sonable assurance engagement. Accordingly, we do not expressa reasonable assurance conclusion.
The audit firm applies ISQC 1 (International Standard on QualityControl) and accordingly maintains a comprehensive system ofquality control including documented policies and proceduresregarding compliance with ethical requirements, professionalstandards and applicable legal and regulatory requirements.We confirm that we are independent of SEB in accordance withthe rules of professional ethics for accountants in Sweden, andhave fulfilled our professional ethics requirements according tothese rules.
Our procedures are based on the criteria defined by the Boardof Directors and the Group Management as described above.We consider these criteria suitable for the preparation of theSustainability Report.
We believe that the evidence we have obtained is sufficientand appropriate to provide a basis for our conclusion below.
ConclusionBased on the limited assurance procedures we have performed,nothing has come to our attention that causes us to believe thatthe Sustainability Report is not prepared, in all material respects,in accordance with the criteria defined by the Board of Directorsand Group Management.
Stockholm, 19 February 2019PricewaterhouseCoopers AB
Report on the statutory sustainability reportThe Board of Directors is responsible for the preparation of thesustainability report included on pages 67–73 and that it hasbeen prepared in accordance with the Annual Accounts Act.
Our examination has been conducted in accordance with FAR’sauditing standard RevR 12 The auditor s opinion regarding thestatutory sustainability report. This means that our examinationof the statutory sustainability report is different and substan-tially less in scope than an audit conducted in accordance withInternational Standards on Auditing and generally acceptedauditing standards in Sweden. We believe that the examinationhas provided us with sufficient basis for our opinion.
A sustainability report has been prepared.
PricewaterhouseCoopers AB was appointed as the auditor ofSkandinaviska Enskilda Banken AB (publ) by the annual generalmeeting 2018, and has been SEB’s auditor since 2000.
Stockholm the 19 February 2019PricewaterhouseCoopers AB
Peter Nyllinge Fredrik LjungdahlAuthorized Public Accountant Sustainability Assurance Specialist
Auditor's limited assurance reporton the statutory sustainability report
Peter NyllingeAuthorized Public AccountantPartner in charge
Martin ByAuthorized Public Accountant
SEB Annual Report 2018186
Auditor’s report

DefinitionsAlternative Performance Measures (APMs) 1)
Items affecting comparabilityTo facilitate the comparison of operating profit between current andprevious periods, items with significant impact that managementconsiders affect the comparability or are relevant for the under-standing of the financial result, are identified and presented sepa-rately, for example impairment of goodwill, restructuring, gains andlosses from divestments and other income or costs that are notrecurring.
Operating profitTotal profit before tax.
Operating profit before items affecting comparabilityTotal profit before items affecting comparability and tax.
Net profitTotal profit after tax.
Return on equityNet profit attributable to shareholders in relation to average 2)
shareholders’ equity.
Returnonequity excluding itemsaffecting comparabilityNet profit attributable to shareholders, excluding items affectingcomparability and their related tax effect, in relation to average 2)
shareholders’ equity.
Return on business equityOperating profit by division, reduced by a standard tax rate, inrelation to the divisions’ average2) business equity (allocatedcapital).
Return on total assetsNet profit attributable to shareholders, in relation to average 2)
total assets.
Return on risk exposure amountNet profit attributable to shareholders in relation to average 2)
risk exposure amount.
Cost/income ratioTotal operating expenses in relation to total operating income.
Basic earnings per shareNet profit attributable to shareholders in relation to the weightedaverage3) number of shares outstanding before dilution.
Diluted earnings per shareNet profit attributable to shareholders in relation to the weightedaverage3) diluted number of shares. The calculated dilution isbased on the estimated economic value of the long-termequity-based programmes.
Networth per shareThe total of shareholders’ equity, the equity portion of anysurplus values in the holdings of debt securities and the surplusvalue in life insurance operations in relation to the number ofshares outstanding.
Equity per shareShareholders’ equity in relation to the number of sharesoutstanding.
Core Gap ratioStructural liquidity risk measure defined as total liabilitiesdeemed to mature beyond one year in relation to total assetsdeemed to mature beyond one year.
Expected credit losses, ECLProbability weighted credit losses with the respective risk of adefault.
ECL allowancesThe allowance for expected credit losses on financial assets,contract assets, loan commitments and financial guaranteecontracts.
Net ECL levelNet credit impairments in relation to the opening balance of theyear of debt securities, loans to the public and loans to creditinstitutions measured at amortised cost, financial guaranteesand loan commitments, net of ECL allowances.
ECL coverage ratioECL allowances in relation to underlying gross carrying amountsfor loans and debt securities as well as nominal amounts of finan-cial guarantees and loan commitments.
Stage 3 loans / Total loans, grossGross carrying amount for stage 3 loans (credit-impaired loans)in relation to gross carrying amount for total loans measured atamortised cost (excluding demand deposits credit institutionsand including trade and client receivables presented as otherassets).
Stage 3 loans / Total loansCarrying amount for stage 3 loans (credit-impaired loans) in rela-tion to carrying amounts for total loans measured at amortisedcost (excluding demand deposits, credit institutions and includingtrade and client receivables presented as other assets).
See sebgroup.com/ir for the excel file entitled AlternativePerformance Measures which includes information on thecalculation of alternative performance measures.
1) Alternative Performance Measures, APMs, are financial measures of historical or future financial performance, financial position, or cash flows, other thanthose defined in the applicable financial reporting framework (IFRS) or in the EU Capital Requirements Regulation and Directive CRR/CRD IV. APMs are usedby SEB when relevant to assess and describe SEB’s financial situation and provide additional relevant information and tools to enable analysis of SEB’sperformance. APMs on basic earnings per share, diluted earnings per share, net worth per share, equity per share, return on equity, return on total assetsand return on risk exposure amount provide relevant information on SEB’s performance in relation to different investment measurements. The cost/incomeratio provides information on SEB’s cost efficiency. APMs related to lending provide information on provisions in relation to credit risk. All these measuresmay not be comparable to similarly titled measures used by other companies.
2) Average for the year, calculated on month-end figures.3) Average, calculated on a daily basis.
SEB Annual Report 2018 187
Definitions

DefinitionsAccording to the EU Capital RequirementsRegulation no 575/2013 (CRR)
Risk exposure amountTotal assets and off balance sheet items, risk-weighted inaccordance with capital adequacy regulations for credit risk andmarket risk. The operational risks are measured and added asrisk exposure amount. Risk exposure amounts are only definedfor the consolidated situation, excluding insurance entities andexposures deducted from own funds.
CommonEquity Tier 1 capitalShareholders’ equity excluding proposed dividend, deferred taxassets, intangible assets and certain other regulatory adjust-ments defined in EU Regulation no 575/2013 (CRR).
Tier 1 capitalCommon Equity Tier 1 capital plus qualifying forms of subordi-nated loans liabilities, so-called additional tier 1 instruments.
Tier 2 capitalMainly subordinated loans liabilities not qualifying as Tier 1capital contribution.
Own fundsThe sum of Tier 1 and Tier 2 capital.
CommonEquity Tier 1 capital ratioCommon Equity Tier 1 capital as a percentage of risk exposureamount.
Tier 1 capital ratioTier 1 capital as a percentage of risk exposure amount.
Total capital ratioTotal own funds as a percentage of risk exposure amount.
Leverage ratioTier 1 capital as a percentage of total assets including off-balancesheet items with conversion factors according to the standard-ised approach.
Liquidity CoverageRatio (LCR)High-quality liquid assets in relation to the estimated net cashoutflows over the next 30 calendar days.
AbbreviationsIFRS9 abbreviations:FVTPL Fair Value Through Profit or LossFVHFT Fair Value Through Profit or Loss Held for TradingFVMPL Fair Value Through Profit or Loss MandatorilyFVDPL Fair Value Through Profit or Loss DesignatedFVOCI Fair Value Through Other Comprehensive IncomeAmC Amortised Cost
IAS 39 abbreviations:HFT Held for TradingFVO Fair Value OptionAFS Available-for-saleLaR Loans and ReceivablesAmC Amortised CostHTM Held to Maturity
SEB Annual Report 2018188
Definitions

Calendar
Financial information and publications
New shareholders are automatically offered a subscription of the Annual Report or the Annual Review.Order printed copies of the Annual Report and the Annual Review onsebgroup.com/irSubscribe to the interim reports (pdf) and the Fact Book (pdf) onsebgroup.com/press
Pleaserecycle me!
2018 Annual Accounts 30 January 2019Annual Report 5 March 2019Annual General Meeting 26 March 2019Interim report January–March 30 April 2019Interim report January–June 12 July 2019Interim report January–September 23 October 2019
SEB corporate websiteFinancial information, publicationsand other information regardingSEB is available at sebgroup.com
Annual ReportInformation on SEB’sbusiness, strategy,risk management andcorporate governance.Detailed information onSEB’s financial positionand results. IncludesSEB’s SustainabilityReport.
Annual ReviewAn abbreviated versionof the Annual Report.
Interim reports and Fact BooksQuarterly reports on SEB’s financial performance.Detailed information on SEB’s financial positionand results in Fact Books.
Capital Adequacyand Risk Manage-ment Report(Pillar 3)Disclosure on capitaladequacy and riskmanagement inaccordance with regu-latory requirements.
Sustainability FactBook & GRI IndexDetailed informationon sustainabilitymatters and a GRI(Global ReportingInitiative) Index.
2018
Capital adequacy andRiskmanagement reportPillar 3
2018
SustainabilityFact Book andGRI Index
TheThe Sustainability Sustainability Fact Fact Book Book consists consists of of data data for for SEB's SEB's SEB's sustainability sustainability related related areas areasandand the the GRI GRI Index Index according according to to the the GRI GRI Standards Standards Core Core Core option. option. The The document document also alsoincludesincludes information information about about SEB's SEB's stakeholder stakeholder dialogue dialogue dialogue and and materiality materiality analysis. analysis.
2018
Annual Review
2018
Annual Report
SEB Fact Book Annual Accounts 2018
Fact BookAnnual Accounts 2018
STOCKHOLM 30 JANUARY 2019
SEB Annual Accounts 2018
Annual Accounts2018
STOCKHOLM 30 JANUARY 2019

Annual General MeetingThe Annual General Meeting will be held on Tuesday 26 March 2019 at 1 pm (CET)at Stockholm Concert Hall, Hötorget, Stockholm, Sweden.
A notice convening the Annual General Meeting, including an agenda,is available on sebgroup.com
Shareholders who wish to attend the Annual General Meeting shall at the lateston Wednesday 20 March 2019:– be registered in the shareholders’ register kept by Euroclear Sweden AB, and– have notified the bank in either of the following ways:by telephone 0771 23 18 18 (+46 771 23 18 18 from outside Sweden)
between 9 am and 4.30 pm (CET) orat sebgroup.com orin writing to the following address: Skandinaviska Enskilda Banken
c/o Euroclear Sweden, Box 191, 101 23 Stockholm, Sweden
DividendThe Board proposes a total dividend of SEK 6.50 per share (consisting of an ordinary dividendof SEK 6.00 per share and an extraordinary dividend of SEK 0.50 per share) for 2018.
Thursday 28 March 2019 is proposed as record date for the dividend payments.If the Annual General Meeting resolves in accordance with the proposal, the share willbe traded ex-dividend on Wednesday 27 March 2019 and dividend payments are expectedto be distributed by Euroclear Sweden AB on Tuesday 2 April 2019.
ContactsMasih YazdiFinance DirectorTelephone: +46 771 62 10 00E-mail: [email protected]
Christoffer GeijerHead of Investor RelationsTelephone: +46 707 62 10 06E-mail: [email protected]
Frank HojemHead of Media RelationsTel: +46 707 63 99 47E-mail: [email protected]
Malin SchenkenbergFinancial Information OfficerTelephone: +46 8 763 95 31E-mail: [email protected]
Skandinaviska Enskilda Banken AB (publ) – Corporate registration number 502032-9081
Production:SEBand
Intellecta•
Photos;Johnér,Shutterstock,H
ans-ErikN
ygren,Andreas
Lind,JoachimLundgren,JoelSherw
oodand
others•
Printing:Elanders•
SEGR
0157
20
19.02
Head officePostal address SEB, SE-106 40 Stockholm, SwedenVisiting address Kungsträdgårdsgatan 8, Stockholm, SwedenTelephone +46 771 62 10 00