web based marketing plan for the polished pet boarding kennel in
TRANSCRIPT
1
WEB BASED MARKETING PLAN FOR THE POLISHED PET BOARDING KENNEL
IN SANTA MARIA, CA
Presented to the
Faculty of the Agribusiness Department
California Polytechnic State University
In Partial Fulfillment
Of the Requirements for the Degree
Bachelor of Science
by
Lauren Marie Frias
March 2012

2
TITLE: Web Based Marketing Plan for The Polished Pet Boarding Kennel
in Santa Maria, CA
AUTHOR: Lauren Frias
DATE SUBMITTED: March 2012
Carol Sexton_________________________________ __ ____________________________
Senior Project Advisor Signature

3
TABLE OF CONTENTS
Chapter Page
I. INTRODUCTION………………………………………………………………………..….4
Problem Statement……………………………………………………………………….…….5
Hypothesis……………………………………………………………………………….…….6
Objectives……………………………………………………………………………….……..6
Justification…………………………………………………………………………………….7
II. REVIEW OF THE LITERATURE………………………………………………………....8
Web-Based Marketing……………………………………………………….............................8
Website Design…..…………………………………………………………………………..…9
Social Media Networking……………….…………………………………………………….10
Innovative Marketing Strategies………………………………………………………………11
Consumer Survey Methods..…….…………………………………………………………….13
III. METHODOLOGY……………………………………………………………………….15
Procedures for Data Collection………………………………………………………………..15
Procedures for Data Analysis………………………………………………………………….16
Assumptions…………………………………………………………………………………...18
Limitations…………………………………………………………………………………..…18
IV. DEVELOPMENT OF THE STUDY………………………………………………….….19
Analysis…………………………………………………………………………………….….19
V. SUMMARY, CONCLUSIONS, AND RECOMMENDATIONS………………………....27
Summary………………………………………………………………………………………27
Conclusions……………………………………………………………………………………28
Recommendations……………………………………………………………………………..29
References Cited……………………………………………………………………………....31
APPENDIX…………………………………………………………………………………....33

4
Chapter 1
INTRODUCTION
The great recession in the United States has caused consumers to change their spending
habits. They are spending less while shopping more (McCully 2011). The recession comes at a
time when consumers had already become accustomed to increasing levels of service from
sellers of goods and services as businesses incorporate new technologies to attract customers and
improve cost efficiencies. Customers are now accustomed to and expect price competitiveness,
excellent service, 24 hour availability, convenience and value added amenities. For a business to
compete in this environment, it must continually find innovative strategies in the utilization of
existing and developing technologies and applications to distinguish it from competitors. At the
forefront of these technologies and applications are the internet and social media networking
(Daniasa 2010).
As a case study, the pet care industry is no exception to these market place realities.
Pet owners constitute 60% of the American population, 84% of which think of their pets as part
of their family. There is an increasing demand for pet care services as people have become more
attached to their pets (Stark 2000). It is not uncommon for pet owners to change their lifestyles to
accommodate the comfort and wellbeing of their pets. Some find it emotionally tolling to leave

5
their pets while they’re away, as they would a child. Pet owners often shape their travel plans
around their pets. Some pet owners take their pets to “doggie daycare” daily, either at a boarding
facility or a pet sitter while they are working (Hung 2011). In spite of the recession, it is
documented that traveling pet owners are willing to incur costs to care for their animals (Kittner
2008).
It is not surprising that pet care industry sales exceeded 23 billion dollars in 2000 (Stark
2000). With this amount of money up for grabs, pet supply stores, veterinarian offices, kennels
and doggie spas face increasing competition for a share of these revenues. To rise above and
achieve a competitive advantage, some boarding facilities are going beyond basic services, now
offering luxurious kennels, homemade meals, spa treatments, 24 hour video surveillance, a more
outdoorsy “experience” for active pets, and the list goes on (Kittner 2008).
Ultimately, it doesn’t matter what a business offers unless customers are aware. The
internet, including social media networking, are at the marketing forefront because many
customers have decided this is frequently a preferred method of acquiring information and
effective way by which to communicate. Since many if not most business are using these tools,
how they are used can greatly distinguish one business from another (Daniasa 2010).
Problem Statement
Would the innovative use of web-based marketing including social media networking and
the creation of an interactive business website benefit The Polished Pet, a dog and cat boarding
kennel in Santa Maria, CA?

6
Hypothesis
Increased web presence will benefit The Polished Pet, as there is evidence that an
increasing number of people are using the internet. Marketing to this new target market will be
an effective strategy to ensuring the financial success of The Polished Pet.
1. A consumer majority agree that they would take advantage of online promotions and web-
based planning options if they were made available.
2. Consumers will board their pets more often if these online promotions are made available.
3. A consumer majority agree that they use the internet to find information about a business, that
a businesses’ web presence is important, and they equate a well-designed website with a well run
business.
4. A consumer majority agree that they use social media networking on a regular basis.
Objectives
1. To determine the influential factors in pet owners decisions to board their pet at a kennel.
2. To measure how often pet owners board their pets and whether or not interactive features and
online promotions would cause them to board their pets more.
3. To assess what pet owners would find useful and valuable on a kennel website.
4. To gauge pet owner attitudes towards the importance of well maintained business websites
and business web presence.

7
Justification
As an increasingly high percentage of businesses utilize websites and social media
networking as educational, marketing and sales tools, consumers become more expectative and
reliant on this virtual presence as a useful, convenient and non-threatening means of acquiring
information as a means to making an informed purchase of a product or service. Consumers may
soon consider a strong virtual presence a minimum prerequisite for a business to be considered
legitimate and competitive. If this premise becomes real, then a business must not only have a
strong web presence, but also distinguish itself in the virtual world from its competitors. Just as
a brick and mortar business may try to stand out by having noticeable signage, an appealing
façade, professional landscaping, etc., the business will now need to implement comparable
distinguishing factors in its virtual space. As a parallel, it would seem logical that a well
designed, easy to use, frequently updated, interactive web site would attract and retain more
clients than one that is none of those. It should follow that a company that uses social media
networking such as Facebook or Twitter in interesting and innovative ways will attract many
more followers than one that does not (Hasley 2010).

8
Chapter 2
REVIEW OF THE LITERATURE
According to Nicole Singleton, marketing director at Pet Care Services Association, a
trade group for pet care related businesses, the pet care industry is growing in spite of the
significant down turn in the economy (Kittner 2008). Owners of pet care related businesses are
competing for the billions of dollars that are spent each year by owners on their pets. Adequate
market share is essential for survival. A virtual (web-based) presence is the latest marketing
phenomena that businesses are developing to gain a competitive edge.
Web-Based Marketing
The exponential growth of the internet makes it a medium that cannot be ignored. Globally,
the number of websites increased from 23,000 in 1995 to 55 million in 2007. In the United
States alone, internet sales went from zero in 1995 to over $50 billion in 2004 (Schibrowsky, et
al 2007). In 2010, US internet sales reached $191 billion, representing 7% of all retail sales. By

9
2014 this figure is projected to reach almost $250 billion, representing 8% of all retail sales.
These figures do not include off line sales that resulted from online research. It is estimated that
as much as $917 billion in offline sales were “Web-influenced” (Schonfield 2010).
A well-designed business website benefits business and consumer alike. A business can
benefit in many ways including increased sales. The business through its website offers 24 hour
access to information. They can present the image they desire with graphics and a mission and
vision statement. A website can be easily modified should there be the need. Customers realize
the convenience of shopping, communicating and researching anywhere, anytime. Researchers
define convenience as “the time and effort consumers use in purchasing a product or service”
(Brown 1990). Research shows convenience as a major factor in buying decisions by consumers
(Izquierdo-Yusta, et al 2011).
Website Design
Having a website may not be enough. There is much evidence and research suggesting that
a well-designed website will attract customers while a poorly designed site will scare them off.
Research shows that satisfied users spend a longer time per visit and are more likely to
recommend a good website to others (Zhang 2000). On the other hand, research carried out by
OnePoll suggests that 70% of consumers say they would not buy from a company that has a
poorly designed website. Website visitors equate a poorly maintained or designed website with a
poorly run business (Hosea 2011). Many factors contribute to a well-designed website. These
include easy navigational features, good layout, use of colors and images, interactive features,
understandable content and even entertainment value.

10
One study concluded that “the Internet is fundamentally an information medium” and that
there is a significant and direct relationship between the quality of accessible information and the
ability by the visitor to make a decision. Quality information was defined as that which is
“quality in terms of accuracy, timeliness, completeness, relevance and consistency” (Gregg
2010). The same study, in an effort to scientifically identify quality content, made conclusions
based on a survey instrument which determined which “information cues are most commonly
presented by business to consumer websites”. Additionally, the study determined which of these
website cues, or options, visitors most often reacted to. It also claimed that this study “laid the
groundwork” for future surveys that will attempt to determine what content website visitors
would like to see on a website (Gregg 2010). With the increasing use of smart phones and
tablets, many websites have mobile versions for easy navigation with those devices (Hosea
2011).
Social Media Networking
People, and by default, consumers, are gathering in virtual space in mind boggling
numbers. In 2010 there were over 500 million Facebook users. In its first 4 years of existence,
10 billion messages, or “tweets” were sent via Twitter. About 80% of surveyed consumers have
at least one social networking site that they visit on a regular basis (Baird, et al 2010). It is no
surprise that businesses want to be where potential customers are, and as a result, businesses are
joining them by droves on social media networking websites.
A survey done by IBM for Business Value reached an interesting conclusion. Prior to the
presence of social media, businesses were used to dictating Customer Relationship Management

11
(CRM). This model typically dictates what a business needs to do to get “close” to its
customers. The survey found that customers aren’t that interested in a “close” relationship with
businesses or brands. Seventy percent said they used social media outlets to connect with family
and friends, while only 23 percent said the same of businesses and brands. When interacting
with a business via social media, customers were mainly focused on looking for a “tangible
benefit” in return for their time and effort, like coupons or discounts (Baird, et al 2010).
Innovative Marketing Strategies
There is no doubt that social media marketing has enormous potential. Just as developing
a website distinguishes a business from its competitors, social media has the potential to further
distinguish a business by reaching consumers where they gather in great numbers. For example,
the ice cream chain, Cold Stone Creamery, offered a link on social media website, Facebook,
which enabled visitors to send gift cards to their friends from Cold Stones Facebook page. The
gift is delivered virtually, with a personalized message and instructions on how to redeem their
treats at any one of 1500 stores nationwide. Not only does this type of marketing have enormous
potential, it is low cost to implement and takes little effort to reach a large number of consumers.
Expectedly, a little effort transfers into a large return. In Cold Stone Creamery’s case,
franchisees saw the results within weeks in the form of thousands of dollars of sales. Because
social media is relatively new and unique, businesses are just beginning to learn how to optimize
their efforts in an attempt to turn this virtual presence into profits for their businesses. The study
suggests that businesses need to develop a “social CRM” policy in order to fully realize the
potential of these new marketing strategies (Heller-Baird, et al 2010).
12
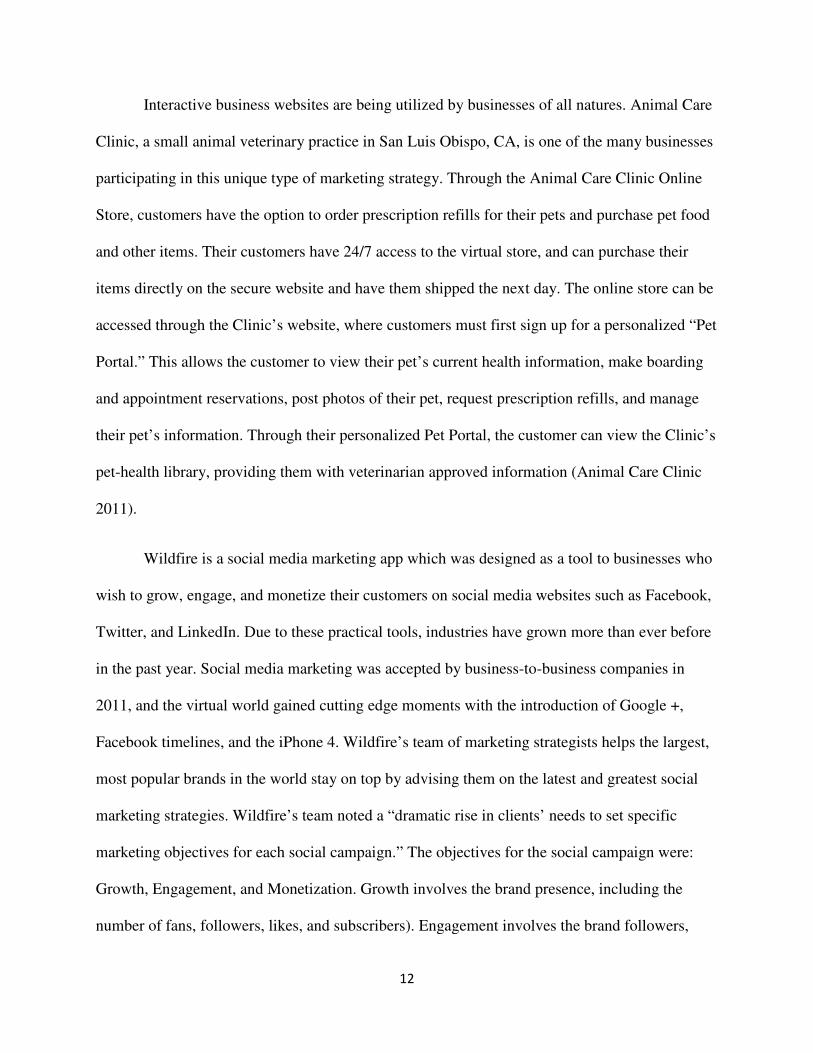
Interactive business websites are being utilized by businesses of all natures. Animal Care
Clinic, a small animal veterinary practice in San Luis Obispo, CA, is one of the many businesses
participating in this unique type of marketing strategy. Through the Animal Care Clinic Online
Store, customers have the option to order prescription refills for their pets and purchase pet food
and other items. Their customers have 24/7 access to the virtual store, and can purchase their
items directly on the secure website and have them shipped the next day. The online store can be
accessed through the Clinic’s website, where customers must first sign up for a personalized “Pet
Portal.” This allows the customer to view their pet’s current health information, make boarding
and appointment reservations, post photos of their pet, request prescription refills, and manage
their pet’s information. Through their personalized Pet Portal, the customer can view the Clinic’s
pet-health library, providing them with veterinarian approved information (Animal Care Clinic
2011).
Wildfire is a social media marketing app which was designed as a tool to businesses who
wish to grow, engage, and monetize their customers on social media websites such as Facebook,
Twitter, and LinkedIn. Due to these practical tools, industries have grown more than ever before
in the past year. Social media marketing was accepted by business-to-business companies in
2011, and the virtual world gained cutting edge moments with the introduction of Google +,
Facebook timelines, and the iPhone 4. Wildfire’s team of marketing strategists helps the largest,
most popular brands in the world stay on top by advising them on the latest and greatest social
marketing strategies. Wildfire’s team noted a “dramatic rise in clients’ needs to set specific
marketing objectives for each social campaign.” The objectives for the social campaign were:
Growth, Engagement, and Monetization. Growth involves the brand presence, including the
number of fans, followers, likes, and subscribers). Engagement involves the brand followers,

13
including comments, shares, and posts. Monetization involves fans, including leaders and sales.
The team expects a shift from the emphasis on growth to emphasis on engagement in 2012.
Predictions for 2012 also include an industry move towards an “integrated social campaign
approach,” which is often centered on a popular icon in the industry. So Delicious recently
launched a campaign formed around Jillian Michaels, a celebrity who communicates to
consumers about the brand and the theme, “changing one’s life.” From just 3 months of
campaign, So Delicious grew its fan base by an astonishing 1000%, increased sales by 74% and
its category share by 60% (Grinberg 2012).
Consumer Survey Methods
Consumer surveys are user friendly methods of data gathering, and are often used to
provide accurate, low cost feedback to businesses. A survey is composed with the specific
business issues and objectives in mind. They act as a sort of model that is analyzed before the
business commits capital to marketing strategies, infrastructure, equipment and/or inventories.
Often created and administered by a market research director, consumer surveys can relay
information back to businesses, specifying exactly what consumers think about aspects of a
business. The most common consumer survey methods utilized are paper-based surveys, web-
based surveys, or a combination of the two. Studies have analyzed which survey methods receive
the highest consumer response rates, as well as which methods are most cost effective, accurate
and user friendly, all in an effort to discover meaningful data and results. It is proven that the
best response rates come from implementing a combination of paper-based surveys and web-
based surveys. The second highest response rates come from a solely web-based survey method,
which is in fact the least costly to administer. The lowest response rates come from a solely
paper-based survey method, which is more costly than the web-based method, but less costly

14
than the combination of the two methods. It should also be noted that the type of data gathering
survey method should be chosen based on the specific characteristics of the individual business
(Greenlaw 2009).

15
Chapter 3
METHODOLOGY
Procedures for Data Collection
In order to determine if the innovative use of web-based marketing including social
media networking and the creation of an interactive business website would benefit The Polished
Pet, it is necessary to gauge pet owner attitudes towards the importance of well maintained
business websites and business web presence, determine how often pet owners board their pets,
and determine the influential factors in pet owners decisions to board their pet at a kennel.
Ultimately, a 14 question consumer survey was designed, reflective of the objectives, and will be
administered to clients of The Polished Pet.
Paper-based surveys will be distributed to clients of The Polished Pet, in Santa Maria,
CA, and web-based surveys will be available online on Facebook, where anyone can participate.
The online survey will be linked to SurveyMonkey.com, so that the results can be directly
recorded. Once 100 surveys are collected, the data collection period will end. The Polished Pet is
well established, and has a sufficient clientele base to provide a meaningful sample.

16
The sample size of n=100 was chosen based on Lenth’s software, Java Applets for
Power and Sample Size, which was designed to determine effective sample size. Due to the
nature of this study and the span of time allotted for collecting and analyzing data, a sample size
of 100 was chosen (Lenth 2006). The data will be collected during a three week period between
January 2012 and February 2012. Paper surveys will be administered at The Polished Pet during
this data collection period, and will be administered by kennel staff. The customers will be asked
by a staff member if they would like to take a survey about web-based marketing as it pertains to
The Polished Pet, and notified that the surveys are part of a senior project by a Cal Poly
Agribusiness/Marketing student. The clients will have the option to participate, or not. Should
the client wish to complete the survey at another time, they will be given a survey with a
stamped return envelope. A stack of cards with the link to the survey online will be available to
customers who opt not to take the survey on the spot. Surveys will be administered in a simple
random sample method, where each client chosen to complete the survey will have the same
probability of being selected as other clients.
Procedures for Data Analysis
Once the data has been collected, it will be organized, analyzed, and manipulated to
reflect the objectives of this study. These objectives include: determining the influential factors
in pet owners decisions to board their pet at a kennel, measuring how often pet owners board
their pets, whether or not interactive features and online promotions would cause them to board
their pets at the facility more often more, assessing what pet owners would find useful and
valuable on a kennel website, and gauging pet owner attitudes towards the importance of well

17
maintained business websites and business web presence. The data will then be analyzed to test
the validity of the hypothesis that increased web presence and social media interaction will
positively affect gross revenues to The Polished Pet.
Survey data be analyzed using the Analysis Center through Surveymonkey, a program
that is capable of manipulating survey data, computing percentages, averages, response counts,
and cross tabulations between questions. Before analysis can begin, it is necessary to manually
input the results from the paper-based surveys into Surveymonkey under the Responses tab. A
target market can be defined by the consumer’s age, gender, marital status, level of education,
employment status and income. A cross tabulation will be run crossing age with the other survey
questions.
To determine the influential factors in pet owners’ decisions to board their pet at a
kennel, survey question 2, “Which characteristics are influential in your decision to board your
pet at a kennel,” is analyzed by its average rating. A rating of 1 is “Not Influential,” while a
rating of 3 is “Very Influential.” The characteristics with the ratings closest to 3 are the top
influential characteristics. To measure how often pet owners board their pets and whether or not
interactive features and online promotions would cause them to board their pets more, the
following survey questions are manipulated: Question 3, “How many days do you board your pet
per year,” Question 4a, “Which online promotions would you likely take advantage of it made
available,” and Question 4b, “How many more days would you board your pet if those options
were made available.” To assess what pet owners would find useful and valuable on a kennel
website, Question 5 can be analyzed by the items with the top percentages. To gauge pet owner
attitudes towards the importance of well maintained business websites and business web

18
presence, Questions 8a and 8b will be analyzed by the average response on each item. The
average response for this particular question will explain how strongly the respondent agrees or
disagrees with each statement about business web-presence.
Assumptions
It is assumed that survey participants will complete the surveys truthfully and honestly,
and will understand the questions the way they were meant to be understood. It is assumed that
the data was accurately entered into Surveymonkey before analysis. The population chosen is
assumed to be an accurate representation of pet owners in Santa Maria, CA, and the data is
assumed to reflect their tastes and preferences.
Limitations
The results of the survey are limited to current and prospective customers who were
willing to take the survey. The survey participants are mainly over 21 years old, as younger
people board their pets less due to monetary concerns, or their parents are financially responsible
for family pets. The results found in the surveys are not necessarily representative of areas
outside Santa Barbara and San Luis Obispo Counties, as most of the surveys we administered at
The Polished Pet in Santa Maria, CA; however the survey results are likely to be useful to
businesses similar in nature.

19
Chapter 4
DEVELOPMENT OF THE STUDY
To test the validity of the hypothesis, it is important to know the demographics of the respondents
who participated in the survey. Of the respondents, 92% board their pet(s) at The Polished Pet. Over half
of the respondents were between 40 and 59 years old. Females made up 63.4% of respondents, while
males made up 37.6%. Regarding marital status, 69% of respondents answered that they are married.
Regarding education, 79.4% of respondents attended at least some college or higher. Employed
respondents make up 69.7%. Household income was slightly scattered, as 22.9% reported a total annual
income between $40,000-59,000, 25.3% reported a total annual income of $60,000-79,000, and 24.1%
reported total annual incomes of $100,000 or more. Regarding the number of days pets are boarded each
year, on average, respondents reported 9.85 days per year.
Table 1_ Age___________________________________________________________________
Response Percent Response Count
under 21 2.0% 2
21-29 12.7% 13
30-39 10.8% 11
40-49 25.5% 26
50-59 32.4% 33 60+ 18.6% 19 ____________________________________________________________________________________
20
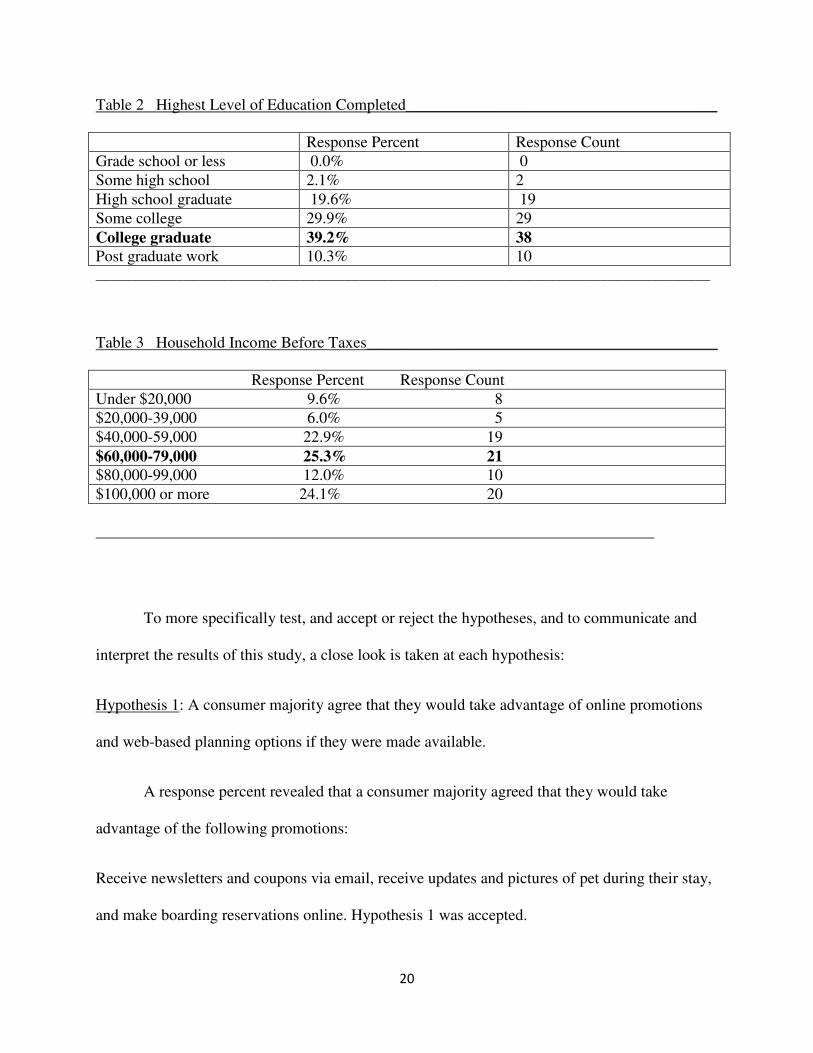
Table 2 Highest Level of Education Completed_______________________________________
Response Percent Response Count
Grade school or less 0.0% 0
Some high school 2.1% 2
High school graduate 19.6% 19
Some college 29.9% 29
College graduate 39.2% 38 Post graduate work 10.3% 10 ____________________________________________________________________________________
Table 3 Household Income Before Taxes____________________________________________
Response Percent Response Count
Under $20,000 9.6% 8
$20,000-39,000 6.0% 5
$40,000-59,000 22.9% 19
$60,000-79,000 25.3% 21 $80,000-99,000 12.0% 10
$100,000 or more 24.1% 20
______________________________________________________________________
To more specifically test, and accept or reject the hypotheses, and to communicate and
interpret the results of this study, a close look is taken at each hypothesis:
Hypothesis 1: A consumer majority agree that they would take advantage of online promotions
and web-based planning options if they were made available.
A response percent revealed that a consumer majority agreed that they would take
advantage of the following promotions:
Receive newsletters and coupons via email, receive updates and pictures of pet during their stay,
and make boarding reservations online. Hypothesis 1 was accepted.

21
Table 4 Promotions that would be taken Advantage of if Available_______________________
Response Percent Response Count
Receive newsletters and coupons via email 56.4% 53 Receive updates and pictures of pet during their stay 67.0% 63 Follow my kennel on Facebook 31.9% 30
Make boarding reservations online 69.1% 65 Update your pet’s records online 47.9% 45
Register your pet(s) for their own personal page on the
kennel website 12.8% 12
Other 1.1% 1
A cross tabulation of Promotions and Aged determined that consumers ages 40-49 and 60+ are
most likely to take advantage of receiving newsletters and coupons via email. Consumers 40-59 are most
likely to take advantage of receiving updates and pictures of their pets during their stay, to follow their
kennel on Facebook, and update their pets’ records online. Consumers ages 30-49 are most likely to take
advantage of making boarding reservations online.

______________________________________________________________________________
FIGURE 1 Promotions that would be taken Advantage of, and Age_______________________________
Hypothesis 2: Consumers will board their pets more often if these online promotion
available.
On average, consumers reported that they would board pet(s)
year if online promotions and web based planning options were made available.
was accepted.
22
______________________________________________________________________________
FIGURE 1 Promotions that would be taken Advantage of, and Age_______________________________
Consumers will board their pets more often if these online promotion
onsumers reported that they would board pet(s) 0.444444 more days per
year if online promotions and web based planning options were made available.
______________________________________________________________________________
FIGURE 1 Promotions that would be taken Advantage of, and Age_______________________________
Consumers will board their pets more often if these online promotions are made
0.444444 more days per
Hypothesis 2

23
Hypothesis 3: A consumer majority agree they use the internet to find information about a
business, that a businesses’ web presence is important, and they equate a well-designed website
with a well run business.
Of 101 respondents, 98 reported that they use the internet to find information about
businesses. Hypothesis 3 was accepted.
An average revealed that consumers somewhat agree that an instructive, well maintained
website is important to them, that they visit business websites when shopping for new businesses
to learn about them, and that they enjoy the convenience of the internet and make purchases and
reservations online if possible.
Table 5 Consumer Opinions of Business Web Presence______________________________
1 2 3 4 5 Average
Response
An instructive, well maintained
website is very important to me 0.0% (0) 1.0%(1) 24.8%(25) 38.6% (9) 35.6%(36) 4.09
When shopping for a new
business, I visit their website to
learn about the business 0.0% (0) 2.0% (2) 8.9% (9) 26.7% (27) 62.4%(63) 4.50
I enjoy the convenience of the
internet, and make purchases
and reservations online,
if possible 1.0% (1) 4.0% (4) 13.9%(14) 30.7% (31) 50.5%(51) 4.26
I would be more likely to do
business with a company that has
a well maintained website 1.0% (1) 0.0% (0) 37.6%(38) 38.6% (39) 22.8%(23) 3.82
No website is better than a
poorly maintained website 4.0% (4) 12.1% (12) 26.3% (26) 29.3% (29) 28.3%(28) 3.66
A poorly maintained website is
better than no website at all 26.5%(26) 20.4% (20) 40.8%(40) 11.2% (11) 1.0% (1) 2.40
Note: Questions rated on the following scale: 1 Strongly disagree, 2 Somewhat disagree, 3 Neutral, 4 Somewhat agree, 5 Strongly agree.
24
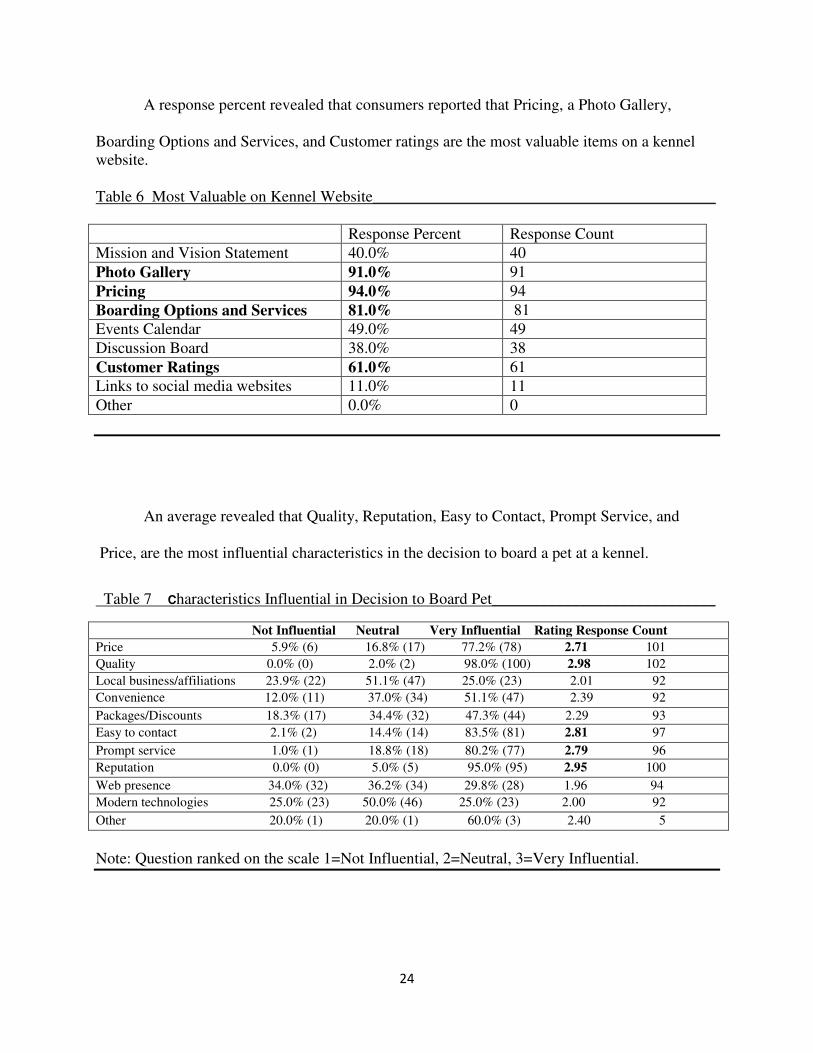
A response percent revealed that consumers reported that Pricing, a Photo Gallery, Boarding Options and Services, and Customer ratings are the most valuable items on a kennel website. Table 6 Most Valuable on Kennel Website___________________________________________
Response Percent Response Count
Mission and Vision Statement 40.0% 40
Photo Gallery 91.0% 91
Pricing 94.0% 94
Boarding Options and Services 81.0% 81
Events Calendar 49.0% 49
Discussion Board 38.0% 38
Customer Ratings 61.0% 61
Links to social media websites 11.0% 11
Other 0.0% 0
An average revealed that Quality, Reputation, Easy to Contact, Prompt Service, and Price, are the most influential characteristics in the decision to board a pet at a kennel.
Table 7 Characteristics Influential in Decision to Board Pet____________________________
Not Influential Neutral Very Influential Rating Response Count
Price 5.9% (6) 16.8% (17) 77.2% (78) 2.71 101
Quality 0.0% (0) 2.0% (2) 98.0% (100) 2.98 102
Local business/affiliations 23.9% (22) 51.1% (47) 25.0% (23) 2.01 92
Convenience 12.0% (11) 37.0% (34) 51.1% (47) 2.39 92
Packages/Discounts 18.3% (17) 34.4% (32) 47.3% (44) 2.29 93
Easy to contact 2.1% (2) 14.4% (14) 83.5% (81) 2.81 97
Prompt service 1.0% (1) 18.8% (18) 80.2% (77) 2.79 96
Reputation 0.0% (0) 5.0% (5) 95.0% (95) 2.95 100
Web presence 34.0% (32) 36.2% (34) 29.8% (28) 1.96 94
Modern technologies 25.0% (23) 50.0% (46) 25.0% (23) 2.00 92
Other 20.0% (1) 20.0% (1) 60.0% (3) 2.40 5
Note: Question ranked on the scale 1=Not Influential, 2=Neutral, 3=Very Influential.

25
Hypothesis 4: A consumer majority agree that they use social media networking on a regular
basis.
A cross tabulation of social media users and age was conducted to determine that a
consumer majority of 62% use social media websites on a regular basis. Hypothesis 4 was
accepted. Consumers ages 30-39 use social media the most, closely followed by ages 21-29
years.
______________________________________________________________________________
FIGURE 2___Social Media Usage and Age____________________________________
0 20 40 60 80 100
21-29 yrs
30-39 yrs
40-49 yrs
50-59 yrs
60+ yrs
Percentage of Consumers who use Social
Media sites on a Regular Basis and Age

26
A response percentage determined that the majority of respondents who use social media on a regular basis use Facebook. Table 8 Most Used Social Media Websites___________________________________________ Response Percent Response Count
Facebook 67.4% 62 Twitter 9.8% 9
None 32.6% 30
Other 3.3% 3 _____________________________________________________________________________________

27
Chapter 5
SUMMARY, CONCLUSIONS, AND RECOMMENDATIONS
Summary
In attempt to determine if increased web presence including the innovative use of web-
based marketing including social media networking and the creation of an interactive business
website would benefit The Polished Pet, a consumer survey was designed and administered to
clients of The Polished Pet. After analysis through SurveyMonkey’s Analysis Center, the
following results were determined:
Hypothesis1: (Accept) A consumer majority agree that they would take advantage of online
promotions and web-based planning options if they were made available.
Hypothesis 2: (Accept) Consumers will board their pets more often if these online promotions
are made available.
Hypothesis 3: (Accept) A consumer majority agree that they use the internet to find information
about a business, that a businesses’ web presence is important, and they equate a well-designed
website with a well run business.

28
Hypothesis 4: (Accept) A consumer majority agree that they use social media networking on a
regular basis.
Conclusions
As 92% of respondents reported boarding their pet(s) at The Polished Pet, the following
conclusions can be taken as a being specific to The Polished Pet’s clientele. The following is accepted
as an accurate representation of the demographics of The Polished Pets clientele:
• The response rate of 63% female
• The most common response age being 40-59 years
• The marital status “married” constituting nearly 70%
• The level of education response rate of 80% having attended at least some college
• The employment rate of 70%
• The reported total annual income between $40,000-59,000, 25.3% reported a total annual income
of $60,000-79,000, and 24.1% reported total annual incomes of $100,000 or more
• The average number of days pets are boarded per year is 9.85 days
In conclusion of Hypothesis 1, it is determined that the online promotions and planning
options they were interested in were: Receive newsletters and coupons via email, receive updates
and pictures of pet during their stay, and make boarding reservations online.
The cross tabulation between age and interest in online promotions was able to determine
consumers ages 40-49 and 60+ are most likely to take advantage of receiving newsletters and
coupons via email, consumers 40-59 are most likely to take advantage of receiving updates and
pictures of their pets during their stay, to follow their kennel on Facebook, and update their pets’
records online, and consumers ages 30-49 are most likely to take advantage of making boarding

29
reservations online. This is useful information, as it gives some basis for which age group could
be successfully marketed to in order to benefit The Polished Pet.
In conclusion of Hypothesis 2, respondents reported that they would board their pets, on
average, 0.444444 more days per year if the online promotions and planning options from
Hypothesis 1were offered.
In conclusion of Hypothesis 3, a majority of 98% reported that they use the internet to find
information about businesses. An average of consumers somewhat agree that an instructive, well
maintained website is important to them, that they visit business websites when shopping for
new businesses to learn about them, and that they enjoy the convenience of the internet and make
purchases and reservations online if possible.
In conclusion of Hypothesis 4, a cross tabulation of social media users and age was
conducted to determine that a consumer majority of 62% use social media websites on a regular
basis, and the vast majority use Facebook.
Recommendations
It is recommended that The Polished Pet offer the following online promotions and planning
options, and market mainly to ages 40-60 years old, as they make up the majority of clients. The
respondents in that age range reported interest in receiving online newsletters and coupons via
email, receiving picture updates, following The Polished Pet’s Facebook page, updating records
online, and making boarding reservations online. I recommend that these promotions and

30
planning options be implemented. By offering these promotions, they could increase their
boarding rates by 0.444444 days per person, per year.
It is recommended that The Polished Pet create a user-friendly, interactive website, keeping
in mind that the factors that draw people to a kennel are quality, reputation, ease of
communication, prompt service, and price. The website should contain with the following
features:
• Pricing
• Photo Gallery
• Boarding Options and Services
• Customer ratings
It is recommended that The Polished Pet create an informative Facebook page. Facebook is a
good marketing tool, as 62% of clients of all age groups reported using social media on a regular
basis. Facebook is a good medium for communication with clients in a non-threatening,
convenient way. The Facebook page can easily be linked to the kennel website, which not only
provides clients and prospective clients with a sense of easy communication, but also enables
them to see the businesses reputation with the other clients who use the site. When boarding a
pet, people often look to others who have had experience with the business before making a
decision.

31
References Cited
Animal Care Clinic, accessed March 2, 2012, http://animalcareclinicslo.com.
Baird, Carolyn Heller and Gautam Parasnis. 2011. “From Social Media to Social Customer
Relationship Management”, Strategy & Leadership. pp. 30 – 37.
Daniasa, Cora I, Vasile Tomita, Dragos Stuparu, and Marieta Stanciu. 2010. “The Mechanisms
of the Influence of Viral Marketing in Social Media,” Economics, Management and
Financial Markets. pp. 278-282.
Greenlaw, Cory and Sharon Brown-Welty. 2009. "A Comparison of Web-Based and Paper-
Based Survey Methods: Testing Assumption of Survey Mode and Response Cost," Sage
Journals Online 33 (2009): 464-480, doi:10.1177/0193841X09340214.
Grinberg, Maya. 2012. “The Next Generation of Social Media Marketing Strategy.” Huffington
Post (Jan 13).
Hasley, Joseph P and Gregg, Dawn G. 2010. “An Exploratory Study of Website Information
Content,” Journal of Theoretical and Applied Electronic Commerce Research.
December. pp. 27-38.
Hosea, Maeve. 2011. “Good First Impressions Lie in the Detail,” Marketing Week. May.
Hung ,Kuang-Peng, Annie Huiling Chen. 2011.“Psychological and Behavioral Predictors of
Taking Pet Companions when Traveling.” Social Behavior and Personality: An
International Journal. pp. 721-724.
Izquierdo-Yusta, Alicia and Roberta J. Schultz. 2011. “Understanding the Effect of Internet Convenience on Intention to Purchase via the Internet,” Journal of Marketing
Development and Competitiveness. September. pp. 32-50.

32
Kittner, Gena and McClatchy. 2008. "No Doggie Spa-This Kennel is for the Dogs." Tribune
Business News.
Klein, Andreas and Bhagat, Parimal. 2010. “We-Commerce: Evidence on a New Virtual
Commerce Platform,” Global Journal of Business Research. pp. 107-124.
Lenth, Russel V. (2006-9). Java Applets for Power and Sample Size [Computer software]. The
American Statistician. Retrieved Nov 28, 2011, http://www.stat.uiowa.edu/~rlenth/Power.
McCully, Clinton P. 2011.“Trends in Consumer Spending and Personal Saving, 1959-2009,”
Survey of Current Business. Washington. June. pp. 14.
Schibrowsky, John A, James W. Peltier, and Alexander Nill. 2007. "The State of Internet
Marketing Research: A Review of the Literature and Future Research Directions",
European Journal of Marketing. pp.722 – 733.
Schonfield, Erick. 2010. “Online Retail Sales will Grow to 250 Billion by 2014,” Forrester
Forecast.
Stark, Myra. 2000. “Creature Comforts.” Brandweek New York. March. pp. 20-22.
Zhang, P. and von Dran, G. M. 2000. “Satisfiers and Dissatisfiers: A Two-factor Model for
Website Design and Evaluation,” Journal of the American Society for Information
Science. pp. 1253–1268. doi: 10.1002/1097-4571.

33
Appendix
1a. Do you board your pet at a kennel? ____________ 1b. If yes, where? a. The Polished Pet, in Santa Maria, CA b. Other _________________________
Please rate question 2 based on the following scale:
1=Not Influential, 2=Neutral, 3=Very Influential 2. Which characteristics are influential in your decision to board your pet at a kennel? (Rate 1-3) a. Price……………………………………… ____ b. Quality…………………………………… ____ c. Local business/affiliations……………….. ____ d. Convenience……………………………... ____ e. Packages/Discounts……………………… ____ f. Easy to contact…………………………… ____ g. Prompt service…………………………… ____ h. Reputation……………………………….. ____ i. Web presence…………………………….. ____ j. Modern technologies...…………………… ____ k. Other __________________________...... ____
3. About how many days do you board your pet per year? _____________
4a. Which of the following online promotions would you likely take advantage of if they were made available by your kennel? (Circle all that apply)
a. Receive newsletters and coupons via email….....…………………..…...….........1 b. Receive updates and pictures of your pet during their stay………..……….........2 c. Follow my kennel on Facebook …....………..………………………..…………3 d. Make boarding reservations online………….…………………………………...4 e. Update your pet’s records online…………………………………………………5 f. Register your pet(s) for their own personal page on kennel website……………..6 g. Other ________________________________________________......................7 4b. How many more days per year would you board your pet if those options were made available? ____________
Hello, my name is Lauren Frias, and I am an Agribusiness/Marketing student at Cal Poly, San Luis Obispo. I would greatly appreciate your help completing this survey for my senior project.
34
5. Your kennel is considering creating a business website. What would you like to see on your kennel’s website? (Circle all that apply) a. Mission and Vision Statement..………………………………………………1 b. Photo Gallery……………………………………………………………….…2 c. Pricing…...………………………………………………………………….....3 d. Boarding Options and Services……………………………………………….4 e. Events Calendar..……………………………………………………………...5 f. Discussion Board……………………………………………………………...6 g. Customer Ratings……………………………………………………………..7 h. Links to social media websites………….. …………………………………..8 i. Other ____________________________________________________.........9 In this portion of the survey, we are interested in your thoughts about businesses and the importance of web presence. 6a. Do you use the internet to find information about businesses? __________ 6b. If not, why? ____________________________________________________ 7a. Do you use social media websites on a regular basis? ___________ 7b. If yes, which one(s)?
a. Facebook b. Twitter c. None d. Other ________________________
Please rate questions 8a and 8b based on the following scale:
1 Strongly disagree
2 Somewhat disagree 3 Neutral
4 Somewhat agree 5 Strongly agree
8a. a. An instructive, well maintained website is very important to me…1…2…3…4…5 b. When shopping for a new business, I visit their website to learn about the business. ………………………………………………………….…………....1…2…3…4…5 c. I enjoy the convenience of the internet, and make purchases and reservations online, if possible..……………………………………………………………..1…2…3…4…5
35
8b. a. I would be more likely to do business with a company that has a well maintained website………………………………………...…………………...1…2…3…4…5 g. No website is better than a poorly maintained website....……….1…2…3…4…5 h. A poorly maintained website is better than no website at all……1…2…3…4…5
The following information is necessary for statistical analysis only, and will be held entirely confidential. 9. Which of the following describes your age? a. under 21……………………1 b. 21-29……………………….2 c. 30-39……………………….3 d. 40-49……………………….4 e. 50-59……………………….5 f. 60+...………………….……6 10. Are you? a. male…………………….1 b. female…………………..2 11. Are you? a. married…………………1 b. living with a partner……2 c. single……………………3 d. widowed……………….4 12. Please state your highest level of education you have completed? a. Grade school or less………….1 b. Some high school…………….2 c. High school graduate…………3 d. Some college…………………4 e. College graduate……………..5 f. Post graduate work…………...6 13. Are you: a. Employed full time…………..1 b. Employed part time……….....2 c. Student………………………3 d. Retired………………………4 c. Unemployed……………..…..5

36
14. Into which of the following ranges does your total household income fall before taxes? a. Under $20,000…………………………1 b. $20,000-39,000………………………..2 d. $40,000-59,000………………………..3 f. $60,000-79,000………………………..4 g. $80,000-99,000………………………..5 h. $100,000 or more……………………...6
Thank you for your time!