weathering the storm ii - colorado nonprofit association · recession to capture the effects of the...
TRANSCRIPT
Weathering the Storm:Challenges and Opportunities Facing Colorado Nonprofits During Recession
2009 Update

1 Weathering the Storm: Challenges and Opportunities Facing Nonprofits During Recession
Weathering the Storm: 2009 Update
Early in 2009, the Colorado Nonprofit Association and the Community Resource Center published a report entitled Weathering the Storm: Challenges and Opportunities Facing Colorado Nonprofits DuringRecession to capture the effects of the economy on nonprofits during 2008. Since that time, we continued to hear about rapid change and challenges faced by nonprofit organizations. Bothorganizations decided to update the survey to test those assumptions.
The findings of this update survey show that the economic downturn is having a significant impact on nonprofit organizations across Colorado. Nonprofit organizations have felt a greater financial andfundraising crunch in recent months, but are still finding creative solutions to maintain their sustainabilityand continue achieving their important missions under very difficult circumstances.
Because nonprofit organizations are integral to the fabric of all Colorado communities, sustaining and strengthening the nonprofit sector as a whole, as well as individual organizations, is crucial. This is especially true during difficult times. We encourage our partners in the philanthropic community,business sector, and in government to ramp up their support of nonprofit organizations during thischallenging time so that nonprofits can continue their critical work to improve and strengthen Colorado’s communities. Colorado’s nonprofits continue to demonstrate remarkable resiliency, but are still in great need of support and resources to meet increasing demands for essential services.
Sincerely,
Sarah Fischler Renny Fagan Interim Co-Director President and Chief Executive Officer Community Resource Center Colorado Nonprofit Association
22009 Update
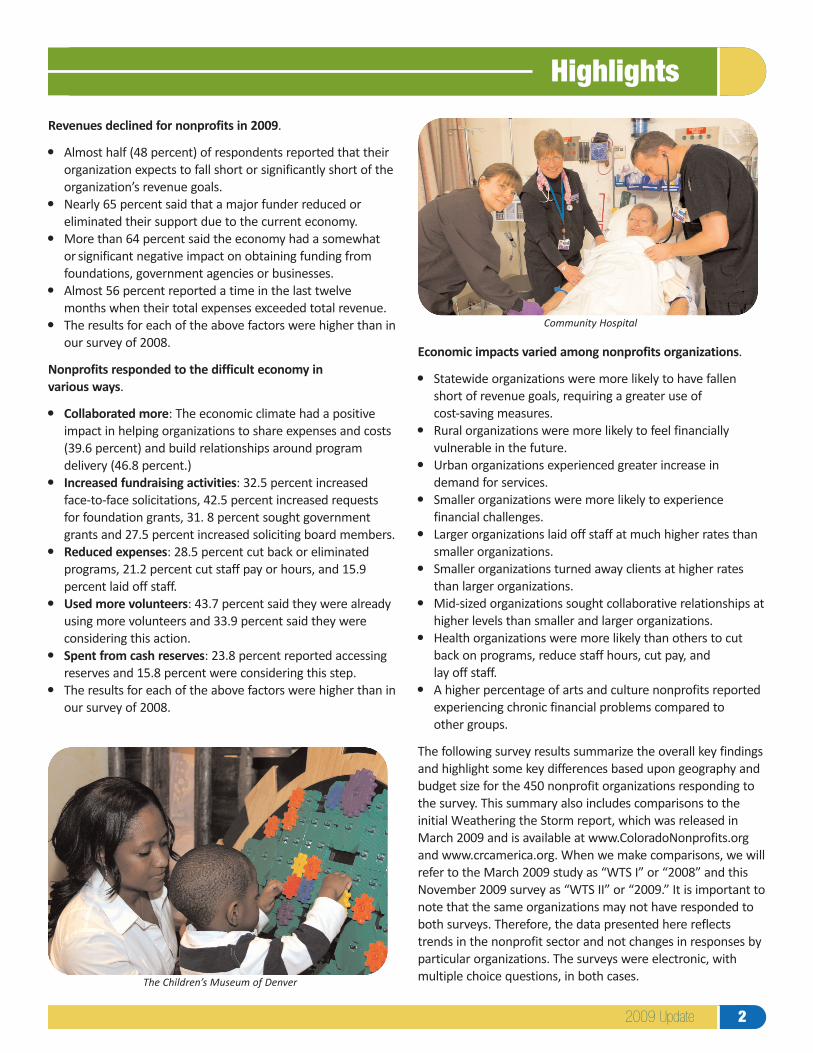
Revenues declined for nonprofits in 2009.
Almost half (48 percent) of respondents reported that their organization expects to fall short or significantly short of theorganization’s revenue goals.Nearly 65 percent said that a major funder reduced or eliminated their support due to the current economy.More than 64 percent said the economy had a somewhat or significant negative impact on obtaining funding from foundations, government agencies or businesses.Almost 56 percent reported a time in the last twelve months when their total expenses exceeded total revenue. The results for each of the above factors were higher than inour survey of 2008.
Nonprofits responded to the difficult economy in various ways.
Collaborated more: The economic climate had a positive impact in helping organizations to share expenses and costs (39.6 percent) and build relationships around program delivery (46.8 percent.)Increased fundraising activities: 32.5 percent increased face-to-face solicitations, 42.5 percent increased requests for foundation grants, 31. 8 percent sought government grants and 27.5 percent increased soliciting board members.Reduced expenses: 28.5 percent cut back or eliminated programs, 21.2 percent cut staff pay or hours, and 15.9 percent laid off staff.Used more volunteers: 43.7 percent said they were already using more volunteers and 33.9 percent said they were considering this action.Spent from cash reserves: 23.8 percent reported accessing reserves and 15.8 percent were considering this step. The results for each of the above factors were higher than inour survey of 2008.
Economic impacts varied among nonprofits organizations.
Statewide organizations were more likely to have fallen short of revenue goals, requiring a greater use of cost-saving measures. Rural organizations were more likely to feel financially vulnerable in the future.Urban organizations experienced greater increase in demand for services. Smaller organizations were more likely to experience financial challenges.Larger organizations laid off staff at much higher rates than smaller organizations.Smaller organizations turned away clients at higher rates than larger organizations. Mid-sized organizations sought collaborative relationships athigher levels than smaller and larger organizations. Health organizations were more likely than others to cut back on programs, reduce staff hours, cut pay, and lay off staff.A higher percentage of arts and culture nonprofits reported experiencing chronic financial problems compared to other groups.
The following survey results summarize the overall key findingsand highlight some key differences based upon geography andbudget size for the 450 nonprofit organizations responding tothe survey. This summary also includes comparisons to theinitial Weathering the Storm report, which was released inMarch 2009 and is available at www.ColoradoNonprofits.organd www.crcamerica.org. When we make comparisons, we willrefer to the March 2009 study as “WTS I” or “2008” and thisNovember 2009 survey as “WTS II” or “2009.” It is important tonote that the same organizations may not have responded toboth surveys. Therefore, the data presented here reflectstrends in the nonprofit sector and not changes in responses byparticular organizations. The surveys were electronic, withmultiple choice questions, in both cases.
Highlights
The Children’s Museum of Denver
Community Hospital

3 Weathering the Storm: Challenges and Opportunities Facing Nonprofits During Recession
Impact of the Economy on Financial Health in 2009FFaalllliinngg SShhoorrtt ooff RReevveennuuee GGooaallss
This has been a difficult financial year for many nonprofits.Overall, 48 percent of respondents reported that theyexpect their organizations to fall short or significantlyshort of the organization’s revenue goals for 2009. This isup from 2008 survey by 8 percent. Only 8.6 percentreported that their organizations would likely exceed orsignificantly exceed their revenue goals, a decrease of13.4 percent from the WTS I respondents who expectedto improve upon their 2008 revenue goals.
PPeerrcceeppttiioonn ooff FFiinnaanncciiaall HHeeaalltthh
In 2009, 20.1 percent reported being healthy and notvulnerable, compared to 16.1 percent in 2008, and 53.7percent report feeling financially vulnerable now, compared to60 percent. At the end of 2009, 21.9 percent said they wereexperiencing chronic financial problems but expect to survive,compared to 18.4 percent in 2008. One positive trend is thatonly 2.3 percent of WTS II respondents weren’t sure if theywould survive through 2010, compared to 4.2 percent who in2008 doubted their survival in the coming year.
LLeevveellss ooff CCaasshh RReesseerrvveess
WTS II respondents reported less cash reserves at the end of 2009 than they had in 2008. While about one-third oforganizations continued to maintain two or three monthsof operating expenses in cash reserves, 8.7 percentreported they now have no reserves, an increase from the5.8 percent who reported no reserves in 2008. Thepercentage of respondents reporting four or moremonths of cash reserves fell from 44.9 percent in 2008 to41.1 percent at the end of 2009.
Impact on RevenuesDDeecclliinnee ffrroomm MMaajjoorr FFuunnddeerrss
Major sources of funding for many nonprofits dwindled in2009. Nearly 65 percent of respondents said that a majorfunder reduced or eliminated their support due thecurrent economy, up from 51.4 percent in WTS I. Fewerrespondents expect to lose funding in 2010.
DDeecclliinnee iinn FFuunnddiinngg FFrroomm IInnddiivviidduuaallss,, CCoorrppoorraattiioonnss,, FFoouunnddaattiioonnss aanndd GGoovveerrnnmmeenntt
More than 40 percent of responding nonprofits reportedsignificant decreases in funding from individual donations, 28.7 percent reported declines in government grants and 41.8percent saw declines in foundation grants. The percentage oforganizations experiencing decreases in these revenuecategories has increased by at least ten percent since WTS I for2008. In addition, the loss of corporate funding continued to bewidespread, with 42.1 percent reporting decreased funding in2009 compared to 37.2 percent in 2008.
Survey of the Nonprofit SectorReduced or Eliminated Major Funding
Decrease in Revenue Sources

42009 Update
SSoommee OOrrggaanniizzaattiioonnss MMaaddee PPoossiittiivvee GGaaiinnss
Some organizations were able to turn the 2009 economicclimate to their advantage and reported increases incertain revenues, especially in these areas:
15.4 percent – Individual donations (excluding bequests)
13.3 percent – Government grants11.7 percent – Fees for services/earned income13.5 percent – Special events
Contending with Declines in RevenueThe nonprofit sector is resilient. In 2009, nonprofitorganizations actively responded to the changing economicenvironment. Almost 73 percent reported establishingfinancial contingency plans or budgets, compared with 59.6percent who had developed such plans in 2008.Organizations said they were monitoring their financesmore carefully than in the past (89.9 percent) and werecommunicating more with funders about the needs and thechallenges they were facing (78.6 percent).
AAccttiioonnss ttoo SSuussttaaiinn OOppeerraattiioonnss
Many nonprofits experienced cash flow problems in 2009 andimplemented a variety of strategies to sustain their operations.More than half of the WTS II respondents (55.8 percent)reported a time in the last twelve months when their totalexpenses exceeded total revenue. That is nearly 10 percentmore than the 45.9 percent of WTS I respondents who reportedthe same problems for 2008. When asked about strategies theyused to compensate for declining revenues, more WTS IIrespondents reported using prior year cash reserves, cuttingback or eliminating programs, cutting staff hours, or conductinglayoffs than WTS I respondents reported for 2008.
TThhee EEccoonnoommiicc DDoowwnnttuurrnn EEnnggaaggeedd BBooaarrddss ooff DDiirreeccttoorrss
Many respondents agreed that the current economy causedtheir boards to become more engaged in many activities.
More than 84 percent engaged in planning related to the current economy to prepare for 2010.More than 91 percent had discussed the potential impact ofthe economy on the organization.Over 61 percent were more engaged in their organizations (giving more time, increasing board gifts, supporting fundraising efforts).Nearly 90 percent reported the board and staff were working together to address the impact of the economy on the organization.
Survey of the Nonprofit Sector
Mountain Area Land Trust
Actions Responding to Down Revenues
5 Weathering the Storm: Challenges and Opportunities Facing Nonprofits During Recession
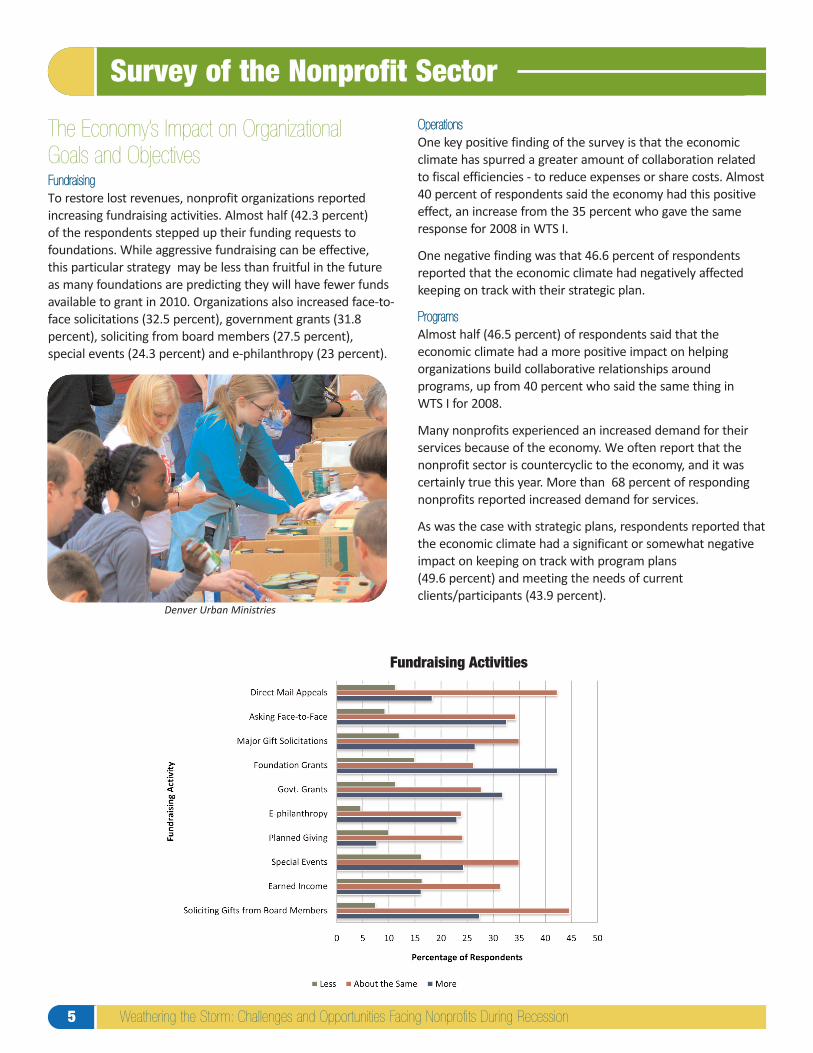
The Economy’s Impact on Organizational Goals and Objectives FFuunnddrraaiissiinngg
To restore lost revenues, nonprofit organizations reportedincreasing fundraising activities. Almost half (42.3 percent) of the respondents stepped up their funding requests tofoundations. While aggressive fundraising can be effective, this particular strategy may be less than fruitful in the futureas many foundations are predicting they will have fewer fundsavailable to grant in 2010. Organizations also increased face-to-face solicitations (32.5 percent), government grants (31.8percent), soliciting from board members (27.5 percent), special events (24.3 percent) and e-philanthropy (23 percent).
OOppeerraattiioonnss
One key positive finding of the survey is that the economicclimate has spurred a greater amount of collaboration relatedto fiscal efficiencies - to reduce expenses or share costs. Almost40 percent of respondents said the economy had this positiveeffect, an increase from the 35 percent who gave the sameresponse for 2008 in WTS I.
One negative finding was that 46.6 percent of respondentsreported that the economic climate had negatively affectedkeeping on track with their strategic plan.
PPrrooggrraammss
Almost half (46.5 percent) of respondents said that theeconomic climate had a more positive impact on helpingorganizations build collaborative relationships aroundprograms, up from 40 percent who said the same thing in WTS I for 2008.
Many nonprofits experienced an increased demand for theirservices because of the economy. We often report that thenonprofit sector is countercyclic to the economy, and it wascertainly true this year. More than 68 percent of respondingnonprofits reported increased demand for services.
As was the case with strategic plans, respondents reported thatthe economic climate had a significant or somewhat negativeimpact on keeping on track with program plans (49.6 percent) and meeting the needs of currentclients/participants (43.9 percent).
Survey of the Nonprofit Sector
Denver Urban Ministries
Fundraising Activities

62009 Update
Outlook for the Next Three YearsIn looking ahead, the new economic climate has many nonprofits rethinking their existing services and programs. About one-thirdof nonprofits are reexamining their assumptions with the possibility of fundamental restructuring. Another 35.5 percent believethat they will expand services in key areas, an increase from the 26.7 percent of WTS I. Most respondents expect to stay inbusiness, with less than one percent of those responding anticipating that they may need to close.
Specific Strategies for the FutureNonprofits are meeting the challenges of the economy head-on. To sustain themselves in this difficult economic climate,nonprofits report already implementing or considering many fundraising and cost-containment strategies they had not used in the past.
Looking Forward

7 Weathering the Storm: Challenges and Opportunities Facing Nonprofits During Recession
The following respondents are included in the analysis relatedto geographic setting:
Note: The survey asked, “Where does your organizationoperate? Select all that apply.” Some respondents selected morethan one area, so some items total more than 100 percent.
Key Findings by geography:
Statewide organizations were more likely to have fallen short of revenue goals, requiring a greater use of cost-saving measures. Rural organizations (60 percent) were more likely to feel financially vulnerable in the future. Urban and statewide organizations also report experiencing higher increases in demand for services.
Financial HealthMeeting revenue goals was a particular challenge for statewideorganizations in 2009. Only 34 percent said they expected tomeet their goals, compared to about 45 percent for rural,suburban and urban organizations.
A higher percentage of rural and statewide groups reporteddecreases in individual donations. Statewide and suburbanorganizations were more likely to report decreases in corporateand foundation funding. A higher percentage of ruralorganizations saw decreased government grant funding.
Descriptions of financial health varied by geographic servicearea. Only 17 percent of rural organizations reported beingfinancially healthy and not vulnerable compared to 24 percentof suburban organizations. More significantly, 60 percent ofrural organizations felt vulnerable about the future, comparedto statewide (39 percent), suburban (46 percent) and urban(52 percent) organizations. More statewide groups (32 percent)reported experiencing chronic financial problems thansuburban or urban (24 percent) or rural (19 percent).
Fewer statewide organizations (31 percent) had four or moremonths of cash reserves for operating expenses than did urban(43 percent) and rural and suburban organizations (41percent). Statewide organizations (16 percent) were also morelikely to have no cash reserves, than organizations operating inrural (9 percent), suburban (7 percent) or urban (5 percent)communities.
Contending with Declines in RevenueStatewide groups reported implementing more cost-savingmeasures than organizations serving other communities,particularly by cutting back or eliminating programs, cuttingstaff pay or hours, laying off staff or operating at a deficit.Urban organizations were more likely to cut staff pay or lay off staff than rural or suburban organizations. Suburban andurban organizations were more likely to have increasedfundraising or tried different fundraising strategies thanstatewide or rural groups.
ProgramA significant majority of organizations operating in eachgeographic setting reported that demand for services,programs and activities had increased. Overall, urbanorganizations reported the greatest increase, with 78 percentof respondents experiencing greater demand, compared to 69percent statewide, 62 percent suburban and 63 percent rural.
Key Findings by Geographic Service Area
Respondents by Geographic Service Area
Decrease in Revenue by Funding Source
82009 Update
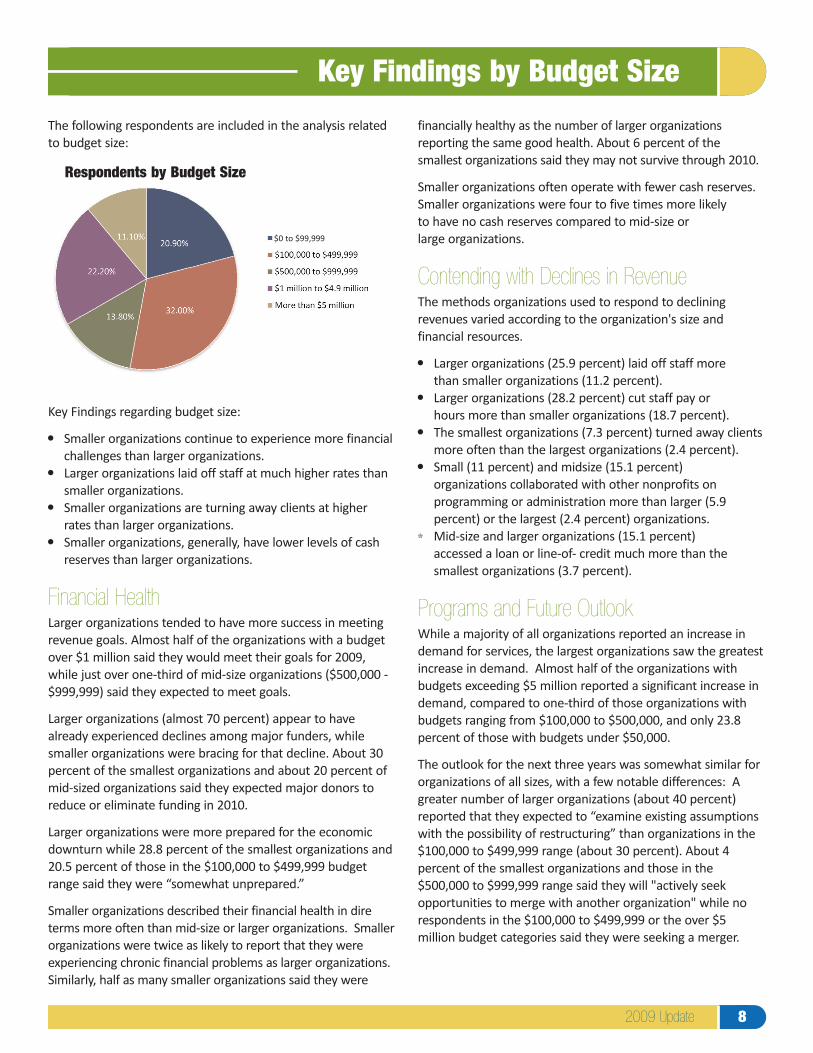
The following respondents are included in the analysis relatedto budget size:
Key Findings regarding budget size:
Smaller organizations continue to experience more financial challenges than larger organizations. Larger organizations laid off staff at much higher rates than smaller organizations. Smaller organizations are turning away clients at higher rates than larger organizations. Smaller organizations, generally, have lower levels of cash reserves than larger organizations.
Financial HealthLarger organizations tended to have more success in meetingrevenue goals. Almost half of the organizations with a budgetover $1 million said they would meet their goals for 2009,while just over one-third of mid-size organizations ($500,000 -$999,999) said they expected to meet goals.
Larger organizations (almost 70 percent) appear to havealready experienced declines among major funders, whilesmaller organizations were bracing for that decline. About 30percent of the smallest organizations and about 20 percent ofmid-sized organizations said they expected major donors toreduce or eliminate funding in 2010.
Larger organizations were more prepared for the economicdownturn while 28.8 percent of the smallest organizations and20.5 percent of those in the $100,000 to $499,999 budgetrange said they were “somewhat unprepared.”
Smaller organizations described their financial health in direterms more often than mid-size or larger organizations. Smallerorganizations were twice as likely to report that they wereexperiencing chronic financial problems as larger organizations.Similarly, half as many smaller organizations said they were
financially healthy as the number of larger organizationsreporting the same good health. About 6 percent of thesmallest organizations said they may not survive through 2010.
Smaller organizations often operate with fewer cash reserves.Smaller organizations were four to five times more likely to have no cash reserves compared to mid-size or large organizations.
Contending with Declines in RevenueThe methods organizations used to respond to decliningrevenues varied according to the organization's size andfinancial resources.
Larger organizations (25.9 percent) laid off staff more than smaller organizations (11.2 percent).Larger organizations (28.2 percent) cut staff pay or hours more than smaller organizations (18.7 percent).The smallest organizations (7.3 percent) turned away clients more often than the largest organizations (2.4 percent).Small (11 percent) and midsize (15.1 percent) organizations collaborated with other nonprofits on programming or administration more than larger (5.9 percent) or the largest (2.4 percent) organizations.Mid-size and larger organizations (15.1 percent) accessed a loan or line-of- credit much more than the smallest organizations (3.7 percent).
Programs and Future OutlookWhile a majority of all organizations reported an increase indemand for services, the largest organizations saw the greatestincrease in demand. Almost half of the organizations withbudgets exceeding $5 million reported a significant increase indemand, compared to one-third of those organizations withbudgets ranging from $100,000 to $500,000, and only 23.8percent of those with budgets under $50,000.
The outlook for the next three years was somewhat similar fororganizations of all sizes, with a few notable differences: Agreater number of larger organizations (about 40 percent)reported that they expected to “examine existing assumptionswith the possibility of restructuring” than organizations in the$100,000 to $499,999 range (about 30 percent). About 4percent of the smallest organizations and those in the$500,000 to $999,999 range said they will "actively seekopportunities to merge with another organization" while norespondents in the $100,000 to $499,999 or the over $5million budget categories said they were seeking a merger.
Key Findings by Budget Size
Respondents by Budget Size
$0 to $99,999
9 Weathering the Storm: Challenges and Opportunities Facing Nonprofits During Recession
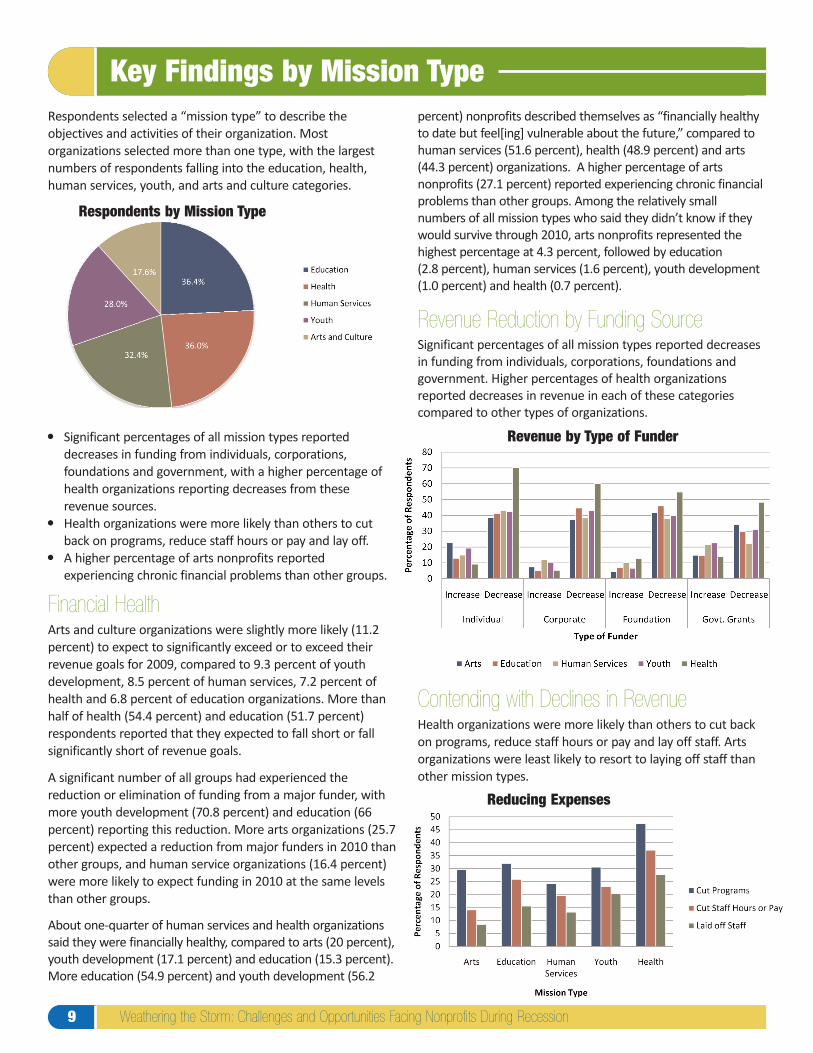
Respondents selected a “mission type” to describe theobjectives and activities of their organization. Mostorganizations selected more than one type, with the largestnumbers of respondents falling into the education, health,human services, youth, and arts and culture categories.
Significant percentages of all mission types reported decreases in funding from individuals, corporations, foundations and government, with a higher percentage of health organizations reporting decreases from these revenue sources.Health organizations were more likely than others to cut back on programs, reduce staff hours or pay and lay off.A higher percentage of arts nonprofits reported experiencing chronic financial problems than other groups.
Financial HealthArts and culture organizations were slightly more likely (11.2percent) to expect to significantly exceed or to exceed theirrevenue goals for 2009, compared to 9.3 percent of youthdevelopment, 8.5 percent of human services, 7.2 percent ofhealth and 6.8 percent of education organizations. More thanhalf of health (54.4 percent) and education (51.7 percent)respondents reported that they expected to fall short or fallsignificantly short of revenue goals.
A significant number of all groups had experienced thereduction or elimination of funding from a major funder, withmore youth development (70.8 percent) and education (66percent) reporting this reduction. More arts organizations (25.7percent) expected a reduction from major funders in 2010 thanother groups, and human service organizations (16.4 percent)were more likely to expect funding in 2010 at the same levelsthan other groups.
About one-quarter of human services and health organizationssaid they were financially healthy, compared to arts (20 percent),youth development (17.1 percent) and education (15.3 percent).More education (54.9 percent) and youth development (56.2
percent) nonprofits described themselves as “financially healthyto date but feel[ing] vulnerable about the future,” compared tohuman services (51.6 percent), health (48.9 percent) and arts(44.3 percent) organizations. A higher percentage of artsnonprofits (27.1 percent) reported experiencing chronic financialproblems than other groups. Among the relatively smallnumbers of all mission types who said they didn’t know if theywould survive through 2010, arts nonprofits represented thehighest percentage at 4.3 percent, followed by education (2.8 percent), human services (1.6 percent), youth development(1.0 percent) and health (0.7 percent).
Revenue Reduction by Funding SourceSignificant percentages of all mission types reported decreasesin funding from individuals, corporations, foundations andgovernment. Higher percentages of health organizationsreported decreases in revenue in each of these categoriescompared to other types of organizations.
Contending with Declines in RevenueHealth organizations were more likely than others to cut backon programs, reduce staff hours or pay and lay off staff. Artsorganizations were least likely to resort to laying off staff thanother mission types.
Key Findings by Mission Type
Respondents by Mission Type
Revenue by Type of Funder
Reducing Expenses
102009 Update
The nonprofit sector performs services that are essential tothe quality of life in every Colorado community. The followingare strategies to help keep nonprofits financially healthy andcommunities strong.
For Nonprofits OrganizationsThe list below suggests a few key strategies as they relate to each of the nine principles in Principles and Practices forNonprofit Excellence in Colorado, published by the Association in 2007.
Governance. Boards of Directors must rigorously exercise their responsibility for financial oversight and should themselves step up fundraising efforts for the organization.Planning. Create and update contingency plans for finance, programs, personnel and facilities.Fundraising. Diversify revenue streams and fundraising strategies. Expand individual giving programs and increase efforts to cultivate and retain current donors.Financial Management. Keep a close watch on cash flow and your financial standing. Ensure that the board and management staff both engage in analyzing the organization’s financial health regularly.Human Resources. Consider using volunteers to fulfill functions or to meet increased demands. Involve staff in making critical decisions.Evaluation. Measure the impact and effectiveness of your programs and communicate these outcomes to the public and donors.Public Policy. Engage policy makers now in the distribution of local, state and federal funding.Strategic Alliances. Develop collaborative relationships to partner on programming, reduce administrative costs or share resources.Transparency and Accountability. Communicate how the economy has affected your ability to meet community need and communicate decisions you have made about your operations in a timely, forthright manner to all stakeholders.
For FundersConsider making more general operating grants to help nonprofits through these financially difficult times.Increase communications with nonprofits about your plans or changes around your funding and share information about other available resources.Reward and facilitate the renewed collaboration among nonprofits that the economy has spurred.
For Individuals and BusinessesFind a cause and donate to an organization. Start by visiting www.generouscolorado.org. Every Colorado individual, family and business can make a difference. Every donation of money or time will strengthen your community. Find volunteer opportunities. Start by visiting the resources page of the Governor’s Commission on Community Service at www.colorado.gov/gccs/resources.html.
For State and Local Government PolicymakersRemember that nonprofit organizations leverage public dollars with private donations and volunteer hours. As such, they can maximize the use of public funds.Governments should continue to fund public services that nonprofit organizations deliver in a cost-efficient manner.Incorporate nonprofits in discussion pertaining to community issues. Through their boards, staff, clients, donors and volunteers, nonprofits have wide networks in communities and can serve as an important resource for information when policy makers are deciding how to allocate and spend public funds.
Call to Action
American Red Cross
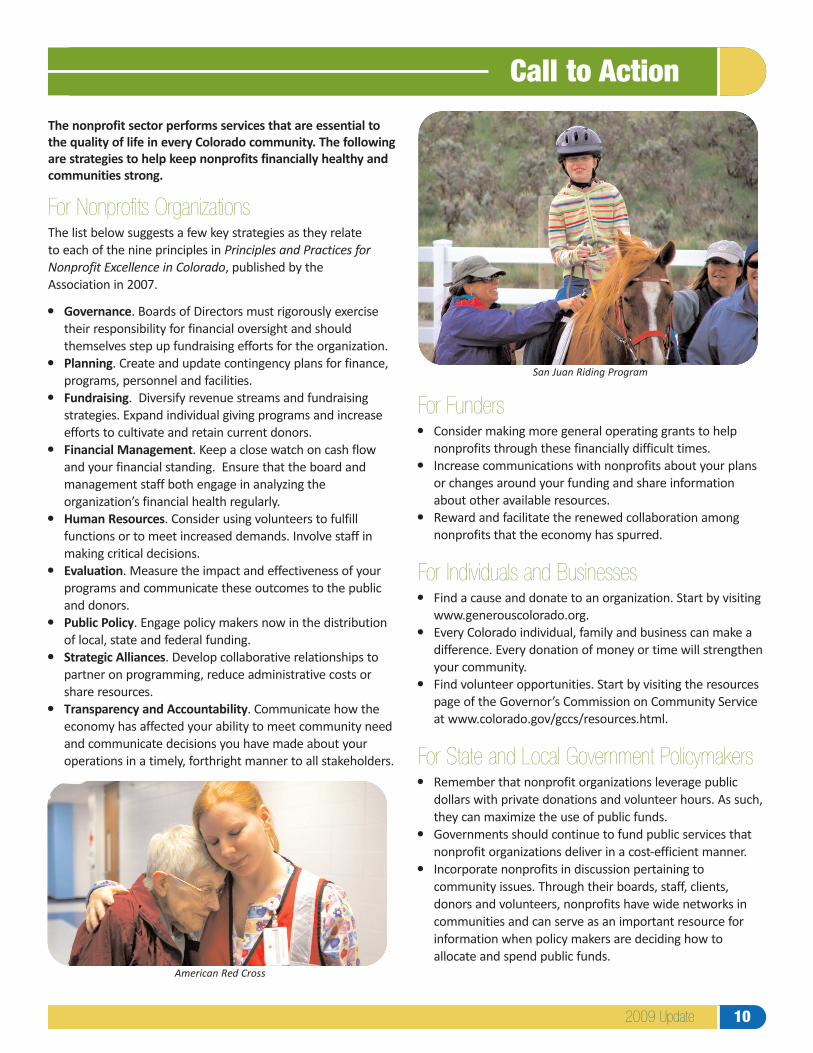
San Juan Riding Program

Weathering the Storm: Challenges and Opportunities Facing Nonprofits During Recession - 2009 Update
Project DirectorsRenny Fagan, President and CEO, Colorado Nonprofit Association; Sarah Fischler, Interim Co-Director, Community Resource Center
Report AuthorsSarah Fischler, Interim Co-Director, Community Resource Center; Renny Fagan, President and CEO; Natasha Lamoreux, Manager of
Education, Sharon Knight, Vice President and Chief Operating Officer, Colorado Nonprofit Association
Graphic Design Erin Spletzer, Communications Coordinator, Colorado Nonprofit Association
For Questions Contact:
Acknowledgements
Renny [email protected]: (303) 832-5710, ext. 201
www.ColoradoNonprofits.org
Sarah [email protected](303) 623-1540, ext. 27
www.crcamerica.org
Cover Photos (clockwise from upper left): Opera Colorado (Photo by Matthew Staver), Mile High Youth Corps, Kids in Need of Dentistry, Freedom Service Dogs, Special Transit