weather system - telemark university collegehome.hit.no/.../weather_system_report.pdf · weather...
TRANSCRIPT
Telemark University College
Faculty of Technology Kjølnes 3914 Porsgrunn Norway Lower Degree Programmes – M.Sc. Programmes – Ph.D. Programmes TF-ver.0.9
Project report 2012
Candidates: Christian Francis Aanning, André Skare Berg, Ahmed Gurhan, Victor Amaechi Igbokwe, Jishnu Unnikannan Nair, Cuong Hong Nguyen
Title: Design and Implementation of
Weather System for Acquiring and
Monitoring of Weather Data
2
Telemark University College Faculty of Technology
M.Sc. Programme
PROJECT REPORT, COURSE CODE SCE4006
Students: Christian Francis Aanning, André Skare Berg, Ahmed Gurhan, Victor Amaechi
Igbokwe, Jishnu Unnikannan Nair, Cuong Hong Nguyen
Thesis title: Design and Implementation of Weather System for Acquiring and Monitoring of
Weather Data
Signatures: . . . . . . . . . . . . . . . . . . ……………………………………. . . . . . . . . . . . . . .
Number of pages: 123
Keywords: OPC, LabVIEW, ASP.NET, Android,
iOS, Modbus, SQL, API . . . . . . . . . . .
. . . . . . . . . . . . . . . . . . . . . . . . . . . . . . . .
Supervisor: Hans-Petter Halvorsen sign.: . . . . . . . . . . . . . . . . . . . . . . . . . . . . . . . . .
2nd
Supervisor: sign.: . . . . . . . . . . . . . . . . . . . . . . . . . . . . . . . . .
Censor: Morten Pedersen sign.: . . . . . . . . . . . . . . . . . . . . . . . . . . . . . . . . .
External partner: National Instruments sign.: . . . . . . . . . . . . . . . . . . . . . . . . . . . . . . . . .
Availability: Open
Archive approval (supervisor signature): sign.: . . . . . . . . . . . . . . . . . . . . . . . . Date : . . . . . . . . . . . . .
Abstract:
As the impact of the weather on the entire globe is on a steady rise, it has become pertinent to device and imp-
lement apparatus that can be used to monitor this ever changing phenomenon within our immediate
surroundings. Latest trends in information technology require that weather information be presented in formats
that are readily available to the end users. This project report is about the design and implementation of a
weather system for acquiring and monitoring of weather data. The developed system is a framework for a
weather station installed within Telemark University College. Using the Modbus protocol, applications were
developed in the G-language of LabVIEW for retrieving weather data from the weather station, the received
data is further logged into an SQL database. Real-time data is made available within Telemark University
College via the OPC protocol whereas custom applications were developed used the Data Dashboard for
LabVIEW application to make the data available on Tablets and Smartphones that run on the Android and iOS
operating system. The ASP.NET technology was explored to develop a Website for display on computers and
TV screens within the college and for creation of web services to make this weather system available on the
worldwide web. Live weather data retrieved from the implemented weather system will be used for monitoring
weather parameters and for educational purposes in the University. The weather system was tested at different
levels of development, unit test, integration test and system test before deployment.
Telemark University College accepts no responsibility for results and conclusions presented in this report.

Table of contents
3
Table of contents
Abstract .................................................................................................................................. 2
Preface.................................................................................................................................... 6
Nomenclature ......................................................................................................................... 7
Overview of tables and figures .............................................................................................. 8
Overview ................................................................................................................. 11 Part I:
1 Introduction .................................................................................................................. 12
2 Problem description ..................................................................................................... 13
2.1 System description ............................................................................................................................. 13
2.2 Weather station system ...................................................................................................................... 14
2.3 System server..................................................................................................................................... 18
2.4 Software ............................................................................................................................................. 19
Theory ................................................................................................................. 21 Part II:
3 SQL Database system .................................................................................................. 22
3.1 Database overview ............................................................................................................................. 22
3.2 Database Table .................................................................................................................................. 22
3.3 Database model ................................................................................................................................. 23
3.4 Relational model ................................................................................................................................ 23
3.5 Database design ................................................................................................................................. 23
3.6 Database SQL server ......................................................................................................................... 24
3.7 Structured Query Language ............................................................................................................... 25
3.8 View .................................................................................................................................................. 26
3.9 Procedure ........................................................................................................................................... 27
3.10 ODBC ........................................................................................................................................... 27
3.11 XXTEA cipher algorithm ............................................................................................................. 27
4 Modbus protocol .......................................................................................................... 29
4.1 Data model......................................................................................................................................... 29
4.2 Functions ........................................................................................................................................... 29
4.3 Transaction ........................................................................................................................................ 30
4.4 PDU Request ..................................................................................................................................... 31
4.5 Response ............................................................................................................................................ 31
4.6 Modbus TCP/IP specification ............................................................................................................ 32
4.7 Modbus and the Microserver ............................................................................................................. 33
5 Scaling.......................................................................................................................... 34
6 API ............................................................................................................................... 35
6.1 API overview ..................................................................................................................................... 35
6.2 C# ...................................................................................................................................................... 36
6.3 ADO.NET .......................................................................................................................................... 36
6.4 Dynamic-link library (DLL) .............................................................................................................. 36
6.5 ASP.NET Web service ...................................................................................................................... 36
7 Tablet ........................................................................................................................... 37

Table of contents
4
7.1 Developing App for Android Operating Systems .............................................................................. 37
7.2 Developing App for iOS .................................................................................................................... 38
7.3 Developing App for Windows ........................................................................................................... 40
7.4 Tablet Weather Presentation .............................................................................................................. 41
8 TV- and Website .......................................................................................................... 46
8.1 Three tier architecture ........................................................................................................................ 47
9 OPC .............................................................................................................................. 48
9.1 OPC Specifications ............................................................................................................................ 48
9.2 OPC Architecture .............................................................................................................................. 49
9.3 The DCOM Challenge in OPC .......................................................................................................... 51
Implementation and Results ............................................................................. 53 Part III:
10 SQL Database system .................................................................................................. 54
10.1 Database design ............................................................................................................................ 54
10.2 Create database and tables ............................................................................................................ 57
10.3 Weather system database re-creation ............................................................................................ 58
10.4 SQL remote connection ................................................................................................................ 59
10.5 ODBC ........................................................................................................................................... 59
10.6 Backup .......................................................................................................................................... 59
10.7 View.............................................................................................................................................. 59
10.8 Procedures..................................................................................................................................... 61
10.9 Time period ................................................................................................................................... 62
11 Modbus Service ........................................................................................................... 64
11.1 Requests results ............................................................................................................................ 66
11.2 Responses results .......................................................................................................................... 66
12 API ............................................................................................................................... 68
12.1 Requirements ................................................................................................................................ 68
12.2 C#.................................................................................................................................................. 70
12.3 Web service .................................................................................................................................. 75
12.4 MATLAB ..................................................................................................................................... 78
12.5 LabVIEW ...................................................................................................................................... 81
12.6 Python web service API ................................................................................................................ 84
13 Tablet ........................................................................................................................... 85
13.1 Tablet Service - Weather Station Project ...................................................................................... 85
13.2 Creating Web Services in LabVIEW ............................................................................................ 85
13.3 Weather Presentation on Dashboard ............................................................................................. 88
13.4 Results .......................................................................................................................................... 88
14 TV- and Website .......................................................................................................... 93
14.1 Design ........................................................................................................................................... 93
14.2 IDE and Tools ............................................................................................................................... 94
14.3 Prototype of the Website ............................................................................................................... 95
14.4 Results .......................................................................................................................................... 97
15 OPC ............................................................................................................................ 103
15.1 Adding OPC tags ........................................................................................................................ 104
15.2 Types of OPC Clients ................................................................................................................. 106
Table of contents
5
15.3 Getting weather data ................................................................................................................... 106
15.4 Creating Customized Clients ...................................................................................................... 110
16 Other implementation ................................................................................................ 113
16.1 System configuration tool ........................................................................................................... 113
16.2 Defective wind speed sensor ....................................................................................................... 114
16.3 Port access .................................................................................................................................. 115
Summary ........................................................................................................... 116 Part IV:
17 Discussion and suggestion for further work .............................................................. 117
17.1 CPU usage .................................................................................................................................. 117
17.2 Tablet .......................................................................................................................................... 117
17.3 Website ....................................................................................................................................... 117
17.4 API .............................................................................................................................................. 118
17.5 Other suggestions for further work ............................................................................................. 118
18 Conclusion ................................................................................................................. 119
References .......................................................................................................................... 120
List of appendices .............................................................................................................. 123
Part V: Appendices ........................................................................ Separate document
Preface
6
Preface
This group project is a prerequisite for the award of a Master of Science (M.Sc.) degree in
System and Control Engineering at the Telemark University College. It was written in
accordance to the technical approach towards the Design and Implementation of a Weather
System for Acquiring and Monitoring of Weather Data.
The entire work was carried out within the confines of Telemark University College using
various professional tools such as LabVIEW 2012, Microsoft SQL server 2012, KEPware
OPC Server V5, Visual Studio 2010, MATLAB 2012a, Python 2.7 and Microsoft Office
Plus.
It is not a mandatory requirement that readers should have expert knowledge on the usage of
these academic tools especially as manuals have been created to aid user understanding
however, this will be an advantage in understanding this technical report.
We would like to express our deepest gratitude to our supervisor, Mr Hans-Petter Halvorsen
M.Sc., a lecturer in Faculty of Technology, Telemark University College, who has always
been within reach to provide guidance throughout the duration of the project. Additionally,
special thanks are to the University’s IT-department for providing necessary hardware and
technical assistance in the course of the project.
Porsgrunn, 30 November 2012
Christian Francis Aanning,
André Skare Berg,
Ahmed Gurhan,
Victor Amaechi Igbokwe,
Jishnu Unnikannan Nair,
Cuong Hong Nguyen
Nomenclature
7
Nomenclature
ADU – Application Data Unit
API – Application Program Interface
ASP – Active Server Pages
COM – Component Object Model
CSV – Comma-Separated Values
CWOP – Citizen Weather Observer
Program
DBMS – Database Management System
DCOM – Distributed Component Object
Model
DCOMCNFG – DCOM Configuration
DCS – Distributed Computer System
E/R – Entity Relationship
FTP – File Transfer Protocol
FTPS – File Transfer Protocol secure
GUI – Graphical User Interface
HTML – HyperText Markup Language
HTTP – HyperText Transfer Protocol
HTTPS – HTTP Secure
IIS – Internet Information Services
LabVIEW – Laboratory Virtual
Instrumentation Engineering
Workbench
LLVM – Low Level Virtual Machine
MBAP – Modbus Application Protocol
MS - Microsoft
NI – National Instruments
NNTP – Network News Transfer Protocol
ODBC – Open Database Connectivity
OLE – Object Linking and Embedding
OPC – Open Platform Communication
PCB – Printed Circuit Board
PDU – Protocol Data Unit
PLC – Programmable Logic Controller
RTU – Remote Terminal Unit
SDK – Software Development Kit
SMTP – Simple Mail Transfer Protocol
SubVI – Subroutine VI
SQL – Structured Query Language
TCP/IP – Transport Control Protocol and
Internet Protocol (the Internet
protocol suite)
TUC – Telemark University College
UDP – User Datagram Protocol
UI – User Interface
UML – Unified Modeling Language
URL – Uniform Resource Locator
UTC – Coordinated Universal Time
VI – Virtual Instrument
XML – Extensible Markup Language

Overview of tables and figures
8
Overview of tables and figures
Overview ................................................................................................................. 11 Part I:
Figure 2-1: System overview ............................................................................................... 14
Figure 2-2: Weather station overview.................................................................................. 15
Table 2-1: Specifications for Capricorn 2000EX™ Weather Station and corresponding
sensors. ................................................................................................................................. 16
Table 2-2: Microserver computer specification ................................................................... 16
Figure 2-3: Log in prompt for the weather Microserver ...................................................... 17
Table 2-3: A summary of the system server specification ................................................... 19
Theory ................................................................................................................. 21 Part II:
Figure 3-1: Table used for storing data in a database. ......................................................... 22
Figure 3-2: E/R diagram shows tables are linked by primary key and foreign key. ............ 23
Figure 3-3:Microsoft SQL Server Management Studio [9]. ................................................ 25
Table 3-1: SQL queries and their functions. ........................................................................ 26
Figure 3-4: A "VIEW" is created from two original tables in the database......................... 26
Figure 3-5: Basic encryption and decryption using a 128 bit key ....................................... 28
Table 4-1: Primary data tables in Modbus [11] ................................................................... 29
Table 4-2: The most common Modbus functions [11] ........................................................ 30
Figure 4-1: ADU and PDU explained .................................................................................. 30
Figure 4-2: A Modbus transaction ....................................................................................... 30
Figure 4-3: A Modbus request example for reading input register 10-13 ........................... 31
Figure 4-4: Big endian representation.................................................................................. 31
Figure 4-5: A Modbus response example for reading input registers 10-13 ....................... 32
Figure 4-6: Fields of the MBAP header ............................................................................... 32
Figure 4-7: The full ADU request for Modbus TCP/IP ....................................................... 32
Table 4-3: Some Modbus measurements parameters from the Microserver. ...................... 33
Table 5-1: Unit conversions ................................................................................................. 34
Figure 6-1: API's for the weather system ............................................................................. 35
Figure 6-2: C# is a combination of the best of other programming languages[17] ............. 36
Figure 7-1: Webservice and LabVIEW [27] ........................................................................ 43
Figure 7-2: The Request/Response model ........................................................................... 44
Figure 7-3: Standard protocols that are used from the clients side to the server side [27] .. 45
Figure 8-1 Three Tier Architecture ...................................................................................... 47
Figure 9-1: Several Clients connecting to a single server.................................................... 50
Figure 9-2: Interconnectivity between multiple clients and multiple server vendors .......... 50
Implementation and Results ............................................................................. 53 Part III:
Overview of tables and figures
9
Figure 10-1: E/R diagram of the weather system database.................................................. 56
Table 10-1: Tables and their functions. ............................................................................... 57
Figure 10-2: SQL script to create a table by the name "WEATHER_DATA". .................. 58
Figure 10-3: "WeatherData" table with all the columns. ..................................................... 58
Figure 10-4: Virtual table by the name “DeviceView”. ...................................................... 60
Figure 10-5: SQL script for creating virtual table "DeviceView". ...................................... 60
Figure 10-6: SQL script for creating "GetDeviceParameter" .............................................. 61
Figure 10-7: Column “ParameterName” as output of the procedure “GetDeviceParameter”.
.............................................................................................................................................. 62
Table 10-2: List of most important created procedures. ...................................................... 62
Table 10-3: Query to locate time period. ............................................................................. 63
Figure 11-1: Modbus service front panel during run-time................................................... 64
Figure 11-2: Modbus Service flow chart ............................................................................. 65
Table 11-1: Request result (output from SubVI modbus_request.vi in Appendix C) ......... 66
Table 11-2: Responses received from the Modbus slave (server) for short responses ........ 67
Figure 12-1 WEATHER_PARAMETER table ................................................................... 68
Table 12-1: Requirements .................................................................................................... 69
Figure 12-2 : C# DLL Library ............................................................................................. 71
Figure 12-3 GetLatest procedure ......................................................................................... 73
Figure 12-4 Adding DLL ..................................................................................................... 74
Figure 12-5 GetWeatherParameters() DLL ......................................................................... 75
Figure 12-6GetWeatherItemData DLL ................................................................................ 75
Figure 12-7: Web service ..................................................................................................... 76
Figure 12-8 Webservice URL .............................................................................................. 77
Figure 12-9 Air temperature from the webservice ............................................................... 78
Figure 12-10: MATLAB Native m-file folder ..................................................................... 79
Figure 12-11: Help command GetWeatherItemData ........................................................... 80
Figure 12-12: wsGetLatest ................................................................................................... 81
Figure 12-13: LabVIEW SubVI's in a block diagram ......................................................... 81
Figure 12-14GetWeatherItemData VI front panel ............................................................... 82
Figure 12-15: GetWeatherItemData SubVI ......................................................................... 82
Figure 12-16: Importing web service methods to LabVIEW .............................................. 83
Figure 12-17: Web service VI's ........................................................................................... 83
Figure 12-18: Data from Python web service ...................................................................... 84
Figure 13-1: Project Explorer for the Tablet Web Service .................................................. 86
Figure 13-2: The Service name is important to remember since it will be a part of the URL
for the Web Service ............................................................................................................. 86
Table 13-1: An overview of the VIs that are included in the project for Web Service. ...... 87
Figure 13-3: The first page in the dashboard showing the latest weather data .................... 89

Overview of tables and figures
10
Figure 13-4: The second page on the Dashboard is showing statistics weather data for the
temperature. ......................................................................................................................... 90
Figure 13-5: The third page on the Dashboard are showing latest wind data...................... 91
Figure 13-6: The fourth page on the Dashboard is showing rain data ................................. 92
Figure 14-1 Flow chart of the web site ................................................................................ 93
Figure 14-2 The UML class diagram of the website ........................................................... 94
Figure 14-3 The Overview Page of the Website .................................................................. 97
Figure 14-4 Drop down menu for Overview page ............................................................... 97
Figure 14-5: Details Page of the Website ............................................................................ 98
Figure 14-6: Trends page of the Website showing Temperature ......................................... 98
Figure 14-7 Trends in Rainfall ............................................................................................. 99
Figure 14-8: Drop down menu of trends page ..................................................................... 99
Figure 14-9: Statistics page of the Website ....................................................................... 100
Figure 14-10: Forecast page from the Website .................................................................. 101
Figure 14-11: MI page from the Website .......................................................................... 102
Figure 14-12 About Page of the Website ........................................................................... 102
Table 15-1: Summary of OPC Server configuration settings ............................................ 103
Figure 15-1: Fully Configured OPC Server Outlook ......................................................... 104
Figure 15-2: Showing active tags on OPC Server-side ..................................................... 107
Figure 15-3: Reading OPC tags on the Client side ............................................................ 107
Figure 15-4: Cogent datahub OPC Tunneling solution ..................................................... 109
Figure 15-5: How Cogent datahub works[51] ................................................................... 109
Figure 15-6: GUI for the C# OPC Client ........................................................................... 110
Figure 15-7: Reading OPC tags from apython Client ........................................................ 111
Figure 15-8: LabVIEW Front panel of for the LabVIEW Client ...................................... 111
Figure 16-1: Front panel of the configuration tool, where the CONFIGURATION table is
shown. ................................................................................................................................ 114
Table 16-1: Communication status on ports. ..................................................................... 115
Summary ........................................................................................................... 116 Part IV:
Telemark University College Faculty of Technology
Overview Part I:
Introduction
12
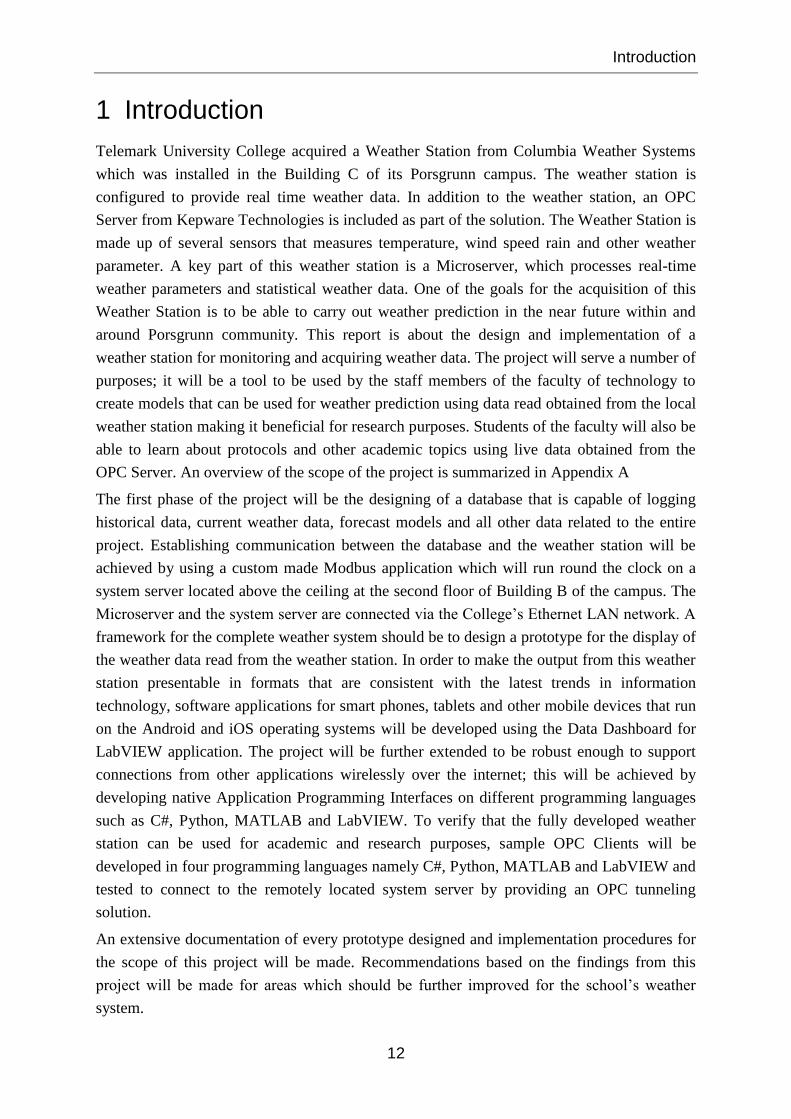
1 Introduction
Telemark University College acquired a Weather Station from Columbia Weather Systems
which was installed in the Building C of its Porsgrunn campus. The weather station is
configured to provide real time weather data. In addition to the weather station, an OPC
Server from Kepware Technologies is included as part of the solution. The Weather Station is
made up of several sensors that measures temperature, wind speed rain and other weather
parameter. A key part of this weather station is a Microserver, which processes real-time
weather parameters and statistical weather data. One of the goals for the acquisition of this
Weather Station is to be able to carry out weather prediction in the near future within and
around Porsgrunn community. This report is about the design and implementation of a
weather station for monitoring and acquiring weather data. The project will serve a number of
purposes; it will be a tool to be used by the staff members of the faculty of technology to
create models that can be used for weather prediction using data read obtained from the local
weather station making it beneficial for research purposes. Students of the faculty will also be
able to learn about protocols and other academic topics using live data obtained from the
OPC Server. An overview of the scope of the project is summarized in Appendix A
The first phase of the project will be the designing of a database that is capable of logging
historical data, current weather data, forecast models and all other data related to the entire
project. Establishing communication between the database and the weather station will be
achieved by using a custom made Modbus application which will run round the clock on a
system server located above the ceiling at the second floor of Building B of the campus. The
Microserver and the system server are connected via the College’s Ethernet LAN network. A
framework for the complete weather system should be to design a prototype for the display of
the weather data read from the weather station. In order to make the output from this weather
station presentable in formats that are consistent with the latest trends in information
technology, software applications for smart phones, tablets and other mobile devices that run
on the Android and iOS operating systems will be developed using the Data Dashboard for
LabVIEW application. The project will be further extended to be robust enough to support
connections from other applications wirelessly over the internet; this will be achieved by
developing native Application Programming Interfaces on different programming languages
such as C#, Python, MATLAB and LabVIEW. To verify that the fully developed weather
station can be used for academic and research purposes, sample OPC Clients will be
developed in four programming languages namely C#, Python, MATLAB and LabVIEW and
tested to connect to the remotely located system server by providing an OPC tunneling
solution.
An extensive documentation of every prototype designed and implementation procedures for
the scope of this project will be made. Recommendations based on the findings from this
project will be made for areas which should be further improved for the school’s weather
system.
Problem description
13
2 Problem description
Weather stations are available in many locations around us, however the location of any
station is an important factor in determining the accuracy and precision of measured weather
data received from this station. The idea of having a local weather station within Telemark
University will be incomplete without a framework for the output from this station.
This project comprises of several tasks aimed at the Design and Implementation of a weather
system for acquiring and monitoring of weather data. An initial challenge was developing a
Modbus program for retrieving live data from the weather station using the Modbus protocol
and logging these data into an SQL database. Different programming languages such as C#,
ASP.NET, Python, MATLAB and LabVIEW are required to be used in retrieving weather
parameters from the database in order to make it available in varying formats like Tablets,
smart phones, computers and a TV display. an important purpose of this project is to make
available live data within the University Campus and hence an OPC Server is also required
in order to create an open source data availability media for educational and research
purposes.
2.1 System description
The weather system is made up of various units that have been put together to achieve the
purpose of monitoring and acquiring weather data from a pre-installed weather station located
in building C in Telemark University College. A relational database for different functions
that is carried out by the weather system is created from scratch, some of the function include
getting weather data logging of weather parameters, forecast parameters, and forecast model.
A key part of the system is a Modbus application service for the retrieval of weather data
from a Microserver in the Weather station via the Modbus protocol. This Modbus application
is created using LabVIEW. The weather system does also include customized applications for
two major mobile operating systems namely Android and iOS in order to make the weather
data available for mobile device users. The web-service part of this system allows the
weather data to be readily available on the World Wide Web in order for software
applications to be able to read weather data. It runs on the main server and enables client
applications in various languages to call for data from the weather system. KEPwareEX OPC
server is configured on the main server to make an open source system for retrieving weather
data used for educational and research purposes. Large TV display screens are used to display
a dynamic website created for this project in ASP.NET framework in order to provide live
data within the College. Access to this weather system can be made via the various
laboratories in the University College, the Eduroam network and the worldwide web. Figure
2-1 shows an overview of the system.

Problem description
14
Weather
station and
micro-
server
Internet
Student LAN
Computer
labs
Gateway
(blocks all traffic
except Web
services)
Staff LAN Eduroam WLAN
Smart
phonesTablets Computer
Web server
Configuration
tool
OPC server
Modbus service
System Server
SQL database
C# web service
for API
OPC tunneler
Tablet service
XML web service
Figure 2-1: System overview
2.2 Weather station system
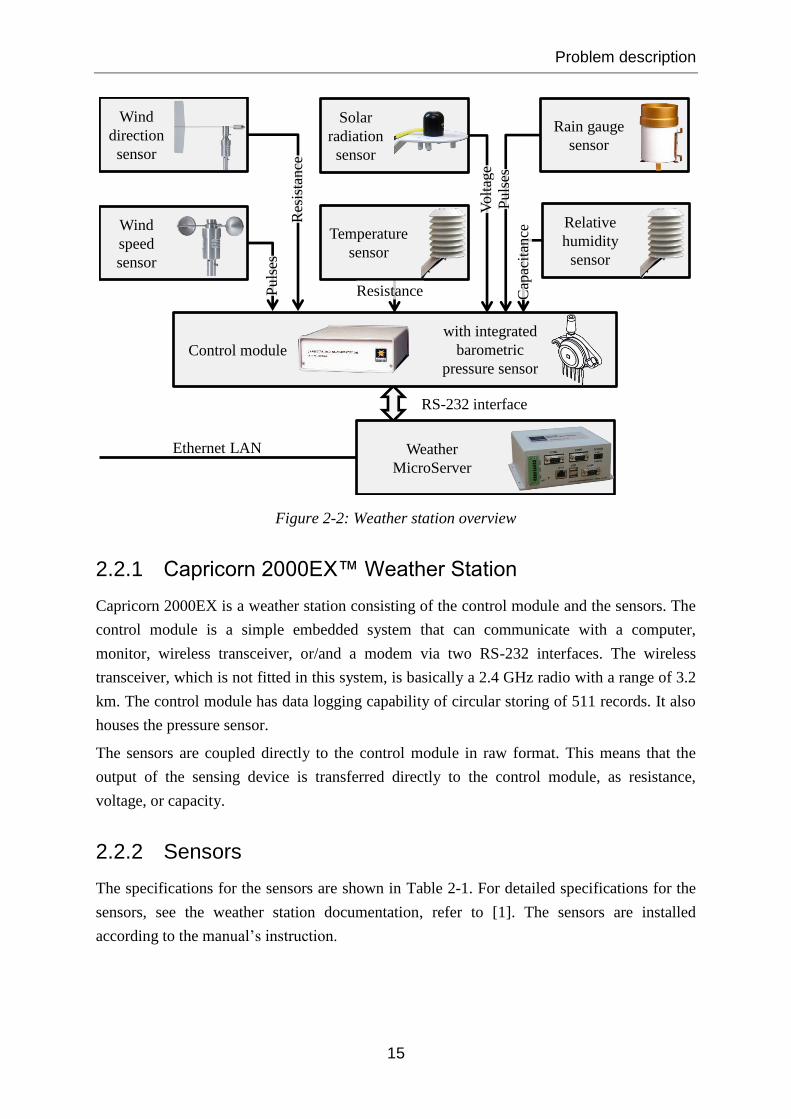
The whole weather station system consists of three parts; sensors, a control module, and a
small computer called a weather Microserver. An overview of the weather station system is
shown in Figure 2-2. The control module and the Microserver are located indoors. Most
sensors are separate, except the combined wind speed- and direction sensor. The barometric
pressure sensor is part of the control module’s PCB, and is therefore located indoor too.
Problem description
15
Rain gauge
sensor
Solar
radiation
sensor
Temperature
sensor
Relative
humidity
sensor
Wind
direction
sensor
Wind
speed
sensor
Control module
with integrated
barometric
pressure sensor
Res
ista
nce
Pu
lses
Volt
age
Puls
es
Cap
acit
ance
Resistance
Weather
MicroServer
RS-232 interface
Ethernet LAN
Figure 2-2: Weather station overview
2.2.1 Capricorn 2000EX™ Weather Station
Capricorn 2000EX is a weather station consisting of the control module and the sensors. The
control module is a simple embedded system that can communicate with a computer,
monitor, wireless transceiver, or/and a modem via two RS-232 interfaces. The wireless
transceiver, which is not fitted in this system, is basically a 2.4 GHz radio with a range of 3.2
km. The control module has data logging capability of circular storing of 511 records. It also
houses the pressure sensor.
The sensors are coupled directly to the control module in raw format. This means that the
output of the sensing device is transferred directly to the control module, as resistance,
voltage, or capacity.
2.2.2 Sensors
The specifications for the sensors are shown in Table 2-1. For detailed specifications for the
sensors, see the weather station documentation, refer to [1]. The sensors are installed
according to the manual’s instruction.

Problem description
16
Table 2-1: Specifications for Capricorn 2000EX™ Weather Station and corresponding
sensors.
Measurand Sensing device Range Accuracy Resolution
Temperature Digital semi-
conductor
-55 to 125 °C 0.5 °C (-10 to 85 °C,
else 2.0 °C)
0.006 °C
Pressure Strain gauge 910 to 1150 hPa 1 hPa (0 to 83.3 °C) 0.3 hPa
Wind speed Reed switch 0 to 71.5 m/s 0.11 m/s (0 to 10 m/s) 0.448 m/s
Wind direction 10 kΩ
potentiometer
0 to 356 degrees 4 degrees 2 degrees
Rel. Humidity Capacitance 0 to 100 % 3 % (10 to 90 % RH) 1 % RH
Rainfall Tipping bucket 1 % up to 2 in/h 0.01 in
Solar radiation Photo diode 5 %
2.2.3 Weather Microserver™
The Microserver is a small embedded computer that runs a Linux based OS. It is ready-made
for communicating to a Capricorn 2000EX weather station, amongst two other weather
stations. The technical specification for the computer is shown in Table 2-2. [2]
Table 2-2: Microserver computer specification
Type Specification
Processor 200 MHz ARM9
RAM 32 MiB1
Storage 512 MiB
Connections 3 serial ports, 1 Ethernet port
For this project one of the serial ports is connected to the control module, and the Ethernet
port is connected to a Telemark University College LAN.
The Microserver has a wide range of capabilities and services.
1 Mi is abbreviation for Mebi (Mega Binary), 1kiB = 1024 bytes, 1 MiB = 1024² = 1 048 576 bytes, GiB = 1024³
bytes 1 073 741 824, etcetera. These are called a binary prefix.

Problem description
17
FTP-service saving weather data to a user-specified FTP-server in XML or CSV
format
XML web service
Internet browser user interface
SNMP communication protocol
Modbus RTU and Modbus TCP/IP protocols
Data logging capability, saving all measurements to a CSV-file every minute.
Data output to the Weather Underground and CWOP. Weather Underground
(www.wundergournd.com) and CWOP is a website where weather data can be
uploaded, it will then be available for public and will be used in short- and long term
weather forecasts.
Maintenance capabilities as virus protection and operating system upgrades
The most important feature for this project is the Modbus TCP/IP protocol, which will be
used to transfer weather data across an Ethernet LAN to the main server. See chapter Part II:
for an introduction to the Modbus TCP/IP protocol, and chapter 4.7 for details of Modbus on
the Microserver.
To configure the Microserver one must use the internet browser user interface, it is accessed
by typing the Microserver IP-address to the address field. The IP-address is set up static to
128.39.35.***. The message shown in Figure 2-3 will appear, prompting for username and
password. The user name is admin, and by default the password is also admin. But this
password was changed to strength security. A user logged into the system has full access to
modify all settings of the Microserver.
Figure 2-3: Log in prompt for the weather Microserver

Problem description
18
2.2.4 Maintenance
According to weather station documentation, some of the sensors should have some degree of
maintenance.
According to the wind sensor manual, the ball bearings of the wind speed sensor
should be replaced in intervals of 12-24 months [3].2
The lens in front of the solar radiation sensor should be kept clean.
The rain gauge sensor must be cleaned by leaf or dirt.3
The others sensor are basically maintenance-free. But the relative humidity sensor should be
replaced every four years, because it will become more unstable with time [1].
2.2.5 Sensor calibration
According to the Weather Station manual, all sensors are factory calibrated to a high degree
of accuracy. Based on this, a sensor calibration procedure is not performed on the sensors.
The only setting that should be done is to set the altitude of the barometric pressure sensor,
which is approximately 8 m above sea level (26 feet). This altitude is set in the Microserver
configuration webpage.
If the sensors anyway should be calibrated, one can set calibration offsets in the Microserver
configuration webpage. Instructions for calibrating the temperature, rainfall, and wind speed
sensors are given in the manual. These are the only measurands that can actually be calibrated
in the control module software. E.g. for calibrating the temperature sensor, a mixture of ice
and water that holds exactly 0 °C can be used.
2.3 System server
A dedicated computer which is the system server for this weather station project was installed
in the ceiling of building B. This system server is connected to the Microserver via the
school’s LAN Ethernet network, the computer runs on the Windows Server operating system.
A summary of the system specification is shown in Table 2-3
2 When the wind speed sensor was disassembled for fixing the erroneous wind speed readings, the two ball
bearings was in good condition, i.e. they spun freely without noise.
3 Not a problem in Telemark University College

Problem description
19
Table 2-3: A summary of the system server specification
System unit Specification
Processor Intel Core i5-2500 CPU 3.3 GHz
Memory 8 GB
OS Windows Server (Standard) 2008 64-bit
HDD 120 GB
Optical Drive DVD/CD ROM +-RW Drive
Graphics Card: ATI Radeon HD 5400 series
Network Adapter Intel 82579LM Gigabit Network Connection
Static IP 128.39.35.252
2.4 Software
The list below shows the software that is installed on the system server, and that is used in the
project.
7-Zip Version 9.2 (64 bit)
Google Chrome:
Google Drive
IIS 7.5 Express
KEPServer EX5
Cogent DataHub
Matrikon OPC Suite
o OPC Analyser
o OPC Explorer
o OPC HDA Explorer
o OPC Simulation Server
o OPC Tunneller
Microsoft.NET Framework 1.1
Microsoft.NET Framework 3.5SP1
Microsoft.NET Framework 4
Microsoft ASP.NET MVC 2
Microsoft Office Professional Plus
2010
Microsoft Security Essentials
Microsoft Silverlight
Microsoft SQL Server 2012
Microsoft Visual Studio 2010
Opera 12.01
National Instruments LabVIEW
2012
o SQL toolkit
Python 2.7.3
Team Viewer 7

Problem description
20
2.4.1 LabVIEW
LabVIEW is a development environment by National instruments that is known for its user
friendly graphical programming environment. The programming language is “G”. [4]
2.4.2 Python
Python is a high level open source programming language that is known for its dynamic data
types, extensive standard library, readable and clear syntax [5].
2.4.3 MATLAB
MATLAB is a high level programming environment for numerical computation, visualization
and programming [6]. MATLAB is a highly appreciated “tool” by engineers, scientist and
industry. The MATLAB environment offers a wide range of Toolboxes that contains
functionalities to solve problems in different areas.
Telemark University College Faculty of Technology
Theory Part II:

SQL Database system
22
3 SQL Database system
Literature survey of Database systems is the main focus of this chapter. Database itself is a
huge subject which touches a wide range of areas. Therefore, the scope will be restricted to
review structures, functionalities and performance of the database systems that is only related
to the project.
3.1 Database overview
Database is a concept for collection of information, data, records such as; books, movies,
music etc. in a structured way so it can easily be stored, accessed, managed and updated by
computers. Technically everything existing around us can be stored in a database and
“everything” today is stored in databases. Databases exists everywhere, which touches on an
enormous range of business areas like; supermarket, YouTube, library, face book, school,
Wikipedia and so on [7]. All the companies and organizations, from small to large, around the
globe are completely depending on having a structured way of keeping their huge amount of
information safely. According to [8] normally a database is able to store unlimited amount of
data.
3.2 Database Table
Records are preserved in a database inform of two dimensional tables. Each single table
consists of columns and rows. Each column contains various types of attributes, while each
row corresponds to a single record [7]. Figure 3-1 illustrates a table for storing information of
different persons as records. The table consists of four different column names from which,
“FirstName”, “LastName” and “PhoneNumber” represent attributes of the persons.
Information related to each person is stored in the same row, due to that the table in Figure
3-1 consists of two rows. Several tables are connected to each other in a structured manner to
form a database.
Figure 3-1: Table used for storing data in a database.

SQL Database system
23
3.3 Database model
Database can be very complex and may consist of hundreds of tables to store huge amounts
of data. The idea is to have an efficient and get a maximum usage of a database as possible.
The quality in performance of a database depends completely on the design. Different tables
should be connected to each other in a structured way based on the manner of how data shall
be stored, process and retrieved. “Database structure is also known as database model or the
data model” [8]. Data model includes the way of structuring data and operations that can be
performed on the data. There exists many different type of models, some examples are; flat
model, hierarchical model, network model, dimensional model, object database model.
Among all these relational model is the most common one.
3.4 Relational model
A relational database model contains more than one table. Each of them consists of columns
and rows exactly as previously described in section 3.2 in this specific type of model all the
tables are linked to each other by primary and foreign key. Figure 3-2 shows the tables are
connected by the primary key (PersonID) in “PERSON” table and foreign key (PersonID) in
the “PASSWORD” table. This is a powerful method for processing and accessing data across
the tables. The main condition is that primary key in this case PersonID which is an integer
has to be a uniquely numbered in the table. Normally the primary key number is set to
increase automatically when creating the tables.
Figure 3-2: E/R diagram shows tables are linked by primary key and foreign key.
3.5 Database design
Several steps has to be done before a database is created, these steps are included in the
planning phase. In this phase the designer has to collect as much information as possible
about the purpose of the about to be created database, what it is created for, who is the end
users, which organization and even their vision in the future. Based on the collected
information the designer is then able to put up requirements and choose the appropriate

SQL Database system
24
model [7]. A database is designed by creating an E/R diagram whose content should satisfy
all the requirements, example of such is illustrated in Figure 3-2.
The following information should be included in an E/R diagram [7];
All the tables of the database must be specified.
Every table must have a name.
If tables are connected to each other, this has to be specified.
All the column names must be stated.
Each table must have a primary key.
Foreign key must be given if tables are linked.
Data type for each column shall be specified.
As much information as possible must be specified in the E/R diagram, the benefit of this is
at the creating phase, just simply follow these specifications. An entity relationship diagram
can be created by just simply using paper and pen, many tools have been developed for this
specific purpose and some of these to mention are; ERwin, Toad Data Modeler, MS Visio
and etc.
3.6 Database SQL server
All the records/data are stored in different types of tables and these tables are located in a
database SQL engine, which is just a round-the-clock service either on the client or a
computer server [9]. One database engine can contain several different types of databases.
Since a database engine is just a service running in the background without a graphical user
interface, interaction with a database a management studio is needed. Management studio is a
GUI which allows users to have a full access to the database SQL server.
SQL servers are also known as DBMS and consist of a database engine and a management
studio. The engine runs the database service in the background while management studio
gives the users possibilities such as; browse, select, delete, update, create tables and even do
the configuration to the server [9]. Various brands of SQL server can be found and they are
provided from different vendors; Oracle, Microsoft Access, Sybase, MySQL, Microsoft SQL
Server and etc. Figure 3-3 illustrates a layout of the Microsoft SQL Server management
studio.
SQL Database system
25
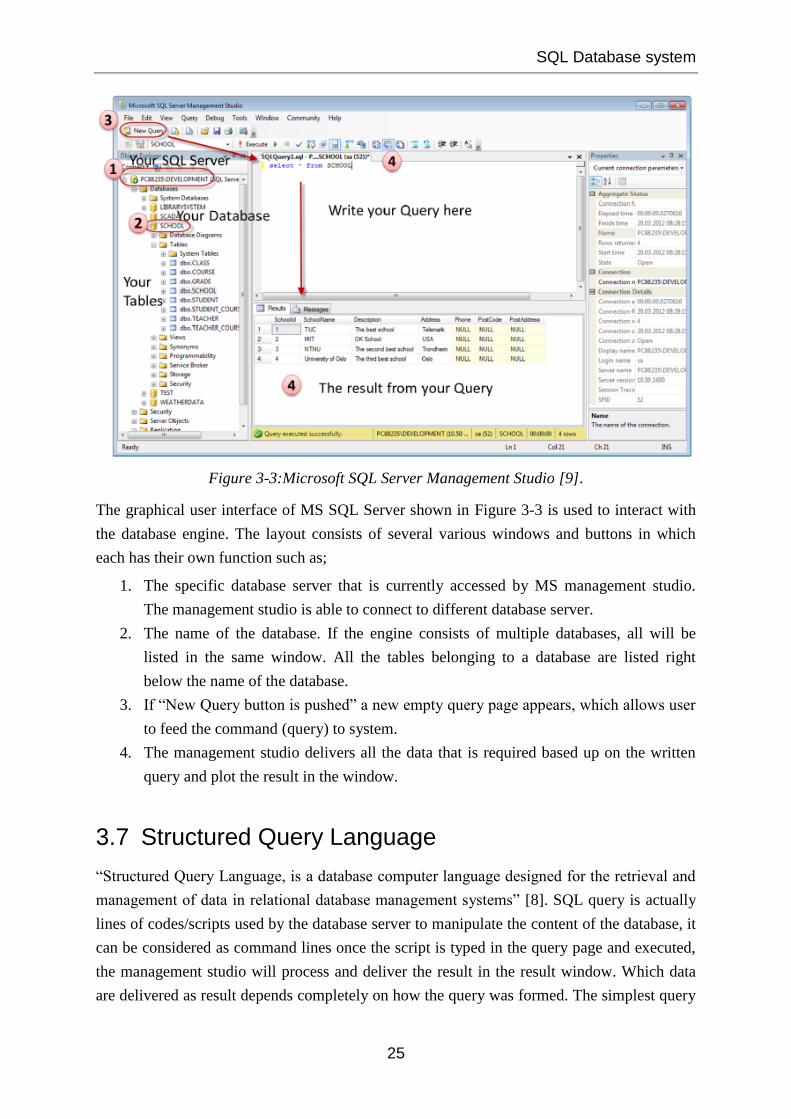
Figure 3-3:Microsoft SQL Server Management Studio [9].
The graphical user interface of MS SQL Server shown in Figure 3-3 is used to interact with
the database engine. The layout consists of several various windows and buttons in which
each has their own function such as;
1. The specific database server that is currently accessed by MS management studio.
The management studio is able to connect to different database server.
2. The name of the database. If the engine consists of multiple databases, all will be
listed in the same window. All the tables belonging to a database are listed right
below the name of the database.
3. If “New Query button is pushed” a new empty query page appears, which allows user
to feed the command (query) to system.
4. The management studio delivers all the data that is required based up on the written
query and plot the result in the window.
3.7 Structured Query Language
“Structured Query Language, is a database computer language designed for the retrieval and
management of data in relational database management systems” [8]. SQL query is actually
lines of codes/scripts used by the database server to manipulate the content of the database, it
can be considered as command lines once the script is typed in the query page and executed,
the management studio will process and deliver the result in the result window. Which data
are delivered as result depends completely on how the query was formed. The simplest query

SQL Database system
26
in SQL will show all the data existing in one table, while a more complex query will give
result which is narrowed down to a more specific data or getting data as result across
different tables in the database. Some simple queries and their performance are described in
Table 3-1.
Table 3-1: SQL queries and their functions.
Query Performance
Select List data from the database
Insert into Store data into the database
update Update/change some attribute of already existed records
delete Erase data from a table
create Add a new table to the database
Join Combine data from different tables
3.8 View
Database “VIEW” is basically a virtual table that gathers and shows some specific chosen
columns from different original tables in the database, as shown in Figure 3-4: A "VIEW" is
created from two original tables in the database. View is created by SQL script in which the
desired columns are specified, the selected columns can be from multiple tables, by using join
operator the tables are joined together [7] which gives more freedom to process the data.
By using views gives many advantages over tables such as; protect the original data in the
physical database, views can join and simplify multiple tables into a single virtual table,
views can hide the complexity of the data, in other words views give the opportunity to limit
the degree of exposure of tables to the outer world. All the advantages mentioned and even
more take very little space to store.
Figure 3-4: A "VIEW" is created from two original tables in the database.
SQL Database system
27
3.9 Procedure
Procedure is almost similarly to a “function” in other programming languages in common, in
SQL this “function” is written by query script. A procedure is executable script that is
associated in general with processing data in the database. Procedure can be defined as a set
of logical statements which are grouped to perform a specific task [7].
3.10 ODBC
Open database connectivity is a standard database access method for accessing the database
from a client, which was developed since 1992. “The goal of ODBC is to make it possible to
access any data from any application, regardless of which database management system is
handling the data” [8]. Databases from different vendors like; Microsoft Access, Sybase,
MySQL, Microsoft SQL Server can communicated with each other by using this standard.
Additionally, application of different programming languages such as; LabVIEW, C#, Java
and so on can communicate to the database servers through this standard.
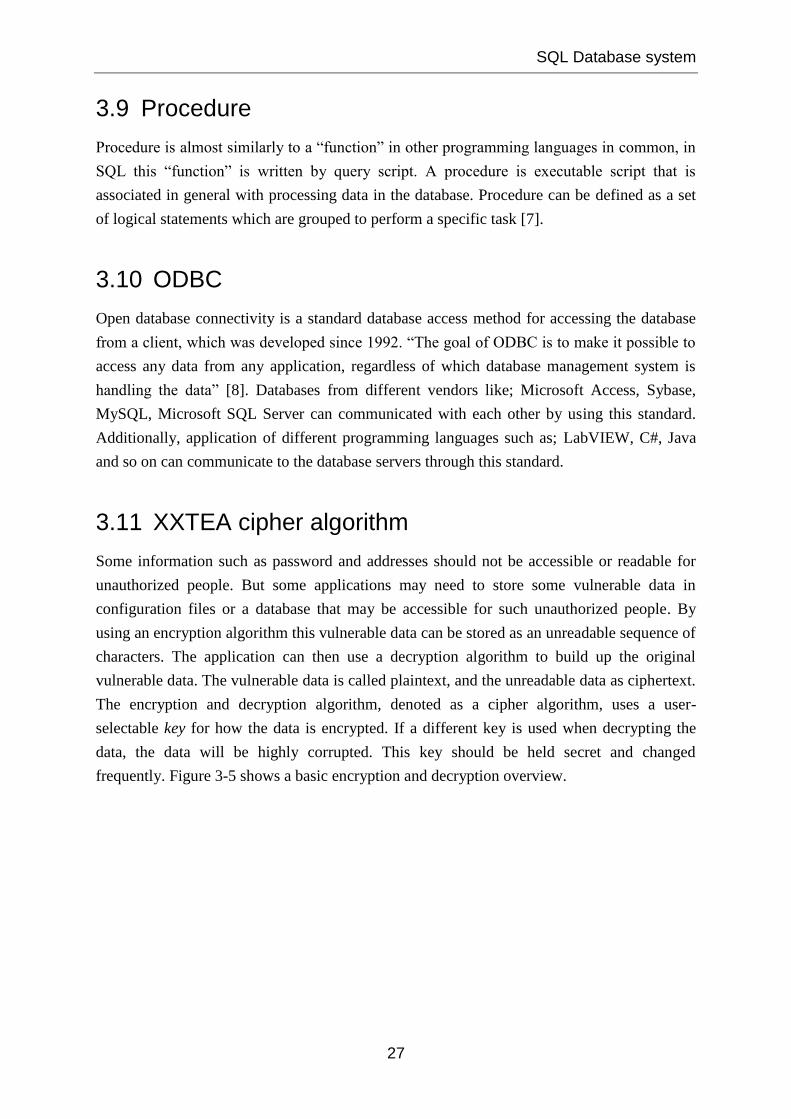
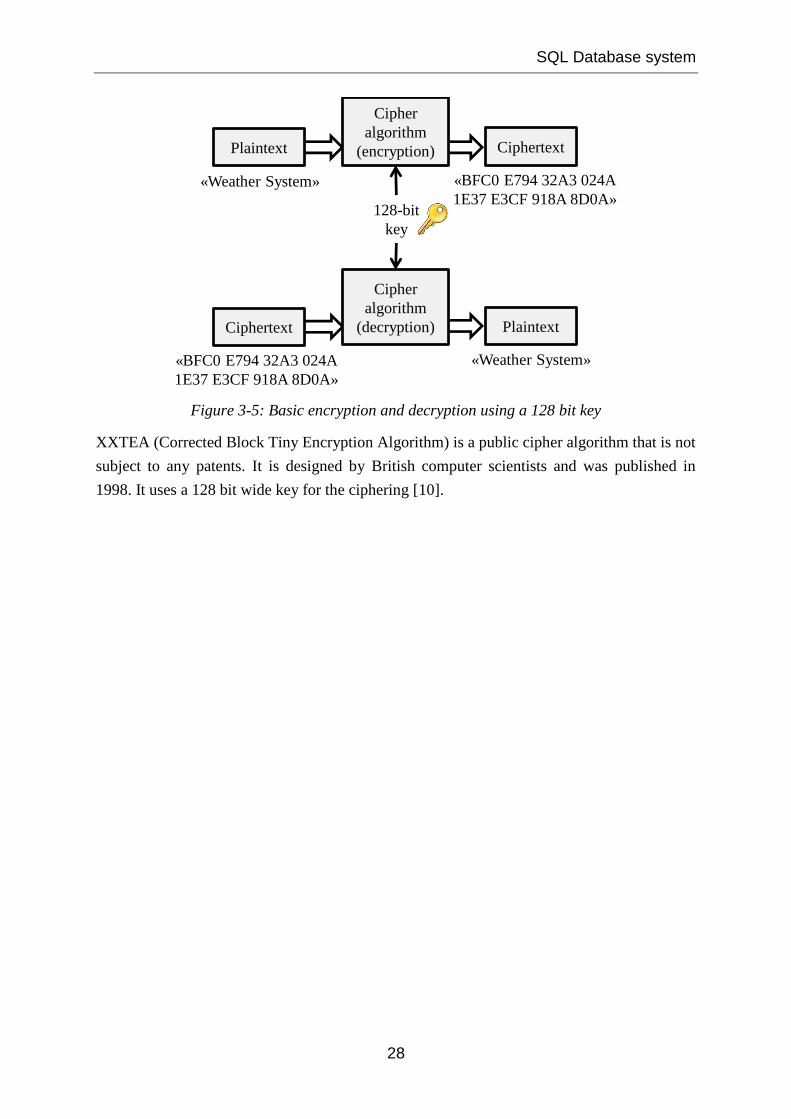
3.11 XXTEA cipher algorithm
Some information such as password and addresses should not be accessible or readable for
unauthorized people. But some applications may need to store some vulnerable data in
configuration files or a database that may be accessible for such unauthorized people. By
using an encryption algorithm this vulnerable data can be stored as an unreadable sequence of
characters. The application can then use a decryption algorithm to build up the original
vulnerable data. The vulnerable data is called plaintext, and the unreadable data as ciphertext.
The encryption and decryption algorithm, denoted as a cipher algorithm, uses a user-
selectable key for how the data is encrypted. If a different key is used when decrypting the
data, the data will be highly corrupted. This key should be held secret and changed
frequently. Figure 3-5 shows a basic encryption and decryption overview.
SQL Database system
28
Ciphertext
Cipher
algorithm
(decryption) Plaintext
128-bit
key
«BFC0 E794 32A3 024A
1E37 E3CF 918A 8D0A»
Plaintext
Cipher
algorithm
(encryption) Ciphertext
«Weather System» «BFC0 E794 32A3 024A
1E37 E3CF 918A 8D0A»
«Weather System»
Figure 3-5: Basic encryption and decryption using a 128 bit key
XXTEA (Corrected Block Tiny Encryption Algorithm) is a public cipher algorithm that is not
subject to any patents. It is designed by British computer scientists and was published in
1998. It uses a 128 bit wide key for the ciphering [10].
Modbus protocol
29
4 Modbus protocol
Modbus is a simple and robust protocol for data exchange. It was originally published by
Modicon in 1979 for use with their PLCs, but because of its versatility it soon became an
industrial standard for automation devices to communicate. Today the structure of Modbus
still continues to grow. [11]
Modbus is based on a request/response method with one server and one or more clients. In
Modbus terminology, it’s easy to incorrectly call the server as the transaction master. The
server is indeed a master, but it’s the master of the data, not the transaction. When sending a
request, the client will become the master of the transaction and the communication medium.
The solution is anyway simple, the modbus server is the master for data, but the clients are
the master of communication. Modbus communication is most commonly carried out on port
number 502.
The subchapters below should be read consecutively for best understanding.
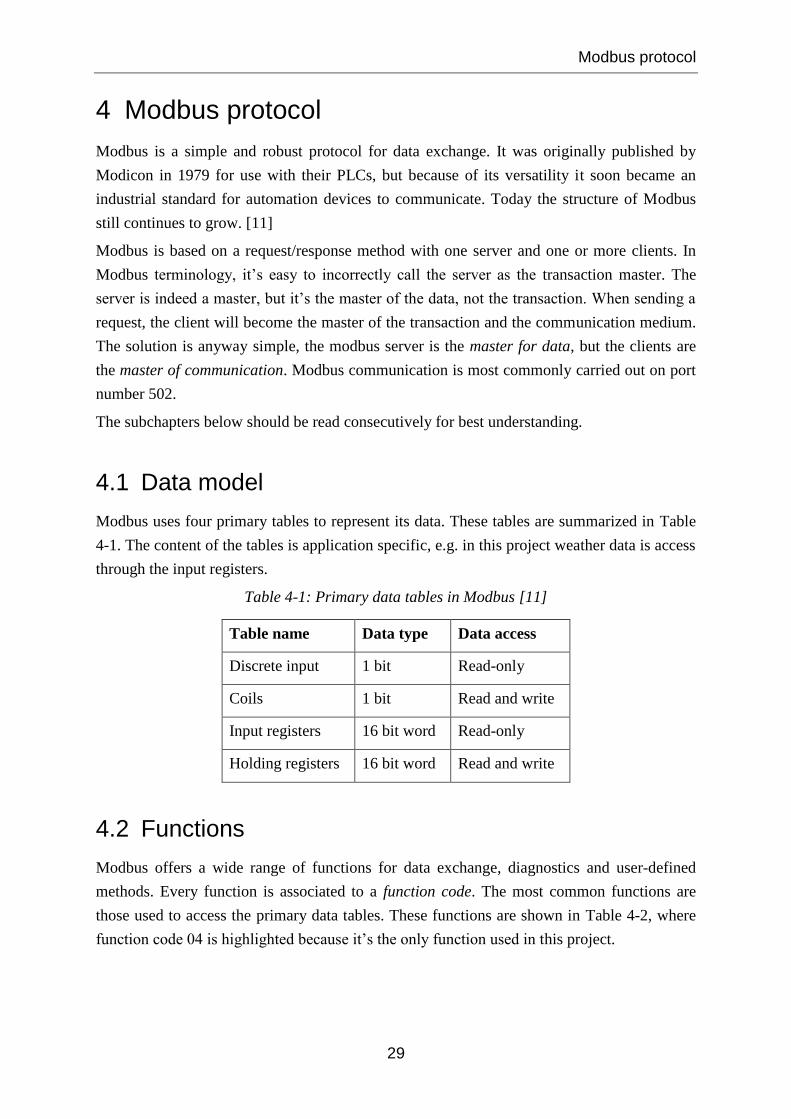
4.1 Data model
Modbus uses four primary tables to represent its data. These tables are summarized in Table
4-1. The content of the tables is application specific, e.g. in this project weather data is access
through the input registers.
Table 4-1: Primary data tables in Modbus [11]
Table name Data type Data access
Discrete input 1 bit Read-only
Coils 1 bit Read and write
Input registers 16 bit word Read-only
Holding registers 16 bit word Read and write
4.2 Functions
Modbus offers a wide range of functions for data exchange, diagnostics and user-defined
methods. Every function is associated to a function code. The most common functions are
those used to access the primary data tables. These functions are shown in Table 4-2, where
function code 04 is highlighted because it’s the only function used in this project.

Modbus protocol
30
Table 4-2: The most common Modbus functions [11]
Function code no. Function name
01 Read coils
02 Read discrete inputs
03 Read holding registers
04 Read input register
05 Write single coils
06 Write single register
4.3 Transaction
A Modbus transaction is started when a client is sending a request to the Modbus server. In
the base Modbus layer this request is called a Protocol Data Unit (PDU). But for underlying
communication layers, as Modbus TCP/IP, some additional information can be added in top
of the PDU, and some error check can be added to the end of the message. The whole request
is then called an Application Data Unit (ADU), consisting of the PDU, additional
information, and the error check [11]. Figure 4-1 shows this structure.
Additional
informatinPDU
ADU
Error check
Figure 4-1: ADU and PDU explained
The received request on the server is called an indication. The server will then process the
indication and send a response back to the client. The received response on the client is called
a confirmation. This is easier explained in Figure 4-2. Note that this is just a simple overview
of a Modbus transaction. The full Modbus transaction state diagram includes exception
handling, and therefore is more complex. The full Modbus transaction state diagram can be
found in Modbus Application Protocol Specification [11].
Modbus
client
Modbus
server
Request Indication
ResponseConfirmation
Figure 4-2: A Modbus transaction
Modbus protocol
31
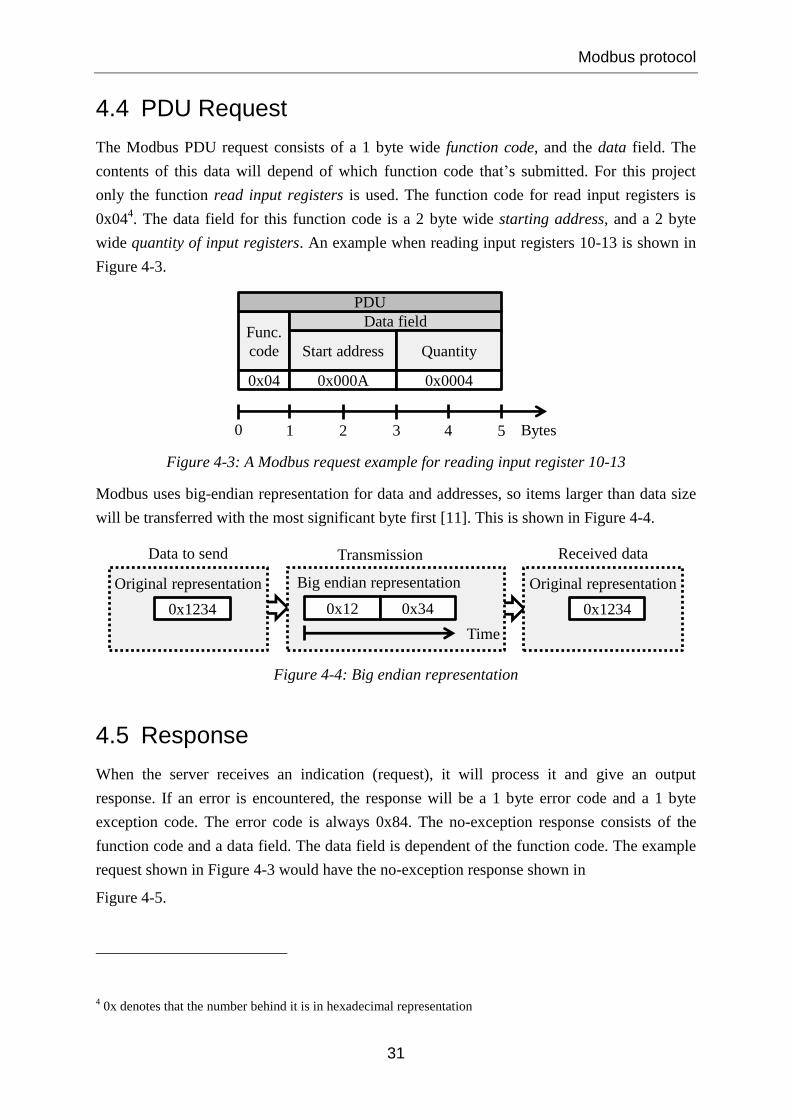
4.4 PDU Request
The Modbus PDU request consists of a 1 byte wide function code, and the data field. The
contents of this data will depend of which function code that’s submitted. For this project
only the function read input registers is used. The function code for read input registers is
0x044. The data field for this function code is a 2 byte wide starting address, and a 2 byte
wide quantity of input registers. An example when reading input registers 10-13 is shown in
Figure 4-3.
Func.
code Start address
Bytes10 2 43 5
Data field
0x04 0x000A
Quantity
0x0004
PDU
Figure 4-3: A Modbus request example for reading input register 10-13
Modbus uses big-endian representation for data and addresses, so items larger than data size
will be transferred with the most significant byte first [11]. This is shown in Figure 4-4.
0x1234
Time
0x12 0x34
Original representation Big endian representation
Data to send Transmission
0x1234
Original representation
Received data
Figure 4-4: Big endian representation
4.5 Response
When the server receives an indication (request), it will process it and give an output
response. If an error is encountered, the response will be a 1 byte error code and a 1 byte
exception code. The error code is always 0x84. The no-exception response consists of the
function code and a data field. The data field is dependent of the function code. The example
request shown in Figure 4-3 would have the no-exception response shown in
Figure 4-5.
4 0x denotes that the number behind it is in hexadecimal representation

Modbus protocol
32
Func.
codeByte
count
Bytes
10 2 43 5
Data field
0x04 0xF37B 0x302C
Input registers
6 7 8 9
0x77D30x08
10
0x302C
PDU
Figure 4-5: A Modbus response example for reading input registers 10-13
4.6 Modbus TCP/IP specification
As mentioned in subchapter 4.3, underlying communication layers can add some extra
information on top of the PDU. For Modbus TCP/IP, this extra information is a MBAP
header. See Figure 4-6 for how the MBAP header is constructed. The MBAP header is total 7
bytes long and consists of a 2 byte wide transaction identifier, a 2 byte wide protocol
identifier, 2 bytes consisting of the number of remaining request bytes (length), and a 1 byte
wide unit identifier which is basically the Modbus slave address (Modbus server). The
protocol identifier will always be 0x00, because that’s Modbus protocol identifier.[12]
Transaction
Identifier
Protocol
Identifier
Bytes10 2 43 5
0x0000 0x0000 0x01
Length
6 7
0x0001
MBAP header
Unit
Ident.
Figure 4-6: Fields of the MBAP header
The full ADU request for Modbus TCP/IP protocol will then be as in
Figure 4-7. Notice the length field of the MBAP header for this case is 6, because there is 6
bytes remaining in the request.
Transaction
Identifier
Protocol
Identifier
0x0001 0x0000 0x01
Length
0x0006
MBAP header
Unit
Ident.
Func.
codeStart address
0x04 0x000A
Quantity
0x0004
PDU
ADU
Bytes
10 2 43 5 6 7 8 9 10 11 12
Figure 4-7: The full ADU request for Modbus TCP/IP

Modbus protocol
33
4.7 Modbus and the Microserver
The Microserver can be configured to store all weather data into Modbus input registers
every third second. The weather parameters data format is a 32 bit single floating point
number for the value and a 32-bit timestamp. The timestamp is using the POSIX time format,
which is represented as seconds elapsed since 01.01.1970 00:00:00. POSIX is also known as
Unix time [13]. Since the input registers is 16 bit wide a 32 bit data value is stored in two
input registers. It is also stored in Low endian format, so 16 bit words must be swapped
before flattened to floating point number or timestamp. Table 4-3 shows a few of the total 68
different weather parameters than can be downloaded from the Microserver over Modbus
[14].
Table 4-3: Some Modbus measurements parameters from the Microserver.
Measurement Description Input
register
Address
Data type
(Low
endian)
umtWindSpeed Wind speed 5-6 float
Wind speed timestamp 7-8 POSIX time
umtRelHumidity Relative humidity 17-18 float
Relative humidity
timestamp
19-20 POSIX time
umtTemp1 Air temperature 37-38 float
Air temperature timestamp 39-40 POSIX time

Scaling
34
5 Scaling
The received weather data from the Microserver over Modbus has US standardized units, i.e.
not expressed in terms of the SI standardization. Such units are degrees Fahrenheit [°F] for
temperature, Inch Mercury [inHg] for pressure, etc. it is not possible to perform scaling in the
Microserver’s configuration. The scaling will instead be done by the Modbus service that will
be introduced in chapter 11 and documented in Appendix C, and by the OPC server in
subchapter 15.1.2.
The weather data is scaled using the linear relationship in equation (5-1) and the relationship
shown in Table 5-1.
(5-1)
where
a – Gain
b – Offset
x – Original value
y – New value with new units
Table 5-1: Unit conversions
From To Gain Offset
degrees Fahreneit [°F] degrees Celcius [°C] 0.555555 -17.7777
inch mercury [inHg] hectoPascal [hPa] 33.86 0
miles per hour [mph] meter per second [m/s] 0.448 0
foot [ft] meter [m] 0.3048 0
inch [in] millimeter [mm] 25.4 0
hits per square inch [hits/in²] hits per square meter [hits/m²] 1550 0
pounds per cubic feet [lb/ft³] kilogram per cubic meter [kg/m³] 16.02 0
miles kilometer [km] 1.609 0

API
35
6 API
An important task of the weather station project was to make external access to the system,
therefore an Application programming interface (API) was needed. This sub chapter explains
shortly what an API is and the different programming languages used in creating APIs for the
project.
6.1 API overview
An application programming interface is a collection of functions that allow other programs
to access a system [15]. The functions acts as keys of operations, and depending on the
function used the API can perform various operations, and return various data from the
system. The operations performed by the API can be operations that other programs may not
be able to or are not permitted to do on the system. APIs allows programmers to use the
available functions as building blocks of their own software programs.
Almost all the applications today relies on API’s from underlying systems, and the purpose of
APIs is to provide an interface for communication while hiding system details[15]. This way
the owner of the system can control the access while the users need only to know how to use
the different functions and what they return without worrying about the complexity of the
code inside the functions.
To support a wide range of users a system can have multiple APIs supporting different
programming languages as illustrated in Figure 6-1. Some systems may also have web
services that allow users to access the same functions over internet.
Figure 6-1: API's for the weather system
API
36
6.2 C#
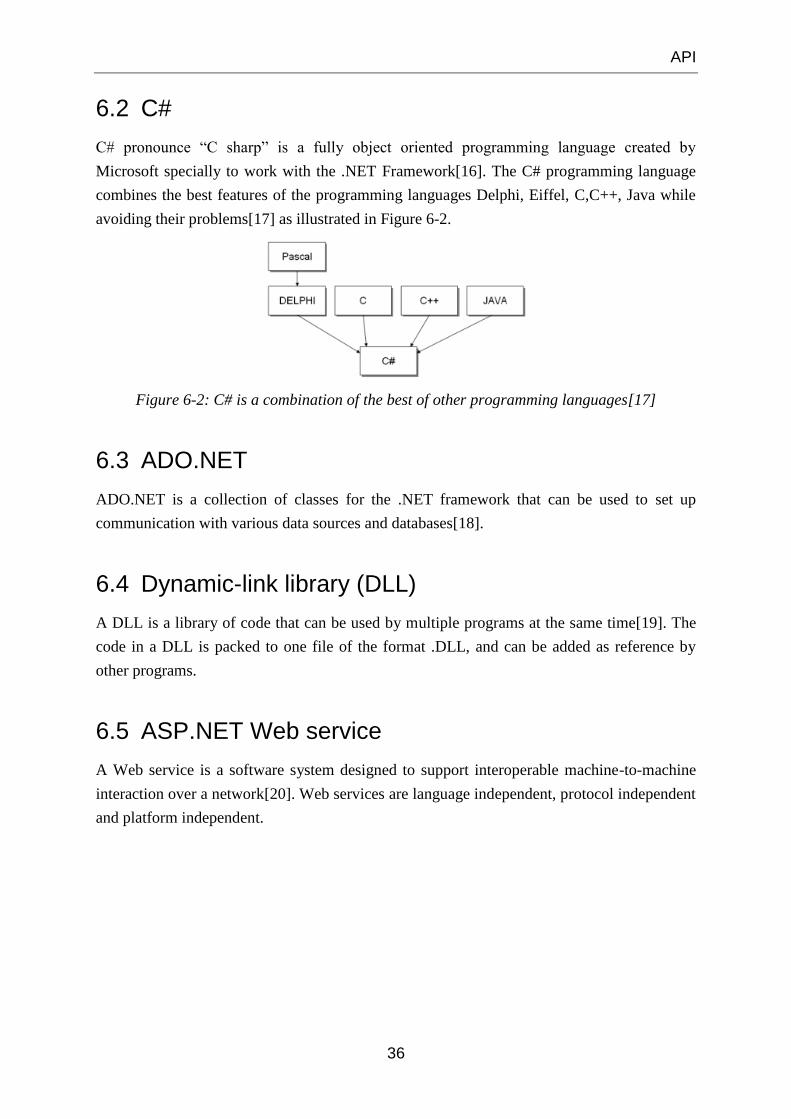
C# pronounce “C sharp” is a fully object oriented programming language created by
Microsoft specially to work with the .NET Framework[16]. The C# programming language
combines the best features of the programming languages Delphi, Eiffel, C,C++, Java while
avoiding their problems[17] as illustrated in Figure 6-2.
Figure 6-2: C# is a combination of the best of other programming languages[17]
6.3 ADO.NET
ADO.NET is a collection of classes for the .NET framework that can be used to set up
communication with various data sources and databases[18].
6.4 Dynamic-link library (DLL)
A DLL is a library of code that can be used by multiple programs at the same time[19]. The
code in a DLL is packed to one file of the format .DLL, and can be added as reference by
other programs.
6.5 ASP.NET Web service
A Web service is a software system designed to support interoperable machine-to-machine
interaction over a network[20]. Web services are language independent, protocol independent
and platform independent.
Tablet
37
7 Tablet
A Tablet is a mobile computer that can be compared with Smart Phones but larger in size
[21]. The users can operate and navigate on their Tablet Computer through a touch screen.
Today there are several vendors that produce Tablets and some of these are using their own
developed Operating Systems. Apple Inc. especially, has received a lot of publicity for their
developed Tablet called iPad. The iPad uses Apples’ own designed Operating System
specially made for Smart Phones and Tablets called iOS. Another Operating System used by
many Tablet vendors is Google's Linux-based Android Operating System. Many Tablet
vendor offers Smart Phones and Tablet versions with Android, Windows or custom
Operating Systems.
Tablets offer a large range of possibilities for usage in everyday life. They can be used as a
camera, for surfing the world wide web, reading books and also for presentations and
educational purposes, the limitations on this device is actually set by the user. Tablets and
Smart Phones have opened a huge market for developing applications that can be used for all
kinds of purposes in everyday life. These applications can be created and published by
everyone but there are some restrictions and regulations that developers need to follow
depending on what kind of Operating System these applications will be running on.
7.1 Developing App5 for Android Operating Systems
The Requirements for creating an Android App are as follows:
1. For new Developers download ADT Bundle at
http://developer.android.com/sdk/index.html if already running Eclipse IDE
download ADT plug-in for Eclipse. Other IDE can also be used then follow a
customize installation for ADT
2. Eclipse IDE or other IDE's is needed
3. Download the Latest SDK tools using SDK Manager
Android SDK provides:
Build Applications
Test Applications
Debug Applications
UI Applications
Android Support Programming language:
5 App is an abbreviation for Application
Tablet
38
Java
Application Distribution:
Google Play
The Android Software Development Kit (SDK) is an essential tool that needs to be
downloaded in order to be able to create an app for Android[22]. The SDK provides software
tools for creation of a software application, in this case an Android application. The Android
SDK and the software development program, Eclipse IDE can be downloaded on developer
website for Android. Eclipse is an Integrated development environment and a multi-language
program [23]. Eclipse is written mostly in Java but the use of plug-ins other programming
languages are also supported. Applications for Android are primarily written in Java,
when this is downloaded as required, development tool users can start creating their own
Android Project. The Android SDK provides the possibilities of opening a new project and
all the files that contains the source codes can be stored in the project using the project
directories. The project can either be developed in Android SDK or using Eclipse with the
ADT plug-ins.
Creating a new project entails following some standard procedures like naming the project
and creating the default files that will allow developers to begin building the application.
When the application is created and ready, it can be run either on a real device or in an
emulator. To run the app on an emulator a virtual Android device needs to be set up.
Within the source code for the application, a User Interface (UI) needs to be created. Android
SDK and Eclipse has both layouts that can be edited and used for creating graphical layouts.
This involves buttons, displaying of messages and more. Custom layouts can also be created
by developers. Using XML gives more possibilities for adjustment to different screen sizes
for example applications for Tablets or mobile phones. The developer website for Android
OS provides new developers of Android app with various guidelines, hints and help for
getting started with the basic methods.
The web site guides through which important tools that needs to be downloaded as well as an
explanation to the different tools. A step by-step guide in creating the first app is found at the
web site. Android also have their own developer community where discussions can be made
in the forum and share experiences with other developers. Different groups have been created
within the community so developers can join the groups where they have most interest in.
7.2 Developing App for iOS
The Requirements for creating a iOS App is:
1. A Mac Computer

Tablet
39
2. An Apple ID
3. Download iOS SDK "Xcode" at https://developer.apple.com/xcode/
The Xcode provides:
Integrated Development Environment
Instruments Analysis tool
iOS Simulator
LLVM Compiler
UI Builder
Downloading the latest version of Xcode gives the latest SDK's for iOS and Mac OS
Xcode Supports Programming languages:
C
C++
Objective C
Application Distribution:
App Store
The iOS Software Development (SDK) is the essential tool that needs to be downloaded to
be able to create a iOS application. The SDK is available in Mac App store for free. The SDK
called Xcode is a powerful tool that offers a development environment for creating apps for
iPhone, Mac and Ipad. With Xcode developers can integrate code editing and build their own
user interface. With the user interface builder in Xcode, developers can test and debug their
design in the same window. With all these development tools inside, Xcode gives a fully
Integrated Development Environment (IDE) with creating source code, debug and designing
in same window. Error codes within the source code will be alerted at once and the coding
mistake will be displayed in more details. The IDE is holding the developer focused at all
time with all the buttons that are needed for running the code and upload code to test devices
displayed clearly. When the application created is finished it can be signed, archived and
easily be submitted directly to the App store using the developer web portal. Applications
can be distributed on App store but not for free. However, there are some exceptions, if the
developer is a member of a higher education institution and an undergraduate who is
developing an application for educational purposes, then it is free. If the applications
published on App Store are charged for free Apple will not demand any return of the cost. If
the developer has picked a price for the application Apple will demand 30% of the total price.
For private developers and developers that create applications for usage within a company
they need to pay an annual fee for using App Store as a tunnel for reaching out to customers
or their employee.

Tablet
40
The latest version of Xcode gives the developers a feeling that they have a wing man when
creating the application[24]. The latest version presents a new generation compiler
technology that don't only alert and indicate when a mistake is done in the source code, but it
also comes with suggestions for correction the error and trying to find better solution when
creating the code[24]. This compiler supports both C, Objective C and C++.
Apple has its own iOS development center on the internet; this address can be very useful for
developers who are new in creating application for iOS. In the Development Center, all kinds
of resources like videos and documentation are available. Guides for creating a first
application is available as well as sample codes. Not only help for the IDE can be found but
also help with computer language like Objective C. Documentation on building code using
classes, methods and string are documented and an own iOS developer Library can be found.
7.3 Developing App for Windows
The Requirements for creating a Windows App is:
1. Download Windows SDK 8.0 for phones at http://dev.windowsphone.com/en-
us/downloadsdk , this refers to the latest version. For Tablets and Desktop apps there
an own supported SDK 8.0 that can be downloaded at http://msdn.microsoft.com/en-
us/windows/desktop/hh852363.aspx
2. 64 bit Windows 8 - Pro or higher
Windows SDK provides:
Microsoft Visual Studio Express 2012 for Windows Phone
Project templates for creating new Windows Phone Apps
Windows phone 8 Emulator for testing and more
Windows support programming languages:
C#
Application Distribution:
Windows Phone Store
The SDK 8.0 is the latest version of SDK for Windows phones, Tablet and Desktop apps.
This also means that the SDK 8.0 is only for Windows 8 operative system. Below it has been
focused on the developer tools for Windows Phones. Developing apps for Desktop and
Tablets that are running on Windows 8.0 also needs SDK 8.0 but has other supported
developer tools. It is important to understand that applications for Tablets and Desktops can
be found at Windows Store app but applications for Windows phones have a own Windows
Phone Store.

Tablet
41
An application for Windows phone 8 can't be created in Windows 7, Windows Server 2008
or on Windows Server 2012.
With SDK 8.0 comes a completely development environment called Visual Studio Express
2012. All design and coding can be done in Visual Studio Express 2012. Visual Studio
Express 2012 contains all the services that are needed to create a application. The
development environment for Windows phones includes code editor that are used for
building the source code, a Windows based Visual designer and a Toolbox that contains
Windows Phone Controls [25].
Running and debugging the app can be done using the Windows Phone Emulator. The
Windows Phone 8 Emulator is included in the SDK. Running and debugging the application
can also be done on a real Windows phone, but this requires that you have a Windows-
enabled phone available and that it is registered. For testing and validating, integrated tools
inside Visual Studio can be used. For validating the behavior of the app for real world
conditions simulations dashboard for Windows phone can be used. The quality and
performance can be tested and validated using Window phone application analysis. Before
finally deploying the app onto the Windows Phones Store, use the Windows Phone Store Test
kit. Through the Store Test Kit the developer can get feedback if the app is accepted or not
for the store.
On Windows Phone Developer web site, Windows has provided tutorials and guidelines for
developers. Sample codes and basic steps for how to create the first app can be found in the
developer center web site information. Windows do also have their own developer
community where discussions can be made in the forum and share experiences with other
developers.
7.4 Tablet Weather Presentation
The main idea with the Tablet application is presenting the weather data from the Telemark
University's own weather station. The latest measurements for the most common weather
parameters is preferable for presenting on the Tablet as well as some statistics on weather
data is presented on a graph. The Design of the weather presentation on the application shall
be informative and easy to read. It is important that the User interface for the application is
more or less in consistency with the Web site layout created for this weather station project.
This gives a good overall impression of the whole project and showing that all the different
parts and tasks included in the project is presented as one complete system.

Tablet
42
7.4.1 Dashboard for LabVIEW
National Instruments is the developer behind the system design platform LabVIEW.
LabVIEW is short for Laboratory Virtual Instrumentation Engineering Workbench.
LabVIEW uses a programming language named G and are used for data acquisition,
instrument control and industrial automation on a variety of platforms like Windows and
Mac OS X[26]. For this Weather Stations project LabVIEW has been used for creating
applications that can be used for reading weather data coming from Telemark University
College. In 2011 National Instrument released Data Dashboard for LabVIEW. The Data
Dashboard is an application that can be downloaded for Tablets and Smart Phones and
supports operating systems like Android and iOS. The main idea behind the Dashboard is to
communicate with applications developed in LabVIEW. The Data Dashboard provides the
possibilities to view live measurement data coming from LabVIEW applications. The Data
Dashboard also let users control their LabVIEW application through controls and indicators.
Indicators and controls from the LabVIEW application can easily be recognized and found in
the Dashboard through Shared Variables or Web Services. The Data Dashboard for
LabVIEW are available and can be downloaded for iPad and iPhone in App Store. For
Android phone and tablet download the application at Google Play or Amazon App Store.
7.4.2 Web Services in LabVIEW
Web Services is a method for communication between electronic devices[27]. Web Service
provides the possibilities to invoke methods that are located on a remote target by using
standard Web-based protocols. Clients can send requests to a remote server and the remote
server processes the request and responds. The response is then displayed on the client side.
For Web Service there are a few bullets that describes the components that involves in a Web
Service
Server - An application is needed to be created that is responsible for receive request
from clients and respond to the clients
Client - Requests and displaying the response will be shown done and shown on the
client side
Protocols - HTTP is the standard Web based protocol that are used for routing data
over the network.
Network - A physical layer is needed for transmitting data.
In this Weather Station project a Web Services application will be created in LabVIEW so
that Tablet and Smart Phones can get the latest measurement through the National Instrument
own developed data dashboard application. In the data dashboard there are two possibilities
for communication with the LabVIEW application. The first is through Shared Variables and
the other one is through Web Services. The advantage of using Shared Variables is that it

Tablet
43
gives the possibilities to share data between single loops, VIs on a host computer and across
the network. Sharing weather data on the Telemark University College local network
Eduroam for those who have Tablet and Smart Phones requires that the networks ports for
Shared Variables are open, so that user can get access to data sent over the network. The
disadvantage of using Shared Variables is that the data can only be accessed on a local
network and not onto the world wide web. The thought behind the Tablet and Smart Phone
application was that the weather data should be available for everyone, and not only those
who study or work at the college. Therefore it was decided to go for the optional Web
Service. With Web Services the weather data will be available for everyone on the world
wide web. In LabVIEW there are possibilities to create and deploy VIs as a Web Services.
This means that an application in LabVIEW can be made for reading the latest measurements
from the WEATHERSYSTEM database that is created for storing weather data. From that VI
the weather data can be published.
7.4.3 Architecting Web Services in LabVIEW
To provide a Web based interface for the LabVIEW application that reads weather
measurements, Web Services are needed. If there are variables from different VIs that are
preferable to publish , Shared Variables can be an advantage to use since they gives the
opportunity to communicate between different VIs. A smart thing to do is to gather all the
variables that are preferable and publish them in one common VI. In that way the different
tasks can be separated and it gives a more orderly overall impression of what responsibility
the different VIs have. In this way a Web Service can communicate between different VIs by
using shared Variables.
Figure 7-1 illustrates how the Web Services work in LabVIEW. The LabVIEW Application
will be used as a method on the Server side. The requests and response will happen on the
client side.
Figure 7-1: Webservice and LabVIEW [27]
When using the Request/Response model for the Web Service this refers to a HTTP method
for Web Services. When using Web Services in LabVIEW, a RESTful6 Web Services needs
6 An adjective coined from Representational State Transfer

Tablet
44
to be created. A RESTful Web Service defines its own architecture principles on how to
address and focus on a Web Service. RESTful uses the HTTP methods explicitly and the
HTTP method
GET
POST
DELETE
PUT
Can be defined inside a Build Specification that needs to be created for setting up the whole
Web Service architecture in LabVIEW. The main point for the Web Services is that the Data
Dashboard can read the latest measurements, so the Web Services needs to be called or
polled. The HTTP method GET support the request/respond model and are therefore the right
one for this services.
Figure 7-2 shows the Request/Response model where the Data Dashboard will request the
Web Services for new weather data and the Web Service will respond updating with the latest
measurements.
Client
Web Browser
LabVIEW
Web Service
Request
Response
Figure 7-2: The Request/Response model
The Web Services contains a set of protocol layers used to communicate from the client side
to the Web Services. From the client side it starts with the Data Dashboard that will be the
interface between the client and the Web Services. If not using the Data Dashboard, a Web
browser will be the interface. On the client side the RESTful architectural state principles are
used for reaching the different variables through the HTTP. The TCP protocol will handle the
transmission of the message and the IP protocol is needed to be routed to the right server
where the VI used as a Web Method are located. An overview of the standard protocols that
are used from the clients side to the server side is shown in Figure 7-3.

Tablet
45
Figure 7-3: Standard protocols that are used from the clients side to the server side [27]

TV- and Website
46
8 TV- and Website
The website was built using Microsoft Visual Studio using ASP.NET framework ASP.NET
is a Web Application development framework; it can be used to create web services, websites
and web application. It allows the programmer to write codes in any .NET languages like C#
or Visual Basic, both available in Visual Studio provided by Microsoft [28]. In ASP.NET
each page is called a Web form with both HTML side and a code side. The HTML side
contains the static mark-up and the server side web components, whereas the code side
defines the dynamic components of the web page or application. In certain cases dynamic
codes can be placed inside the HTML side using JavaScript using <script> </script> tags [29]
Microsoft from ASP.NET Framework 2.0 started the code behind model. The current version
of the framework is 4.5, which is built in Microsoft Visual Studio 2012. ASP.NET pages
have extension as “.aspx” while the code behind has an extension “.aspx.cs” for C# code and
“.aspx.vb” for Visual Basic [28]
The charts in the Website were created using Google’s Visualization API (GoogleAPI, 2012).
This API provides an easy way to plot data and visualize it in a better way than the default
available Chart controls in Visual Studio. The Visualization API contains control to create
line charts, pie charts, tables etc. All these control are exposed as JavaScript libraries. These
charts can be populated with data using some client or server side controls as done in this
project. All the components in the chart control is customizable and it is rendered in the
website using HTML5 so that it is portable on all browsers, old and new and even on tablets
and smart phones. The data sources for these charts are JavaScript data tables. In order to
convert the C# ‘s normal data table [30] to JavaScript data table [31], a third party library
called Bortosky Google Visualization Library[32]is used. This library contains a method to
convert the normal data table to JavaScript data table so that it can be used in the
Visualization API to create the chart.
The Website gets all data from the SQL server using a library built as a part of API task of
this project. It is named Weather Library. This library is built in C#. Upon importing the
dynamic linked library of the Weather Library to the Website all methods and attributes in
that library can be accessed from the website. Thus all data can be accessed for presentation
in the Website.
The IIS or Internet Information Services is a webserver application available in Microsoft
Windows. It helps to deploy websites from Windows OS [33].The current version of IIS is
8.It supports HTTP, HTTPS, FTP, FTPS, SMTP, NNTP etc. It can be downloaded from
http://www.iis.NET/downloads. This is an easy way to publish websites on the server from
Visual Studio using the IIS. It can be turned on from the Administrative Tools in Control
Panel. All settings of IIS can be adjusted in IIS Manager.
In this project the system is modeled using the Three Tier Architecture [34].
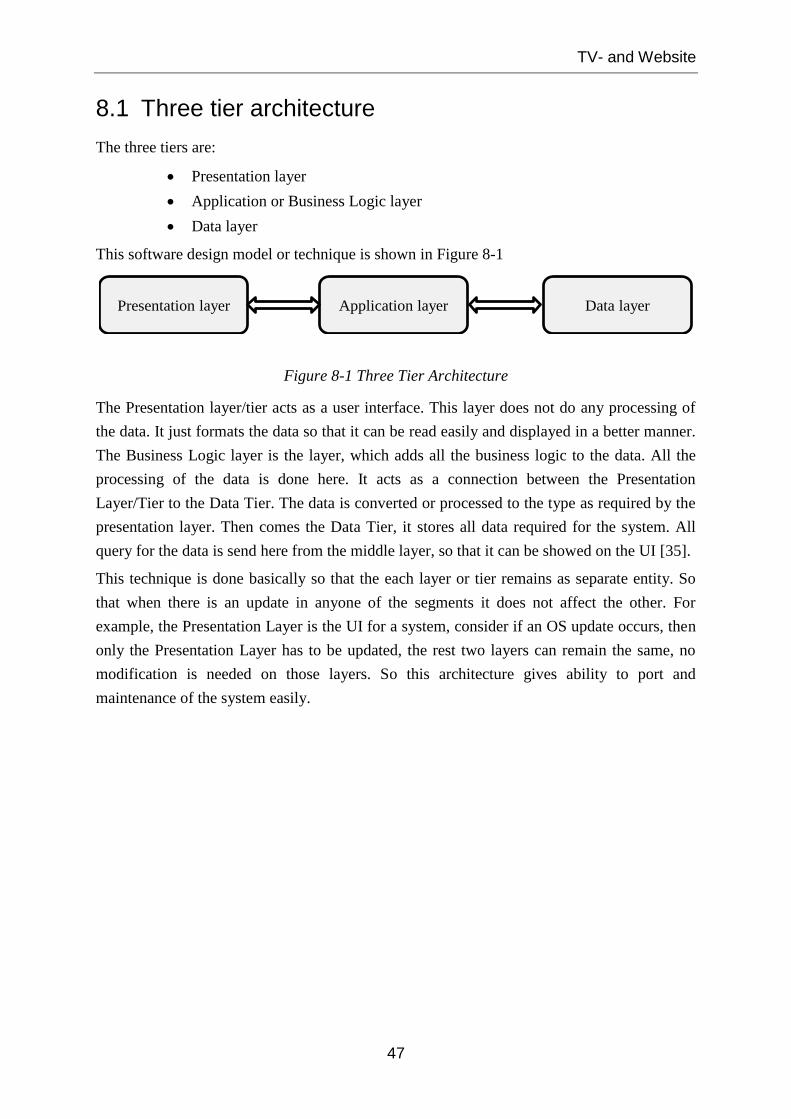
TV- and Website
47
8.1 Three tier architecture
The three tiers are:
Presentation layer
Application or Business Logic layer
Data layer
This software design model or technique is shown in Figure 8-1
Presentation layer Application layer Data layer
Figure 8-1 Three Tier Architecture
The Presentation layer/tier acts as a user interface. This layer does not do any processing of
the data. It just formats the data so that it can be read easily and displayed in a better manner.
The Business Logic layer is the layer, which adds all the business logic to the data. All the
processing of the data is done here. It acts as a connection between the Presentation
Layer/Tier to the Data Tier. The data is converted or processed to the type as required by the
presentation layer. Then comes the Data Tier, it stores all data required for the system. All
query for the data is send here from the middle layer, so that it can be showed on the UI [35].
This technique is done basically so that the each layer or tier remains as separate entity. So
that when there is an update in anyone of the segments it does not affect the other. For
example, the Presentation Layer is the UI for a system, consider if an OS update occurs, then
only the Presentation Layer has to be updated, the rest two layers can remain the same, no
modification is needed on those layers. So this architecture gives ability to port and
maintenance of the system easily.

OPC
48
9 OPC
In today’s world of technology, the acronym OPC has transformed and been renamed into
Open Platform Communication, this transformation has come to be, as a result of the various
stages of progressive evolvement that this communication protocol has undergone[36].
The advent of OPC dates back to 1994, it was born due to the need for interoperability and
connectivity between hardware from different vendors or manufacturers. Prior to the
availability of the OPC protocol, hardware manufacturers had to invent drivers for their
hardware communication products before end users can be able to effectively use the
hardware for instrumentation, process control systems and other industrial needs. This
resulted in a lot of dissatisfaction, as end users had to buy communication hardware based on
availability of drivers rather than suitability of purpose in many cases. A group of vendors
from various disciplines in the industrial segment formed a consortium and formed what is
known as the OPC foundation. The task of this consortium was to maintain standards for
open connectivity for automation systems and process control systems in general. The
consortium focused on building a basic OLE for Process Control specification. OLE (Object
Linking and Embedding) was developed by the Microsoft corporation for the windows
operating system hence when the first OPC standard was released after two years in 1996, it
was restricted to only Windows operating systems and at that time it was known as OLE for
process control (OPC). But today, the OPC protocol is readily available in other operating
systems is used for other purposes beyond process control.
An OPC server is simply a software application, the most widely used analogy in describing
an OPC Server is the role a printer driver plays in allowing applications installed on a
computer to be able to communicate with printer hardware. The OPC Sever acts as an
Application Programming Interface (API), it connects to devices like PLCs, DCS, RTU or
other data sources such as databases or user interface and then translates the data into a
standard based OPC format.[37]. Likewise an OPC Client is also a software application that
designed to communicate with an OPC Server. Both Sever and Client applications have user
interfaces that aid communication between them.
9.1 OPC Specifications
An OPC specification describes a software interface used in the exchange of information
between two or more software applications, OPC specifications are named and grouped based
on the type of information that can be exchanged on these interfaces. For instance, the
Alarms and Events specifications (OPC AE) are used for event detection and identifying
abnormal conditions in a system while the OPC Data access (OPC DA) specification are used
for processing and collecting real-time data.[38]
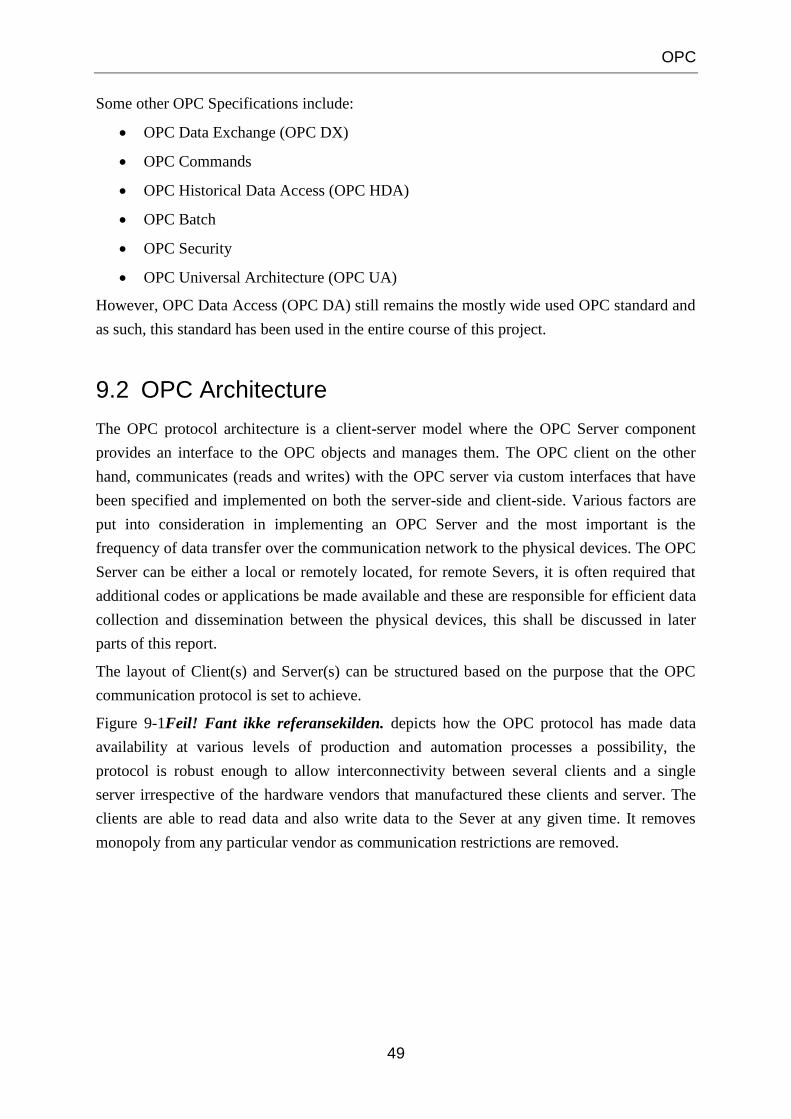
OPC
49
Some other OPC Specifications include:
OPC Data Exchange (OPC DX)
OPC Commands
OPC Historical Data Access (OPC HDA)
OPC Batch
OPC Security
OPC Universal Architecture (OPC UA)
However, OPC Data Access (OPC DA) still remains the mostly wide used OPC standard and
as such, this standard has been used in the entire course of this project.
9.2 OPC Architecture
The OPC protocol architecture is a client-server model where the OPC Server component
provides an interface to the OPC objects and manages them. The OPC client on the other
hand, communicates (reads and writes) with the OPC server via custom interfaces that have
been specified and implemented on both the server-side and client-side. Various factors are
put into consideration in implementing an OPC Server and the most important is the
frequency of data transfer over the communication network to the physical devices. The OPC
Server can be either a local or remotely located, for remote Severs, it is often required that
additional codes or applications be made available and these are responsible for efficient data
collection and dissemination between the physical devices, this shall be discussed in later
parts of this report.
The layout of Client(s) and Server(s) can be structured based on the purpose that the OPC
communication protocol is set to achieve.
Figure 9-1Feil! Fant ikke referansekilden. depicts how the OPC protocol has made data
availability at various levels of production and automation processes a possibility, the
protocol is robust enough to allow interconnectivity between several clients and a single
server irrespective of the hardware vendors that manufactured these clients and server. The
clients are able to read data and also write data to the Sever at any given time. It removes
monopoly from any particular vendor as communication restrictions are removed.

OPC
50
Figure 9-1: Several Clients connecting to a single server
In Figure 9-2Feil! Fant ikke referansekilden. it can be seen that there is no limitation to the
number of servers a particular client can communicate with and neither is there any
restriction a the number of clients a given server can host for the purpose of interconnectivity
and interoperability, the OPC protocol is a solution that is far reaching in making information
open in today’s world of technology.
Figure 9-2: Interconnectivity between multiple clients and multiple server vendors
OPC Clients OPC Server
OPC Clients
OPC Server
Vendor C
OPC Client #2
OPC Client #1
OPC Client #3
OPC Server
Vendor A
OPC Server
Vendor B

OPC
51
OPC Servers are software-based, built on the Microsoft’s OLE/COM technology. COM
stands for Component Object Model, a binary-interface standard for software componentry
introduced in 1993 by Microsoft used for enabling inter-process communication and dynamic
object creation in a large range of programming languages, it encompasses the OLE,
ActiveX, COM+ and DCOM technologies.[39] This technology allows for managing of
compound documents and transferring of data between different applications. Initially
designed for possibilities in editing documents and adding features from various applications,
the OLE/COM specification is extensible and has become useful for process control,
manufacturing and automation industries[40]. OPC protocol made availability of data at
different levels an easier task. However, there are challenges that come with using the OPC
protocol, most of which emanate from the DCOM technology.
9.3 The DCOM Challenge in OPC
When connections using the OPC protocol seem impossible or a user is unable to transfer
data between applications properly, the underlying issue is likely DCOM-related. DCOM
stands for Distributed Component Object Model, a proprietary technology for communication
among software components distributed across networked computers. It is an extension to
Microsoft’s COM technology[39]. The challenges associated with DCOM can be very
frustrating especially for new users trying to configure and use an OPC server for the first
time. There are five basic steps required to establish a reliable DOM communication and they
include:
a. Remove Windows Security: Windows, just like every other operating system comes
pre-installed with a firewall that prevents users from unauthorized access that may be
from people with malicious intents, worms or viruses, therefore removing Windows
security for a computer that is in a network can pose as a threat to the health and
safety of data that resides in this computer. However, in order to establish a reliable
OPC communication, it is recommended that the computer be removed from the
network at the time that Windows Security is removed. Turn off the firewall in order
to have the Security removed.
b. Setup mutual user Account recognition: After the Windows security is removed,
The next step required is to setup a mutual user account recognition as this will enable
both computers properly recognize user accounts, if secured access is required,
username and passwords can be set at this stage, it is possible to specify which
computers should be able to connect to the Server and restrict other not required to
connect to the OPC Server. For a local client (a client installed on the same computer
as the OPC Server) what is required at this stage is to locate the local security policies
under the windows administrative tools and in the Sharing and security model for

OPC
52
local accounts option, set it to ‘’Classic’’ this will authenticate the local users. For the
remote Clients
c. Configure System-wide DCOM settings: Prior to the OPC Unified Architecture
(OPC UA) specification, all specifications depended on Microsoft DCOM for data
transportation, it became mandatory that DCOM settings are configured properly both
for a specific OPC server and for a the default system-wide DCOM settings. The
system wide changes affect all windows applications including OPC applications and
since OPC Client applications do not have their own DCOM settings, they default
DCOM configuration affect the Clients. To configure the right settings, in the ‘Run’
window from the Windows start button, run DCOMCNFG to open the component
services window, check the ‘Enable Distributed COM on this computer’ menu option,
also set the ‘Default Authentication Level’ to Connect. This is the minimum
authentication level that should be considered. In the launch and edit Permissions
group, click ‘Edit Limits’ and add ‘Everyone’ to the list.
d. Configure Server specific DCOM settings: Run the DCOMCNFG from the window
start menu again and open the component services window, navigate inside the
console root folder to the component services folder, then to the computers folder,
select the properties option in the DCOM Config folder. In the identity tab, select
‘The system account (services only), with this setting the OPC server will take the
identity of the operating system, the system account is recognized by all the
computers on the workgroup or domain. Ensure that the OPC server is configured to
execute as a service before configuring this setting.
e. Restore Windows security: After the Client-server remote connection has been
communication established, the Windows firewall has to be turned on again in order
to save guard the health of the system, turning on the firewall will block all
unauthorized access from the network, however, exceptions need to be made by
specifying which applications are able to respond to requests that are unsolicited. A
good idea will be to specify that the firewall should allow or deny traffic on a specific
port for TCP or UDP traffic [41]

Telemark University College Faculty of Technology
Implementation and Results Part III:

SQL Database system
54
10 SQL Database system
The focus of this chapter is to give an overview of practical works that is conducted for the
project, which is mainly related to data being processed within Microsoft SQL server. The
works involved gathering problems specifications and goal of the project to create a correct
database design, create the weather system database, maintain the database and create
necessary views and procedures needed by external applications.
10.1 Database design
Before any database shall be created it has to be designed properly and the foremost step in
the designing phase is to list up all the necessary requirements that covers all the functions of
the intended database. The requirements are extracted from the problem description.
10.1.1 Problem specifications
The goal of the group project is to design and implement a weather system for acquisition of
weather data and weather forecast. A weather station by the name micro server, which
contains different sensors for measuring the current weather condition, is already mounted on
top of C-building at TUC. Base on this device the team has to establish the communication to
store and log the data captured by various sensors. These values are logged as historical data
by database server which runs round-the clock in the background. The database server has to
always be available so that different applications are able to use the service. Website,
different applications and prediction models are completely dependent on the data from the
server to publish the weather status at the moment and the predicted weather forecast in the
future.
10.1.2 Requirements
Based on the problem description from the data storing and processing point of view, a list of
requirements is set, the list contains criteria that the database has to meet up in able for the
whole system to work smoothly. Some of the requirements are as follows;
An operative system server is needed.
SQL server (to store data).
Store data from the micro server.
The data are logged as historical value.
Store forecast models.
Script/code to extract specific data from the server.
Different applications have to be able to pull out the data.

SQL Database system
55
10.1.3 Entity relationship diagram
Microsoft Visio is a diagramming program developed aiming for creating different kinds of
diagrams easily. This software program has an included template for creating Database
Model Diagrams.
Figure 10-1 shows the E/R diagram as design for the weather system database. The diagram
was created by Microsoft Visio 2010. There exist many other tools intended for the same
purpose, among those some of them are very advanced and better comparing to the using
tool. Microsoft Visio 2010 was chosen due to reason that it is freely available for students in
Telemark College University.
To fulfill all the requirements of the project and the database manage to handle all the tasks a
total number of eleven tables are required. The tables are introduced in Figure 10-1
with all the names and columns belonging to it and they are connected to each other
according to the relational model. In this specific type of model tables are linked together by
the primary keys and foreign keys.
The complete weather system database comprises totally of eleven tables and they are by the
names;
CONFIGURATION
USER_PASSWORD
USER_INFO
WEATHER_MODEL
DEVICE
MODEL_PARAMETER
WEATHER_PARAMETER
WEATHER_DATA
FORECAST_DATA
FORECAST
DEVICE_PARAMETER
It is not necessary to have table’s name written in capitals, but this is a good programming
habit used for making it easier to distinguish between tables and columns when the queries
are formed. This is extremely useful in the SQL programming process, by following such
system creating the SQL script will be much easier.
Each table contains only relevant data belonging to the same category. Grouping similar data
which belongs to a specific table is a convenient and structured way to make it easier to
locate and extract the needed information. Tables in the database are connected to each other
by Primary keys and foreign keys, which makes this a relational model. Arrows in the
diagram illustrates how the tables are correlated to each other.

SQL Database system
56
Almost all the tables in Figure 10-1 are linked to each other except for
“CONFIGURATION” table because this table is not dependent on data from other tables and
reverse. Basically tables are in connection with each other because the data in each table are
related but do not belong to the same category. A more detailed of ER diagram in
Figure 10-1 can be found in Appendix B.1.
CONFIGURATION
PK ConfigurationID
Section Key Value Description
USER_INFO
PK UserInfoID
UserName FirstName LastName EmployeeNumber EmailAddress PhoneNumber Address PostalCode City
WEATHER_MODEL
PK WeatherModelID
ModelName RatingFK1 UserInfoID
MODEL_PARAMETER
PK ModelParameterID
FK1 WeatherModelIDFK2 WeatherParameterID
WEATHER_DATA
PK WeatherDataID
FK1 WeatherParameterID MeasurementValue MeasurementDateTime LocalDateTime
WEATHER_PARAMETER
PK WeatherParameterID
ParameterName Unit Source ItemUrl ModbusRegister ModbusAddress Description Gain Offset
FORECAST
PK ForecastID
FK1 WeatherModelIDFK2 WeatherParameterIDFK3 ModelParameterID
FORECAST_DATA
PK ForecastDataID
FK1 ForecastIDFK2 WeatherParameterID ForecastValue ForecastDateTime
WEATHER SYSTEM (ER diagram)
DEVICE_PARAMETER
PK DeviceParameterID
FK1 WeatherParameterIDFK2 DeviceID
DEVICE
PK DeviceID
DeviceName Description
USER_PASSWORD
PK UserPasswordID
PasswordFK1 UserInfoID
Figure 10-1: E/R diagram of the weather system database.
10.1.4 Table descriptions
The purpose of creating tables is to store useful information in a database which in turn will
be useful for other systems, applications, users or other greater purposes, in this case the

SQL Database system
57
purpose is to satisfy and provide a smooth service to the weather system. Every table created
has a specific purpose. Each of the eleven tables is necessary for the implementation of the
project and they are described by Table 3-1.
Table 10-1: Tables and their functions.
Table Name Description
CONFIGURATION Contain data used as configuration parameters and may be
utilized by the SQL server or other external applications.
USER_INFO Information of the Owners’ of the prediction models.
USER_PASSWORD Store password of owners’ of the prediction models.
DEVICE External devices which use the service of the database such as;
Modbus, Tablet and website.
DEVICE_PARAMETER The external devices are able to pre-select needed parameters.
WEATHER_PARAMETER
Store all the sensors from the micro server, there are
68 parameters, but not all of them is used
WEATHER_DATA
All the values each parameters are updated in this table every
two minutes. The table will increase automatically by time.
WEATHER_MODEL Contains weather prediction models.
MODEL_PARAMETER Parameters of the model.
FORECAST Containing, weatherModelID, weatherParameterID,
modelParameter ID
FORECAST_DATA Output values of the prediction models. The predicted values.
10.2 Create database and tables
A database is created with the name “WEATHERSYSTEM” which contains all the tables
stated in the E/R diagram and running on a MS SQL server 2012. The tables are created by
SQL script, written codes, this method is more time consuming in comparison to the
graphical method. But instead once the script is written the table system can be easily re-
created in case of error, this is also convenient for documenting and sharing the code in form
of query with other members of the project team. The written code to create all the tables in
“WEATHERSYSTEM” database is located in Appendix B.2. Figure 10-2 shows an example
of the code used to create the “WEATHER_DATA” table.
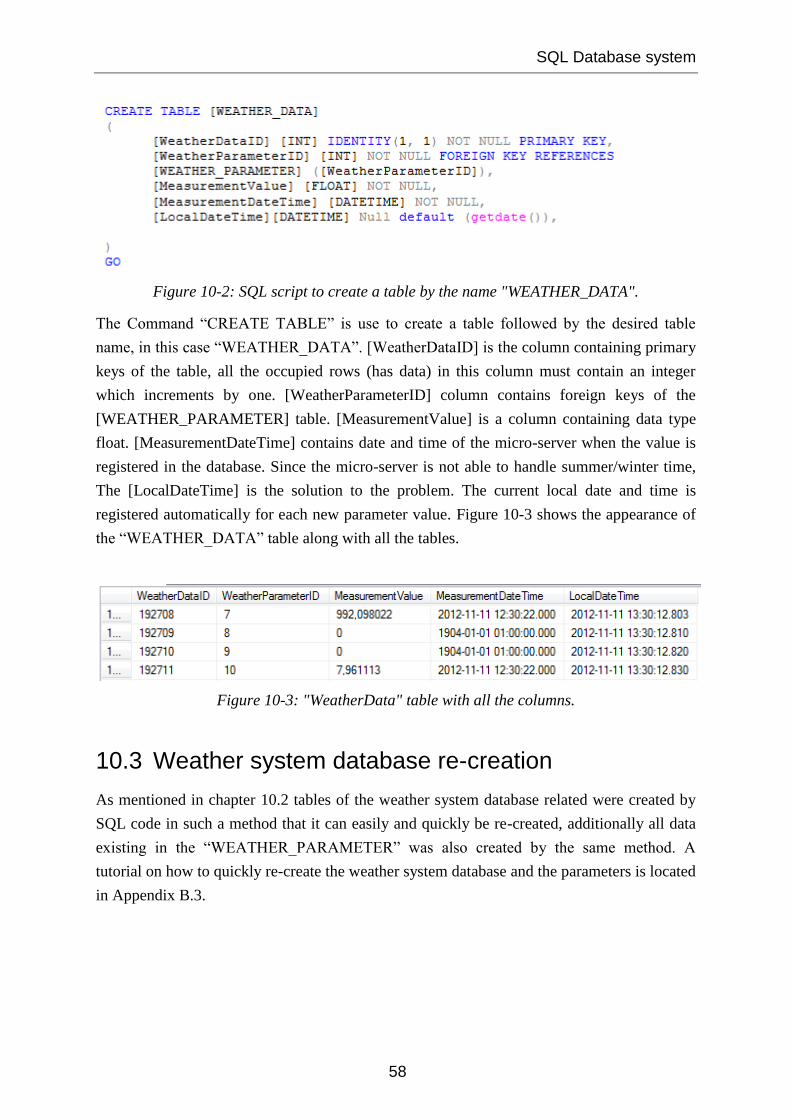
SQL Database system
58
Figure 10-2: SQL script to create a table by the name "WEATHER_DATA".
The Command “CREATE TABLE” is use to create a table followed by the desired table
name, in this case “WEATHER_DATA”. [WeatherDataID] is the column containing primary
keys of the table, all the occupied rows (has data) in this column must contain an integer
which increments by one. [WeatherParameterID] column contains foreign keys of the
[WEATHER_PARAMETER] table. [MeasurementValue] is a column containing data type
float. [MeasurementDateTime] contains date and time of the micro-server when the value is
registered in the database. Since the micro-server is not able to handle summer/winter time,
The [LocalDateTime] is the solution to the problem. The current local date and time is
registered automatically for each new parameter value. Figure 10-3 shows the appearance of
the “WEATHER_DATA” table along with all the tables.
Figure 10-3: "WeatherData" table with all the columns.
10.3 Weather system database re-creation
As mentioned in chapter 10.2 tables of the weather system database related were created by
SQL code in such a method that it can easily and quickly be re-created, additionally all data
existing in the “WEATHER_PARAMETER” was also created by the same method. A
tutorial on how to quickly re-create the weather system database and the parameters is located
in Appendix B.3.

SQL Database system
59
10.4 SQL remote connection
Connection to the database remotely has been attempted already at the very beginning of the
project. This is a very critical step to achieve, because all the members work are dependent on
data from the database. A successful connection allows several team members to work on the
SQL server independently at the same time. It is desirable to enable communication to the
server remotely through the eduroam network, and also from offices of staff members but due
to the network security reasons the project team was granted access to the school’s network
by LAN cables from the computer labs in TUC. A tutorial for how to create connection
remotely is could be found in Appendix B.4.
10.5 ODBC
An Open Database Connectivity to the database was established by using the ODBC Data
Source Administrator tool which is embedded in Windows Operative system. ODBC
provides a standard software method for using database management and the aim is to make
it independent of programming languages, database systems and operating systems. The
ODBC was created by the name WEATHERSYSTEM. So far software programs like;
LabVIEW, Matlab, Python and C# are using this connectivity as data transferring method.
10.6 Backup
Some data in the database are logged over a long time period, each value carries timestamp
which represents the specific weather condition at the moment corresponding to the given
timestamp. External applications rely on these values for their graphs as much as forecast
models rely on these values to find patterns in the purpose of improving the prediction skill.
These prediction models are completely dependent on historical data to train the model.
All the external applications and services are useless if these data are no longer available.
These mentioned values are in the matter of fact the core to the weather system and a system
failure or to be more correct, data loss shall not be tolerated. Therefore, the weather system
database server is backed up in a folder by the name “database” in the C drive, which in turn
is synchronized to the Google drive account. The service is backed up in daily sequence at
midnight when the server is least active.
10.7 View
The concept of database View, or VIEW, is to combine multiple tables or some desired
columns from different original tables and create a new virtual table. VIEW is a result of

SQL Database system
60
SQL script by using “join” as the main operator. In this project a VIEW is created by the
name “VIEW_Device”, this virtual table will show records of five columns originally from
two separate original tables. Figure 10-4 illustrates the virtual table “VIEW_Device” which
is practically impossible to distinguish from the original table from the appearance. The
“DeviceID” column originally belongs to the “DEVICE” table while remaining columns
belongs to “WEATHER_PARAMETER”. Beside the differences in the creation, a virtual
table operates exactly as any other original table.
Figure 10-4: Virtual table by the name “DeviceView”.
The SQL script used for creating the virtual table “DeviceVIEW” intended for Modbus
application is shown in Figure 10-5. The first piece of code will delete any existing VIEW by
the same name, and a new fresh code will be installed on the system. Then all the columns
names shall be specified along with the table of which the columns are belonging to in the
original table. Then finally all the original tables are joined together to form a VIEW of
which the result is shown in Figure 10-4.
Figure 10-5: SQL script for creating virtual table "DeviceView".

SQL Database system
61
10.8 Procedures
In order for external applications like; website and LabVIEW dashboard to be able to publish
their graphs, data needs to be pulled out from the SQL server sequentially. These applications
are completely incapable of direct access to the data in the database but rather they publish
outputs of serial queries that are executed by using the Microsoft management studio. The
output is a combination of complex SQL statements which have been grouped together to
form a procedure. A lot of different procedures were created during the course of the project,
some of the procedure are rather complicated and can be several pages long.
Figure 10-6: SQL script for creating "GetDeviceParameter"
Figure 10-6 illustrates the procedure with simplest script amongst others that was created
during work of the project. The script starting by checking if procedure by the same name
already exists, if so it will be deleted and a new script is installed. Since the Parameter name
and the device are stored in separate tables, join operator is needed.
Refer to Figure 10-6 the procedure “GetDeviceParameter” expects one input, which is name
of the device, while all the parameter’s names which were selected for a specific device from
“DEVICE_PARAMETER” table are shown as output of the procedure. Figure 10-7
represents the output of the procedure, in which column “ParameterName” contains name of
all the specified parameters. To obtain the result the following command is executed
depending on which of the device is specified as input.
exec GetDeviceParameter <<DeviceName>>
exec GetDeviceParameter Website
exec GetDeviceParameter Modbus
exec GetDeviceParameter Tablet

SQL Database system
62
Figure 10-7: Column “ParameterName” as output of the procedure “GetDeviceParameter”.
Table 10-2 lists all the most important procedures that have been created during the project
work and information in details, scripts and usage, are located in Appendix B
Table 10-2: List of most important created procedures.
Name Command line Appendix
P_GetLatest exec GetLatest <ParameterName> B.4
P_TabletLatestValues Exec TabletLatestValues B.5
P_GetWeatherItemData execute GetWeatherItemData <ParameterName>,
<'Start date'>,<'end date'>
B.6
P_ParameterValues exec ParameterValue umtTemp1,<<period>> B.7
P_Average exec AverageHourly <ParameterName>,<’Period’> B.8
P_GetMaxMin Exec GetMaxMin
<<ParameterName>>,<<’Period’>>,<<Mode>>
B.9
10.9 Time period
Website and applications show the weather condition in different graphs based on the values
which were pulled out from the SQL server. In most cases these historical values are within a
frame of a certain time period and these values need to be processed unless it becomes useful.
An example would be to get the average temperature of yesterday, in able to get the result
first of all the start and end time of yesterday has to be located then get all the values within
that specific time frame and use an average function to obtain the final result.
The challenge part is to find a method in able to locate the time frame like begin and end of
last hour, yesterday, last week and ect.. To this specific problem, SQL provides a very simple
and interesting solution, which required only one line of code and this can easily be modified
to determine any moment in time.

SQL Database system
63
Table 10-3: Query to locate time period.
Time Query Result
Current time select getdate()
End of last hour select dateadd(minute, 0, dateadd(hour,
datediff(hour, 0, getdate()), 0))
Start of last hour select dateadd(minute, 0, dateadd(hour,
-1+datediff(hour, 0, getdate()), 0))
Start of today select dateadd(hour, 0, dateadd(day,
datediff(day, 0, getdate()), 0))
end of today select dateadd(hour, 0, dateadd(day, -
1+datediff(day, 0, getdate()), 0))
The queries listed in Table 10-3 are very powerful used to define a certain specific time
period in SQL. In which current time is stated, in this case the time when the query “select
getdate()” was exectuted. A simple query is used to determine the end of last hour, which is
actually also a start of the current hour. Table 10-3 shows that by just simply changing an
integer of the query, the period of any time, day, week, month and year can be tracked, both
back in history and in the future. This time tracking method was used through the entire
project work for retrieving groups of data within a certain time frame.
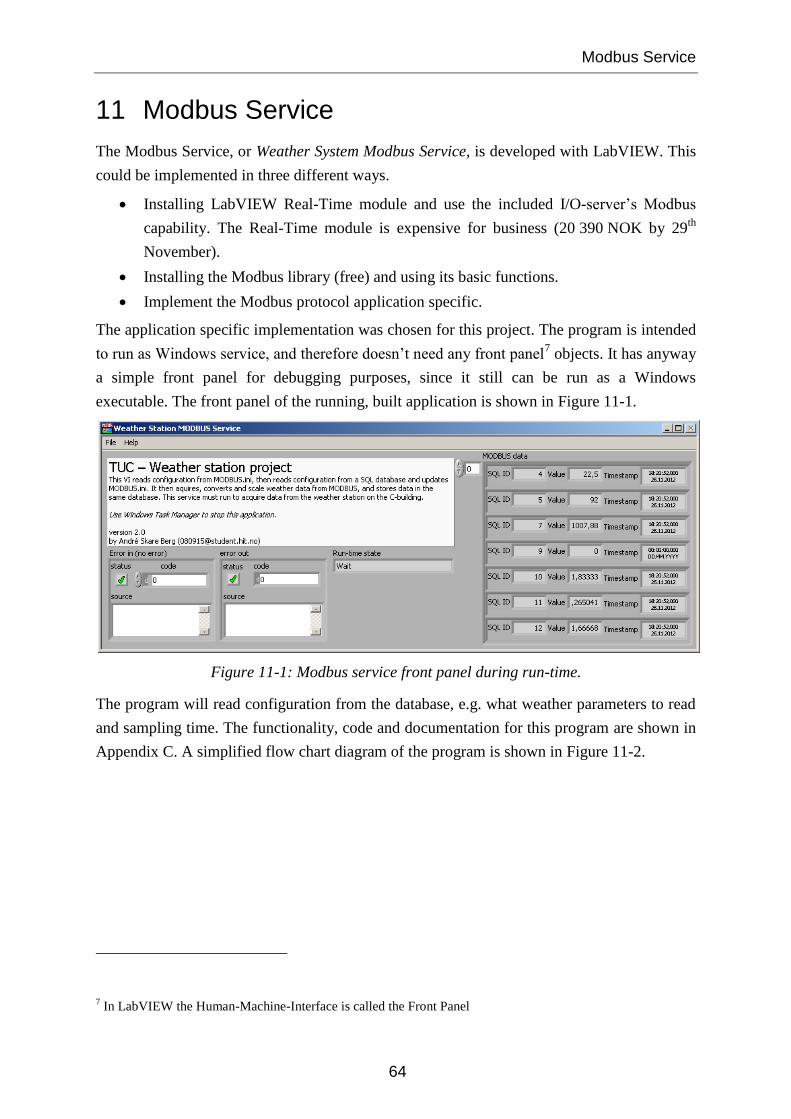
Modbus Service
64
11 Modbus Service
The Modbus Service, or Weather System Modbus Service, is developed with LabVIEW. This
could be implemented in three different ways.
Installing LabVIEW Real-Time module and use the included I/O-server’s Modbus
capability. The Real-Time module is expensive for business (20 390 NOK by 29th
November).
Installing the Modbus library (free) and using its basic functions.
Implement the Modbus protocol application specific.
The application specific implementation was chosen for this project. The program is intended
to run as Windows service, and therefore doesn’t need any front panel7 objects. It has anyway
a simple front panel for debugging purposes, since it still can be run as a Windows
executable. The front panel of the running, built application is shown in Figure 11-1.
Figure 11-1: Modbus service front panel during run-time.
The program will read configuration from the database, e.g. what weather parameters to read
and sampling time. The functionality, code and documentation for this program are shown in
Appendix C. A simplified flow chart diagram of the program is shown in Figure 11-2.
7 In LabVIEW the Human-Machine-Interface is called the Front Panel

Modbus Service
65
Start
Read
configuration
from INI-file
Decrypt
ciphertext
password
Connect to
database
Error? Retry?
End
Read config.
from
database
Connect to
Microserver
Initialize
Modbus
requests
Restart?
Close
connections
Read & scale
Modbus data
Insert data
into database
Wait... Error?
Normal execution loop
Shutdown?
YesNo
Yes
No
NoYes
No
Yes
Yes
No
Figure 11-2: Modbus Service flow chart

Modbus Service
66
11.1 Requests results
See chapter 4.4 and 4.6 for details on how the Modbus request is structured. Table 11-1
shows the Modbus requests generated by executing Modbus service. Only the right-most
column is the request sent to the Modbus slave (data server), the other columns are the fields
that makes up the requests. The VI for generating these requests is modbus_request.vi in
Appendix C.
Table 11-1: Request result (output from SubVI modbus_request.vi in Appendix C)
Tra
nsa
ctio
n I
D
Pro
toco
l ID
Len
gth
Mod
bu
s A
dd
ress
Fu
nct
ion
cod
e
Sta
rtin
g r
egis
ter
ad
dre
ss (
dec
imal)
Nu
mb
er o
f re
gis
ters
to r
ead
(d
ecim
al)
Transmitted request in
Hex-representation
0 0 6 1 4 5 4 0000 0000 0006 0104 0005 0004
1 0 6 1 4 13 8 0001 0000 0006 0104 000D 0008
2 0 6 1 4 25 4 0002 0000 0006 0104 0019 0004
3 0 6 1 4 33 20 0003 0000 0006 0104 0021 0014
4 0 6 1 4 65 8 0004 0000 0006 0104 0041 0008
5 0 6 1 4 93 32 0005 0000 0006 0104 005D 0020
6 0 6 1 4 265 4 0006 0000 0006 0104 0109 0004
11.2 Responses results
See chapter 4.5 for details about the Modbus responses. The total response data received from
the Modbus slave for all the requests from the previous subchapter is too large to show here.
But for the requests with Numbers of registers to read ≤ 4, i.e. for Transaction ID = 0, 2, 6,
the data is small. These three has only one weather parameters each.
Wind speed [mph]
Barometric pressure [inHg]
Solar radiation [W/m²]
The response for these requests is shown in Table 11-2. The response column is located to
left in this case to indicate that it’s received. Note that this is not the true output from
modbus_txrx.vi that is explained in Appendix C, because the MBAP header is removed from
the responses before it is returned from the VI. The MBAP header is however included in

Modbus Service
67
Table 11-2 to make it easier to understand. The other, larger responses have multiple values
in the Value and Timestamp columns.
Table 11-2: Responses received from the Modbus slave (server) for short responses
Received response in
Hex-representation T
ran
sact
ion
ID
Pro
toco
l ID
Len
gth
Mod
bu
s A
dd
ress
Fu
nct
ion
cod
e
Byte
cou
nt
Valu
e (c
on
ver
ted
to
float,
bu
t n
ot
scale
d)
Tim
esta
mp
(con
ver
ted
)
0000 0000 000B 0104
0800 0041 009E 2750 B3 0 0 11 1 4 8 8.000 26.11.12
16:51:51
0002 0000 000B 0104
08F7 CF41 ED9E 1A50 B3 2 0 11 1 4 8 29.746 26.11.12
16:51:38
0006 0000 000B 0104
0800 0000 009E 1A50 B3 6 0 11 1 4 8 0 26.11.12
16:51:38
These values are then inserted to the SQL database.
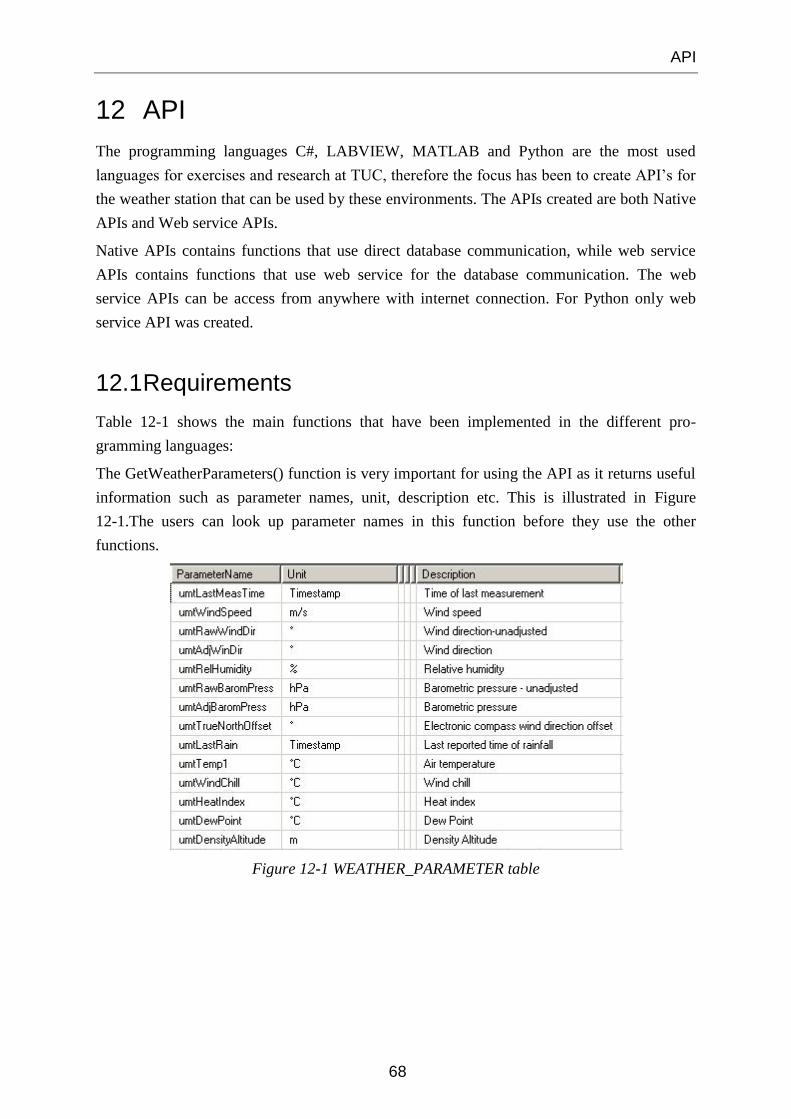
API
68
12 API
The programming languages C#, LABVIEW, MATLAB and Python are the most used
languages for exercises and research at TUC, therefore the focus has been to create API’s for
the weather station that can be used by these environments. The APIs created are both Native
APIs and Web service APIs.
Native APIs contains functions that use direct database communication, while web service
APIs contains functions that use web service for the database communication. The web
service APIs can be access from anywhere with internet connection. For Python only web
service API was created.
12.1 Requirements
Table 12-1 shows the main functions that have been implemented in the different pro-
gramming languages:
The GetWeatherParameters() function is very important for using the API as it returns useful
information such as parameter names, unit, description etc. This is illustrated in Figure
12-1.The users can look up parameter names in this function before they use the other
functions.
Figure 12-1 WEATHER_PARAMETER table
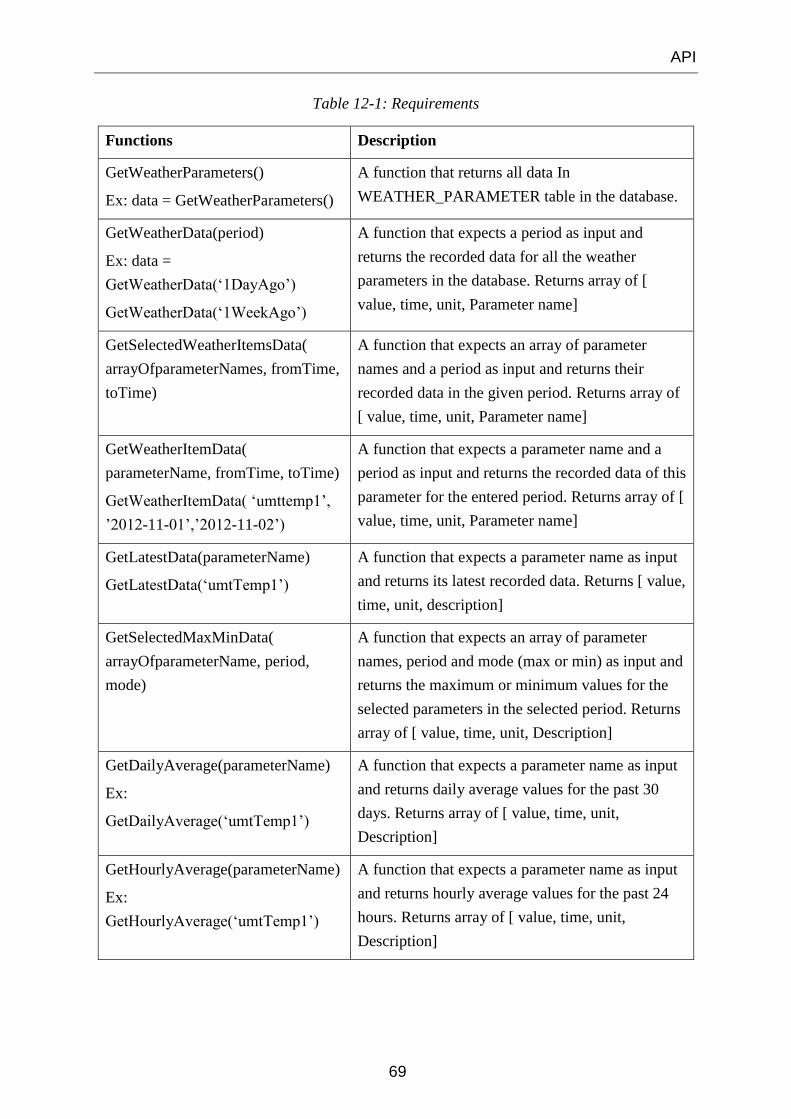
API
69
Table 12-1: Requirements
Functions Description
GetWeatherParameters()
Ex: data = GetWeatherParameters()
A function that returns all data In
WEATHER_PARAMETER table in the database.
GetWeatherData(period)
Ex: data =
GetWeatherData(‘1DayAgo’)
GetWeatherData(‘1WeekAgo’)
A function that expects a period as input and
returns the recorded data for all the weather
parameters in the database. Returns array of [
value, time, unit, Parameter name]
GetSelectedWeatherItemsData(
arrayOfparameterNames, fromTime,
toTime)
A function that expects an array of parameter
names and a period as input and returns their
recorded data in the given period. Returns array of
[ value, time, unit, Parameter name]
GetWeatherItemData(
parameterName, fromTime, toTime)
GetWeatherItemData( ‘umttemp1’,
’2012-11-01’,’2012-11-02’)
A function that expects a parameter name and a
period as input and returns the recorded data of this
parameter for the entered period. Returns array of [
value, time, unit, Parameter name]
GetLatestData(parameterName)
GetLatestData(‘umtTemp1’)
A function that expects a parameter name as input
and returns its latest recorded data. Returns [ value,
time, unit, description]
GetSelectedMaxMinData(
arrayOfparameterName, period,
mode)
A function that expects an array of parameter
names, period and mode (max or min) as input and
returns the maximum or minimum values for the
selected parameters in the selected period. Returns
array of [ value, time, unit, Description]
GetDailyAverage(parameterName)
Ex:
GetDailyAverage(‘umtTemp1’)
A function that expects a parameter name as input
and returns daily average values for the past 30
days. Returns array of [ value, time, unit,
Description]
GetHourlyAverage(parameterName)
Ex:
GetHourlyAverage(‘umtTemp1’)
A function that expects a parameter name as input
and returns hourly average values for the past 24
hours. Returns array of [ value, time, unit,
Description]
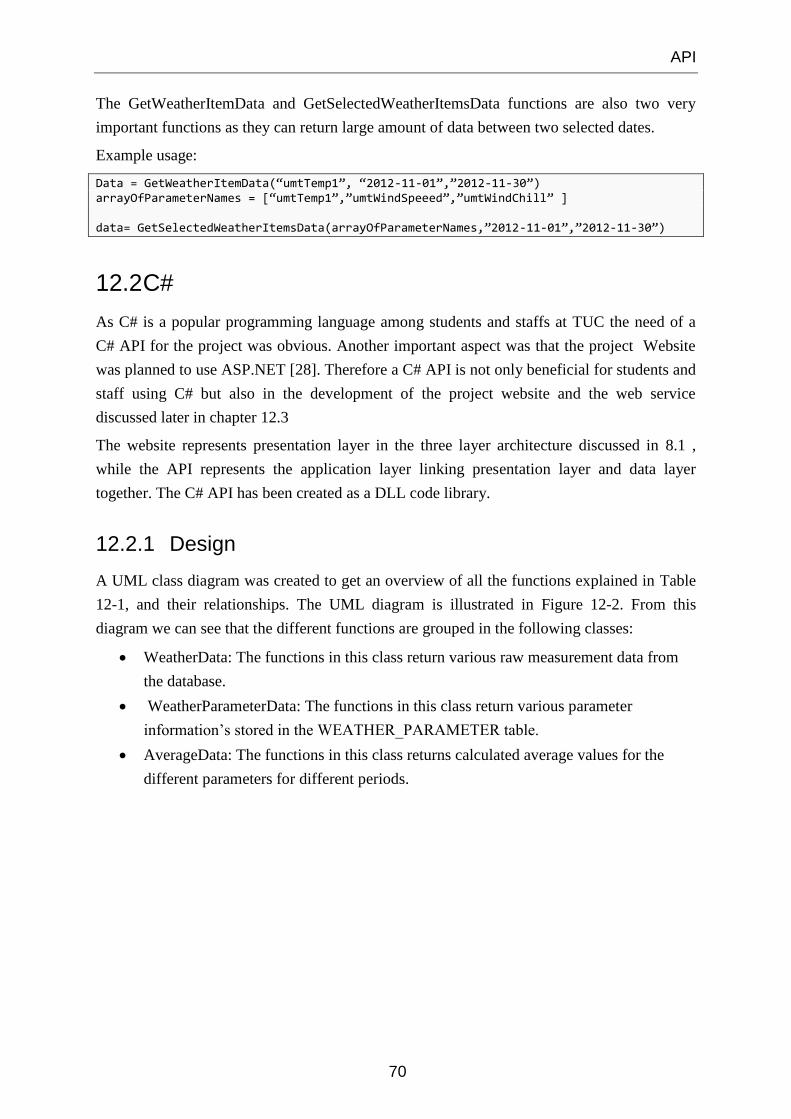
API
70
The GetWeatherItemData and GetSelectedWeatherItemsData functions are also two very
important functions as they can return large amount of data between two selected dates.
Example usage:
Data = GetWeatherItemData(“umtTemp1”, “2012-11-01”,”2012-11-30”) arrayOfParameterNames = [“umtTemp1”,”umtWindSpeeed”,”umtWindChill” ] data= GetSelectedWeatherItemsData(arrayOfParameterNames,”2012-11-01”,”2012-11-30”)
12.2 C#
As C# is a popular programming language among students and staffs at TUC the need of a
C# API for the project was obvious. Another important aspect was that the project Website
was planned to use ASP.NET [28]. Therefore a C# API is not only beneficial for students and
staff using C# but also in the development of the project website and the web service
discussed later in chapter 12.3
The website represents presentation layer in the three layer architecture discussed in 8.1 ,
while the API represents the application layer linking presentation layer and data layer
together. The C# API has been created as a DLL code library.
12.2.1 Design
A UML class diagram was created to get an overview of all the functions explained in Table
12-1, and their relationships. The UML diagram is illustrated in Figure 12-2. From this
diagram we can see that the different functions are grouped in the following classes:
WeatherData: The functions in this class return various raw measurement data from
the database.
WeatherParameterData: The functions in this class return various parameter
information’s stored in the WEATHER_PARAMETER table.
AverageData: The functions in this class returns calculated average values for the
different parameters for different periods.

API
71
Figure 12-2 : C# DLL Library
12.2.2 Implementation
The database communication for the different functions was done using ADO.NET and as the
main structure for the functions in the class diagram shown in Figure 12-2 are same we will
in the following explain how the function GetLatestData is implemented:
This function expects a weather parameter name as input and returns the latest measured
value, timestamp, Unit and description of that parameter:
GetLatestData(string parameterName)
After this function has received a parameter name as input it tries to set up connection with
the database by using a connection string that contains information about the database. This
could be as following:
connectionString = "Data Source= http://ServerAddress;Initial Catalog=DatabaseName; User Id=userName; Password = Password";
This string is passed to an SqlConnection object from ADO.NET[18]:
conn = new SqlConnection(connectionString)
The SqlConnection object uses the information in the connection string to identify the
database server, database name, and tries connecting to the identified database using the user
name and password information passed in the connection string.
A try-catch statement has been implemented in case the connection attempt fails as illustrated
in the following code:

API
72
try using (conn = new SqlConnection(connectionString))//create connection object ...Code here... catch (SqlException e) Console.WriteLine("Connection failed"); Console.WriteLine(e.Message); Thread.Sleep(5000);
With this code the function first tries connecting to the database and if it fails ( an exception
occurs) the catch statement will “catch” this and the user will be informed about the
connection failure and where it happened in the code.
If the connection attempt is successful the connection object is passed to an Sqlcommand
object. This command object takes care of the SQL statements we want to execute, and uses
the connection object to communicate with the database. In this function a stored procedure
has been used.
The stored procedure is executed as following in the code:
First we build the command object.
cmd = new SqlCommand("GetLatest", conn);
Set the command type letting the command object know we want to execute a stored
procedure.
cmd.CommandType = CommandType.StoredProcedure; sets the command type
Pass the input parameter name to the stored procedure in database.
cmd.Parameters.Add(new SqlParameter("@WeatherParameterName", parameterName));
Execute the stored procedure in the database:
cmd.ExecuteReader();
To obtain the result returned from the database ADO.NETs SqlDataReader object has been
used as following:
reader = cmd.ExecuteReader();
The data has then been extracted from the SqlReader as following
while (reader.Read()) Value = (double)reader["MeasurementValue"]; Timestamp = reader["MeasurementDateTime"].ToString(); Unit = reader["Unit"].ToString(); Description = reader["Description"].ToString();
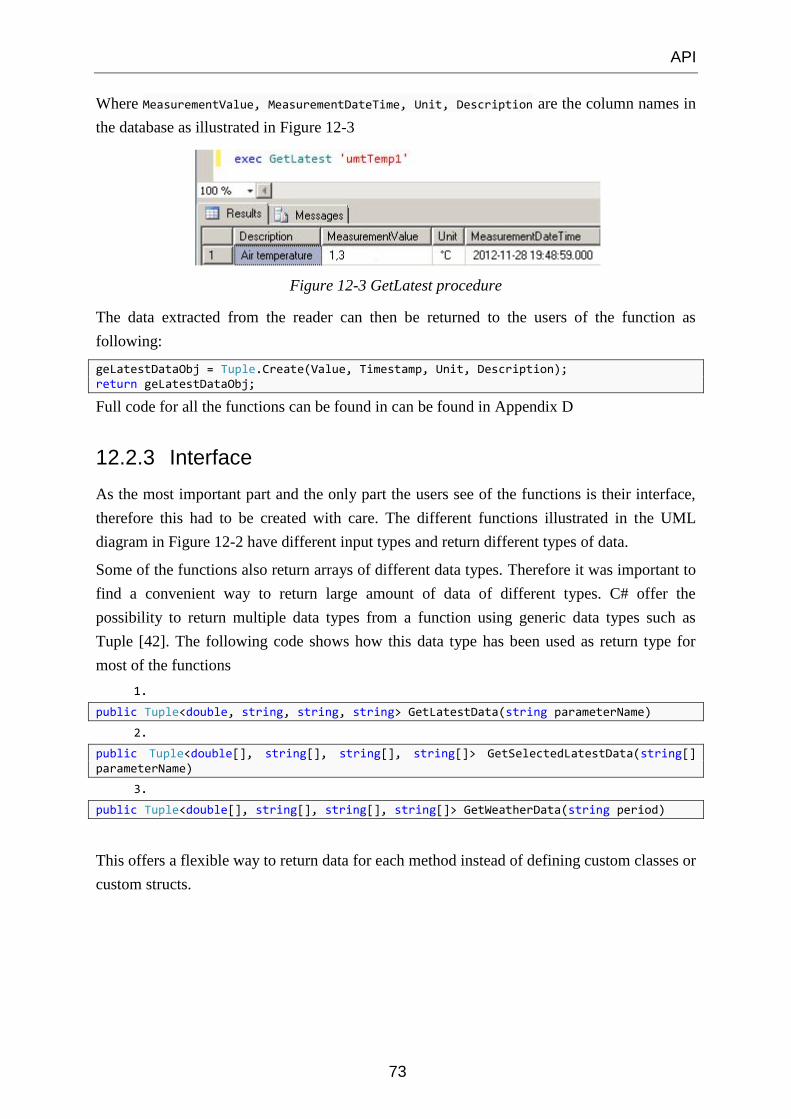
API
73
Where MeasurementValue, MeasurementDateTime, Unit, Description are the column names in
the database as illustrated in Figure 12-3
Figure 12-3 GetLatest procedure
The data extracted from the reader can then be returned to the users of the function as
following:
geLatestDataObj = Tuple.Create(Value, Timestamp, Unit, Description); return geLatestDataObj;
Full code for all the functions can be found in can be found in Appendix D
12.2.3 Interface
As the most important part and the only part the users see of the functions is their interface,
therefore this had to be created with care. The different functions illustrated in the UML
diagram in Figure 12-2 have different input types and return different types of data.
Some of the functions also return arrays of different data types. Therefore it was important to
find a convenient way to return large amount of data of different types. C# offer the
possibility to return multiple data types from a function using generic data types such as
Tuple [42]. The following code shows how this data type has been used as return type for
most of the functions
1.
public Tuple<double, string, string, string> GetLatestData(string parameterName)
2.
public Tuple<double[], string[], string[], string[]> GetSelectedLatestData(string[] parameterName)
3.
public Tuple<double[], string[], string[], string[]> GetWeatherData(string period)
This offers a flexible way to return data for each method instead of defining custom classes or
custom structs.

API
74
12.2.4 Using the C# Library
The users of the C# API can simply add the DLL file as reference in their own code and get
access to all the functions available. Figure 12-4 Adding DLL illustrates how the DLL can be
added as references in Microsoft Visual studio 2010.
Figure 12-4 Adding DLL
The following example shows how the functions in the DLL file can be used in a C# console
application.
1) The users can first find the Parameter names as illustrated in the following code.
var getWData = wParam.GetWeatherParameters();
int length = getWData.Item1.Length;
Console.WriteLine("Using the GetWeatherParameters function\n");
for(int i=0;i<length;i++)
Console.WriteLine("ParameterName " + getWData.Item1[i] + " \t\tUnit " +
. getWData.Item2[i] + "\tDescription: " + getWData.Item3[i]);
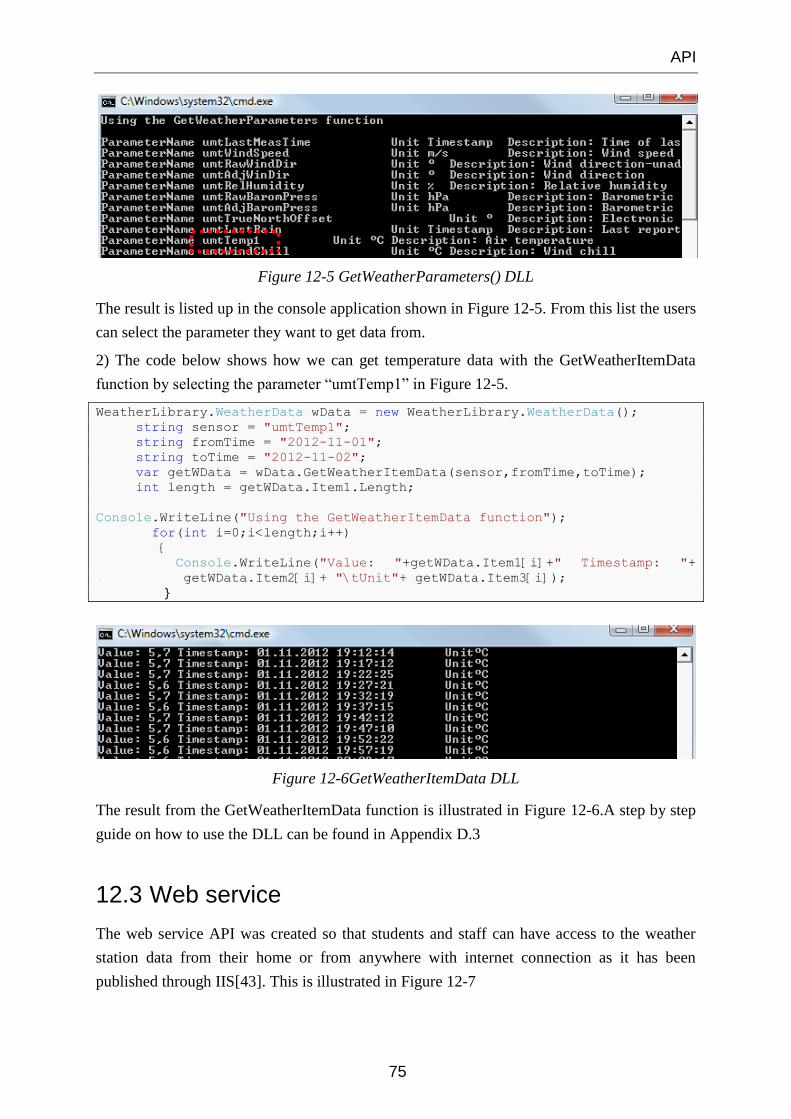
API
75
Figure 12-5 GetWeatherParameters() DLL
The result is listed up in the console application shown in Figure 12-5. From this list the users
can select the parameter they want to get data from.
2) The code below shows how we can get temperature data with the GetWeatherItemData
function by selecting the parameter “umtTemp1” in Figure 12-5.
WeatherLibrary.WeatherData wData = new WeatherLibrary.WeatherData();
string sensor = "umtTemp1";
string fromTime = "2012-11-01";
string toTime = "2012-11-02";
var getWData = wData.GetWeatherItemData(sensor,fromTime,toTime);
int length = getWData.Item1.Length;
Console.WriteLine("Using the GetWeatherItemData function");
for(int i=0;i<length;i++)
Console.WriteLine("Value: "+getWData.Item1[i]+" Timestamp: "+
. getWData.Item2[i]+ "\tUnit"+ getWData.Item3[i]);
Figure 12-6GetWeatherItemData DLL
The result from the GetWeatherItemData function is illustrated in Figure 12-6.A step by step
guide on how to use the DLL can be found in Appendix D.3
12.3 Web service
The web service API was created so that students and staff can have access to the weather
station data from their home or from anywhere with internet connection as it has been
published through IIS[43]. This is illustrated in Figure 12-7

API
76
GetData()
MATLAB
C#
LabVIEW
Python
GetData()
GetData()
GetData()
Weather
system
database
Staff and students
Figure 12-7: Web service
12.3.1 Implementation
The web service was created using ASP.NET. This offers the possibility to create a web
service with normal C# code and we can simply add [WebMethod] to the functions we want to
publish as web service. The code below shows how the function GetLatestData discussed in
section 12.2.2 was implemented as web service.
[WebMethod] public CustomData GetLatestData(string parameterName) var getLatest = weatherData.GetLatestData(parameterName); latestStrObj.Value = getLatest.Item1; latestStrObj.Timestamp = getLatest.Item2; latestStrObj.Unit = getLatest.Item3; latestStrObj.Description = getLatest.Item4; return latestStrObj;
Only a few lines of code were needed, and the whole body of the code is normal C# code, the
only difference is the [WebMethod] header of the function. This function returns the latest data
stored in the database for the input parameter, however as we can see from the code there are
no database communication objects here. All the database communication codes are hidden

API
77
in the DLL file that has been added as reference to the web service project. The function then
uses an object of the GetLatestData function in the DLL file. This way the functions in the C#
API discussed in section 12.2 were used as building blocks for the web service.
The complete code for the Web service can be found in Appendix D.7
12.3.2 Publishing
All the important function functions in the C# API were imported as web service and
published through IIS to the web address: http://128.39.35.252/WebApi/WebService.asmx as
illustrated in
Figure 12-8 Webservice URL
The GetLatestData function is marked with red in Figure 12-8Figure 12-8 Webservice URL,
and if we click on this function on the web browser, and select e.g the temperature parameter
“umtTemp1” the result will be as following:

API
78
<CustomData xmlns:xsd="http://www.w3.org/2001/XMLSchema"
xmlns:xsi="http://www.w3.org/2001/XMLSchema-instance"
xmlns="http://TUCWeather.org/">
<Value>
2.461109
</Value>
<Timestamp>
27.11.2012 11:40:47
</Timestamp>
<Unit>
°C
</Unit>
<Description>
Air temperature
</Description>
</CustomData>
Figure 12-9 Air temperature from the webservice
Figure 12-9 shows the result returned by the website as an XML[44] document containing the
latest value, timestamp, unit, and description. This XML document can be imported by client
programs that can take out all the important information from the document.
12.4 MATLAB
All the functions created in the C# API and web service were also implemented in MATLAB
Native API. Most of the functions were also created as MATLAB web service client API.
12.4.1 MATLAB Native API
In order to create a MATLAB native API for the weather station the inbuilt functions in
MATLABs database toolbox were used. Using this toolbox a set of m files were created
representing the same functions created in the C# API. The code below illustrates how the
GetWeatherItemData(parameterName,startDate,endDate) function is implemented in
MATLAB.
function data = GetWeatherItemData(parameterName,startDate,endDate)
conn = database('WEATHERSYSTEM','sa','********);
cmd = sprintf('exec GetWeatherItemData
''%s'',''%s'',''%s''',parameterName,startDate,endDate);
%Execute the SQL statement
result = exec(conn,cmd);
%import the data
result = fetch(result);
% return the data to workspace
data = result.Data;
end
As mentioned in section 12.2 this function accepts a parameter name and a period as input
and returns value, timestamp, unit, description for all the recorded data within that period.

API
79
The period and parameter name is received in the function header and passed to the stored
procedure GetWeatherItem.
In similar way as in C# the database communication in MATLAB is set up by using the
following functions:
database (databaseName, username, password)
exec(connection object,Command)
fetch (result).
With these three functions all kinds of select statements, insert statements, procedures, Views
e.g can be executed. We only need to pass the SQL code we want to execute to the “exec”
function. The fetch function imports data to MATLAB, while the database function sets up
the connection.
All the functions were created in the same way and saved in different m files and collected to
one folder named TUCweatherStationToolbox as illustrated in Figure 12-10
Figure 12-10: MATLAB Native m-file folder
By saving the folder in Matlab’s search path the users can simply call them directly from
workspace as following:
data = dbGetWeatherItemData('umtTemp1','2012-11-02','2012-11-03')
Help information were also created for all the functions, and the users can type <<help
functionName>> in MATLAB command window to get information about that function.
By typing help dbGetWeatherItemData the user will get the help information shown in Figure
12-11.
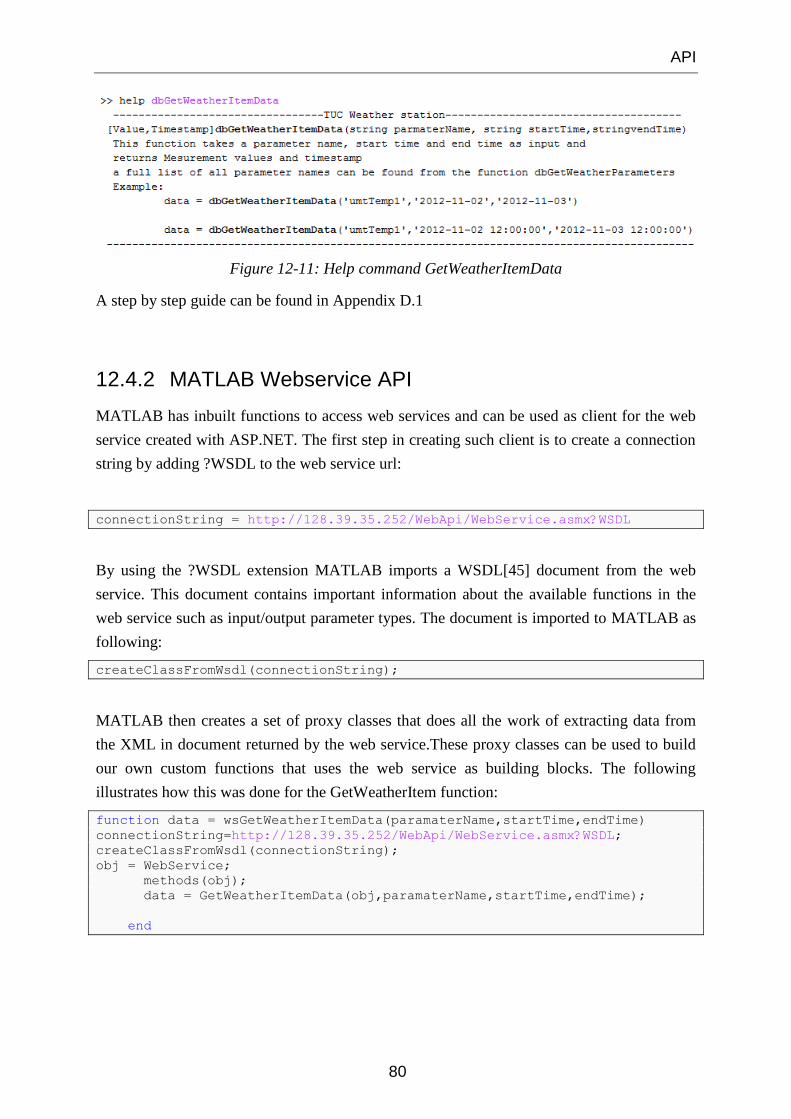
API
80
Figure 12-11: Help command GetWeatherItemData
A step by step guide can be found in Appendix D.1
12.4.2 MATLAB Webservice API
MATLAB has inbuilt functions to access web services and can be used as client for the web
service created with ASP.NET. The first step in creating such client is to create a connection
string by adding ?WSDL to the web service url:
connectionString = http://128.39.35.252/WebApi/WebService.asmx?WSDL
By using the ?WSDL extension MATLAB imports a WSDL[45] document from the web
service. This document contains important information about the available functions in the
web service such as input/output parameter types. The document is imported to MATLAB as
following:
createClassFromWsdl(connectionString);
MATLAB then creates a set of proxy classes that does all the work of extracting data from
the XML in document returned by the web service.These proxy classes can be used to build
our own custom functions that uses the web service as building blocks. The following
illustrates how this was done for the GetWeatherItem function:
function data = wsGetWeatherItemData(paramaterName,startTime,endTime)
connectionString=http://128.39.35.252/WebApi/WebService.asmx?WSDL;
createClassFromWsdl(connectionString);
obj = WebService;
methods(obj);
data = GetWeatherItemData(obj,paramaterName,startTime,endTime);
end

API
81
A similar approach was also done for all the other functions and an m file was created for
each function. The users can then simply access the weather station data with MATLAB from
anywhere with internet connection.
All the m files were collected to the TUCweatherStationToolbox folder, and the code can be
found in Appendix D.8
Figure 12-12: wsGetLatest
12.5 LabVIEW
12.5.1 LabVIEW Native API
To create a LabVIEW Native API a set sub Vis were created using an SQL toolkit created by
our teacher for the database communication. A sub VI was created for each function so that
the users can implement the different sub VI’s as building blocks for their own programs.
Figure 12-15shows an example how the sub VI’s can be used.
Figure 12-13: LabVIEW SubVI's in a block diagram
In Figure 12-15, the GetWeatherItemData function was used together with open and close
connection Vis.

API
82
Figure 12-14GetWeatherItemData VI front panel
Figure 12-14 shows the result by running the program.
The users can connect the different sub VI blocks together without knowing what’s inside the
blocks. Figure 12-15 shows the code inside the GetWeatherItem SubVI.
Figure 12-15: GetWeatherItemData SubVI
12.5.2 LabVIEW Webservice API
The LabVIEW web service API was created by importing all the functions in the web
service. This was done by using the connection string for the web service as illustrated in
Figure 12-17
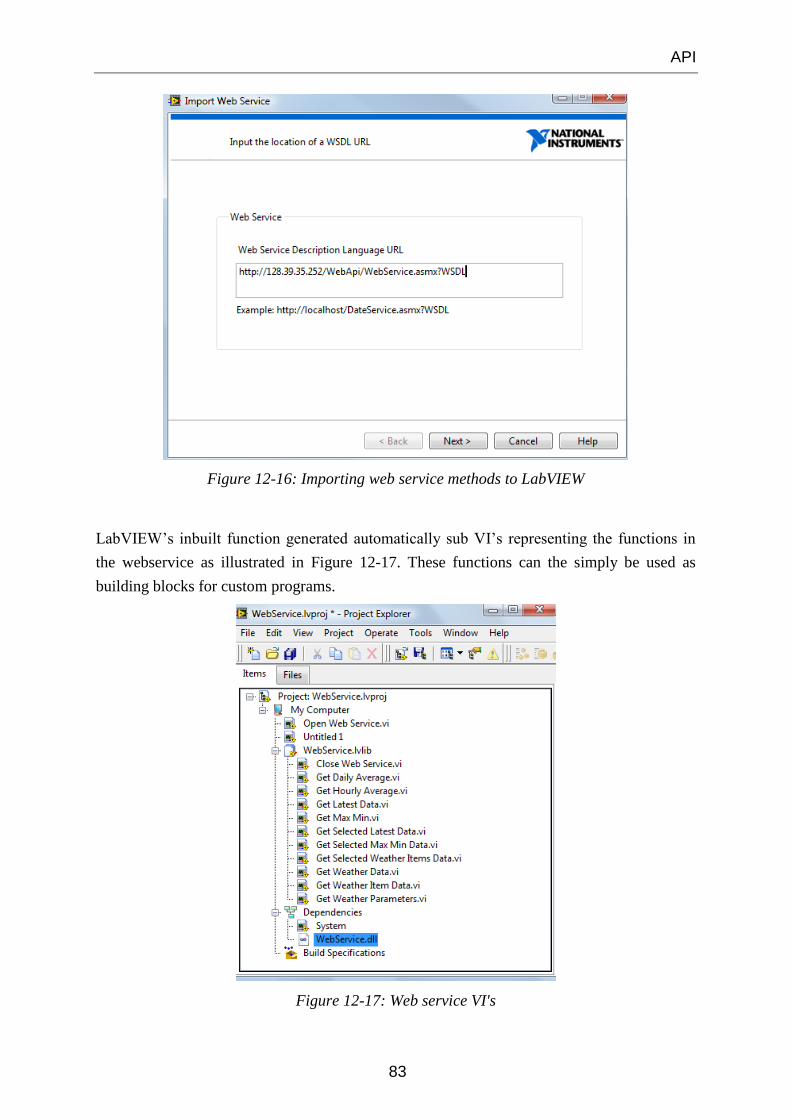
API
83
Figure 12-16: Importing web service methods to LabVIEW
LabVIEW’s inbuilt function generated automatically sub VI’s representing the functions in
the webservice as illustrated in Figure 12-17. These functions can the simply be used as
building blocks for custom programs.
Figure 12-17: Web service VI's

API
84
12.6 Python web service API
For Python web service API the suds SOAP [46] library was used to access the functions in
the web service. This library has easy to use functions that have some similarities with
MATLAB web service functions.
All the functions were implemented as a python module that can be imported and used in
python shell or imported in custom codes files. The code below shows how the function
GetWeatherParameters implemented in the python module
def GetWeatherParameters():
""""""
client = Client('http://128.39.35.252/WebApi/WebService.asmx?wsdl')
#WebServiceClient.GetWeatherParameters()
var = client.service.GetWeatherParameters()
# save the columns in tuple
tup = (var[0],var[1],var[2],var[3],var[4],var[5],var[6],var[7])
return tup
The Code: client = Client('http://128.39.35.252/WebApi/WebService.asmx?wsdl') is used
to connect to the web service while client.service.FunctionName() is used to retrieve.
Figure 12-18 shows en example how the functions can be used.
Figure 12-18: Data from Python web service

Tablet
85
13 Tablet
National Instruments has created an application called Data Dashboard for LabVIEW. With
the Data Dashboard, application created in LabVIEW can be monitored and controlled
through Indicators and Controls. The connection between Data Dashboard and LabVIEW
applications can be achieved through Web Services and Shared Variables.
13.1 Tablet Service - Weather Station Project
The Tablet services for the Weather Station project is mainly for presenting weather data.
The weather data will be read from Telemark University College's own weather station. The
main thought behind the Tablet services, is to use an application that is designed and
programmed for reading the latest weather data from the local Weather Station. The
application shall be published and available for all Tablet and smart phone users so that
everyone can be updated with the latest weather measurements around Porsgrunn.
For the most well-known Operating Systems for Tablets namely, Android, iOS and Windows
there exists tools and software development kits that are created for the different operating
systems. Developers need to use these tools to create applications and very often the
operating system owners have restrictions and regulations for publishing and using the
applications on their operating systems therefore, developers need to consent to these rules
laid down by the owners.
An overview of the sources and types of SDK's that are needed to create applications for
these OS are summarized below.
13.2 Creating Web Services in LabVIEW
To create a Web Service in LabVIEW a new Project needs to be created. Figure 13-1 shows
the Project explorer where the build Specifications needs to be used.

Tablet
86
Figure 13-1: Project Explorer for the Tablet Web Service
In the build specification the Web Service VI can be configured, deployed and managed. It is
in the Build Specification dialog box for the Web Service that there are decided how clients
can interact with the Web Service after it is deployed. LabVIEW uses RESTful Web
Services and this has to be created to be able to configure the Web Services. When the
RESTful Web Services are created there will appear a Build Specification dialog box. Here,
the entire configuration for the Web Services can be done. First the Build specification needs
to be named and the service name. Notice the service name because the service name will be
a part of the URL for the Web Service. Figure 13-2 shows that the Service name is important
to remember since it will be a part of the URL for the Web Service.
Figure 13-2: The Service name is important to remember since it will be a part of the URL
for the Web Service

Tablet
87
Next the source files needs to be specified in the configuration. The VI that will be used as a
Web method for the Web Service needs to be uploaded to the project and specified in the
configuration. In the weather system project, three different applications that reads weather
data have been created. One for only reading the latest measurements, one for reading the
average temperature the last 7 days and one for reading the last 24 hours temperatures. The
two last VIs are more for presenting the weather data statistically in a graph. An overview of
the VIs that are made for the Web Services is shown in Table 13-1.
Table 13-1: An overview of the VIs that are included in the project for Web Service.
VI Description
Main VI - TUCWEATHER
SubVIs - LatestValues, Open SQL
This VIs gets the latest weather data for 13
different parameters.
Main VI - AVGLastWeek
SubVI - LastWeek, Open SQL
This VIs is getting the average temperature
for the last seven days.
Main VI - LastHour
SubVI - Last24Hour, Open SQL
This VI is getting the average temperature
for the last 24 hours.
Main VI - WebServices This VI is the main VI for the Web
Services. This VI is used as a Web Method
for the Web Service.
In these three VIs there are used Shared Variables. The Shared Variables are used for
communicating with one main VI that is used for the Web Services. The VI for the Web
Service will then be the main source file. In the Web Service VI that is used as a Web method
for the Web Service, the weather data are passed through the connector pane. The data that
are coming out is specified as XML data but this can be configured. The HTTP method for
the Web method do also need to be specified. Since this service will be a call service, HTTP
method GET is chosen because it supports the request/respond model. When the Web Service
is finally set-up it needs to be deploy, if else the Web Service will not be up and running. To
communicate with the Web method that has been deployed as a Web Service, some
information is needed. The URL that specifies the location for the Web Service consists of
1. Physical location - The address for the physical location of the server needs to be
specified in the URL. The physical location will be the first part that needs to be
specified. For clients it will be IP address of the server but it can also be a domain
name. The IP address for the Microserver is 128.39.35.252 .
2. Port - The number is the second term of the URL and is added with a colon between
the IP and the port number. Port 8080 is assigned for Web Services and is default.

Tablet
88
3. Web Service name - This have been specified in the Build Specification dialog box
when created the Web Server for the weather station project. The Web Service name
was sat to TUCweather.
4. Web Method VI name - The last term will be the name of the VI that has been chosen
as a Web method for the Web Service. This VI has been called WebServices.
The complete URL for reaching out to the Web Service will be
http://128.39.35.252:8080/TUCweather/WebServices
13.3 Weather Presentation on Dashboard
The weather presentation on the Data Dashboard requires a LabVIEW application and
communication with Shared Variables or a deployed Web Service. In the Weather Station
project it was decided to go for Web Service since it provides communication on the world
wide web and not only on a local network. To achieve communication between a Data
Dashboard application and a LabVIEW Web Service all that is needed is ether the Web
Service name or the IP address for the server. If typing in the IP address of the server all the
Web Services for the server will appear automatically. When it comes to data types both Web
Service and Data Dashboard supports most of the well known types like string, numeric,
double etc. For the Web Service there have only been used the data type double. The
statistically weather data have been arrays of double. When downloading a data dashboard
for the first time, a custom layout can be created for a application. In the weather system
project there have been no use for controls since the LabVIEW application is just reading
data and publish them. Indicators doth have been diligently used since our group decided to
publish 13 variables. On the Dashboard users are free to design and import pictures, symbols,
colors and writing text. In the Dashboard the Weather Station project group have created, it
have been used Weather symbols that responds to the different variables. More pages have
also been added with more detail information on some of the weather variables. The purpose
of designing one layout for the Weather Station is to have one dashboard ready that reads the
weather data and can be shared. So far the supervisor of this project will have the latest
version and can share the dashboard with everyone that has a tablet or Smartphone via Email.
More detail on have to create a Data Dashboard and Build a Web Service application in
LabVIEW can be found in Appendix E.
13.4 Results
From the LabVIEW application created for building a Web Service a connection to the Data
Dashboard can be established. Through the Web Method the outputs of the LabVIEW
application is distributed and the weather data can be read from the Web Service. The

Tablet
89
Layout of the Data Dashboard is in landscape format and it is divided into 3 pages. The first
page contains the latest measurements for seven different weather parameters shown in
Figure 13-3.
Figure 13-3: The first page in the dashboard showing the latest weather data
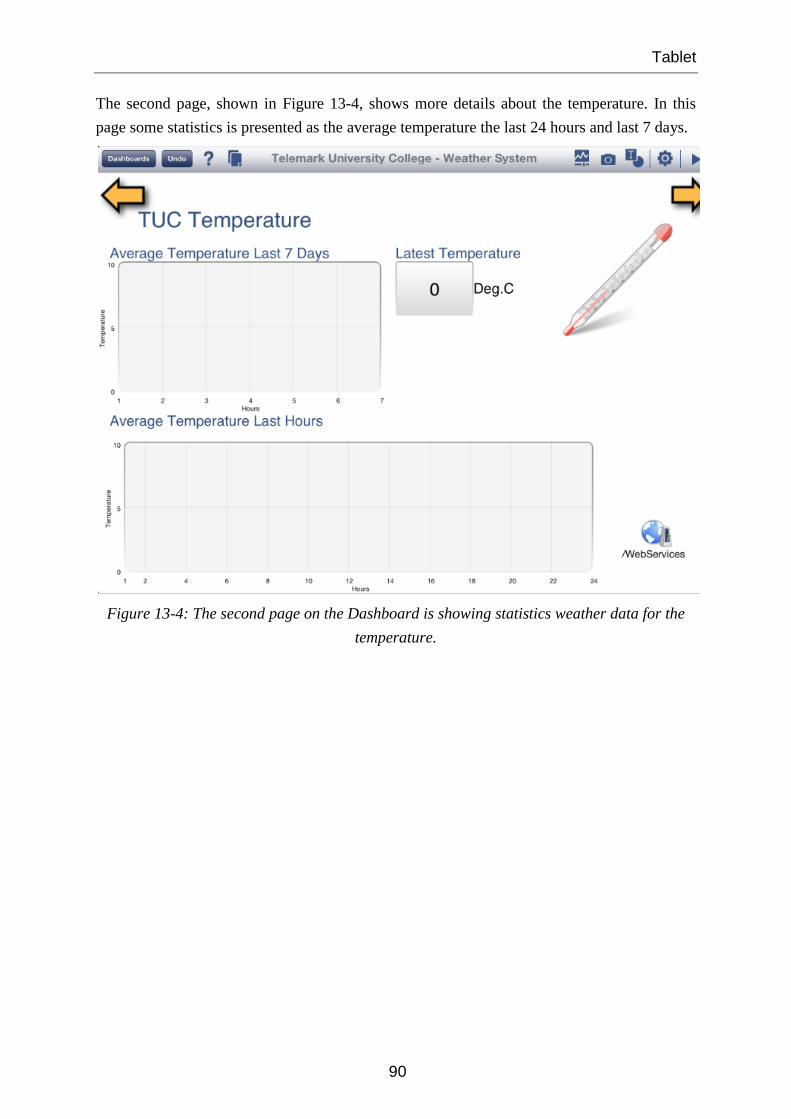
Tablet
90
The second page, shown in Figure 13-4, shows more details about the temperature. In this
page some statistics is presented as the average temperature the last 24 hours and last 7 days.
Figure 13-4: The second page on the Dashboard is showing statistics weather data for the
temperature.
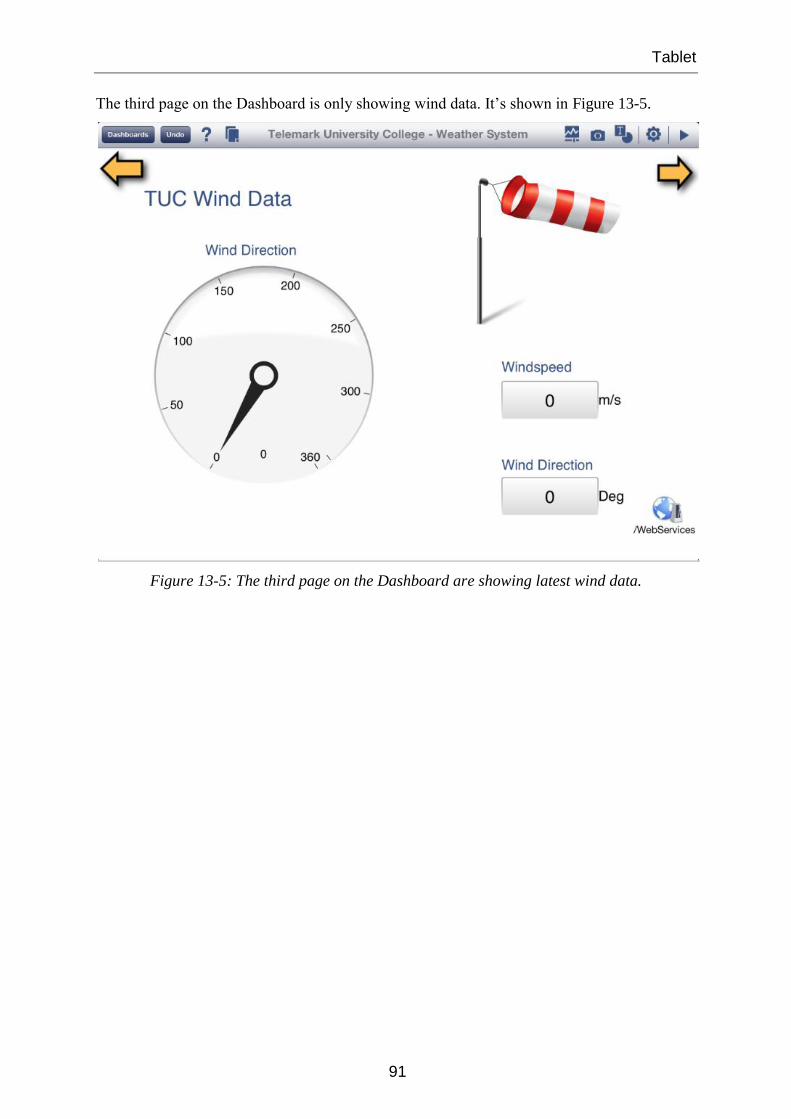
Tablet
91
The third page on the Dashboard is only showing wind data. It’s shown in Figure 13-5.
Figure 13-5: The third page on the Dashboard are showing latest wind data.

Tablet
92
Figure 13-6 shows the fourth page on the Dashboard that’s showing rainfall data. Rainfall for
today, last week, month and year can be read.
Figure 13-6: The fourth page on the Dashboard is showing rain data

TV- and Website
93
14 TV- and Website
14.1 Design
The main purpose of the Website is to fetch data from the SQL server that holds data from
the Weather Station. The Website also has to display the trends of the different sensor data,
real time variation and forecast data from various Weather prediction Models. It is designed
to be a front-end interface to users for the data collected from the Weather Station.
The working of the Website is shown in the Figure 14-1
Figure 14-1 Flow chart of the web site
The Weather Library is a part of the API created so that the Website can easily access the
data stored in the SQL Server. The Website has been designed in the Three Layer
Architecture .The Web form or the user interface form the first layer i.e. Presentation Layer.
The Weather Library forms the Business Layer and the SQL Server forms the Data Access
Layer.
The Presentation Layer deals with the presentation of the data in a Human readable format,
here only formatting of the data is done. The Business Layer deals with the adding business
logic to the data obtained form the data layer. All the processing of the data is done in this
layer. Then there is the data access layer. This layer holds the data.
The web form of the website form the Presentation Layer. The Weather Library API forms
the Business Layer. It helps to connect to the data layer and access the needed information in
the format required. The SQL server is the data access layer.
The UML class diagram of the website is given below in Figure 14-2.

TV- and Website
94
Figure 14-2 The UML class diagram of the website
From the class diagram the functions in each page can be seen. The charts in all pages are
implemented with help of Google Visualization API [47]. The Visualization class is a Library
used to convert C# Data table object to a JavaScript object so that it can be used as a data
source in the charts. It is done so using the Library called Bortosky Google Visualization
Library[32].
14.2 IDE and Tools
For creating this website Microsoft Visual Studio 2010 was used[48]. It can be downloaded
at http://www.ASP.NET/downloads. For this project Visual Studio 2012 was used. It comes
with .NET Framework version 4 installed in it. Visual Studio provides the best Integrated
Development Environment for website development in ASP.NET. The Website was
published on IIS (Internet Information Services), so that it can be accessed from the Internet
using an address. The version of IIS installed on the Server is version 7.5.

TV- and Website
95
14.3 Prototype of the Website
The prototype of the Website was created and published on the IIS. It can be accessed at
http://128.39.35.252/Weather/ . The Website is easy to use. It consists of a horizontal top
navigation menu, which displays all the pages and options available for the user. The
webpage is also designed to loop through these options automatically as the TV screen,
which the Webpage is intended for does not have any input devices. So the website acts like a
slide show on the TV screen showing all needed information.
It has seven pages:
1. Overview
2. Details
3. Trends
4. Statistics
5. Forecast
6. MI
7. About
The Overview page shows the current Temperature, Rainfall, Wind Speed, Atmospheric
Pressure and Wind Speed measured by the Weather Station sensors. There is also a chart at
the bottom of the page, which shows the variations of these values. The right hand side of the
page shows the values from the forecast models. It shows both today’s and tomorrow’s
forecast. These values are taken from the best model. These current values are obtained using
the Weather Library API. By using a function called GetLatestMeasurement function. When
the page is loaded the Page_Load function calls the PullData() and the forecastData(). These
functions in turn call the GetLatestMeasurement () to get the latest data and print them on the
labels present on the webpage. There are also icons shown in the web page. These change
according to the changing measured value using a statement
Image1.ImageUrl = "Icons/Weather/sunny.png";
Some parts of the code is shown in Appendix F.1
The Details page shows the measured value of some of the important sensors. In this page the
details are shown as a table, this is done with the use of data tables. The data table can be
easily populated with data. When the page is loaded Page_load() calls the displayData(). This
function creates an object for the Weather Library and calls the GetSelectedLatestData() this
data is used to populate the data table. As the page also shows yesterday’s values also another
function GetSelectedLatestData() is used to get yesterday’s values and this data is used to
populate the data table. Some part of the code is shown in Appendix F.2
The Trends page shows the variation of the four main sensor average values over hour, and
daily averages for seven and 30 days. The charts are rendered using the Google visualization
API. The Google API cannot be used directly, as this code is JavaScript and the data from the

TV- and Website
96
SQL server is available through C# library. So a third party library called Bortosky Google
Visualization Library is used to convert the data table created in C# to JavaScript object data
table as the API only supports them. This code is shown in Appendix F.3. The Page_Load()
calls LoadChart(), this function gets the data from the Weather Library, convert the data to
normal data table, then convert this data table to JavaScript object type data table. Then a
function google.load(), a part of the Google Visualization API loads the function required to
render the chart on to a <div> element. <div> element is a HTML code that assigns a part of
the page for a particular purpose[49]. Then a variable is initialized to with the data available
from the Bortosky Library and a connection is made with the <div> tag for the chart using
google.visualization.LineChart().Then the chart is drawn using the chart.draw function. A set
of option like title name, font size ect can be given as arguments for this function. A function
is called google.setOnLoadCallback() is used to render all these charts.
The Statistics page shows the minimum and maximum values of certain measured values.
There are three tables that show these values over a time of 24 hours, last week and last
month. This is done using a data table rendered using gridview. The data is obtained using
Weather Library. The GetSelectedMaxMinData() gives the minimum and maximum value
for the parameters given to it. The whole code is shown in Appendix F.4
The Forecast page shows the forecast for today and tomorrow from forecast models. This
page consists of a simple function that loads the forecast data from the weather library to a
grid view using data table.The Page_Load calls a function loadForecastData() . This function
get the forecast data from SQL using GetForecastData(). A data table is created using the data
obtained and rendered through a grid view. The code is given in Appendix F.5
The MI page shows the data from the Metrological Institute. The data is obtained from yr.no
website. This page consists of certain Java Scripts obtained form yr.no to show data directly
from the yr.no page. The code is shown in Appendix F.6
And finally the About page shows the details about the project. An abstract of the page is
shown in this page and some also credits is given in this page.

TV- and Website
97
14.4 Results
The website was published on IIS and it was available for the users to access it using the
address http://128.39.35.252/Weather/. The screen shots of all pages are shown here.
Figure 14-3 The Overview Page of the Website
The Figure 14-3 shows the Overview page. It can be seen that the current weather
parameters, Rainfall, Temperature, Wind Speed and Pressure. are shown on the left top
corner of the website. The left bottom shows the current variation of the weather parameter,
here temperature in this page. The right side of the page shows forecast from the best model.
It shows the forecast of three main parameters: rainfall, temperature and wind speed for today
and tomorrow. It also shows the picture of the owner of the best model. After one minute the
page automatically loads the graph of the next parameter in the left bottom corner. This can
also be accessed from the top navigation menu. There is a drop down menu from Overview
as in Figure 14-4
Figure 14-4 Drop down menu for Overview page
The next page can be loaded by clicking the Details button on the Navigation menu, or it get
automatically loaded after four minutes.

TV- and Website
98
Figure 14-5: Details Page of the Website
Figure 14-5 shows the Details page. It can be seen that it consists of two tables with data of
available sensors from today and yesterday. The left table shows the latest measurements of
all sensors, while the right table shows yesterdays data. The number of sensor shown in this
page can be adjusted in the SQL Server in Parameter table.
The next page is the Trends page. This can be accessed by clicking on the Trends button on
the navigation menu or waiting one minute the website automatically loads the trends page
from details page.
Figure 14-6: Trends page of the Website showing Temperature

TV- and Website
99
This page shows the trends of the measured value hourly, over last seven days and over last
30 days. So looking at Figure 14-6, trend of variation of temperature can be easily seen. In
order to show rainfall, the chart was modified to column charts, so that it is more easy to
interpret. Figure 14-7shows the trends in Rainfall. To see the variation of Wind speed,
Rainfall or Atmospheric Pressure it can be selected from the drop down menu from the
navigation menu as shown in Figure 14-8
Figure 14-7 Trends in Rainfall
Figure 14-8: Drop down menu of trends page
The website can also automatically load the page after a gap of one minute. So all graphs are
re-rendered with values of the next parameter.
The next page is the Statistics page. It can be accessed by clicking the Statistics button on the
navigation menu. The website loads this page automatically after four minutes after the trends
page.

TV- and Website
100
Figure 14-9: Statistics page of the Website
The Figure 14-9shows the Statistics page of the website. It shows the minimum and
maximum values of all sensor reading from yesterday, last 7 days and last 30 days. The left
most table shows the statistics of yesterday, the middle table shows the statistics from last 7
days and the right most table shows the statistics from last 30 days. The sensor list is same as
that available in the Details page.
The next page is the Forecast page. This page can be loaded by clicking the Forecast button
on the navigation menu or the website loads it automatically after one minute after the
Statistics page. The Figure 14-10 shows the Forecast page.

TV- and Website
101
Figure 14-10: Forecast page from the Website
In this page, a table is shown which consists of name of the model owner, and the forecast
value of the Weather parameter: rainfall, temperature and wind speed along with the time
they are forecasted for.
The next page is called MI. It consists of data available from the Meteorological Institute of
Norway. This page can be loaded by clicking MI on the navigation menu. The website
automatically loads this page after one minute after Forecast page. The Figure 14-11 shows
the MI page. It basically consists of pre-built scripts running so as to show the data from
yr.no website.
Then the last page is the About page. This page consists of the abstract of the project done.
The Figure 14-12 shows the About page. This page can be accessed by clicking on the About
button on the navigation menu. The website automatically loads this page after the MI page
after one minute. After one minute the website loads the Overview page again.
So thus the website keep looping through all pages like a slide show. It has been implemented
such so that it can operate without any input devices.
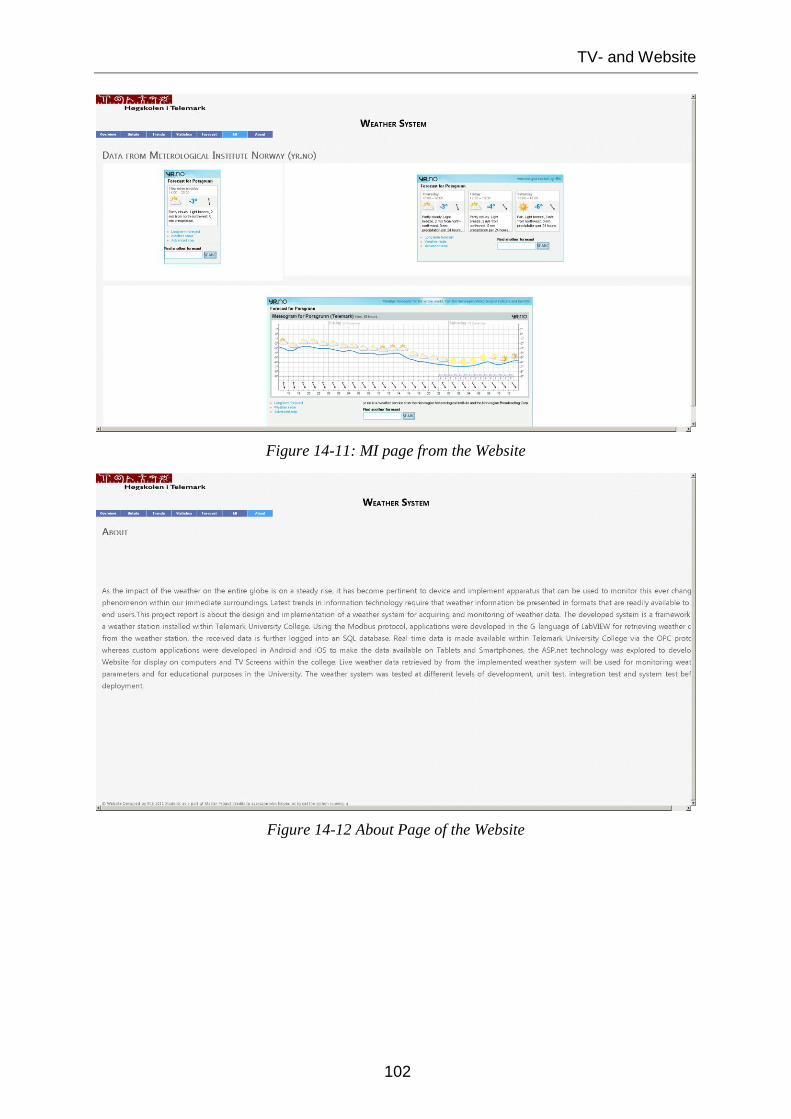
TV- and Website
102
Figure 14-11: MI page from the Website
Figure 14-12 About Page of the Website

OPC
103
15 OPC
The Capricorn 2000EXTM
weather station acquired from Columbia systems has a wide range
of capabilities one of which was communicating via the Modbus RTU and TCP/IP protocol
as a requirement, an OPC Server that will be able to communicate with this device using
these protocols must have configuration settings that are suitable for this protocol. There are
different types of OPC Servers available in the market in different versions. Some of the most
prominent ones include:
Matrikon OPC Servers
KEPServerEX from KEPware technologies
NI OPC Servers from National Instruments
The Capricorn 2000EXTM
weather station was purchased with the KEPServerEX V5 OPC
Server and this was used for communication with the weather station to make data available
to different Client applications. A manual showing the step by step installation and
configuration of the KEPServerEX V5 application can be seen in Appendix G. A summary of
the configuration settings for the server application can be found in Table 3-1
Table 15-1: Summary of OPC Server configuration settings
CATEGORY CONFIGURATION SETTINGS
Name KEPServerEX
Device Name Capricorn 2000EXTM
Device ID 128.39.35.253
Device Model Modbus
Device Driver Modbus TCP/IP
Network Adapter Default
Addressing Use zero-based addressing within registers
Write optimization Write only latest values for all tags
Port number 502
IP protocol TCP/IP
Connect Time out 3 ms
Request Time out 10000 ms

OPC
104
Figure 15-1: Fully Configured OPC Server Outlook
15.1 Adding OPC tags
15.1.1 Addressing
The Capricorn 2000EXTM
weather station is made up of different types of sensors that read
weather parameters and make this data available via the web browser user interface, see
chapter 2.2.2 for information about these sensors.
Using the Modbus protocols, data readings obtained from each of these sensors are stored in
registers a list of the weather parameters that can be read by this weather station is found in
[14]. In order to add OPC items to the pre-configured OPC Server, the address of each
weather parameter must be followed as shown in the list in order to get the corresponding
OPC readings from the sensors, care must be taken to ensure that the addresses are correct
15.1.2 Scaling the OPC tags
The weather station obtained from Columbia systems, a company located in Maine, USA was
configured to take provide data in accordance to American standards, this made it important
that the readings obtained from this device are scaled so that the end users in this part of the
worl will be able to relate to the data made available based on European standards which are
obtainable here. Scaling of the tags required that the mathematical relationships between
these different standards (SI Units) be used to set how the OPC Server should translate data.
As an example the conversion of Temperature in Fahrenheit’s into Celsius is given by
equation (15-1)

OPC
105
(15-1)
Where is the Temperature in Celsius
and is the Temperature in Farenheit’s
This scaling relationship can be adjusted for the tags requiring it by right-clicking on the
property tab, selecting linear scaling and then inputting the corresponding values of the raw
value range and the scaled value range. E.g. for conversion from Fahrenheit to Celsius the
raw range can be set to 32-50, and the scaled value range to 0-10. A summary of the OPC
tags that required scaling can be seen in below
Air Temperature
Wind speed
Barometric Pressure
Wind Chill
Heat index
Dew point
3 sec avg of wind speed
2 min avg of wind speed
10 min avg of wind speed
10 min max of wind speed
60 min max of wind speed
Rain rate
Rain for the day
Rain last hour
Vapour pressure.
15.1.3 Restricting write access for Clients
One of the main advantages of the OPC protocol is interconnectivity and interoperability
between servers and clients of different vendors. This means that servers can read and write
to clients and vice versa, however for the purpose of this project, it will not be a good idea for
clients to be able to write data to the tags on the OPC server and make this data available to
other clients. For the purpose of data integrity, an OPC server for acquiring and monitoring of
weather data should have limited access for clients in order to be assured of uniformity and
correctness of weather data. It was ensured that each and every tag added to this weather
system had its write access restricted to clients. This was done by changing the settings under
the properties of all the tags in the OPC item list and choosing the restrict write access to
clients option.

OPC
106
15.1.4 Tag descriptions
It is important that since a good number of tags are available in the weather system, end users
that want to read these weather parameters should be able to distinguish one tag from another
therefore it is pertinent that a description of each tag be understandable to the lay man. The
type of data read by each tag is also specified so that the precision of the values read from the
server will be as high as possible. A uniform scan rate of 1000 ms was assigned to each tag
and this is the amount of time it will take the server to update each tag.
15.2 Types of OPC Clients
The architecture of the OPC protocol is a Client-server model, the configuration of the OPC
server makes it possible to read data from any device used in this configuration, which in this
case is the weather station. The data received from the weather station is routed to the OPC
server using the Modbus protocol and is furthermore, made available to end users via client
applications. There exists a wide range of client applications that can be bought off the shelf
in software stores or downloaded from the websites of their respective manufacturers. Most
of these clients are preconfigured for industrial, manufacturing or educational purposes.
Some of the renowned OPC Servers include
Matrikon OPC Explorer
National Instrument Lookout
OPC Quick Client from KEPware
Custom Client applications can also be built to be able to communicate with the OPC Server
using various programming languages and toolboxes from several applications. As part of the
scope of this project, Customized clients will be created in the following formats:
LabVIEW codes (with a front panel showing the GUI for the client)
C# using Visual basics (also with a graphical user interface)
Python programming language
MATLAB (Using a model created with Simulink)
The advantages of building custom applications is that they can be extend to suit various
needs. Very simple codes and applications can be built for educational purposes while more
experienced persons can extend their codes and programs to solve more complex problems
for example, industrial and process control purposes.
15.3 Getting weather data
In order to demonstrate the interconnectivity between Server and Client from different
vendors and show the robustness of the OPC protocol, ready-made clients such as the

OPC
107
Matrikon OPC Explorer and customized Clients in four programming languages namely:
Python, C# (using visual studio), MATLAB and python were used to read live weather data
from the Capricorn 2000EXTM
weather station by reading OPC tags from the pre-configured
KEPServerEX V5 OPC Server. A step by step guide on how to interconnect both applications
can be seen in Appendix G.3 and Appendix G.4
15.3.1 Using the Matrikon Explorer
Using ready-made Client applications to read OPC Servers are quick and easy but however,
necessary steps must be taken to ensure the reliability of data read using these clients (See
Appendix G.1). An outlook of the server side and client side can be seen in Figure 15-2 and
Figure 15-3 respectively.
Figure 15-2: Showing active tags on OPC Server-side
Figure 15-3: Reading OPC tags on the Client side

OPC
108
Note that the Client side detects all servers instaled on the local computer, when a connection
is established with any of them, it also shows the particulars of the Server such as:
Name of Server
Connections status (Yes or NO)
Total Items (the amount of OPC items read from the server)
Quality of tags being read (e.g. Good, non-specific)
Data Exchange rate
Current time and Update tme (local)
15.3.2 Remote access to OPC Server
In chapter 2.4 (The DCOM challenge in OPC), how restrictions in DCOM, the technology
on which the OPC was built affects the OPC protocol was discussed and recommended steps
to overcome this challenge was also suggested. In addition to this depending on security
setting in a a network additional steps can be taken to ensure that a reliable OPC
communication protocol is established. For the network in Telemarkk University College,
getting data across to clients within the network requied additional steps namely:
1. Opening of communication ports on the OPC Server
2. Configuring of an OPC Tunneler application Using Cogent datahub
15.3.3 Cogent Datahub
Cogent Datahub is a product of Cogent Realtime Systems, a company dedicated to providing
middleware products to enable live data integration and distribution for industrial and
embedded systems. Cogent datahub is the latest version of their line of datahub products with
features that support the OPC protocol for connections between OPC servers and clients [50]
(see Appendix G.3.2.1 for step by step installation and configuration). The graphical User
Interface for this application is shown in Figure 15-4.

OPC
109
Figure 15-4: Cogent datahub OPC Tunneling solution
The Cogent datahub application is a suite with various functionalities such as data logging,
OPC Security, scripting, OPC tunneling etc. The main functionality that was utilized in this
project was the OPC tunneling functionality. The usage of this functionality became
necessary due to the challenges associated with DCOM. The networking protocol for OPC is
DCOM, which was not designed for realtime data transfer and is highly sensitive of network
breaks in addition to its security flaws. In order to overcome this challenge, the cogent
datahub application was used as an OPC tunneling solution.
The goal of OPC tunneling is to eliminate DCOM which is commonly done by replacing the
DCOM networking with TCP. Instead of connecting the OPC client to a networked OPC
server, the client program connects to a local OPC tunneling application which acts as a local
OPC server. The tunneling application accepts requests from OPC client and converts them to
TCP messages, which are then sent across the network to a companion tunneling application
on the OPC server computer. There the request is converted back to OPC and is sent to the
OPC server application for processing. Any response from the server is sent back across the
tunnel to the OPC client application in the same manner.[51]
Figure 15-5: How Cogent datahub works[51]

OPC
110
15.4 Creating Customized Clients
As part of the scope of this project, customised clients were created in four programming
languages namely MATLAB, Python, C Sharp and LabVIEW. The clients created were made
to be as simple as possible because they were created for educational purposes in order to
show students how simple Clients can be developed. The samples codes can be extended to
various level of complexities as may be required.
15.4.1 C# Client
The design forms in Visual Studio makes programming in C# an interesting venture as user-
specified graphical interfaces can be combined with simple codes to create an OPC Client. It
is recommend that measurement studio class libraries be installed on the computer to aid the
creation of a C# Client. Refer to Appendix G for a step by step guide on creation of an OPC
client using C#. The simple codes will allow users to browse the OPC Server and read OPC
tag values on a dashboard as shown in Figure 15-6.
Figure 15-6: GUI for the C# OPC Client
15.4.2 Python Client
Python is a general-purpose, high level programming language whose design philosophy
emphasizes code readability. It has clear and expressive syntax and also a large and
comprehensive standard library. It was conceived in Netherlands in the 1980s Python is a free
and open source softwarewith a community based development model that performs nearly
all implementations [52]. To get python to run effectively on a computer requires a number of

OPC
111
steps and these steps can be seen in Appendix G. Simple python codes were used to create an
OPC Client as describes in Appendix G. Figure 15-7 shows a sample output for a client
created using this programming language.
Figure 15-7: Reading OPC tags from apython Client
15.4.3 LabVIEW Client
LabVIEW is a platform used for system design and development environment for a a visual
programing language from National Instruments. Some of its common applications include
dataacquisition, instrument control and industrial automation. The graphical language is
named ’G’ and is used on a various platforms such as UNIX, Linux, Mac OS and MS
Windows[52]. Programming in Lab VIEW is intercative as the user gets to see the
progression of the program yat every level of initiation. An example of OPC Clients created
on this platform which is robust enough to read as many OPC tags as user specifies and then
displays it in the front panel as shown in Figure 15-8.
Figure 15-8: LabVIEW Front panel of for the LabVIEW Client

OPC
112
15.4.4 MATLAB Client
The Matrix laboratory applicatin is a numerical computing software developed by
MathWorks and allows for implementation of different types of algorithms, plotting functions
and complex matrix manipulations. It can also be used to create user interfaces which can be
further interface with other computer programmes irrespective of the languages they are
written on. The licensed MATLAB application also contains several toolboxes that can be
used for a wide ramge of industrial purposes. The OPC toolbox in MATLAB is accessed
through Simulink. Models of an OPC created here to read OPC tags from any Server (see
Appendix G.4.3 for a manual on creating MATLAB Clients). The finished output of the
MATLAB Client is shown in Figure 15-9.
Figure 15-9: MATLAB Client for OPC
The benefits of using the OPC protocol over other types of protocol e.g. the Modbus protocol
for making live weather data available for end users are vast. Users receive high quality of
information in addition to time stamps on these information. From a usable point of view,
OPC protocol provides the capability of browsing the address space with very descriptive
item IDs. More data types and string data are handled better using the OPC protocol and most
importantly, restrictions in network nodes that are prevalent in other protocols are avoided
using the OPC protocol[53]. For the weather system designed in this project, based on key
concerns such as funcotionality and availability of live data for educational purposes, the
OPC connectivity option gives a very good fit.

Other implementation
113
16 Other implementation
This chapter contains other minor implementations.
16.1 System configuration tool
A basic system configuration tool is created. It shows a list of all the tables in the database,
and it’s possible to show the content of each table and make user-defined queries. Entries in a
table can be deleted and changed, and new elements can be inserted. The system
configuration tool should in principle only be used on the following tables:
CONFIGURATION
WEATHER_PARAMETER
DEVICE_PARAMETER
The program was created to easily make changes in the WEATHER_PARAMETER table,
changing the scaling coefficients and the units, and adding configuration key/value pairs to
the CONFIGURATION table. It has also been used to select which weather parameter to
acquire data from in the DEVICE_PARAMETER table. A WeatherParameerID that is
coupled to DeviceID = “1” (for Modbus) in DEVICE_PARAMETER will be acquired and
logged to the database. The user interface of the configuration tool is shown in Figure 16-1.
The contents of the CONFIGURATION table is also shown.
It’s easy to make exceptions. The program will fail in the following cases.
The user tries to make changes in the entry identifier column.
A number is entered with comma, and not period.
An entry is inserted into a table and does not include all the required columns (not
NULL columns)

Other implementation
114
Figure 16-1: Front panel of the configuration tool, where the CONFIGURATION table is
shown.
16.2 Defective wind speed sensor
The wind speed sensor showed 0 m/s even when it was very windy outside, and then
suddenly showing correct results for a short period of time. Troubleshooting was performed
and the wind speed sensor was demounted. The wind speed sensors uses four magnets to
activate a reed-switch two times per revolution, and this reed-switch was defective. The reed-
switch was replaced with a reed switch of a different kind which required slight modification
on the reed-switch mount. It was got from the electronic equipment storage at TUC, A reed
switch could also have been ordered from the wind speed sensor manufacturer, but this was
not done to save time and money. The wind speed sensor has worked since.
password

Other implementation
115
16.3 Port access
Data communication is one of the most critical parts to the project and through the ports users
are able to access to data available from different services/servers. For this specific project,
being able to access data through ports enable the team member, end users and professors to
access the system and obtain live data. Additionally, through the ports multi users can have
access to certain services at the same time at different sessions. These ports can only be
opened by the network administrator from IT-department. Table 16-1 indicates all the ports
that are opened by a ticking signs.
Table 16-1: Communication status on ports.
Service Port number Staff LAN Eduroam Student LAN
OPC 4502 √ √
MS SQL server 1433 √
WEB service 8080 √ √ √
Modbus 502 √

Telemark University College Faculty of Technology
Summary Part IV:

Discussion and suggestion for further work
117
17 Discussion and suggestion for further work
17.1 CPU usage
All LabVIEW developed applications shows an unexpected behavior. The behavior is that the
applications tend to claim 100 % CPU usage of one CPU core, slowing down the whole
system. The exact reason for this is not known, and was only briefly troubleshooted.
Different LabVIEW run-time engines were tried, and updated to the last version. It was also
discovered that the LabVIEW start-up windows showed the same behavior after being
opened for a long time.
17.2 Tablet
In the weather system project an application for Smart Phones and Tablets developed by
National Instruments was used. The application called Data Dashboard for LabVIEW only
supports Smart Phones and Tablets that are running on the Android and iOS operating
system. A suggestion for further work is for students to develop a completely new application
that can run on the Windows 8 operating system. It can be focused on developing an
application for Windows-enabled phones using the development kit that supports Windows
phones or use the SDK for developing an application for Tablets and Windows Desktop.
Apparently Windows 8.0 is the latest operating system from Microsoft representing a
completely new concept. This will improve the market for the Windows phone in Norway
compared to its android and iOS counterparts.
Another point of view will be that today most people do not have Windows phones so a
better suggestion would be to create an application for iOS. The products from Apple have
been very popular in Norway the last years meaning that the probability today is much higher
for having and iPhone instead of a Windows phone. This also opens for a more rapidly
increase in sharing an application created for the weather station.
17.3 Website
Include animations for wind direction and improve graphics used in the system.
Improve charting so that forecast data also be plotted on the charts
Use code snippets from jQuery to improve the design and over all look of the system.
Use fluid layout (HTML5 and CSS 3) for the Website so that it can resize to any Web
browser size.

Discussion and suggestion for further work
118
Get Weather Data from The Norwegian Meteorological Institute into the SQL Table
so that it can be displayed on the website.
Optimize speed of the Website by using external JavaScript and CSS files instead of
in-line coding, by a caching system, compress images on the website, loading
JavaScripts at end of the page, optimise web caching of the pages
Improve website compatibility with smaller screens like Tablets and Smart Phone
screens.
17.4 API
Optimize the data communication especially for the function
GetWeatherData(period). This function can return large amount of data and has
multiple database calls. The number of data calls can be reduced by creating new
procedures or Views for this function.
A Native API for Python should be created
The number of functions can be increased to give the users more options.
17.5 Other suggestions for further work
Improve the configuration tool such that users can more easily change the weather
system configuration without danger.
Overhaul the weather station’s sensors. Replace ball bearings of the wind speed
sensor, clean leaf and dirt of the other sensors.
Reinstall the main server operating system with Windows 7.

Conclusion
119
18 Conclusion
This technical report is documentation of the Design and implementation of a weather system
for the monitoring and acquisition of weather data. The initial phase of the project involved
developing a relational database model from scratch using Microsoft’s Serial Query
Language for logging of weather data from the weather station. In order to establish
connection between the weather station and the database, a customized program was
developed using LabVIEW development application.
The data logged round the clock into the database is a digital representation of physical
weather conditions at various points in time, in order for this digital data to be translated into
meaningful information for end users, the digital values are processed using the database
management studio so that external applications can be able to communicate with the
database. User interfaces were created in different formats for smart phones and tablets using
a recent developmental kit from National Instrument called data dashboard for LabVIEW. A
prototype was developed for displaying the weather data and was further implemented with a
dynamic website which was created in C sharp programming language on the ASP.NET
framework for the display of weather data on computers, and TV screens within Telemark
University College. Native Application programming Interfaces (API) were created to allow
external access from different programming languages such as C sharp, LabVIEW,
MATLAB and python. Additionally, a web-service API was created to allow external access
to the weather system through the internet. Wireless data acquisition using the OPC protocol
was implemented by configuring an OPC server which contained OPC items made of
weather parameters. OPC clients were developed in C sharp, Python, MATLAB and
LabVIEW programming languages. The DCOM challenge related to the OPC protocol was
overcome by exploring OPC tunneling possibilities using Cogent data hub tunneller
application.
The entire was carried out within 12 weeks and a technical documentation of all activities
carried out in the project was made. Custom applications developed for this project was also
put documented for research and educational purposes.

References
120
References
[1] I. Columba Weather Systems, "Capricorn 2000EX™ Weather Station User Manual,"
vol. 1.06, 2011.
[2] I. Columba Weather Systems, "Weather MicroServer – User Manual ", ed. U.S.A:
Columba Weather Systems, Inc., 2011.
[3] I. Met One Instruments, "034B Wind Sensor Operation Manual," vol. Rev B, ed: Met
One Instruments, Inc, p. 17.
[4] N. Instruments. (2012). What is LabVIEW. Available:
http://sine.ni.com/np/app/main/p/docid/nav-104/lang/no/fmid/1762/
[5] Python.org. (2012). About Python. Available: http://www.python.org/about/
[6] mathworks. (2012). MATLAB® Available:
http://www.mathworks.se/products/matlab/
[7] T. C. a. C. Begg, Ed., DATABASE SYSTEMS A Practical Approach to Design,
Implementation, and Management. 2008, p.^pp. Pages.
[8] N.-O. Skeie, Ed., Industrial Information Technology, Lecture notes for SCADA
Computer Devices, Data Communication, Field Bus, OPC, Process Database,
Embedded systems, Mechatronics, Real-time systems, Alarm Systems, EEx, Testing,
and Data Recovery sections., 2012, p.^pp. Pages.
[9] H.-P. Halvorsen, "Structured Query Language," 2012.04.13 2012.04.13.
[10] wikipedia. XXTEA. Available: http://en.wikipedia.org/wiki/XXTEA
[11] I. Modbus Organization, "Modbus Application Protocoll Specification," vol. 1.1b3,
ed, 2012, p. 50.
[12] R. M. N. David J. Wheeler, "Correction to XTEA," Cambridge University, Computer
laboratory1998.
[13] wikipedia. Unix time. Available: http://en.wikipedia.org/wiki/Unix_time
[14] I. Columba Weather Systems. Modbus Point List. Available:
http://www.columbiaweather.com/media/Microserver/OrionModbusData.pdf
[15] M. Reddy, API Design for C++ 2011.
[16] Wikipedia. (2012). .NET Framework. Available:
http://en.wikipedia.org/wiki/.NET_Framework
[17] N.-O. Skeie, Object-Oriented Analysis, Design, and Programming using UML and
C#, 2012.
[18] Microsoft. (2012). ADO.NET. Available: http://msdn.microsoft.com/en-
us/library/e80y5yhx.aspx
[19] Microsoft. (2012). What is a DLL? Available:
http://support.microsoft.com/kb/815065
[20] W3C. (2004). Web Services Glossary. Available:
http://www.w3.org/TR/2004/NOTE-ws-gloss-20040211/
[21] wikipedia. (2012). Tablet Computer. Available:
http://en.wikipedia.org/wiki/Tablet_computer
[22] android. (2012). Get the Android SDK. Available:
http://developer.android.com/sdk/index.html
[23] wikipedia, "Eclipse (softaware)," 2012.
[24] apple, "Developer Tools," 2012.

References
121
[25] microsoft, "Windows Phone SDK tools," 2012.
[26] wikipedia. (2012). LabVIEW. Available: http://en.wikipedia.org/wiki/LabVIEW
[27] N. Instruments. (2012). Web Services. Available: http://www.ni.com/white-
paper/7350/en
[28] Wikipedia. (2012). ASP.NET. Available: http://en.wikipedia.org/wiki/ASP.NET
[29] Microsoft. (2012). JavaScript in ASP.Net. Available: http://msdn.microsoft.com/en-
us/library/aa479011.aspx
[30] Microsoft. (2012). DataTable Class. Available: http://msdn.microsoft.com/en-
us/library/system.data.datatable.aspx
[31] Datatables.net. (2012). Datatable Class in JavaScript. Available:
http://datatables.net/docs/DataTables/1.9.4/
[32] G. Bortosky. (2012). Bortosky Google Visualisation. Available:
http://code.google.com/p/bortosky-google-visualization/
[33] Wikipedia. (2012). IIS. Available:
http://en.wikipedia.org/wiki/Internet_Information_Services
[34] Wikipedia. (2012). Three Tier Architecture. Available:
http://en.wikipedia.org/wiki/Multitier_architecture#Three-tier_architecture
[35] P. Patel. (2009, Three Layer Architecture in C# .NET. Available:
http://www.codeproject.com/Articles/36847/Three-Layer-Architecture-in-C-NET
[36] O. T. Institute, "What is OPC," ed, 2012.
[37] Wikipedia. (2012). OPC Server. Available: http://en.wikipedia.org/wiki/Opc_server
[38] O. Foundation. (2012). OPC Specifications. Available:
http://www.opcfoundation.org/Products/Specifications.aspx?CM=-1
[39] Wikipedia. (2012, 24 Nov 2012). Component Object Model. Available:
http://en.wikipedia.org/wiki/Component_Object_Model
[40] H. K. Hayrettin Toylan, "A research on SCADA application by the help of OPC
server for the water tank filling system," Scientific Research and Essays, vol. 5, 2010.
[41] R. Kondor. (2007). OPC and DCOM: Things you need to know. Available:
http://www.automation.com/pdf_articles/OPC_and_DCOM_5_things_you_need_to_k
now.pdf
[42] Microsoft. (2012). Tuple. Available: http://msdn.microsoft.com/en-
us/library/dd387149.aspx
[43] Microsoft. (2012). Internet Information Services. Available: http://www.iis.net/
[44] W3C. (2012). Extensible Markup Language (XML). Available:
http://www.w3.org/XML/
[45] W3C. (2012). WSDL. Available: http://www.w3.org/TR/wsdl
[46] J. Ortel. (2010). suds Available: http://sourceforge.net/projects/python-suds/
[47] GoogleAPI. (2012). Google Visualization API. Available:
https://developers.google.com/chart/interactive/docs/index
[48] Microsoft. (2012). ASP.NET. Available: http://www.asp.net/
[49] W3School. (2012). DIV tags. Available: http://www.w3schools.com/tags/tag_div.asp
[50] C. R. Systems. (2012, 25th November 2012). Cogent Datahub. Available:
http://www.cogentdatahub.com/Products/Cogent_DataHub.html

References
122
[51] B. M. a. A. Thomas. (2008, 29 Nov 2008). OPC Tunneling - know your options.
Available:
http://www.cogentdatahub.com/Download/PDF_Release/OPC_Tunnelling_Options.p
df
[52] Wikipedia. (2012, 2012). Python (programming Language). Available:
http://en.wikipedia.org/wiki/Python_(programming_language)
[53] E. Murphy. (2008). OPC Advantages. Available:
http://lists.opcfoundation.org/TACblog/Lists/Comments/ViewComment.aspx?ID=5
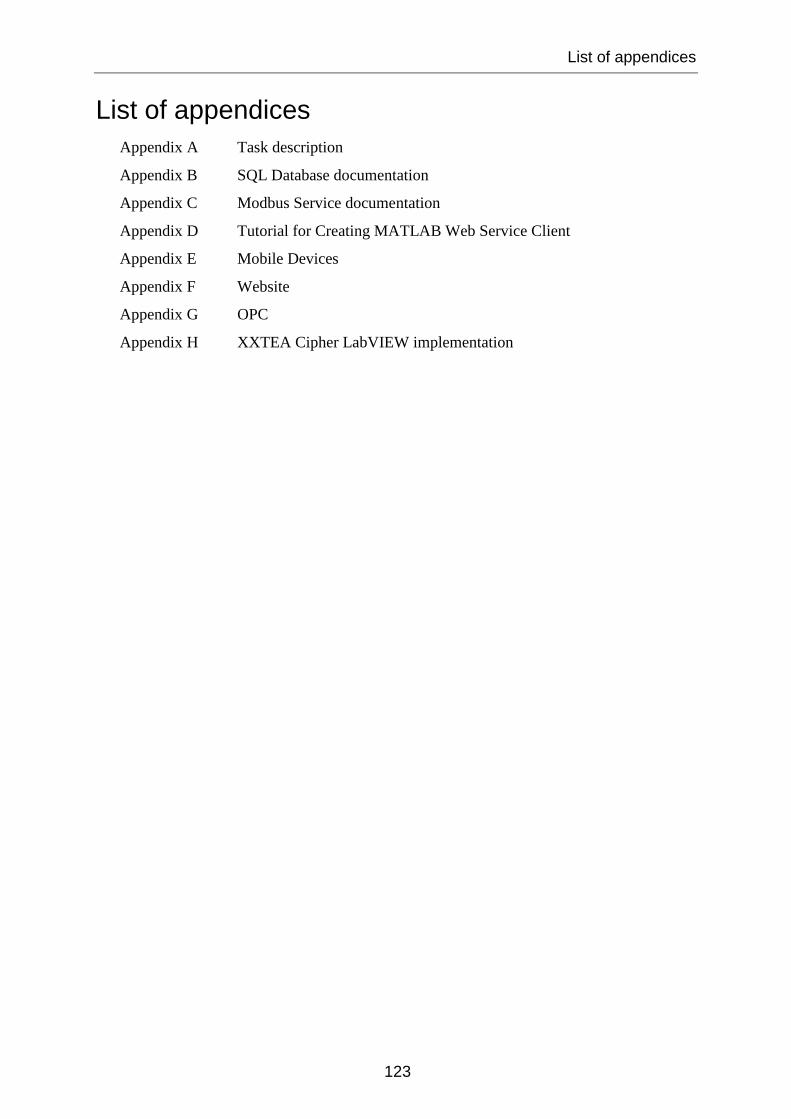
List of appendices
123
List of appendices
Appendix A Task description
Appendix B SQL Database documentation
Appendix C Modbus Service documentation
Appendix D Tutorial for Creating MATLAB Web Service Client
Appendix E Mobile Devices
Appendix F Website
Appendix G OPC
Appendix H XXTEA Cipher LabVIEW implementation