wea riskst the - wv dhhr · wea riskst the west virginia ... the behaviors, or risk factors, under...
TRANSCRIPT

W e a Riskst The
West Virginia Department of Health and Human Resources Bureau for Public Health
Off ice of Epidemiology and Health Promotion


th Risks: The Appa achian Lifesty
Gaston Caperton Governor
Gretchen 0. Lewis Secretary
Department of Health and H
Wilfiam T. Wallace, Jr., M.D., M.P.H. Commissioner, Bureau for Public Health
Alan P. Holmes, Director Office of Epidemiology and Health Promotion
Health Statistics Center

Health Statistics Center Alan P. Holmes, Director
Gary Thompson, Special Projects Coordinator Eugenia Thoenen, Special Studies Coordinator
Report Written Bv Eugenia Thoenen
Health Statistics Center
Statistical Staff Betty J o Berry, Secretary
Joseph D. Kennedy, Progsammer/Analyst Fred King, HER Specialist
Thomas N. Leonard, ProgramrnedAnalyst Tom Light, Data Analyst
Philip Simmons, Programmer/halyst
G r a ~ h i c s and Exhi.bits By Tom Light
Cover Design By Gary Thompson
December 1995
Permission to quote from or reproduce materials from this report is granted when due acknowledgement is made.

The region known as Appalachia stretches along the spine of the Appalachian Mountains from
northern Alabama to south-central New York. It is a region of great natural beauty, yet many of its
inhabitants live in conditions of poverty, the result of a history of isolation from mainstream America
and its opportunities. High rates of chronic disease occur in Appalachia, in part because of unwise
and unhealthy lifestyle choices made by those who live there. The link between unhealthy behaviors
and chronic disease has been well established; this study attempts to examine certain of these
behaviors as reported by Appalachian residents, comparing their prevalences with those reported by
persons living outside of Appalachia. The region of Appalachia (as defined by the Appalachian
Regional Commission) contains 399 counties in 13 states: Alabama, Georgia, Kentucky, Maryland,
Mississippi, New York, North Carolina, Ohio, Pennsylvania, South Carolina, Tennessee, Virginia, and 7
West Virginia.
The behaviors, or risk factors, under consideration are among those monitored regularly by the
Behavioral Risk Factor Surveillance System (BRFSS), developed by the U.S. Centers for Disease
Control and Prevention to enable states to track progress toward the reduction of unhealthy lifestyle
choices among their adult residents. Eight BRFSS risk factors are examined: seatbelt nonuse, obesity,
overweight, hypertension awareness, current smoking, heavier drinking, binge drinking, and drinking
and driving.
The 1993 data used in our report were collected from 102,464 households in 49 states and the
District of Columbia. A three-step study design was employed to allow for several levels of
comparison; the main focus of the present report, however, is the comparison of aggregated data from
(1) the 399 Appalachian counties ("Appalachia") and ( 2 ) all remaining counties in the U.S. ("non-
Appalachia").

Distinct differences were found between Appalachia and non-Appalachia in terms of both
demographic variables and behavioral prevalences:
Appalachia has a higher percentage of women (53%) than non-Appalachia (51%), as well as
an older population: 14% of its population was aged 65 and older in 1990, compared to 12%
in non-Appalachia. Ninety-two percent (92%) of Appalachian residents are white, compared
to 79% elsewhere in the country. On average, Appalachians are less educated and poorer than
the rest of the country: in 1989, per capita income was $11,704 in Appalachia and $14,667 in
non-Appalachia. Thirty-two percent (32%) of Appalachian adults aged 25 and older were high
school dropouts, compared to 24% of their peers in non-Appalachia.
The following risk factors were found to be higher in Appalachia than in non-Appalachia:
seatbelt nonuse (24.1% vs. 17.2%); obesity (31.7% vs. 30.0%); overweight (27.4% vs. 25.5%);
hypertension awareness (22.1% vs. 21.4%); and current smoking (24.2% vs. 21.9%). The
following risk factors were found to be lower in Appalachia than in non-Appalachia: heavier
drinking (2.8% vs. 3.5%); binge drinking (11.6% vs. 14.6%); and drinking and driving (1.9% vs.
2.5%). All of these differences were found to be statistically significant except that for
hypertension awareness.
A distinct pattern, referred t o as the Appalachian Behavioral Profile, emerged from the
comparison of the eight BRFSS risk factors: Over;all, Appalachiar~ residearts were fomd
ficantly higher risk of iqjury and illness from seatbelt nonuse, obesity,
overweight, and current smocng and at si
kzkom heavier Cffi mg, binge dri
Appdachajim residents,

Table of Contents
Page
Introduction to Appalachia .................................................................................................................
............................................................................................................... ........................ Methodology -- 9
Results: Appalachia vs . Non-Appalachia ........................................................................................
Demographic Characteristics ................................................................................................. ...................................................................................................................... Seatbelt Nonuse
..................................................................................................................................... Obesity .............................................................................................................................. Overweight
Hypertension Awareness ...................................................................................................... .................................................................................................................... Current Smoking
Heavier Drinking ............................................................................................... ........................................................................................................................ Binge Drinking
Drinking and Driving .................................... ... .................................................................. ................................................................................................................................. Summary
.............................................................................................. .................................. Bibliography .....-. 63
................................................................................................. ................................. Appendixes ......... 65
........................................................... . . A Appalachian States vs Non-Appalachian States 67 .............. . . B Appalachian States: Appalachian Counties vs Non-Appalachian Counties 69
C . Sample Designs ................................................................................................................ 109 . D Number of Interviews by State ...................................................................................... Ill
E . RuralNrban Definitions .................................................................................................. 113 F . List of Appalachian Counties by State ....................................................................... 115


Chapter One
The natural beauty of the Appalachian Mountains belies the serious health problems affecting
many of the area's inhabitants. High rates of chronic disease point to a way of life that has been
detrimental to the health of those persons who live in Appalachia's highlands and valleys. To date,
however, little research exists on u h e a l t f i l behaviors among Appalachian residents that place them
at special risk for these diseases. It is hoped that this report will provide some insight into the
prevalence of such behaviors, or risk factors, in Appalachia, with comparisons to the rest of the United
States.
Over the years, Appalachia has been one of the most studied, and at the same time most
misrepresented and misunderstood, regions of the country. Foll~wing the spine of the Appalachian
Momtains from nodhem Alabama to south-central New York, Appalachia lies between the coastal.
plains of the East and the states of the Midwest. n called an area of contradictions, it is rich in
natural resources, yet many of its residents live in poverty. Replete with breathtakingly beautihl
scenery, it has also been the site of tenibie mui;i'lation of the land through unregulated mining and
timbering. While the region has been exploited for the wealth of its minerals and forests, its great
human potential has remained generally untapped and unrealized. The people of the mountains have
been described in various ways, from stoic, rugged individualists to indolent, uneducated victims of
industrialization. Unfortunately, the definitive study of the people who have chosen the Appalachians
as their home has yet to be written.

Chapter One
The first inhabitants of the region were the Native Americans, the Iroquois Confederacy and
the Shawnee to the north and the Chickasaw, Cherokee, Choctaw, and Creek tribes to the south,
Much of Appalachia's Indian heritage is well known and easily recognized. The name "Appalachia"
itself is derived from an Indian word meaning "endless mountains." Many of the region's rivers and
streams carry Indian names, as do its mountain ranges, counties, and towns. The early European
settlers benefited frorn the Indians' knowledge of native plants and natural products in the treatment . .... .
of illnesses. From the Indians, they also learned t o cultivate new crops, including corn, beans, sweet
potatoes, pumpkins, and squash.
In general, the majority of barly pioneers who came into the Appalachian region were of
Scotch-Irish and German descent. These two groups were primarily responsible for shaping the culture
that is considered App~lachian today. The Germans, known as the "Pennsylvania Dutch," settled in
the Appalachian valleys of Pennsylvania, Maryland, Virginia, and North Carolina during the late
seventeenth and early eighteenth centuries. The Scotch-I~sh were a persecuted ethnic group in Great
Britain that emigrated to America in the eighteenth and nineteenth centuries. Finding the same
persecution upon their arrival in America from the pioneers who had preceded them, the Scotch-f sish
eventually migrated into the Appalachians and settled in the isolated mountains to separate
themselves frorn the coastal settlements. Other immigrant groups that found their way into
Appalachia included the Welsh, English, Italians, French, and Dutch, as well as African-Bmericans
fleeing slavery on the ~nderground Railroad that cut across the region and Middle Europeans such
as the Polish and Russian immigrants who settled in Appalachia's industrialized areas.


Chapter Two
ODOLOGY
The data source for our analysis was the 1993 Behavioral Risk Factor Surveillance System.
The BRFSS was designed by the CDC to measure health behaviors over time, enabling states to
monitor progress toward the reduction of these risk factors by providing ongoing surveillance. From
the initial 15 states in 1984, the BRFSS had grown to include all. states and the District of Columbia . . . . - .
by 1994. The 1993 data used in this report were collected from 102,464 households in 49 states
(Wyoming did not participate in that year) and the D i s t ~ c t of Go1 bia. Having access to the total
BRFSS database for 1993 allowed data aggregation on both the state and county levels.
In order to provide a comprehensive understanding of any differences revealed through an
analysis of behaviors in Appalachia and elsewhere, our study employed a three-step design allowing
for three separate levels of comparison (Chart 1). The first step consisted of an overall comparison
using state-level data from the BRFSS. A national prevalence was calculated for each risk factor by
aggregating data from all 49 states and the District of Columbia. The total dataset was then divided
into two groups: the 13 states specified by the ARC as lying wholly or in part within Appalachia
(Alabama, Georgia, Kentucky, Maryland, Mississippi, New York, North Carolina, Ohio, Pennsylvania,
South Carolina, Tennessee, Virginia, and West Virginia) and the remaining 36 states and the District
of Columbia. Risk factor prevalences were calculated for each of these two groups, referred to as (1)
"Appalachian states" (13 thirteen states having one o r more counties designated as Appalachian)

P .-
off *Z
off pr.

Methodology ==
and (2) "non-Appalachian states" (those states with no counties designated as Appalachian). This
allowed a comparison of the Appalachian states to the U.S. as a whole and the remaining BRFSS
states. These data are included in Appendix A.
Step two of our analysis, the focus of this report, involved aggregation of the BRFSS data on
the county level. Data from (1) the 399 ARC-designated Appalachian counties ("Appalachia") and (2)
all remaining counties in the U.S. ("non-Appalachia") were aggregated to yield two sets of rates that
were compared more extensively. In addition to overall prevalence rates for the eight risk factors,
variables including gender, age, education, and income were examined for significant differences
between Appalachian and non-Appalachian residents.
An even narrower focus was involved in step thee of the study. County level data were
aggregated within each of the 13 Appalachian states to yield (1) an Appalachian and (2) a non-
Appalachian portion for each state. The same variables were examined on the state level as those
analyzed for Appalachia and non-Appalachia as a whole. These data are included in Appendix B.
The BRFSS represents a collaborative effort between individual state public health agencies
and the CDC. The states provide telephones, o=ce space, interviewers, and data supervision (either
in-house or through contracted services). The CDC provides financial assistance, a standardized set
of core questions, computer-assisted telephone inkfiewing software, computers, data processing
services, and analytic consultation. Although all 49 states and the District of Columbia used random-
digit-dialing telephone survey techniques in 1993, the sample designs varied by state. Thirty-five
states used a multistage cluster design based on the Waksberg sampling method for random digit

Chapter
dialing; other sample designs, such as simple random or stratified random, were chosen by the
remaining 15 states (see Appendix @ for a listing of sample designs by state). The fact that different
sampling methods were used by the states does not present a problem for data aggregation because
each state is considered a separate level of sampling stratification when the data are combined for
analysis, as in the present study.
Phone calls and interviews are conducted by the states during a seven-to-twelve day period
each month. When the interviewing cycle is completed, the data are sent to the CDC for editing. The
edited data are weighted by the CDC to the age-, race-, and sex-specific distribdions found in each
state, along with each respondent's probability of selection. Weighted data are then used to estimate
risk factor prevalence among the adult population of each state.
The 1993 BRFSS data were weighted to intercensal I992 population estimates for each state
and the District of Columbia. The overall state sample sizes in I993 ranged from 1,189 to 4,386.
(Appendix D contains a listing of all the states and the District of Columbia with their sample sizes.)
Because the CDC weighted each state's data using statewide population estimahs,
reweighting of the BRFSS data from the 12 states that have both Appalachian and non-Appalachian
sections was performed to reflect the population distributions unique to each section. In other words,
for each state, the aggregated surveys from the Appalachian counties were reweighted using the age,
sex, and race distributions for that region of the state, with the same procedure applied to the
aggregated surveys from those counties that make up the non-Appalachian region of the state.

Methodology =
The CDC originally weighted the 1993 l3RFSS data to a 1992 intercensal population that
provided age, sex, and race distributions on a statewide level, all that was needed for their purposes.
To reweight the data to a region within a state, county age, sex, and race distributions were essential;
however, for 1992, only total population estimates were available on a county level through. the Census
Bureau. It was therefore necessary to extrapolate 1992 county population distribution estimates.
Using 1990 census data, populations by age, sex, and race were aggregated for (1) counties in the
Appalachian region and (2) counties in the non-Appalachian region of each state to produce region-
specific age, sex, and race distributions. These distributions were then applied to aggregated 1992
county population estimates for each of the Appalachian and non-Appalachian regions in the 12 states,
yielding approximate counts of regional populations by age, race, and sex. These counts were
subsequently used in the reweighting process. Although all of West Virginia's 55 counties are
designated as lying within Appalachia, that state's data were also reweighted in order to make
comparisons between West Virginia and the other Appalachian states as valid as possible.
Determination of statistical. inference for data in this report was based on nonoverlapping 95%
confidence intervals. The BRFSS prevalences given are mid-point estimates derived from sample data,
around which 95% confidence intervals were constructed. A prevalence of 10.0% with a confidence
interval of plus or minus (CId 1.0% is interpreted as meaning that the reader can be 95% confident
that the true prevalence lies within 9.0% and 11.0%. However, the formula used to calculate the
confidence interval is highly sensitive to sample size. Large sample sizes yield small ("narrow19)
confidence intervals around the mid-point estimate; small sample sizes yield large ("wide") confidence
intervals. The wider the confidence interval, the less reliable the rate. Most of the comparisons in
this study are of sufficient sample size to be valid, but the Appalachian portions of several states lack

Chapter
sizable populations from which to draw a sample. In these instances, the reader is urged to use
caution. in interpreting the data.
This report includes the examination ofthe following risk factors: nonuse of seatbelts, obesity,
ovenveight, hypertension awareness, current smoking, binge drinking, heavy drinking, and drinking
and driving. The risk factor prevalences for the demographic variables under examination (age,
gender, education, and income) show the percentages of persons within that moua, not within the total
survey sample reporting that risk factor. This method of presentation facilitates identification of at-
risk popdations for health promotion efforts.
As used in this paper, the term "significant" refers t o statistical sipificance; the terms "more
likely" and "less likely" also indicate that the difference between prevalences was found to be
statistically significant.

Chapter Three
Between 1980 and 1990, the United States as a whole experienced a 9.8% increase in
population. The aggregated Appalachian counties, however, witnessed a growth of 1.6% over the same
decade, 56% of which was due to a massive population increase in only one county: Gwinnett County,
located outside of Atlanta, Georgia. This stagnation demonstrates the effect of the severe economic L C . I
and employment difficulties-faced by most ofthe Appalachian states during the 1980s. In 1990, 8.3%
(20,701,881) of the total U.S. population (248,709,873) lived in Appalachia.
Using the definitions for rural and urban used by the authors of
Mountains: Communitv-Based Coalitions for Cancer Prevention and Control (and described in
Appendix E), two-thirds (266) of the 399 Appalachian counties can be classified as rural. In terms of
population, in 1990 approximately 15% of the total Unikd States population lived in m a 1 counties,
compared to 32% of the Appalachian population. (See Exhibit 2.)
U.S. census data from 1990 were aggregabd by county. to create Appalachian and non-
Appalachian populations, allowing regional comparisons on the basis of gender, age, race, education,
and income. These selected demographics are presented in Table 1.


Results =
Table 1 Percentage of Selected Demographic Charactelristics
By Appalachian Residency U.S. Census, 1990
Per Capita Income (1989) % Below fgoverty Line (1989) % 65+ Below Poverty Line (1989)
% < High School Graduate
Distinct differences between the two regions can be seen for all the variables under
consideration. Appalachia has a higher percentage of women (52.8%) than non-Appalachia (51.1%), I
as well as an older population: 14.3% of its population was aged 65 and older in 1990, compared to
12.4% in non-Appalachia. The Appalachian counties are rnueh more homogeneous racially than the
rest of the country, with 91.8% of residents classified as white, compared to 79.2% elsewhere.
Appalachians are on average less educated and poorer than the rest of the country. A marked
difference can be noted in 1989 per capita income: $11, 704 in Appalachia, compared to $14,667 in
non-Appalachia. Only 14.3% of the Appalachian population over age 25 were college graduates in
1990, while 20.9% of persons living elsewhere had at least a bachelor's degree.

Chapter Three
BRFSS data for the behaviors under consideration were aggregated into two groups:
Appalachia and non-Appalachia. The variables of gender, age, education, and income level were
examined for each risk factor, and the responses from Appalachian residents were compared to those
from persons living outside of Appalachia.
Of all. the risk factors addressed in this paper, the most stsiking differences between
respondents living in and outside of Appalachia were found for seatbelt nonuse12 (Table 2). Nearly
one fouAh (24.1%) of all adult Appalachian residents reposted seatbelt nonuse, compared to 1'7.2% of
respondents living elsewhere, a sbtistically sipificant diEerence. This finding held for both men
(29.3% vs. 21.1%) and women (19.8% vs. 13.5%). Overall, and among women only, Appalachian
residents reported significantly higher rates of seatbelt nonuse in all demographic cakgories included
in the study, i.e., all age groups, educational levels, and household incorne levels. Signrificantly higher
prevalences of seatbelt nonuse were found for Appalachian men for all demographic categories except
men aged 55-64 and those having 13 or more years of education; while the sates were still higher
among Appalachian men than among their non-Appalachian counterparts in these groups, the findings
were not statistically significant. Figure f illustrates the differences in reported seatbelt nanuse
between Appalachian and non-Appalachian men and women by educational attainment, a strong
determinant of seatbelt use or nonuse.
'Used seatbelts "sometimes," "seldom," or "never" when driving or riding in motor vehicles,
'Six non-Appalachian states (Maine, Massachusetts, New Hampshire, North Dakota, South Dakota, and Vermont) and one Appalachian state (Kentucky) did not have seatbelt use laws in effect a t the time of the survey. West Virginia's seatbelt use law went into effect on September I, 1993.
Table 2
Prevalence (%) of Seatbelt Nonuse in Appalachia and Non-Appalachia By Gender and Selected Characteristics
Behavioral Risk Factor Surveillance System, 1993
"Prevalence in Appalachian counties is significantly higher (SH) ar significantly lower (SL) than in non-Appalacllian counties. A blank indicates no significant difference. **GI = 95% confidence interval. The midpoint prevalence (%) plus or minus the percentage indicated in parentheses comprises the range of values called the confidence
interval. Users can be 95% confident that the true prevalence lies within this interval.

Results =
The overall 1993 prevalence of obesity3 in Appalachia was found to be significantly higher
than the prevalence in non-Appalachia (31.7% vs. 30.0%), primarily due to the difference between total
obesity rates among women in the two regions (31.7% vs. 28.8%) (Table 3). Appalachian women
reported higher prevalences of obesity than women living in other parts of the country in every age
group; the rate among women aged 25-34 was significantly higher. (Figure 2 shows the differences
in prevalence of obesity by age between Appalachian and non-Appalachian w o m e ~ ) The rate of
obesity among women with household incomes in excess of $25,000 was also found to be significantly
higher among Appalachian residents than among other women. No statistically significant differences
were found by women's educational attainment. Little difference in rate of obesity was noted between
Appalachian and non-Appalachian men, either by age, education, or income level.
3At least 20% over the "ideal weight" for the person's height, calculated using the Metropolitan Life Insurance Company's 1959 Height and Weight Tables.

Table 3
Prevalence (%) of Obesity in Appalachia and Non-Appalachia By Gender and Selected Characteristics
Behavioral Risk Factor Surveillance System, 1993
"Prevalence in Appalachian counties is significantly higher (SH) or significantly lower (SL) than in non-Appalachian counties. A blank indicates no significant difference, **CI = 95% confidence interval. The midpoint prevalence (96) plus or minus the percentage indicated in parentheses comprises the range of values called the confidence
interval. Users can be 95% confident that the true prevalence lies within this interval.


Chapter Three
The same patterns emerged in overweight4 prevalence as were noted in obesity rates (Table
4). The total prevalence of overweight among Appalachian residents was significantly higher than
that among non-Appalachian residents (27.4% vs. 25.592~1, again due in large part to significantly
higher rates among women (26.9% vs. 24.2%). Overall, the prevalence of overweight among persons
with 12 years of education and among college graduates was significantly higher in the Appalachian
counties (see Figure 3). Women aged 25-44 were more likely to be overweight if they lived in
Appalachia, as were female high school graduates.and women with household incomes greater than
$25,000. In both regions, the rate among males increased with age up t o age 65. Although men in
Appalachia reported higher rates of overweight than other men in all age groups except 45-54, none
of the differences was found t e be statistically significant. Overweight prevalence decreased with
increased educational attainment and increased income level among men living in both regions, but
no significant differences emerged.
'10% - 19% over the "ideal weight" for the person's height, calculated using the Metropolitan Life Insurance Company's 1959 Height and Weight Tables.

Table 4
Prevalence (%) of Overweight in Appalachia and Non-Appalachia By Gender and Selected Characteristics
Beha.cviora1 Risk Factor Surveillance System, 1993
"Prevalence in Appalachian counties is significantly higher (SW) or significar~tly lower (SL) than in non-Appalachian counties. A blank indicates no significant difference. **GI = 95% confidence interval, The midpoint prevalence (%) plus or minus the percentage indicated in parentheses comprises the range of values called the confidence
interval. Users can be 95% confident that the true prevalence lies within this interval.


Results =
Little difference was noted in the 1993 prevalence of hypertension awareness5 among
respondents living in Appalachia and those living in other parts of the country, although the rate was
slightly higher among Appalachians (22.1%) than among non-Appalachians (21.4%). Hypertension
prevalence increased with age and generally decreased with higher education and income among
residents of both regions (Table 5). Appalachian women aged 35-44 were significantly more likely than
other women to report having been told they had high blood pressure, and significantly higher rates
of hypertension were also reported by Appalachian men with incomes of less than $10,000. On the
other hand, both rnen and women with 13-15 years of education who lived in Appalachia were less
likely to repod hypedension than their counterparts elsewhere.
'Answered "yes" to the question "Have you ever been told by a doctor, nurse, or other health professional that you have high blood pressure?"

Table 5
Prevalence (%) of Hypertension in Appalachia and Non-Appalachia By Gender and Selected Characteristics
Bel~avioral ~ i s k Factor Sunreillance System, 1993
*Prevalence in Appalachian munties is significantly higher (SH) or significantly lower (SL) than in non-Appalachian counties. A blank indicates no significant difference. **CI = 95% confidence interval, The midpoint prevalence (96) plus or rninus the percentage indicated in parentheses comprises the range of values called the confidence
interval. Users can be 95% confident that the true prevalence lies within this interval.

Results =
The overall prevalence of current smoking6 was found to be significantly higher in Appalachia
than in non-Appalachia (24.2% vs. 21.9%) (Table 6). This finding held for both men (25.5% vs. 23.5%)
and women (22.9% vs. 20.4%). Overall, and among women, persons aged 25-44 and 55-64 were more
likely to report current smoking if they lived in Appalachian counties. (Figure 4 illustrates differences
in smoking rates found by age between Appalachian and non-Appalachian residents.) Respondents
in both regions reported consistently lower rates of smoking with increased education and income
levels, but smoking rates were significantly higher in Appalachia than elsewhere among high school
dropouts and lower-income (<$10,0001 respondents. Among women only, those with family incomes
of $10,000-$24,999 were more likely to smoke if they lived in Appalachia.
%ad smoked at least 100 cigarettes in lifetime and currently smoked regularly.
29

Table 6
Prevalence (%) of Current Smoking in Appalachia and Non-Appalachia By Gender and Selected Characteristics
Behavioral Risk Factor Surveillance System, 1993
*Prevalence in Appalachian counties is significantly higher (SH) or significantly lower (SL) than in non-Appalachian counties. A blank indicates no significant difference. **CI = 95% confidence interval. The midpoint prevalence (%) plus or minus the percentage indicated in parentheses comprises the range of values called the confidence
interval. Users can be 95% confident that tile true prevalence lies within this interval.

Chapter Three
The overall 1993 prevalence of heavier drinkingr was significantly lower in Appalachia than
in non-Appalachia (2.8% vs. 3.5%) (Table 7). Significantly lower rates were noted for both men (5.0%
vs. 6.2%) and women (0.7% vs. 1.0%). By age, Appalachian women aged 45 and older were less likely
than their counterparts in other regions to report heavier drinking, as were Appalachian men aged
55 and older. Appalachian men whose educational attainment was 12 years or less also reported
significantly lower rates of heavier drinking than other men with the same education. An interesting
finding emerged with heavier drinking and household income levels. Men residing in Appalachian
counties whose family incomes were less than $10,000 annually were more likely than those in other
counties to report heavier drinking; Appalachian men living on $10,000 or more, on the other hand,
were less likely than other respondents t o do so. These findings are shown in Figure 5.
'Consumed 60 or more drinks dnring the month prior to the interview.

Table 7
Prevalence (7%) of Heavier DriAing in Appalachia and Non-Appalachia By Gender and Selected Characteristics
Behavioral Risk Factor Surveillance System, 1993
*Revalence in Appalachia is significantly higher (SH) or significantly lower (SE) than in uon-Appalachia. A blank indicates no significant difference. **CI = 95% confidence interval. The prevalence (%) plus or minus the percentage indicated in parentheses comprises the range of values called the confidence interval. Users can be
95% confident that the true prevalence lies within this interval.


Results =
The overall prevalence of binge drinking among BRFSS respondents in 1993 was found to
be significantly lower in Appalachia than in non-Appalachia (11.6% vs. 14.6%) (Table 8). By gender,
each of the sexes also reported significantly lower rates than their counterparts outside of Appalachia.
The prevalence among men living in Appalachia was 17.9%, compared to 22.2% among non-
Appalachian men; the rate among Appalachian women was 5.6%, compared to 7.6% among women
elsewhere. W i l e not always true for each sex alone, total prevalences for binge drinking among
Appalachian residents were significantly lower than those for respondents living outside of Appalachia
for every age group except the youngest (18-24). Appalachians were also significantly less likely to
report binge drinking in all. education categories (except individuals with college degrees) a d all
income levels. Total binge drinking prevalences by age for Appalachia and non-Appalachia are
presenhd in Figure 6.
8Consurned five or more drinks on at least one occasion during the month prior to the interview.
35


Chapter Three
The total prevalence of drinking and driving9 in Appalachia was significantly lower than that
reported in non-Appalachia (1.9% vs. 2.5%) (Table S), as was that among Appalachian men (2.9% vs.
4.2%). Overall, Appalachian respondents aged 18-24 and 551 were less likely to report drinldng and
driving than those of the same ages who lived outside of Appalachia. The rate of driving under the
inRuence was also significantly lower among Appalachians with 13-15 years of education, as well as
among those with household incomes of less than $10,000. Among women only, high school dropouts
in Appalachia were less likely to report drinking and driving than their counterparts elsewhere; among
men only, high school graduates living in Appalachia were less likely to drink and drive than those
in other parts of the country,
'Drove "after having perhaps too much to drink" at least once during the month prior to the interview.
38


Chapter Three
Total prevalences for five of the eight risk factors examined in this report were higher in
Appalachia than in non-Appalachia: seatbelt nonuse, obesity, overweight, hypertension awareness, and
current smoking (Figure 7 ) . When tested for statistical significance, all these differences in prevalence
were found to be significant except that for hypertension awareness. Three risk factor prevalences
were f o n d t o be lower in Appalachia than elsewhere: heavier drinking, binge drinking, and drinking
and driving. All these Werences were found to be statistically significant.
Figure 8 presents total risk factor prevalences reported by men Little difference in prevalence
was noted for obesiQ, overweight, or hypertension when men living in kppalacka were compared to
those living in other areas of the country. Appalachian men were more likely than other men,
however, to report seatbelt nonuse and current smoking; both of these were found t o be statistically
sipificant differences; Significantly lower rates of drinking behaviors were reported by men in
Appalachia than by male respondents elsewhere,
it4 Total risk factor prevalences reported by women only are shown in Figure 9. Agpalachian
women reported significantly higher prevalences of seatbelt nonuse, obesity, overweight, and current
smoking than women who lived outside of Appalachia. Hypertension awareness was somewhat higher
among Appalachian women than among other women, but this difference was not statistically
significant. Significantly lower rates of heavier and binge drinking were found among Appalachian
women, while little difference was reported between Appalachian and non-Appalachian women for
drinking and driving,

2? 2 Cn
*-
K..


Chapter Four
DISCUSSION
Chapter Three presented the results of a comparison of eight unhealthy behaviors as reported
by adult residents of A~palachia and non-Appalachia. A distinct pattern emerged from the data:
flverall, &palachian residents are at signiGmmltly higher risk of in;jmsy and iIllness fmm
seatbelt nonuse, obesity, overweight, and smoking and at significantly lower risk for i~
m d i h e s s Erom heavier driraGng, bhge elri ng, and drinrEng agld driving than mn-
Appalaclhism residents. (Although the prevalence of hypertension was greater in Appalachia than
in non-Appalachia, the difference was not found to be statistically significant.)
Not a11 the me-des ipa ted Appalachian states fit this patkm, however. Risk factor rates
varied across the region; as we have noted, Appalachia includes 13 states with a wide range of
economies, nationalities, topographies, and lifestyles. Table 10 presents prevalences for the
Appalachian regions of each of the 13 states. Exhibits 3 through 10 compare regional risk factor
prevalences to the overall Appalachian and non-Appalachian averages.
For example, as Exhibit 3 illustrates, the prevalences for seatbelt nonuse reported in the
Appalachian regions of Pennsylvania, Ohio, West Virginia, Kentucky, Georgia; and Mississippi were
higher than the Appalachian average (24. I%), those in New York, Virginia, and Tennessee were lower
than the Appalachian average but still higher than the non-Appalachian average (17.2%), and those
in North Carolina, South Carolina, and Alabama were lower than the non-Appalachian average.
Conversely, as shown in Exhibit 8, heavier drinking prevalences were lower than the &palachian
average (2.8%) in Ohio, West Virginia, Kentucky, Virginia, Tennessee, Mississippi, Mabama, and
Georgia, were higher than the Appalachian average but still lower than the non-Appalachian

Chapter Four
average (3.5%) in North and South Carolina, and were higher than the non-Appalachian average in
Pennsylvania and New Uork.
Table 10
Prevalence (%) of Eight Risk Factors by Appalae %&on of Each State Behavioral Risk Factor Surveillance System, 1993
*Prevalence in aggregated Appalachian countiefi (A) is significantly higher or lower than prevalence in aggregated non-Appalachian counties (NA).


L
c a> -2 g I = - - C g 5 ." z 9 5 cTL!X& C L b
a cc! C Q C T - Q + CCIz<i:z F a g a l
Q j C Cr) 2 E c E o g CCI 9 .- i m 5 m


Discussion =
Exhibits 11 and 12 illustrate how the Appalachian portion of each state compares to the
Appalachian Behavioral Profile established through our study results: Overahl, Appalaclhian
residents are (I) at signnificantly higher risk sf inj and illness fkorn seatbelt nonuse,
obesity, overweight, and srnoGng anrd (2) at significantly lower risk of i ~ u 9 y and illness
&om heavies dri ng, binge drinking, a d adri&ng and &living thasl non-bpalacfian
residents.

Chapter Four
Ofthe five risk factors for which Appalachian residents reported higher prevalences, four were
found to be simificantls higher: seatbelt nonuse, obesity, overweight, and smoking. The Appalachian
regions of three states reported rates that were higher than the non-Appalachian average rate for all
four risk factors: Kentucky, Pennsylvania, and West Virginia (Exhibit 11).
Exhibit 1 1
Four Higher Risk Factors," 1993 Appalachian Regions Compared to
Non-Appaiachian Average
4 risk Qctors higher than non-&palachian average
non-Appalachian average
0-1 risk factors higher than
nonuse, obesity, overweight, and current sm%ng

Discussion --
Appalachian residents as a whole reported significantly lower rates for all three drinking
behaviors measured by the BRFSS: heavier drinking, binge drinking, and drinking and driving. Nine
of the 13 states (Alabama, Georgia, Kentucky, Maryland, Mississippi, North 'carolha, Tennessee,
Virginia, and West Virginia) posted rates for all three behaviors that were lower than the non-
Appalachian prevalence (Exhibit 12).
1 i
Exhibit 12
Three Lower Risk Factors,' 1993 Appalachian Regions Compared to
"Heavier drinkin
Non-Appalachian Average
3 risk factors lower than non-Appalachian average
non-Appalachian average
3 risk factors higher than
~ g , binge drinking, and drinking and driving
Chapter Four
Each of the 13 Appalachian states was given a total consistency score determined by the
number of risk factor prevalences reported by that state that were consistent with the findings for
Appalachia as a whole (i.e., a prevalence for seatbelt nonuse, obesity, overweight, or smoking that was
higher than the non-Appalachian rate and a prevalence for heavier drinking, binge drinking, or
drinking and driving that was lower than the non-Appalachian rate). These results are presented in
Table 11.
Appalachian BRFSS respondents in Kentuckg? and West Virginia reported prevalences for all
seven risk factors that were consistent with the overall pattern.. The Appalachian podions of
Mississippi and Tennessee came very close to fitting the pattern, each having six risk factor
prevalences consistent with the profile. 'ghe Appalachian couhnties in Alabama, New York, and
Maryland posted risk factor rates that were the most inconsistent with the Appalachian Behavioral
Profile. Exhibit 13 illustrates how the risk factor prevalences reported by the Appalachian re@ons
of each state compare to the overall profile.

Table 11
Number of Risk Factor Prevalences Consistent with Overall Appalachian Behavioral Profile* Appalachian Re&ons by State
Behavioral Risk Factor Surveillance System, 1993
North Carolina
South Car-olina
X = Risk factor prevalence consistent with Appalachian profile
*Greater risk from seatbelt nonuse, obesity, overweight, and current smoking among Appalachian respondents than among non-Appalachian respondents. Lower risk from heavier drinking, binge drinking, and drinking and driving among Appalael~inn respondents than among non-Appalachian respondents.


Discussion --
Selected socioeconomic characteristics associated with the risk factors under consideration are
presented in Table 12. (Additional demographic information for each state is included in Appendix
B.) Per capita income, percent of population living below the poverty line, and the percent of adult
population lacking a high school education are shown by state (i.e., the Appalachian portion thereof).
The four states most consistent with the overall behavioral profile, Kentucky, West Virginia,
Mississippi, and Tennessee, ranked among the six states with the highest prevalences in all three
categories. These states had a large proportion of Appalachian residents living in designated rural
counties in 1994 (see Exhibit 2). The three states most inconsistent with the overall behavioral profile,
Alabama, Maryland, and New York, ranked in the seven states with the lowest prevalences in ali
three categories. These states had a large proportion of Appalachian residents living in designated
urban counties in 1994.
Table 12 Selected Socioeconomic Characteristics and Total Consistency Wtafing
Appalachian Regions by State
*Consistency with overall Appalachian Behavioral Profile (see Table 10)
61.

Chapter Four
It is beyond the scope of our report to offer strategies to improve the health status of
Appalachia. At best, we have provided some insight into the demographics and behaviors of a
minority group within the U.S. population that is at special risk for certain chronic health problems.
We sincerely hope that the data provided in this document will be useful to health planners,
policymakers, and researchers a t all levels in their efforts t o encourage and promote healthier lifestyle
choices among Appalachian residents.

Appalachia Leadership Initiative on Cancer. Sowing Seeds in the Mountaim: Community-Based Coalitions for Cancer Prevention and Control. NIH Publication No. 94-3779. Bethesda, Maryland: National Cancer Instituk, 1994.
Appalachian Regional Development Act o f 1965.
Appalachian Regional Commission. Annual .Report 1993. Washington, D.C.: Appalachian Regional Commission, 1994.
Appalachian Regional Commission. Appalachia: Twenty Years of Progress. Washington, D.C.: Appalachian Regional Commission, 1985.
Batteau, AW. The Inuention of mpalachia. Tucson: The University of Anizona Press, 1990.
Glen, ME, ed. Appalachia in Transition, St. Louis, Missouri: The Bethany Press, 1970. .. .
Waksberg, Joseph. "Sampling Methods for Random Digit Dialing." J. American Statistical Association. 73 (March 1978): 40-47.
Weller, JE. Yesterday's People: Life in Contemporary Appalachia. Lexington, Kentucky: The University of Kentucb Press, 1965.
West Virginia Department of Health and n Resources. h e r i c a n Stop Smoking Intervention Study fir Cancer Prevention (ASSET), nical ProposaL. Charleston, : West Virginia Depastment of Health and Human Resources, Bureau of Public Health, 1990.


Appendixes


Appendix A
APPALACHIm STATES VS. NON-APPALACMIlPN STATES
In the first stage of our study, prevalence data for the eight risk factors were aggregated by
(1) residency in Appalachian states (those states having one or more Appalachian counties) and (2)
residency in non-Appalachian states (those states not having any counties designated as Appalachian)
(Table A-1). Prevalences reported for seatbelt nonuse and current smoking were found to be
significantly higher in the Appalachian states as a group than in the rest of the country, The rates
for heavier drinking, binge drinking, and drinking and driving were found to be significantly lower
in the Appalachian states than in the non-Appalachian states. No significant differences in prevalence
were found between the two regions for obesity, overvveight, or hyperltension awareness.
Table A-2
*49 States and the District of Columbia (excludes Wyoming) ""Prevalence in Appalachian states is significantly higher (SH) or significantly lower (SL) than in
non-Appalachian states. A blank indicates no significant difference. ***CI = 95% confidence interval. The midpoint prevalence (%) plus or minus the percentage indicated
in parentheses comprises the range of values called the confidence interval.


Appendix B
STATES: APPALACHIAN COUNT1 ES VS. NON-APPALACHl[AN COUNTIES
The third stage of the present study involved the comparison of regions within the states
containing one or more Appalachian counties. The intrastate regions designated as Appalachian range
in size from all of West Virginia's 55 counties to only three of Maryland's 23 counties (and 4.7% of
Maryland's total population). Close to two-thirds (62.6%) of Alabama's population live in Appalachian
counties, compared to 6.1% of the residents of New York.
The tables that follow present demographic and risk factor prevalence comparisons between
the Appalachian and non-Appalachian regions of each of the 12 states having such regions. West
Virginia's demographics were compared to those of the United states as a whole; no risk factor
prevalence compafisons were possible for West Virginia.
Because of the small samples interviewed in certain of the states Tacking sizable Appalachian
populations (and the correspondingly wide confidence intervals resulting from such small numbers of
events), the reader is advised t o use caution in interpreting regional differences in risk factor
prevalences (see Chapter Two: Methodology for a discussion of the limitations of small sample sizes).

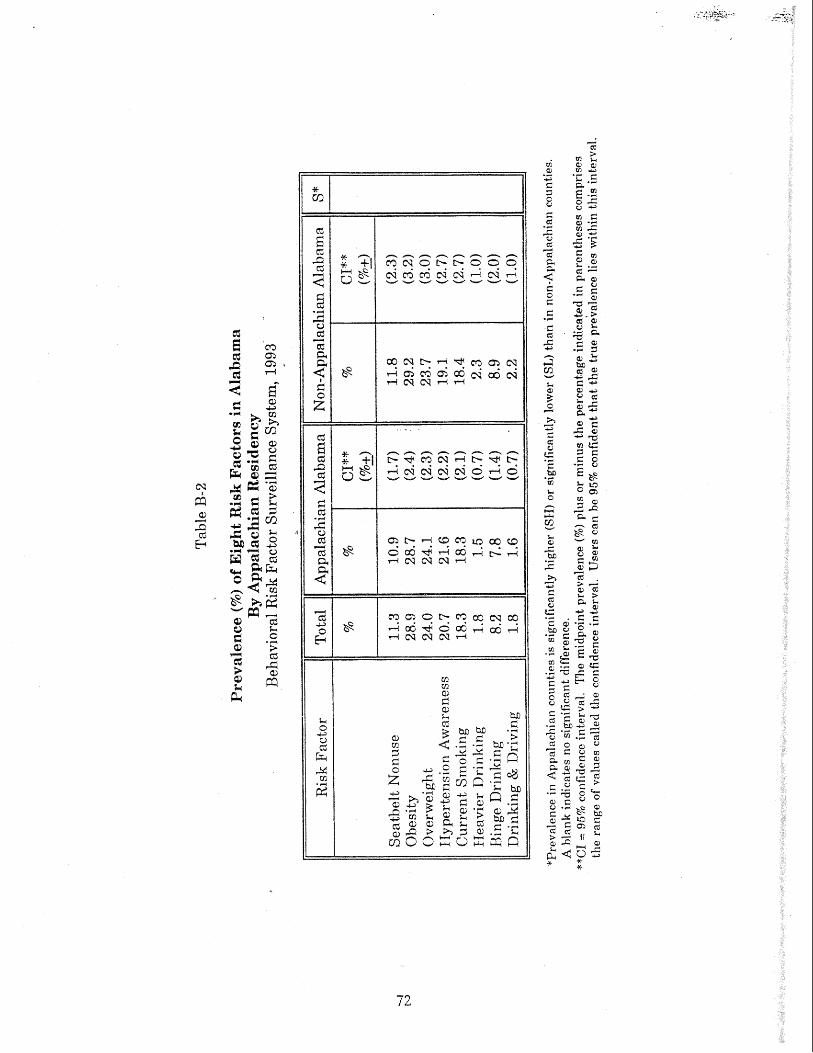
ALAB
Nearly two-thirds (62.6%) of Alabama's population lives in the Appalachian
portion of the state (Table B-I). Alabama's total population is somewhat older than the U.S.
population as a whole, with 12.9% of the state's residents aged 65 or older, compared to 12.6% for the
nation. The Appalachian portion of Alabama has a slightly higher percentage of older residents than
does the non-Appalachian portion (13.0% vs. 12.8%). Appalachian Alabama has a greater propodion
of white citizens (79.1% compared to 64.5%) and a higher average per capita income ($11,993 vs.
$10,638) than the rest ofthe state. Fewer of Alabama's Appalachian residents live below the poverty
line than do their non-Appalachian neighbors.
Risk Factor Prevalence. Little difference in prevalence between residents of the Appalachian
and non-Appalachian counties was noted for seatbelt nonuse, obesity, overweight, hypertension, or
current smoking (Table B-2). Lower rates of all three alcohol behaviors were reported by persons who
lived in Appalachian Alabama; however, none of these differences was statistically significant.

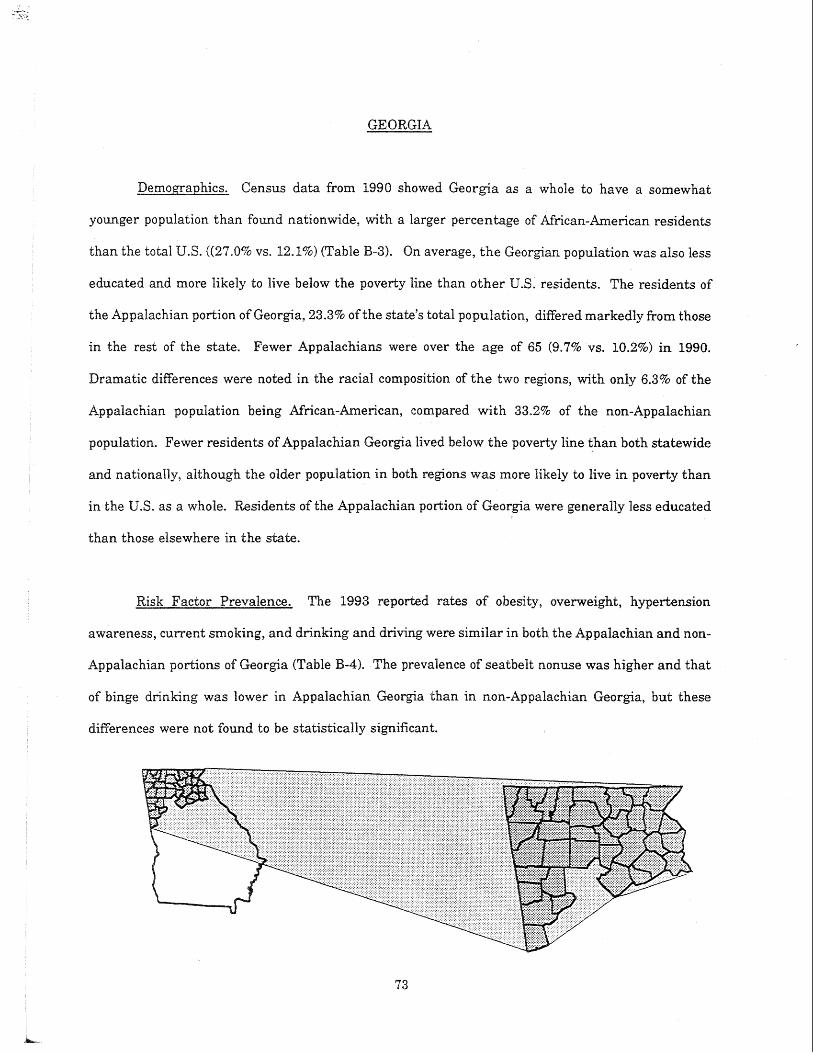
GEORGIA
Census data from 1990 showed Georgia as a whole to have a somewhat
younger population than found nationwide, with a larger percentage of African-American residents
than the total U.S. ((27.0% vs. 12.1%) (Table B-3). On average, the Georgian population was also less
educated and more likely to live below the poverty line than other U.S. residents. The residents of
the Appalachian portion of Georgia, 23.3% of the state's total population, differed marjkedly from those
in the rest of the state. Fewer Appalachians were over the age of 65 (9.7% vs. 10.2%) in 1990.
Dramatic differences were noted in the racial composition of the two regions, ~ 4 t h only 6.3% of the
Appalachian population being African-American, compared with 33.2% of the non-Appalachian
population. Fewer residents of Appalachian Georgia lived below the poverty line than both statewide
and nationally, although the older population in both regions was more likely to live in poverty than
in the US. as a whole. Residents of the Appalachian podion of Georgia were generally less educated
than those elsewhere in the state.
Risk Factor Prevalence. The 1993 repohd rates of obesity, overweight, hypedension
awareness, current smoking, and d ~ n k i n g and driving were similar in both the Appalachian and non-
Appalachian portions of Georgia fl"Tble B-4). The prevalence of seatbelt n o m e was higher and that
of binge drinking was lower in dlppalachian Georgia than in non-Appalachian Georgia, but these
differences were not found to be statistically significant.


Table B-4
Prevalence (96) of Eight Risk Factors in Georaa By Alppalachian Residency
Behavioral Risk Factor Suweillance System, 1993
*Prevalence in Appalachian counties i s significantly higher (SH) or significantly lower (SL) than irr non-Appalaeltian counties. A blank indicates no significant difference.
**CI = 95% confidence irlterval. The midpoint prevalence (%) plus or minus the percentage irldicated in parent,l~eses comprises the range of values called the confidence interval. Users can be 95% corifident that the true prevalence lies within this interval.

In 1990, 28.4% of Kentucky's population lived in the state's Appalachian
counties. In that year, Kentucky's total population had a greater proportion of white residents, a lower
per capita income, less education, and was more likely to live in poverty than the United States
population as a whole (Table B-5). These differences were even more pronounced among Appalachian
residents. Ninety-eight percent (98.1%) of residents of Appalachian Kentucky were white, compared
to 89.6% of those in non-Appalachian Kentucky. Per capita income in the Appalachian portion of
Kentucky was $8,412 in 1989, with nearly three out of every 10 residents (29.0%) living in poverty,
more than twice the national average (13.1%). Almost one-half (48.5%) of Appalachian. Kentuckians
over the age of 25 had not graduated from high school according to census data, compared to 30.0%
of residents living elsewhere in the state and 24.8% nationwide.
Risk Factor Prevalencc5. Statistically significant diff-krences were found between residents in
the Appalachian and non-Appalachian regions of Kentucky for six of the eight risk factors (Table B-6).
Reported prevalences of seatbelt nonuse, overweight, hypertension awareness, and current smoking
were significantly higher in the Appalachian counties than in other cowties in the state. Conversely,
rates sf heavier drinking and binge d ~ n k i n g were significantly lower among Appalachian residents
of Kentucky than among other residents.


Demographics. In 1990, only 4.7% of Maryland's population lived in the three counties
designated as belonging to Appalachia by the ARC. Nonetheless, considerable demographic differences
emerged when this portion of Maryland was compared to the remainder of the state (Table B-7).
Appalachian Maryland had a larger proportion of residents over age 65 than the rest of the state
(15,4% vs. 10.6%), a greater percentage of whom lived in poverty (13.8% vs. 10.3%). Only 4.0% of the
Appalachian population was African-American, compared to 25.9% elsewhere in Maryland. The 1989
per capita income was much lower in the Appalachian portion of the state ($12,086 vs. $18,008), as
was the average level of education. While 21.1% of adults over the age of 25 in non-Appalachian
Maryland were high school dropouts, three of every 10 adults (30.3%) in the Appalachian counties had
not graduated. Only 11.3% of Appalachians had college degrees, compared to 27.2% of other state
residents.
Risk Factor Prevalence. Given the small BRFSS sample size inkmiewed in the Appalachian
counties of Maryland, the confidence intervals surrounding o w midpoi& prevalences were very wide,
making comparisons with the non-Appalachian sample difiedt. Because of this, even though several
risk factor prevalences reported by Appalachian respondents appear markedly lower than those
reported by noniAppalachian respondents, significant differences were found only for overaveight and
hypertension awareness (Table B-8). Conversely, although the rates of binge drinking and drinking
and driving appear to be considerably higher among Appalachian residents than among non-
Appalachian residents, these differences were not statistically significant.


MISSISSIPPI
Demomaphics. Twenty percent (19.8%) of Mississippians lived in the state's Appalachian
counties in 1990. Mississippi's population as a whole differed substantially in several ways from the
total U.S. according to the 1990 census, being generally poorer and less educated and having a larger
percentage of African-American citizens (Table B-9). The Appalachian population had a somewhat
higher percentage of residents aged 65 and older than the rest of the population (13.3% vs. 12.3%) and
a much lower proportion of African-American residents (28.7% vs. 37.3%). While, overall, a smaller
percentage of Appalachians lived below the poverty line than did non-Appalachians (22.6% vs. 25.9%),
a slightly higher percentage of Appalachia's elderly lived in poverty (31.8% vs. 28.8%). Adults in
Appalachian Mississippi were less likely to have finished high school than adults in the rest of the
state.
Risk Factor Prevalence. Little difference was noted between respondents in the Appalachian
and the non-Appalachian regions of Mississippi for seven of the eight risk factors in o u r study (Table
B-10). A substantial difference in prevalence emerged for only one risk factor: Mississippians from
Appalachia more frequently reported seatbelt nonuse while driving or riding in a car than respondents
from non-Appalachian Mississippi (41.1% vs. 34.4%), but this was not found to be statistically
significant.


NEW YORK
Demographics. Only 6.9% of New Uork's population was defined as Appalachian in 1990. New
York's total population in that year was somewhat older, more racially diverse, more likely to be
college educated, and slightly less likely to live in poverty than the U.S. population as a whole (Table
- 9 Residents of the Appalachian portion of New York, however, differed in several ways from
residents elsewhere in the state. While Appalachian New York reported a higher percentage of
persons aged 65 and older (14.0% vs. 13.1%), the elderly in Appalachia were less likely to live below
the poverty line than those in non-Appalachian New York. A much higher percentage of the
population in the state's Appalachian counties was white than in the rest of the state (96.1% vs.
73.0%). A marired difference was found in 1989 per capita income: $12,034 in Appalachia compared
to $16,789 in non-Appalachia. While fewer adults were high school dropouts in the Appalachian
counties, there were also fewer college graduates.
Risk Factor Prevalence. New Yorkers who lived in Appalachian counties reporkd slightly
lower rates of seatbelt hionuse and obesity than those residing in the rest of the state, as well as a
similar rate of overweight (Table B-92). Reported prevalences of hypertension awareness, current
smoking, heavier drinking, binge drinking, and drinking and driving were higher in the Appalachian
portion of New York; of these, the differences for heavier drinking and binge drinking were found to
be statistically significant. In general, Appalachian residents of New York showed little in common
with other Appalachians in patterns of risk factor prevalence.

Table B-11
Percentage of Selected Demographic Characteristics in New York By Appalachian Residency
U.S. Census, 1990
Per Capita Income (1989) 5% Below Poverty Line (1989)
School Graduate

Table EI-12
Prevalence (76) of Eight Risk Factors in New Yorh By Appalachian Residency
Behavioral Risk Factor Surveillance System, 1993
Seatbelt Nonuse
Current Smoking Heavier Drinking
"Prevalence in Appalachian counties is significantly higller (SfI) or significantly lower (SL) tlran in non-Appalachian counties. A blank indicates no significant difference.
**CI = 95% confidence interval. The midpoint prevalence (%I plus or minus t;he percentage indicated in parentheses comprises the range of values called the confidence interval. Users can be 95% co~rfident that the true prevalerlce lies within this interval.

NORTH CAROLINA
Demographics. Approximately one in every five (19.7%) North Carolinians in 1990 lived in the
portion of the state designated as Appalachian (Table B-13). In general, Appalachian residents in
North Carolina were older, with 114.9% of the Appalachian residents aged 65+, compared to 11.5% in
the rest of the state. Fewer African-hericans lived in Appalachian North Carolina, accounting for
9.1% of the population compared to 25.1% elsewhere in the state, Little difference was noted in per
capita income between residents of the Appalachian and non-Appalachian counties; North Carolinians
living in both regions were on average less educated than those in the U.S. as a whole.
, .
Risk Factor Prevalence. Seatbelt nonuse in I993 was significantly higher among Appalachian
North Carolinians &an among BRFSS respondents elsewhere in the state (14.0% vs. 9.2%) cable B-
514). Obesity and overweight, on the other hand, were significantly lower among residents of North
Carolha's Appalachian counties. Both ltbypertension awareness and current smoking were higher
among Appalachim respondehlts, but these differences were not statistically significant. Little
difference was nokd between respondents in the two regions in the prevalence of any of the three
drdnking behaviors.


OHIO
Demographics. Approximately one in eight (12.7%) Ohioans lived in Appalachia in 1990.
According to census information, Appalachian Ohio had a slightly higher percentage of older residents
than non-Appalachian Ohio (Table B-15). While the percentage of the population in Ohio's non-
Appalachian counties that was African-American was close to that nationwide, the percentage in
Appalachian Ohio was much smaller (2.1% vs. 11.9%). Per capita income in 1989 was markedly lower
in the Appalachian counties than in the rest of Ohio ($10,468 vs. $13,8951, and more people were
living below the poverty line (17.4% vs. 11.8%). Proportionally, Appalachian Ohio also had more
adults over the age of 25 who were high school dropouts than did non-Appalachian Ohio (30.8% vs.
23.4%), as well as fewer college graduabs (9.8% vs. 18.0%).
Risk Factor Prevalence. Nigher risk factor prevalences were reported by BRFSS respondents
Iisring in Ohio's Appalachian counties than elsewhere in the state for seatbelt Donuse, obesity,
ovenweight, current smoking, binge drinking, and drinking and driving, while lower r a k s were
repol-ted for hypertension awareness and heavier drinking (Table B-16). Only the difference in heavder
drinking prevaIence between Appalachian Ohioans and non-Appalachian Ohioans, however, was found
to be statistically significant (0.3% vs. 2.7%).


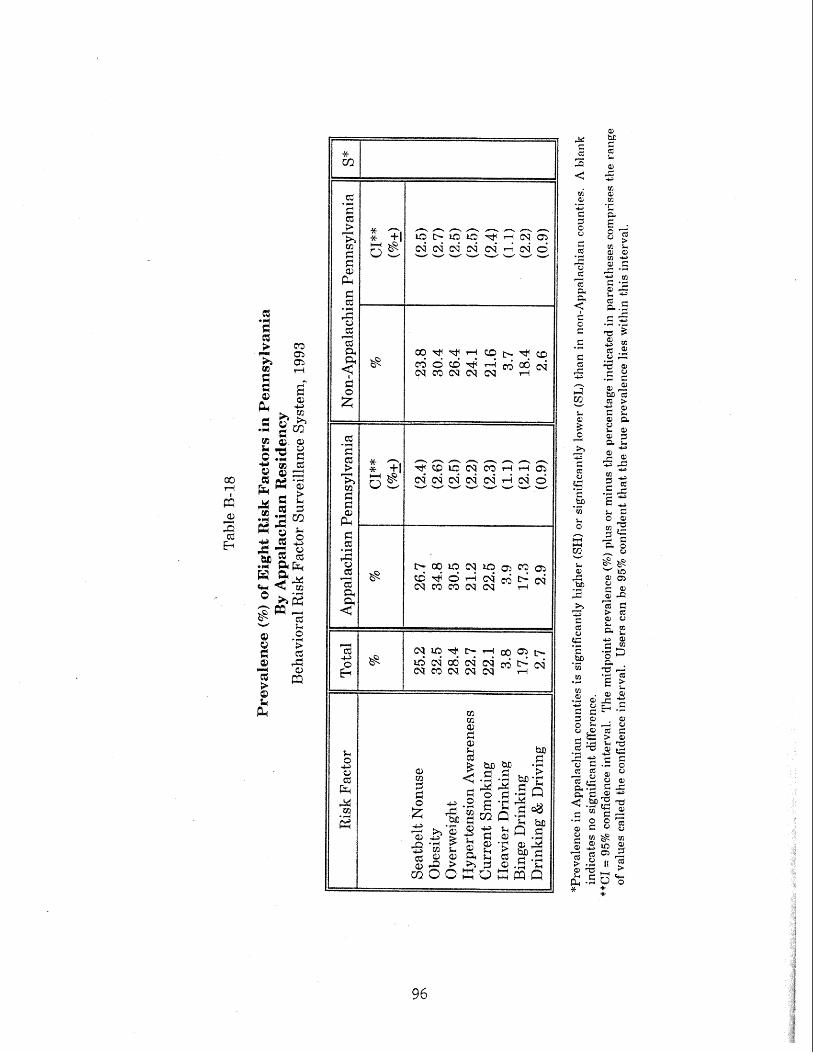
PENNSYLVANIA
Nearly ane-half (48.6%) of Pennsylvania's total population in 1990 lived in
counties designated as Appalachian (Table B-17). The demographics for Appalachian Pennsylvarnia
were found to differ from those for non-Appalachian Pennsylvania in several ways. The population
in the Appalachian counties was generally older than that in the rest of the state and had a mwh
smaller percentage qf African-Americans (4.0% vs. 14.0%). The 1989 average per capita income was
lower in Appalachia ($12,351 vs. $15,683), and more people were living in poverty (12.5% vs. 9.9%).
While the two regions had similar proportions of high school graduates, Appalachia had fewer college
graduates (15.2% vs. 20,6%). ., .
Risk Factor Prevalence. BRFSS respondents living in the Appalachian podion of Pexursylvania
reported higher 1993 prevalences of seatbelt nonuse, obesity, overweight, eumemt smoking, h e a ~ e r
drinking, and drinking and driving than other Pennsylvanians and lower prevalences of hypertension
awareness and binge drinking (Table B-18). None of these differences was f o u d t o be sktistically
significant. -

gj P I + g + 4 .- g u, g.." 2 **'t;: cr;J Q a = 2 e: .G
E 2 4 *2 3 2 % k
- 2 2 c , a :: *H e4 ti e7;;1 " A % 4 -2
AF1= p a - w E

SOUTH CAROLINA
Demoma~hics. Approximately one in four (25.5%) South Carolinians lived in the Appalachian
portion of their state in 1990 (Table B-19). Overall, the state's population was somewhat younger, had
a higher percentage of African-Americans, and was poorer and less educated than the national
average. The Appalachian counties of South Carolina had a smaller proportion of African-Americans
(16.9% vs. 34.3%), a slightly higher per capita income ($12,634 vs. $11,645), and fewer residents living
below the poverty line (11.6% vs. 16.7%) than the rest of the state. Educational levels in the two
regions were similar.
Risk Factor Prevalence. Adults living in the Appalachian counties of South Carolina reported
slightly lower rates of seatbelt nonuse and binge drinking in 1993 than their non-Appalachian
neighbors (Table B-20). Slightly higher prevalences were reported by Appalachians for hypertension
ent smoking, and heavier drinking. Similar rates were reported in both regions for
obesity, ovenveight, and drinking and driving. No statistically significant differences were found.


TENNESSEE
According t o census data, 44% of all Tennesseans lived in the state's
Appalachian counties in 1990 (Table B-21). Appalachian residents of Tennessee diEered from their
non-Appalachian neighbors in several ways. Appalachians were generally older (13.7% aged 65+ vs.
11.9%), more likely to be white (93.6% vs. 74.7%), and less likely to have a minimum of a high school
education (63.9% vs. 69.7%). The average 1989 per capita income among persons living in Tennessee's
Appalachian counties was $11,586, compared to $12,78 1 among other state residents.
Risk Factor Prevalence. Slight differences were noted in the 1993 BRFSS prevalences between
Appalachian residents of Tennessee and those living in non-Appalachian counties (Table B-22). The
only difference that was statistically significant was found for drinking and driving: Appalachian
Tennesseans were significantly less likely to report driving when they had had too much to drink than
were non-Appalachian Tennesseans (0.3% vs. 1.3%).


Approximately eight percent (8.4%) of Virginians lived in counties designated
as Appalachian in 1990 (Table B-23). Dramatic differences, however, were found in the demographic
characteristics of this small segment of Virginia's population when i t was compared to the rest of the
state. Nearly fifteen percent (14.6%) of Appalachians were aged 65 or older, compared to 10.4% of the
other residents. Ninety-seven percent (97.0%) of the Appalachian population was white; only 75.7%
of the rest of Virginia's population was white. The per capita income in the Appalachian counties was
substantially lower than that in other counties 1$10,108 vs. $16,225), and nearly twice the proportion
of Appalachian residents lived in poverty (17.6% vs. 9.6%). Only 56.4% of Appalachians had a
of a high school degree, compared to 76.9% of non-Appalachians. Even more striking was
the difference in the percentage of college-educated residents: 9.0% in Appalachian Virginia and 26.0%
Risk Factor Prevalence. Seatbelt nonuse and hypertension awareness were reported with more
frequency by BRFSS respondents in Appalachian Virginia than elsewhere in the state, but these
differences were not found to be statistically significant (Table B-24). Virginians living in Appalachian
counties were significantly less likely to report any of the three drinking behaviors, i.e., heavier
drinldng (1.1% vs. 3.7%); binge drinking (5.2% vs. 14.8%) , and drinking and driving (0.5% vs. 2.7%).


WEST VfRGINIA
Demographics. All of West Virginia's population is considered to be Appalachian according to
the ARC definition; therefore, all comparisons must be made between West Virginia and the total
United States. According to the U.S. census, in 1990 15.0% of West Virginia's population was 65 years
of age or older, compared to 12.6% in the nation as a whole (Table B-25). Only 3.8% of the state's
residents were nonwhite, whereas the national percentage was 19.8%. West Virginians were poorer
than average, with a per capita income of $10,520 in 1989; the national per capita income was
$14,420. Nearly one in five (19.7%) West Virginians lived below the poverty line in that year,
compared to 13.1% nationwide. In 1990, over one-third (34.0%) of the state's adults over the age of
25 had not finished high school, while less than one-fourth (24.8%) of the U.S. adult population of the
same ages were dropouts. Only 12.3% of West Virginians were college graduates, compared t o 20.3%
nationally.
Risk Factor Prevalence. No comparisons were possible between Appalachian and non-
Appalachian counties in West Virginia, as all counties are defined as Appalachian. State prevalences
for the eight risk factors are presented in Table B-26.


Appendix D Nunnber of Interviews by State
Behavioral Risk Factor Surveillance System, 1993
District of Columbia
New Hampshire
"North Carolina North Dakota
*South Carolina South Dakota
"Appalachian States


Appendix E
BAN DEFINITIONS
In Sowing Seeds in the Mountains: Community-Based Coalitions for Cancer Prevention and
Control, published by the Appalachia Leadership Initiative on Cancer (ALIC), the U.S. Department
culture's (USDA) Rural-Urban Continuum Codes were used to define rural and urban counties
within Appalachia. Using the USDA's codes, shown in Table C-1, metropolitan counties are classified
by size and nonmetropolitan counties are classified by degree of urbanization or proximity to
metropolitan areas. For their purposes, the ALIC collapsed the nine continuum codes into two
categories, with Codes 0-5 redefined as "urban" and Codes 6-9 redefined as "
to use the ALIC's definition for m a 1 in this report: A rural county is a nonmetrcs1poli;tan comty with
an urban population of less than 20,000.

Table E-1
ALIC Rural and Urban County Categories Based on the USDA Rural-Urban Continuum Codes for Metro a n d Nonmetro Counties
Definition
(as defined by the ~ I C )
Core large metropolitan Central counties of metropolitan areas of 1. million population or more
Fringe counties of metropolitan areas of 1 million population or more
Medium metropolitan Counties in metropolitan areas of 250,000 t o 1 million population
Lesser metropolitan Counties in metropolitan areas of less than 250,000 population
Urban population of 20,000 or more, adjacent to a metropolitan area
Urbanizednonad~acent Urban population of 20,000 or more, no& adjacent to a metropolitan area
(as def ind by the &IC)
Less urbanizedadj acent Urban population of 2,500 to 19,999, adjacent to a metropolitan area
not adjacent to a metropolitan area
Completely ruralladjacent Completely rural or fewer than 2,500 urban population, adjacent to a metropolitan area
Source: Butler, M.A. Rural-Urban Continuum Codes for Metro and Nonmetro Counties. U.S. Department of Agriculture, Economic Research Service, Agriculture and Rural Economy Division. Staff Report No. 9028, April 1990.

Bibb Blount Calhoun Chambers Cherokee Chil ton Clay Cteburne Colbert Coosa Cullman De KaIb Elmore Etowah Fayette Franklin Jackson Jefferson Lamar Lauderdale Lawrence Limestone Madison Marion Marshall Morgan Pickens Randolph Shelby St. CPair Talladega
osa osa
Walker Winston
GEORGEA Banks Barrow Bartow Carroll Catoosa Chattooga Cherokee Bade Dawson Douglas Fannin Floyd Forsyth Franklin Gilmer Gordon
Appendix F
Habersham Monroe Morgan Muskingum Noble Perry Pike Ross Scioto Tuscara was Vinton Washington PENNS'ILL Allegheny &strong Beaver Bedford Blair Bradford Butler Carnbria Cameron Carbon Centre Clarion Ctea f i e l d Clinton Columbia Crawford Elk Erie Fayette Forest F'ulton Greene Huntingdon Indiana Jefferson Juniata Lackawanna Lawrence
, Luzerne Lycoming
I McKean Mercer Mifflin Monroe Montour Northumberland Perry Pike Potter Schuylkill Snyder

Appendix F LIST OF AP CHIAN C O m I E S BY STATE (Cont'd.)

