we packaging for a - billerudkorsnäs challenges ... · handelsbanken nordic mid/small cap seminar...
TRANSCRIPT
1
Per Lindberg, CEO and President
Handelsbanken Nordic Mid/Small Cap Seminar | June 2015
WE PACKAGING FOR A
2
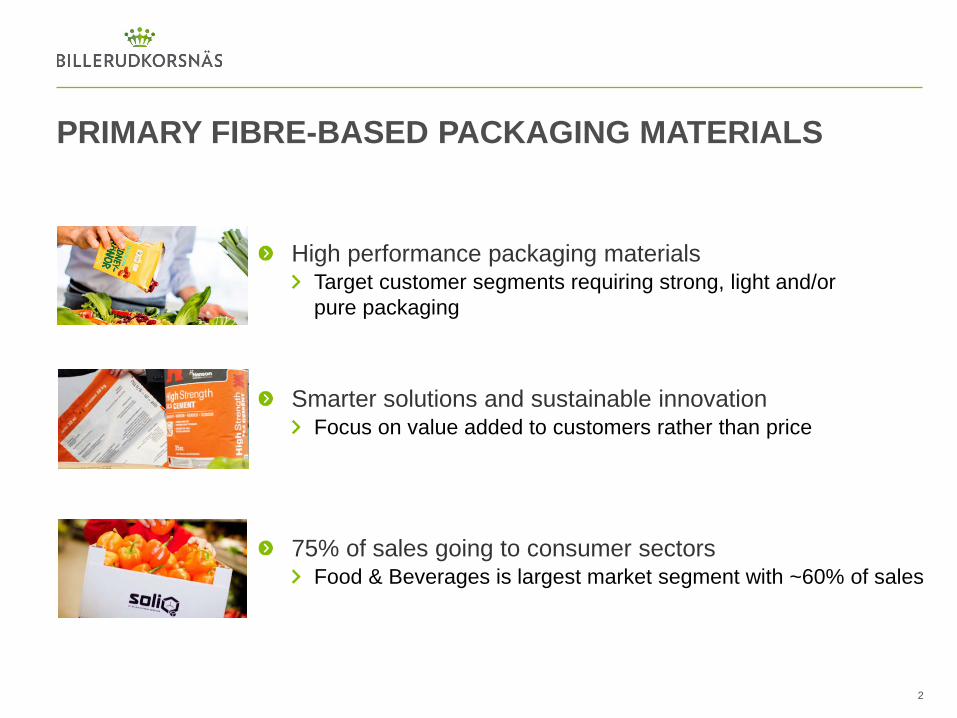
PRIMARY FIBRE-BASED PACKAGING MATERIALS
High performance packaging materials Target customer segments requiring strong, light and/or pure packaging
Smarter solutions and sustainable innovation Focus on value added to customers rather than price
75% of sales going to consumer sectors Food & Beverages is largest market segment with ~60% of sales
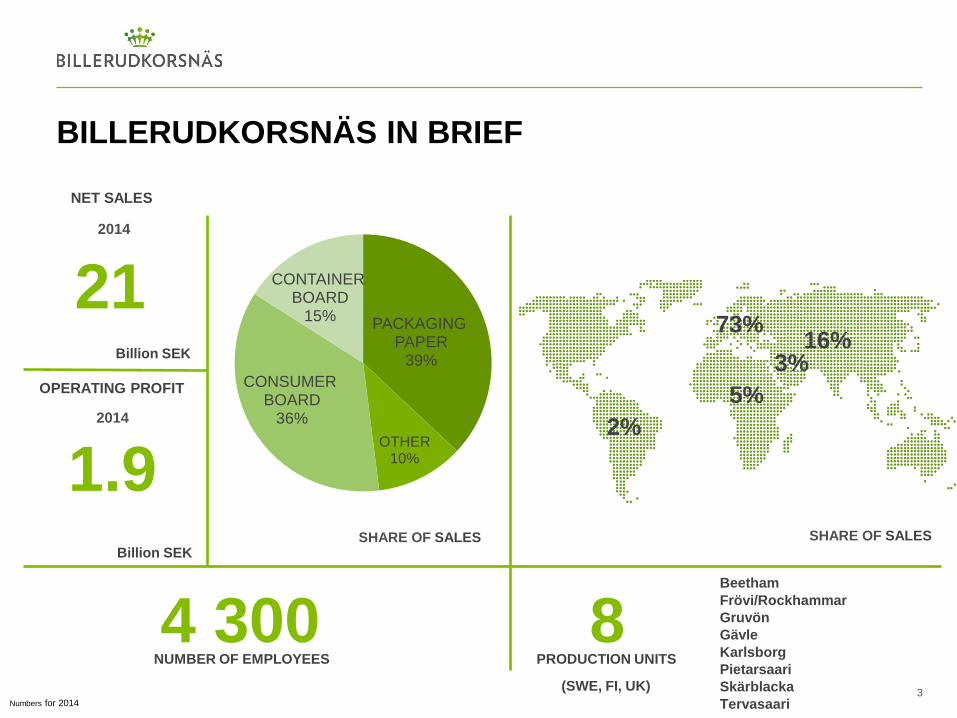
PACKAGING PAPER
39%
OTHER 10%
CONSUMER BOARD
36%
CONTAINER BOARD
15%
BILLERUDKORSNÄS IN BRIEF
3
2014
OPERATING PROFIT
Beetham Frövi/Rockhammar Gruvön Gävle Karlsborg Pietarsaari Skärblacka Tervasaari
NUMBER OF EMPLOYEES
Billion SEK
SHARE OF SALES
PRODUCTION UNITS
1.9
4 300 Billion SEK
73% 16%
5% 2%
3%
SHARE OF SALES
Numbers for 2014
8
21
2014
NET SALES
(SWE, FI, UK)
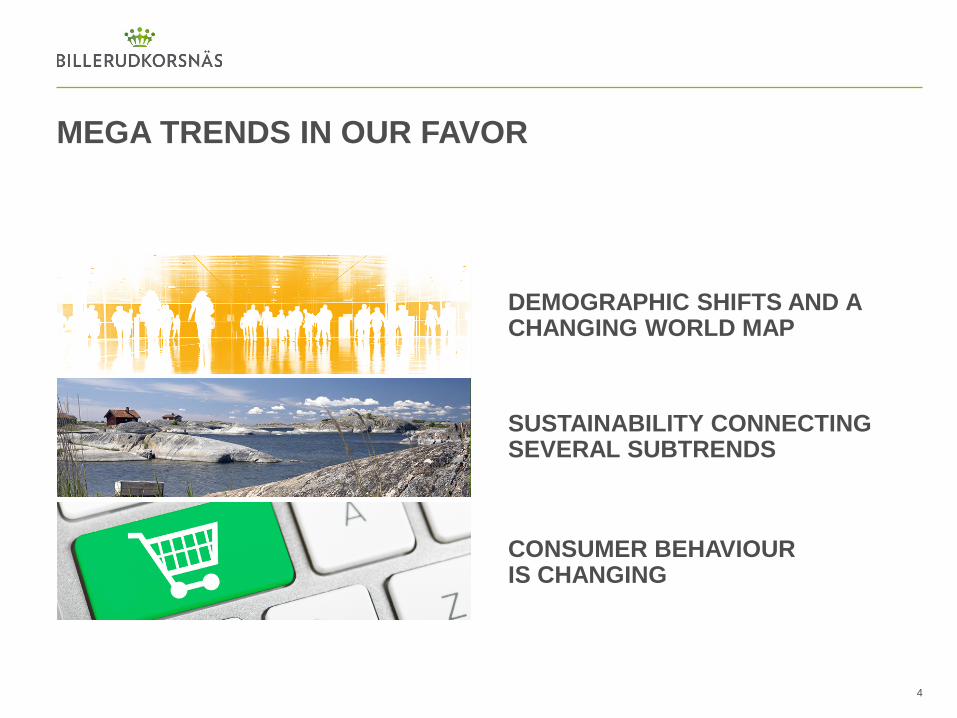
MEGA TRENDS IN OUR FAVOR
4
SUSTAINABILITY CONNECTING SEVERAL SUBTRENDS
CONSUMER BEHAVIOUR IS CHANGING
DEMOGRAPHIC SHIFTS AND A CHANGING WORLD MAP

THE PACKAGING MARKET IN OUR FAVOR
5
0
200
400
600
800
1 000
1 200
2008 2009 2010 2011 2012 2013 2018e
Global packaging market USD bn
CAGR (13-18e: 4,1 %)
Source: Smithers Pira 2013
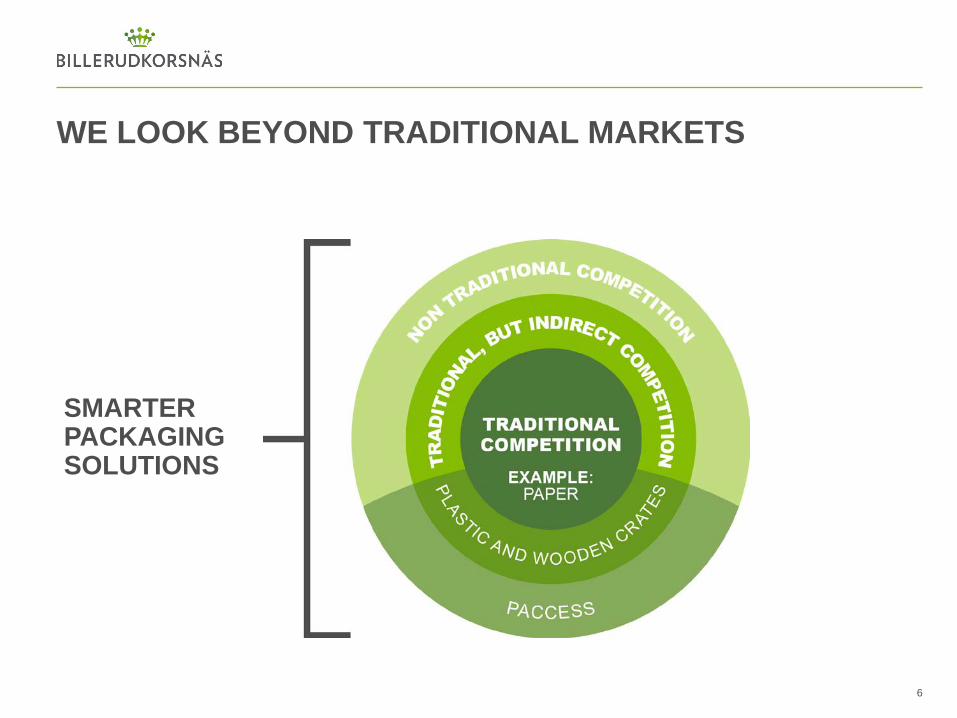
WE LOOK BEYOND TRADITIONAL MARKETS
6
SMARTER PACKAGING SOLUTIONS
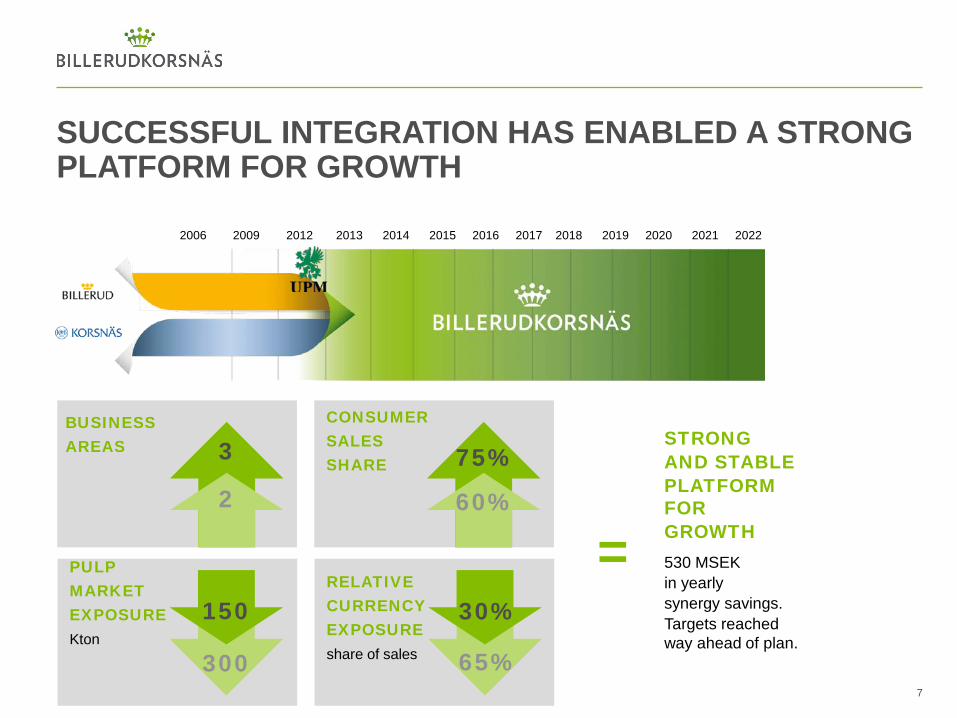
SUCCESSFUL INTEGRATION HAS ENABLED A STRONG PLATFORM FOR GROWTH
7
2006 2009 2012 2013 2014 2015 2016 2017 2018 2019 2020 2021 2022
=
BUSINESS AREAS
2
3 CONSUMER SALES SHARE 75%
60%
STRONG AND STABLE PLATFORM FOR GROWTH 530 MSEK in yearly synergy savings. Targets reached way ahead of plan.
PULP MARKET EXPOSURE Kton
300
150
RELATIVE CURRENCY EXPOSURE share of sales
65%
30% 300
150
65%
30%
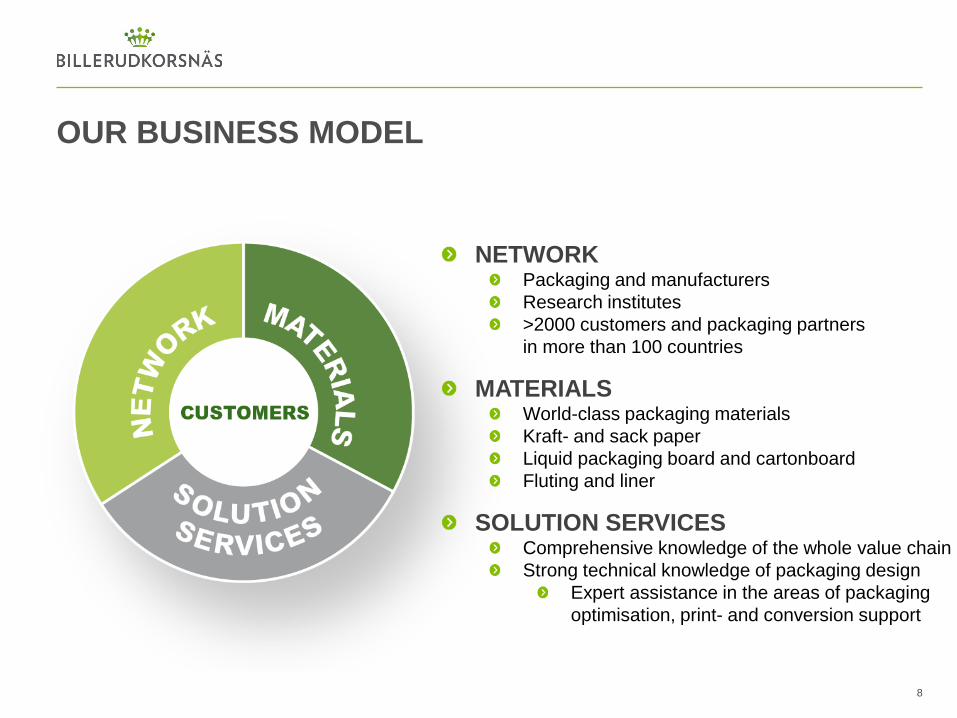
OUR BUSINESS MODEL
8
NETWORK Packaging and manufacturers Research institutes >2000 customers and packaging partners in more than 100 countries
MATERIALS World-class packaging materials Kraft- and sack paper Liquid packaging board and cartonboard Fluting and liner
SOLUTION SERVICES Comprehensive knowledge of the whole value chain Strong technical knowledge of packaging design
Expert assistance in the areas of packaging optimisation, print- and conversion support
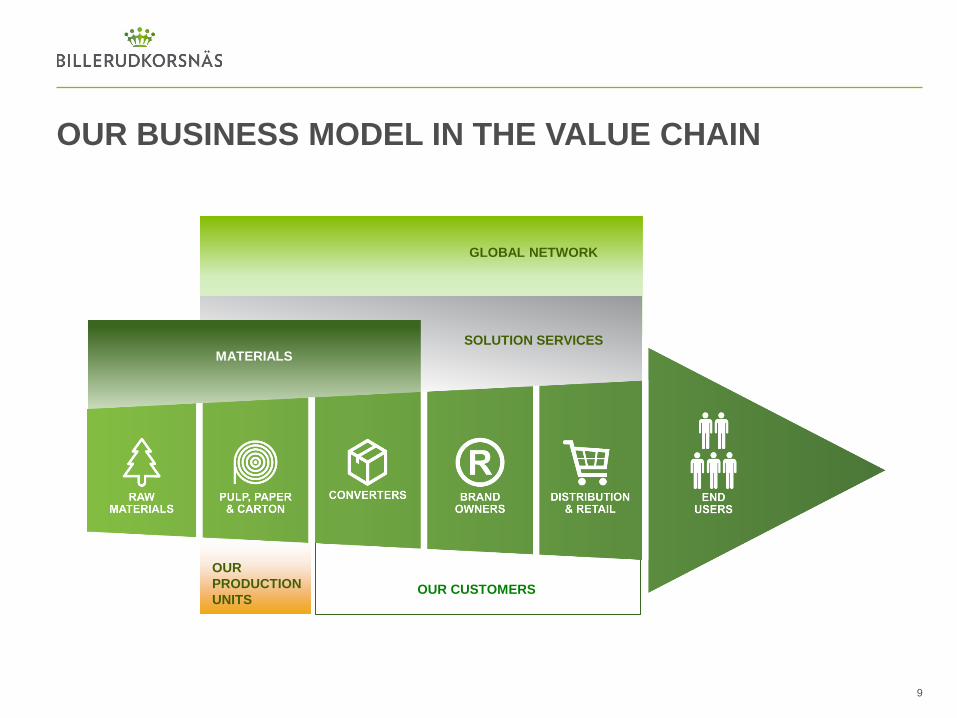
OUR BUSINESS MODEL IN THE VALUE CHAIN
OUR PRODUCTION UNITS
MATERIALS SOLUTION SERVICES
OUR CUSTOMERS
GLOBAL NETWORK
9
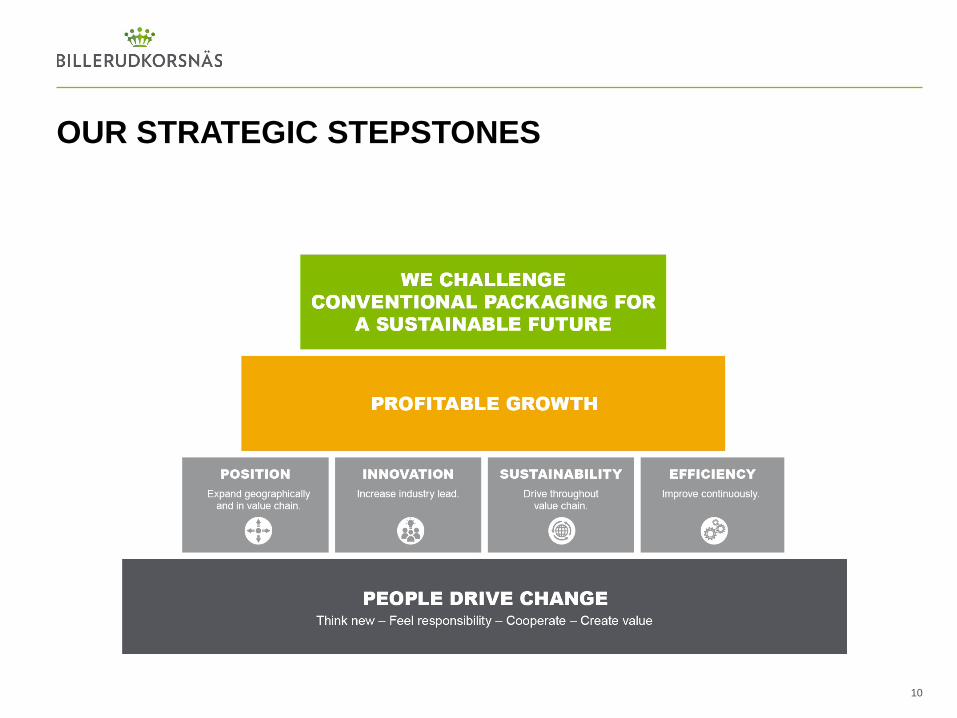
OUR STRATEGIC STEPSTONES
10
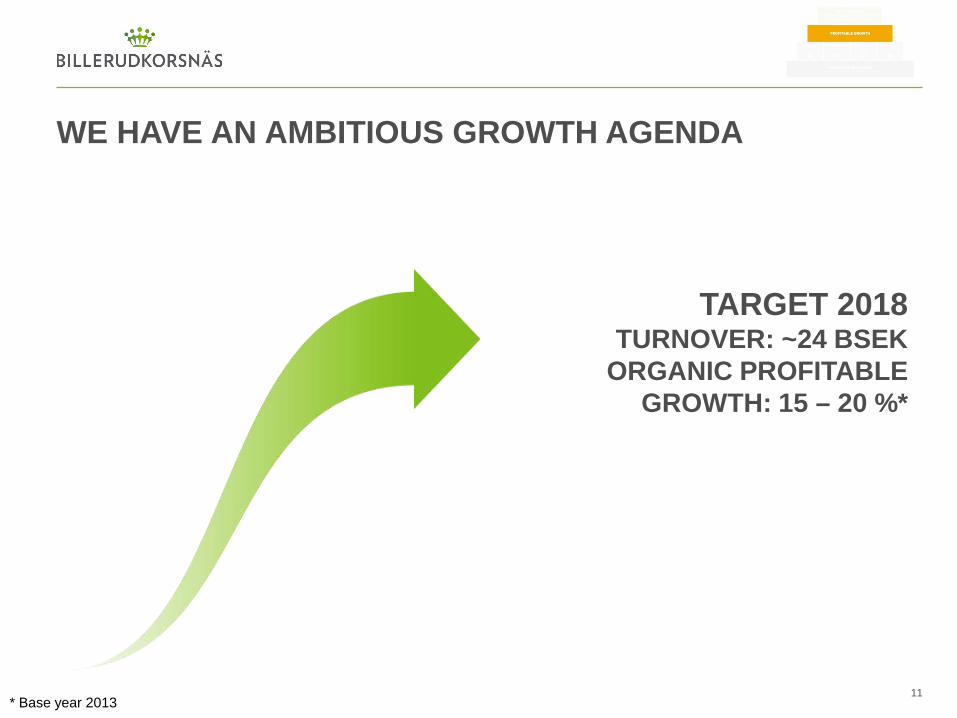
WE HAVE AN AMBITIOUS GROWTH AGENDA
11
TARGET 2018 TURNOVER: ~24 BSEK
ORGANIC PROFITABLE GROWTH: 15 – 20 %*
* Base year 2013
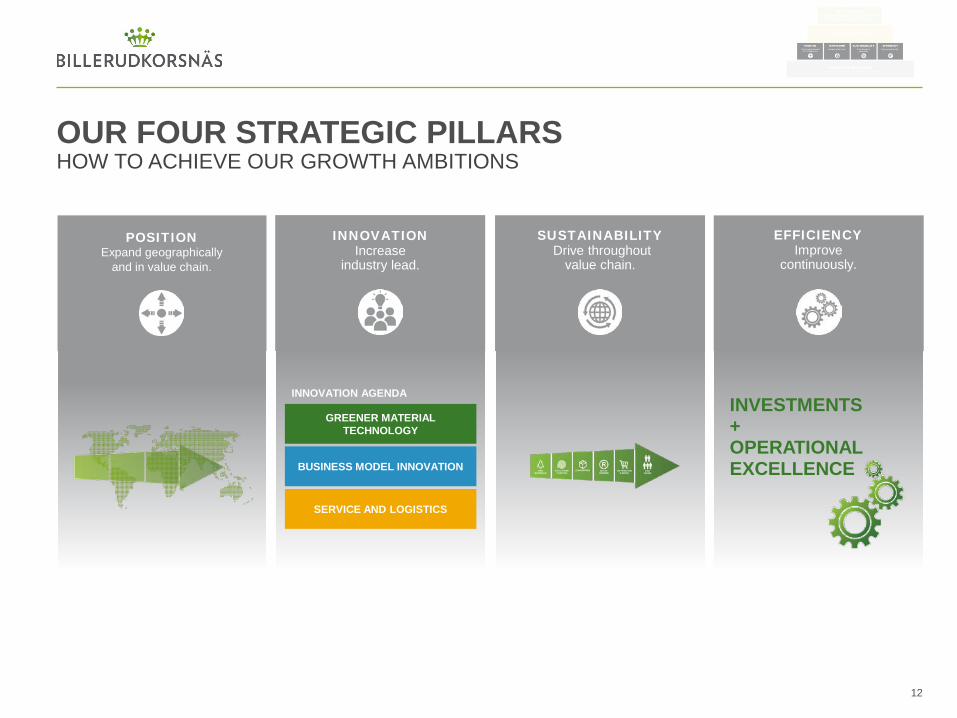
INNOVATION
Increase industry lead.
OUR FOUR STRATEGIC PILLARS HOW TO ACHIEVE OUR GROWTH AMBITIONS
12
GREENER MATERIAL TECHNOLOGY
BUSINESS MODEL INNOVATION
SERVICE AND LOGISTICS
INVESTMENTS + OPERATIONAL EXCELLENCE
POSITION Expand geographically
and in value chain.
SUSTAINABILITY
Drive throughout value chain.
EFFICIENCY Improve
continuously.
INNOVATION AGENDA
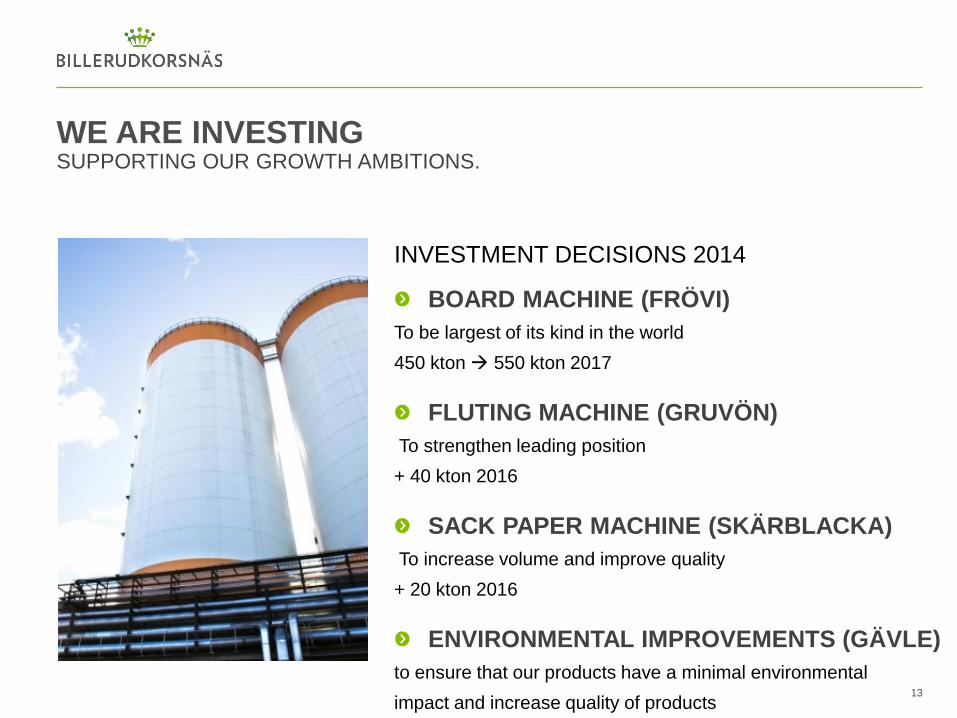
WE ARE INVESTING SUPPORTING OUR GROWTH AMBITIONS.
13
INVESTMENT DECISIONS 2014
BOARD MACHINE (FRÖVI) To be largest of its kind in the world 450 kton 550 kton 2017
FLUTING MACHINE (GRUVÖN) To strengthen leading position + 40 kton 2016
SACK PAPER MACHINE (SKÄRBLACKA) To increase volume and improve quality + 20 kton 2016
ENVIRONMENTAL IMPROVEMENTS (GÄVLE) to ensure that our products have a minimal environmental impact and increase quality of products
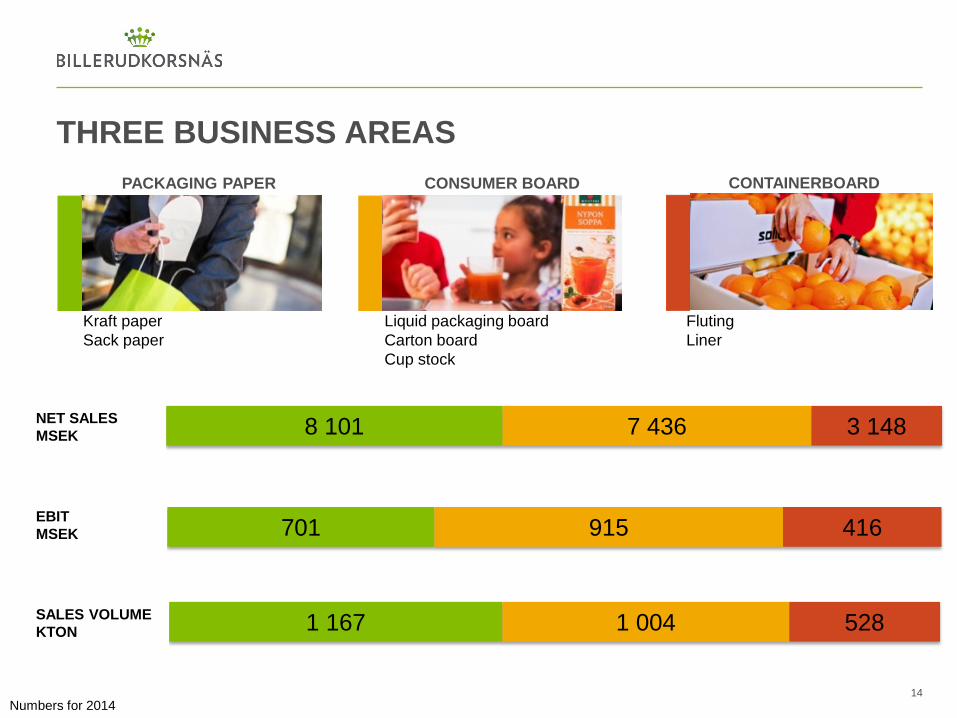
CONTAINERBOARD
Fluting Liner
THREE BUSINESS AREAS
14
8 101 7 436 3 148
PACKAGING PAPER
Kraft paper Sack paper
CONSUMER BOARD
Liquid packaging board Carton board Cup stock
701 915 416
1 167 1 004 528
Numbers for 2014
EBIT MSEK
NET SALES MSEK
SALES VOLUME KTON

STRATEGIES PER BUSINESS AREA TO ACHIEVE 15-20%* ORGANIC GROWTH BY 2018
15
BA market CAGR
VALUE GROWTH Increase margins on existing portfolio
2 - 4% CAGR
CONTAINERBOARD
SELECTIVE GROWTH Target growth in selected segments, balancing additional capacity
0 - 4% CAGR
PACKAGING PAPER
VOLUME GROWTH Increase volume in key markets
4 - 5% CAGR
CONSUMER BOARD
* Base year 2013 CAGR (Compound Annual Growth Rate)
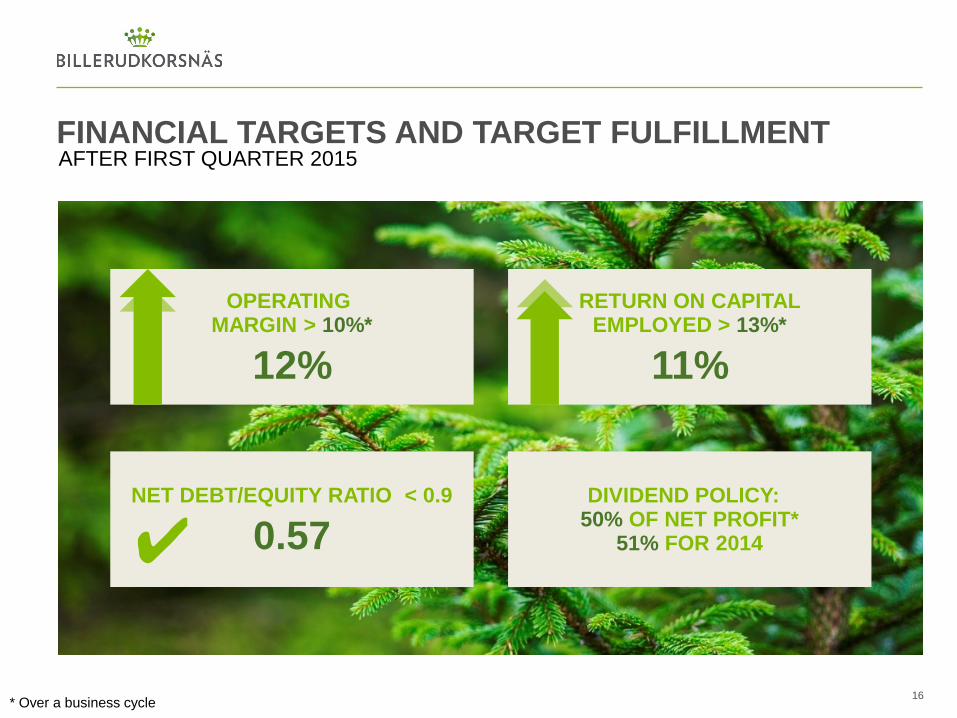
OPERATING MARGIN > 10%*
12%
FINANCIAL TARGETS AND TARGET FULFILLMENT
16
RETURN ON CAPITAL EMPLOYED > 13%*
11%
NET DEBT/EQUITY RATIO < 0.9 0.57
DIVIDEND POLICY: 50% OF NET PROFIT*
51% FOR 2014
AFTER FIRST QUARTER 2015
✔
* Over a business cycle
SUMMARY
Global trends imply major growth opportunities Sustainability, demographic shifts, digitalization and changed consumer behavior
We have a strong and stable platform on a growing market
Major investments have been done and will continue
Our four pillar strategy includes: Position expansion, Innovation, Sustainability and Efficiency
Business area strategies support organic growth targets Value growth, selective growth and volume growth
Potential additional M&A growth in medium term future
17
CAPITAL MARKETS DAY ON 12 NOVEMBER 2015
18
Capital Markets Day in Stockholm on 12 November 2015. More info will be published on www.billerudkorsnas.com
Q&A
19
20