we make it work ––– bilfinger se annual report 2013
TRANSCRIPT

–––BILFINGER SE
ANNUAL REPORT 2013
WE MAKE IT WORK

Business segments
IndustrialBilfinger provides services for the design, construction, maintenance and
modernization of plants, primarily in the sectors oil and gas, refineries, petro-
chemicals, chemicals and agro-chemicals, pharmaceuticals, food and beverages,
power generation, steel and aluminum. The range of services covers consult-
ing, engineering, project management, piping and component engineering, plant
assembly, mechanical engineering, electrical, instrumentation and control tech-
nology, process engineering, insulation, scaffolding and corrosion protection.
Important regions include Europe, USA and Asia. __page 76
As an engineering and services group, Bilfinger develops, builds, maintains and operates facilities and structures for infrastructure, real estate, industry and the energy sector.
PowerBilfinger is active in maintenance, repair, efficiency enhancements, service life
extensions and demolition of existing plants as well as in the design, manu-
facture and assembly of components for power plant construction with a focus
on boiler and high-pressure piping systems. Services include engineering,
delivery, assembly and commissioning of power plant facilities throughout their
entire lifecycles (construction, operation, demolition). Important regions include
Europe, South Africa and the Middle East. __page 82
Building and FacilityBilfinger is among the leading providers of technical, commercial and infrastruc-
tural real-estate services in Europe, the USA and MENA countries in addition to
worldwide services in water and wastewater technology. The Group manages
facilities of all kinds. In Germany, it offers development, design, management
and construction services for real estate as well as the organization of construc-
tion logistics. All of these services are consistently aligned to the entire lifecycle
of the properties. As a result of close cooperation among the business segment’s
specialists in design, construction and operation, Bilfinger is able to execute
sustainable, energy-saving and value-optimized real-estate projects for its
clients. __page 88
ConstructionBilfinger positions itself as a specialist for intelligent civil-engineering
services in the areas of mobility and energy. The focus in the field of mobility
is on hydraulic structures, steel bridges, tunnels, subways and urban rail lines
as well as noise protection walls. In the field of energy, the company focuses on
foundations for offshore wind parks and construction of overhead power lines.
In addition, foundation engineering, prestressing and geo-technology, steel con-
struction, structural maintenance and formwork are all included in the service
range. Civil-engineering activities are focused on Germany and other European
countries. __page 96
€ million 2013 2012 ∆ in %
Output volume 3,963 3,705 +7
Orders received 4,290 3,737 +15
Order backlog 2,967 2,733 +9
Capital expenditure on P, P & E 77 77 0
Depreciation 67 61 +10
EBITA / EBITA adjusted 232 206 +13
EBITA margin (in %) 5.9 5.6
Employees (at December 31) 37,945 37,056 +2
€ million 2013 2012 ∆ in %
Output volume 1,256 1,319 -5
Orders received 1,094 1,178 -7
Order backlog 1,176 1,311 -10
Capital expenditure on P, P & E 28 20 +40
Depreciation 23 22 +5
EBITA / EBITA adjusted 123 123 0
EBITA margin (in %) 9.8 9.3
Employees (at December 31) 10,028 9,278 +8
€ million 2013 2012 ∆ in %
Output volume 2,346 2,249 +4
Orders received 2,181 2,373 -8
Order backlog 2,304 2,147 +7
Capital expenditure on P, P & E 21 14 +50
Depreciation 18 14 +29
EBITA / EBITA adjusted 116 106 +9
EBITA margin (in %) 4.9 4.7
Employees (at December 31) 22,069 15,292 +44
€ million 2013 2012 ∆ in %
Output volume 1,038 1,404 -26
Orders received 817 1,099 -26
Order backlog 987 1,224 -19
Capital expenditure on P, P & E 32 29 +10
Depreciation 26 25 +4
EBITA / EBITA adjusted 1 25 -96
EBITA margin (in %) 0.1 1.8
Employees (at December 31) 3,673 4,490 -18
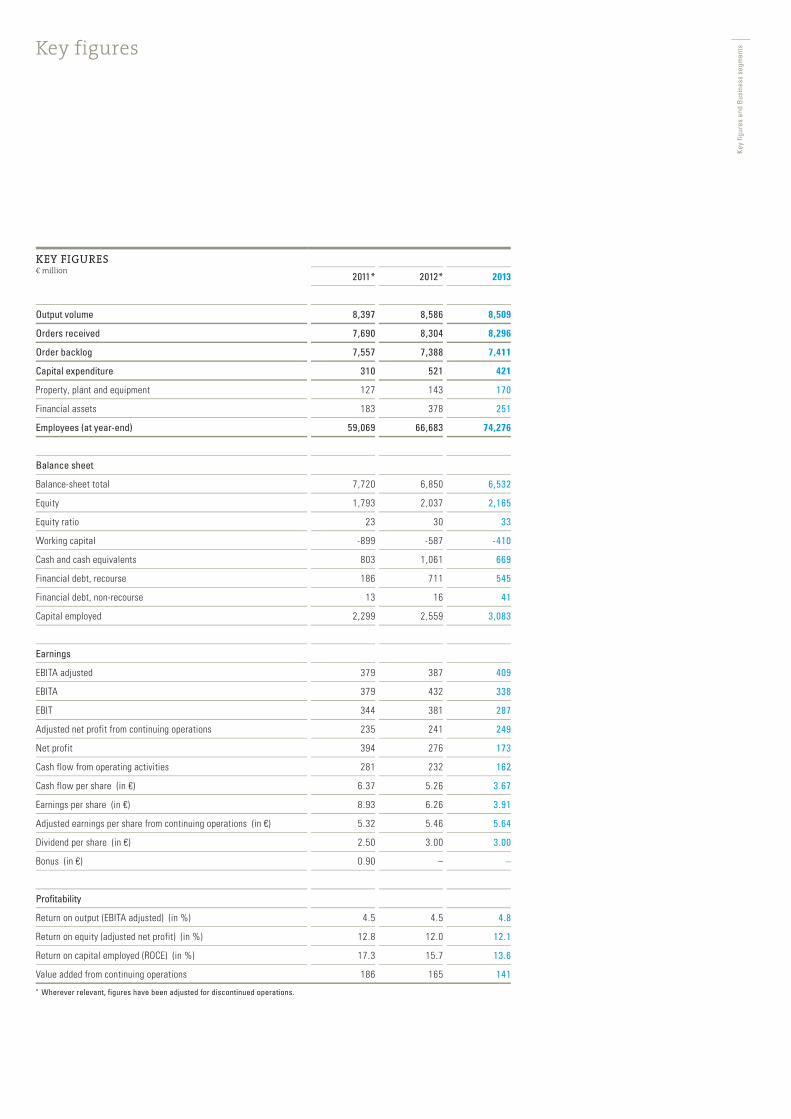
KEY FIGURES€ million
2011* 2012* 2013
Output volume 8,397 8,586 8,509
Orders received 7,690 8,304 8,296
Order backlog 7,557 7,388 7,411
Capital expenditure 310 521 421
Property, plant and equipment 127 143 170
Financial assets 183 378 251
Employees (at year-end) 59,069 66,683 74,276
Balance sheet
Balance-sheet total 7,720 6,850 6,532
Equity 1,793 2,037 2,165
Equity ratio 23 30 33
Working capital -899 -587 -410
Cash and cash equivalents 803 1,061 669
Financial debt, recourse 186 711 545
Financial debt, non-recourse 13 16 41
Capital employed 2,299 2,559 3,083
Earnings
EBITA adjusted 379 387 409
EBITA 379 432 338
EBIT 344 381 287
Adjusted net profit from continuing operations 235 241 249
Net profit 394 276 173
Cash flow from operating activities 281 232 162
Cash flow per share (in €) 6.37 5.26 3.67
Earnings per share (in €) 8.93 6.26 3.91
Adjusted earnings per share from continuing operations (in €) 5.32 5.46 5.64
Dividend per share (in €) 2.50 3.00 3.00
Bonus (in €) 0.90 – –
Profitability
Return on output (EBITA adjusted) (in %) 4.5 4.5 4.8
Return on equity (adjusted net profit) (in %) 12.8 12.0 12.1
Return on capital employed (ROCE) (in %) 17.3 15.7 13.6
Value added from continuing operations 186 165 141* Wherever relevant, figures have been adjusted for discontinued operations.
Key figures
Key
figur
es a
nd B
usin
ess
segm
ents


–––BILFINGER SE
ANNUAL REPORT 2013
WE MAKE IT WORK

2

Bilfinger SEAnnual Report 2013
Contents
5
6 Letter from the Chairman of the Executive Board 8 Executive Board of Bilfinger SE 10 Report of the Supervisory Board 14 Bilfinger in the capital market
18 A day at Bilfinger
57
58 Overview of financial year 2013 and outlook 2014 59 The Bilfinger Group 60 Business model 60 Objectives and strategy 61 Financial management system 62 Research and development 65 Economic report 65 Business developments 2013 67 Results of operations 70 Net assets 71 Financial position 74 Information on the results of operations, net assets and financial position of Bilfinger SE
76 Industrial business segment 82 Power business segment 88 Building and Facility business segment 96 Construction business segment 102 Discontinued operations
103 Sustainability 104 Procurement 104 Communication and marketing 106 Human resources 109 Events after the balance sheet date 110 Opportunity and risk report 118 Outlook 121 Additional disclosures pursuant to Section 289 Subsection 4 and Section 315 Subsection 4 of the German Commercial Code (HGB) / Executive Board remuneration
125
126 Corporate governance report129 Remuneration report
135
136 Responsibility statement 137 Auditor’s report
138 Consolidated financial statements 139 Consolidated income statement 140 Consolidated statement of comprehensive income 141 Consolidated balance sheet 142 Consolidated statement of changes in equity 143 Consolidated statement of cash flow
144 Notes to the consolidated financial statements
203
204 Return-on-capital-employed controlling 207 Boards of the company 210 Glossary 212 Ten-year overview 214 Financial calendar
To our shareholders Corporate governance
Consolidated financial statements
Additional information
Combined management report
3

4

6 Letter from the Chairman of the Executive Board 8 Executive Board of Bilfinger SE 10 Report of the Supervisory Board 14 Bilfinger in the capital market
To our shareholders
5

Letter from the Chairman of the Executive Board66

Dear Shareholders,Ladies and Gentlemen,
For Bilfinger, 2013 was once again a year in which we were able to increase our operating profit. On the other hand, we still have to overcome a diverse range of challenges in order to achieve our organic growth objectives. The year began with a difficult first quarter but thanks to a race to catch up that went on until the very last day, we managed to close the gap to a large extent. This was an impressive demonstration of the Group’s ability to per-form. 2014 will also be shaped by considerable efforts and changes. Step by step, we are creating the conditions necessary to achieve the goals we have set for ourselves by 2016. Our focus throughout will be on organic growth and the further improvement of our profitability. In addition, we will further strengthen our position through targeted acquisitions.
With the exception of Construction, all business segments contributed to Bilfinger reaching a new record high in operating profit in financial year 2013. Industrial, our largest business segment, performed very well and benefited in particular from the special economic situation in the USA: driven by shale gas exploration which we support with our services, we were able to substantially increase our U.S. business. Power was able to achieve a particularly good margin, mainly as a result of the successful execution of international power plant projects. One piece of bad news is the hesitant approach to investments on the part of utility companies, espe-cially in Germany. The results from Building and Facility were also pleasing: the business segment showed growth in all areas. Burdens from the Ger-man road construction unit and from the construction business in Poland, on the other hand, shaped the Construction business segment and prevented a better performance from the Group as a whole. We have now, for the most part, solved these problems: the German road construction activities were sold and the Polish activities were realigned.
We look to the future with optimism: important acquisitions such as Johnson Screens and Europa Services round out our portfolio and provide us with access to new markets and client groups. At the same time, our cost-reduction measures are taking hold and we are therefore making significant steps forward in terms of competitiveness.
Our new, uniform brand presence has long since developed into a success story. The Bilfinger logo is now visible at many locations and has already led to a significant increase in awareness of our brand. Due to the new appearance, an increasing number of clients know that Bilfinger offers a broad, attractive spectrum of engineering and services. New business opportunities open up for us through the networking of the various compe-tences. At the same time, we are noticing the positive impact of our strong brand in recruiting qualified new employees.
Ladies and Gentlemen,Bilfinger’s prospects for 2014 and the years to follow are positive. In 2013, the company sustainably improved its position as a leading international engineering and services group despite the economic challenges that we faced. For our Industrial business segment, we believe the chances are
good that the investment economy recovers further already in 2014. In the future, Power will also benefit from worldwide growth in the need for energy. Clear framework conditions with regard to energy policy in Ger-many should also have a positive effect. The new acquisitions are providing a boost to the Building and Facility business segment. Now that the ground-work has been laid, Construction will improve significantly.
We are consistently implementing our strategic and organizational realignment based on the BEST (Bilfinger Escalates Strength) and Bilfinger Excellence programs. These efforts are accompanied by an extensive inter-nal reorganization. This step was necessary in light of the large number of companies which, through acquisitions, have joined the Bilfinger Group in recent years. These measures, unfortunately, are also accompanied by job cuts, something that together with the employee representatives we will carry out in a manner that is as socially acceptable as possible. Bilfinger Excellence will make an important contribution to a more competitive cost structure in 2014 and beyond.
The divisions that have been formed to manage the operational busi-ness have now begun their business activities. In the new organization, many colleagues work together more closely than was the case in the past; they exchange information and jointly pursue success with the client. We have also created the instruments we need to become more efficient and faster. Important information for new bids, for example, can be put together quickly and professionally using new platforms. Over the long term, these instruments will help us to achieve the goals we set.
The Executive Board would like to express its thanks to all employees. The development of a new organization is an exhausting and demanding task with considerable challenges in the company. We can only achieve the goals we have set with persistence, courage and commitment.
Our thanks go out to you, dear shareholders, who have – some of you for many years already – accompanied us with confidence. It is extremely important, especially in times of transformation, that you support Bilfinger and the clear path we have taken. We have not yet reached our goal and have many tasks ahead of us. We view the year 2014 with a sense of con-fidence and are determined to take advantage of the opportunities that are presented to us.
My Executive Board colleagues and myself would be pleased if you continued to put your trust in Bilfinger in the future and look forward to writ-ing additional chapters in the successful history of our company together.
Sincerely,
Roland KochChairman of the Executive Board at Bilfinger SE
Bilfinger SEAnnual Report 2013
Letter from the Chairman of the Executive Board
7
Executive Board of Bilfinger SE88
Bilfinger SEAnnual Report 2013
Executive Board of Bilfinger SE
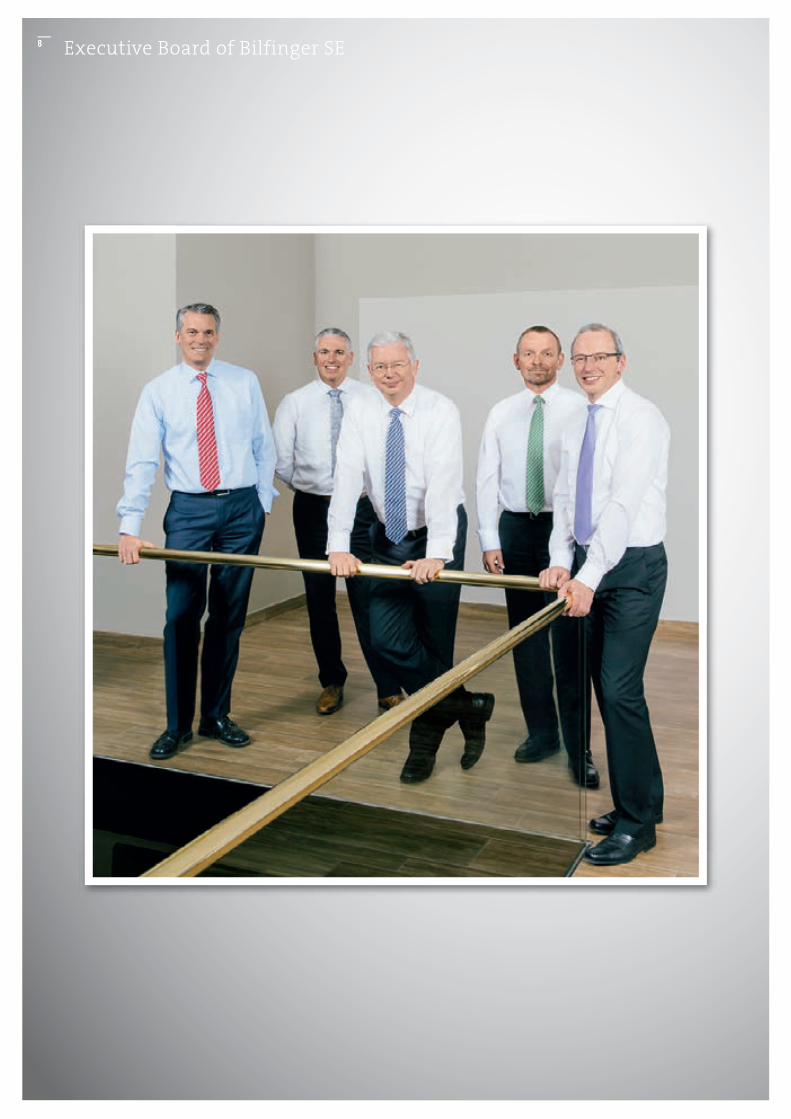
Dr. Jochen Keysberg__Divisions: Building | Facility Services | Real Estate | Water Tech-nologies
Government Services __Born 1966 in Dortmund. In 1997, after completing his studies in engi-neering at the Technical University of Aachen and his doctorate at the Technical University of Hamburg-Harburg, Dr. Jochen Keysberg joined the Bilfinger Group. He held a number of management positions in the Group both in Germany and abroad and has been a Member of the Executive Board since 2012.
Pieter Koolen (from September 19, 2013)__Divisions: Engineering, Automation and Control | Industrial Fabrication and Installation | Industrial Maintenance | Insulation, Scaffolding and Painting | Oil and Gas | Support Services
HSEQ (Health, Safety, Environment and Quality)__Born 1955 in Breda, Netherlands. Pieter Koolen holds a registered accountant degree and has held a number of management posi-tions with auditing and construction companies. In 2005, he became Member of the Executive Board at Tebodin B.V., which has been part of the Bilfinger Group since 2012. He joined the Executive Board of Bilfinger SE in September 2013.
from left:
Roland Koch, Chairman__Strategy | Human Resources (Labor Director) | Legal | Compliance | Project Controlling | Communications & Marketing | Group Organization__Born 1958 in Frankfurt am Main. After a degree in law at the Uni-versity of Frankfurt, Roland Koch worked as a lawyer specializing in corporate and labor law. From 1987 to 2010 he was a member of the state parliament in Hesse and from 1999 to 2010 he was Premier of the state of Hesse. Roland Koch has been a member of the Executive Board at Bilfinger since March 1, 2011 and took over as Chairman on July 1, 2011.
Joachim Enenkel __Divisions: Construction | Infrastructure | Piping Systems | Power Systems
Technology and Development__Born 1962 in Sindelfingen. After a degree in civil engineering from the University of Technology in Stuttgart and positions with various engineering offices and construction companies, Joachim Enenkel joined the Bilfinger Group in 1996. He assumed management functions in Germany and abroad and has been a Member of the Executive Board since 2010.
Joachim Müller__Accounting | Finance | Controlling | M & A | Internal Audit | Taxes | Investor Relations | Purchasing | IT __Born 1959 in Eberbach. After studying economics at the University of Heidelberg, Joachim Müller worked at auditing companies and held commercial management positions at several international industrial and IT companies. He has been a Member of the Executive Board at Bilfinger since 2008.
9

In 2013, Bilfinger continued to develop successfully, even though we were not able to achieve the anticipated higher organic growth rates for output volume and earnings in the economic environment that is relevant for us. Additional important steps were introduced in the reporting year to increase and sustainably secure the competitiveness of our company. With ‘Bilfinger Excellence’, a program to enhance efficiency over the long term, structures and processes in the sales and administrative areas will be optimized and costs will be reduced. A key component of this program is the integration of the management and administration tasks of the former Subgroup holdings in Bilfinger SE. In future, operational management will be carried out by 14 divisions within the SE, each of which will report directly to the Executive Board. The Supervisory Board endorsed ‘Bilfinger Excellence’ in September 2013 and supports the Executive Board in the implementation of the measures.
Cooperation between the Supervisory Board
and the Executive Board
During the year under review, the Supervisory Board performed the duties incumbent upon it in accordance with the law and the Articles of Incorporation. The cooperation with the Executive Board was character-ized by an intensive and open dialog. The Executive Board informed the Supervisory Board regularly, in a timely manner and extensively, in both written and verbal form, on all relevant aspects of the company’s development. The Supervisory Board discussed in detail the reports from the Executive Board. It continuously monitored the work of the Executive Board on the basis of this reporting and provided advice regarding the management and strategic development of the company. The Supervisory Board was always involved at an early stage in deci-sions of substantial importance. The primary benchmarks for the super-vision of the Executive Board by the Supervisory Board were the legality, correctness, suitability and profitability of the Group-wide manage-ment of the business by the Executive Board. The content and scope of reporting from the Executive Board fulfilled the requirements placed on it by the law, by the principles of good corporate governance and by the Supervisory Board. As well as the reports prepared by the Executive Board, the Supervisory Board also received additional information from the Executive Board. Between the scheduled meetings, the Chairman of the Supervisory Board regularly exchanged ideas and information, in particular with the Chairman of the Executive Board with regard to fundamental topics, the progress of business and significant events.
Article 15 Paragraph 1 of the Articles of Incorporation of Bilfinger SE and a catalog prepared by the Supervisory Board, embedded in the
Bilfinger SEAnnual Report 2013Report of the Supervisory Board
Ladies and Gentlemen,
Dr. hc. Bernhard WalterChairman of the Supervisory Board
10

Executive Board rules of procedure and regularly reviewed for any necessary adjustments, list the transactions and measures of funda-mental importance which require the approval of the Supervisory Board. The Supervisory Board decided on transactions and measures submit-ted to it and requiring its approval after reviewing them and discussing them with the Executive Board.
A further focus of consultations in the plenary sessions of the Supervisory Board was earnings development in the individual business segments as well as corporate planning – investments, return-on-capi-tal-employed controlling and the comparison of the course of business with the anticipated figures were also dealt with in detail. Furthermore, the Supervisory Board was informed by the Executive Board on an on-going basis about findings of risk management.
The Supervisory Board also dealt with compliance questions includ-ing the conclusion of a Deferred Prosecution Agreement with the U.S. Department of Justice. Through its Audit Committee, the Supervisory Board accompanies and monitors the framework, development and application of the Bilfinger compliance system. The auditors confirmed to the Supervisory Board that this system meets recognized standards.
The Supervisory Board is not aware of any conflicts of interest to be disclosed by members of the Executive or Supervisory Boards.
Supervisory Board meetingsThere were five meetings of the Supervisory Board in 2013; they were held on March 6, April 18, September 19, October 24 and December 10. All members of the Supervisory Board attended more than half of the meetings; the average attendance rate was 92 percent.
Topics in the plenary meetingsWith the exception of the meeting held on October 24, 2013, the focus of which was on the approach to corporate strategy, in each meeting the Executive Board reported on current business development and the Chairmen of the Supervisory Board committees informed the plenum about the activities of the bodies they lead. The meetings of the Super-visory Board also dealt with the following topics:
On March 6, 2013, the Supervisory Board dealt primarily with the annual and consolidated financial statements for 2012, changes to the Executive Board remuneration system and the proposed resolutions to the Annual General Meeting.
The meeting held on April 18, 2013 served to prepare the sub-sequent Annual General Meeting.
On September 19, 2013, the Supervisory Board dealt mainly with ‘Bilfinger Excellence’ and, following detailed consultations, endorsed the program, with which administrative functions in the company will be combined, costs reduced and the management structure more efficiently structured. In addition, the plenum dealt with personnel issues of the Executive Board and approved the sale of the project
portfolio in the Concessions business segment. Furthermore, the Super-visory Board addressed the effects of changes to the German Corpo-rate Governance Code in 2013 and approved the annual Declaration of Compliance pursuant to Section 161 of the German Stock Corporation Act (AktG).
At the meeting on October 24, 2013, the Supervisory Board dis-cussed the status of the implementation of Group strategy for the years up to 2016. The status and the necessary steps to achieve the objec-tives presented by the Executive Board were discussed in detail. In addition, the Supervisory Board looked at the development of companies acquired in 2011.
On December 10, 2013, the Supervisory Board dealt primarily with the status of the implementation of ‘Bilfinger Excellence’ as well as with the acquisition of Europa Support Services Ltd., Motherwell, United Kingdom. The Supervisory Board approved the acquisition of this company following detailed discussions. In addition, reports from the areas of project controlling, internal auditing and compliance were on the agenda.
In accordance with the recommendation of the Audit Committee, the Supervisory Board proposed to the Annual General Meeting that the accounting firm Ernst & Young GmbH Wirtschaftsprüfungsgesellschaft, Mannheim, be elected to conduct the external audit of the annual and consolidated financial statements for 2013.
Work of the committees In order to ensure the efficiency of its activities, the Supervisory Board has formed a Presiding Committee, an Audit Committee and a Nomina-tion Committee.
Presiding Committee of the Supervisory BoardThe Presiding Committee of the Supervisory Board consists of four members (see page 209). It prepares the plenary meetings and makes recommendations on important resolutions. The tasks of the Presiding Committee also include regulating the personnel issues of the Execu-tive Board, unless the provisions of the German Stock Corporation Act and the German Corporate Governance Code stipulate that they are to be regulated by the plenum of the Supervisory Board, and taking deci-sions on legal and other transactions subject to approval.
Five meetings of the Presiding Committee of the Supervisory Board were held in 2013. The Presiding Committee approved the sale of an equity interest and the sale of shares in two public private partnership (PPP) projects and also approved bids for a concession project and two larger construction projects. Some of the resolutions of the Presiding Committee of the Supervisory Board were made in written form.
Bilfinger SEAnnual Report 2013
Report of the Supervisory Board 11

Audit CommitteeThe Audit Committee also consists of four members (see page 209). It monitors the accounting processes as well as the functionality and effectiveness of the risk management system, the internal auditing system and the internal control system. It also deals with questions relating to auditing and compliance. The Chairman of the Audit Com-mittee, Mr. Udo Stark, has particular knowledge and experience in the application of accounting principles and internal control procedures.
In six meetings in the past financial year, the Audit Committee primarily dealt with the annual financial statements for 2012 and the quarterly reports for 2013, including the corresponding interim finan-cial statements of March 31, June 30 and September 30. The auditors participated in four meetings of the Audit Committee and reported in detail on the results of the audit of the annual and consolidated finan-cial statements, the auditors’ review of the interim financial statements as of June 30 and September 30, 2013 and on the significant findings for the work of the Audit Committee. The Chairman of the Supervisory Board participated in four meetings of the Audit Committee as a guest. The Chairman of the Audit Committee also met individually with the Chief Financial Officer outside the Committee meetings and discussed, among other things, the annual financial statements and the interim financial statements with him.
The Audit Committee reviewed the independence of the external auditors and recommended that the Supervisory Board propose their election by the Annual General Meeting in 2013. The Audit Committee is not aware of any reasons to doubt the external auditors’ impartiality. The Committee awarded the contracts for the audit of the annual and consolidated financial statements as well as for the auditors’ review of the interim financial statements from June 30 and September 30, 2013 to the auditors, negotiated the audit fee with them and determined the focus of the audit. It also dealt with the non-audit services provided by the external auditors and reviewed compliance with the relevant limits for such services.
The Audit Committee received information on the development of the risk situation from the quarterly reports of the Executive Board, which were also submitted to the plenum of the Supervisory Board. Furthermore, the Audit Committee dealt in detail with the activities of Project Controlling and Internal Auditing. To enable the Audit Commit-tee to evaluate risk management, the Project Controlling and Internal Auditing departments submitted annual reports to the committee. The Audit Committee reviewed the functionality of the internal control system and the risk management system in relation to the accounting process. The Audit Committee is of the opinion that the internal control system, the internal auditing system and the risk management system fully meet the demands that are made of them.
The Audit Committee also dealt in detail with compliance questions and a Deferred Prosecution Agreement with the U.S. Department of Justice. The Chief Compliance Officer reported on his activities to the Committee once a quarter (see page 128).
Nomination CommitteeThe Supervisory Board has formed a Nomination Committee in accord-ance with the recommendation in Clause 5.3.3 of the German Corporate Governance Code. This Committee consists of three members repre-senting the shareholders (see page 209) and suggests suitable candi-dates to the Supervisory Board for its recommendations for the election of Supervisory Board members to be made to the Annual General Meet-ing. In financial year 2013, the Nomination Committee convened once, holding consultations with regard to the proposed resolutions for the election of two Supervisory Board members.
Corporate governance and declaration of complianceIn 2013, the Supervisory Board dealt in detail with questions of corpo-rate governance and with the German Corporate Governance Code. On September 19, 2013, the Executive Board and the Supervisory Board issued a declaration of compliance pursuant to Section 161 of the Ger-man Stock Corporation Act (AktG), which is a component of the corpo-rate governance report (see page 126) and is permanently available on the company’s website, as are the previous declarations.
Efficiency checkThe Supervisory Board and Audit Committee check the efficiency of their activities annually. The efficiency check takes place on the basis of a comprehensive company-specific questionnaire and through dis-cussion in the plenary sessions of the Supervisory Board or in the Audit Committee. In 2013, this again confirmed the quality of the Supervisory Board’s activities that had already been ascertained in previous years. For 2014, the Supervisory Board once again commissioned an external consultant with the evaluation of its activities.
Audit of the annual and consolidated financial statementsAccounting firm Ernst & Young GmbH Wirtschaftsprüfungsgesellschaft, Mannheim, has audited the annual financial statements and the com-bined management report of Bilfinger SE and the Group prepared by the Executive Board in accordance with the German Commercial Code (HGB) for 2013 and has issued them with an unqualified audit opinion. The consolidated financial statements of Bilfinger SE for 2013 were prepared in accordance with Section 315a of the German Commer-cial Code (HGB) on the basis of the International Financial Reporting Standards (IFRS) as adopted by the European Union. The consolidated financial statements were also issued with an unqualified audit opinion by the auditors. The audit assignment had been issued by the Audit Committee of the Supervisory Board in accordance with the resolution of the Annual General Meeting of April 18, 2013. The aforementioned financial statements, the audit reports of the external auditors and the proposal of the Executive Board on the appropriation of profits were provided to all members of the Supervisory Board in good time. The
Bilfinger SEAnnual Report 2013Report of the Supervisory Board12

Audit Committee of the Supervisory Board, in preparation for the re-view and discussion of these documents by the plenary session of the Supervisory Board, discussed the financial statements and the audit reports as well as the proposal on the appropriation of distributable earnings in the presence of the external auditors. In addition, the Audit Committee received a report from the external auditors on their col-laboration with the Internal Auditing department and other persons in positions involved in risk management and on the effectiveness of the internal control and risk management system with regard to accounting, whereby the external auditors stated that no significant weaknesses had been found. The external auditors confirmed that the internal con-trol system, the internal auditing system and the risk management sys-tem fully meet the demands made of them.
The Supervisory Board undertook a detailed review of the annual financial statements, the consolidated financial statements and the combined management report of Bilfinger SE and the Group for the year 2013, as well as the proposal of the Executive Board on the appropriation of distributable earnings – following an explanation of these documents by the Executive Board – and dealt with these matters in its meeting on March 13, 2014. The external auditors, represented by the two auditors who signed the audit opinion, also participated in this meeting. They explained the audit and responded to questions from the Supervisory Board on the results of the audit as well as its form and scope. They also discussed with the Supervisory Board the internal control and risk management system, in particular as it relates to the accounting process. The Supervisory Board shares the opinion of the Audit Committee on the effectiveness of these systems. The Super-visory Board was convinced that the audit by the external auditors was conducted in a proper manner. In concurrence with the recommenda-tion of the Audit Committee, the Supervisory Board took note of and approved the results of the audit conducted by the external auditors. Following the final results of the Supervisory Board’s own review carried out on this basis, there were no objections to be made; this applies in particular to the corporate governance statement, namely to the extent that its components are to be analyzed by the Supervisory Board alone. At its meeting held on March 13, 2014, the Supervisory Board approved the annual and consolidated financial statements and the combined management report for the 2013 financial year as submit-ted by the Executive Board. The company’s financial statements have thus been adopted.
The Supervisory Board, in its assessment of the situation of the company and the Group, is in agreement with the assessment made by the Executive Board in its combined management report. The Supervisory Board consents to the proposal of the Executive Board on the appropriation of distributable earnings, particularly with regard to the stringency of accounting and dividend distribution policy, the effects on liquidity, creditworthiness and future financing needs, as well as with consideration of shareholders’ interests. In accordance
with the recommendation of the Audit Committee, it consents to the Executive Board’s proposal for the appropriation of distributable earnings.
Executive Board personnel mattersOn September 19, 2013, the Supervisory Board appointed Mr. Pieter Koolen as a member of the Executive Board with immediate effect. Mr. Koolen was previously Managing Director at Tebodin B.V., The Hague, and Head of the Division Engineering at Bilfinger Industrial Technologies. Mr. Thomas Töpfer stepped down from the Executive Board by mutual agreement on October 31, 2013. The Supervisory Board would like to thank Mr. Töpfer for his contribution to the develop-ment of the company.
Supervisory Board personnel mattersIn the Supervisory Board, Mr. Thomas Pleines with effect from the conclusion of the Annual General Meeting on April 18, 2013 and Prof. Dr. Klaus Trützschler with effect from the end of the day June 30, 2013 resigned from their positions. Mr. Jens Tischendorf with effect from the end of the Annual General Meeting on April 18, 2013 and Mr. Herbert Bodner with effect from July 1, 2013 were elected to the Supervisory Board as their successors. The Supervisory Board thanks all the departed members for their work and commitment in the interests of the company.
Thanks to the Executive Board and the employeesThe Supervisory Board thanks the members of the Executive Board for the trusting and constructive cooperation and expresses its thanks and appreciation to all the employees for their good work for Bilfinger in the past financial year.
Adoption of this reportThe Supervisory Board adopted this report in its meeting on March 13, 2014 in accordance with Section 171 Subsection 2 of the German Stock Corporation Act (AktG).
For the Supervisory Board
Dr. hc. Bernhard WalterChairman of the Supervisory BoardMannheim, March 13, 2014
Bilfinger SEAnnual Report 2013
Report of the Supervisory Board 13

Positive stock-exchange sentiment in 2013
A surprise for most investors in 2013 was the unexpectedly strong upward trend of the stock markets in the United States, Germany and Japan. While the European sovereign-debt crisis caused investor reticence at the beginning of the year, the expansive monetary policy of the U.S., European and Japanese central banks had significant influ-ence on stock markets as of the middle of the year. This upward trend was supported by better economic data from the United States and the euro zone.
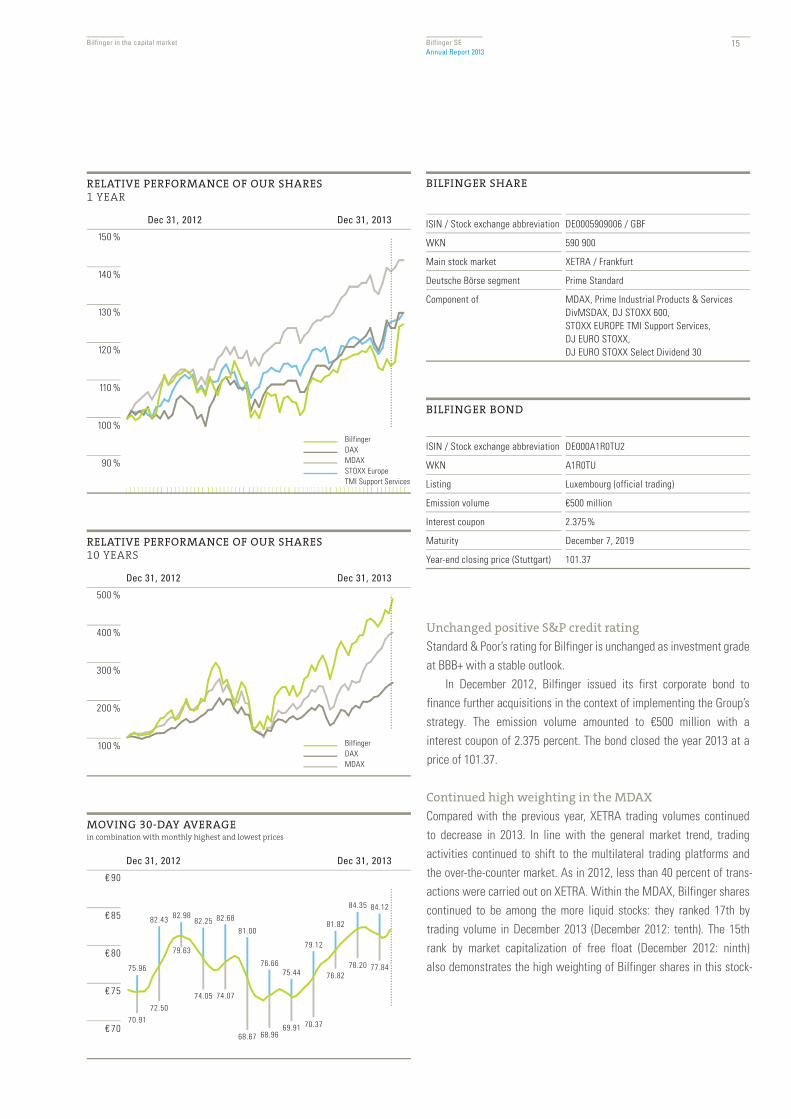
Bilfinger’s share price developed largely in line with the market trend in the first quarter, but with a gain of 16 percent it lagged behind reference indices until the end of the year. The DAX and the MDAX closed the year up 25 percent and 39 percent, respectively, while the sector index STOXX Europe TMI Support Services gained 25 percent. After the relatively weak development in 2013, Bilfinger’s share price made up substantial ground in the first few weeks of the new year, closing rank with both the DAX and the sector index.
Bilfinger shares reached their low for the year of €68.67 in June, during a generally weak market phase. The high for the year of €84.35 was reached in late November. Bilfinger shares closed the year at €81.53, representing a market capitalization of €3.8 billion.
For shareholders who invested in Bilfinger shares 10 years ago, this was a very successful investment: with a performance of plus 434 percent, our shares were well ahead of the DAX and the MDAX with plus 241 percent and plus 371 percent, respectively. This clearly shows how Bilfinger’s successful transformation has been recognized by the capital market.
Positioning as service stock further established
The perception of Bilfinger as an engineering and services group con-tinued to take root. Since 2012, the German Stock Exchange (Deutsche Börse) has listed Bilfinger in the Industrial Products & Services sector. For its Global Industry Classification Standard (GICS), Standard & Poor’s has classified Bilfinger in the Diversified Support Services sector; STOXX lists our shares in ‘STOXX Europe TMI Support Services,’ in line with the Industry Classification Benchmark (ICB).
Bilfinger SEAnnual Report 2013Bilfinger in the capital market
Share-price revival after moderate development in 2013___
Unchanged good S&P credit rating (investment grade) ___
Sustained distribution policy: dividend of €3.00 per share
Bilfinger in the capital market
14
Bilfinger in the capital market Bilfinger SEAnnual Report 2013
Unchanged positive S&P credit rating
Standard & Poor’s rating for Bilfinger is unchanged as investment grade at BBB+ with a stable outlook.
In December 2012, Bilfinger issued its first corporate bond to finance further acquisitions in the context of implementing the Group’s strategy. The emission volume amounted to €500 million with a interest coupon of 2.375 percent. The bond closed the year 2013 at a price of 101.37.
Continued high weighting in the MDAX
Compared with the previous year, XETRA trading volumes continued to decrease in 2013. In line with the general market trend, trading activities continued to shift to the multilateral trading platforms and the over-the-counter market. As in 2012, less than 40 percent of trans-actions were carried out on XETRA. Within the MDAX, Bilfinger shares continued to be among the more liquid stocks: they ranked 17th by trading volume in December 2013 (December 2012: tenth). The 15th rank by market capitalization of free float (December 2012: ninth) also demonstrates the high weighting of Bilfinger shares in this stock-
BILFINGER SHARE
ISIN / Stock exchange abbreviation DE0005909006 / GBF
WKN 590 900
Main stock market XETRA / Frankfurt
Deutsche Börse segment Prime Standard
Component of MDAX, Prime Industrial Products & Services DivMSDAX, DJ STOXX 600, STOXX EUROPE TMI Support Services,DJ EURO STOXX,DJ EURO STOXX Select Dividend 30
BILFINGER BOND
ISIN / Stock exchange abbreviation DE000A1R0TU2
WKN A1R0TU
Listing Luxembourg (official trading)
Emission volume €500 million
Interest coupon 2.375 %
Maturity December 7, 2019
Year-end closing price (Stuttgart) 101.37
RELATIVE PERFORMANCE OF OUR SHARES1 YEAR
150 %
140 %
130 %
120 %
110 %
100 %
90 %
Dec 31, 2013Dec 31, 2012
BilfingerDAXMDAXSTOXX Europe TMI Support Services
MOVING 30-DAY AVERAGEin combination with monthly highest and lowest prices
€ 90
€ 85
€ 80
€ 75
€ 70
79.63
75.96
82.43 82.9882.25 82.68
81.00
76.6675.44
79.12
81.82
84.35 84.12
70.9172.50
74.05 74.07
68.67 68.9669.91 70.37
76.8278.20 77.84
Dec 31, 2013Dec 31, 2012
RELATIVE PERFORMANCE OF OUR SHARES10 YEARS
500 %
400 %
300 %
200 %
100 %
Dec 31, 2013Dec 31, 2012
BilfingerDAXMDAX
15

Bilfinger SEAnnual Report 2013Bilfinger in the capital market
exchange segment, although it decreased to 2.4 percent at the end of 2013 (December 2012: 3.2 percent). This was due to the relatively weak development of our shares compared with other MDAX stocks, as well as the lower free float.
Broad international shareholder structure
As in previous years, two shareholder surveys were carried out in 2013. Four percent of our shares are currently held as treasury stock and 96 percent are in the hands of private and institutional investors.
At December 31, 2013, the analysis of shareholders by region shows that shareholders in Switzerland, Germany, the United Kingdom and the USA continue to be the most prominent. The proportion of shares held by institutional investors declined considerably in Germany to 21 per-cent and in the United Kingdom to 13 percent. The proportion of share-holders in Switzerland, on the other hand, increased to 24 percent and in the USA to 12 percent. At 6 percent, a significantly higher proportion comes from the Benelux countries. The proportion from Scandinavia (3 percent) and France (2 percent) was nearly unchanged. Institutional investors continue to dominate our shareholder structure; the propor-tion of private investors amounts to 12 percent.
The free float, as defined by Deutsche Börse, decreased slightly in 2013 to 77 percent (previous year: 81 percent). Due to the reclas-sification by Deutsche Börse of shareholdings previously classified as non free-float, this figure increased to 96 percent at the beginning of 2014.
INSTITUTIONAL INVESTORS BY REGIONas of December 31
in %
2013 2012
Bilfinger treasury shares 4 4
Private investors 12 12
Institutional investors
Switzerland 24 22
Germany 21 25
United Kingdom 13 19
USA 12 9
Benelux 6 2
Scandinavia 3 3
France 2 3
Other 3 1
KEY FIGURES ON OUR SHARES€ per share
2010 2011 2012 2013
Earnings 1 6.43 8.93 6.26 3.91
Adjusted earnings 2 4.64 5.32 5.46 5.64
Cash flow per share 5.52 6.37 5.26 3.67
Dividend 2.50 3.40 3 3.00 3.00
Dividend yield 4 4.0% 5.2% 4.1% 3.7%
Pay out ratio 5 54% 64% 55% 53%
Highest price 64.35 70.35 77.90 84.35
Lowest price 40.75 50.47 58.82 68.67
Year-end price 63.20 65.88 73.00 81.53
Book value 6 40.84 40.51 45.96 48.67
Market value / book value 4, 6 1.5 1.6 1.6 1.7
Market capitalization in € million 4, 8 2,909 3,032 3,360 3,752
MDAX weighting 7 3.5% 3.7% 3.2% 2.4%
Price-to-earnings ratio 4, 5 13.62 12.38 13.37 14.46
Number of shares (in thousands) 7, 8 46,024 46,024 46,024 46,024
Average XETRA daily volume (no. of shares) 381,287 253,322 156,993 125,429
Unless stated otherwise, all information relates to continuing operations.All price details refer to XETRA trading.1 Includes continuing and discontinued operations 2 Adjusted for one-time expenses in connection with Bilfinger Excellence as well as capital gains and losses. Also adjusted for amortization of intangible assets from acquisitions.3 Including bonus in the amount of €0.904 Based on the year-end closing price5 Based on adjusted earnings per share6 Balance sheet shareholder’s equity excluding minority interest7 Based on the year-end8 Including treasury shares
16

Bilfinger in the capital market Bilfinger SEAnnual Report 2013
Attractive dividend of €3.00 per share
With regard to our dividend policy, our focus is on a sustainable development. A proposal will be made for the dividend for the year 2013 to remain unchanged at €3.00 per share. In relation to the share price at the end of 2013, this represents a dividend yield of 3.7 percent.
Predominantly positive investment recommendation
for Bilfinger shares
The broad coverage of Bilfinger’s stock remained almost unchanged in 2013. We are in regular contact with a total of 21 financial analysts, 13 of whom currently recommend our shares as buy and eight as hold. We provided information to institutional investors in more than 250 dis-cussions, in particular in roadshows in 17 cities in Germany and abroad, as well as by participating in eight international and seven national investor conferences.
This year’s Capital Markets Day was held in Mannheim to enable us to present the broad and integrated product offering as well as the market and business opportunities of our Power business segment. The presentations by members of the operational management were fol-lowed by a guided tour of Mannheim power station. The high number of participants is evidence of the ongoing great interest in this event.
Annual General Meeting 2013 with increased
capital presence
Shareholder presence at the Annual General Meeting increased once again in 2013. 64 percent of the share capital as defined by our Articles of Incorporation was represented (2012: 62 percent) and the event was attended by a total of 446 participants. We will continue to encour-age our shareholders to exercise their voting rights – either in person or through a proxy. All the resolutions of last year’s Annual General Meeting were passed as recommended by the management with large majorities.
MARKET CAPITALIZATION OF BILFINGER SE€ million
4,000
3,500
3,000
2,500
2,000
1,500
1,000
500
2013201220112010200920082007200620052004
3,360
3,752
3,0322,909
2,482
1,388
1,9632,065
1,499
1,112
DIVIDEND DEVELOPMENT OF BILFINGER SHARESin €
3.50
3.00
2.50
2.00
1.50
1.00
0.50
2013201220112010200920082007200620052004
3.00 3.00
3.40
2.50
2.001.85
1.66
1.15
0.920.92
0.90*
2.50
* Bonus dividend
17

A DAY AT BILFINGER
BY DAY OR BY NIGHT, WHEREVER THE HANDS OF THE CLOCK CAN BE FOUND, YOU CAN ALSO FIND BILFINGER SPECIALISTS WORKING FOR THEIR CLIENTS
SOMEWHERE IN THE WORLD. THEY ARE DELIVERING THE BEST ENGINEERING AND SERVICES SOLUTIONS AVAILABLE FOR
INDUSTRY, ENERGY, REAL ESTATE AND INFRASTRUCTURE.
Rio de Janeiropage 26
Bismarckpage 20
18

Moscowpage 47
Pretoriapage 42
Rotterdampage 30
Ingolstadtpage 38
Sakhalinpage 51
Munichpage 34
19

20

The U.S. is now the largest gas producer in the world. The shale oil reserves
are enormous.
21

New technology is ensuring that development of the huge oil and gas reserves in the USA is economically viable. The country could even become independent from fuel imports. Bilfinger Westcon Inc., the Bilfinger subsidiary located in Bismarck, North Dakota, is benefiting from the nation-wide boom.
It’s just before five a.m. on a frosty November morning in Bismarck, North Dakota, as Mario Silva climbs into the eight-seat corporate jet. His destination is Ohio, 1,268 miles away to the east. The native of Brazil has worked in Wyoming, Montana and Nebraska for his employer Bilfinger Westcon. He has been involved in the construction of gas processing plants and refineries, as well as food processing and agricultural plants. During the project near the village of Kensington in Ohio, the 35-year-old will act as Project Manager / Superintendent and will lead several hundred craftsmen including welders, iron workers, pipe fitters, and crane operators. Silva will be responsible for the expansion of an existing gas plant – this is a part of one of the largest projects that Bilfinger Westcon has ever constructed. Using a cryogenic process, this plant extracts the natural gas liquids from the product that is received by pipeline. Today, Silva will be meeting with the owner of the plant to introduce himself and to have them review his resumé to see if they feel he is capable of running the project. The meeting will take place in a few hours. Stressed? “Not at all,” answers Silva, “We’re well prepared.”
In the USA, a development is taking place that some observers describe as a revolution. In Ohio, North Dakota, Pennsylvania, Montana, Texas and some other states, huge new oil and gas reserves have been discovered in recent years, and their exploration has become economically feasible, thanks to the development of hydraulic fracturing. With this method, the oil and gas that has formed in the shale is broken down using high-pressured water and chemicals. The shale gas forma-tions are so vast that the USA has now become the biggest gas pro-ducer in the world and in a few years the country may be able to export gas. Calculations suggest that the country could even be completely independent of energy imports by 2025. Because of the relatively cheap supply of domestic energy, some analysts are already predicting a wave of re-industrialization in the United States.
The planned expansion project in Kensington is just a small part of a larger project in Ohio that will turn the coveted raw materials into usable energy. A consortium of three companies is planning to invest about $900 million over a period of five years. The natural gas will be pumped through a network of pipelines from hundreds of drilling sites in the surrounding countryside to these processing plants. Its first stop is Kensington, where it will be separated into methane and other gases.
A ‘WONDERLAND’ FOR ENGINEERS
Bismarck5:21 a.m.
22
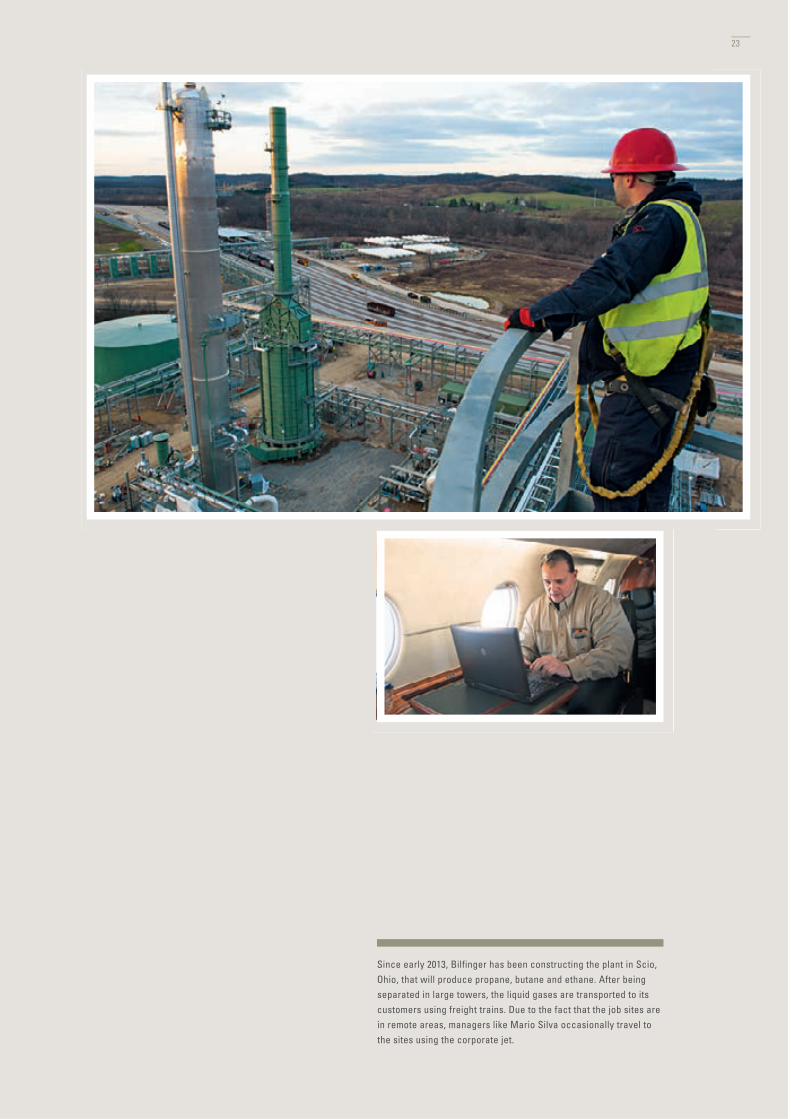
Since early 2013, Bilfinger has been constructing the plant in Scio, Ohio, that will produce propane, butane and ethane. After being separated in large towers, the liquid gases are transported to its customers using freight trains. Due to the fact that the job sites are in remote areas, managers like Mario Silva occasionally travel to the sites using the corporate jet.
23

The setting of the towers and equipment not only requires huge cranes and lifting platforms, but also precise schedules. Mark C. Peterson, CEO of Bilfinger subsidiary Westcon, often takes care of this personally: the self-made man, who began his career as an iron worker, knows the business in both theory and practice.
24

Nearly 30 miles away, on the outskirts of the village of Scio, in a liquid gas fractionation plant also built by Bilfinger Westcon, the raw material will then be processed into butane, propane, ethane and gasoline. The product will be delivered to customers through a newly constructed loading facility. The steel ensemble of towers, boilers, tanks, compres-sors and miles of pipelines, which already produce thousands of barrels of liquefied gas every day were part of Phase I. That portion of the pro-ject was described by a reporter from the regional newspaper as an engineer’s wonderland.
Project Director Bill Bradley, who coordinates the work of a few dozen Bilfinger Westcon managers and several hundred workers from different trades, oversees both construction sites. The pace in Ohio is breathtaking: “When we started here just 11 months ago, it was a $20 million contract. Then the project scope grew with the addition of further trains. We started with train one and now we’re talking about getting the contract for train three. In the end, we could be looking at a $250 million project.” Of the more than 1 million man-hours worked, some of them stand out in your mind more than others. Bradley can especially remember one day this summer, when a depropanizer vessel weighing 230 tons was delivered from Texas and erected with two heavy-duty cranes. “Whoever thinks that this is about measuring inches, is mistaken,” says Bill Bradley. “This is precision work. Just before we got the tower standing, the winds started blowing. We had to pause for an hour, but then luckily we were able to continue,” explains Bradley. “I’ve experienced operations like this many times before, but I still get an adrenaline rush every time.”
Mark C. Peterson is CEO / President of Bilfinger Westcon Inc. His com-mitment to satisfying the customer with quality work has been the key to his success. “Service is what really makes us stand out.” Peterson founded Westcon in 1981. He was the sole owner for several years, and integrated it into Bilfinger Westcon in 2012. He helps to develop the lift procedures and if needed he puts on his work boots and heads out to the field to make sure that the lifts are done safely and properly. Safety and his employees are both very important to him. The self-made man who began as an iron worker, puts on his jeans and heads out to one of the job sites where the employees will be working through a holiday.
“A few years ago, power plant construction was an important topic, after that it was ethanol plants and now oil and gas are hot. You have to follow the industries as they evolve. No matter what industry we are dealing with, we go the extra mile for our customers.’’ Peterson points to the model of the corporate jet on his desk. “This is perhaps the best buy we have ever made,” says the CEO. He flips through his calendar showing this week’s travel schedule. Wednesday: Tioga, North Dakota; Thursday: Scio, Ohio; Friday: Dallas, Texas.
In Ohio, Bilfinger Westcon employee Mario Silva is preparing to head back home to Bismarck following his meeting with the owner of the project. Shortly before the company jet takes off, his cell phone rings and he receives the news he was waiting for. “Congratulations Mario, we’ve got the green light, you can start in four weeks.”
“Service is what really makes us stand out. We go the extra mile for our customers.’’
25
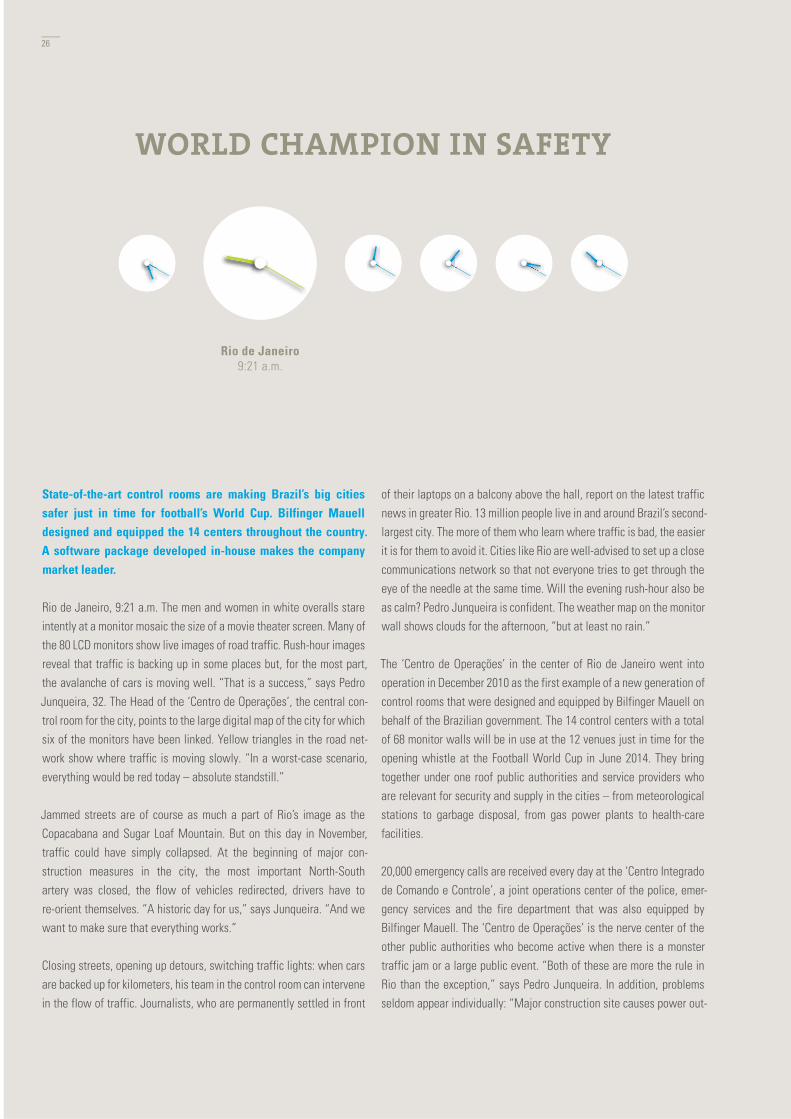
State-of-the-art control rooms are making Brazil’s big cities safer just in time for football’s World Cup. Bilfinger Mauell designed and equipped the 14 centers throughout the country. A software package developed in-house makes the company market leader.
Rio de Janeiro, 9:21 a.m. The men and women in white overalls stare intently at a monitor mosaic the size of a movie theater screen. Many of the 80 LCD monitors show live images of road traffic. Rush-hour images reveal that traffic is backing up in some places but, for the most part, the avalanche of cars is moving well. “That is a success,” says Pedro Junqueira, 32. The Head of the ‘Centro de Operações’, the central con-trol room for the city, points to the large digital map of the city for which six of the monitors have been linked. Yellow triangles in the road net-work show where traffic is moving slowly. “In a worst-case scenario, everything would be red today – absolute standstill.”
Jammed streets are of course as much a part of Rio’s image as the Copacabana and Sugar Loaf Mountain. But on this day in November, traffic could have simply collapsed. At the beginning of major con-struction measures in the city, the most important North-South artery was closed, the flow of vehicles redirected, drivers have to re-orient themselves. “A historic day for us,” says Junqueira. “And we want to make sure that everything works.”
Closing streets, opening up detours, switching traffic lights: when cars are backed up for kilometers, his team in the control room can intervene in the flow of traffic. Journalists, who are permanently settled in front
of their laptops on a balcony above the hall, report on the latest traffic news in greater Rio. 13 million people live in and around Brazil’s second-largest city. The more of them who learn where traffic is bad, the easier it is for them to avoid it. Cities like Rio are well-advised to set up a close communications network so that not everyone tries to get through the eye of the needle at the same time. Will the evening rush-hour also be as calm? Pedro Junqueira is confident. The weather map on the monitor wall shows clouds for the afternoon, “but at least no rain.”
The ‘Centro de Operações’ in the center of Rio de Janeiro went into operation in December 2010 as the first example of a new generation of control rooms that were designed and equipped by Bilfinger Mauell on behalf of the Brazilian government. The 14 control centers with a total of 68 monitor walls will be in use at the 12 venues just in time for the opening whistle at the Football World Cup in June 2014. They bring together under one roof public authorities and service providers who are relevant for security and supply in the cities – from meteorological stations to garbage disposal, from gas power plants to health-care facilities.
20,000 emergency calls are received every day at the ‘Centro Integrado de Comando e Controle’, a joint operations center of the police, emer-gency services and the fire department that was also equipped by Bilfinger Mauell. The ‘Centro de Operações’ is the nerve center of the other public authorities who become active when there is a monster traffic jam or a large public event. “Both of these are more the rule in Rio than the exception,” says Pedro Junqueira. In addition, problems seldom appear individually: “Major construction site causes power out-
WORLD CHAMPION IN SAFETY
Rio de Janeiro9:21 a.m.
26

27

30 public authorities and service providers work together under one roof at the Centro de Operações in Rio de Janeiro. More than 600 traffic cameras send images from around the city to the control room. “Today we can provide more targeted assistance,” says Pedro Junqueira, 32, the manager of the new center that was designed and equipped by Bilfinger Mauell.
28

age causes traffic chaos.” One problem leads to the other: “When something happens in the future, we will have an optimal degree of coordination via the new control centers.”
When he says that, it brings up the painful memory of spring 2010, when heavy rains in Rio washed away entire mountain slopes and the Favelas that were built on them. More than 70 people died. “The rescue teams set out as quickly as they could back then,” says Junqueira. But nonetheless: “Without a shared operations center a lot of time was wasted with telephone calls.” The natural disaster accelerated the planning of the ‘Centro de Operações’ and six months later the brand new glass cube including the control room was unveiled by the Mayor of Rio. “Today, we can provide more targeted assistance,” says Junqueira.
The new control centers which Bilfinger Mauell equipped for the public sector are among the biggest and most modern in the world. The company, with its headquarters in Wuppertal, Germany, and about 460 employees in five countries, recently became part of the Bilfinger Group. In Brazil it has held a leading position in the market for control room technology for many years. To date, the company has installed about 700 monitor walls in the conference rooms of large companies
throughout the country. And when Brazilian President Dilma Rousseff wants to access data and images, she also uses an LCD wall including software from Mauell.
“A breakdown of our main control system is basically impossible,” says Klaus Liesenberg, CEO of Bilfinger Mauell in Brazil. “There is a computer behind every monitor which is familiar with both its own part as well as all of the other parts,” the descendant of German immigrants explains, describing the principle of the company system ‘X omnium’. The overall picture which consists of individual monitors and monitor groups, is controlled by one of the computers. If this computer fails, control is automatically assumed by one of the other computers. As a Microsoft Gold Partner, Bilfinger Mauell can rely on an extensive software library in order to constantly develop its own technology.
It is now before noon in the ‘Centro de Operações’. The mood is relaxed. There are of course a few minor problems on some main traffic routes, but the major standstill has been avoided. Pedro Junqueira is satisfied.
“We have been preparing people for this day for weeks. And when there were small accidents, emergency services were quickly at the site to clear the street.” The team barely has time to take a deep breath because the second rush-hour of the day will begin in a few hours. Pedro Junqueira is certain: “We will manage that one, too.”
“It is virtually impossible for our system to fail. If one computer goes down,
another one takes control.”
29

30

In Rotterdam, an entire refinery was shut down, maintained, modernized – and put back into operation: for eight Bilfinger Group companies, what was most important was precision, speed and exact timing.
The refinery from Kuwait Petroleum Europoort (KPE) on the western edge of Rotterdam’s port is a giant structure made of pipes and reactors, of columns, boilers and coolers. Each year, about 4 million tons of crude oil is processed into benzene, diesel, kerosene, lubricant, liquid gas and asphalt. About 350 people work here when the facility is in normal operations. But now, in fall 2013, the plant is facing extraordinary circumstances: at peak periods, up to 3,500 workers are hurrying around the facility at the same time. The GOP, the benzene production plant with its towering structures can hardly be seen. It has disappeared behind the giant scaffolding.
Rainer Gross heads the Turnaround unit at Bilfinger Maintenance North. When he stops in front of the GOP during his midday tour, he looks up at four pipe ends that are sticking out of the scaffolding. One after the other, these pipes will be loaded with meter-long bundles of piping – heat exchangers that are responsible for the cooling or the heating of the processed liquids. The angle at which the pipe bundles are inserted
has to be exactly right. A crane, a telescopic handler and two specialists with a spirit level carry out the precision work. Gross gives a satisfied nod as the first bundle disappears into the pipe. His watch says shortly past two. At this pace, everything will go according to plan.
During the turnaround, the refinery will be shut down, emptied, cleaned, checked, maintained and repaired. And then, when everything is in place, it will slowly go back into operation. A shutdown such as this one is as important for industrial facilities as a pit stop is in Formula 1. Here, in record time, the conditions are being met to ensure that everything runs smoothly once it gets back on track. And, just like in Formula 1, every screw has to be perfectly in place.
Bilfinger is coordinating the process as general contractor. This is already the fifth turnaround that Bilfinger has carried out for KPE. And it’s the biggest: until now, one-half of the refinery was shut down at two-year intervals. The turnaround in 2013 was a turning point. From now on there will be a complete shutdown every five years. In addition to testing, cleaning and maintenance work, the opportunity will also be used for a revamping: for the modernization and upgrading of the facility.
A REFINERY TAKES A PIT STOP
Rotterdam12:21 p.m.
31

Although the name makes it sound like something different, the shutdown is actually the acceleration phase of a process that takes up many months with preparation and follow-up work. A team headed by Jens Teichmann, Turnaround Project Manager at Bilfinger Maintenance North, sets up its planning camp on the grounds of the refinery already in the fall of 2012. From January 2013, a monthly coordination meeting takes place with the client. In March, six months prior to the shutdown, three dozen Bilfinger specialists are already in the facility. The scaffolders come in May. Most of the mechanical engineers arrive at the beginning of October, just before the fast-paced shutdown begins. In February 2014, one year and two months after the project began, the last Bilfinger employees leave the KPE facility.
A calendar hangs on the wall in the container office of Rainer Gross and Jürgen Schuh, Head of Turnarounds & New Markets. The 16th and the 23rd of November 2013 are highlighted – the handover dates for the GOP and the lubrication plant. While Gross reviews the progress of the work on the heat exchangers on his tour of the plant, Schuh calls up the overall progress report on his computer. The program is the digital backbone of the shutdown. It connects all project managers with all relevant information available – and provides real-time insight into the status of the project.
The program also provides a glance into the future. But although it promises a ‘three-day outlook plan’ which minutely details all upcoming sub-projects and the specialists who are involved in each of them, the plan can in fact only deliver a reliable forecast for the next few hours:
“Only in the early morning does KPE issue its approval for the activities of that particular day,” explains Schuh. This is because a broad range of factors have to be taken into account at short notice, such as the pro-
gress in the other sections of the refinery or delivery times for compo-nents recently ordered. A shutdown demands a high degree of both commitment and flexibility.
Rainer Gross’ tour also takes him to the production hall, in the middle of which a steel cylinder weighing several tons seems to be floating like a giant torpedo. Only after looking closely does one notice the supports that keep it hip-high. The cylinder is a mix container from the GOP, equipped to withstand pressures of 27.3 bar, built in 1983. A pipe fitter has separated a window from the steel coat. Now a materials tester is spraying the edges of the window with white contrast paint. He then sprays it with a liquid that contains tiny metal filings. Using two magnet bars it is thus possible to detect even the smallest of cracks. In this case, everything is fine. “N.D.” scribbles the materials tester on the container: no defect.
On this particular day in November, Bilfinger coordinates 595 scaffolders, insulators, cleaners, fitters, welders, foremen, site managers, project planners and technicians. Nearly a third of them come from Bilfinger Industrial Services Nederland. The others are Bilfinger colleagues from Leuna and Neustadt on the Danube, from Bitterfeld and Munich, from Austria and Slovakia as well as employees from partner companies and external service providers.
Ensuring that the many thousands of individual procedures from the companies involved become one large whole in which every cog in the works meshes perfectly – that is the ultimate objective. A turnaround, says Rainer Gross with a smile, means the greatest imaginable degree of chaos to which a clear structure must be given: “And that’s what I love about this job.”
Bilfinger specialists are laying the groundwork to ensure that operations
can begin again in record time.
32

A materials tester examines a component: many thousands of such individual tasks from hundreds of scaffolders, insulators, cleaners, fitters, welders, foremen, site managers, project planners and technicians have to be coordinated for the turnaround at the Rotterdam refinery.
33

The HVB Tower will be transformed into a green building. Among other new features, it will receive a new façade with energy-saving glazing. During the clearing stage, all the material will be disposed of cleanly using space-saving building ‘elevators’. Construction logistics expert Sebastian Havasi is responsible for ensuring that all the building contractors can expect the best working conditions every day.
34

Bilfinger’s construction logistics specialists ensure that time and money are saved on large-scale construction sites – on the modernization of HypoVereinbank’s HVB Tower in Munich, for example.
Sebastian Havasi stands on the roof of the HVB Tower in Munich. His view stretches as far as the Frauenkirche cathedral in the city center whose bells strike noon and can be heard throughout the city. The cathedral’s towers used to overlook all other buildings in Munich. That was until the end of the 1970s when the administrative building of the HypoVereinsbank was built. This 113-meter-tall banking center has now become a city landmark which shapes Munich’s skyline.
Now, three decades after the building was inaugurated, this listed sky-scraper building has to be renovated. The idea is to transform the land-mark into a resource-conserving, eco-friendly green building with a modern, open-space interior design concept. The building services will be upgraded to enhance efficiency, and the building will be given a new facade with energy-efficient glazing.
“This conversion in the densely populated Arabellapark is a real chal-lenge,” comments Sebastian Havasi. A main highway runs along the building’s west side, and hotels, businesses and offices are directly facing it. Bankers also continue with their day-to-day activities in the low-rise building next to the tower. There is hardly enough space avail-able to deliver material or set up containers, skips and cranes. Despite the lack of space, the project manager and his team from the Bilfinger subsidiary bauserve are responsible for overseeing the tower’s mod-ernization: “As construction logistic experts, it is our job to ensure that the companies commissioned to overhaul the building can carry out their work swiftly and efficiently,” explains Sebastian Havasi.
On many large-scale construction sites, it is usually left to the compa-nies to manage the logistics themselves. “This results in a drop in pro-
ductivity as each company is left to its own devices,” explains bauserve Managing Director Andreas Goetz. “In contrast, we look to optimize all operations across the entire project for all the companies involved and provide them with the necessary infrastructure. We can thus reduce the construction timeframe and minimize costs for the clients.” These plan-ning and coordination services can free-up capacities for other impor-tant managerial tasks such as monitoring and quality control.
For the renovation of the HVB Tower, bauserve calculates the capacities needed to supply new material and dispose of old materials on the construction site. Two cranes positioned on the staircase towers are used to replace the façade. The logistics experts installed two large construction elevators on the building’s east side to transport old mate-rial once the building has been cleared and to safely supply material at a later stage in the project. The rolco system, developed and patented by Andreas Goetz, will be used on the entire construction site. The old-fashioned wheelbarrow is still often seen in action transporting waste around construction sites despite its obvious disadvantages such as low volume as well as the continuous loading and unloading of material by hand. In contrast, the rolco roller containers offer a cleaner and more productive approach to waste disposal: “The waste is sorted directly on-site.” It does not have to be emptied by hand; fork-lift trucks situated at the bottom of the tower pick up the bins and dispose of their contents in large-scale containers.
This simple yet ingenuous solution is an important element of the con-struction logistics concept developed by bauserve over the last 15 years. The logistics experts at bauserve initially worked with spread-sheets and data manually. A special IT system was soon developed to manage this task and has been in operation for a long time: every build-ing contractor involved in a project is responsible for registering the transport services it requires online before work begins. In this way, the construction site can operate in accordance with the just-in-time princi-ple. Defined timeframes help to relieve congestion and traffic on the
MODERNIZING A MUNICH LANDMARK
Munich12:21 p.m.
35

36

“As construction logistics experts, it is our job to ensure that contractors can carry out their
work quickly and efficiently.”
37

Germany needs new overhead power lines. At the same time, pylons are being reinforced to allow them to transport more electricity and withstand extreme weather conditions. This is why Bilfinger FRB is sending its men up these steel giants come wind or high weather.
12:21 p.m. in a field near Ingolstadt, in the Free State of Bavaria, Ger-many. In his bright luminous yellow jacket, Thomas Weitzel is instantly recognizable at the top of a 65-meter-high electricity pylon. He stretch-es his arms and grabs hold of the steel cables being lowered down by crane. After loosening rows of bolts on the steel lattice tower, col-
leagues below him are tightening the cables to the pylon. Once finished, they climb down the steel struts and take off their heavy climbing gear when they reach the ground. Now it is the turn of the crane operator.
The wind is slowly picking up. The crane now lifts the top two-thirds of the electricity pylon four to five meters up into the sky while the wires are still connected to the neighboring pylons. 36 tons of steel are now hanging from the crane’s hook. Only the 10-meter high base section remains fixed to the ground. But not for long. This section is lifted up by a smaller crane and is deposited on the field. The Bilfinger FRB workers then install a new, pre-assembled base section on the existing founda-
ENERGY TRANSFORMATION AT DIZZYING HEIGHTS
construction site. bauserve was recognized for its comprehensive approach by the German Logistics Association (BVL) which awarded the company the Logistics Service Award.
Project manager Havasi and his team have to manage thousands of small tasks on the HVB tower every day. They installed sanitary facili-ties on each floor for the construction workers, fitted 300 floodlights and construction lamps and 120 electricity distributors all over the building and laid meters and meters of cable on all levels, 200 meters on the roof alone for the crane’s electricity supply. bauserve provides the construction companies with their own hire containers which can be used as office space, for lunch breaks or for storage. Up to 350 work-ers are in action on the construction site at the same time. The logistics experts are also responsible for checking work permits and access rights to the construction site.
“Many of our clients are only concerned with the final product. It is often underestimated what a positive impact the building process can have on quality and cost,” comments Andreas Goetz. “But word is now grad-ually getting around!” Bilfinger sees an opportunity for growth in the construction logistics sector and excellent potential in Germany and Europe. This explains Bilfinger’s recent takeover of another company specializing in logistics. The Bilfinger Group is now the largest provider of engineering and planning services for construction logistics in Ger-man-speaking countries.
It’s 7 p.m. and the skies above Munich are dark. Workers have clocked off for the day. Sebastian Havasi now inspects all floors and checks that all the doors are closed and decides what still has to be done this even-ing or first thing in the morning. “At the start of the project, many of those involved repeat the same phrase over and over again: You can’t do that!” the project manager says and smiles: “Then we prove them wrong.”
Ingolstadt12:21 p.m.
38

39

The Irsching power plant is shut down for inspection over a total of 10 days. In this short period, utility masts will be raised so that energy provider TenneT can transport more electricity through the lines. 36 tons are hanging from the crane.
40

tion. It is 2 meters higher than the old section. This is the main reason behind all this time-consuming work on this rainy day out on the fields near Ingolstadt: the height of the electricity pylon is being raised.
Franz Zellner looks up to inspect the sky. He spent 20 years of his life climbing up the pylons. He has now been sent by his employer TenneT. The grid operator awarded Bilfinger FRB with the conversion contract.
“The men have to be finished today,” explains Zellner. Although the wind is picking up and a wind strength of 4 is sweeping through the flat countryside, Zellner says, “Don’t worry, they will manage it. The men can work well even at wind strengths of 6.” Zellner himself climbs up the pylon in the late afternoon to check that the fitters have done a clean job: “This is just a formality. The men are professionals.”
TenneT wants to increase the capacity. This causes the wires to heat up more, the wires become longer and hang lower down between the pylons. The wires would then hang below the mandatory minimum distance to the ground. This is why it is necessary to raise the height of many of the electricity pylons in operation. “We call this strengthening the wires,” explains Olaf Wegermann, Managing Director of Bilfinger FRB. The Irsching power plant is shut down for inspection for a total of 10 days: no electricity flows through the 380-kV line and 4 pylons have to be raised in this short period.
Bilfinger FRB is also seizing the opportunity to overhaul the overhead lines to prepare for the effects of climate change. Extreme weather con-ditions such as storms and prolonged cold spells are increasing. Wind and ice are both a major threat to the wires. Wegermann thinks back to the chaos that erupted in the heavy winter of 2005 in Münsterland:
“Electricity pylons collapsed under the weight of the ice.” The result was a series of power cuts, an incident which should never be repeated. This is why it is vital to make 17 of the pylons more resistant. On some pylons, the foundations have to be reinforced.
The energy transformation is the final reason why the power grid has to be changed. A great deal of wind power is generated in Germany, espe-cially in the North and on the high seas, and this has to be transported to consumers. New transmission lines are being installed all over Ger-many. Installed lines are also being overhauled – an immense potential for Bilfinger FRB. 13.5 kilometers of lines were fitted near Hamm-Uen-trop to transport wind power to the South of Germany. 60 fitters worked hard from May 2012 to the summer of 2013 laying 8 kilometers of 380-kV cable from Koblenz-Weißenthurm to Sechtern. This is a section of a high-voltage DC line along the ‘Rheinschiene’ as it is known in Ger-man, one of the most important electricity highways that runs next to the river Rhine and transports eco-friendly power.
Thomas Weitzel, the man in the yellow jacket, wears a type of head scarf underneath his climbing helmet. “The wind whistles all around you up there,” he says. “But I enjoy it because it is not run-of-the-mill work. Overhead line fitters cannot suffer from vertigo or be faint-heart-ed.” He then climbs up the pylon again as the new bottom section still has to be bolted to the top section which can then be unhooked from the crane. Weitzel and his colleagues finish the job just as darkness begins to fall.
There are only a handful of companies in existence that can tackle this type of demanding work on overhead long-distance power lines. Bilfin-ger FRB with sites in Dinslaken and Luxembourg can look back on over 20 years of experience in this sector. In addition to TenneT, they also count e.on, RWE and other grid operators among their clients. The com-pany recently founded a new subsidiary in Bersteland, Brandenburg, responsible for the region in Eastern Germany. The specialists need more support, Olaf Wegermann says: “We offer good fitters, surveyors and engineers excellent opportunities.”
Overhead lines toward the south are being expanded. Electricity highways
for eco-friendly generated power.
41

Bilfinger plays an important role in feeding South Africa’s appetite for energy. The company supplies parts for new power plants and is helping to upgrade the efficiency of old facilities. The success is attributed to the company’s qualified employees. The company’s in-house training program enjoys an excellent reputation.
1:21 p.m. at Bilfinger training center in Pretoria. Sparks are flying every-where. Dozens of young people wearing protective masks are bending over their work pieces. Trainees dressed in blue overalls are busy learn-ing how to weld. In the next room, prospective metalworkers are taking out their rulers and pencils for a lesson in technical drawing. There are a remarkable number of women among the trainees, one of whom is Minor Kgalema. “I am training to become a welder,” says the 29-year-old with purple painted finger nails, smiling: “Why can’t we do the job just as well as men?” The mother of two explains that she is trying to secure a safe future for herself and her children. If she successfully completes the training course, Bilfinger Power Africa guarantees her, as well as all the other successful graduates, a permanent job. “I need financial security as I am the sole provider for my mother and my children.”
Education is not just the foundation for her own future; the company’s success also rests in her hands. In 2013, 168 young people completed training programs to become welders and other skilled workers. “Our training program enjoys an excellent reputation,” says Salvador Freiherr
von Neuberg, Managing Director Bilfinger Power Africa. In August 2013, the company was awarded a gold medal from the South African Insti-tute for the Welding Profession. “Our pro active training program is vital for us to succeed,” explains von Neuberg. “We are experiencing an annual growth rate of between 5 and 10 percent. A general shortage of qualified skilled workers is noticed throughout the country.”
The appetite for energy in this emerging country with its booming econ-omy is enormous. 37,000 megawatts are currently being generated.
“South Africa will need approximately 20,000 megawatts of additional power by 2020,” stresses von Neuberg. Yet many of the country’s power plants are outdated and prone to failure. New plants are urgently required. This is where Bilfinger services are called on to construct, repair, refurbish and overhaul power plants.
One figure alone clearly underlines just how important the 2,300 Bilfinger employees in South Africa are for the energy economy: “We are currently responsible for the maintenance and repair of 44 percent of all power plants in South Africa,” says von Neuberg. In November 2013, the state energy supplier Eskom entered into negotiations to extend its framework agreement with Bilfinger, a contract covering the maintenance of six major plants, until 2016. Bilfinger is also supplying pressure parts, compensators, pipelines and suspension systems for the construction of two new coal-fired power plants in Medupi and Kusile, which, when finished, will be among the largest plants in the world. Bilfinger Power Africa has also extended its business operations
‘MADE IN SOUTH AFRICA’ – A LABEL OF QUALITY
Pretoria1:21 p.m.
42

Minor Kgalema is pleased to receive such good training. The workplace of this 29-year-old is secure. Qualified skilled workers are in high demand in South Africa. In 2013, Bilfinger trained a total of 168 young people at the Cape – excellent well-trained personnel is the most important factor for success if a company wants to compete in the country’s booming power plant industry.
43

“We are well-respected because we send the right teams to the right place
at the right time.”
44

45

South Africa is an enormous market for Bilfinger in the next two decades. 800 employees work at the Pretoria plant – but not just for the country’s own energy economy. Some of the components are exported to power plants in Poland: “Everything we produce here complies with the European standard,” says Managing Director von Neuberg.
46

The Mercury City Tower rises 75 stories high into the sky above Moscow. Bilfinger was responsible for technical consulting during construction of Europe’s tallest skyscraper and is taking over the entire facility management with 120 employees.
3:21 p.m. in downtown Moscow. Konstantin Vishnyakov’s key chain is big and heavy, the Bilfinger engineer holds it like a shopping bag dan-gling in his hand, the dozens of keys clatter together with every step he takes. But Vishnyakov only has to look for a few seconds until he finds the right key: 52/5/23 is written on the tag. 52nd floor, section 5, room 23. There’s a smell of fresh paint in the air as he inspects the cables on
the ceiling. Far below the panoramic window lies the city of Moscow. Even the monumental Soviet palaces look dainty from up here. “Of course I’m proud to work in this extraordinary building,’’ says Konstantin Vishnyakov. ‘’We make sure everything runs smoothly here.’’
To the west of the capital, on the banks of the Moskva River, Moscow-City is starting to take form. The Mercury City Tower is currently the tallest tower in the new skyscraper district, people like to call it the Manhattan of Moscow. At 339 meters, the tower is the tallest building in Europe – from a technical point of view, it is a 75-storey challenge. Bilfinger is responsible for facility management in the tower that is now
FACILITY MANAGEMENT IN MOSCOW’S MANHATTAN
to supply the petrochemical industry. 400 employees are currently working on the construction site of a gas refinery for the Sasol company.
“South Africa is a vast market and will be for the next two decades,” says von Neuberg.
He is particularly proud of the site in Pretoria which employs a workforce of 800. “The power plant components that we produce here comply with all European standards.” The company’s European colleagues from Bilfinger Power Systems have just put in an order for compensators and other parts for the Belchatow power plant in Poland: thousands of seams have been accurately welded at the South African site. ‘Made by Bilfinger in South Africa’ is a label of quality.
According to von Neuberg, carefully laid long-term work schedules and plans are frequently thrown into disarray. For example, he has to send hundreds of welders and metalworkers within a matter of days to an old power plant where tube leaks have occurred or other urgent main-tenance work has to be carried out. Sometimes the extensive inspec-tion and maintenance of a power plant, which is due every three years, is suddenly postponed for weeks or even months. One of the reasons can be that the affected plant cannot be shut down because it has to stay connected to the grid and generate electricity. “We have a lot of experience in re-planning and reorganizing,” says Salvador von Neu-berg. “We are well-respected because we send the right teams to the right place at the right time.”
Moscow3:21 p.m.
47

48

almost ready for its first tenants. The first employees were already in place in November 2013, and soon there will be around 120 Bilfinger personnel to make sure that the electricity, water, heating and air conditioning never fail, the lifts are reliable and arrive promptly when the button is pressed and that the building, including the reddish shim-mering glass facade, is cleaned. They will also ensure that the reception is always open and that no unauthorized persons enter the building.
An increasing number of investors want their building operation services managed by a single source. Alexander Vorontsov is General Director of
‘Mercury City Tower’, the company that carried out the construction. He does not hesitate when asked why Bilfinger was chosen. The engineer-ing in skyscrapers plays an important role: “Bilfinger is quite simply the most experienced company in this area.”
A skyscraper that is built over several years is like your own child that you look after and see grow up. “Now we’re just about to send the child off to school,” says Vorontsov. The first office floors have already been rented out while construction workers carry out the detailed work on other floors. Bilfinger has known this ‘child’ since the day it was born. In
2008, the company was also put in charge of the technical audit during the planning phase: Bilfinger advised on the choice of building materials and reviewed the suitability of the architects’ proposals from a facility management perspective. “If Bilfinger engineers say the planning can be put into practice, we know we can trust them,” says Alexander Vorontsov.
Bilfinger has been active in Russia since 1997, and today more than 1,100 employees work in the CIS countries. The company is especially in demand in the Russian capital. In Moscow-City alone, Bilfinger looks after two other projects alongside the Mercury City Tower: one other skyscraper and the underground shopping center, Afimall City.
Engineer Konstantin Vishnyakov has come down from lofty heights to the service floor. The tower’s control center is located in the basement where Bilfinger employees look after the fine tuning of the building. On their screens they can keep a close eye on every fan, pump and circuit. The screens are currently showing a complete overview of the tower. Small blue boxes are moving from the top to the bottom and back again. These are the lifts that have recently been built and are now being
“The engineering in buildings plays an important role.
Bilfinger is quite simply the most experienced company in this area.”
49

No job is too big: part of facility management in Europe’s tallest skyscraper is ensuring that the shimmering red facade remains absolutely clean. The constant presence of Bilfinger employees means that the users of the building can count on the trouble-free functioning of the building technology and that costs remain low.
50

On Russia’s largest island, Gazprom and its partners have built an integrated oil and gas production facility that is among the largest in the world. Bilfinger consultants carried out an extensive efficiency review at Sakhalin-2.
10:21 p.m. At what is supposed to be the end of the working day, Steffen Simon and his Bilfinger colleagues are sitting in the hotel in front of their laptops, evaluating interviews, preparing presentations. The exchange with colleagues at headquarters in Munich works best after midnight – with a time difference of 10 hours.
The trip from Germany to Sakhalin, Russia’s largest island located between the Sea of Japan and the Sea of Okhotsk, took three days. For five weeks, Senior Consultant Steffen Simon, together with other specialists from the company and Bilfinger subsidiary Tebodin, conduct-ed interviews with hundreds of employees from Sakhalin-2, one of the world’s largest integrated oil and gas production projects. The client is the Sakhalin Energy Investment Company Ltd. The goal is the optimiza-tion of the liquid gas facility: work organization, technical aspects, maintenance work, documentation – the whole package. “The Sakhalin Energy processes are generally very good,” says Steffen Simon. “But as is the case everywhere, it is especially difficult to squeeze out the last few percentage points.”
SHORT NIGHTS ON SAKHALIN
tested. The Mercury City Tower has 26 elevator shafts, 10 of which have twin-lifts: two lifts in one shaft. No visitor to the skyscraper should ever have to wait any longer than 30 seconds for the elevator. In Russia, all those in the central technology room agree, such twin-lifts are unique.
The entire building is equipped with a ventilation control system. Sensors constantly send updated data about the air composition in each of the rooms in the tower. Bilfinger employees can look up the circuits of all fans and filters on their screens, compare standard values with actual values, track down sources of error and send out repair teams.
Konstantin Vishnyakov continues on to the heating system. Hot water in the Mercury City Tower is pumped up to the top over four stations on floors 14, 41, 57 and 69. Vishnyakov’s fingers flit across the control sur-face of a touch screen; with a few movements he can readjust the heat-ing system. When he finishes work in the evening and is on his way home, he always casts a glance back at the building, he says lost in thought. The tallest skyscraper in Europe is at its most beautiful in the evenings, when the setting sun is reflected in the windows. “That’s when our tower sparkles like gold,” says the engineer.
Sakhalin10:21 p.m.
51

The nights on Sakhalin are short for the consultants from Europe. In the mornings, they set out before 6 a.m. Before they set foot on the road, they attach so-called ‘stoppers’ – not unlike football cleats – to the bottoms of their shoes. They help you keep your footing on the icy paths. The morning meeting is scheduled for 7:30 a.m. At 5 p.m., the feedback round with the team begins. In between there is one interview after the other. That’s the routine, day after day.
Sakhalin Energy is a production consortium which, in addition to majority owner Gazprom, also includes Shell, Mitsubishi and Mitsui. Together they are developing gas and oil fields in the sea. In Aniva Bay on the southern coast of the island, which stretches to within 40 kilometers from the northern Japanese island of Hokkaido, Russia’s first liquid gas plant was opened in 2009. Here, 850 kilometers from the most northerly of the three production platforms, gas and oil for the East Asian and the North American markets are shipped. The distance, which is roughly the same as the distance between Vienna and Copenhagen, is bridged by pipelines.
The piping system on the island and offshore is more than 1,900 kilometers in total. It has many technical features to protect it from earthquakes, because Sakhalin is in the same tectonically active zone as Japan. More than 2,000 employees operate, monitor and maintain Sakhalin-2.
The processes that keep such a gigantic industrial facility up and running are complex. The consulting services from Bilfinger cover both the organization as well as the maintenance procedures and technical aspects – and their depiction in IT systems. How current is the data?
How extensive? How is it structured? How targeted is the analysis? To find answers to these questions and many more, Simon and his col-leagues go through several blocks of questions in each interview. And they go into the facilities, have equipment, procedures and functions explained to them in detail.
Simon’s team found out, for example, that an extensive amount of data is collected via SAP data management for the maintenance of the facil-ity. “Exemplary, orderly documentation,” says Steffen Simon. “But indi-vidual data sets go into too much detail without taking the relevance for the context into consideration.” Projects are segmented into very small units and accurately controlled – but in the interest of optimum effi-ciency, it would be possible to do without some of the things that require many man-hours to prepare. A further problem identified by Simon’s team relates to the structure and quality of the SAP master data, the management of which requires extensive specialist know-ledge about the technical plant and long experience with database soft-ware: switching to an improved concept for updating data, one which more effectively takes personnel changes into account, means that a more sustainable knowledge management can be achieved. To retain staff at Sakhalin-2 over the long term, the team also recommended qualification programs which bring together theory and practice. The Bilfinger con sultants also encouraged the establishment of partnership agreements in which Sakhalin Energy would grant its suppliers greater decision-making competence and responsibility. This allows coordina-tion efforts to be reduced while at the same time making it possible to more flexibly manage procedures. “It’s such things that only an unbi-ased, global view from the outside can see,” says Steffen Simon.
“The processes are very good. But we can squeeze out the last few percentage points in
efficiency improvements.”
52

Teamwork at Bilfinger between Munich and Siberia: Thomas-Peter Wilk looks after the preparation of the analyses for the client – Sakhalin Energy in Sakhalin. Steffen Simon, together with other Bilfinger experts, took a detailed look at the processes for the Russian liquid gas facility.
53

54

On the southern end of Sakhalin, gas and oil for the East Asian and North American
markets are shipped – more efficiently than before thanks to Bilfinger.
55

56

58 Overview of financial year 2013 and outlook 2014 59 The Bilfinger Group 60 Business model 60 Objectives and strategy 61 Financial management system 62 Research and development 65 Economic report 65 Business developments 2013 67 Results of operations 70 Net assets 71 Financial position 74 Information on the results of operations, net assets and financial position of Bilfinger SE
76 Industrial business segment 82 Power business segment 88 Building and Facility business segment 96 Construction business segment 102 Discontinued operations
103 Sustainability 104 Procurement 104 Communication and marketing 106 Human resources 109 Events after the balance sheet date 110 Opportunity and risk report 118 Outlook 121 Additional disclosures pursuant to Section 289 Subsection 4 and Section 315 Subsection 4 of the German Commercial Code (HGB) / Executive Board remuneration
Combined management report
57

Bilfinger SEAnnual Report 2013Management report
Operating profit increased in a challenging year ___
Dividend of €3.00 per share proposed___
Positive outlook for 2014
Overview of financial year 2013 and outlook 2014
Results of operations
__ Output volume of €8,509 million at level of the prior year __ Figures for orders received of €8,296 million and order backlog of €7,411 million also reached the levels of the prior year__ Adjusted EBIT increased by 6 percent to €409 million __ Adjusted EBITA margin rose to 4.8 percent __ Adjusted net profit from continuing operations climbed to €249 million __ Dividend of €3.00 per share proposed
Financial position and net assets
__ Cash flow from operating activities of €162 million influenced by lower cash earnings as well as structural changes in working capital__ Investments in financial assets of €251 million primarily for corporate acquisitions__ Investments in property, plant and equipment of €170 million__ Free cash flow decreased to €217 million__ Cash and cash equivalents of €669 million at end of the year__ Financial liabilities decreased to €545 million__ Sound capital structure continues to offer considerable investment scope for the Group’s ongoing strategic development
Outlook 2014
__ Positive development in all business segments expected in 2014__ Output volume for the Group will increase to at least €9 billion. With the exception of Construction, organic growth is expected in all business
segments with the acquisitions already made also contributing to the increase __ Adjusted EBITA and adjusted net profit will increase considerably. The basis for this development is the planned increase in output volume and,
primarily, ongoing cost reduction measures
58

Management reportThe Bilfinger Group
Bilfinger SEAnnual Report 2013
Legal form and organization
Bilfinger is a stock company in accordance with European law (Societas Europaea – SE) and, in addition to German stock company law, is also subject to specific SE regulations and the German SE Implementation Act as well as the German SE Employee Involvement Act. The manage-ment bodies of the company are the Executive Board, the Supervisory Board and the Annual General Meeting.
The Executive Board manages the company in its own responsi-bility. The Supervisory Board appoints, supervises and advises the Executive Board and is directly involved in key decisions affecting the company. These bodies work in close cooperation for the benefit of
The Bilfinger Group Bilfinger. (For further information, please see the Declaration of Corpo-rate Governance on the company’s Internet site – www.bilfinger.com – under ‘Investor Relations / Corporate Governance’)
Organization
The Bilfinger Group is organized decentrally. Bilfinger SE is a holding without its own business activities. The operating activities are carried out through subsidiaries which act on the market as independent profit centers. Since January 1, 2014, they have been allocated to divisions within Bilfinger SE which in turn are each part of one of our four busi-ness segments.
Until the end of the reporting year, the operating activities were managed by Subgroups. This organization was abandoned within the scope of our program to increase the efficiency of the company (Bilfin-ger Excellence). From financial year 2014, the Executive Board members responsible for a specific business segment will directly control the
STRUCTURE OF THE BUSINESS SEGMENTSFROM JANUARY 1, 2014
Industrial Power Building and Facility Construction
Divisions:
Industrial Maintenance
Insulation, Scaffolding and Painting
Oil and Gas
Industrial Fabrication and Installation
Engineering, Automation and Control
Support Services
see page 76
Divisions:
Power Systems
Piping Systems
see page 82
Divisions:
Building
Facility Services
Real Estate
Water Technologies
see page 88
Divisions:
Construction
Infrastructure
see page 96
STRUCTURE OF THE BUSINESS SEGMENTSUNTIL DECEMBER 31, 2013
Industrial Power Building and Facility Construction
Bilfinger Industrial Services
Bilfinger Industrial Technologies
Bilfinger Power Systems Bilfinger Facility Services
Bilfinger Hochbau
Bilfinger Government Services
Bilfinger Construction
Bilfinger Infrastructure
59

operating activities of the individual subsidiaries via the 14 divisions. Despite changes to the management organization, the structure within our four business segments remained mostly unchanged.
Concessions, our former fifth business segment, has ceased to exist due to the company’s disposal of these activities. The corresponding key figures are disclosed in the reporting year under ‘discontinued operations.’
Business model___
As an engineering and services group, Bilfinger develops, builds, main-tains and operates plants and buildings for infrastructure, real estate, industry and the energy sector. The Group operates internationally with a broad range of subsidiaries. With our expertise, the outstanding performance of our more than 70,000 employees and a comprehensive range of services, we enable our customers to concentrate on the core of their entrepreneurial activities. They can entrust us with the devel-opment, construction and operation of the facilities and buildings they require.
Objectives and strategy___
Following the successful transformation to an engineering and services group, Bilfinger is using its financial strength and operating potential for the next phase in its development. Supported by the strategic programs BEST (Bilfinger Escalates Strength) and Bilfinger Excellence, output volume will grow to €11-12 billion by 2016 and net profit will increase to about €400 million.
Bilfinger has decided to focus on optimization in five key areas:
Operational Excellence We want to provide our clients with the highest level of quality.
Organic and acquisitional growth in high-margin areas Each busi-ness segment has concrete objectives for organic and acquisitional growth.
Networking within the Group for increased cross-selling and new service packages Through increased internal cooperation we want to increasingly offer our clients comprehensive service packages.
REGIONS
Bilfinger SEAnnual Report 2013Management report60

Internationalization We are optimizing our international organization in order to better coordinate our activities abroad.
Effective risk management We consistently develop our risk man-agement system and the ability to realistically evaluate risks.
Implementation of key modules
The implementation of the BEST strategic program was vigorously pushed forward in 2013. We created the required structures for intensi-fied cooperation between all parts of the Group, based upon which we will systematically offer our clients a comprehensive range of services:
__ The uniform brand architecture makes the variety of services we offer transparent, both internally and externally.
__ An optimized international organization coordinates the work on our brand in major regions.
__ All operating units have access to a complete set of rules, on the basis of which joint projects are tackled and implemented.
Bilfinger Excellence
In addition to BEST, we have initiated a program to enhance our ef-ficiency and competitiveness: with Bilfinger Excellence we want to sus-tainably improve our competitiveness through
__ a focus on organic growth with a lean and efficient corporate struc-ture, an intensified cooperation among all Group units and concen-tration on daily business activities,
__ acceleration of decisions and avoiding redundant efforts in the Group by reducing decision-making levels,
__ an increase in the profitability of Bilfinger through a reduction of general administrative expenses.
To facilitate achievement of these objectives, we are optimizing struc-tures and processes in the company and repositioning ourselves: from 2014, the former Subgroup structure will be abandoned and replaced by 14 customer-group oriented divisions within Bilfinger SE which will as-sume responsibility for the operational units. Administrative functions currently located at Group headquarters and in the Subgroups will be streamlined and merged. This also includes the establishment of shared service centers. By taking these measures, we will avoid duplicate work and harmonize the heterogeneous structures which had arisen in recent years in connection with our extensive acquisitional activities. Bilfinger will thus become leaner and more efficient. The structural improve-ments and the reduction of 1,250 administrative positions worldwide
in the coming two years will, following complete implementation of the measures, lead to annual savings in personnel costs of €80 million to €90 million as well as in non-personnel costs in the low to middle double-digit million range.
Financial management system___
Our key financial management metrics include figures for growth, prof-itability, capital efficiency, cash-flow generation and capital structure.
Output volume In addition to the Group’s revenue, the figure for output volume also includes our proportion of the goods and services supplied by joint ventures and consortiums. Orders received and order backlog constitute a key basis for the planning of output volume. Profitable growth in output volume forms a cornerstone of our strategy for increas-ing Bilfinger’s enterprise value. Our goal is to expand the Group’s out-put volume to between €11 billion and €12 billion by 2016. We aim to achieve organic growth averaging 3 to 5 percent per annum. In addition, targeted acquisitions will contribute to the growth in output volume.
EBITA and return on EBITA The indicator of operating profit of the corporate units and of the Group, and thus the measure of earnings for segment reporting, is earnings before interest, taxes and amortization of intangible assets from acquisitions (EBITA). When performing such an analysis, the focus is on the profit margin – calculated as operating profit as a percentage of output volume. By 2016, we plan to achieve a Group EBITA margin of approximately 6 percent. For better compara-bility over the course of time, we also consider ‘adjusted EBITA’ with adjustments made, for example, for one-time capital gains or restructur-ing expenses.
Net profit / dividend policy Net profit consists of operating profit plus / minus amortization of intangible assets from acquisitions, financial income and expense and taxes. Also with regard to net profit we make reference to an ‘adjusted net profit’ with adjustments made for the above-mentioned exceptional items as well as for amortiza-tion of intangible assets from acquisitions. We pursue a sustainable dividend policy with the objective of letting our shareholders partici-pate appropriately in the Group’s success. By 2016, we plan to increase our net profit to approximately €400 million. With regard to the divi-dend, we intend to pay out to shareholders approximately 50 percent of net profit.
Management reportThe Bilfinger Group
Bilfinger SEAnnual Report 2013
61

Return on capital employed (ROCE), value added An important financial management system at the Bilfinger Group is the system of return-on-capital-employed controlling. With this method, we measure the value added by our business segments and by the Group. We em-ploy our capital specifically where high value added is achieved. The main idea behind this concept is that positive value added can only be achieved for the Group if the return on the average capital employed is higher than the weighted average cost of capital (WACC). We aim to achieve a return on capital employed (ROCE) in the coming years of between 15 and 20 percent.
The parameters upon which this calculation is based are determined as long-term average values, are regularly reviewed, and are adjusted for any relevant changes in the market environment. The calculation of the value added achieved by the business segments and by the Group is presented in the chapter on return-on-capital-employed controlling with appropriate explanations.
Cash flow from operating activities / cash conversion / net work-ing capital Key financial metrics for managing liquidity include cash flow from operating activities and cash conversion. They measure the extent to which earnings are reflected by cash inflows. A major factor to be considered is the change in net working capital. Net work-ing capital is calculated as the difference between current assets excluding cash and cash equivalents and current liabilities excluding financial debt. A reduction in net working capital leads to lower capital employed and thus also contributes toward an increase in the return on capital employed (ROCE) and in the value added by the business seg-ment concerned. We calculate cash conversion as a quotient from oper-ating free cash flow and EBITA. In operating free cash flow we also take net investments in property, plant and equipment into consideration.
Investments / acquisitions Although compared with some industries our business is not very capital intensive, planned additions to property, plant and equipment are subject to intensive investment controlling. The planned investment ratio in relation to output volume is around 2 percent. For corporate acquisitions, we have defined minimum re-quirements that generally have to be fulfilled. For example, acquisitions should make a positive contribution to net profit in the first full financial year after being acquired, and should make a positive contribution to value added with a return on capital employed above the respective cost of capital.
Further key figures On the basis of our strategic corporate planning, we regularly review the effects on our financial risk profile of various scenarios for the business and financial development of the Group. The key financial metrics are the dynamic debt-equity ratio, gearing and cash-flow protection. In line with our targets, their levels should reflect
a financial standing comparable with our sound investment-grade rat-ing (BBB+). For the dynamic debt-equity ratio (quotient of adjusted net debt and adjusted EBITDA), we have determined a target value of less than 2.5, the target value for gearing (quotient of financial debt and total equity) is less than 40 percent. The target for cash-flow protec-tion (quotient of cash inflow from operating activities before change in working capital and adjusted net debt) is more than 40 percent. Accord-ingly, the tolerated level of Group debt on a recourse basis is oriented toward meeting these targets. Its present level gives us substantial scope to finance the strategic development of the Bilfinger Group.
Research and development___
Climate protection and resource conservation through the opti-mization of power plants, industrial facilities and buildings We are making an important contribution to meeting the ecological chal-lenges of our time with about 190 different research and development projects. The expenses for products, service concepts, optimization of processes and procedures as well as patents amounted to about €14 million in 2013. Our research and development activities are generally oriented toward the lifecycles of the objects and lead to practical, eco-nomically feasible solutions for our clients. The focus is on renewable energies and distribution networks, energy efficiency and pollutant re-duction in power plants and industrial facilities, sustainable real estate, water supply and sewage systems as well as noise protection.
Increased research activities As part of the strategic program BEST (Bilfinger Escalates Strength) which was launched in 2011, we are accelerating our activities in research and development. We are increasingly tapping technologies that are of particular importance for the development of our company. Inside the Group, measures for the expansion of our expertise, the development of new products and the further development of existing solutions are being funded. The prod-ucts that are developed are professionally marketed through our own company start-ups. Bilfinger also invests in external companies in the start-up / growth area which market the innovations they themselves have developed.
With the intensifying of our research and development activities, we are expanding our technological competences in a targeted manner in order to achieve greater value added and, also in the future, to be able to offer our clients innovative services in all business segments.
Renewable energies and distribution networks Together with other well-known companies and research institutes, Bilfinger is participating in a project for the development of solar thermal tower power plants.
Bilfinger SEAnnual Report 2013Management report62

Concentrated Solar Power (CSP) power plants use mirrors to focus sun-light to a central receiver located in a tower. With the enormous heat from the focused sunlight it is possible to generate electricity through a steam turbine. Bilfinger is contributing its competence in firing and steam generation technology to the project along with its extensive knowledge in high-pressure piping systems. In the future, CSP power plants can make an important contribution to securing a sustainable supply of electricity. The heat that is created through the concentration of sunlight can be conserved for several hours in special heat storage systems. For this reason, thermal solar power plants can continue to supply electricity even when the sun is no longer shining.
One of the key tasks of future energy supply is to sensibly inte-grate decentralized generation into existing distribution structures. This applies primarily to the design of low-voltage electrical networks. To-gether with partners from scientific organizations and the energy sector, Bilfinger developed the ‘Intelligent Distribution Network Management System’ which was awarded the Hessian state prize for intelligent ener-gy in the spring of 2013. The system, known as iNES, is a smart grid sys-tem solution for the decentralized management of network capacities within a low-voltage network which can react to existing requirements in real time and which thus avoids over-voltage and under-voltage as well as operational malfunctions.
In many facilities such as hospitals or data centers, a reliable elec-tricity supply is absolutely essential. For the stabilization of the network and for an uninterrupted supply of power, Bilfinger has developed a powerful short-term storage system on the basis of electrical flywheel technology. Bilfinger is applying its competences and experience in the field of superconducting magnet technology to reduce the loss of ten-sion in the wheels and thus to improve efficiency levels. The goal is to achieve nearly friction-free ball-bearing joints using super-conducting technology.
Together with partners, Bilfinger is developing combined pipe-cable installation systems, so-called PowerTubes, which can be used in the expansion of electricity networks in sensitive regions and in metropoli-tan areas. With these systems, high-voltage cables and other supply lines are laid underground in accessible tubes. The advantages of this solution include the ideal mechanical protection of the lines as well as the ease with which they can be monitored, updated and quickly repaired.
Energy efficiency and pollution reduction for power plants and industrial facilities By increasing the steam temperature in coal-fired power plants, the level of efficiency in the production of electricity is significantly improved and, therefore, emissions can be reduced and resources saved. As part of a joint project sponsored by the German Ministry of Economics and Technology at the Mannheim power station, we are gaining knowledge about the behavior of new materials and welded joints at temperatures above 700°C.
Our newly developed micro-gas turbine unit QiP ®, which can simultaneously generate electricity and heat for heating or production processes (cogeneration), was presented at the industrial trade fair in Hanover. With an electrical output of 100kWel and a thermal output of 200 kWth, the unit is suitable for decentralized applications in industry, trade, agriculture and in the public sector. It features a high degree of efficiency, the flexible use of various fuels, a long operating life and low maintenance expenses.
In the context of the energy transformation, the flexibility of con-ventional power plants must be increased in order to cover for fluc-tuations in the supply of electricity from renewable sources. Here, traditional lignite-fired power plants quickly reach their limits due to the high water content in the lignite – because the combustion process becomes instable with lower loads. One possible solution is the use of dried lignite as a fuel. Together with a partner, Bilfinger has developed an innovative new dried lignite firing burner. The pioneering technology in this unit makes use of plasma generated from microwaves to ignite the fuel. It significantly simplifies and accelerates the starting up of steam generators. Secondary fuels such as oil or gas are unnecessary which also substantially reduces the cost of starting up the generator. In a block at the Jänschwalde power plant, the new burner for dried lignite firing will be put to use for the first time in the fall of 2014.
Sustainable buildings Bilfinger develops methods to optimize build-ing technology systems for the sustainable operation of real estate properties. To this end, energy measurement data is gathered, evalu-ated and graphically presented so that the systems can be efficiently controlled and operated on the basis of this analysis.
We are participating in the EU-sponsored Campus 21 project, which deals with the integration of production and consumption subsystems in
DISTRIBUTION OF ACTIVITIES FOR RESEARCH AND DEVELOPMENT 2013 BY EXPENSE
3 % Safety
1% Noise protection
6 % Pollution reduction
9% Water supply and disposal
6% Sustainable real estate
19 % Other 11% Renewable energies
45 % Energy-efficient industry and power plants
Management reportThe Bilfinger Group
Bilfinger SEAnnual Report 2013
63

a comprehensive building energy management system (building EnMS). Within an EnMS, the performance parameters of a building are used to optimize the operation of lighting, heating, ventilation and cooling and to thus reduce energy consumption and CO2 emissions. The individual elements of the measurement and control technology in the technical building equipment are linked in such a way that the data recorded allows for real-time, needs-oriented management of the building.
Water supply and disposal Within the scope of the publicly-funded project ‘CuveWaters’ in Namibia, a decentralized concept for the pro-vision of water in dry regions is being explored. The objective of the project is to make use of natural sources of water such as rainwater or saline groundwater in these areas, which are at times subject to extreme drought, and to make water resources available throughout the year. For this purpose, Bilfinger has developed a system for wastewater collection and treatment by means of vacuum sewer systems and sub-sequent mechanical cleaning. The biogenic waste material is fermented and used for the production of electricity. The treated wastewater can be used to irrigate agricultural areas or for other applications.
In another development project, we are pursuing the goal of optimizing the process efficiency of wastewater treatment plants while maintaining the quality of the effluent water. In this regard, both tech-nologies and components (e.g., fine-bubble aeration systems), as well as process control and measurement and control technology are con-stantly improved. As a result of this optimization, energy can be saved and the quality of the water can be increased.
Bilfinger SEAnnual Report 2013Management report64

Business developments 2013 ___
Bilfinger continued its successful development in a challenging year. In the second half of the year, following a moderate start, the company made up most of the ground it had lost.
Despite a further volume reduction in the Construction business segment, output volume was at the level of the prior year while at the same time, adjusted earnings were again increased. The adjusted EBITA margin thus rose to 4.8 percent (previous year: 4.5 percent). As in the previous year, shareholders will participate in the successful devel-opment of the business with an attractive dividend of €3.00.
Output volume in financial year 2013, of which the share gener-ated by international markets was unchanged at 61 percent, was at the level of the prior year at €8,509 million (previous year: €8,586 million). Growth in the Industrial business segment and the Building and Facility business segment was offset primarily by a further significant decrease in the Construction business segment. Overall, organic growth was short of our expectations. The figures for orders received of €8,296 mil-lion (previous year: €8,304 million) and order backlog of €7,411 million (previous year: €7,388 million) also reached the levels of the prior year.
The key figures of the activities to be sold of the former Concessions business segment are presented under ‘discontinued operations’ in the annual financial statements 2013. The prior-year figures have been ad-justed accordingly. Unless otherwise stated, all of the figures provided in the financial statements refer to the Group’s continuing operations.
Following a positive earnings trend over the course of the year, adjusted EBITA increased to €409 million (previous year: €387 million). The Indus-trial and Building and Facility business segments in particular contribut-ed to this development. With a very good margin, Power again achieved the earnings level of the prior year despite a decrease in output volume. Earnings in the Construction business segment were heavily burdened by the situation in the infrastructure unit. Net profit of continuing opera-tions adjusted for amortization of intangible assets from acquisitions and exceptional items rose to €249 million (previous year: €241 million).
Economic report OUTPUT VOLUME, ORDERS RECEIVED, ORDER BACKLOG / ADJUSTED EARNINGS€ million
2013 2012 ∆ in %
Output volume 8,509 8,586 -1
Orders received 8,296 8,304 0
Order backlog 7,411 7,388 0
EBITA adjusted 1, 2 409 387 +6
EBITA margin adjusted (in percent) 1, 2 4.8 4.5
Adjusted net profit from continuing operations 3 249 241 +3
Adjusted earnings per share from continuing operations (in €) 3 5.64 5.46 +3
1 Adjusted in 2013 for one-time expenses in connection with the efficiency enhancement program Bilfinger Excellence and burdens from the sale of the German road construction activities as well as for earnings contributions from the sale of shares in the Nigerian business (full-year 2013: €71 million before taxes and €45 million after taxes; Q4 2013: €59 million before taxes and €35 million after taxes)
2 Adjusted in 2012 for earnings contributions from the sale of shares in the Nigerian business (full-year 2012: €45 million before taxes and €37 million after taxes; Q4 2012: €0 million before and after taxes)
3 Adjusted for the exceptional items referred to under 1) and 2) and for the amortization of intangible assets from acquisitions (full-year 2013: €35 million (previous year: €35 million) after taxes; Q4 2013: €9 million (previous year: €11 million) after taxes)
PLAN / ACTUAL COMPARISON Actual 2013 Outlook Interim Report Q3 2013
Outlook Interim ReportH1 2013
Outlook Interim ReportQ1 2013
Actual 2012
Output volume €8.5 billion about € 8.6 billion about € 8.7 billion increase €8.6 billion
Adjusted EBITA €409 million about € 400 million increase with higher margin increase with higher margin €387 million
Adjusted net profit from continuing operations * €249 million over € 240 million increase with higher margin increase with higher margin €241 million
* Since the first quarter 2013, our earnings forecast relates to adjusted EBITA and adjusted net profit from continuing operations. This serves to enable comparability over time.
Management reportEconomic report
Bilfinger SEAnnual Report 2013
65

CONSOLIDATED INCOME STATEMENT (ABRIDGED) € million
2013 2012
Output volume from continuing operations(for information only) 8,509 8,586
Revenue 8,415 8,343
Cost of sales -7,299 -7,222
Gross profit 1,116 1,121
Selling and administrative expenses -837 -832
Other operating income and expense -24 61
Income from investments accounted for using the equity method 32 31
Earnings before interest and taxes (EBIT) 287 381
Net interest result 1 -43 -34
Earnings before taxes 1 244 347
Income tax expense 2 -72 -102
Earnings after taxes from continuing operations 3 172 245
Earnings after taxes from discontinued operations 4 34
Earnings after taxes 3 176 279
thereof minority interest 3 3
Net profit 3 173 276
Average number of shares (in thousands) 44,149 44,140
Earnings per share (in €) 4 3.91 6.26
thereof from continuing operations 3.83 5.50
thereof from discontinued operations 0.08 0.76
1 Following adjustment of the prior year figure due to IAS 19R by + €2.0 million2 Following adjustment of the prior year figure due to IAS 19R by - €0.5 million3 Following adjustment of the prior year figure due to IAS 19R by + €1.5 million4 Basic earnings per share are equal to diluted earnings per share. The adjustments due to IAS 19R only had an insignificant influence on earnings per share.
OUTPUT VOLUME BY BUSINESS SEGMENT€ million
2013 2012 ∆ in %
Industrial 3,963 3,705 +7
Power 1,256 1,319 -5
Building and Facility 2,346 2,249 +4
Construction 1,038 1,404 -26
Consolidation, other -94 -91
8,509 8,586 -1
46 % Industrial
15 % Power
12 % Construction
27 % Building and Facility
OUTPUT VOLUME BY REGION€ million
2013 2012 ∆ in %
Germany 3,349 3,324 +1
Rest of Europe 3,604 3,730 -3
America 904 692 +31
Africa 245 468 -48
Asia 407 372 +9
8,509 8,586 -1
39 % Germany11% America
42 % Rest of Europe
3 % Africa5 % Asia
Management report Bilfinger SEAnnual Report 2013
66
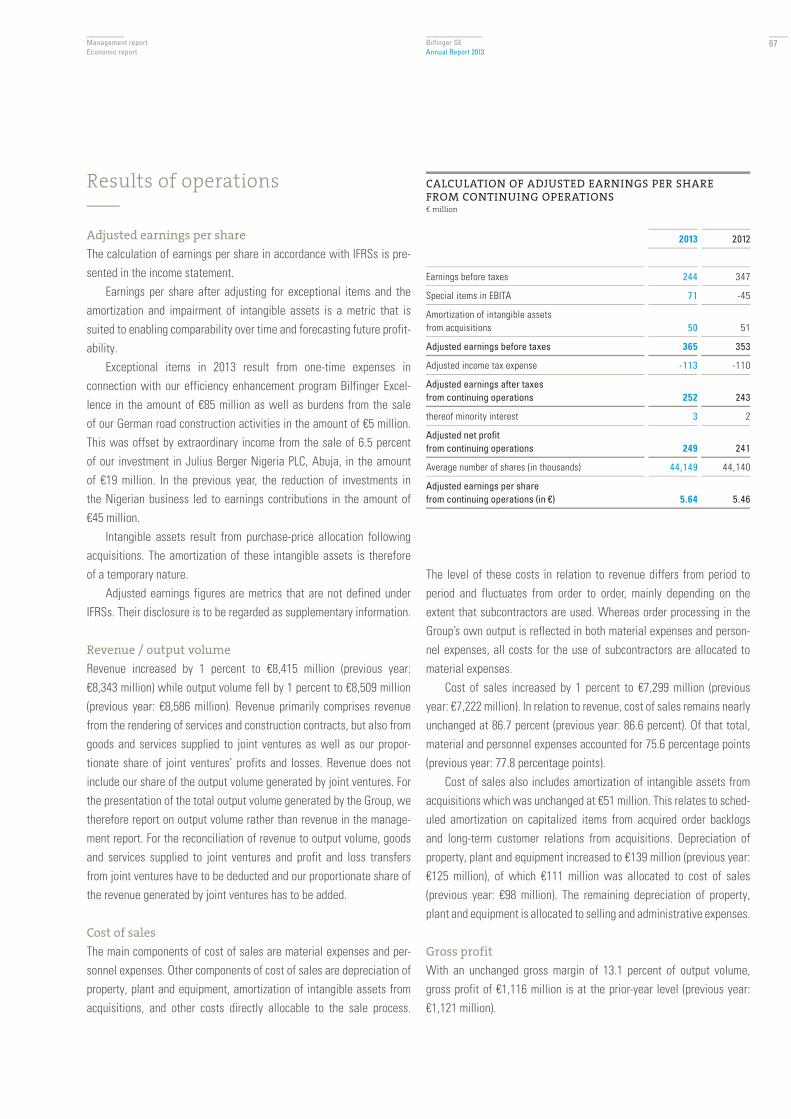
Results of operations ___
Adjusted earnings per share
The calculation of earnings per share in accordance with IFRSs is pre-sented in the income statement.
Earnings per share after adjusting for exceptional items and the amortization and impairment of intangible assets is a metric that is suited to enabling comparability over time and forecasting future profit-ability.
Exceptional items in 2013 result from one-time expenses in connection with our efficiency enhancement program Bilfinger Excel-lence in the amount of €85 million as well as burdens from the sale of our German road construction activities in the amount of €5 million. This was offset by extraordinary income from the sale of 6.5 percent of our investment in Julius Berger Nigeria PLC, Abuja, in the amount of €19 million. In the previous year, the reduction of investments in the Nigerian business led to earnings contributions in the amount of €45 million.
Intangible assets result from purchase-price allocation following acquisitions. The amortization of these intangible assets is therefore of a temporary nature.
Adjusted earnings figures are metrics that are not defined under IFRSs. Their disclosure is to be regarded as supplementary information.
Revenue / output volume
Revenue increased by 1 percent to €8,415 million (previous year: €8,343 million) while output volume fell by 1 percent to €8,509 million (previous year: €8,586 million). Revenue primarily comprises revenue from the rendering of services and construction contracts, but also from goods and services supplied to joint ventures as well as our propor-tionate share of joint ventures’ profits and losses. Revenue does not include our share of the output volume generated by joint ventures. For the presentation of the total output volume generated by the Group, we therefore report on output volume rather than revenue in the manage-ment report. For the reconciliation of revenue to output volume, goods and services supplied to joint ventures and profit and loss transfers from joint ventures have to be deducted and our proportionate share of the revenue generated by joint ventures has to be added.
Cost of sales
The main components of cost of sales are material expenses and per-sonnel expenses. Other components of cost of sales are depreciation of property, plant and equipment, amortization of intangible assets from acquisitions, and other costs directly allocable to the sale process.
The level of these costs in relation to revenue differs from period to period and fluctuates from order to order, mainly depending on the extent that subcontractors are used. Whereas order processing in the Group’s own output is reflected in both material expenses and person-nel expenses, all costs for the use of subcontractors are allocated to material expenses.
Cost of sales increased by 1 percent to €7,299 million (previous year: €7,222 million). In relation to revenue, cost of sales remains nearly unchanged at 86.7 percent (previous year: 86.6 percent). Of that total, material and personnel expenses accounted for 75.6 percentage points (previous year: 77.8 percentage points).
Cost of sales also includes amortization of intangible assets from acquisitions which was unchanged at €51 million. This relates to sched-uled amortization on capitalized items from acquired order backlogs and long-term customer relations from acquisitions. Depreciation of property, plant and equipment increased to €139 million (previous year: €125 million), of which €111 million was allocated to cost of sales (previous year: €98 million). The remaining depreciation of property, plant and equipment is allocated to selling and administrative expenses.
Gross profit
With an unchanged gross margin of 13.1 percent of output volume, gross profit of €1,116 million is at the prior-year level (previous year: €1,121 million).
CALCULATION OF ADJUSTED EARNINGS PER SHARE FROM CONTINUING OPERATIONS€ million
2013 2012
Earnings before taxes 244 347
Special items in EBITA 71 -45
Amortization of intangible assets from acquisitions 50 51
Adjusted earnings before taxes 365 353
Adjusted income tax expense -113 -110
Adjusted earnings after taxes from continuing operations 252 243
thereof minority interest 3 2
Adjusted net profit from continuing operations 249 241
Average number of shares (in thousands) 44,149 44,140
Adjusted earnings per share from continuing operations (in €) 5.64 5.46
Management reportEconomic report
Bilfinger SEAnnual Report 2013
67

Selling and administrative expenses
Selling and administrative expenses remained largely unchanged at €837 million (previous year: €832 million), equivalent to 9.8 percent of output volume (previous year: 9.7 percent).
Other operating income and expense
The balance from other operating income and expenses of minus €24 million is negative following a positive figure of €61 million in the previous year. It should be taken into account here that in the reporting year, restructuring expenses in the amount of €69 million in connec-tion with our efficiency enhancement program Bilfinger Excellence are included. A gain of €19 million was realized from the sale of shares in Julius Berger Nigeria PLC. In the previous year, the reduction of investments in the Nigerian business led to earnings contributions in the amount of €45 million.
Income from investments accounted for using the
equity method
Income from investments accounted for using the equity method is com-posed of the income and expenses from associates and joint ventures and amounts to €32 million (previous year: €31 million).
EBITA / adjusted EBITA / EBIT
EBITA (earnings before interest, taxes and amortization of intangible assets from acquisitions) serves as a measure of operating profit. For better comparability over the course of time, from financial year 2013 we also consider ‘adjusted EBITA’ with adjustments made, for example for one-time capital gains or restructuring expenses. Adjusted EBITA increased to €409 million (previous year: €387 million). In relation to output volume, the adjusted EBITA margin was 4.8 percent (previous year: 4.5 percent).
In the Industrial business segment, EBITA increased to €232 mil-lion – as a result of acquisitions as well as organic growth (previous year: €206 million). The EBITA margin increased to 5.9 percent (previous year: 5.6 percent).
In the Power business segment, EBITA amounts to €123 million as in the prior year, the EBITA margin was increased, not least as a result of the completion of a number of projects, to the unusually high figure of 9.8 percent (previous year: 9.3 percent).
In the Building and Facility business segment, EBITA rose despite the deconsolidation of the Nigerian activities in the middle of 2012 to €116 million (previous year: €106 million). The reasons for this develop-ment were the acquisitions made and the good organic growth. The EBITA margin increased to 4.9 percent (previous year: 4.7 percent).
Earnings expectations were not met in the Construction business seg-ment. The heavy loss-making road construction business in Germany was sold in the fourth quarter. In addition, it was not possible by the end of the year to reach an agreement on outstanding claims relating to completed road construction projects in Poland. Overall, EBITA amounts to €1 million (previous year: €25 million).
Adjusted EBITA not allocated to the business segments amounts to minus €63 million (previous year: minus €73 million). From this financial year, it includes, in addition to headquarters costs, at-equity earnings of the investment in Julius Berger Nigeria as well as the earnings con-tributions from two concession projects that are not presented under ‘discontinued operations.’ Headquarters costs are at the level of the prior year.
Overall, EBITA amounts to €338 million. This includes exceptional items from one-time expenses in connection with the efficiency en-hancement program Bilfinger Excellence in the amount of €85 million as well as burdens from the sale of the German road construction activities of €5 million. A gain of €19 million was realized from the sale of shares in Julius Berger Nigeria PLC. In the prior-year period, additional contri-butions to earnings of €45 million from the reduction of the interest in the Nigerian business led to total EBITA of €432 million.
After deducting amortization of intangible assets from acquisitions, which amount to €51 million as in the prior year, EBIT of €287 million remains (previous year: €381 million).
Net interest expense
Net interest expense increased to €43 million (previous year: €34 mil-lion). Interest income declined due to the lower interest rates on in-vestments to €8 million (previous year: €12 million). Current interest expense increased following the issue of a corporate bond at the end of 2012 to €32 million (previous year: €26 million). The interest expense
ADJUSTED EBITA BY BUSINESS SEGMENT€ million
2013 2012
Industrial 232 206
Power 123 123
Building and Facility 116 106
Construction 1 25
Consolidation, other -63 -73
Continuing operations 409 387
Management report Bilfinger SEAnnual Report 2013
68

from the increase in the retirement benefit obligation – offset against the income from plan assets – amounted to €14 million (previous year: €13 million). Income of €2 million was achieved from securities (previ-ous year: €1 million).
The interest expense for minority interest was unchanged at €7 mil-lion (previous year: €8 million).
Earnings before and after taxes
Earnings before taxes of continuing operations amount to €244 mil-lion (previous year: €347 million) and earnings after taxes amount to €172 million (previous year: €245 million). The effective tax rate, adjusted for tax-free capital gains, was 31 percent – as in the prior year.
Earnings after taxes from discontinued operations of the former Concessions business segment amount to €4 million, in the prior year this amounted to an additional contribution of €34 million. In the report-ing year, capital gains from the sale of projects in the total amount of €46 million were nearly offset by disposal costs and expenses for the winding up of the discontinued activities of €10 million as well as the devaluation of the investment in the A1 of €34 million.
Overall, earnings after taxes decreased to €176 million (previous year: €279 million).
Minority interest
Profit attributable to minority interest amounts to €3 million, as in the prior year.
Net profit / earnings per share
Net profit for the year amounts to €173 million (previous year: €276 million). Net profit from continuing operations adjusted for amor-tization of intangible assets from acquisitions and for the exceptional items described amounts to €249 million (previous year: €241 million); adjusted earnings per share from continuing operations amount to €5.64 (previous year: €5.46).
Sustainable dividend policy
It is proposed that a dividend, unchanged from the previous year, of €3.00 be paid out for financial year 2013. This represents an unchanged total dividend distribution of €132 million in relation to the number of shares entitled to a dividend as of March 13, 2014. Bilfinger thus up-holds its sustainable dividend policy despite higher negative exception-al items. In relation to the share price at the end of 2013, this represents a dividend yield of 3.7 percent.
Value added
Value added – the difference between return on capital employed (ROCE) and the cost of capital – is an important key figure for measur-ing profitability of capital employed and for the efficient controlling of
DETERMINATION OF THE COST OF CAPITAL (WACC)
2013 2012
Risk-free interest rate 3.0% 3.0%
Market risk premium 5.5% 5.5%
Beta factor 0.84 0.87
Cost of equity capital after taxes 7.62% 7.80%
Cost of borrowed capital before taxes 4.00% 4.25%
Tax rate 31.0% 31.0%
Cost of borrowed capital after taxes 2.76% 2.93%
Proportion of equity capital 70.0% 70.0%
Proportion of borrowed capital 30.0% 30.0%
Cost of capital (WACC) after taxes 6.17% 6.34%
Income tax rate 31.0% 31.0%
Cost of capital (WACC) before taxes (rounded) 9.00% 9.25%
VALUE ADDED IN THE BUSINESS SEGMENTS
Capital employed € million
Return € million
ROCE %
Cost of capital %
Value added € million
2013 2012 2013 2012 2013 2012 2013 2012 2013 2012
Industrial 1,536 1,351 232 206 15.1 15.2 8.75 9.25 98 81
Power 475 384 123 125 25.9 32.5 8.75 9.25 81 89
Building and Facility 666 525 122 107 18.4 20.5 8.75 9.25 64 59
Construction 227 243 12 39 5.0 16.1 11.50 11.25 -15 12
Consolidation, other 179 56 -70 -76 – – – – -87 -76
Continuing operations 3,083 2,559 419 401 13.6 15.7 9.00 9.25 141 165
Management reportEconomic report
Bilfinger SEAnnual Report 2013
69

capital employed. From this financial year, we are focusing only on con-tinuing operations in order to provide better comparability over time in the consideration of return on capital employed. Adjusted EBITA serves as a basis for the calculation of the return. The weighted average cost of capital (WACC) for the Group amounts to 9.00 percent before taxes (previous year: 9.25 percent). ROCE of the business segments is com-pared with segment-specific cost-of-capital rates to reflect their dif-fering risk profiles. For the business segments Industrial, Power and Building and Facility, this amounted to 8.75 percent (previous year: 9.25 percent) and for the Construction business segment 11.50 percent (previous year: 11.25 percent). Further details can be found in the chap-ter ‘Return-on-capital-employed controlling’ (see pages 204 ff.).
The average capital employed of continuing operations increased to €3,083 million in the reporting year (previous year: €2,559 million). Average interest-bearing liabilities increased significantly.
ROCE from continuing operations decreased due to the higher capi-tal employed to 13.6 percent (previous year: 15.7 percent); value added in absolute terms fell to €141 million (previous year: €165 million).
In the Industrial business segment, ROCE was at the level of the prior year with 15.1 percent (previous year: 15.2 percent), despite sig-nificantly higher EBITA. This was due to a primarily acquisition-related increase in capital employed to €1,536 million (previous year: €1,351 million). Value added increased to €98 million (previous year: €81 mil-lion).
Despite the nearly unchanged return in the Power business segment, ROCE declined due to the higher level of capital employed to 25.9 percent (previous year: 32.5 percent). Value added decreased to €81 million (previous year: €89 million).
Despite higher returns in the Building and Facility business seg-ment, ROCE decreased due to increased capital employed following acquisitions to 18.4 percent (previous year: 20.5 percent). Value added increased to €64 million (previous year: €59 million).
As a result of the significantly lower EBITA, ROCE in the Construc-tion business segment fell to 5.0 percent (previous year: 16.1 percent). Value added was negative at minus €15 million. In the previous year, the figure was positive at €12 million.
The value added by headquarters and consolidation was negative at minus €87 million (previous year: minus €76 million).
Net assets___
For the analysis of net assets, in order to gain better comparability with the figures as of December 31, 2013, the assets and liabilities of dis-continued operations of the former Concessions business segment are shown separately in an item on the assets side and an item on the
liabilities side of the pro-forma balance sheet as of December 31, 2012.Total assets decreased due to the sale of concession projects to
€6.5 billion (previous year: €6.9 billion). This is evident from the de-crease of assets and liabilities classified as held for sale.
On the assets side, non-current assets increased to €3,134 million (previous year: €2,931 million).
As a result of the acquisition of companies, intangible assets, which primarily comprise acquired goodwill of €1,885 million (previ-
CONSOLIDATED BALANCE SHEET (ABRIDGED)€ million
Dec. 31, 2013 Dec. 31, 2012
pro forma
Assets
Non-current assets
Intangible assets 2,023 1,890
Property, plant and equipment 712 689
Other non-current assets 399 352
3,134 2,931
Current assets
Receivables and other current assets 2,373 2,226
Cash and cash equivalents 669 1,061
Assets classified as held for sale 356 632
3,398 3,919
6,532 6,850
Equity and liabilities
Equity 2,165 2,037
Financial debt, non-recourse 41 16
Non-current liabilities
Provisions for pensions and similar obligations 423 394
Non-current financial debt, recourse 517 519
Other non-current liabilities 260 301
1,200 1,214
Current liabilities
Current financial debt, recourse 28 192
Other current liabilities 2,783 2,813
Liabilities classified as held for sale 315 578
3,126 3,583
6,532 6,850
Management report Bilfinger SEAnnual Report 2013
70
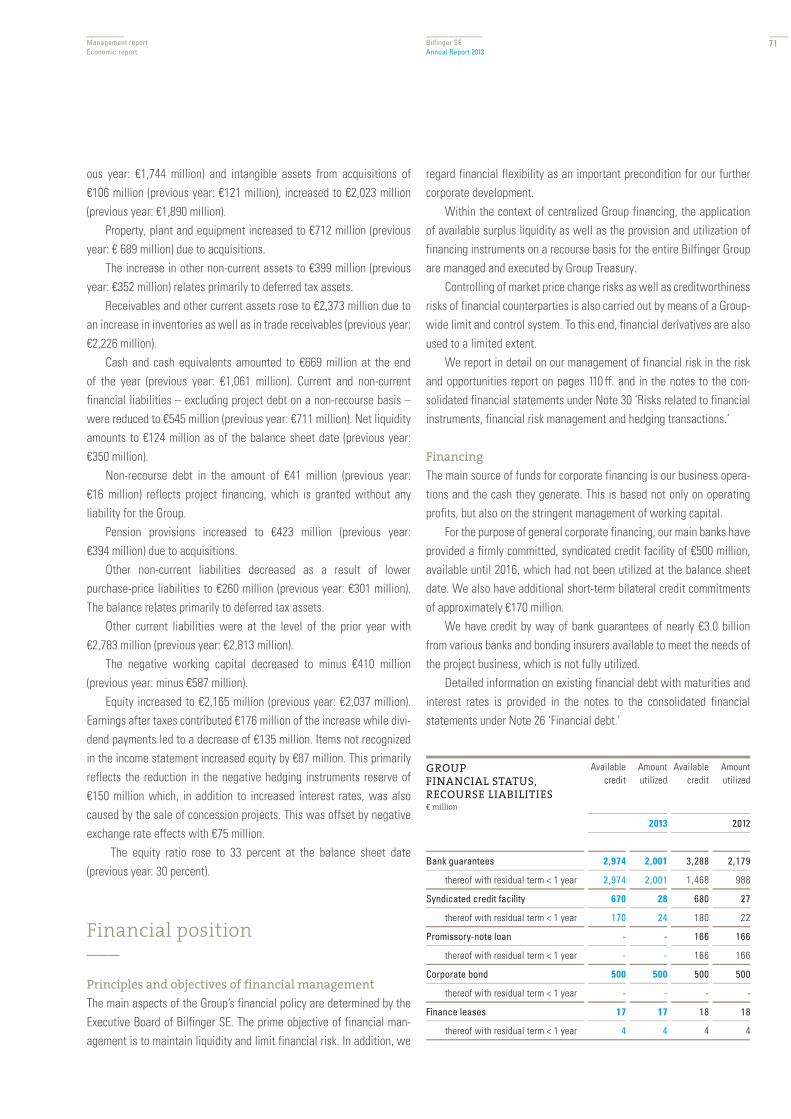
ous year: €1,744 million) and intangible assets from acquisitions of €106 million (previous year: €121 million), increased to €2,023 million (previous year: €1,890 million).
Property, plant and equipment increased to €712 million (previous year: € 689 million) due to acquisitions.
The increase in other non-current assets to €399 million (previous year: €352 million) relates primarily to deferred tax assets.
Receivables and other current assets rose to €2,373 million due to an increase in inventories as well as in trade receivables (previous year: €2,226 million).
Cash and cash equivalents amounted to €669 million at the end of the year (previous year: €1,061 million). Current and non-current financial liabilities – excluding project debt on a non-recourse basis – were reduced to €545 million (previous year: €711 million). Net liquidity amounts to €124 million as of the balance sheet date (previous year: €350 million).
Non-recourse debt in the amount of €41 million (previous year: €16 million) reflects project financing, which is granted without any liability for the Group.
Pension provisions increased to €423 million (previous year: €394 million) due to acquisitions.
Other non-current liabilities decreased as a result of lower purchase-price liabilities to €260 million (previous year: €301 million). The balance relates primarily to deferred tax assets.
Other current liabilities were at the level of the prior year with €2,783 million (previous year: €2,813 million).
The negative working capital decreased to minus €410 million (previous year: minus €587 million).
Equity increased to €2,165 million (previous year: €2,037 million). Earnings after taxes contributed €176 million of the increase while divi-dend payments led to a decrease of €135 million. Items not recognized in the income statement increased equity by €87 million. This primarily reflects the reduction in the negative hedging instruments reserve of €150 million which, in addition to increased interest rates, was also caused by the sale of concession projects. This was offset by negative exchange rate effects with €75 million.
The equity ratio rose to 33 percent at the balance sheet date (pre vious year: 30 percent).
Financial position ___
Principles and objectives of financial management
The main aspects of the Group’s financial policy are determined by the Executive Board of Bilfinger SE. The prime objective of financial man-agement is to maintain liquidity and limit financial risk. In addition, we
regard financial flexibility as an important precondition for our further corporate development.
Within the context of centralized Group financing, the application of available surplus liquidity as well as the provision and utilization of financing instruments on a recourse basis for the entire Bilfinger Group are managed and executed by Group Treasury.
Controlling of market price change risks as well as credit worthiness risks of financial counterparties is also carried out by means of a Group-wide limit and control system. To this end, financial derivatives are also used to a limited extent.
We report in detail on our management of financial risk in the risk and opportunities report on pages 110 ff. and in the notes to the con-solidated financial statements under Note 30 ‘Risks related to financial instruments, financial risk management and hedging transactions.’
Financing
The main source of funds for corporate financing is our business opera-tions and the cash they generate. This is based not only on operating profits, but also on the stringent management of working capital.
For the purpose of general corporate financing, our main banks have provided a firmly committed, syndicated credit facility of €500 million, available until 2016, which had not been utilized at the balance sheet date. We also have additional short-term bilateral credit commitments of approximately €170 million.
We have credit by way of bank guarantees of nearly €3.0 billion from various banks and bonding insurers available to meet the needs of the project business, which is not fully utilized.
Detailed information on existing financial debt with maturities and interest rates is provided in the notes to the consolidated financial statements under Note 26 ‘Financial debt.’
GROUP FINANCIAL STATUS, RECOURSE LIABILITIES€ million
Available credit
Amount utilized
Available credit
Amount utilized
2013 2012
Bank guarantees 2,974 2,001 3,288 2,179
thereof with residual term < 1 year 2,974 2,001 1,468 988
Syndicated credit facility 670 28 680 27
thereof with residual term < 1 year 170 24 180 22
Promissory-note loan - - 166 166
thereof with residual term < 1 year - - 166 166
Corporate bond 500 500 500 500
thereof with residual term < 1 year - - - -
Finance leases 17 17 18 18
thereof with residual term < 1 year 4 4 4 4
Management reportEconomic report
Bilfinger SEAnnual Report 2013
71
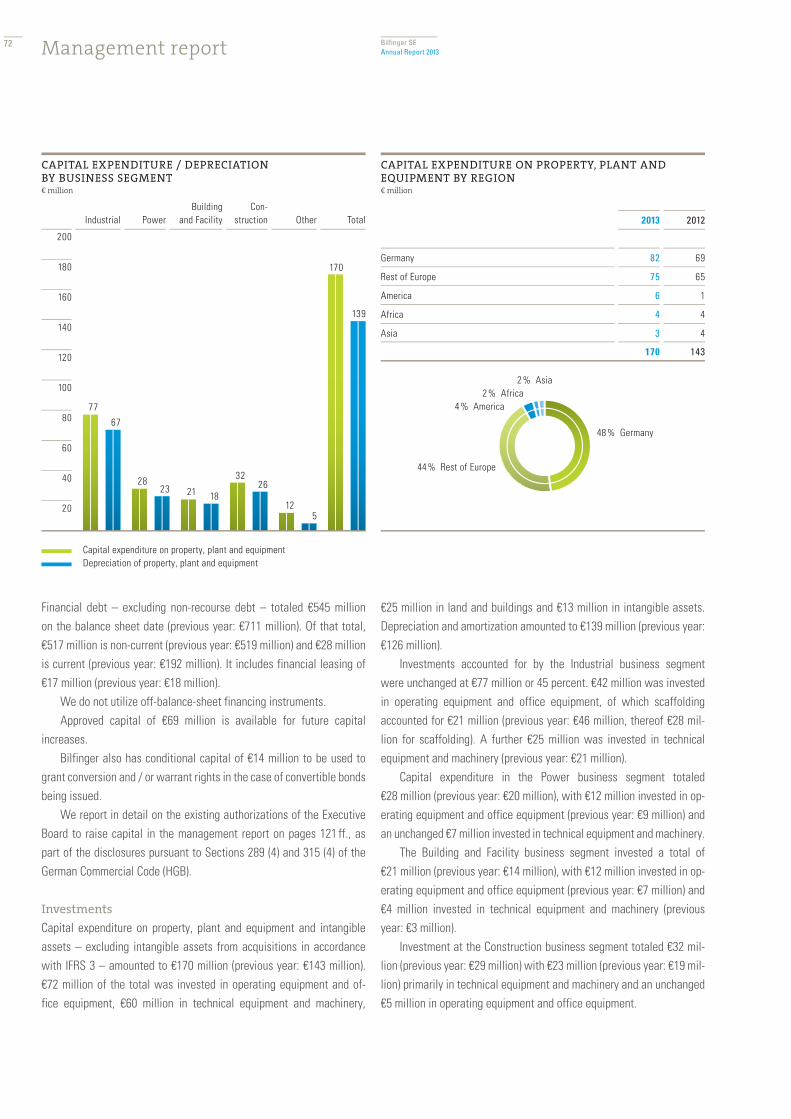
Financial debt – excluding non-recourse debt – totaled €545 million on the balance sheet date (previous year: €711 million). Of that total, €517 million is non-current (previous year: €519 million) and €28 million is current (previous year: €192 million). It includes financial leasing of €17 million (previous year: €18 million).
We do not utilize off-balance-sheet financing instruments.Approved capital of €69 million is available for future capital
increases. Bilfinger also has conditional capital of €14 million to be used to
grant conversion and / or warrant rights in the case of convertible bonds being issued.
We report in detail on the existing authorizations of the Executive Board to raise capital in the management report on pages 121 ff., as part of the disclosures pursuant to Sections 289 (4) and 315 (4) of the German Commercial Code (HGB).
Investments
Capital expenditure on property, plant and equipment and intangible assets – excluding intangible assets from acquisitions in accordance with IFRS 3 – amounted to €170 million (previous year: €143 million). €72 million of the total was invested in operating equipment and of-fice equipment, €60 million in technical equipment and machinery,
€25 million in land and buildings and €13 million in intangible assets. Depreciation and amortization amounted to €139 million (previous year: €126 million).
Investments accounted for by the Industrial business segment were unchanged at €77 million or 45 percent. €42 million was invested in operating equipment and office equipment, of which scaffolding accounted for €21 million (previous year: €46 million, thereof €28 mil-lion for scaffolding). A further €25 million was invested in technical equipment and machinery (previous year: €21 million).
Capital expenditure in the Power business segment totaled €28 million (previous year: €20 million), with €12 million invested in op-erating equipment and office equipment (previous year: €9 million) and an unchanged €7 million invested in technical equipment and machinery.
The Building and Facility business segment invested a total of €21 million (previous year: €14 million), with €12 million invested in op-erating equipment and office equipment (previous year: €7 million) and €4 million invested in technical equipment and machinery (previous year: €3 million).
Investment at the Construction business segment totaled €32 mil-lion (previous year: €29 million) with €23 million (previous year: €19 mil-lion) primarily in technical equipment and machinery and an unchanged €5 million in operating equipment and office equipment.
CAPITAL EXPENDITURE / DEPRECIATION BY BUSINESS SEGMENT€ million
200
180
160
140
120
100
80
60
40
20
TotalOtherCon-
structionBuilding
and FacilityPowerIndustrial
Capital expenditure on property, plant and equipmentDepreciation of property, plant and equipment
139
5
2618
23
67
170
12
32
2128
77
CAPITAL EXPENDITURE ON PROPERTY, PLANT AND EQUIPMENT BY REGION€ million
2013 2012
Germany 82 69
Rest of Europe 75 65
America 6 1
Africa 4 4
Asia 3 4
170 143
48 % Germany
2 % Africa4 % America
44 % Rest of Europe
2 % Asia
Management report Bilfinger SEAnnual Report 2013
72

The regional focus of investment was again on Europe, which accounted for 92 percent of the total (previous year: 93 percent). Germany account-ed for an unchanged 48 percentage points of European investments.
Payments in the amount of €251 million (previous year: €378 mil-lion) were made for investments in financial assets – corporate acquisi-tions, increases in equity interests and earn-out obligations. The most important acquisitions include the American water technology special-ists Johnson Screens Inc. and the British real-estate services provider Europa Support Services Ltd. Important acquisitions from the previous year included Neo Structo / India, Tebodin / The Netherlands, Westcon / USA and the German company Envi Con. Further information on corpo-rate acquisitions can be found in the notes to the consolidated financial statements on pages 152 ff. under ‘Consolidated Group.’
Statement of cash flows
Cash earnings declined to €289 million (previous year: €419 million), primarily due to the lower level of EBIT. Working capital was still significantly negative and decreased by €99 million (previous year: €134 million). Primarily impacted by this were the Power and Construc-tion business segments due to the comparatively low orders received.
The gains on disposals of non-current assets, which are to be de-ducted from operating cash flow, decreased to €28 million (previous year: €53 million). They relate primarily to capital gains realized on the reduction of our investments in the Nigerian business.
Cash flow from operating activities of continuing operations amounted to €162 million (previous year: €232 million).
Investments in property, plant and equipment and intangible assets exceeded the relatively low level of the prior year with €170 million (previous year: €143 million). These cash outflows were offset by a cash inflow which was unchanged at €17 million.
Disposals of financial assets resulted in total proceeds of €208 million (previous year: €333 million); of that amount, €171 million was accounted for by the sale of concession projects (previous year: €270) million and €25 million by the reduction of investments in the Nigerian business (previous year: €59 million). This led to a free cash flow of €217 million (previous year: €439 million). Investments in finan-cial assets totaled €251 million after €378 million in the prior year. They relate to corporate acquisitions, increases in equity interests and earn-out obligations.
The net cash outflow from financing activities of €296 million includes primarily the dividend payment to shareholders of Bilfinger SE for the previous financial year in the amount of €132 million as well as repayment of a promissory note loan with an amount of €166 million. The high cash inflow from the prior year of €335 million resulted from the placement of a bond in the amount of €500 million.
Continuing operations resulted in a net cash outflow of €330 mil-lion. There had been a net cash inflow of €396 million in the prior year.
The cash outflow from discontinued operations amounts to €46 million (previous year: €151 million).
Exchange-rate changes led to an arithmetical decrease in cash and cash equivalents of €13 million, after an increase of €5 million in 2012.
Cash and cash equivalents of concessions projects classified as held for sale amount to €22 million on the balance sheet date, €7 mil-lion were disposed of in the course of the sale.
In total, cash and cash equivalents at the end of the year decreased to €668 million (previous year: €1,087 million).
STATEMENT OF CASH FLOWS (ABRIDGED)€ million
2013 2012
Cash earnings from continuing operations 289 419
Changes in working capital -99 -134
Gains on the disposal of non-current assets -28 -53
Cash flow from operating activities of continuing operations 162 232
Capital expenditure on P, P & E and intangible assets -170 -143
Proceeds from the disposal of property, plant and equipment 17 17
Cash outflow for P, P & E and intangible assets -153 -126
Proceeds from the disposal of financial assets 208 333
Free cash flow from continuing operations 217 439
Investments in financial assets -251 -378
Cash flow from financing activities of continuing operations -296 335
Issue of treasury shares as part of the employee share program 1 0
Dividends -138 -152
Payments from changes in ownership without change in control -4 0
Repayment of debt / borrowing -155 487
Change in cash and cash equivalents of continuing operations -330 396
Change in cash and cash equivalents of discontinued operations -46 -151
Change in value of cash and cash equivalents due to changes in foreign exchange rates -13 5
Change in cash and cash equivalents -389 250
Cash and cash equivalents at January 1 1,087 847
Cash and cash equivalents classified as assets held for sale (Concessions) at January 1 (+) / at December 31 (-) -22 68
Disposal of cash and cash equivalents Concessions -7 -78
Cash and cash equivalents at December 31 669 1,087
Management reportEconomic report
Bilfinger SEAnnual Report 2013
73

Information on the results of operations, net assets and financial position of Bilfinger SE (company financial statements in accordance with the German Commercial Code)___
Results of operations
The income statement of the company financial statements of Bilfin-ger SE is characterized by its holding function. Revenue amounted to €110 million (previous year: €113 million) and resulted almost solely from output volume charged to companies of the Group.
Other operating income of €7 million (previous year: €8 million) is primarily the result of currency translation.
The decrease in personnel expenses resulted from lower expenses for bonus payments. Insofar as these relate to employees of subsidiar-ies, they are covered in the reporting year by the relevant units them-selves.
Other operating expenses primarily consists of non-personnel administrative expenses, rents and leases, insurance premiums, other service and personnel expenses as well as additions to provisions.
Financial income of €206 million (previous year: €294 million) main-ly comprises income from profit-and-loss-transfer agreements as well as other investment income from companies of the Group. Income and expenses from profit-and-loss-transfer agreements are subject to fluc-tuations relating to the accounting of contracts in accordance with the realization principle of the German Commercial Code (HGB).
The net interest result decreased due to reduced interest income (minus €5 million) related to lower levels of interest rates and a decrease in income from plan assets for pension provisions and due to increased interest expenses (plus €4 million) in the course of the issue of a €500 million bond in December 2012.
Profit from ordinary activities decreased to €120 million (previous year: €212 million). The decline is attributable to significantly lower earnings from financial assets.
There was no tax expense in the reporting year (previous year: €14 million). It must be considered here that earnings from profit-and-loss-transfer agreements primarily comprise tax-free distributions and capital gains.
Net profit after taxes amounts to €120 million (previous year: €198 million). Of that total, €45 million (previous year: €99 million) has been transferred to other retained earnings. Including the profit carried for-ward of €63 million (previous year: €97 million), this results in distribut-able earnings of €138 million (previous year: €196 million).
Net assets and financial position
The financial position of Bilfinger SE is governed by its function as a holding company.
Total assets of €2,956 million (previous year: €3,225 million) pri-marily comprise financial assets of €1,538 million (previous year: €1,948 million), receivables of €961 million (previous year: €349 mil-lion), and cash, cash equivalents and securities of €430 million (previous year: €904 million).
Financial assets decreased by €410 million to €1,538 million. Loans to associates in particular decreased by €322 million. The decrease re-sults primarily from the repayment of long-term loans to subsidiaries. Through the Group’s internal transfer of companies, shares in associ-ates decreased by €84 million.
Receivables and other assets of €917 million (previous year: €335 million) mainly comprises receivables from subsidiaries in connec-tion with the Group’s central corporate financing. The increase resulted on the one hand from the financing of acquisitions and on the other hand from the restructuring of long-term loans in short-term loans.
On the other side of the balance sheet, equity amounts to €1,500 million (previous year: €1,512 million), provisions amount to €195 million (previous year: €253 million) and liabilities amount to €1,261 million (previous year: €1,460 million).
INCOME STATEMENT OF BILFINGER SE (HGB)€ million
2013 2012
Revenue 110 113
Other operating income 7 8
Personnel expenses -61 -65
Amortization of intangible assets / depreciation of property, plant & equipment -1 -1
Other operating expenses -129 -134
Earnings from financial assets 206 294
Net interest result -12 -3
Earnings from ordinary business activities 120 212
Income tax expense 0 -14
Net profit 120 198
Profit carryforward 63 97
Allocation to other retained earnings -45 -99
Unappropriated retained earnings 138 196
Management report Bilfinger SEAnnual Report 2013
74

Provisions include tax provisions of €44 million (previous year: €45 million) and other provisions of €150 million (previous year: €208 million). The reduction in other provisions was use-related, among other things due to the payment of a fine to the U.S. Department of Justice.
The retirement benefit obligation is fully funded with plan assets, whereby the surplus funding of €23 million (previous year: €21 million) is presented as a net asset after offsetting.
Liabilities in the amount of €637 million (previous year: €699 mil-lion) include liabilities to associates from deposits in connection with centralized cash pooling. They also include financial debt in the amount of €500 million (previous year: €666 million) for a primary unsecured bond issued in December 2012 with a term until December 2019. The decrease of €166 million results from the scheduled repayment of a promissory note loan.
The equity ratio was 51 percent at the balance sheet date (previous year: 47 percent).
Opportunities and risks
The business development of Bilfinger SE is generally subject to the same risks and opportunities as the Bilfinger Group.
As the parent company of the Bilfinger Group, Bilfinger SE is in-cluded in the Group-wide internal control and risk-management system.
Outlook
As the parent company of the Group without any business operations of its own, Bilfinger SE receives revenue primarily from its subsidiaries. Positive expectations with regard to the Group’s business development will generally affect the earnings of Bilfinger SE. We do, however, ex-pect a substantial merger loss in financial year 2014 in connection with our planned Group restructuring with the merger of Subgroup parent companies and Bilfinger SE which will lead to significantly lower earn-ings for the year as compared to the prior year. This will not hinder the ability to distribute a dividend since the company has extensive re-serves to offset this merger loss. We assume that we will continue to achieve net profit sufficient for our shareholders to participate in the company’s success with an attractive dividend.
Declaration of corporate governance in accordance with
Section 289a of the German Commercial Code (HGB)
The declaration of corporate governance pursuant to Section 289a of the German Commercial Code (HGB) has been made available on the company’s website (www.bilfinger.com) under the heading Corporate Governance.
BALANCE SHEET OF BILFINGER SE (HGB, ABRIDGED)€ million
Dec. 31, 2013 Dec. 31, 2012
Assets
Non-current assets
Intangible assets and P, P & E 4 3
Financial assets 1,538 1,948
1,542 1,951
Current assets
Receivables and other assets 961 349
Cash and cash equivalents 430 904
1,391 1,253
Excess of plan assets over pension liability 23 21
Assets 2,956 3,225
Equity and liabilities
Equity 1,500 1,512
Provisions 195 253
Liabilities 1,261 1,460
Equity and liabilities 2,956 3,225
Management reportEconomic report
Bilfinger SEAnnual Report 2013
75
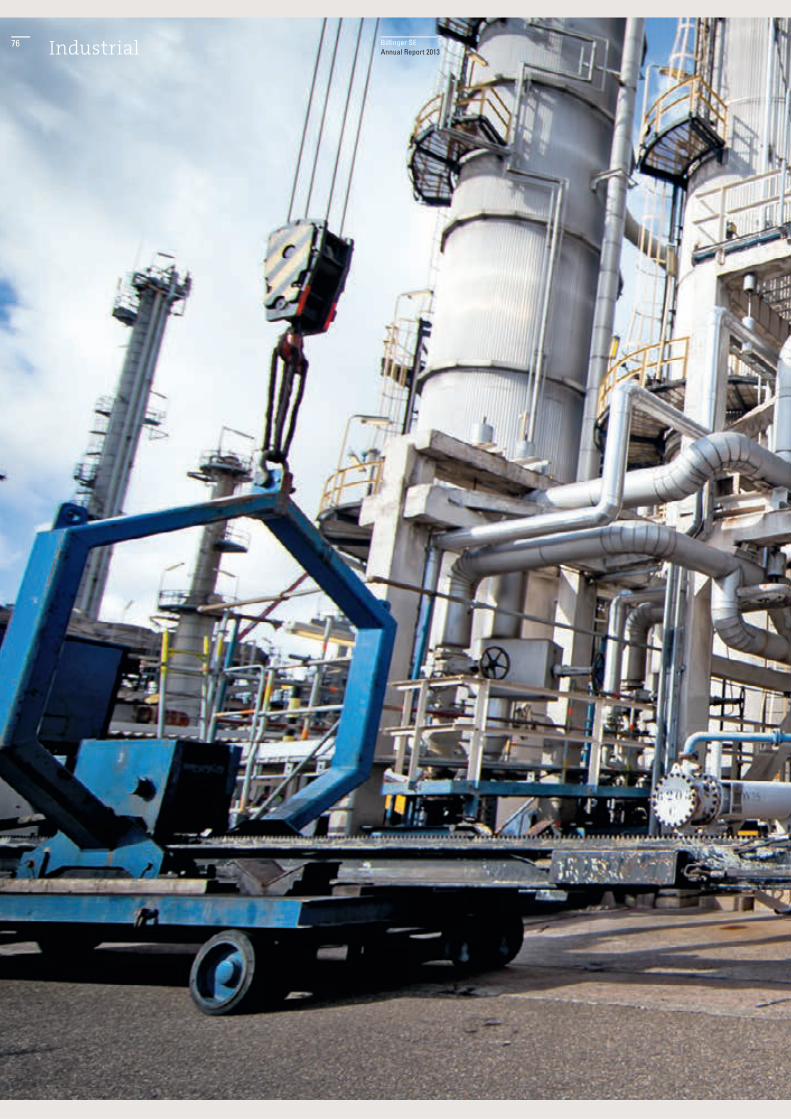
Industrial Bilfinger SEAnnual Report 2013
76

Management reportIndustrial
Bilfinger SEAnnual Report 2013
77

Bilfinger SEAnnual Report 2013Industrial
INDUSTRIAL
AS ONE OF THE WORLD’S LEADING PROVIDERS OF INTEGRATED TECHNICAL SERVICES FOR THE PROCESS INDUSTRY
AND THE ENERGY SECTOR, WE COMBINE ENGINEERING EXPERTISE AND SERVICE MENTALITY
–––––
THE KEY TO OUR SUCCESS IS OUR COMPREHENSIVE RANGE OF TECHNICAL SERVICES FOR THE ENTIRE LIFECYCLE
OF INDUSTRIAL PLANTS, FROM ENGINEERING TO MAINTENANCE
–––––
WE PROVIDE OUR SERVICES TO CLIENTS WORLDWIDE WITH THE HIGHEST STANDARDS OF OCCUPATIONAL SAFETY,
ENVIRONMENTAL PROTECTION AND QUALITY
78
Management reportIndustrial
Bilfinger SEAnnual Report 2013
Economic environment In the euro zone, the year under review brought another setback for investments in plant and equipment, which are important for industrial services. Following a fall of 4.8 percent in 2012, companies’ capital ex-penditure fell by a further 2.9 percent in 2013 (COM 2013). Companies’ willingness to invest was noticeably impacted also in Germany, where a significant decrease of 2.7 percent was recorded. The reasons for this lack of business confidence were the uncertainties of the euro crisis and the related weakness of sales in Europe. However, a noticeable improvement in companies’ optimism and rising willingness to invest were apparent as the year progressed.
Companies were more willing to invest in the United Kingdom, where capital expenditure increased by 3.3 percent. Negative develop-ment in the chemical and oil and gas sectors could therefore be off-set by increasing business activity in other sectors. In Norway, a high level of investment continues to flow into oil and gas production which means that market prospects remain good. Investment proceeded at a steady pace also in the United States with an increase of 3.5 percent. There, utilization of fossil fuels was expanded significantly. By drilling for natural gas into dense rock strata with the use of new technologies (fracking), gas production has increased by 27 percent since 2005 and has meanwhile reached an all-time high (TI USA in Focus 2013). The boom in shale gas and the accompanying increase in oil production re-duced the import dependence of the U.S. economy once again in 2013. The International Energy Agency expects the United States to become the world’s biggest oil producer by the 2020s. Due to the U.S. energy boom, there is a strong and sustained willingness to invest in the oil and gas industry.
The German market is meanwhile estimated to have a volume of €25 billion (LünIS 2013). However, due to the unfavorable level of in-vestment, the growth rate fell again compared with the previous year by 1 percentage point to 4.7 percent (LünIS 2013), and is thus significantly lower than the double-digit rates of expansion of 2010/2011. Chemi-cals and petrochemicals continue to be the most important sectors; their proportion of the market increased slightly from 33.1 percent to 34.4 percent (LünIS 2013). The ongoing trend to outsource industrial services has facilitated further growth of the market in Germany.
Sources: COM 2013: European Commission, European Economic Forecast, Autumn 2013, November LünIS 2013: Lünendonk Study 2013, Leading industrial service companies in Germany, September 2013 TI USA in Focus 2013: Trade & Invest Germany, USA in Focus, August 2013
Market position and strategic success factors We are partner of choice for our clients especially in the process industry and the energy sector, and set standards for technical solu-tions covering the entire lifecycles of their plants. Our market position is based on the special way in which we combine technical expertise and a focus on services.
The services we provide range from consulting, engineering and project management to manufacturing and assembly as well as solu-tions for far-reaching maintenance concepts and ambitious projects. We combine our expertise to create optimal, demand-oriented solutions for our clients. Our goal is to increase plant efficiency and availability for our clients, thus improving plant productivity, reducing relative main-tenance costs, and to optimizing lifecycle costs.
With a focus on long-term partnerships, we combine local presence and a services orientation of our highly-qualified employees with the expertise of an international group for the benefit of our clients.
An important part of our operational activities relates to the gen-eral overhaul of large plants in the process industry, also known as turnarounds. They serve to perform regular inspections of large-scale industrial plants and are used to carry out alterations or expansions. Turnarounds require up to 100,000 individual tasks, which have to be performed by a large number of involved companies within a very short time in order to keep the production shortfall as small as possible. Industrial companies are increasingly outsourcing their turnarounds to managing contractors, which assume responsibility for the planning, coordination and execution of all work, and are the sole point of contact for the client. With our deep understanding of technical correlations and the expertise of our specialists, we are ideally placed to perform these tasks. Our clients for turnaround services include BASF, Borealis, BP, Esso, Kuwait Petroleum, Neste Oil, Total and Yara.
We further extended our expertise in the field of control systems in 2013 with the acquisition of GreyLogix, an automation specialist. The intelligent networking of local energy producers has a key role to play in the context of the energy transformation. Bilfinger technology controls the operation of natural-gas storage units, adjusts the electricity feed into the network to current consumption and optimizes the use of local energy sources.
79

Bilfinger SEAnnual Report 2013Industrial
Growth strategy
Organic__ Our entire range of services is offered in all markets __ We are expanding our activities in the general overhaul of large
plants in the process industry (‘turnarounds’) __ Outsourcing (maintenance of industrial plants also by taking over
the client’s service personnel) especially with major international clients
__ Growth of integrated service packages
Acquisitional __ Regions: United States, Europe, Asia__ Sectors: engineering, oil and gas, mechanical engineering, and
electrical, instrumentation and control technology
PerformanceThe Industrial business segment showed successful development after a moderate start to the year. Output volume increased by 7 percent to €3,963 million. The strong upturn in the second half resulted in organic growth of 3 procent for the financial year as a whole. Orders received increased at a higher rate than output volume to €4,290 million. With the margin increasing to 5.9 percent, EBITA reached €232 million. The number of employees rose to 37,945.
Apart from Germany with a share of 21 percent, the most impor-tant markets were in European countries outside Germany, which had a share of 59 percent, in particular Scandinavian and Benelux countries, the United Kingdom, Austria and Eastern European countries. 17 per-cent of output volume was generated in the American market.
Market trendThe market for industrial services is generally stable, despite ongoing pressure on margins. In the project business, we continue to observe a reticence to invest on the part of our clients in many markets. But in the United States, as a result of the country’s energy policy, the oil and gas industry is booming and Bilfinger is participating. Projects for inspec-tions of major production plants are ensuring good capacity utilization in European markets. In the consulting and engineering business, the markets of the Middle East offer particularly good prospects. We are supporting international clients’ strong investment activity with feasi-bility studies, engineering services and project management.
KEY FIGURES INDUSTRIAL€ million
2013 2012 ∆ in %
Output volume 3,963 3,705 +7
Orders received 4,290 3,737 +15
Order backlog 2,967 2,733 +9
Capital expenditure on P, P & E 77 77 0
Depreciation 67 61 +10
EBITA / EBITA adjusted 232 206 +13
EBITA margin (%) 5.9 5.6
Employees (at December 31) 37,945 37,056 +2
INDUSTRIAL: OUTPUT VOLUME BY REGION€ million
2013 2012 ∆ in %
Germany 841 805 +4
Rest of Europe 2,345 2,292 +2
America 652 490 +33
Asia 125 118 +8
3,963 3,705 +7
21% Germany
59 % Rest of Europe
17 % America3 % Asia
80

Management reportIndustrial
Bilfinger SEAnnual Report 2013
Management structure and areas of activity From financial year 2014, management of the operational Group units in the Industrial business segment will be carried out by divisions of Bilfinger SE with the following areas of activity:
Industrial Maintenance__ Maintenance and repair services for industrial plants__ Conversion, expansion and modernization of plants
Insulation, Scaffolding and Painting__ Insulation solutions (heat insulation, cold insulation, noise protec-
tion, fire protection)__ Scaffolding (industrial and specialist solutions)__ Painting and coating (surfaces / corrosion protection)
Oil and Gas__ (Offshore) maintenance and repair services__ Specialist services: insulation, scaffolding and corrosion protection__ Training (e.g., industrial climbers)
Industrial Fabrication and Installation__ Assembly and installation of plant components (e.g., apparatus
engineering)__ Construction of industrial plants__ Manufacturing and installation of piping systems and components
Engineering, Automation and Control__ Design and engineering of industrial facilities including power
plants__ Project management and construction management__ Design, manufacture and installation of industrial automation solu-
tions (electrical, instrumentation and control technology)
Support Services__ Placement of qualified own personnel in the industrial and com-
mercial areas__ Provision, repair and logistics for machines and equipment
ClientsIndustrial companies in the core markets of oil and gas, refineries and petrochemicals, chemicals and agrochemicals, pharmaceuticals, food and beverages, power generation, steel and aluminum
Key competitorsCape, Fabricom, Fluor Industrial Services, Hertel, Kaefer, Redhall, Re-mondis, Voith Industrial Services
Important events 2013Our services business for oil and gas production facilities in the North Sea and Barents Sea continued to develop well. Framework agreements with long-standing clients like Statoil, Marathon Oil and Chevron for ex-tensive repair and maintenance services were extended once again. Our tasks include repairs and maintenance as well as the modernization of offshore production platforms and onshore processing facilities includ-ing Europe’s largest gas liquefaction plant near Hammerfest in Norway as well as refineries and steel works in the Benelux countries. In the re-porting year, as market leader for services in the processing industry in Scandinavia, Bilfinger extended the contract with plastics manufacturer Borealis, for example, for maintenance services at its Swedish location in Stenungsund.
In North America, another focal point of our project business, we have received, among others, orders for the construction of gas process-ing plants as well as for the comprehensive project management and assembly work in a new refinery as part of the first new refinery in the USA since 1976.
Our services in the consulting and engineering business are also in demand. In Abu Dhabi we won an order for the detail engineering of a plant for the commercial separation, utilization and storage of carbon dioxide. The project is the first of its kind in the Middle East. The new plant extracts the CO2 from the production process of a steel factory, compresses and dries it before sending it through a 50-kilometer long pipeline to the oilfield on the Rumaitha Coast. There are three immedi-ate benefits from this project: the reduction of fuel gas emissions in the United Arab Emirates, the availability of the carbon dioxide for efficient oil production technology and the reclamation of natural gas for domes-tic energy production.
Our experts are also finding solutions to very specialized problems: the Norwegian community of Rjukan is located in a deep valley which receives no sunlight in the winter. Bilfinger has now made the one-hundred year old idea to redirect the sun’s light into the town using mir-rors a reality. Computers are helping three heliostats as tall as houses to follow the path of the sun and reflect 80 percent of its rays to the town’s marketplace. They were built with the cold, snowy and stormy Norwegian winter in mind. The sun reflectors operate on wind and solar energy. The appearance of the winter sun in Rjukan was a global media event at the end of October 2013.
OutlookWe have summarized details of the expected development of Industrial and our other business segments in the Outlook section on pages 118 ff.
81

Power Bilfinger SEAnnual Report 2013
82

Management reportPower
Bilfinger SEAnnual Report 2013
83

Bilfinger SEAnnual Report 2013Power
POWER
EXPERTISE, QUALITY, RELIABILITY AND ADHERENCE TO DEADLINES ARE THE BASIS FOR OUR SUCCESS
–––––
MODERNIZATION AND SERVICE-LIFE EXTENSIONS FOR EXISTING POWER STATIONS
ARE BECOMING INCREASINGLY IMPORTANT
–––––
WE ARE WELL-PREPARED FOR THE CHALLENGES OF THE ENERGY TRANSFORMATION
84
Management reportPower
Bilfinger SEAnnual Report 2013
Economic environment The German market for services in the area of power plants and energy developed only moderately in 2013. The German energy transformation had no direct negative effects on the volume of repair and maintenance services for fossil and nuclear power plants. Conventional power plants with low electricity generation require these services as well as – due to the long dismantling times – nuclear power plants before or after decommissioning (LünIS 2013). However, the energy transformation is still causing considerable uncertainty with regard to the construction of new conventional power plants and the modernization of existing ones in Germany. Uncertainty about future sales and price prospects continued to be a significant obstacle to investment and also adversely affected the market for power-plant services.
In the Gulf States, substantial investment has been initiated in re-generative energy and nuclear power with the aim of diversifying the supply of energy away from the almost complete dependence on fos-sil fuels. Saudi Arabia for example intends to double its power-plant capacity by 2032 to between 120 and 130 gigawatts. Renewable energies are then to supply 50 gigawatts of that total (TI Saudi Arabia Trends 2013).
Capacity shortages in electricity production have always been a serious obstacle to economic development in South Africa. By 2030 therefore, 43 gigawatts of new power-plant capacity is to be created, with renewable energies taking a substantial share of 40 percent of this extra capacity. (TI South Africa Solar Energy 2013).
Market position and strategic success factors The depth of our own vertical integration, quality and on-time delivery all give Bilfinger Power an excellent market position. With our own ex-pertise and our own capacities, we provide power-plant operators with products and services of the highest quality. We optimize the down-times that are necessary for the maintenance and modernization of facilities and reliably adhere to deadlines that have been set. In light of the aging of many power plants and public resistance to new locations, modernization and service-life extensions of existing power plants are highly important.
Bilfinger Power’s competitive advantage is its broad portfolio. Our specialists plan, produce, supply and install all boiler components for power plants. By optimizing combustion systems, we achieve higher efficiency, reduce CO2 emissions and extend plant lifetimes. Our services portfolio ranges from engineering to commissioning, allowing us to cover the complete lifecycle of power plants.
Sources:LünIS 2013: Lünendonk Study 2013, Leading Industrial Services Companies in Germany, September 2013 TI Saudi Arabia Trends 2013: Trade & Invest Germany, Economic Trends Mid-2013 – Saudi Arabia, June 2013 TI South Africa Solar Energy 2013: Trade & Invest Germany, Compact Sector – Solar Energy – South Africa, June 2013
Combustion technology is the key to steam generation, because effi-ciently controlled combustion improves a power plant’s efficiency and reduces CO2 emissions. And that applies no matter whether the plant uses lignite, coal, oil, natural gas, biomass, nuclear power or waste as a source of primary power. Our goal is to achieve increased output with less fuel, and thus to reduce emissions. In order to increase power-plant efficiency, higher temperatures and higher pressures are required. We have special expertise in the highly critical processing of the special materials needed in these processes.
In the year under review, we expanded our portfolio with the addi-tion of turbine services by acquiring the assets of the Swiss company ESG Energy Service Group (ESG). ESG provides services for steam and gas turbines and generators as well as manufacturing and supplying components. Its expertise and equipment capacities are a perfect fit with Bilfinger’s existing structures. This acquisition allows us to offer our clients the demanding, complex maintenance of their entire power plant from one source.
Our highly qualified engineers are constantly developing new and intelligent solutions to meet the steadily growing demands of power-plant processes. We cooperate with the universities of BTU Cottbus, TU Darmstadt and Duisburg- Essen on individual development projects. This includes for example control technology for low-voltage networks and our mobile micro gas-turbine unit QiP ®.
As a European market leader for high-pressure piping systems, Bilfinger has decades of experience in the engineering, pre-production and assembly of piping systems. We specialize in the exact bending of pipes made of special materials and with up to 12 centimeters material thickness in powerful inductive pipe-bending systems. This allows us to guarantee that our products will withstand the very high temperatures and high pressures inside modern power plants.
Bilfinger’s machine and apparatus engineering has specialist knowledge in the combination of welding technology and mechanical processing as well as in the assembly of large, heavy and complex steel components. The services provided include reactor containers weigh-ing several tons for the chemical industry, core containers for nuclear power plants, as well as blade wheels for hydroelectric power plants and foundations for offshore wind turbines.
Engineers in the Nuclear and Environmental Technology business units deliver pioneering new solutions for highly complex facilities. These include, for example, flue gas purification systems for power plants, superconducting magnets for research facilities and contain-ment structures for nuclear power plants. A broad spectrum of special-ized knowledge and decades of experience in environmental technol-ogy, magnet technology as well as nuclear technology and service mean that our experts are sought-after partners for the operators of power plants and major research facilities.
85
Bilfinger SEAnnual Report 2013Power
Growth strategy
Organic __ Developing new regions __ Expanding our service portfolio in all markets
Acquisitional __ Regions: United States, Europe, Middle East, Asia __ Sectors: extensive portfolio for power-plant technology and regen-
erative energies
PerformanceOutput volume in the Power business segment decreased to €1,256 million. This is attributable to the current reluctance of energy suppli-ers to make investments and the planned reduction in output volume from the Belchatow power plant project in Poland, which will, however, increase once again in 2014. Although organic growth was down by 8 percent, the total decrease in output volume amounted to 5 percent. Orders received and the order backlog also stood at a comparatively low level. EBITA amounted to €123 million as in the previous year. The EBITA margin increased to an unusually high level of 9.8 percent not least due to the completion of a number of projects. The number of employees increased to 10,028.
Business in Germany accounted for 34 percent of output volume. 32 percent of volume was generated in European countries outside Ger-many with a focus on Finland, the Netherlands and Poland. South Africa as well as the Middle East are also important international markets.
Market trend With population growth and increasing industrialization, global demand for energy is rising and can only be met through a mix of the various energy sources that are available. In addition to renewable energy, coal, gas and nuclear power will be indispensable to cover base loads for the foreseeable future. The use of these energy sources will therefore increase moderately.
We are faced with strong demand for our know-how in both conven-tional power plants and nuclear technology in our international markets. The importance of our international business is growing steadily. With our expertise, we are in great demand as a partner for projects usually involving a high degree of complexity. This applies, in particular, to our specialty – modernization and service life extension of existing plants.
In Germany, energy utilities’ willingness to invest in conventional power plants is still low due to uncertainty about the future form of the country’s energy policy. We were able to partially offset the drop in demand in Germany with our international business. The proportion of business generated in Germany, which was still two-thirds of the business segment’s total revenue just a few years ago, has decreased to one-third. In view of the lack of storage possibilities for the growing
KEY FIGURES POWER€ million
2013 2012 ∆ in %
Output volume 1,256 1,319 -5
Orders received 1,094 1,178 -7
Order backlog 1,176 1,311 -10
Capital expenditure on P, P & E 28 20 +40
Depreciation 23 22 +5
EBITA / EBITA adjusted 123 123 0
EBITA margin (%) 9.8 9.3
Employees (at December 31) 10,028 9,278 +8
POWER: OUTPUT VOLUME BY REGION€ million
2013 2012 ∆ in %
Germany 432 487 -11
Rest of Europe 406 435 -7
America 33 11 +200
Africa 226 237 -5
Asia 159 150 +6
1,256 1,319 -5
34 % Germany
32 % Rest of Europe
18 % Africa
3 % America
13% Asia
86

Management reportPower
Bilfinger SEAnnual Report 2013
production of green electricity, the new federal government – on the basis of the coalition agreement between the CDU / CSU and the SPD – intends to ensure that enough conventional coal- and gas-fired power plants remain in the network to secure a permanent supply of electric-ity. It remains to be seen to what extent and in which periods these plans will lead to specific investments by utilities.
Management structure and areas of activityFrom financial year 2014, management of the operational Group units in the Power business segment will be carried out by divisions of Bilfinger SE with the following areas of activity:
Power Systems__ Services for power plants over their entire lifecycles (new construc-
tion, maintenance and demolition)__ Efficiency-enhancing measures, wear protection and lifetime exten-
sions for power plants __ Design, production and installation of components for power-plant
construction
Piping Systems__ Development, design, production as well as assembly and commis-
sioning of piping-related system parts and components for power plants and industry
__ Pipeline, district heating and storage technology__ Maintenance, repair and rehabilitation of these systems
ClientsEnergy utilities, industrial companies, plant manufacturers and research institutes
Major competitors Alpic, Alstom Power, Balcke-Dürr, Doosan Babcock, Mitsubishi-Hitachi, Shaw
Important events in 2013 In the international business, demand for our power-plant services is high. Our longstanding client Dubai Aluminium placed an order with us in 2013 to replace five old waste-heat boilers with modern units in the Jebel Ali gas and steam power plant. This refitting will significantly increase the steam output and considerably reduce the plant’s sound levels.
In Europe’s biggest lignite-fired power plant in Belchatow, Poland, we completed the renovation of three boilers last year and six more are currently being renovated. The plant is being fitted with state-of-the-art technology so that it meets the strict environmental standards of the European Union. In the late summer of 2013, we were contracted to carry out the lifetime extension, efficiency and output improvements as
well as emission reduction of an additional block, on which we will start work in 2016. Also in Poland, we are modernizing the Turow power plant with three flue-gas desulfurization units with the use of limestone slurry as a scrubbing medium. The order received by Bilfinger Power includes not only the components for the desulfurization units, but also the com-plete electrical and control system. Bilfinger Construction is responsible for the related die construction work.
The cooperation we started with the European Organization for Nu-clear Research (CERN) in 1990 is being continued. Together with experts from CERN, our engineers will develop and produce superconducting prototype magnets in the innovative niobium-tin technology, which will be required for the next stage of the LHC particle accelerator in Geneva. With the new material combination, the strength of the magnetic field is to be increased by more than 30 percent. Our specialists have already produced more than 400 dipole magnets for CERN.
In Germany, there is little willingness to invest in conventional power plants due to uncertainty about the effects of the energy trans-formation. In view of the decommissioning of nuclear power plants that has been decided upon, the energy utilities will have to adapt to the implementation of these measures. Dealing with residual and waste materials is of key importance for the disposal of nuclear power plants that are no longer in use. With the application of appropriate methods, dismantled contaminated and activated plant components – so-called residual materials – will be selected, treated and recycled as far as possible. Bilfinger has expertise with services in the nuclear field and practical experience with technology for processing residual materials, for example with equipment for dismantling and with special decon-tamination methods for minimizing waste.
Outlook Summarized details of the expected development of the Power busi-ness segment and of our other business segments are provided in the Outlook section on pages 118 ff.
87

Building and Facility Bilfinger SEAnnual Report 2013
88

Management reportBuilding and Facility
Bilfinger SEAnnual Report 2013
89

Bilfinger SEAnnual Report 2013Building and Facility
BUILDING AND FACILITY
WE ARE STRENGTHENING OUR LEADING MARKET POSITION FOR FACILITY SERVICES IN GERMANY AND EUROPE
–––––
OUR SPECIALTY: SOLVING COMPLEX TASKS
–––––
BUILDING AND FACILITY SERVICES OFFER AN INNOVATIVE LIFECYCLE PRODUCT: ‘ONE’
90

Management reportBuilding and Facility
Bilfinger SEAnnual Report 2013
Economic environment
Building
The German market for building construction featured a disparate de-velopment in 2013. For private and institutional investors, residen-tial construction continued to be attractive due to ongoing low inter-est rates, the good level of employment and the low yields on secure financial investments. On the other hand, investment in the construc-tion of public-sector commercial properties decreased moderately, but stabilized as the year progressed. In the previous year, construction in the public sector had fallen by a double-digit rate due to the expiry of economic stimulus packages. The improved revenue situation of public-sector budgets had a positive impact in 2013. In the area of commercial construction, the segment of logistics and warehouses once again prof-ited from growth in the mail-order business. Prices for building construc-tion again increased at higher rates than consumer-price inflation
Facility Services
The market for outsourced facility management services in Germany has recently shown only moderate expansion at an annual rate of 1 to 2 per-cent (LünFac 2013). The market growth has been driven by rising new construction of office buildings and other commercial properties, but also by an increased industry penetration rate. While the volume of services provided externally is estimated at nearly €60 billion, Germany’s Federal Statistical Office calculates a market volume of about 5 percent of GDP (LünFac 2013) or €130 billion for the total of facility management services provided both internally and externally.
With regard to the demand for services, a shift was apparent towards technical facility management, which meanwhile accounts for one-third of all outsourced real-estate services. Energy management became increasingly important. The importance of traditional building services such as cleaning decreased somewhat, however. The share of the en-tire market accounted for by commercial facility management increased slightly, but is still relatively low at 6.5 percent of all services.
The process of consolidation within the industry continued, so the proportion of organic growth of the companies active in the German mar-ket therefore decreased slightly. Demand for facility management ser-vices from the industry and IT / telecommunication sectors continued to grow; those sectors together accounted for 40 percent of all revenue in the German market.
Source: LünFac 2013: Lünendonk Study 2013, Leading Facility Service Companies in Germany, July 2013 (Source for all figures and qualitative statements: LünFac 2013)
Market internationalization continued in both directions. On the one hand, foreign providers were increasingly active in the German market, which is very attractive due to its stability compared with other Europe-an countries. On the other hand, German providers were able to increase their revenues outside Germany faster than their domestic revenues, following a decrease in the proportion of total revenue generated out-side the country due to the euro crisis in the previous year. The most important foreign markets for German providers of facility management services are still the neighboring countries of Austria, Benelux, Poland, the Czech Republic and Switzerland. Of the countries directly bordering on Germany, only France continued to be difficult to access. Outside Europe, North America, the Gulf region and Asia are the most important foreign markets.
Market position and strategic success factors Under the brand ‘one,’ we offer our real-estate clients something special: We guarantee not only the design and construction costs, but also future energy consumption and other operating expenses over an agreed period of up to 30 years. In this way, we create a large degree of security for an investment.
The product ‘one’ is the result of close cooperation between the employees of the Building and Facility business segment, who are intensively occupied with the design, construction and operation of buildings. With the knowledge and experience they have gained, they are able to optimize the lifecycle of a property in consideration of pro-duction costs and future operating costs; this applies to the energy-related modernization of older buildings as well as new construction. With the expertise of its specialists, Bilfinger reliably produces cost-effective and sustainable real estate.
Building
With a full-range service offering, we are among the leading German companies for building construction. We avoid pure price competition and instead focus on providing our clients with high-quality solutions for sus-tainable, energy-efficient and cost-optimized buildings. We focus on part-nership contract models for design and construction, allowing us to apply our expertise to the benefit of our clients and to achieve better margins.
91

Bilfinger SEAnnual Report 2013Building and Facility
We cover the most important areas in Germany through a network of operational branches, with a major project unit, our own companies for interior fitting, cold storage construction and facade engineering, as well as specialized consulting, design and logistics units. Since 2013, with SPM Projektmanagement of Munich, we now also have our own unit for the management of construction projects, especially in the fields of healthcare and education.
Facility Services
Bilfinger is the market leader for facility services in Germany and is among the leading providers in Europe. With our 360° Facility Services concept, we offer our clients tailored services with innovative solutions in the facility management, real estate and water technology sectors. We have competitive advantages from the high proportion of services we provide directly and from a comprehensive portfolio in all our markets. We provide all services for the management of all kinds of facilities. In control centers, towers at international airports and other properties of DFS Deutsche Flugsicherung (the German company for air-traffic control), we make sure that technical facility management runs just as smoothly as air traffic. For Telefónica, we are responsible for the complete integrated facility management comprising techni-cal equipment, security, catering, rental / operator management and shop expansion, and the planning and execution of alterations and modernization. This takes place within the framework of holistic real estate – an innovative contract and management model by which the client ultimately will rent workplaces fully operated by Bilfinger. During sport events such as the Confederations Cup, we take care of catering with our organizational and logistical services. In shopping centers like Buyaka Istanbul, we not only designed the operator model, but are also responsible for letting the floor space successfully. We look after major clients through a tailored management model so that they can concen-trate on strategic tasks, and we also take over the important area of energy management. Along with increasing globalization, our inter-national clients’ demand for ‘one-stop shops’ is growing and boosting our outsourcing business. In currently 40 countries, we offer a uniformly high level of comprehensive services to companies in all sectors and are continually expanding this offering.
KEY FIGURES BUILDING AND FACILITY€ million
2013 2012 ∆ in %
Output volume 2,346 2,249 +4
Orders received 2,181 2,373 -8
Order backlog 2,304 2,147 +7
Capital expenditure on P, P & E 21 14 +50
Depreciation 18 14 +29
EBITA / EBITA adjusted 116 106 +9
EBITA margin (%) 4.9 4.7
Employees (at December 31) 22,069 15,292 +44
BUILDING AND FACILITY: OUTPUT VOLUME BY REGION€ million
2013 2012 ∆ in %
Germany 1,599 1,441 +11
Rest of Europe 454 377 +20
America 221 191 +16
Africa 11 219 -95
Asia 61 21 +190
2,346 2,249 +4
68 % Germany
1% Africa9 % America
3 % Asia
19 % Rest of Europe
92

Management reportBuilding and Facility
Bilfinger SEAnnual Report 2013
Growth strategy Building
Organic__ Moderate organic growth with objective of shifting the focus of
activities towards higher-margin specialized services
Acquisitional__ Smaller targets with high-margin specialties such as consulting,
planning, management and construction logistics
Growth strategy Facility Services
Organic__ Expansion of the portfolio offering in the area of energy efficiency __ Further development of international presence in Europe and – with
water technologies – in North America and Asia __ Further development of existing and acquisition of major new inter-
national clients
Acquisitional__ Further development of presence in Europe and – with water tech-
nologies – in North America and Asia __ Expansion of expertise in the area of attractive niche businesses
PerformanceThe Building and Facility segment successfully held its position in a challenging competitive environment. Output volume increased to €2,346 million, and the order backlog rose to €2,304 million. Organic growth in output volume amounted to 3 percent. Orders received were below the level of the previous year, which was characterized by the termination of a major service contract of several years in length. EBITA developed positively and increased by 15 percent to €116 million. This represents an increased EBITA margin of 4.9 percent. The number of employees grew to 22,069.
68 percent of output volume was generated in Germany. Important international markets in Europe, with a focus on Switzerland, Italy, Aus-tria and Eastern Europe, had a share of 19 percent, and North America had a slightly increased share of 9 percent.
Market trend
Building
Following good demand for German building construction in 2013, an ongoing dynamic development is to be expected for 2014. Above all, the new construction of apartments and investment in energy-saving alter-ations to real-estate properties will continue to ensure stable capacity utilization. Consulting services for all aspects of real estate as well as high-quality work such as building extensions, facade engineering and building equipment are meeting with growing interest in the market.
Facility Services
Demand for facility services is generally very stable across all our mar-kets. The trend is away from individual services provided locally and towards providing multinational clients with integrated services. Our services are increasingly measured against defined results and not in terms of individual activities.
Energy efficiency, sustainability and resource conservation are becoming increasingly important. In the field of energy management, we supply intelligent measurement and control systems. Through the holistic planning of technical building equipment, we create the right conditions for energy savings.
With increasingly tough price competition, success in the market depends on utilizing economies of scale and the availability of qualified personnel.
93

Bilfinger SEAnnual Report 2013Building and Facility
Management structure and areas of activityFrom financial year 2014, management of the operational Group units in the Building and Facility business segment will be carried out by divisions of Bilfinger SE with the following areas of activity:
Building__ Construction: turnkey projects and modernization __ Consulting, planning, management and construction logistics __ Trades: building technology, interior fittings and facade__ Lifecycle projects / one
Facility Services__ Commercial, technical and infrastructure facility management __ Office services and catering __ Services connected with the optimized operation of buildings
(especially energy efficiency and maintenance optimization) __ Integrated system solutions
Real Estate__ Commercial, technical and infrastructure real-estate management __ Asset and funds management __ Valuation of real-estate properties __ Real-estate consulting
Water Technologies__ Industrial and municipal water treatment plants __ Components for water treatment plants (e.g., filters) __ Vacuum canalization and wastewater systems __ Sewage sludge treatment and drying
Clients Public and private clients of all types, especially professional real-estate owners
Major competitors
Building
Hochtief, Max Bögl, Züblin
Facility Services
Carillion, Cofely, ISS, Johnson Controls, Strabag, Wisag
Important events in 2013
Building
BASF is also convinced of our ‘one’ product. For the chemicals company, we are developing, designing and constructing an office building with a separate parking garage in Ludwigshafen. The ‘one’ project is being carried out as a property-developer model through a project company. It is a good example of how various Bilfinger entities apply their expertise so that together they can find an optimal solution for a difficult task. Bilfinger Facility Management is responsible for the operational plan-ning, Bilfinger Bauperformance is contributing the building physics and structural design, the Building unit is designing and constructing the of-fice building and Bilfinger Parking is designing and building the parking garage. The interior fitting, facade engineering and building equipment will also be supplied by specialized Bilfinger units.
In the field of construction logistics, we see growth possibili-ties and good development opportunities in Europe outside Germany. Through the acquisition of CCL Consulting & Construction Logistics, based in Berlin, we significantly expanded our involvement in this area in 2013. CCL’s operations will be merged with our bauserve business in 2014. With an annual output volume of €40 million, the newly formed Bilfinger Construction Logistics will be Germany’s strongest company for construction logistics. The company designs, coordinates and man-ages all services in connection with the execution of construction work such as site surveillance and access control, occupational safety, mate-rial and machine leasing as well as facility and waste management for construction sites.
A good example of our successful positioning as a logistics special-ist is the roof refurbishment at Frankfurt Airport. The roof of Terminal 2 has to be refurbished from the apron during normal operations. Access to the roof is only possible at certain positions during short time slots. The roof surface will be opened from above section by section in order to renew the material as far as the profiled sheet metal. The roofers will work under the cover of tents, which are adapted to the various shapes of the roof, transported by hand, erected and moved on as required. Our specialists are responsible for the entire logistics services and have pre-pared the site. They move the material onto the roof by builder’s hoist or truck-mounted crane, and remove all waste material from there. On the enormous roof surfaces, materials are transported to wherever needed by specially adapted hand tractors. For that purpose, Bilfinger has laid tracks made of scaffolding covered with planks for walking on and us-ing the hand tractors. Due to these difficult circumstances, the logistics account for more than half of the total refurbishment costs.
The renovation of the Unter den Linden State Opera House in Berlin is also being managed by Bilfinger. It includes not only the historical Opera House, but also the management offices and rehearsal center. In
94

Management reportBuilding and Facility
Bilfinger SEAnnual Report 2013
compliance with the strict requirements for the protection of historical buildings, the complex will be adapted to modern needs. Raising the roof in the opera theater is to improve the resonances of the space and a tunnel will directly connect the rehearsal center with the opera building.
Technical building equipment is a key function for sustainable and energy-efficient buildings and is therefore a promising field for the fu-ture. In the year under review, Bilfinger strengthened its expertise in building equipment and energy consulting with the acquisition of the engineering firm Rostek & Stolz in Magdeburg.
Facility Services
With the acquisition of Europa Support Services at the end of 2013, we have moved up to the top group of facility services providers in the United Kingdom and Ireland. The company has a workforce of approxi-mately 3,300 people. It generates a large proportion of its output vol-ume of nearly €200 million per annum with its own qualified personnel and has long-term client relations with renowned companies. With this reinforcement in one of Europe’s most important facility services mar-kets, we are better positioned in the competition for major orders from internationally active clients.
We are steadily expanding our business with important large cli-ents. For the fourth time in succession, IBM has extended a contract covering the complete facility management and project management of more than 200 properties in 24 countries of Central and Eastern Europe and the Middle East. The contract runs for a period of four years. This extension is a reflection of the trend for contracting the management of entire real-estate portfolios. In addition to IBM for example, Bilfinger also manages major international real-estate portfolios of other pre-mium clients such as BASF, Deutsche Bank, Deutsche Post DHL, EADS, Kraft Foods and MAN.
As well as traditional FM services, consulting services are also in high demand, in particular for increasing the energy efficiency of build-ings. In this context, Bilfinger is also responsible for energy manage-ment for many clients, and advises companies on sustainable energy supply and environmental protection.
In the area of real estate, we have received a major order in Turkey. Our experts will take over the letting and center management for the planned large shopping center ‘Metropol Istanbul.’ Bilfinger will also coordinate the facility management for the 400-meter-long shopping mall with 350 retail units. We are also responsible for the fund and real-estate management of closed-end real-estate investment funds of the German company HCI Capital, with a total of 48 office and logis-tics properties in the Netherlands, Austria and Switzerland, and we are taking over the property management for the Dutch real-estate portfolio of an investment company with 127 office and retail properties.
Outlook Summarized details of the expected development of the Building and Facility business segment and of our other business segments are pro-vided in the Outlook section on pages 118 ff.
95

Construction Bilfinger SEAnnual Report 2013
96

Management reportConstruction
Bilfinger SEAnnual Report 2013
97

Bilfinger SEAnnual Report 2013Construction
CONSTRUCTION
WE SPECIALIZE IN PROVIDING DEMANDING ENGINEERING SERVICES IN THE AREAS OF MOBILITY AND ENERGY
–––––
WE ARE EXTENDING OUR VALUE CHAIN IN THE AREA OF OFFSHORE WIND BY SETTING UP OUR OWN PRODUCTION
–––––
WE ARE PREPARING FOR THE DEVELOPMENT OF THE EUROPEAN ELECTRICITY NETWORK
–––––
WE FOCUS ON EUROPEAN CORE MARKETS
98

Economic environmentThe European market for civil engineering was adversely affected in 2013 by the poor economic situation and by efforts to consolidate public finances.
The German market remained relatively stable as the economic situation was more favorable than in many other countries. The infra-structure acceleration program decided upon in the previous year with its additional investment in road building, railways and canals started to have a positive impact on the awarding of contracts.
In Poland, efforts to reduce the government deficit and decreas-ing inflows from the EU budget had a strong negative impact on the construction sector, resulting in a slump also for civil engineering. At the same time, there are indications of a revival in the coming years because the new EU financial framework that starts in 2014 will once again provide funding for infrastructure projects in the areas of energy, transport infrastructure, water management and environmental protec-tion. Numerous new invitations to tender already took place during the year under review.
In Scandinavia, the relatively good financial situation of public budgets compared with other European countries allowed stable invest-ment in ongoing infrastructure projects. Rising investment in transport infrastructure seems likely in the coming years. Outside the EU, Norway continued to invest substantial amounts in transport infrastructure and offshore installations.
In Austria, the government initiated an economic stimulus program due to the insolvency of a major construction company. However, there were no resulting positive effects for civil engineering in 2013. Only residential building provided any growth impetus for the construction industry.
Market position and strategic success factors Bilfinger has positioned itself as a specialist for intelligent civil-engi-neering services in the areas of mobility and energy. With our expertise in technology and project work and our knowledge of regional circum-stances, we are a sought-after partner for our clients. For public-sector clients, we primarily realize major transport infrastructure projects in Europe. For private-sector clients, we provide services mainly for indus-trial construction and for energy generation, distribution and storage.
As a result of the selective expansion of our service offering, our own research and development as well as cooperation with industrial partners and universities, we are extending our lead in the technologies we offer. We intend to participate in the development of the electric-ity network for the distribution of energy from alternative sources. In the spring of 2013, we acquired the FRB Group, which is active in the overhead power-line business and has headquarters in Luxembourg and Dinslaken. Bilfinger FRB specializes in the planning, layout and instal-lation of high- and extra-high-voltage power lines. To be able to offer
Management reportConstruction
Bilfinger SEAnnual Report 2013
so-called mixed power lines in the future, we are part of a research joint venture that is developing an innovative system for laying extra-high-voltage cables underground.
For the use of wind power, we are active in multiple projects. We are one of the leading companies laying foundations for wind parks in the North Sea and the Baltic Sea, with more than 550 foundations already completed or commissioned. All over Europe, our specialists produce, supply and install pre-stressing systems for the erection of masts consisting of segmented concrete elements for onshore wind parks with hub heights of up to 150 meters, so that they can withstand extreme storms. Together with a leading producer of wind turbines, we are developing a concept for the easy and economical dismantling of wind masts at the end of their useful lives. We are carrying out research to find technical solutions for optimizing the design of foundation ele-ments for offshore wind parks. Our new facility for the production of steel foundations for offshore wind turbines, which is being established in the port of Szczecin in cooperation with the Polish company Crist Dockyards, is scheduled to start production toward the end of 2014. Going beyond the actual execution of construction, we are able to apply our technical expertise and wealth of experience already in the plan-ning of challenging mobility projects. A good example of the application of our all-round planning and execution competence for a public-sector client in the context of a competitive dialog is the Kvarnholmsförbindel-sen bridge-building project in Sweden. A former industrial area on an island off the coast near Stockholm is being transformed into a new residential district. The proposal made by Bilfinger for a steel arch bridge has convinced the client in terms of design, technical details and cost. By means of an asymmetrically curved shape, it avoids expensive pile foundations in geologically difficult terrain while giving the new bridge a very elegant appearance. With this contract, we have further strengthened our good position in the attractive Scandinavian market for mobility projects.
We are among the technology leaders in many areas of civil en-gineering such as tunneling, port construction, offshore, pre-stressed engineering, steel construction and foundation engineering. In order to avoid country risks, we concentrate our activities on core markets in Europe. Outside Europe, we take on tasks only as a technology partner for locally experienced and reliable companies.
Our Polish subsidiary Bilfinger Infrastructure has oriented its activi-ties towards a broad client base and intends to significantly increase the proportion of projects carried out for private-sector clients. In the future, the company’s output volume is to be generated fairly equally by road construction, bridge building, river regulation and power-plant and industrial construction. We sold the German company for road construc-tion, Bilfinger Infrastructure GmbH in Bochum, to a strategic investor in 2013.
99

Bilfinger SEAnnual Report 2013Construction
Growth strategy
Organic __ Electricity generation (especially offshore foundations), electricity
networks (especially extra-high-voltage power lines) __ Expansion of business activities in the Scandinavian market
(especially in the area of transport infrastructure) __ Increasing the proportion of private-sector clients
Acquisitional __ Targeted investments to strengthen special technologies
PerformanceIn Construction, output volume, orders received and order backlog de-creased significantly. Our expectations in this business segment were not met. Output volume decreased by 26 percent to €1,038 million. Orders received decreased to €817 million. EBITA was a mere €1 mil-lion. We disposed of the loss-making road construction business in Germany at the end of the reporting year. Furthermore, we remained unable to reach an agreement on outstanding claims for completed road construction projects in Poland. The number of employees fell to 3,673.
The share of domestic volume amounted to 52 percent; European countries outside Germany accounted for 41 percent. Key markets in-cluded Scandinavia, Poland, Austria and the United Kingdom.
Market trend In our European markets for infrastructure projects in the mobility sec-tor, we are faced with different levels of demand: While investment in transport infrastructure remains flat in Germany and is declining in Poland, the further expansion and modernization of transport infra-structures with public-sector investment will continue for some years to come in the Scandinavian countries.
It will take a long time to implement the far-reaching changes to German infrastructure for electricity generation and distribution and energy storage triggered by the energy transformation. Also in the rest of Europe, demand is growing as a result of the expansion of wind energy, utility networks and storage technology, as well as through the conversion and modernization of power plants. In the coming years, this is expected to result in attractive construction projects in that sector in Germany and other European countries.
KEY FIGURES CONSTRUCTION€ million
2013 2012 ∆ in %
Output volume 1,038 1,404 -26
Orders received 817 1,099 -26
Order backlog 987 1,224 -19
Capital expenditure on P, P & E 32 29 +10
Depreciation 26 25 +4
EBITA / EBITA adjusted 1 25 -96
EBITA margin (%) 0.1 1.8
Employees (at December 31) 3,673 4,490 -18
CONSTRUCTION: OUTPUT VOLUME BY REGION
€ million
2013 2012 ∆ in %
Germany 543 645 -16
Rest of Europe 429 663 -35
Other regions 66 96 -31
1,038 1,404 -26
52 % Germany
7 % Other regions
41% Rest of Europe
100

Management reportConstruction
Bilfinger SEAnnual Report 2013
Management structure and areas of activityFrom financial year 2014, management of the operational Group units in the Construction business segment will be carried out by divisions of Bilfinger SE with the following areas of activity:
Construction__ Mobility: ports, locks / dams, tunnels, inner-city tram / underground
rail lines, noise barriers __ Energy: power plant construction (conventional and renewable),
foundations for offshore parks, networks__ Additional competencies: foundation engineering, pre-stressing
and geotechnical engineering, steel construction, structural main-tenance and formwork
Infrastructure__ Transport infrastructure including roads, bridges, tunnels__ Construction services for power plants and industrial facilities__ Other civil engineering structures
Services Demanding planning and engineering services in the areas of mobility and energy
Clients Public- and private-sector clients
Major competitors Balfour Beatty, Hochtief, Max Bögl, Porr, Skanska, Strabag / Züblin
Important events in 2013 In Berlin, we are carrying out two major construction projects to improve the city’s public transport system. On the one hand, the U 5 underground rail line from Brandenburger Tor to Rotes Rathaus is being extended by approximately 1.6 kilometers; on the other hand, the S 21 tram line is being extended from Hauptbahnhof to the northern tram ring. We are working on two important structures for the improvement of transport infrastructure also in our growth market, Norway: the Vågstrands Tun-nel and the Tresfjord Bridge. In the North Sea off the German coast, we successfully installed the foundations for all 80 of the Dan Tysk wind turbines in 2013. We also worked on a number of projects for industrial clients. For example, we were involved with our pre-stressed systems in the construction of sugar silos up to 60 meters in height for a client in the food and beverage industry. The Group’s internal networking was of particular use in a new construction project for a company in the chemicals industry. In Passau, Construction cooperated with Bilfinger VAM in the Power business segment to construct a production plant for basic chemical materials. By means of this cooperation, it was possible to master the complex interfaces between civil engineering and plant engineering and to minimize the project risks for the client.
For ambitious projects in the real-estate sector, our Foundation Engi-neering unit delivers turnkey excavations such as for the new Maintor office district in Frankfurt am Main, the Andreas district in Düsseldorf and the Kurpfalz-Galerie shopping center in Aachen.
OutlookSummarized details of the expected development of the Construction business segment and of our other business segments are provided in the Outlook section on pages 118 ff.
101

Discontinued operations: Concessions___
In the past financial year, Bilfinger sold the majority of its concessions activities as planned. From a total of 12 projects concerned, seven have already been transferred to the buyer. The transfer of the remaining five concession projects that have been sold is expected to follow in the first half of 2014 with proceeds of about €100 million and a capital gain of approximately €10 million. The majority of the divested projects will be taken over by the BBGI infrastructure fund, which is listed on the London Stock Exchange. In view of the decreasing strategic importance of the former business segment, the Group decided at the beginning of the year to sell the projects.
In addition, Bilfinger made the decision in December to also sell the shares in the German autobahn project A1. The project has been fully written off due to the development of traffic volumes which remain substantially below expectations.
The key figures of the activities sold and those for sale of the con-cessions business are presented under ‘discontinued operations’ in the annual financial statements 2013. Earnings from the activities of the former Concessions business segment amount to €4 million after taxes (previous year: €34 million). In the reporting year, capital gains from the sale of projects completed in 2013 in the total amount of €46 million were nearly offset by costs to sell and expenses for the winding up of the discontinued activities of €10 million as well as the devaluation of the investment in the A1 of €34 million.
The project-development activities have been discontinued and the asset-management units have been integrated in the Group by the Real Estate division as of January 1, 2014. We still have the M6 Duna and M6 Tolna highways in Hungary in our portfolio.
Bilfinger SEAnnual Report 2013Management report102
Sustainability___
Our top priority is to secure the viable future of Bilfinger. Our company policy is therefore geared toward being successful over the medium and long term. Such success can only come about, in our opinion, if our business activities also take noneconomic factors into account and are able to reconcile the needs of employees, customers, suppliers, share-holders and other social groups. As part of our commitment to sustain-ability, we want to make an active contribution to the conservation of resources, to the promotion and development of our employees and to improving social conditions on an ongoing basis. This commitment includes obligations within the scope of international initiatives such as the requirements of the UN Global Compact and adherence to national standards like the German Sustainability Code. We are also committed to a sustainable leadership philosophy through our member-ship in the Wittenberg Center for Global Ethics.
Since financial year 2011, we have been systematically publishing our objectives, strategies, activities and results in an annual Sustain-ability Report. The internationally recognized guidelines of the Global Reporting Initiative (GRI) form the basis of this reporting.
Ecology An important part of our business activities consists of help-ing our clients increase their energy efficiency and reducing their emis-sions. To this end, we draw up individual solutions based on cutting-edge technology. Our expertise focuses in particular on professional engineering and premium services for the extraction and application of biological, wind, thermal and hydro power as well as on the reduction of toxic emissions and the design, construction and operation of highly energy-efficient buildings.
We also gear our internal processes toward ecological benchmarks. All units of the company are certified in accordance with the environ-mental management standard ISO 14001 or take environmental goals into consideration in the framework of other management systems such as ISO 9001. The share of certifications in accordance with ISO 14001 increased significantly in recent years and was further expanded in 2013. Certification in accordance with ISO 50001 (Energy Management Systems) was also undertaken for individual Group companies.
We reduce the negative environmental impact of our commercial activities to the greatest extent possible. Using appropriate manage-ment systems, we constantly endeavor to optimize our utilization of materials, energy and water consumption as well as waste production in order to make an active contribution to the maintenance of biological diversity.
Employees Our employees are our most important resource. We de-velop their skills, motivate them and feel bound by the principles of
respect, fairness and loyalty in the way we treat each other. The health of our employees is a top priority and occupational safety is paramount. In order to further improve the safety culture at Bilfinger, we introduced a behavior-oriented safety program throughout the Group in the report-ing year.
The diversity of our workforce is an important factor for our success. We rely on a diverse range of experience, qualifications and perspec-tives from the people who work for us in countries around the world. Bilfinger has been offering solutions to improve compatibility between career and family for many years. Solutions include, in particular, flex-ible working time models as well as programs for the care of children and relatives with special needs. In order to secure our business suc-cess over the long term, we intensively train young talent.
Society We see ourselves as part of society. We therefore get involved as corporate citizens wherever our business activities are located. In particular, we support projects in the areas of education, culture and sport as well as social projects. The institutions supported by Bilfinger include endowed chairs, the Deutschlandstipendium from the German Ministry of Education and Research, the Knowledge Factory, the Ger-man Sport Aid Foundation, the Special Olympics as well as the National Theatre in Mannheim.
Products and services We are an increasingly important sustain-ability services provider for our customers. A major share of Bilfinger’s services are now provided for power plants, industrial facilities and real estate in the areas efficiency enhancement, lifecycle optimization, resource conservation, environmental technology and renewable energy. In recent years, we have completed our range of services in this area with the expansion of our expertise in electrical, instrumentation and control technology.
Bilfinger’s core competencies include increasing the energy efficiency of industrial plants, power stations and buildings. We thus achieve not only substantial cost savings for our customers, but also an increase in the efficiency level and a reduction of emissions that are en-vironmentally harmful. We support energy transformation and develop individual solutions for the production and utilization of bioenergy as well as wind, solar and hydropower. With our effective products and services for water treatments, wastewater purification, sludge treat-ment, waste treatment and sewage plant optimization we contribute to conserving water resources.
Further development of the sustainable product range is of utmost importance in the research and development activities of Bilfinger. We also aim to define ourselves according to the quality of our products and services and to set standards in this regard. We oblige our suppliers, subcontractors and service providers by means of a Code of Conduct to take into account the impact of their actions on people and the environ-
Management reportEconomic report
Bilfinger SEAnnual Report 2013
103

ment by adhering to standards such as the principles of the UN Global Compact. In addition, we mandate that they also impose these obliga-tions with their own suppliers, subcontractors and service providers.
Outlook Bilfinger’s range of services is particularly broad in the area of energy efficiency. For this reason, Bilfinger Efficiency GmbH was found-ed – a company that will go on the market in 2014. Bilfinger Efficiency combines the expertise of the Group in the area of energy efficiency and offers customers the relevant services from a single source.
We will continue our efforts to further improve our service range as a sustainability services provider and to improve our own sustainability performance. The strong networking of the Group which is being under-taken within the scope of our strategic development will create even better conditions in this regard.
Bilfinger’s Sustainability Report is available in the Internet at www.sustainability.bilfinger.com
Procurement___
Through the ongoing expansion of our purchasing network and the further standardization of purchasing functions in the operating com-panies, it was possible to realize substantial procurement potential in the reporting year.
The newly-revised Group guideline on procurement forms the basis for all procurement activities in the Group. Uniformly-defined purchas-ing processes are necessary to be able to select the best suppliers, subcontractors and service providers for Bilfinger. In addition to mon-etary aspects, criteria for selection include quality, adherence to sched-ules, risk / security, experience, environmental aspects and compliance questions.
We seek to concentrate our procurement volumes on key strategic suppliers. The ongoing evaluation of our partners’ performance in ac-cordance with internal Group criteria, allows us to recognize weakness-es in the service level of the supplier and, together with the supplier, improve the situation. The Group-wide, standardized supplier manage-ment system and the harmonization of procurement processes are a decisive success factor in our purchasing strategy.
Newly introduced functional reporting in purchasing for the entire purchasing organization in connection with clear targets and defined key performance indicators to review target achievement increases the transparency and effectiveness of purchasing in all Group units. The consistent data and information generated with the reporting allow us to further improve control of procurement processes in the Group.
For the purchase of subcontractor services, materials and services, we have available a broad basis of internal and external suppliers as well as a number of procurement markets. There is no general dependence on individual business partners.
Communication and marketing ___
A total of €17.3 million (2012: €18.0 million) was invested in com-prehensive communications measures in the reporting year. Of that amount, publications accounted for €2.6 million (2012: €2.6 million), fairs and exhibitions for €3.1 million (2012: €4.0 million), new media for €1.7 million (2012: €1.0 million) and other activities for €3.4 million (2012: €3.4 million). In addition, a total of €6.5 million was invested as a one-time marketing expense for the implementation of the new corporate design, global registration of the logo and the continuation of the image campaign.
Corporate identity / corporate branding One of our key communi-cation objectives is to strengthen and reposition our corporate brand, ‘Bilfinger.’ As an international engineering and services group with a wealth of expertise in the areas of industry, energy, real estate and infrastructure, we are unique worldwide. The stringent and uniform brand identity stands for our new self-image. Our corporate design with worldwide validity connects all the operating units closely with the Group brand. Apart from a few exceptions, all the operating compa-nies have ‘Bilfinger’ as an element of their company’s name and present themselves under a shared corporate brand.
Corporate design Bilfinger is characterized by features that seem to differ greatly: the inventiveness of its engineers and the service mental-ity of the staff in areas providing direct services, for example. We have combined this entrepreneurial self-image into a creative ‘leitmotiv’ of the brand: the complementary principle. All of the creative elements of our corporate design follow this principle and thus facilitate diversity,
2013 2012
Purchasing volume absolute (€ million) 3,537 3,840
Purchasing volume as a percentage of output volume (%) 42 45
thereof subcontractor services (%) 61 63
thereof materials purchased (%) 39 37
Management report Bilfinger SEAnnual Report 2013
104
fascination, orientation and harmony at all perception levels of com-munication – and base the profile of the Bilfinger brand on exactly that self-image.
A brand portal has been developed to accelerate the Group-wide implementation of the new corporate design. All of the new corporate design manuals can be found in this online application, from typo graphy to the use of color and images, to office equipment to print media, vehicle lettering, signs on buildings, clothing and digital media. The por-tal also offers numerous practical examples, advice on application and production recommendations. Corporate campaign The advertising campaign for rebranding, which started successfully in 2012 with a focus on decision makers and opin-ion leaders in the fields of business, politics and society, was supple-mented with three additional themes in 2013. Under the brand promise of ‘We make it work,’ advertisements demonstrate how Bilfinger makes a decisive contribution to helping customers focus on their core busi-ness. In 2013, the themes show the range of Bilfinger’s services in the areas of sustainability, servicing industrial equipment and manufactur-ing power-plant components.
Internet Bilfinger’s new brand identity is becoming more and more visible on the Internet. During the year 2013, 40 corporate websites were adapted to the new corporate design and relaunched. This is based on the web environment we implemented in 2012, which secures the uniform appearance of the Bilfinger websites and makes synergy effects possible. The web environment is available to all the companies of the Group and is currently home to more than 100 company websites from the entire Group.
Bilfinger was nominated for the German Prize for Online Commu-nication in 2013 in the categories of ‘Corporate Website’ and ‘Digital Annual Report,’ and was thus among the five best contenders. We integrated the online annual report into our corporate website for the first time in 2013.
On the social web, the platforms actively used by Bilfinger have continuously rising user numbers. The biggest attractions are the You-Tube channel ‘BilfingerTV’ (www.youtube.com/bilfingertv) and the cor-porate profile on the LinkedIn network site (http://www.linkedin.com/company/bilfinger).
Bilfinger Magazine We regularly use the Group’s customer magazine not only to maintain dialog with our clients, but also to acquire business and to recruit personnel. The print edition of Bilfinger Magazine appears twice annually with a circulation of about 30,000 copies and is sup-plemented by an online edition. In the biggest European competition for corporate communication (BCP), the magazine was awarded prizes in
the categories of Industry / Technology and Green Publishing. Bilfinger Magazine is printed on recycling paper and the production process is optimized in terms of sustainability.
Sustainability report Bilfinger publishes an annual sustainability re-port, which systematically presents the Group’s goals, strategies, activi-ties and results in this area. Our sustainability reporting is based on the internationally recognized guidelines of the Global Reporting Initiative (GRI). The report is available exclusively online and was given more depth and reach in 2013.
Press In order to provide the public with relevant information about Bilfinger in a timely manner, we maintain close contacts with the busi-ness editors of news agencies, daily and weekly newspapers, maga-zines and online publications. With our quarterly and annual reports, press releases, conference calls and press conferences, we provide regular and comprehensive information on the Bilfinger Group’s busi-ness situation.
One focus of our press work last year was on in-depth communi-cation about Bilfinger’s repositioning. Our own stand at the Hannover Industrial Trade Fair was a new platform to inform journalists about the Group’s range of services with press events and individual discussions with members of the Executive Board.
Information for employees In 2013, Bilfinger started a process to develop a new mission statement for the Group. Our employees were actively involved in the project right from the start. In more than 100 workshops all over the world, they discussed Bilfinger’s values and goals. On the basis of this employee feedback, the new mission state-ment will be completed in 2014 and introduced throughout the Group.
The employee magazine Bilfinger World appears twice a year in the languages German, English and Polish with a circulation of 60,000 copies, and is distributed to the employees of all entities of the Group worldwide. With this magazine, Bilfinger aims to encourage networking and team spirit at the Group, and to give the employees an overview of strategic objectives and the variety of services provided by the Group.
Employees are kept up to date on what is happening at the Group on a daily basis via the intranet. Thousands of employees make use of this vast resource every day. Within the scope of repositioning the company, a new intranet portal has been introduced which offers infor-mation and news from the entire Group. The dialog with the workforce is also promoted with online transmissions, so-called live streams, in which employees can directly submit questions to the Executive Board. The Group’s senior executives are informed about important new devel-opments with a newsletter and in conference calls.
Management reportEconomic report
Bilfinger SEAnnual Report 2013
105

Direct dialog with clients From April 8 to 12, 2013, Bilfinger pre-sented itself for the first time at the Hannover Trade Fair. In Hall 11 of the world’s biggest industrial trade fair, the Group showed its complete range of engineering and other services for the sectors of industry, energy, real estate and infrastructure on a newly designed stand with floor space of 500 square meters. Under the brand promise of ‘We make it work,’ visitors to the trade fair were able to gain an impression of how Bilfinger looks after industrial equipment, power plants, buildings and infrastructure projects over their entire lifecycles. The exhibits in-cluded a virtual 3D model of an industrial plant that had been specially developed for the Hannover Trade Fair, a micro gas turbine that had just been launched on the market, an interactive media system to explain the real-estate product ‘one,’ and a model of the DanTysk wind park, for whose foundations Bilfinger is responsible. The trade-fair stand and the related series of lectures met with a very positive response from clients and the media.
Focal points of our client dialog philosophy were once again na-tional and international trade fairs, congresses and conferences. There we presented the strengths and capabilities of our operating units.
Human resources___
Principles of our human resources work Our company’s success is our employees’ success. We develop their skills, motivate them and feel bound by the principles of respect, fairness and loyalty in the way we treat each other.
Bilfinger is an attractive employer. Surveys and rankings attest to the above-average image ratings we enjoy among students and em-ployees. We want to improve even further in order to ensure we are successful in the competition for the best talent that has arisen as a result of demographic developments.
Occupational safety The health of our employees is the number one priority for Bilfinger. ‘Zero harm’ is the objective of our measures initi-ated to increase occupational safety.
Our HSEQ department is responsible for health, safety, environment and quality. It develops the HSEQ management system, monitors its compliance within the Group, implements and monitors the HSEQ sys-tems in the operating units, and conducts a range of training courses. The department defines the HSEQ reporting system and summarizes reports from the Group units in quarterly reports to the Executive Board. The Executive Board is immediately informed of any serious accidents at work.
NUMBER OF EMPLOYEES BY BUSINESS SEGMENT
2013 2012 ∆ in %
Industrial 37,945 37,056 2
Power 10,028 9,278 8
Building and Facility 22,069 15,292 44
Construction 3,673 4,490 -18
Headquarters & other units 561 567 -1
74,276 66,683 11
51% Industrial
5 % Construction
30 % Building and Facility
13 % Power
1% Headquarters & other units
NUMBER OF EMPLOYEES BY REGION
2013 2012 ∆ in %
Germany 26,751 24,046 11
Rest of Europe 34,167 30,341 13
North America 3,820 3,703 3
South America 174 0
Africa 2,250 2,086 8
Asia 6,966 6,507 7
Australia 148 0
74,276 66,683 11
36 % Germany
3 % Africa
5 % North America
< 1% South America
46 % Rest of Europe
9 % Asia < 1% Australia
Management report Bilfinger SEAnnual Report 2013
106

Responsibility for compliance with our occupational safety standards lies with the operating units which take into account the working condi-tions that are specific to their respective businesses. A Group occu-pational safety officer and a network of occupational safety officers in the operating units support the operating units in complying with and fine tuning the rules.
Accidents can only be prevented if employees are repeatedly made aware of the importance of occupational safety. In order to further strengthen the safety culture at Bilfinger, we launched the SAFETY-WORKS! program during the reporting year. The program lays out a me-thodical approach for continuous optimization for the individual units in our decentralized and diverse Group. On the basis of a self-evaluation, ob-jectives are defined and measures implemented, the success of which is, in turn, evaluated. A comparison of the Group units results in best practice examples and corresponding control possibilities.
The effectiveness of our systems for occupational safety in the operating units is verified by certifications in accordance with the standards OHSAS 18001 and SCC which cover 60 percent of all the Group’s workplaces. We conduct audits on all levels through internal and external agencies in order to continually analyze and improve our occupational safety measures.
Health promotion We are continuing to implement the concept for the promotion of health and performance among our employees which was introduced in 2012. The fields of activity include sports and exer-cise, physical and mental health and workplace conditions. Through a framework agreement with a national fitness provider, our employees have the opportunity to visit fitness studios throughout Germany and Austria at reasonable conditions. We promote the sporting activities of our workforce in a number of disciplines. These include running, foot-ball, basketball, cycling, skiing, squash, inline skating and yoga. We send large teams to corporate running events held at the Hockenheim-ring, in Frankfurt and in other cities as well as to bike races and dragon boat races. 38 teams from numerous countries took part in the Bilfinger Hochbau Football Cup, the Group’s largest internal sporting event which
was held for the first time in the impressive atmosphere of Frankfurt’s Commerzbank Arena.
We offer special seminars for dealing with stress and for sustain-ably maintaining performance. We look closely at whether our work-places are a burden on the health of employees or whether they may even endanger their health. If necessary, technical or organizational measures are taken to deal with such risks.
Health Days in various units offered employees the opportunity to find out about healthy lifestyles. These events will take place on a regular basis in the future in order to more intensively promote health awareness.
Equal opportunity At Bilfinger, employees around the world are offered equal opportunities.
There can be no discrimination based on ethnicity, gender, sexual orientation, religion, ideology, disability or age.
Increasing the share of women in our workforce which, at the end of the reporting year was at 19 percent, is one of our most important ob-jectives. The measures we apply to promote female employees include specific training opportunities and cross-mentoring programs. The share of female employees in management positions was 7 percent at the end of the year. In order to increase this figure, we have been executing our own program since 2011. Our objective is to fill approximately 15 to 20 percent of management positions at Bilfinger with women by 2020. To achieve this objective, we will be relying on the targeted promo-tion of young talent: of the university graduates newly hired in Germany in 2013 with economics or engineering degrees, 52 and 23 percent, respectively, were female.
We are active as an exhibitor at special career fairs, in the context of which especially women with professional experience can establish contact with potential employers. Through an internal women’s network in the company which was founded in 2012, female employees can bring themselves up to date on career topics and exchange experiences with other participants.
NUMBER OF EMPLOYEES BY GENDER Total Male Female Total Male Female
2013 2012
Industrial 37,945 34,486 3,459 37,056 33,708 3,348
Power 10,028 8,974 1,054 9,278 8,398 880
Building and Facility 22,069 13,208 8,861 15,292 9,593 5,699
Construction 3,673 3,106 567 4,490 3,839 651
Headquarters & other units 561 334 227 567 352 215
74,276 60,108 14,168 66,683 55,890 10,793
Management reportEconomic report
Bilfinger SEAnnual Report 2013
107

Professional and private life It is our goal to adapt the workplace to the individual situation of the employee. This is often possible with part-time contracts, the details of which are worked out individually between the employee and his or her supervisor. Together with the operating units, headquarters developed models for flexible working hours and home-office arrangements that are implemented in the indi-vidual companies in line with both local and individual situations.
The offers that allow for greater compatibility of career and private life and a corresponding improvement of the work-life balance include childcare options and care for family members with special needs. A model for such measures was tested in Mannheim and expanded to all locations in Germany. Employees can contact a family service agency. Bilfinger covers the costs of the consulting and agency services as well as certain care-related costs.
Recruiting The objective of our intensive university marketing program is to identify highly qualified graduates and arouse their interest in working for Bilfinger. Within the scope of the ‘Deutschlandstipendium’ scholarship program, we currently support 90 scholarship recipients at 19 universities. We award the ‘Bilfinger Prize’ at five universities. The contacts gained within the scope of this program often lead to intern-ships and academic papers that are accompanied by our employees.
We will further intensify and internationalize our diverse activities at selected universities in order to meet the future need for highly-qual-ified specialists around the world.
In the course of our new market presence, all Group units appear with a standardized employer branding in the jobs market. The graphic concept for this presence has also been adapted with the reposition-ing of the Group. The main contact points are the career pages on our website which also has a very clearly arranged jobs pool. In a ranking of the most popular employers for engineers (trendence Institute), our company achieved a very strong 9th place and thus moved up an im-pressive 10 places in just one year. This confirms the positive perception of Bilfinger as an employer.
Bilfinger Academy – training and personnel development For Bilfinger, professional training is an investment in the future of each individual employee and the entire Group. The program offered by the Bilfinger Academy was further expanded in 2013 to ensure the great-est possible level of support to employees. All business areas bring together their seminars, e-learnings and development offers under a joint virtual umbrella. This gives employees and managers a complete overview of all training events. One focus in 2013 was on the Group-wide implementation of binding e-learning programs. More than 30,000 e-learnings were completed at all Bilfinger location on topics such as compliance and working capital management. Just as successful was
E-RECRUITING (GERMAN-SPEAKING COUNTRIES)
2013 2012 ∆ in %
Industrial 290 174 +67
Power 34 73 -53
Building and Facility 1,175 949 +24
Construction 62 73 -15
Headquarters & other units 36 89 -60
1,597 1,358 +18
TOP TEN SKILLED OCCUPATIONS AND DUAL STUDY PROGRAMS IN GERMANY(APPRENTICESHIPS / NUMBER OF APPRENTICES)
Plant mechanic 176
Industrial clerk 101
Electricians 78
Commercial BA degree 57
Industrial mechanic 50
Construction mechanic 49
Technical draftsman / woman 45
Mechatronic technician 43
Industrial insulator 42
Technical BA degree 36
GROUP APPRENTICES BY BUSINESS SEGMENT
2013 2012 ∆ in %
Industrial 745 778 -4
Power 411 318 +29
Building and Facility 440 400 +10
Construction 51 57 -11
Headquarters & other units 8 8 0
1,655 1,561 +6
Management report Bilfinger SEAnnual Report 2013
108

Management reportEvents after the balance sheet date
ACQUISITIONS: NUMBER OF EMPLOYEES
2013
Europa Support Services Ltd. 3,265
Johnson Screens Inc. Group 1,081
Mauell GmbH Group 460
GreyLogix GmbH Group 365
ELWO S.A. 202
CCL Consulting & Construction Logistics GmbH 98
FRB GmbH Group 73
SPM Projektmanagement GmbH 64
Rostek & Stolz Ingenieurgesellschaft mbH 27
ESG Energy Service Group AG 19
5,654
the establishment of cross-functional networks. There, experts are working on comprehensive projects on topics of relevance to the busi-ness such as welding and engineering.
Annual staff appraisals ensure that management and staff select the right measures from the broad range of offerings from the Bilfinger Academy in dialog with one another and on the basis of need. These appraisals were carried out on the basis of a uniform system for the first time in 2013 – initially for employees in Germany.
Employee share program The employee share program which was started in the previous year was continued in 2013. Participating em-ployees could apply their bonus in the amount of €300 toward the purchase of a share package with five shares. The difference between the amount of the bonus and the price of the share package of €44.80 was covered by the company. In total, employees purchased more than 17,000 shares as part of this campaign.
Currently, 18.2 percent of the 25,000 employees who are entitled to participate in the program hold employee shares. While the rate of participation among management employees declined slightly, partici-pation among all other employees rose. As in the previous year, about 80 percent of the participants had their voting rights at the company’s Annual General Meeting 2013 executed by the association of employee shareholders.
Bonus payment for employees in Germany Once again, more than 18,000 employees in Germany received a bonus payment of €300 gross in June 2013 as thanks for their efforts and commitment.
Our business has developed according to plan in the current financial year. No events have occurred that are of particular significance for the Group’s results of operations, net assets and financial position; our business and economic environment has not changed significantly. In our interim report, which we will publish on May 8, 2014, we will provide a detailed overview of the first quarter of the year.
Events after the balance sheet date
Bilfinger SEAnnual Report 2013
109

Opportunities and risks In the course of its business activities, Bilfinger creates opportunities and takes risks; both must be thoroughly weighed and considered. Business success depends on the principle that the risks taken are managed and that they are outweighed by opportunities.
We have restructured our organization and, with effect from the end of the reporting year, disposed of our Subgroup structure. From 2014, 14 divisions within Bilfinger SE will assume management responsibility for the operating business. Their tasks as described below were the responsibilities of the former Subgroups until the end of 2013.
Our corporate strategy focuses on identifying the opportunities that present themselves at an early stage, evaluating them by applying our risk management system and taking advantage of them through suit-able measures for the continued successful development of Bilfinger.
As part of strategic corporate planning approved by the Executive Board for a period of five years from 2011, the divisions regularly submit a detailed three-year plan. The resulting cumulative overview for the Group is dealt with on an ongoing basis by the Executive Board. To achieve a greater level of detail, the Executive Board conducts full-day workshops with the divisional management at which the analyses and planning of the divisions are discussed, also with a view to their clas-sification in Group planning. This treatment takes all factors that are relevant for the Group’s opportunity management into consideration, including markets, competitive situation, strategic positioning, analysis of strengths and weaknesses, own organization, investments, human resources as well as volume and earnings development. It serves as a basis for strategic decisions intended to take advantage of the Group’s opportunity potential.
Opportunity and risk report
Through the management of risks and opportunities, we protect and expand our potential___
The Group’s collective opportunity and risk management function is exercised by the Executive Board and headquarters and monitored by the Supervisory Board___
Within the scope of the Group-wide risk management system, the divisions and subsidiaries make use of instruments that are aligned with their operating business___
Group Project Controlling accompanies large volume orders or orders with particular risks from the bid phase through to completion___
The internal control and risk management system as relates to the accounting process ensures that the business situation is properly reflected in the financial statements
Management report Bilfinger SEAnnual Report 2013
110
Management reportOpportunity and risk report
The recognition and realization of opportunities is an integral part of the process management system at our operational units. We define opportunities as favorable deviations from planned framework condi-tions. Their opposite, negative deviations from planned framework con-ditions, constitutes risk. Opportunities and risks are therefore treated in the same step of the process. It is only following the analysis of a deviation from normal conditions that a classification as opportunity or risk can be undertaken.
Accordingly, an opportunity / risk index is prepared in the bid phase of a project in which positive or negative deviations from normal, generally expected conditions are listed. In the determination of costs, the calculation initially assumes planned conditions. Only subsequently are the positive or negative particularities that are listed in the risk and opportunity index analyzed, evaluated and decisively taken into account in the final decision on the bid and its formulation.
Following the placing of the order, the project management re-sponsible for the execution of the project uses the risk and opportunity index as an important information and control instrument. The index is updated and re-evaluated on an ongoing basis and serves as a key component of project meetings.
Opportunities for Bilfinger
Group We want to secure the economic success of our company by growing in defined industries through acquisitions. In this context we will consistently apply the funds available to strategically complement the portfolio and to create a stronger platform for organic growth. One focus is the strengthening of our engineering competence and the re-sulting increase in vertical integration.
We have also made it our goal to accelerate the organic growth of our existing units. Increased cooperation among our Group units is particularly promising in this regard. As part of our BEST (Bilfinger Escalates Strength) strategic program, we have created a series of instruments which will help our units put together comprehensive ser-vice packages and offer them to the market.
With the program to increase efficiency (Bilfinger Excellence), we will fundamentally optimize structures and processes in the sales and administrative areas and secure our competitiveness over the long term. For this purpose, we have disposed of the former Subgroup structure with effect from the end of 2013. Since that time, operational manage-ment has been the responsibility of 14 divisions within Bilfinger SE. The measures we have introduced enhance the operational responsibility of our decentralized units and strengthen our focus on the customer. These measures foster internal cooperation and the joint management of cus-tomer relationships. Bilfinger Excellence creates transparent structures, clear lines of responsibility and a competitive cost structure.
Opportunities will also arise from the improvement of our business con-ditions: the business environment in important industrial countries has improved, Germany is experiencing strong growth in consumption and investment and in the rest of Europe there are also initial indications that the recession is ending. With an even stronger focus on our ser-vice range achieved through the sale of our concessions business and the German road construction unit, we believe we are well-equipped to participate in the anticipated upswing.
Bilfinger is well-positioned in the sustainability and energy effi-ciency areas. The global trend toward an ever-greater use of renewable energies and toward efficient energy production also from conventional sources and improved utilization of energy offer us good prospects in all segments. The improvement of energy efficiency, for example, is not only a task for energy production, but also for the process industry and the real-estate sector.
There are differing specific framework conditions present in our business segments that enable us to take advantage of organic and acquisitional growth.
Industrial In the Industrial business segment, the focus of our activi-ties related to the execution of inspections for major production facili-ties has to date been in Central and Northern Europe. We see interest-ing potential to expand this business in other European countries and in Asia. This also applies to the expansion of activities related to repair and maintenance work for offshore oil and gas platforms. Especially with large international clients, we see demand for outsourcing meas-ures in which we also maintain the industrial facilities and take over the customer’s existing service personnel.
There are opportunities for acquisitional growth from portfolio ex-pansion in existing markets and from opening up growing international markets. To this end, market potential is regularly evaluated and con-sistently integrated into the growth strategy. One example is the United States where the share of national gas production from the mining of shale gas reserves is expected to increase from the current 23 percent to about 50 percent of total consumption by 2035. This requires a sig-nificant expansion of the pipeline network. It is also expected that the chemical industry will increase its capacities as a result of decreasing oil and gas prices. This development offers promising development op-portunities in the Industrial business segment.
In our estimation, another driver of growth will be the application of our competence in electrical, measurement and control technology as well as in engineering. In the course of the expansion of renewable energies, the intelligent networking of decentralized energy sources is extremely important. We see particular opportunities in competition from our strong position in engineering.
Bilfinger SEAnnual Report 2013
111

Power In the Power business segment, we have a sound technological foundation for taking advantage of future opportunities. Our strengths include a significant vertical integration in energy technology, our posi-tion as market leader in high-pressure piping systems, a unique range of competences in nuclear and environmental technology as well as com-prehensive expertise and our own manufacturing capacities in heavy steel construction. With the addition to our portfolio of services in the area of turbine services, we are in a position to provide our clients with maintenance services for their entire power plant from a single source. Strong market penetration in Europe – especially in DACH and Eastern European countries – and a long-standing presence in South Africa and the Middle East form a solid foundation for the further development of our business in power plant service. With regard to the decision to shut down nuclear power plants in Germany, we are preparing to participate in the necessary dismantling of reactors.
We see promising opportunities in our international markets. There is substantial demand in many countries for the modernization of aged facilities, especially for coal-fired power plants. For gas-fired power plants, opportunities are presented in the conversion of open cycle power plants (OCPP) to combined cycle power plants (CCPP). For regions such as the Middle East, the modernization and expansion of thermal seawater desalination plants are of fundamental importance. In North America, the dynamic energy sector offers substantial development opportunities also for our Power business segment.
On this basis, we seek to develop new growth opportunities in selected markets such as Europe, the Middle East, Asia or the USA.
Building and Facility In the Facility business segment, we have a leading market position in Germany and offer our clients a complete range of real-estate related services. With our product ‘one,’ we of-fer real-estate investors far-reaching security by guaranteeing not only the design and construction costs, but also future energy consumption and other operating expenses. This offering is generating an increasing amount of interest.
In the building construction business in Germany we see opportuni-ties primarily in the provision of high-margin special services such as consulting, construction logistics and the management of construction projects. We intend to continue our moderate growth in these areas.
At Facility Services, there are particular opportunities in the expan-sion of business activities with key accounts, greater use of our compre-hensive competences in the field of consulting and from an expansion of our activities in energy management for buildings. In asset and prop-erty management, an expansion of the service portfolio to high-margin broker services can generate impetus for growth.
We intend to use our strong position in Germany to take advantage of additional opportunities in selected European countries as well as in North America and Asia. We seek organic growth and are planning further acquisitions. We want to strengthen our position as a leading European service provider through the intensification of our activities for asset, property and facility management services in the important UK market. We thus also increase our potential to assume responsibility for transnational services at major international customers. The Water Technologies division, which includes the activities of Johnson Screens – acquired in the reporting year – and the resources that were already in place in the Group, has a strong international position in the future market water.
Construction In the Construction business segment there are oppor-tunities in the restructuring of our civil engineering units into special-ists for intelligent construction services in mobility and energy. We see further potential in the Scandinavian countries which continue to invest heavily in the expansion of their transportation infrastructure. We are market and technology leader in the construction of foundations for offshore wind turbines in the North Sea and Baltic Sea. This position provides us with the opportunity to expand our construction activities in connection with the use of regenerative energies. To this end, we will apply our strong competence in the offshore field as well as in tunnel construction and foundation engineering. With the addition of utility line construction to our portfolio, we want to participate in the expansion of the electricity network for the distribution of alternative energies. Other attractive areas of activity in the Construction business segment can include cable laying and execution of construction-related services.
In construction logistics, we see additional growth opportunities and good development possibilities in European markets outside Ger-many. As a key function for energy-efficient real estate, technical build-ing equipment also represents a promising area of activity.
Risk management system
The task of the risk management system is to ensure that risks are con-trolled. For the timely identification, evaluation and responsible han-dling of risks, effective recording, management, control and audit sys-tems must be in place which together form Bilfinger’s risk management system. The elements of our risk management system are strategic business planning combined with a detailed and up-to-date reporting system that serves as an internal early-warning and monitoring system. Our risk management system has been designed with the strong inter-national focus of Bilfinger’s business activities, the special features of the individual project business and the service business in mind.
Management report Bilfinger SEAnnual Report 2013
112

Management reportOpportunity and risk report
The risk management function comprises the following components in particular:
__ General principles of risk awareness and fostering individual risk-conscious behavior
__ Specification and control of key performance indicators (EBITA, return on capital employed, liquidity, etc.)
__ Collective controlling by corporate departments (Group Controlling, Procurement, Treasury, Project Controlling, Internal Auditing, Legal, Compliance, HSEQ)
__ Particular risk review and monitoring for major projects and large service orders
__ Internal control and risk management system as relates to the ac-counting process
Risk management at Bilfinger is a continuous and decentralized pro-cess, which is monitored and controlled from headquarters. Accord-ingly, the divisions and subsidiaries, within the scope of the overall sys-tem, use instruments of risk management that are customized to their respective businesses. The Group’s collective risk management function is exercised by the Executive Board and headquarters and monitored by the Supervisory Board. Effectively avoiding risks requires more than just good instruments and procedures. A highly-developed risk awareness among employees is also indispensable and is a factor that we promote through training sessions and other measures. Group-wide, general principles of risk awareness apply to management and staff at all lev-els. On this basis our operating units have developed concrete guide-lines for dealing with the risks inherent in their particular business.
Each year, the Group sets new targets for all of its subsidiaries in terms of the key performance indicators EBITA and return on capital employed, as well as liquidity targets and limits. These and other key figures are monitored with the use of monthly reporting. The actual situ-ation and the targets set are analyzed at all levels. With the use of mar-ginal values and deviation parameters, relevant risks are identified and monitored, and their effects are limited by taking suitable measures. This provides the Executive Board and other members of the manage-ment team with detailed information on the current financial situation. In consultation with the Executive Board, the corporate functions per-form a specialist monitoring function throughout the Group. They have wide-ranging obligations to request and receive information, to issue individually defined guidelines, and to be actively involved with their specialist colleagues at the divisions and subsidiaries.
Headquarters are also responsible for controlling tasks of over-riding importance. The corporate departments of Group Controlling,
Procurement, Group Treasury, Project Controlling, Internal Auditing, Legal, Compliance and HSEQ (Health, Safety, Environment and Quality) report regularly and comprehensively to the Executive Board on possible risks from their respective specialist perspectives. In addition, the Exec-utive Board submits a quarterly risk report to the Audit Committee and the plenum of the Supervisory Board. The Committee is informed on a semi-annual basis by the heads of Project Controlling and Internal Audit on the results of the reviews carried out by their corporate departments.
Orders with large volumes or special risks can only be accepted if they are expressly approved by the Executive Board. Above a speci-fied volume, approval of the Supervisory Board is also required. Projects with greater risks are reviewed more intensively by the Executive Board prior to a bid being submitted and continue to be closely monitored when an order has been received. Risks, particularly those related to major projects, are counteracted by clearly structuring the distribution of tasks within the corporate departments:
__ Group Project Controlling supports these projects from the bidding phase until completion. The technical, financial and timeline-relat-ed development of each project – irrespective of the responsible operating unit – is analyzed continually and critically.
__ Decisions on financing, internal credit lines and guarantees are made at headquarters by the Executive Board with significant sup-port from Group Treasury.
__ Internal Auditing, both on a scheduled and risk-oriented basis as well as ad hoc and incident-related, examines the design and effectiveness of work procedures and processes and internal controls at the levels of the operating units, the business processes and the projects.
__ Group Controlling is responsible for the monthly recording of all performance measures as well as for the active controlling of the subsidiaries.
__ With its supplier management system, Group Procurement supports the evaluation and selection of subcontractors, materials suppliers and external service providers.
__ The Legal department reviews contractual risks and takes the lead with any legal disputes.
__ The HSEQ department carries out audits in order to analyze risks in connection with health, safety, environment and quality and to review the methods used to control them.
__ Compliance subjects each joint venture and each joint venture partner to an integrity review and obligates them to adhere to the Bilfinger compliance standards.
Bilfinger SEAnnual Report 2013
113

Bilfinger has a modern and efficient compliance system which has been consistently expanded in recent years and which is improved on an ongoing basis. A clear set of rules is in place for the entire Group in order to avoid illegal behavior. The contents are conveyed to employees around the world through on-site training, webinars and e-learning pro-grams. Our Compliance Team is integrated into the operating business, works closely with the Group’s Executive Board, the management of our affiliates and with executives; it reviews cases in which compliance is doubtful and assists employees in adhering to internal requirements. The Chief Compliance Officer reports directly to the Chairman of the Executive Board. IT tools are used to support the implementation of the rules, for example the integrity review for subcontractors, suppliers and consultants. Via a communications platform, employees worldwide can ask questions through telephone or intranet. These questions will then be answered by the compliance team. The system can also be used to report compliance incidents (anonymously, if desired).
The Corporate Organization department provides uniform Group-wide standards for the elements of company controlling and continu-ously develops the Bilfinger governance system.
Our controlling and monitoring instruments are combined into a comprehensive risk management system that is subject to continuous development. All of the processes and approval procedures that are stipulated by law, the Executive Board or the corporate functions are documented in guidelines, work procedures, manuals and instructions. Via the intranet, employees throughout the Group have quick access to the content of the risk management system. The functionality and effectiveness of key elements of this system, including the operational, non-accounting related internal controlling system and the internal risk system are reviewed by the Audit Committee of the Supervisory Board and the external auditors. Any recommendations on the optimization of the risk management system resulting from these reviews are imple-mented immediately.
Internal control and risk management system as relates
to the accounting process
The internal control system as relates to the accounting process con-sists of principles, procedures and measures to secure the effective-ness, efficiency and accuracy of the company’s accounting as well as the observance of applicable legal requirements. This also includes the internal auditing system insofar as it relates to accounting.
Under consideration of standards that are usual for the industry as well as applicable legal requirements, Bilfinger has established an internal control and risk management system for Group accounting pro-cesses in order to recognize potential risks and minimize them. This system is being continuously developed.
This internal control and risk management system ensures that en-trepreneurial substance is accurately recorded, processed and recog-
nized in the balance sheet and implemented in the accounting system. Appropriate staffing and equipment, the use of adequate software as well as clear legal and internal company requirements form the basis of an orderly, standardized and consistent accounting process. The clear division of areas of responsibility as well as various control and moni-toring mechanisms (especially plausibility controls, the dual control principle and audit treatments from Internal Auditing), ensure proper accounting. In this way, it is ensured that the accounting process is carried out uniformly and in line with legal requirements, the princi-ples of proper book-keeping, international financial reporting standards and internal Group guidelines. Furthermore, it is ensured that business transactions throughout the Group are recorded and evaluated uniform-ly and within the scope of accounting publications and that, as a result, accurate and reliable information is made available.
The internal control and risk management system established at Bilfinger with regard to the Group accounting process consists of the following significant features:
__ The IT systems used in the accounting areas are protected from unauthorized access through appropriate security measures.
__ Standardized accounting is guaranteed through Group-wide guide-lines.
__ Accounting data is randomly reviewed on a regular basis for com-pleteness and accuracy. Programmed plausibility audits are carried out by software that is designed for that purpose.
__ Appropriate controls have been implemented for all accounting-relevant processes (including the dual control principle, functional separation and analytical audits). They are also reviewed regularly by Internal Auditing.
__ On the basis of the reports received from the auditor and from Inter-nal Auditing, the Supervisory Board, through its Audit Committee, reviews the functionality of the internal control and risk manage-ment system as relates to the accounting process.
Risks related to our business environment
Markets The Bilfinger Group depends on the general economic situ-ation and the development of those markets in which the company is active. Due to the international nature of our business activities, we are also exposed to political and other risks. There is a tremendous amount of competition in our markets. Changes in legal requirements, in terms of tax laws for example, could burden our earnings. To manage these risks, we regularly analyze how countries’ economies are developing and whether our business segments are competitive. We are actively involved in advisory committees and panels to ensure that the economic effects of new legislation, ordinances and regulations are avoided in good time.
Management report Bilfinger SEAnnual Report 2013
114

Countries Country risks include uncertainties arising from political developments in our markets. In order to minimize such risks, we oper-ate only in certain specified markets. We see no country risks that are relevant to the Group’s earnings.
Environment Through our production processes at production facili-ties and at construction sites as well as in transport, contamination of air and water is possible. We counter such risks through preventative measures in the selection of materials and products, the course of the processes and work instructions as well as through relevant controls. We are insured against any environmental damage that may occur despite these precautions.
Risks related to our business model
Subsidiaries We carry out business operations through a large num-ber of subsidiaries and affiliates. All the companies of the Group are subject to the regular financial controlling of subsidiaries and associ-ated companies. This is carried out from headquarters as directed by the Executive Board and is outside the reporting hierarchy. By per-manently monitoring business developments, especially by means of local reviews, subsidiary controlling creates a complete picture and an independent opinion of the companies’ financial situations.
The subsidiary controllers report to the Executive Board once a month and inform it of any unusual developments without delay. In addition, there is a financial controlling department in each division that reports to the respective management and is subject to the functional supervision of Group Controlling. The Supervisory Board ensures that it is also informed in detail on the development of newly acquired Group companies.
Acquisitions We counteract risks relating to acquisitions with the following concept: We generally acquire either a controlling interest or 100 percent ownership of suitable companies. Companies that we regard as candidates for acquisition are valued by our experts with the help of comprehensive due diligence audits. The key criteria for this assessment are strategic relevance, profitability, management quality, future prospects and compliance aspects. We only acquire companies that are active and successful in the market and which can make posi-tive contributions to the Group’s earnings from the start. New compa-nies are integrated into the Group and its risk management system ac-cording to clear plans and instructions. Decisions on the acquisitions to be made by the Group are taken in the Executive Board. Approval of the Supervisory Board is also required for larger company acquisitions.
Risks related to service provision
Project business We face calculation and execution risks in relation to the planning and implementation of complex major projects in par-ticular. Losses in major projects can lead to a substantial burden on earnings.
The management of these risks is one of the main tasks of the units responsible for the individual project and is supported by centralized project controlling. This includes the selection of projects and the sub-sequent bid preparation, project execution and processing of any guar-antee claims. In the selection of projects and the processing of bids, in addition to the actual task of the project, the client’s person, conditions in the region the project is to be carried out, the competence and capac-ity of the Group unit that will potentially do the work, execution risks, the draft contract as well as the payment plan and payment security are all analyzed, critically evaluated and divided into risk classes. Selection of the projects that are to be pursued is made on the basis of these risk classes.
Within the context of this project controlling, principal contracts are subjected to a thorough commercial and legal examination, with technical aspects analyzed separately by experts in that field. Pro-jects above a certain volume or with a high degree of complexity are carefully monitored by a central unit with defined regulations in each phase of the business so that any corrective measures can be taken in good time. 48 projects were under special observation in 2013. Sufficient provisions have been taken in the balance sheet for all identi-fied project risks.
Services business As is the case in the project business, calculation and execution risks also exist in the services business. In general, how-ever, these are limited due to the lesser degree of complexity and the lower volumes of the services to be provided.
The basis for the management of these risks by our services units is a profound understanding of the services being provided and of the con-tract conditions that have been agreed. For the execution of the work they have their own competent and reliable staff in sufficient numbers. Due to the high degree of involvement in the business processes of the client, particular attention is paid to the appropriate qualifications of the persons assigned. For international activities, knowledge of the local conditions and the reliability of local employees is of particular importance.
In the services business, too, orders from a certain volume upward are monitored by a centralized unit so that corrective measures can be implemented in a timely manner when necessary.
Management reportOpportunity and risk report
Bilfinger SEAnnual Report 2013
115

Partners For the execution of our business activities we maintain diverse contractual relationships with a large number of partners. For the most part, these are clients, partners in jointly-owned companies, consortiums and joint ventures, subcontractors, suppliers, financial in-stitutions as well as service providers. If these contract partners are not able to meet their performance and / or payment obligations, if they perform poorly, behind schedule or not at all, it can lead to difficulties for our own performance and to financial losses.
We counter this risk by carefully selecting our partners in terms of reliability and performance and – when necessary – a collateraliza-tion of their contractual obligations. In the execution of projects with consortial and joint venture partners and in the assignment of impor-tant subcontractors, all potential breakdowns on the partner side are routinely included in the bid considerations. This approach has proven to be effective in the global economic and financial crisis: virtually no partner risks have arisen.
We subject all important suppliers, service providers and subcon-tractors as well as all distribution agents, joint venture partners, con-sortiums and joint ventures to an integrity audit prior to the conclusion of a contract.
A particular problem is presented by advance performance obliga-tions, especially in the construction business. Inherent to these obliga-tions is the risk that payments from the client are not made on time or that additional work must be carried out that has not been secured with a price agreement. To avoid such situations we systematically monitor the business conduct and financial situation of our clients.
Human Resources We carefully counteract the human-resources risks that might arise due to a shortage of junior managers, high staff turnover, lack of qualifications, low motivation or an excessively old work force with a range of personnel development measures. In this way, we ensure that highly qualified employees are recruited and retained by the Group over the long term. We therefore maintain close contacts with selected universities, organize internships for students and graduates, and organize specially designed familiarization pro-grams at the beginning of new graduates’ careers at Bilfinger. An extensive range of courses and further training is available to our work-force. Career prospects are discussed regularly and individually with our employees. Management positions are mainly occupied from within the workforce. By means of our human resources controlling, we analyze structural changes within the workforce and can thus counteract any negative developments at an early stage. As a result of our farsighted human resources development, no specific risks are recognizable in the personnel sector.
Procurement We intensively monitor our global procurement markets. The Group-wide monitoring of world market prices of, for example, steel, oil and services facilitates the flexible procurement of materials and sub-contractor services for our projects at optimal conditions. We counteract regional procurement risks by cooperating with competitive suppliers and subcontractors. We secure quantities, qualities and prices by means of letters of intent and preliminary agreements. We also protect our-selves against inflation in our bids by means of sliding price clauses.
Quality assurance Our operational units remain primarily responsible for the quality of their products as well as the relevant safety and moni-toring measures. These decentralized systems are supported by the headquarters. A corporate officer for quality assurance gathers relevant data and information from all divisions, determines the status of ‘best practice’ and distributes his findings to all Group units. The condensed knowledge on optimized quality management is routed to the ongoing work of the quality assurance managers in our operating units as well as to training and education measures.
The proven audits and certifications of processes and units with our partners, the German Quality Association, the European Organization for Quality and the Technical Review Association are continued. With the further development of our quality management, we have taken all the steps necessary to provide our clients with a quality level of the highest standard.
Financial risks
We monitor financial risks with proven control mechanisms that allow for timely and transparent reporting. The Group’s reporting system guar-antees regular identification, analysis, assessment and management of financial risks by Group Treasury. All relevant equity interests and joint ventures are included in this monitoring.
On the basis of rolling cash-flow planning, liquidity risks in the Group are monitored and controlled centrally. Within the context of central financing, Bilfinger SE is available to its subsidiaries as a lender of last resort. Notwithstanding economically less relevant regions, the Group’s internal equalization of liquidity in Europe is supported by cross-border cash pooling.
Investment financing is carried out with consideration of matching maturities. From the €250 million promissory note loan placed for this purpose in 2008, and following the repayment of a first tranche in the amount of €84 million in 2011, the second tranche of €166 million was repaid on time in the middle of 2013. In 2012, a €500 million bond with maturity in 2019 was issued. To finance working capital, we have a
Management report Bilfinger SEAnnual Report 2013
116

€500 million pre-approved credit line at attractive conditions that is in place until 2016.
The credit facilities available for the execution of our project and services business continue to be appropriate to support our future cor-porate growth. To this end, long-term bilateral credit lines in the amount of €1.8 billion with a term until 2014 are available. In addition, we also have short-term bilateral credit lines. All credit commitments can be called due prematurely in the case of a change of control. The long-term credit agreements include a financial covenant in the form of a limitation of the dynamic gearing ratio. Any breach can lead directly or, through cross-default clauses, indirectly to the repayment call of all financing on a recourse basis. At no time did such a threat exist.
Market-price risks in the finance sector primarily involve exchange rates, interest rates, raw-material prices and the market values of financial investments. Centralized control allows us to net out cash flows and financial positions to a large extent. We make use of deriva-tive financial instruments to minimize residual risks and fluctuations in earnings, valuations and cash flows. We do not undertake any financial transactions beyond the underlying business risk. Hedging is primarily carried out via micro-hedges. Fundamental questions of risk manage-ment such as defining or reviewing methods, limits or risk strategies are dealt with by a steering committee with the direct involvement of the Executive Board.
We use currency futures or currency options to hedge risks relating to foreign-currency cash flows and balance sheet items denominated in foreign currencies (not translation risks). We generally hedge against transaction risks in the project business for the entire project period immediately after a contract is received. In some cases this is already done during the bidding phase. Risk management takes place with the use of specified risk limits for outstanding foreign exchange items, their value at risk and marked-to-market results.
Whenever possible, hedging against price fluctuations of raw ma-terials is undertaken on the basis of fixed-price agreements for deliver-ies or sliding-price clauses for consumption at a physical level. If this is not possible, hedging is carried out with the use of commodity swaps, for diesel fuel or bitumen, for example.
We counteract the risks of interest-rate changes by continually reviewing and, when required, adjusting the composition of recourse liabilities subject to fixed and variable interest rates. We assess risks with consideration of future needs for new financing or refinancing on the basis of a cash-flow-at-risk model. The borrowing costs budgeted within the scope of the cost-of-capital model serve as a point of refer-ence. To manage this, we generally apply derivative financial instru-ments such as interest-rate swaps and swaptions.
In the area of non-recourse project financing, however, liabilities are hedged with full maturity matching with the use of interest rate swaps. Changes in market value occurring in this context must be reflected in the balance sheet, but they have no impact on the success of the relevant project or on the Group’s cash flows.
Substantial counterparty risks can arise in connection with the investment of liquid funds and the application of derivative financial instruments. To limit such risks, we enter into financial transactions exclusively with such banks that have a rating of at least A-. In addition, on the basis of an internal limit system, a diversification of volumes and maturities takes place. Our risk consideration also includes the loss of pre-approved but not yet utilized financing in the project business.
Due to this consistent application of the financing policy, there were no negative effects on the Group’s financial position or earnings also in 2013.
Note 30 (see page 192 f.) of the notes to the consolidated financial statements provides quantitative information on the risks from financial instruments and hedging transactions. Further information on financial instruments can also be found in Note 29 of the notes to the consoli-dated financial statements (see page 189 f.).
Other risks
Compliance Compliance cases can have a variety of consequences for the company and its employees. These range from damage to the com-pany’s competitiveness, loss of assets and third-party damage claims to sanctions from the state. The clarification alone of suspicious cases often causes substantial costs through the involvement of internal and external measures. With our compliance system, which is constantly being developed, we are making targeted efforts to avoid these risks. Suspicious events are actively confronted and investigated. In case of an investigation, we cooperate with the responsible authorities. Any misconduct that is discovered will result in personnel consequences for those involved and will lead to preventive organizational measures.
Reputation Accidents at our project sites, environmental damage, ac-tual or alleged deficits and errors in our performance as well as compli-ance violations can all damage our reputation and impact our financial situation. We counteract damage to our reputation through open com-munication and cooperation with clients and government authorities.
IT In order to prevent unauthorized access and data loss and to guar-antee the permanent availability of our systems, we protect our infor-mation technology with numerous technical installations. Our IT struc-
Management reportOpportunity and risk report
Bilfinger SEAnnual Report 2013
117
tures are largely standardized. We use software products from leading producers such as SAP, Oracle and Microsoft. Applicable security guidelines are regularly adapted to the latest technical developments. IT security is regularly audited in a standardized process by internal and external auditors.
Litigation Legal disputes arise almost exclusively from our provision of services, especially in the project business. Controversies with a client mainly relate to our remuneration, claimed defects in our services or delays to the completion of a project. We strive to avoid legal disputes wherever possible. This goal cannot always be achieved, however, with the result that German and international companies are sometimes in-volved in litigation or arbitration. It is naturally impossible to predict the outcome of such cases with certainty. Nonetheless, following care-ful examinations, we can assume that sufficient provisions have been recognized in the balance sheet for all such disputes.
General assessment of the risk situation
The evaluation of the overall risk is the result of a consolidated consid-eration of all significant individual risks. Further reduction of the con-struction business tends to minimize our project risks. The overall risk situation of the Bilfinger Group has not, however, changed significantly as compared with the prior year. We are convinced that the risks associ-ated with our business activities are sustainable for the Group in view of our strong diversification, our financial strength and the instruments that have been put in place to manage these risks.
In the past financial year, we did not identify any individual risks whose occurrence, either alone or in combination, would have jeopard-ized the continuing existence of the Group or one of its significant Group companies. If unpredictable, exceptional risks should arise, the possibil-ity that they would have an impact on our output volume or earnings cannot be excluded. From today’s perspective, however, no risks can be identified that could threaten the existence of the Group or one of its significant Group companies.
Economic environment
For the year 2014, we anticipate a generally positive development of economic conditions in those markets that are relevant for Bilfinger.
Development of the Group
Bilfinger is using its broad potential as an engineering and services group for the next phase in its development. Based on the strategic program BEST (Bilfinger Escalates Strength) and the efficiency en-hancement program Bilfinger Excellence, output volume will increase to €11-12 billion by 2016 and net profit will grow to about €400 million (see page 61).
Even though, according to current assessments, the global economy is about to enter a period of positive development, our markets remain demanding. With our robust business model, we remain confident that we are well-equipped to reach our goals.
Provided that the assessments with regard to the economic de-velopment of the global economy prove true and no recessionary ten-dencies appear, we anticipate the following development in 2014, not including future acquisitions:
Industrial
Declining insecurity about the future of the European currency means that companies are showing a renewed willingness to invest. As a result, investments in plant and equipment in the euro zone will expand again at a rate of about 4 percent following two years of decline (COM 2013). The German investment dynamic will be exceeded by that of the United Kingdom and the USA. Overall, global trade will increase. For the chemical industry, however, expectations are currently somewhat reserved because not all export markets are showing the same level of recovery. With the revival of the investment economy, the groundwork has been laid for stable growth rates in the markets for industrial services.
In the Industrial business segment, Bilfinger anticipates higher organic growth in output volume for 2014 as compared to the reporting year. This is based on expected improvement in the businesses of its in-dustrial customers. The EBITA margin will be within the target corridor.
Outlook
Source:COM 2013: European Commission, European Economic Forecast, Autumn 2013, November.
Management report Bilfinger SEAnnual Report 2013
118
Management reportOutlook
degree, the improved financing conditions for euro countries on the cap-ital markets have a stabilizing effect on the execution of investments in transport and energy networks. The ongoing programs of the new EU financing framework for the period from 2014 to 2020 will create particular investment impetus in the southern and eastern European recipient countries of the EU Structural Fund. In Germany, the civil engi-neering market will benefit from increasing infrastructure spendings of the federal government.
Following a strong decline in output volume in the reporting year to approximately €1 billion, we anticipate a comparable figure for 2014. This is contingent on an increase in orders received. Earnings will improve significantly due to the sale of the loss-making German road construction activities as well as the expected turnaround in Poland. The EBITA margin, however, will not yet reach the target figure.
Group
Output volume Output volume for the Group will increase to at least €9 billion in 2014 (reporting year: €8.5 billion). With the exception of Construction, we expect organic growth in all business segments; in addition, the acquisitions already made will also contribute to the increase.
Adjusted EBITA / adjusted net profit from continuing operations Adjusted EBITA (reporting year: €409 million) and adjusted net profit (reporting year: €249 million) will increase significantly with higher margins. The basis for this is, primarily, the planned increase in volume as well as the Group-wide cost reduction measures.
Return on capital employed We intend to create substantial value added in each segment with a return on capital employed (ROCE) above our weighted average cost of capital. In 2014, we expect a return on capital employed for continuing operations of at least 15 percent.
Dividend policy Our sustainable dividend policy calls for a distribution ratio of approx. 50 percent of adjusted net profit.
Cash flow from operating activities Despite payments for restruc-turing costs, we plan a noticeable increase in cash flow from operating activities on the basis of increasing earnings. In this context we will maintain a strong focus in particular on the management of working capital.
Capital expenditure on property, plant and equipment Planned investments in property, plant and equipment for 2014 in a magnitude of a good €200 million are above the usual level of about 2 percent of output volume. This is due to a joint venture in the Construction
Power
The global market for power plant services will grow more strongly in 2014 than in the two previous years. North America, Europe, the Arabian Gulf states and emerging economies are pursuing ambitious but very different plans for the further development of their energy systems. With the further stabilization of the global financial system, credit bottlenecks are becoming less of a worry. The economic recovery in the industrialized countries will have a positive impact on the stability of the emerging economies and their ability to invest. In Germany, the initial course of action from the Grand Coalition with regard to energy policy is becoming apparent – one geared toward greater cost effi-ciency in the expansion of renewable energies. Up to now, however, it is not clear whether it will be possible to reduce uncertainties related to power plant investments associated with the energy transformation, meaning that the willingness to build new power plants will remain low. This also means that the modernization of existing power plants will become even more important.
Buoyed by the international business, Bilfinger anticipates an increase in output volume for the Power business segment in 2014. In 2013, the EBITA margin reached an exceptionally high level of 9.8 per-cent. It will not quite reach the target corridor in 2014.
Building and Facility
In Germany, the year 2014 will likely bring the turning point toward positive growth rates in commercial and public-sector building con-struction. The willingness of companies to undertake new construction will be supported by more affordable financing conditions and the fad-ing symptoms of the European debt crisis. With the completion of pri-vate and public-sector structures increasing once again, an important driver for facility services is developing positively in Germany in 2014. In Switzerland and Austria, too, demand for facility management services will likely increase in the course of the European economic recovery. It is also likely that we will see stable development in the British market for facility management services which is being supported by a signifi-cant economic recovery, rising real-estate prices in London and strong investment activity among companies.
Output volume of the business segment will grow organically in 2014 and will increase significantly, particularly as a result of acquisi-tions made in the reporting year. The EBITA margin will be at the upper end of the target corridor in 2014 as well.
Construction
Following three years of extensive budget consolidation in many euro zone countries, a more relaxed approach in budget policy can be expected. The anticipated end of the recession in the euro zone will lead to an increase in tax revenues and will facilitate the execution of infrastructure projects that have to date been delayed. To the same
Bilfinger SEAnnual Report 2013
119

business segment for the production of steel foundations for offshore wind turbines in which €50 million will be invested in 2014. Because we hold the majority of 62.5 percent of shares in the joint venture, these investments will be fully disclosed in our consolidated financial state-ments 2014.
Investments in financial assets At the end of 2013, we had financial scope of approximately €800 million for acquisitions planned within the context of our corporate strategy. We intend to invest this sum in finan-cial years 2014 and 2015.
Financing structure Cash and cash equivalents amounted to €669 million at the end of 2013 .
In accordance with our planning, we will finance the dividend distri-bution in 2014 from free cash flow.
We expect to be able to finance the acquisitions planned for 2014 largely through the use of available liquidity and payments due this year from the sale of our concessions projects. Insofar as it is necessary, borrowed capital will be used in addition.
For the financing of intra-year changes in working capital, we have a syndicated cash credit line of €500 million available which is due in 2016.
Capital structure With regard to capital structure, we strive for rela-tions in the relevant key figures that are required for our solid invest-ment-grade rating (see page 62 for details).
Research and development Our expenditures for research and development will increase in the coming years. The focus of activities will be on the optimization of energy generation in power plants and the reduction of energy requirements over the lifecycle of buildings.
GENERAL STATEMENT OF THE EXECUTIVE BOARD ON THE EXPECTED DEVELOPMENT OF THE GROUP€ million
Output volume EBITA margin adjusted
2013 Expected 2014 2013 Expected 2014
Industrial 3,653 * noticeable increase 5.7 % * magnitude of 6 %
Power 1,566 * noticeable increase 9.4 % * between 8 and 8.5 %
Building and Facility 2,346 substantial increase 4.9 % at upper end of target corridor of 4.5 to 5 %
Construction 1,038 similar level 0.1 % still under target figure of 4 %
Other -94 – –
Group 8,509 increase to at least € 9 million 4.8 % increase
* With the implementation of the new organizational structure, the allocation of a number of operational Group companies to the business segments has changed. As a result, from financial year 2014 an output volume of about €310 million and an EBITA of €24 million from 2013 which had previously been part of the Industrial business segment will in future be presented in the Power business segment.
General statement from the Executive Board of
Bilfinger SE on the anticipated development of the Group
Overall, the Executive Board of Bilfinger SE views the situation of the Group as positive. On the basis of our strengths as an engineering and services group, we intend to grow organically at an average annual rate of 3 to 5 percent. A significant portion of the increase in volume planned until 2016 will come from acquisitions. We will increase earnings at a disproportionately high rate through acquisitions in high-margin areas and through the further measures laid out in our strategy programs BEST and Bilfinger Excellence.
Management report Bilfinger SEAnnual Report 2013
120

Management reportAdditional disclosures pursuant to Section 289 Subsection 4 and Section 315 Subsection 4 of the German Commercial Code (HGB)
Structure of subscribed capital
The subscribed capital of (unchanged) €138,072,381 is divided into 46,024,127 bearer shares with an arithmetical value of €3.00 per share. Each share grants entitlement to one vote in the Annual General Meeting.
Limitations relating to voting rights or the transfer
of shares
We are not aware of any limitations to voting rights beyond the statu-tory limitations, such as pursuant to Sections 136 and 71 b of the Ger-man Stock Corporation Act (AktG).
Shareholdings in Bilfinger exceeding 10 percent of the
voting rights
Investment company Cevian Capital II GP Limited, St. Helier, Jersey, Channel Islands, notified us on March 14, 2012 with reference to Sec-tion 21 Subsection 1 of the German Securities Trading Act (WpHG) that its shareholding in Bilfinger had exceeded the threshold of 15 percent of the voting right and amounts to 15.01 percent. In accordance with Section 22 Subsection 1 Sentence 1 Number 1 of the German Securi-ties Trading Act (WpHG), these voting rights were assigned to Cevian Capital II GP Limited through Cevian Capital II Master Fund LP, Cevian Capital Partners Limited and Cevian Capital II Co-Investment Fund LP.
In January 2013, Cevian Capital II GP Limited, St. Helier, Jersey, Channel Islands, notified us that the voting rights of Cevian Capital II Master Fund LP, Grand Cayman, Cayman Islands, exceeded the thresh-old of 15 percent on January 14, 2013 and amounted to 15.07 percent. Thereof, voting rights of 14.0 percent have been assigned pursuant to Section 22 Subsection 1 Sentence 1 of the German Securities Trading Act (WpHG). Cevian Capital Partners Limited, Florinia, Malta, gave noti-fication that on January 15, 2013 its voting rights exceeded the thresh-old of 15 percent and amounted to 15.19 percent.
Within the scope of the Annual General Meeting 2013, Cevian noti-fied us that its voting rights at that point in time amounted to a total of 18.87 percent.
Shares with special rights
There are no Bilfinger shares with special rights conferring powers of control.
Control of voting rights of employee shares with indirect
exercise of controlling rights
Within the scope of the employee share program, there are employee shareholdings in Bilfinger that do not exercise their control rights di-rectly, but have transferred these to a shareholder association that rep-resents their interests. The proxies can be revoked at any time. On the balance sheet date, a total of 80,515 voting rights had been transferred to the association.
Statutory requirements and provisions of the Articles
of Incorporation on the appointment and dismissal of
members of the Executive Board and changes to the Ar-
ticles of Incorporation
The appointment and dismissal of members of the Executive Board are subject to the statutory provisions of Section 39 of the SE Regulations, Section 16 of the SE Implementation Act and Sections 84 and 85 of the German Stock Corporation Act (AktG), as well as the provisions of Article 8 of the Bilfinger SE Articles of Incorporation. Accordingly, mem-bers of the Executive Board are appointed by the Supervisory Board for a maximum period of five years. Re-appointments are permitted. The Supervisory Board can dismiss a member of the Executive Board when there is good cause for the dismissal. The Supervisory Board decides on the appointment or dismissal of a member of the Executive Board by simple majority. In the event of a tied vote, the Chairman of the Super-visory Board has a casting vote; if the Chairman does not participate, the Deputy Chairman has a casting vote provided he is a representative of the shareholders.
Any amendments to the Articles of Incorporation of Bilfinger SE are subject to the statutory provisions of Section 59 Subsection 1 of the SE Regulations and Sections 133 and 179 of the AktG, as well as the provisions of Article 21 Section 2 of the Articles of Incorporation of Bilfinger SE. Accordingly, a majority of two-thirds of the valid votes cast or, provided that at least half of the share capital is represented, a simple majority of the valid votes cast is sufficient to amend the Ar-ticles of Incorporation. This does not apply to a change of the object of the company, to a resolution in accordance with Section 8 Subsec-tion 6 of European Council (EC) Regulation No. 2157/2001 of October 8, 2001, or to cases for which a greater voting or capital majority is stipu-lated by law. Pursuant to Article 25 of the Articles of Incorporation, the Supervisory Board is authorized to make resolutions concerning amend-ments and supplements that affect only the wording of the Articles of Incorporation.
Additional disclosures pursuant to Section 289 Subsection 4 and Section 315 Subsection 4 of the German Commercial Code (HGB)
Bilfinger SEAnnual Report 2013
121

Authorization of the Executive Board with regard to the
buy-back and issue of shares
Treasury shares In February 2008, the Executive Board, with the consent of the Supervisory Board and on the basis of the authorization granted by the Annual General Meeting of May 23, 2007, bought back 1,884,000 shares through the stock exchange at an average price of €53.07 per share. Of this total, 17,635 shares were converted in the reporting year as part of an employee share program. Afterwards, the company holds 1,866,365 treasury shares; this corresponds to 4.055 percent of the current voting rights. The company has no rights from these shares (Section 71 b AktG). In accordance with the resolution of May 23, 2007, the Executive Board can sell these shares through the stock exchange, offer them for sale to shareholders under considera-tion of the principle of equal treatment, use them within the scope of corporate mergers or acquisitions or for the fulfilment of conversion and option rights or recall them without any further resolution by an Annual General Meeting. The Annual General Meeting held on April 18, 2013 authorized the Executive Board, among other things, to offer these treasury shares for sale or to pledge / transfer them, with the approval of the Supervisory Board, to employees of Bilfinger SE and subordinated subsidiary companies as well as to the management of subordinated subsidiary companies; this also includes authorization to offer the shares for sale under other special conditions or to pledge / transfer them at no cost.
The Annual General Meeting held on April 18, 2013 canceled the authorization issued by the Annual General Meeting held on April 15, 2010 and authorized the Executive Board, with the consent of the Su-pervisory Board, to acquire the company’s own shares until April 17, 2018 in an amount of €13,807,238 of the current share capital under the condition that the shares to be acquired on the basis of this au-thorization, together with other shares held by the company which the company has already acquired and which are still in its possession or attributable to the company in accordance with Sections 71d and 71e AktG, at no time exceed 10 percent of the share capital. Furthermore, the requirements of Section 71 Subsection 2 Sentences 2 and 3 AktG are also to be observed. The acquisition may not be used for the pur-pose of trading in treasury shares.
Acquisition is to take place in accordance with the principle of equal treatment (Section 53 a AktG) through the stock exchange or by means of a public offer to buy addressed to all shareholders. In the case of acquisition through the stock exchange, the price paid (excluding in-cidental costs) may not be more than 10 percent higher or 10 percent lower than the stock-exchange price of Bilfinger shares resulting from the opening auction in Xetra trading of Deutsche Börse AG (or a com-parable successor system). With a public offer to buy, the price offered (excluding incidental costs) may not be more than 10 percent higher or 10 percent lower than the average stock-exchange price of Bilfinger
shares on the last three days of stock-exchange trading before the day the offer is made public, calculated on the basis of the arithmetical average of the price of Bilfinger shares in the closing auction of Xetra trading of Deutsche Börse AG (or a comparable successor system).
Shares acquired on the basis of this authorization may be offered to all shareholders with consideration of the principle of equal treatment or sold through the stock exchange. With the approval of the Supervi-sory Board, they may also be disposed of by sale or otherwise if the shares are sold in exchange for cash at a price not substantially below their average stock market price on the last three trading days before determination of the final selling price by the Executive Board. This au-thorization is limited to a total of 10 percent of the share capital of the company at the time of the resolution of the Annual General Meeting on April 18, 2013 or – if lower – 10 percent of the company’s share capital at the time of disposal of the shares. The authorized volume is reduced by the proportionate part of the share capital which is attributable to the shares or to which conversion and / or option rights or obligations under bonds relate which were issued or sold, subject to an exclusion of subscription rights, on or after April 18, 2013 pursuant to Section 186 Subsection 3 Sentence 4 AktG either directly, analogously or mutatis mutandis. In addition, the shares may be used within the scope of cor-porate mergers or acquisitions, recalled without any further resolution by the Annual General Meeting, or used for the fulfillment of conversion and / or option rights or obligations under bonds.
The Annual General Meeting held on April 18, 2013 further author-ized the Executive Board to offer these treasury shares, which were or will be acquired on the basis of the authorization from April 18, 2013 or which were acquired on the basis of an authorization issued earlier, for sale or to pledge / transfer them, with the approval of the Supervi-sory Board, to employees of Bilfinger SE and subordinated subsidiary companies as well as to the management of subordinated subsidiary companies; this also includes authorization to offer the shares for sale under other special conditions or to pledge / transfer them at no cost.
Approved capital
By resolution of the Annual General Meeting of April 15, 2010, with the consent of the Supervisory Board, the Executive Board was authorized until April 14, 2015 to increase the company’s share capital by up to €69,000,000 by the single or multiple issue of new no-par value bearer shares (Approved Capital 2010). Such issue of new shares may be ef-fected against cash or non-cash contributions. The new shares are to be offered to shareholders for subscription. An indirect subscription right within the meaning of Section 186 Subsection 5 AktG shall suffice in this context. Limited to new shares representing a total proportionate amount of the share capital of up to €27,600,000 and subject to the consent of the Supervisory Board, the Executive Board is authorized to exclude shareholders’ statutory subscription rights under the conditions specified in the authorization resolution with the issue of new shares
Management report Bilfinger SEAnnual Report 2013
122

Management reportExecutive Board remuneration
in cases of fractional amounts, to grant subscription rights to holders of conversion and / or option rights issued by the company or by a com-pany of the Group, or to carry out capital increases against cash and / or non-cash contributions.
Conditional capital
By resolution of the Annual General Meeting of April 18, 2013, the share capital was conditionally increased by up to €13,807,236 through the issue of up to 4,602,412 new bearer shares representing a propor-tionate amount of the share capital of €3.00 per share (Conditional Capital 2013). The conditional capital increase serves to grant shares to holders of conversion or option rights upon the execution of such rights, or to fulfill conversion or option obligations under convertible bonds or bonds with warrants which, in accordance with the authorization granted by the Annual General Meeting on April 18, 2013, are issued and / or guaranteed by the company or by a company of the Group until April 17, 2018.
The conditional capital increase will only be carried out to the ex-tent that holders of bonds make use of their conversion and / or option rights or fulfill their obligations to exercise conversions / options, and the conditional capital is required for this purpose. The new shares par-ticipate in profits from the beginning of the financial year in which they are issued as a result of the exercise of conversion or option rights or the fulfillment of conversion or option obligations.
Agreements related to a change of control
In the case of a change of control resulting from an offer to take over Bilfinger SE, as is common business practice, termination possibilities exist for the providers of credit and guarantees for our syndicated cash credit lines of €500 million, our promissory note loan of €500 million, and various bilateral credit facilities totaling over €1,820 million. For the credit facilities, there is also an immediate prohibition of any further utilization in the case of such a change of control.
Compensation agreements in the case of an offer to
take over the company
In the case of a change of control and if certain other conditions are ful-filled, the members of the Executive Board have the right to terminate their contracts of service. This regulation would give the members of the Executive Board the required independence in the case of a takeo-ver bid so that they could direct their actions solely to the benefit of the company and its shareholders. Further details can be found in the remuneration report (see pages 129 ff.).
The remuneration of the members of the Executive Board is comprised of a fixed salary, bonuses including a special incentive as well as fringe benefits and retirement benefits. Further information including individu-alized details of payments can be found in the remuneration report (see pages 129 ff.). The remuneration report is part of the combined manage-ment report.
Executive Board remuneration
Disclaimer___
All statements made in this report that relate to the future have been made in good faith and based on the best knowledge available. How-ever, as those statements also depend on factors beyond our control, actual developments may differ from our forecasts.
Bilfinger SEAnnual Report 2013
123

124

126 Corporate governance report 129 Remuneration report
Corporate Governance
125

Corporate governance report
Bilfinger attaches great importance to good corporate governance. The principles of good and responsible corporate governance guide the ac-tions of the management and control functions of Bilfinger SE. The term ‘corporate governance’ refers to the entire management and control system of a company, including its organization, its socio-political prin-ciples and guidelines as well as the internal and external monitoring and control mechanisms. Good and transparent corporate governance ensures the responsible, value-oriented and sustainable management and control of the company.
Structure of corporate governance
Bilfinger SE is a European stock company located in Germany and is subject to European SE regulations, the German SE Implementation Act and the German Stock Corporation Act. The company has a dual man-agement and monitoring structure consisting of the Executive Board and the Supervisory Board. The third body of the company is the An-nual General Meeting. At present, no use is made of the possibility of forming an advisory board, as allowed by Article 17 of our Articles of Incorporation.
Executive Board The members of the Executive Board are appointed by the Supervisory Board; it currently consists of five members (see page 207). The Executive Board manages the company in its own re-sponsibility; its tasks include setting the company’s corporate goals and strategic focus, managing and monitoring the operating units, as well as implementing and monitoring an efficient risk management system.Details of the remuneration of the Executive Board members can be found in the remuneration report, which is included as a section of the Group management report (see page 129).
Supervisory Board In accordance with Article 11 of the Articles of Incorporation, the Supervisory Board of Bilfinger SE consists of twelve members, six of whom are representatives of the shareholders and six of whom are employee representatives. The shareholder representa-tives are elected by the Annual General Meeting, and it is thereby incumbent on the Supervisory Board, in accordance with Section 124 Subsection 3 Sentence 1 AktG, to propose candidates to the Annual General Meeting. The appointment of the employee representatives is carried out by the SE Works Council in accordance with the agreement on employee participation reached between company management and the European employee representatives on July 15, 2010. With regard to the appointment of those members to be appointed by the SE Works Council, the Supervisory Board has no right to make proposals; it is not involved in the selection procedure for the employee representatives in the Supervisory Board.
The Supervisory Board advises and monitors the management of the company by the Executive Board. Decisions of fundamental importance for the company require the approval of the Supervisory Board. Within the context of its report, the Supervisory Board informs the shareholders about its activities (see pages 10).
The current composition of the Supervisory Board and the commit-tees formed for more efficient execution of its activities can be seen in the section of the Annual Report entitled ‘Boards of the company’ (see page 208). The positions held by members of the Supervisory Board on monitoring boards of other companies are also listed here.
Details of the remuneration of the Supervisory Board members can be found in the remuneration report, which is included as a section of the Group management report (see page 132).
Annual General Meeting The Annual General Meeting is to be con-vened at least once each year. The Executive Board presents to the An-nual General Meeting certain documents, including the annual and con-solidated financial statements as well as the combined management report for Bilfinger SE and the Bilfinger Group. The Meeting decides on the appropriation of profits and on ratifying the actions of the Executive Board and the Supervisory Board, elects the members of the Supervi-sory Board representing the shareholders, and the external auditors. In addition, it makes decisions on amendments to the Articles of Incorpo-ration and in certain other cases as specified by applicable law or the Articles of Incorporation. Each share grants entitlement to one vote in the Annual General Meeting.
German Corporate Governance Code
The German Corporate Governance Code contains recommendations and suggestions for good corporate governance and control. It was developed by the responsible government commission based upon statutory provisions as well as nationally and internationally recognized standards of corporate governance. The Code is updated and elaborated by the commission on a continual basis. Bilfinger supports the goal set out by the Code of enhancing the transparency and comprehensibility of the corporate governance system and fostering trust among national and international investors, customers, employees and the public in the management and supervision of German listed companies.
Objectives for the composition of the Supervisory Board In ac-cordance with Section 5.4.1 Sentence 1 of the German Corporate Gov-ernance Code, the Supervisory Board shall state concrete objectives regarding its composition which, while considering the specifics of the enterprise, take into account the international activities of the enter-prise, potential conflicts of interest, the number of independent Super-visory Board members as defined by Section 5.4.2 of the German Cor-porate Governance Code, an age limit to be specified for the members of the Supervisory Board and diversity. In accordance with Section 5.4.1 Subsection 2 Sentence 2 of the German Corporate Governance Code, these objectives should also include appropriate consideration for the
Corporate governance report
Bilfinger SEAnnual Report 2013
126

Corporate governance report
participation of women. Proposals from the Supervisory Board to the responsible election committees shall, in accordance with Section 5.4.1 Subsection 3 Sentence 1 of the German Corporate Governance Code, give ample consideration to these objectives. The objectives and the status of their implementation shall, in accordance with Section 5.4.1 Subsection 3 Sentence 2 of the German Corporate Governance Code, be published in the corporate governance report.
As previously outlined, the Supervisory Board is responsible for making proposals for the election of the shareholder representatives to the Supervisory Board to the Annual General Meeting, but it is not involved in the selection procedure for the employee representatives in the Supervisory Board. Against this backdrop, the Supervisory Board announces, in accordance with Section 5.4.1 Subsection 2 of the Ger-man Corporate Governance Code and considering the specific situation of the company, the following objectives for its composition. It intends to consider the resolutions it proposes to the Annual General Meeting for the appointment of Supervisory Board members on the provision that those persons whose personal and professional qualifications make them the best suited for the position be proposed:
__ At least two members should, as a result of their international experience, embody to a significant extent the criteria of inter-nationality.
__ At least two members should possess particular knowledge and experience in business administration and finance.
__ At least two members should possess particular experience from leading positions in industrial or services companies.
__ At least three members should be independent in accordance with the requirements of Section 5.4.2 Sentence 2 of the German Corporate Governance Code, therefore in particular have no person-al or business relationship with the company, its bodies, a control-ling shareholder or one associated with affiliated companies that could result in a significant and not merely temporary conflict of interest. In addition, they should have no consulting or management function for clients, suppliers, creditors or other business partners, nor should they hold any position which could lead to a conflict of interest.
__ A maximum of two members are to be former members of the Ex-ecutive Board.
__ No member should exercise a management or consulting function for a significant competitor of the company.
__ At least one member should meet the requirements of Section 100 Subsection 5 AktG (so-called ‘financial expert’).
__ At least one woman should be a member of the Supervisory Board. __ As a rule, no member should be over 70 years of age at the time
of the Annual General Meeting which is to decide on his or her ap-pointment as member of the Supervisory Board; exceptions are to be justified.
The composition of the current Supervisory Board complies with the objectives above.
Declaration of compliance On September 19, 2013, in accordance with Section 161 of the German Stock Corporation Act (AktG), the Executive Board and Supervisory Board issued the following annual declaration of compliance as required:
“Bilfinger SE complies with all of the recommendations of the German Corporate Governance Code as amended on May 13, 2013 with the fol-lowing exceptions:
__ The Supervisory Board does not comply with the recommendation in Section 5.1.2 Subsection 1 Sentence 2 Clause 2 (seeking an ap-propriate consideration of women) insofar as it is guided solely by the qualification of those persons available when filling Executive Board positions. The Supervisory Board would, however, consider filling a vacant position on the Executive Board with a woman pro-vided that in the specific case an appropriate candidate is available.
__ The recommendation in Section 5.4.3 Sentence 3 (announcement to shareholders of proposed candidates for the Chairmanship of the Supervisory Board) is not followed because this recommendation does not conform with the distribution of competencies as set out in the German Stock Corporation Act (AktG), which states that the election of the Supervisory Board Chairman is the responsibility of the Supervisory Board alone.
Since issuing the Declaration of Compliance of October 23, 2012, the company has complied with all recommendations of the German Cor-porate Governance Code as amended on May 15, 2012 with the excep-tion of the recommendations in Sections 5.1.2 Subsection 1 Sentence 2 Clause 2 and 5.4.3 Sentence 3.”
The Declaration of Compliance is published on the company’s website and is updated when changes occur.
Bilfinger also fulfills nearly all non-binding suggestions of the Ger-man Corporate Governance Code. Exceptions are the accessibility of the proxy representative of the shareholders also during the Annual Gen-eral Meeting (Section 2.3.3 Sentence 2 Clause 2). The suggestion that shareholders should be given access to the Annual General Meeting through modern communication technology (Section 2.3.4) is followed insofar as the speech of the Chairman of the Executive Board is broad-cast on the Internet.
Directors’ dealings
Pursuant to Section 15 a of the German Securities Trading Act (WpHG), the members of the Supervisory Board and the Executive Board, other persons with management duties who regularly have access to insider information on the company and who are authorized to make significant business decisions, and certain persons who are in a close relationship
Bilfinger SEAnnual Report 2013
127

with those persons are legally obliged to disclose to Bilfinger SE any acquisitions and disposals of Bilfinger shares and related financial instruments, particularly derivatives, in an amount of more than €5,000 in any calendar year. We publish details of such transactions on our website at www.bilfinger.com, among other places, without delay.
The members of the Executive Board and the Supervisory Board do not own any shares in the company or any related financial instruments that together, either directly or indirectly, constitute more than 1 per-cent of the shares issued by the company.
Compliance system
For Bilfinger compliance represents an essential element of success-ful executive management and good corporate governance. With this in mind, we have established our compliance system. It meets the in-creased global requirements and international standards.
The basis for the compliance rules valid on a Group-wide basis is a Code of Conduct which lays out the general principles of our actions. The corresponding Group guidelines include concrete instructions on the central issues of integrity, competition and dealing with business partners.
The new compliance regulations were distributed to all employees in more than 20 languages. We distribute the content throughout the world by means of comprehensive on-site training, webinars and a newly-developed e-learning program.
With the communication platform Bilfinger Compliance Communi-cations, employees worldwide can ask questions via telephone or in-tranet in their native language. These questions will then be answered by the compliance team. The system can also be used to report compli-ance incidents (anonymously, if desired). Internal whistleblowers are protected against any reprisals; the voluntary disclosure of one’s own misconduct is to the advantage of the employee concerned.
Persons outside of the company such as customers, suppliers, sub-contractors or service providers can also point out misconduct via Bilfin-ger Compliance Communications. These messages remain anonymous if so desired.
The Group’s Chief Compliance Officer reports directly to the Chair-man of the Executive Board. The compliance officers that report to him along with central and decentral compliance managers are sup-ported by compliance staff in the operating companies and process all compliance-related issues. The compliance team, which is staffed with specialists, works closely with the Group’s Executive Board, the man-agement of our affiliates and with executives; it reviews cases in which compliance is doubtful and assists employees in adhering to internal requirements.
Our control systems to ensure adherence with compliance require-ments are developed on an ongoing basis and are increasingly integrat-ed in to operational processes. They also comprise routine and special audits by Internal Auditing and the compliance organization. Important
business partners are subjected to an IT-supported integrity audit. In particular, we review the use of third parties in connection with order acquisition.
Through the immediate reporting of serious cases and the Chief Compliance Officer’s quarterly reports, the Executive Board, the Audit Committee of the Supervisory Board and the plenum of the Supervisory Board are given detailed updates on developments in the compliance area. A compliance committee supports the Chief Compliance Officer in the composition and the further development of the compliance system.
We actively pursue information on compliance violations through our own investigations, by notifying the relevant authorities when necessary and cooperating with them to achieve a full resolution. Any misconduct that is discovered will result in personnel consequences for those involved and will lead to preventive organizational measures.
The insights gained from reporting, the comparison with other sys-tems and the evaluations from external specialists all lead to the ongo-ing development and improvement of our compliance system. Following an agreement with the U.S. Department of Justice, an independent Compliance Monitor was appointed by Bilfinger in the spring of 2014 to support the company in this optimization.
Financial loss liability insurance
The company has taken out financial loss liability insurance which cov-ers the activities of the members of the Executive Board and Superviso-ry Board (D&O insurance). This insurance includes the deductible for the Executive Board legally required by Section 93 Subsection 2 Sentence 3 of the German Stock Corporation Act and the deductible for the Super-visory Board recommended in Section 3.8 Subsection 3 of the German Corporate Governance Code.
Corporate governance statement
The Executive Board issued a corporate governance statement pursu-ant to Section 289 a of the German Commercial Code (HGB) that has been made available to the general public on the company’s website (www.bilfinger.com) under ‘Investor Relations / Corporate governance statement.’
Mannheim, March 13, 2014
Bilfinger SEThe Executive Board The Supervisory Board
Corporate governance report Bilfinger SEAnnual Report 2013
128

Remuneration report
This remuneration report explains the remuneration system that has been in force for the Executive Board since January 1, 2013 and approved by the Annual General Meeting on April 18, 2013. The re-port also presents remuneration granted to individual members of the Executive Board for financial year 2013. The remuneration report also provides details of the remuneration of the Supervisory Board in 2013. The remuneration report is part of the Group management report.
Executive Board remuneration
The remuneration system, which is valid for all members of the Execu-tive Board, provides for variable remuneration according to a profit-sharing model related to the average of the earnings before taxes (EBT) achieved in the past three financial years. In addition, remuneration also includes further variable components in the form of special incen-tives. Further components of the remuneration system include non-cash benefits and retirement benefits.
Annual fixed salary The annual fixed salary shall amount to €499 thousand for full members of the Executive Board and €818 thou-sand for the Chairman of the Executive Board. As newly appointed Executive Board members, the remuneration received by Dr. Keysberg (until April 30, 2014) and Mr. Koolen (until March 18, 2015) is reduced by 20 percent. In addition to the fixed salary, the members of the Executive Board also receive fringe benefits (benefits in kind), for the most part in the form of insurance cover and the use of company cars, the value of which is accounted for in accordance with applicable tax law.
Variable remuneration Pursuant to Germany’s Appropriateness of Management Board Remuneration Act of August 2009, the remunera-tion structure at listed companies is to be oriented towards sustainable corporate development; variable remuneration is to be paid on a multi-year assessment basis. The members of the Executive Board therefore receive variable remuneration according to a profit-sharing model related to the average of the earnings before taxes (EBT) achieved in the past three financial years. Of the amount of variable remuneration calculated in this way, 65 percent is paid out immediately. The other 35 percent is paid out only after a waiting period of two years and depending on the relative development of Bilfinger’s share price (in terms of total shareholder return) compared with the MDAX.
The details are as follows: As the starting amount of variable remunera-tion, each full member of the Executive Board receives €3,800 (€3,040 for as long as the annual fixed salary is reduced by 20 percent) and the Chairman of the Executive Board receives €6,600 per €1 million of the average EBT achieved by the Group in the past three years. This starting amount is limited by a cap of €1,300 thousand for full members of the Executive Board (€1,040 thousand for as long as the annual fixed salary is reduced by 20 percent) and €2,200 thousand for the Executive Board Chairman. 65 percent of the starting amount is paid out immediately. The remaining 35 percent (deferral) is paid out after a waiting period of two years depending on the development of Bilfinger’s share price (in terms of total shareholder return) compared with the MDAX. If the rela-tive development of the share price is more than 60 percent worse than the MDAX, the deferral is not paid out. The deferral is limited by a cap to 150 percent of its starting value (equal to 35 percent of the starting amount of the variable remuneration).
The Supervisory Board can reduce the EBT of one or more financial years that is used to calculate the average EBT by up to 20 percent if the EBT is significantly increased by non-recurring components of earnings. Furthermore, the Supervisory Board can increase or reduce the starting amount of profit sharing in its own discretion by up to 10 percent based on the evaluation of the individual performance of each member of the Executive Board.
Special incentive In order to incentivize significantly higher growth targets approved in 2011 as part of strategic planning until 2016, a target bonus system has been introduced as a supplement to the ex-isting variable remuneration for members of the Executive Board from January 1, 2013. This supplement has a term of four years and is orient-ed toward annual earnings and liquidity targets. Depending on the ful-fillment of the EBT target as set for the relevant financial year, members of the Executive Board receive a bonus which, for 100 percent target achievement amounts to €150 thousand for full members of the Execu-tive Board and €225 thousand for the Chairman of the Executive Board. If 100 percent of the annual target for free cash flow is achieved, full members of the Executive Board receive €50 thousand and the Chair-man of the Executive Board receives €75 thousand.
The annual EBT target values are based on strategic planning as approved by the Executive Board and the Supervisory Board in October 2011. If the actual figures are more than 5 percent below target, this portion of the special incentives will not be granted for the relevant financial year; if the figures exceed the target by more than 30 percent, a cap in the amount of €300 thousand for full members of the Execu-tive Board and €450 thousand for the Chairman of the Executive Board shall be applied. Within this span, a linear interpolation will be used to determine the amount of the bonus.
Remuneration report
Bilfinger SEAnnual Report 2013
129
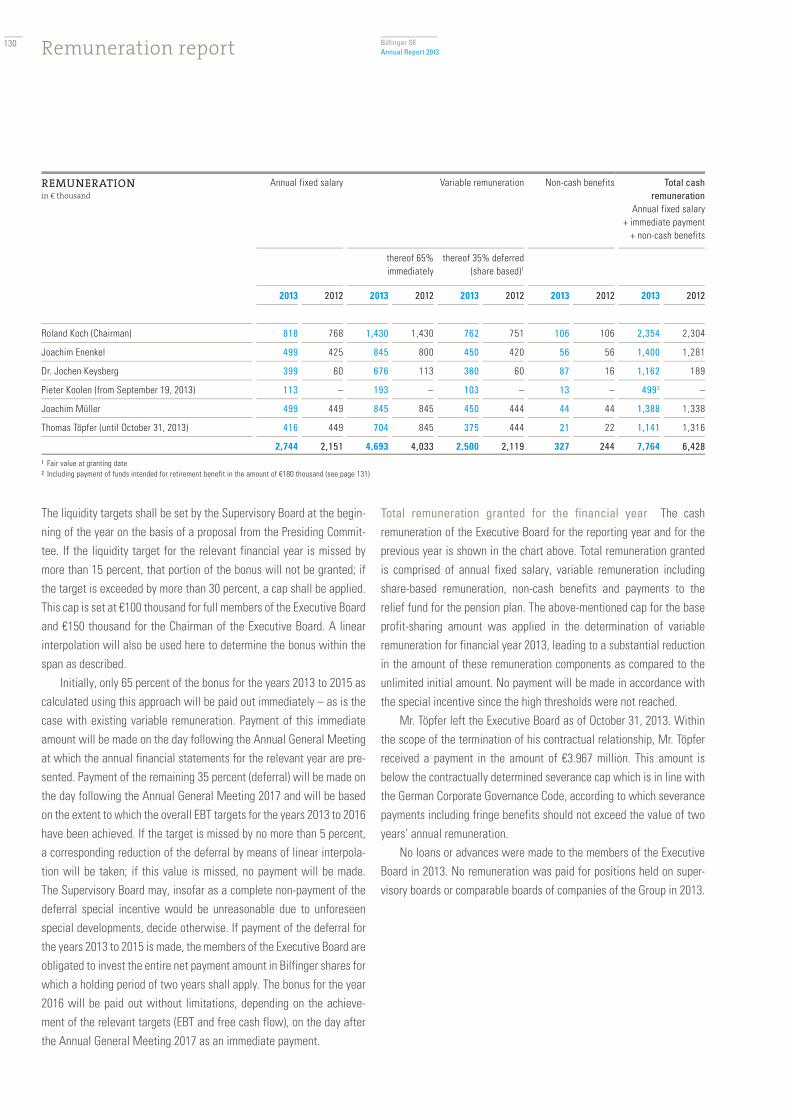
The liquidity targets shall be set by the Supervisory Board at the begin-ning of the year on the basis of a proposal from the Presiding Commit-tee. If the liquidity target for the relevant financial year is missed by more than 15 percent, that portion of the bonus will not be granted; if the target is exceeded by more than 30 percent, a cap shall be applied. This cap is set at €100 thousand for full members of the Executive Board and €150 thousand for the Chairman of the Executive Board. A linear interpolation will also be used here to determine the bonus within the span as described.
Initially, only 65 percent of the bonus for the years 2013 to 2015 as calculated using this approach will be paid out immediately – as is the case with existing variable remuneration. Payment of this immediate amount will be made on the day following the Annual General Meeting at which the annual financial statements for the relevant year are pre-sented. Payment of the remaining 35 percent (deferral) will be made on the day following the Annual General Meeting 2017 and will be based on the extent to which the overall EBT targets for the years 2013 to 2016 have been achieved. If the target is missed by no more than 5 percent, a corresponding reduction of the deferral by means of linear interpola-tion will be taken; if this value is missed, no payment will be made. The Supervisory Board may, insofar as a complete non-payment of the deferral special incentive would be unreasonable due to unforeseen special developments, decide otherwise. If payment of the deferral for the years 2013 to 2015 is made, the members of the Executive Board are obligated to invest the entire net payment amount in Bilfinger shares for which a holding period of two years shall apply. The bonus for the year 2016 will be paid out without limitations, depending on the achieve-ment of the relevant targets (EBT and free cash flow), on the day after the Annual General Meeting 2017 as an immediate payment.
Total remuneration granted for the financial year The cash remuneration of the Executive Board for the reporting year and for the previous year is shown in the chart above. Total remuneration granted is comprised of annual fixed salary, variable remuneration including share-based remuneration, non-cash benefits and payments to the relief fund for the pension plan. The above-mentioned cap for the base profit-sharing amount was applied in the determination of variable remuneration for financial year 2013, leading to a substantial reduction in the amount of these remuneration components as compared to the unlimited initial amount. No payment will be made in accordance with the special incentive since the high thresholds were not reached.
Mr. Töpfer left the Executive Board as of October 31, 2013. Within the scope of the termination of his contractual relationship, Mr. Töpfer received a payment in the amount of €3.967 million. This amount is below the contractually determined severance cap which is in line with the German Corporate Governance Code, according to which severance payments including fringe benefits should not exceed the value of two years’ annual remuneration.
No loans or advances were made to the members of the Executive Board in 2013. No remuneration was paid for positions held on super-visory boards or comparable boards of companies of the Group in 2013.
Remuneration report
REMUNERATIONin € thousand
Annual fixed salary Variable remuneration Non-cash benefits Total cashremuneration
Annual fixed salary + immediate payment
+ non-cash benefits
thereof 65% immediately
thereof 35% deferred (share based)1
2013 2012 2013 2012 2013 2012 2013 2012 2013 2012
Roland Koch (Chairman) 818 768 1,430 1,430 762 751 106 106 2,354 2,304
Joachim Enenkel 499 425 845 800 450 420 56 56 1,400 1,281
Dr. Jochen Keysberg 399 60 676 113 360 60 87 16 1,162 189
Pieter Koolen (from September 19, 2013) 113 – 193 – 103 – 13 – 4992 –
Joachim Müller 499 449 845 845 450 444 44 44 1,388 1,338
Thomas Töpfer (until October 31, 2013) 416 449 704 845 375 444 21 22 1,141 1,316
2,744 2,151 4,693 4,033 2,500 2,119 327 244 7,764 6,4281 Fair value at granting date2 Including payment of funds intended for retirement benefit in the amount of €180 thousand (see page 131)
Bilfinger SEAnnual Report 2013
130

Remuneration report
Additional disclosures
Long-term incentive plan The remuneration system for the Executive Board that was in effect until the end of 2010 also included a variable component linked to the company’s long-term performance and share price (long-term incentive plan). Under this arrangement, the members of the Executive Board were granted phantom shares in the form of so-called performance share units (PSUs). On the balance sheet date, Messrs. Enenkel and Müller have a total of 13,741 PSUs from the years 2009 and 2010. Cash payment (taxable) of the value of these PSUs takes place in each case after a four-year lockup period in the years 2014 and 2015 in line with the development of Bilfinger’s share price compared with the MDAX. The amounts to be paid out are limited by caps. On the basis of the Bilfinger share price of €81.53 at the end of 2013 and taking the caps into consideration, from today’s perspective, payments totaling €587 thousand will be made in the years 2014 and 2015.
Following the Annual General Meeting on April 18, 2013, Mr. Töpfer received payment for 837 PSUs for the year 2008 with a value of €49 thousand (taxable). Due to his departure from the Executive Board, Mr. Töpfer will not receive any payments from the long-term incentive plan. Retirement benefits With the exception of Mr. Koolen, Executive Board members receive pension payments from a retirement age of 62. In case of the death of one of these members of the Executive Board, survivors are entitled to pension benefits in the form of widow and orphan pensions. These entitlements have been transferred to an ex-ternal institution in the form of a reinsured relief fund and are based on contributions made by the company to the relief fund and contractu-ally agreed with the member of the Executive Board. All future pension entitlements are fully funded so that there is no financial burden on the company in the event of a claim. The benefits of the external in institu-tions also cover the risk of occupational disability for Messrs. Enenkel, Dr. Keysberg and Müller. Mr. Koch, however, would receive a monthly pension of currently €6,949 directly from Bilfinger until the age of 62 in the case of occupational disability (increased by €175 for each year of service); his annual contributions to the relief fund would continue to be paid in the amount of 55 percent of his last annual fixed salary.
The inclusion of Mr. Koolen in the retirement benefit system for members of the Executive Board was not sensible because, due to his age at entry, inclusion in the relief fund would have resulted in a rela-tively low pension amount. He therefore receives the funds intended for his pension plan including the provisions for the risk of occupational disability in the current amount of €180 thousand p.a. under considera-tion of tax regulation as a cash payment which he can apply to his own pension plan.
For Messrs. Enenkel, Dr. Keysberg and Töpfer, retirement pension commitments exist that were granted before they were appointed to the Executive Board. The relevant values amount to €179 thousand
for Mr. Enenkel (2012: €172 thousand), €197 thousand for Dr. Keys-berg (2012: €190 thousand) and €735 thousand for Mr. Töpfer (2012: €707 thousand). Because Mr. Koolen withdrew from his pension plan at Tebodin B.V. with his appointment to the Executive Board, the pro-portionate pension entitlement he earned there in the amount of €310 thousand (taxable) was paid out to him in cash.
The table above shows contributions to the relief fund for the year 2013 and pension entitlements already achieved by members of the Executive Board.
Other arrangements for the members of the Executive Board Mr. Müller receives a transitional payment from the company if his Ex-ecutive Board membership ends due to revocation or non-extension of his Executive Board appointment by the company or due to termination of his contract of service for an important reason to be justified by the company. However, this arrangement only applies if the event causing termination occurs after a period of office of a full eight years.
In the case of a change of control, i.e., if a shareholder in the com-pany reaches or exceeds a shareholding of 30 percent of the company’s
RETIREMENT BENEFITS€ thousand
Probable annual pension entitlement
upon retirement
Payments to relief fund
2013 2012
Roland Koch (Chairman) 187 449 422
Joachim Enenkel 124 225 202
Dr. Jochen Keysberg 105 180 162
Joachim Müller 115 225 202
Thomas Töpfer 33 117 180
564 1,196 1,168
PS Us GRANTED UNDER THE LONG-TERM INCENTIVE PLAN€ thousand
2009 tranche 2010 tranche Total
Joachim Enenkel 0 1,868 1,868
Joachim Müller 1,850 10,023 11,873
Thomas Töpfer 0 0 0
1,850 11,891 13,741
Theoretical amount to be paid out based on a share price of €81.53 (in € thousand) 151 436 587
Year of payment 2014 2015
Bilfinger SEAnnual Report 2013
131

voting rights and in addition due to an allocation of responsibilities decided upon by the Supervisory Board a significant change occurs in the Executive Board members’ responsibilities, or if the company enters into a control agreement as the controlled company, the members of the Executive Board have a special right of termination for their contracts of service. A special regulation applies to the Chairman of the Execu-tive Board due to his function; he is entitled to terminate his contract of service if the acquiring entity takes measures that effectively and materially restrict his abilities to exert control or his independence as the Chairman of the Executive Board. In the case of termination of a contract of service due to a change of control, the members of the Ex-ecutive Board receive severance compensation for the remaining peri-ods of their contracts of service subject to a maximum of three years. The severance compensation comprises the annual fixed salary and profit sharing; the latter is calculated as the average of the variable remuneration paid in the past five full financial years (bonuses, PSUs, immediate payments and deferrals). Following the remaining period of his contracts of service covered by severance compensation, Mr. Müller is entitled to a transitional payment if the individual conditions for such payment are fulfilled. Pursuant to the previous remuneration system, PSUs already granted are not compensated for the time after leaving the Executive Board. In accordance with the recommendation in Section 4.2.3 Subsection 5 of the German Corporate Governance Code, sever-ance compensation in the case of a change of control is limited to 150 percent of the general severance cap of two years’ remuneration in accordance with Section 4.2.3 Subsection 4 of the German Corporate Governance Code.
Total remuneration of former members of the Executive Board and pensions The amounts paid to former members of the Execu-tive Board or their surviving dependants totaled €2,169 thousand (2012: €2,238 thousand). The present value of future pension obligations for those persons calculated according to IAS 19 amounts to €27,264 thou-sand (2012: €27,524 thousand).
Supervisory Board remuneration
The members of the Supervisory Board receive, as specified by Article 16 of the Articles of Incorporation of Bilfinger SE, in addition to the re-imbursement of their expenses, annual fixed remuneration of €70 thou-sand. The Chairman of the Supervisory Board receives two and a half times that amount; the Deputy Chairman of the Supervisory Board and the Chairmen of the Committees with the exception of the Nomination Committee receive double that amount. The members of the commit-tees with the exception of the Nomination Committee receive one and a half times that amount. If a member of the Supervisory Board exer-cises several of the aforementioned functions, he or she is only entitled to the highest of the respective amounts. Members of the Supervisory Board receive a meeting fee of €500 for each meeting of the Super-
visory Board and its committees that they attend. Members who reside in Germany are also reimbursed for any value added tax applicable to their remuneration.
The remuneration of the members of the Supervisory Board of Bilfinger SE in 2013 amounted to €1,307 thousand (2012: €1,305 thou-sand). In financial year 2013, members of the Supervisory Board of Bil-finger SE were also compensated for expenses in the total amount of €30 thousand. No additional remuneration was paid or benefits granted for personal services rendered such as consulting or agency services.
REMUNERATION OF THE SUPERVISORY BOARD OF BILFINGER SE€ thousand
2013 2012
Dr. h. c. Bernhard Walter (Chairman, Chairman of the Presiding Committee)
179 179
Stephan Brückner (Deputy Chairman, member of the Presiding Committee) 144 144
Herbert Bodner (from July 1, 2013, member of the Audit Committee) 56 –
Volker Böhme (member of the Audit Committee) 109 110
Dr. John Feldmann (member of the Presiding Committee) 109 109
Lone Fønss Schrøder 72 73
Thomas Kern (member of the Audit Committee) 110 109
Rainer Knerler (member of the Presiding Committee) 109 109
Thomas Töpfer (until April 18, 2013) 22 72
Udo Stark (Chairman of the Audit Committee) 146 145
Holger Timmer 72 73
Jens Tischendorf (from April 18, 2013) 51 –
Prof. Dr. Klaus Trützschler (until June 30, 2013, member of the Audit Committee) 55 109
Marek Wróbel 73 73
1,307 1,305
Bilfinger SEAnnual Report 2013Remuneration report 132

133

134

136 Responsibility statement 137 Auditor’s report
138 Consolidated financial statements 139 Consolidated income statement 140 Consolidated statement of comprehensive income 141 Consolidated balance sheet 142 Consolidated statement of changes in equity 143 Consolidated statement of cash flow
144 Notes to the consolidated financial statements
Consolidatedfinancial statements
135

Bilfinger SEAnnual Report 2013
To the best of our knowledge, and in accordance with the applicable accounting principles for financial reporting, the consolidated financial state-ments give a true and fair view of the assets, liabilities, financial position and profit or loss of the Group, and the Group management report, which has been combined with the management report of Bilfinger SE, includes a fair review of the development and performance of the business and position of the Group, together with a description of the principal opportunities and risks associated with the expected development of the Group.
Mannheim, March 13, 2014
The Executive Board
Responsibility statement
Dr. Jochen KeysbergRoland Koch
Joachim Müller
Joachim Enenkel
Pieter Koolen
136

Bilfinger SEAnnual Report 2013
We have audited the consolidated financial statements prepared by the Bilfinger SE, Mannheim, comprising the income statement, the statement of comprehensive income, the balance sheet, the statement of changes in equity, the statement of cash flows and the notes to the consolidated financial statements, together with the group management report, that was combined with the company’s management report, for the fiscal year from 1 January to 31 December 2013. The preparation of the consolidated financial statements and the group management report in accordance with IFRSs as adopted by the EU, and the additional requirements of German commercial law pursuant to Sec. 315a (1) HGB [‘Handelsgesetzbuch’:
‘German Commercial Code’] are the responsibility of the parent company’s management. Our responsibility is to express an opinion on the consoli-dated financial statements and on the group management report based on our audit.
We conducted our audit of the consolidated financial statements in accordance with Sec. 317 HGB and German generally accepted standards for the audit of financial statements promulgated by the Institut der Wirtschaftsprüfer [Institute of Public Auditors in Germany] (IDW). Those stand-ards require that we plan and perform the audit such that misstatements materially affecting the presentation of the net assets, financial position and results of operations in the consolidated financial statements in accordance with the applicable financial reporting framework and in the group management report are detected with reasonable assurance. Knowledge of the business activities and the economic and legal environment of the Group and expectations as to possible misstatements are taken into account in the determination of audit procedures. The effectiveness of the accounting-related internal control system and the evidence supporting the disclosures in the consolidated financial statements and the group management report are examined primarily on a test basis within the framework of the audit. The audit includes assessing the annual financial statements of those entities included in consolidation, the determination of entities to be included in consolidation, the accounting and consolida-tion principles used and significant estimates made by management, as well as evaluating the overall presentation of the consolidated financial statements and the group management report. We believe that our audit provides a reasonable basis for our opinion.
Our audit has not led to any reservations.
In our opinion, based on the findings of our audit, the consolidated financial statements comply with IFRSs as adopted by the EU, the additional requirements of German commercial law pursuant to Sec. 315a (1) HGB and give a true and fair view of the net assets, financial position and results of operations of the Group in accordance with these requirements. The group management report is consistent with the consolidated financial statements and as a whole provides a suitable view of the Group’s position and suitably presents the opportunities and risks of future development.
Mannheim, 13 March 2014
Ernst & Young GmbHWirtschaftsprüfungsgesellschaft
Auditor’s report
Prof. Dr. Peter WollmertWirtschaftsprüfer[German Public Auditor]
Karen SomesWirtschaftsprüferin[German Public Auditor]
137

Bilfinger SEAnnual Report 2013Consolidated
financial statements
138

Bilfinger SEAnnual Report 2013
Consolidated financial statements
CONSOLIDATED INCOME STATEMENT€ million Notes 2013 2012
Revenue (6) 8,414.6 8,343.5
Cost of sales -7,298.9 -7,222.2
Gross profit 1,115.7 1,121.3
Selling and administrative expense -836.9 -832.1
Other operating income (7) 99.7 107.6
Other operating expense (8) -123.9 -47.0
Income from investments accounted for using the equity method (9) 32.5 31.0
Earnings before interest and taxes (EBIT) (10) 287.1 380.8
Interest income 1 (11) 7.6 11.9
Interest expense (11) -45.4 -38.4
Other financial expense (11) -5.3 -7.4
Earnings before taxes 1 244.0 346.9
Income tax expense 2 (12) -71.5 -101.6
Earnings after taxes from continuing operations 3 172.5 245.3
Earnings after taxes from discontinued operations (2) 3.7 33.6
Earnings after taxes 3 176.2 278.9
thereof minority interest 3.4 2.5
Net profit 3 172.8 276.4
Average number of shares (in thousands) (13) 44,149 44,140
Earnings per share 4 (in €) (13) 3.91 6.26
thereof from continuing operations 3.83 5.50
thereof from discontinued operations 0.08 0.76
1 Following adjustment of the prior-year figure due to IAS 19R by + €2.0 million 2 Following adjustment of the prior-year figure due to IAS 19R by - €0.5 million 3 Following adjustment of the prior-year figure due to IAS 19R by + €1.5 million4 Basic earnings per share are equal to diluted earnings per share. The adjustments due to IAS 19R only had an insignificant influence on earnings per share.
139

Bilfinger SEAnnual Report 2013Consolidated
financial statements
CONSOLIDATED STATEMENT OF COMPREHENSIVE INCOME€ million
2013 2012
Earnings after taxes 1 176.2 278.9
Items that will not be reclassified to the income statement
Gains / losses from remeasurement of net defined benefit liability (asset)
Unrealized gains / losses 2 -1.5 -63.7
Income taxes on unrealized gains / losses 3 2.1 16.8
0.6 -46.9
Items that may subsequently be reclassified to the income statement
Gains / losses on fair-value measurement of securities
Unrealized gains / losses 3.3 2.8
Income taxes on unrealized gains / losses -0.1 0.0
3.2 2.8
Gains / losses on hedging instruments
Unrealized gains / losses 50.0 -4.4
Reclassifications to the income statement 23.2 338.9
Income taxes on unrealized gains / losses -19.3 -86.3
53.9 248.2
Currency translation differences
Unrealized gains / losses -73.7 6.0
Reclassifications to the income statement -1.2 -17.1
-74.9 -11.1
Gains / losses on investments accounted for using the equity method
Unrealized gains / losses 59.1 -97.5
Reclassifications to the income statement 37.3 22.3
96.4 -75.2
78.6 164.7
Other comprehensive income after taxes 79.2 117.8
Total comprehensive income after taxes 255.4 396.7
attributable to shareholders of Bilfinger SE 251.9 393.2
attributable to minority interest 3.5 3.5
1 Following adjustment of the prior-year figure due to IAS 19R by + €1.5 million 2 Following adjustment of the prior-year figure due to IAS 19R by - €2.0 million 3 Following adjustment of the prior-year figure due to IAS 19R by + €0.5 million
140
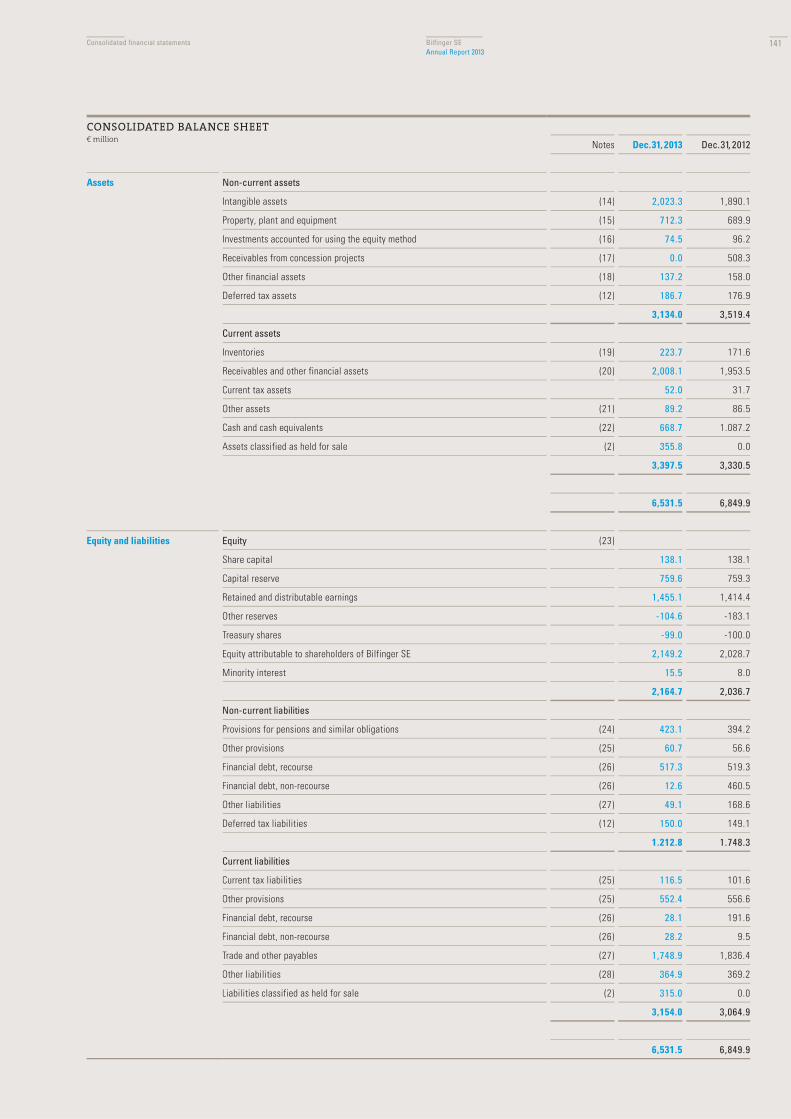
Bilfinger SEAnnual Report 2013
Consolidated financial statements
CONSOLIDATED BALANCE SHEET€ million
Notes Dec. 31, 2013 Dec. 31, 2012
Assets Non-current assets
Intangible assets (14) 2,023.3 1,890.1
Property, plant and equipment (15) 712.3 689.9
Investments accounted for using the equity method (16) 74.5 96.2
Receivables from concession projects (17) 0.0 508.3
Other financial assets (18) 137.2 158.0
Deferred tax assets (12) 186.7 176.9
3,134.0 3,519.4
Current assets
Inventories (19) 223.7 171.6
Receivables and other financial assets (20) 2,008.1 1,953.5
Current tax assets 52.0 31.7
Other assets (21) 89.2 86.5
Cash and cash equivalents (22) 668.7 1.087.2
Assets classified as held for sale (2) 355.8 0.0
3,397.5 3,330.5
6,531.5 6,849.9
Equity and liabilities Equity (23)
Share capital 138.1 138.1
Capital reserve 759.6 759.3
Retained and distributable earnings 1,455.1 1,414.4
Other reserves -104.6 -183.1
Treasury shares -99.0 -100.0
Equity attributable to shareholders of Bilfinger SE 2,149.2 2,028.7
Minority interest 15.5 8.0
2,164.7 2,036.7
Non-current liabilities
Provisions for pensions and similar obligations (24) 423.1 394.2
Other provisions (25) 60.7 56.6
Financial debt, recourse (26) 517.3 519.3
Financial debt, non-recourse (26) 12.6 460.5
Other liabilities (27) 49.1 168.6
Deferred tax liabilities (12) 150.0 149.1
1.212.8 1.748.3
Current liabilities
Current tax liabilities (25) 116.5 101.6
Other provisions (25) 552.4 556.6
Financial debt, recourse (26) 28.1 191.6
Financial debt, non-recourse (26) 28.2 9.5
Trade and other payables (27) 1,748.9 1,836.4
Other liabilities (28) 364.9 369.2
Liabilities classified as held for sale (2) 315.0 0.0
3,154.0 3,064.9
6,531.5 6,849.9
141
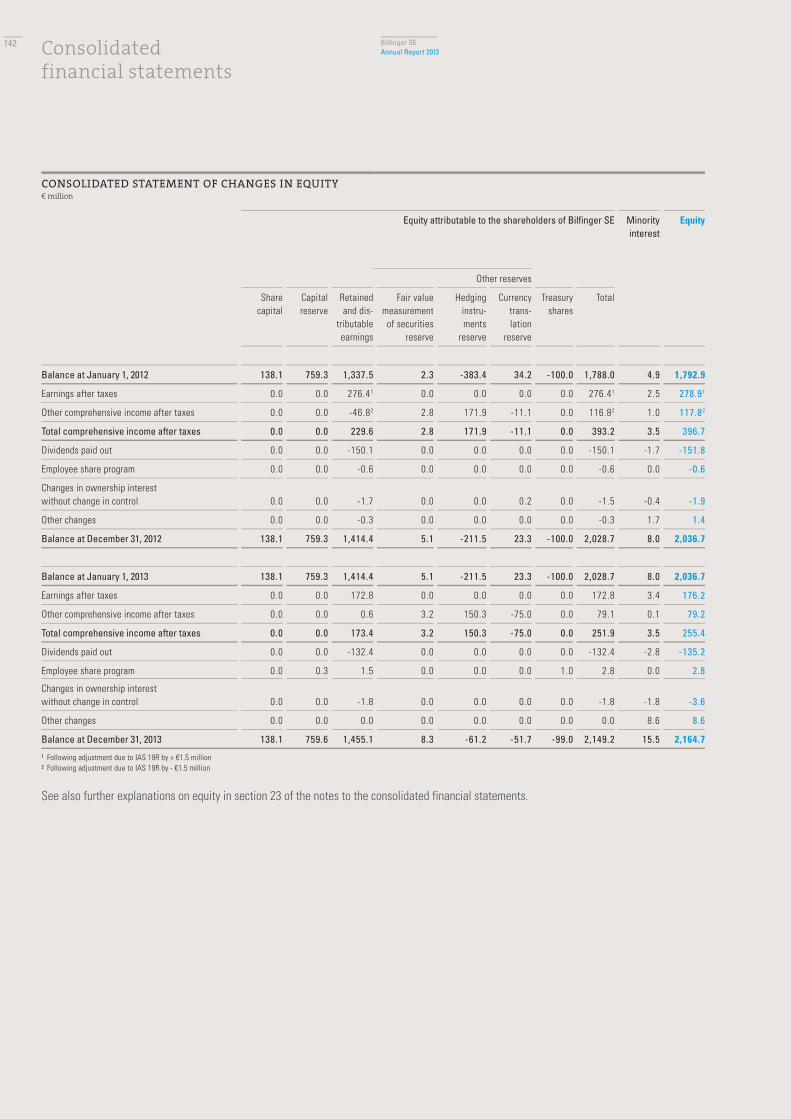
Bilfinger SEAnnual Report 2013
CONSOLIDATED STATEMENT OF CHANGES IN EQUITY€ million
Equity attributable to the shareholders of Bilfinger SE Minorityinterest
Equity
Other reserves
Share capital
Capital reserve
Retained and dis-
tributable earnings
Fair value measurement
of securities reserve
Hedging instru-ments
reserve
Currency trans-lation
reserve
Treasury shares
Total
Balance at January 1, 2012 138.1 759.3 1,337.5 2.3 -383.4 34.2 -100.0 1,788.0 4.9 1,792.9
Earnings after taxes 0.0 0.0 276.41 0.0 0.0 0.0 0.0 276.41 2.5 278.91
Other comprehensive income after taxes 0.0 0.0 -46.82 2.8 171.9 -11.1 0.0 116.82 1.0 117.82
Total comprehensive income after taxes 0.0 0.0 229.6 2.8 171.9 -11.1 0.0 393.2 3.5 396.7
Dividends paid out 0.0 0.0 -150.1 0.0 0.0 0.0 0.0 -150.1 -1.7 -151.8
Employee share program 0.0 0.0 -0.6 0.0 0.0 0.0 0.0 -0.6 0.0 -0.6
Changes in ownership interest without change in control 0.0 0.0 -1.7 0.0 0.0 0.2 0.0 -1.5 -0.4 -1.9
Other changes 0.0 0.0 -0.3 0.0 0.0 0.0 0.0 -0.3 1.7 1.4
Balance at December 31, 2012 138.1 759.3 1,414.4 5.1 -211.5 23.3 -100.0 2,028.7 8.0 2,036.7
Balance at January 1, 2013 138.1 759.3 1,414.4 5.1 -211.5 23.3 -100.0 2,028.7 8.0 2,036.7
Earnings after taxes 0.0 0.0 172.8 0.0 0.0 0.0 0.0 172.8 3.4 176.2
Other comprehensive income after taxes 0.0 0.0 0.6 3.2 150.3 -75.0 0.0 79.1 0.1 79.2
Total comprehensive income after taxes 0.0 0.0 173.4 3.2 150.3 -75.0 0.0 251.9 3.5 255.4
Dividends paid out 0.0 0.0 -132.4 0.0 0.0 0.0 0.0 -132.4 -2.8 -135.2
Employee share program 0.0 0.3 1.5 0.0 0.0 0.0 1.0 2.8 0.0 2.8
Changes in ownership interest without change in control 0.0 0.0 -1.8 0.0 0.0 0.0 0.0 -1.8 -1.8 -3.6
Other changes 0.0 0.0 0.0 0.0 0.0 0.0 0.0 0.0 8.6 8.6
Balance at December 31, 2013 138.1 759.6 1,455.1 8.3 -61.2 -51.7 -99.0 2,149.2 15.5 2,164.7
1 Following adjustment due to IAS 19R by + €1.5 million 2 Following adjustment due to IAS 19R by - €1.5 million
See also further explanations on equity in section 23 of the notes to the consolidated financial statements.
Consolidatedfinancial statements
142

Bilfinger SEAnnual Report 2013
Consolidated financial statements
CONSOLIDATED STATEMENT OF CASH FLOWS€ million Notes 2013 2012
Earnings after taxes from continuing operations 172.5 245.4
Depreciation, amortization and impairments 192.8 174.7
Decrease in non-current provisions and liabilities -33.3 -5.4
Deferred tax expense / benefit -29.3 19.4
Adjustment for non-cash income from equity-method investments -13.3 -14.8
Cash earnings from continuing operations 289.4 419.3
Increase / decrease in inventories -19.2 29.0
Decrease / increase in receivables 4.1 -87.3
Increase / decrease in current provisions 6.3 -76.4
Decrease / increase in liabilities -90.4 0.5
Change in working capital -99.2 -134.2
Gains on disposals of non-current assets -28.6 -52.7
Cash flow from operating activities of continuing operations (33) 161.6 232.4
Proceeds from the disposal of intangible assets 1.0 0.0
Proceeds from the disposal of property, plant and equipment 16.1 17.3
Proceeds from the disposal of subsidiaries net of cash and cash equivalents disposed of 4.6 37.0
Proceeds from the disposal of concession projects 170.9 270.3
Disposal of cash and cash equivalents classified as assets held for sale -7.3 -77.7
Proceeds from the disposal of other financial assets 32.2 25.3
Investments in intangible assets -13.6 -12.2
Investments in property, plant and equipment -156.7 -130.3
Acquisition of subsidiaries net of cash and cash equivalents acquired -246.4 -377.7
Investments in other financial assets -3.8 -0.5
Cash flow from investing activities of continuing operations (33) -203.0 -248.5
Issue of treasury shares as part of the employee share program 1.2 0.0
Dividend paid to the shareholders of Bilfinger SE -132.4 -150.1
Dividend paid to minority interest -6.2 -1.7
Proceeds from changes in ownership interest without change in control 0.2 0.0
Investments resulting in changes in ownership interest without change in control -3.8 0.0
Borrowing 38.4 524.6
Repayment of financial debt -193.3 -37.8
Cash flow from financing activities of continuing operations -295.9 335.0
Change in cash and cash equivalents of continuing operations -337.3 318.9
Cash flow from operating activities of discontinued operations (33) -22.4 -127.5
Cash flow from investing activities of discontinued operations (33) -23.3 -23.7
Change in cash and cash equivalents of discontinued operations -45.7 -151.2
Change in value of cash and cash equivalents due to changes in foreign exchange rates -13.2 5.2
Cash and cash equivalents at January 1 1,087.2 846.6
Cash and cash equivalents classified as assets held for sale (Concessions) at January 1 (+) 0.0 67.7
Cash and cash equivalents classified as assets held for sale (Concessions) at December 31 (-) 22.4 0.0
Cash and cash equivalents at December 31 668.6 1,087.2
143

Bilfinger SEAnnual Report 2013Notes to the consolidated
financial statements 2013
Segment reporting
As in the previous year, segment reporting has been prepared in accordance with IFRS 8. The reportable segments of the Bilfinger Group reflect the internal reporting structure. Segment reporting depicts the Group’s continuing operations. The definition of the segments is based on products and services.
Description of reportable segments:
Industrial The segment Industrial comprises services for the design, construction, maintenance and modernization of plants, primarily for in-dustrial sectors including oil and gas, refineries and petrochemicals, chemicals and agrochemicals, pharmaceuticals, food and beverages, power generation, and steel and aluminum. The range of services covers consulting, engineering, project management, piping and component engineer-ing, plant assembly, mechanical engineering, electrical, instrumentation and control technology, process engineering, insulation, scaffolding and corrosion protection. Important regions include Europe, USA and Asia.
Power The segment Power comprises maintenance, repair, efficiency enhancements, service life extensions and demolition of existing plants as well as the design, manufacture and assembly of components for power plant construction with a focus on boilers and high-pressure piping sys-tems. Services include engineering, delivery, assembly and commissioning of power plant facilities throughout their entire lifecycles (construction, operation, demolition). Important regions include Europe, South Africa and the Middle East.
Building and Facility The Building and Facility business segment includes technical, commercial and infrastructural real-estate services in Europe, USA and MENA countries as well as worldwide services in water and wastewater technology. The Group manages all kinds of facilities. In Ger-many, it offers development, design, management and construction services for real estate as well as the organization of construction logistics. All of these services are consistently aligned to the entire lifecycles of the properties. As a result of close cooperation among the business segment’s specialists in design, construction and operation, Bilfinger is able to execute sustainable, energy-saving and value-optimized real-estate projects.
Construction The Construction segment is comprised of the Group’s civil-engineering activities. Bilfinger has positioned itself as a specialist for intelligent civil-engineering services in the areas of mobility and energy. The focal points in the area of mobility are waterways, steel bridges, tun-nels, urban railways and tramways, and noise protection barriers. In the area of energy, the Group concentrates on foundations for offshore wind parks and overhead power lines. In addition, foundation engineering, prestressing and geo-technology, steel construction, structural maintenance and formwork are all included in the service range. Civil engineering activities are focused on Germany and other European countries.
Notes to the consolidated financial statements 2013
144

Bilfinger SEAnnual Report 2013
Notes to the consolidated financial statementsSegment reporting
‘Earnings before interest, taxes and amortization of intangible assets from acquisitions’ (EBITA) is the key performance indicator for the business units and the Group, and thus the metric for earnings in our segment reporting. EBIT is also reported. The reconciliation of EBIT to earnings before taxes from continuing operations is derived from the consolidated income statement. Internal revenue reflects the supply of goods and services between the segments. These are invoiced at the usual market prices. In the reconciliation to the consolidated financial statements, the Group’s internal expenses and income as well as intra-Group profits are eliminated. Consolidation includes the consolidation of business transactions between the business segments. The reconciliation also includes income and expenses from headquarters as well as other items that cannot be allocated to the individual segments according to our accounting policies. The allocation of external revenue to the regions is carried out according to the location of the service provision.
The reconciliation of segment assets also includes cash and cash equivalents as well as the non-current and current assets that are not allocated to the business segments. The segment liabilities shown in the reconciliation include the liabilities of Group headquarters and interest-bearing liabilities such as debt and provisions for pensions and similar obligations. Accordingly, the corresponding expense and income items are not recorded in segment earnings (EBITA). Investments in property, plant and equipment also include investments in intangible assets such as licenses or software of €13.6 million (2012: €12.2 million).
145
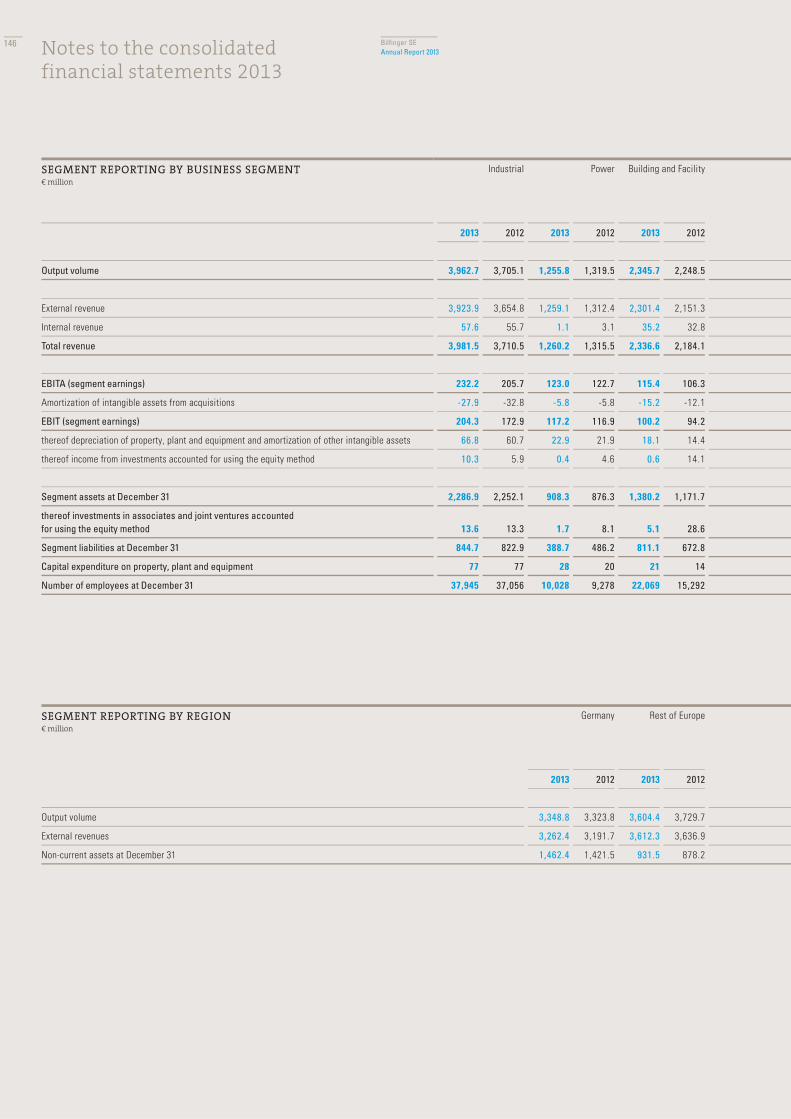
Bilfinger SEAnnual Report 2013
SEGMENT REPORTING BY REGION€ million
Germany Rest of Europe
2013 2012 2013 2012
Output volume 3,348.8 3,323.8 3,604.4 3,729.7
External revenues 3,262.4 3,191.7 3,612.3 3,636.9
Non-current assets at December 31 1,462.4 1,421.5 931.5 878.2
SEGMENT REPORTING BY BUSINESS SEGMENT€ million
Industrial Power Building and Facility
2013 2012 2013 2012 2013 2012
Output volume 3,962.7 3,705.1 1,255.8 1,319.5 2,345.7 2,248.5
External revenue 3,923.9 3,654.8 1,259.1 1,312.4 2,301.4 2,151.3
Internal revenue 57.6 55.7 1.1 3.1 35.2 32.8
Total revenue 3,981.5 3,710.5 1,260.2 1,315.5 2,336.6 2,184.1
EBITA (segment earnings) 232.2 205.7 123.0 122.7 115.4 106.3
Amortization of intangible assets from acquisitions -27.9 -32.8 -5.8 -5.8 -15.2 -12.1
EBIT (segment earnings) 204.3 172.9 117.2 116.9 100.2 94.2
thereof depreciation of property, plant and equipment and amortization of other intangible assets 66.8 60.7 22.9 21.9 18.1 14.4
thereof income from investments accounted for using the equity method 10.3 5.9 0.4 4.6 0.6 14.1
Segment assets at December 31 2,286.9 2,252.1 908.3 876.3 1,380.2 1,171.7
thereof investments in associates and joint ventures accounted for using the equity method 13.6 13.3 1.7 8.1 5.1 28.6
Segment liabilities at December 31 844.7 822.9 388.7 486.2 811.1 672.8
Capital expenditure on property, plant and equipment 77 77 28 20 21 14
Number of employees at December 31 37,945 37,056 10,028 9,278 22,069 15,292
Notes to the consolidated financial statements 2013
146
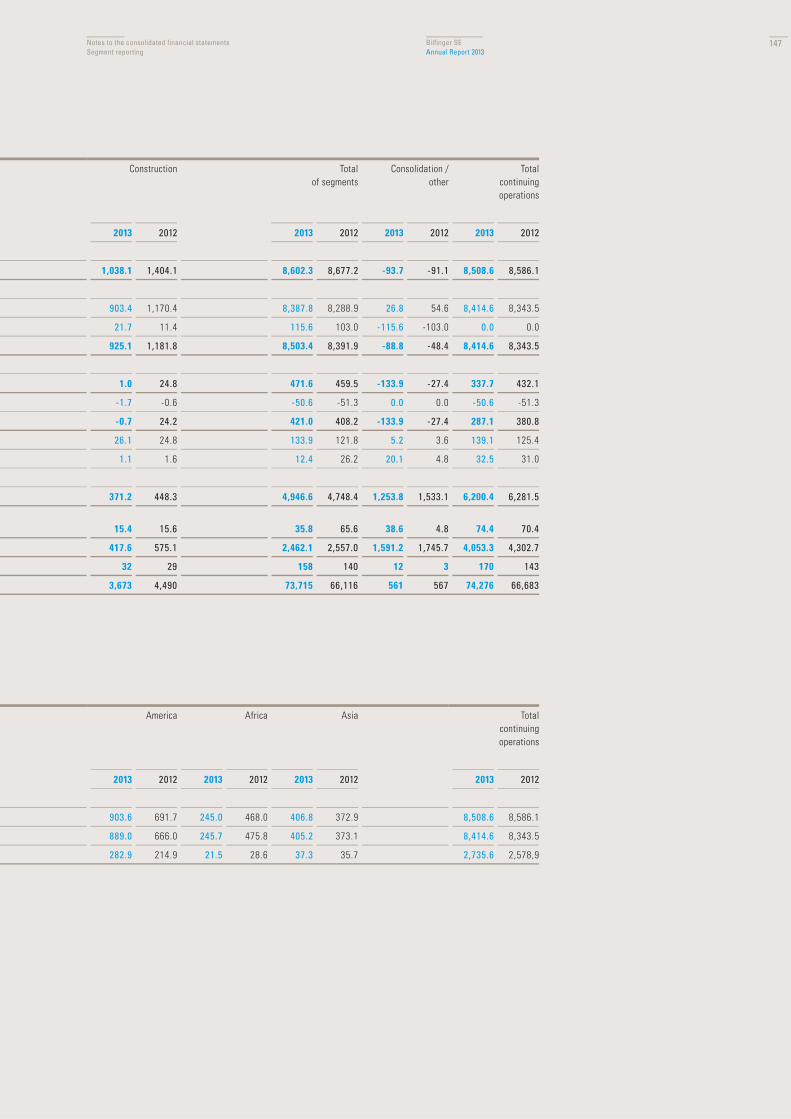
Bilfinger SEAnnual Report 2013
Notes to the consolidated financial statementsSegment reporting
America Africa Asia Totalcontinuing
operations
2013 2012 2013 2012 2013 2012 2013 2012
903.6 691.7 245.0 468.0 406.8 372.9 8,508.6 8,586.1
889.0 666.0 245.7 475.8 405.2 373.1 8,414.6 8,343.5
282.9 214.9 21.5 28.6 37.3 35.7 2,735.6 2,578,9
Construction Totalof segments
Consolidation /other
Totalcontinuing
operations
2013 2012 2013 2012 2013 2012 2013 2012
1,038.1 1,404.1 8,602.3 8,677.2 -93.7 -91.1 8,508.6 8,586.1
903.4 1,170.4 8,387.8 8,288.9 26.8 54.6 8,414.6 8,343.5
21.7 11.4 115.6 103.0 -115.6 -103.0 0.0 0.0
925.1 1,181.8 8,503.4 8,391.9 -88.8 -48.4 8,414.6 8,343.5
1.0 24.8 471.6 459.5 -133.9 -27.4 337.7 432.1
-1.7 -0.6 -50.6 -51.3 0.0 0.0 -50.6 -51.3
-0.7 24.2 421.0 408.2 -133.9 -27.4 287.1 380.8
26.1 24.8 133.9 121.8 5.2 3.6 139.1 125.4
1.1 1.6 12.4 26.2 20.1 4.8 32.5 31.0
371.2 448.3 4,946.6 4,748.4 1,253.8 1,533.1 6,200.4 6,281.5
15.4 15.6 35.8 65.6 38.6 4.8 74.4 70.4
417.6 575.1 2,462.1 2,557.0 1,591.2 1,745.7 4,053.3 4,302.7
32 29 158 140 12 3 170 143
3,673 4,490 73,715 66,116 561 567 74,276 66,683
147

Bilfinger SEAnnual Report 2013
General information
Bilfinger SE is a listed stock corporation with its registered office and headquarters at Carl-Reiss-Platz 1-5, 68165 Mannheim, Germany. As an engineering and services group, Bilfinger develops, constructs, maintains and operates plant and buildings for infrastructure, real estate,
industry and the energy sector. The consolidated financial statements of Bilfinger SE for financial year 2013 were released for publication by the Executive Board on
March 13, 2014. The consolidated financial statements of Bilfinger SE have been prepared in accordance with International Financial Reporting Standards
(IFRSs), as they are to be applied in the European Union, and the complementary guidelines that are applicable pursuant to Section 315a Subsection 1 of the German Commercial Code (HGB), and are published in the electronic version of the German Federal Gazette (‘Bundesanzeiger’).
The consolidated financial statements have been prepared in accordance with the principles of historical cost of acquisition and production, with the exception of individual items such as available-for-sale financial assets and derivative financial instruments, which are shown at fair value. The consolidated financial statements have been prepared in euros. All amounts are shown in millions of euros (€ million), unless otherwise stated.
To improve the clarity of presentation, we have combined several individual items of the balance sheet and of the income statement under single headings; they are shown separately and explained in these notes to the consolidated financial statements.
The income statement is presented according to the cost-of-sales method.Profit contributions from operating investments are generally entered under other operating income or other operating expense, whereby
amounts of income and expense that relate to investments accounted for using the equity method are shown as separate items in the consolidated income statement.
On September 19, 2011, Bilfinger resolved to introduce a publicly listed fund into which it would place 18 public-private partnership projects from its Concessions business segment. With the expiry of the subscription period on December 13, 2011, all of the shares in the Bilfinger Berger Global Infrastructure Fund (BBGI) had been placed. The initial listing of the fund followed on December 21, 2011 in the premium segment of the London Stock Exchange. The sale of the projects to the fund was carried out over the course of the financial year 2012. The assets and liabilities of the project companies were classified as ‘held for sale’ and presented separately in the balance sheet of December 31, 2011.
On May 15, 2013, the Executive Board of Bilfinger SE decided to discontinue the activities in the Concessions business segment. On November 15, 2013, an agreement was signed with the infrastructure fund BBGI, which is listed on the London Stock Exchange, on the acquisition by BBGI of the projects offered for sale by Bilfinger. In addition, Bilfinger’s interest in the German A1 highway project, which is accounted for using the equity method, was classified as held for sale on December 20, 2013 and was also presented under discontinued operations.
The investments not held for sale continue to be presented as continuing operations. In segment reporting they are presented under ‘Consolida-tion / other’. This primarily relates to two transport infrastructure concession projects accounted for using the equity method.
In accordance with the provisions of IFRS 5, the investments held for sale were presented as discontinued operations as of the time of reclas-sification (for further information, see Note 2 Discontinued operations):
__ In the consolidated balance sheet the affected assets and liabilities (disposal group) are presented separately under ‘Assets classified as held for sale’ and ‘Liabilities classified as held for sale’.
__ In the consolidated income statement, the income and expenses of discontinued operations are presented separately from the income and expenses of continuing operations, and are summarized separately in one item as earnings after taxes from discontinued operations.
__ In the consolidated statement of cash flows, cash flows from discontinued operations are also presented separately from the cash flows from continuing operations.
__ The Concessions business segment is no longer presented in segment reporting.
General notes
Notes to the consolidated financial statements 2013
148

Bilfinger SEAnnual Report 2013
Notes to the consolidated financial statementsGeneral notes
Since the dates of reclassification (May 15, 2013 and December 20, 2013), non-current assets classified as held for sale have no longer been subject to systematic depreciation or amortization and subsequent measurement according to the equity method was ceased for the investments accounted for using the equity method.
Accounting policies
The significant accounting policies applied generally correspond with those applied in the prior year, with the following exceptions:
The amended and new IFRSs relevant to Bilfinger and applied as of January 1, 2013 are:
__ IFRS 7 Financial Instruments: Disclosures __ IFRS 13 Fair Value Measurement__ IAS 1 Presentation of Financial Statements__ IAS 19 Employee Benefits__ IAS 36 Impairment of Assets__ Improvements to IFRSs 2009-2011
The effects of these changes are as follows:
IFRS 7 Financial Instruments: DisclosuresWithin the scope of the amendment to IAS 32 regarding offsetting financial assets and financial liabilities, amendments to IFRS 7 were published which lead to an expansion of disclosures for the presentation of netting agreements. Those disclosures have been included in the notes to the consolidated financial statements.
IFRS 13 Fair Value MeasurementIFRS 13 for the first time sets out a uniform framework for the measurement of fair value, which is applied in various IFRSs (financial instruments, business combinations, disposal groups, changes in ownership interests with a change in control, investment property), and extends the disclo-sures required in the notes to the consolidated financial statements. Initial application has no significant effects on the financial statements.
IAS 1 Presentation of Financial StatementsThe amendment to IAS 1 ‘Presentation of items of other comprehensive income’ revises the presentation of other comprehensive income (OCI) of the period in the statement of comprehensive income. OCI is divided into items that are reclassified into profit or loss in following periods (gains / losses on the fair-value measurement of securities, gains / losses on hedging transactions, gains / losses on currency translation differences) and items that are not reclassified into profit or loss (actuarial gains / losses).
IAS 19 Employee BenefitsThe revised version of IAS 19 states that gains and losses from the remeasurement of the net defined benefit liability may only be recognized directly in equity (other comprehensive income). This corresponds to the method that has been applied to date in the Bilfinger Group. In addition, income due to the expected return on plan assets may only be recognized in the amount of the discount rate used for determining the defined benefit liability (net interest method). The amended regulations are to be applied retrospectively. Accordingly, this resulted in a shift between reserves from gains and losses from the remeasurement of the net defined benefit liability and other retained earnings in the amount of €10.9 million. In addition, this led to an improvement in the net interest result in the prior-year period of €2.0 million and to a corresponding increase in the loss from the remeasurement of the net defined benefit liability (asset) in other comprehensive income before taxes. For the prior-year, the income statement, the statement of comprehensive income and the consolidated statement of changes in equity have been adjusted accordingly. The change in method had no influence on the amount of the provisions for pensions and similar obligations presented in the balance sheet and no material influence on the reporting year’s profit or loss.
149

Bilfinger SEAnnual Report 2013
IAS 36 Impairment of AssetsThe amendment to IAS 36 includes minor adjustment to the disclosure of the recoverable amounts of non-financial assets. In particular, according to this amendment, the recoverable amount is only to be stated for the cash-generating units with significant goodwill for which an impairment or impairment reversal was recognized in the reporting year. This amendment must be applied at the latest for annual periods beginning on or after January 1, 2014. Bilfinger is applying the amendment earlier.
Improvements to IFRSs 2009-2011Improvements to the collected standards published in the context of the annual update include improvements to several IFRSs, mainly to remove inconsistencies and to clarify wording. The changes have not led to any effects.
IFRSs already published but not yet applied:
IFRS 7 Financial Instruments: DisclosuresThe amendments to IFRS 7 relate to disclosures on transition to IFRS 9 (no date yet set for first application).
IFRS 9 Financial InstrumentsThe new standard will replace IAS 39 Financial Instruments: Recognition and Measurement. The objective of IFRS 9 is to simplify the classifica-tion and measurement requirements for financial instruments. So far, regulations on the classification and measurement of financial instruments and hedge accounting have been published. Regulations on impairment and minor changes to classification and measurement will probably be published in 2014 (no date yet set for first application).
IFRS 10 Consolidated Financial StatementsIFRS 10 harmonizes the currently valid consolidation principles of IAS 27 and SIC-12. The uniform consolidation model includes all entities that are controlled by the parent by means of voting rights or other contractual arrangements (first application for annual periods beginning on or after January 1, 2014). The subsidiaries of Bilfinger are generally companies for which the voting-rights majority is the most important indicator of control and no other contractual arrangements exist. The new regulations are therefore unlikely to lead to any changes in Bilfinger’s consolidated group and thus will have no significant impact on the Group’s financial position, cash flows or profitability.
IFRS 11 Joint Arrangements IFRS 11 replaces the currently valid principles on accounting for jointly controlled entities, jointly controlled assets and operations of IAS 31. The focus of IFRS 11 is no longer on the legal form of the joint arrangement, but on the way in which rights and obligations are shared among the parties to the arrangement on the basis of contracts, articles of incorporation and other agreements (first application for annual periods beginning on or after January 1, 2014). Joint ventures are accounted for using the equity method, in accordance with IAS 31. IFRS 11 has no impact on classification.
IFRS 12 Disclosure of Interests in Other EntitiesIFRS 12 brings the disclosure requirements concerning all interests in subsidiaries, joint arrangements and associates as well as unconsolidated structured entities into one standard, and extends the disclosures required in the notes to the consolidated financial statements (first application for annual periods beginning on or after January 1, 2014).
IAS 19 Employee BenefitsThe amendment to IAS 19 introduces a simplification rule regarding the consideration of employee contributions in connection with defined benefit pension obligations which are made irrespective of the number of years worked (first application for annual periods beginning on or after January 1, 2014).
Notes to the consolidated financial statements 2013
150

Bilfinger SEAnnual Report 2013
Notes to the consolidated financial statementsGeneral notes
IAS 28 Investments in Associates and Joint VenturesThe amendment to IAS 28 extends the scope of the currently valid IAS 28 Investments in Associates with the addition of accounting for joint arrangements using the equity method. The standard has been renamed accordingly as Investments in Associates and Joint Ventures (first application for annual periods beginning on or after January 1, 2014).
IAS 32 Financial Instruments: PresentationThe amendment to IAS 32 explains the conditions for offsetting financial instruments. The rules clarify the importance of the current legal right to offset and the conditions under which systems with gross offsetting can be regarded as net offsetting (first application for annual periods begin-ning on or after January 1, 2014).
IAS 39 Financial Instruments: Recognition and MeasurementThe amendment to IAS 39 Novation of Derivatives introduces a rule for reasons of simplicity by which hedge accounting need not be discontinued if a hedging derivative is novated to a central counterparty and meets certain criteria (first application for annual periods beginning on or after January 1, 2014).
IFRIC 21 LeviesIFRIC 21 regulates the accounting of all levies that are not within the scope of IAS 12 Income Taxes. IFRIC 21 clarifies that an entity is to recognize a liability for a levy when the obligating event that triggers payment, as identified by the relevant legislation, occurs (first application for annual periods beginning on or after January 1, 2014).
Improvements to IFRSs 2010-2012 and Improvements to IFRSs 2011-2013Improvements to the collected standards published in the context of the annual update include improvements to several IFRSs, mainly to remove inconsistencies and to clarify wording.
At the end of the reporting period, IFRS 9 with the corresponding amendments to IFRS 7, IFRIC 21, the amendment to IAS 19 regarding employee contributions in connection with defined benefit pension plans as well as improvements to IFRSs 2010-2012 and 2011-2013 had not yet been endorsed by the EU Commission. The future application of the standards is unlikely to have any material effect on the financial position, cash flows or profitability of the Bilfinger Group. Bilfinger intends to apply those IFRSs as of the mandatory date of application insofar as they have been endorsed.
151

Bilfinger SEAnnual Report 2013
1. Consolidated Group
In addition to Bilfinger SE, four Subgroups and 66 companies in Germany along with two Subgroups and 71 companies based outside Germany have been included in the consolidated financial statements. Of these, eleven companies in Germany and nine companies based outside Germany have been consolidated for the first time in the year under review. A further 14 companies have been accounted for using the equity method.
In general, all subsidiaries are fully consolidated with the exception of, in particular, inactive companies such as shelf companies and compa-nies in liquidation. Subsidiaries are all companies that are controlled directly or indirectly by Bilfinger SE. Control generally exists when Bilfinger has more than half of the voting rights of a company or when Bilfinger, as an exception, is able in another way to govern a company’s financial and business policy so as to obtain benefits from its activities. When assessing whether or not control exists, currently exercisable potential voting rights are also taken into consideration.
Associates are accounted for using the equity method. An associate is a company over which the Group has significant influence by partici-pating in its financial and business policy but which is not controlled by the Group. Significant influence is generally presumed when Bilfinger has voting rights of 20 percent or more.
Joint ventures are also accounted for using the equity method. A joint venture exists if the owners contractually agree to control the company jointly, i.e. the relevant strategic, financial and operating decisions require the unanimous consent of all owners.
Information disclosed pursuant to Section 313 Subsection 2 of the German Commercial Code (HGB) is summarized in a separate list of equity interests. That list also includes a definitive list of all subsidiaries that make use of the disclosure exemption pursuant to Section 264 Subsection 3 HGB.
Acquisitions In financial year 2013, payments of €191 million were made for the acquisitions of fully consolidated companies – after offsetting €37 million in acquired cash and cash equivalents. The purchase price for these companies amounts to €231 million, of which €3 million has been recognized as a purchase-price liability.
In addition, payments of €32 million were made for the acquisition of minority interests, which had been recognized as liabilities in accordance with IAS 32. Payments in the amount of €2 million for successive acquisitions and €19 million for earn-out liabilities recognized in the prior year were also made. Subsequent costs of acquisition for equity interests amounted to €2 million.
Overall, this led to an outflow of cash and cash equivalents in the amount of €246 million.With effect as of January 9, 2013, we acquired Helmut Mauell GmbH, Velbert, Wuppertal, for a price of €7 million. This specialist for power
plant control technology has 460 employees and annual output volume of approximately €65 million.With effect as of February 26, 2013, we acquired the American water technology specialist Johnson Screens Inc., New Brighton, Minnesota,
for a price of €103 million. The company was founded in 1904; it has approximately 1,200 employees and annual output volume of approximately €165 million.
With effect as of March 22, 2013, we acquired GreyLogix GmbH, Flensburg, for a price of €14 million. This specialist for automation technology generates annual output volume of €45 million with a workforce of 300 persons.
Effective December 13, 2013, we acquired Europa Support Services Ltd., Manchester, United Kingdom, for a price of €76 million. This facility management company with a focus on the British and Irish markets generates output volume of €190 million with a workforce of 3,300 people. The purchase price allocation is provisional due to the short period of time between the acquisition and the end of the reporting period. Changes may occur with regard to intangible assets and deferred taxes.
In financial year 2012, payments of €363 million were made for the acquisition of fully consolidated companies – after offsetting €31 million in acquired cash and cash equivalents. The purchase price for these companies amounts to €458 million. Of that total, €64 million was recognized on the basis of current earnings planning for earn-out liabilities.
In addition, payments of €11 million were made for the acquisition of minority interests, which had been recognized as liabilities in accordance with IAS 32. Payments in the amount of €2 million for successive acquisitions and €1 million for earn-out liabilities recognized in the prior year were also made.
Overall, this led to an outflow of cash and cash equivalents in the amount of €378 million.In the Industrial business segment at the beginning of financial year 2012, we acquired 98 percent of shares in Neo Structo Construction Pri-
vate Ltd., located in Surat, India, for a purchase price of €47 million. The company had 1,600 employees and annual output volume of €60 million. Effective April 1, 2012, we acquired the Dutch company Tebodin B.V., The Hague, for a price of €146 million. The consulting and engineering company had 3,200 employees and output volume of €225 million. With effect from the end of July, 2012, we acquired American assembly and
Notes to the consolidated financial statements 2013
152
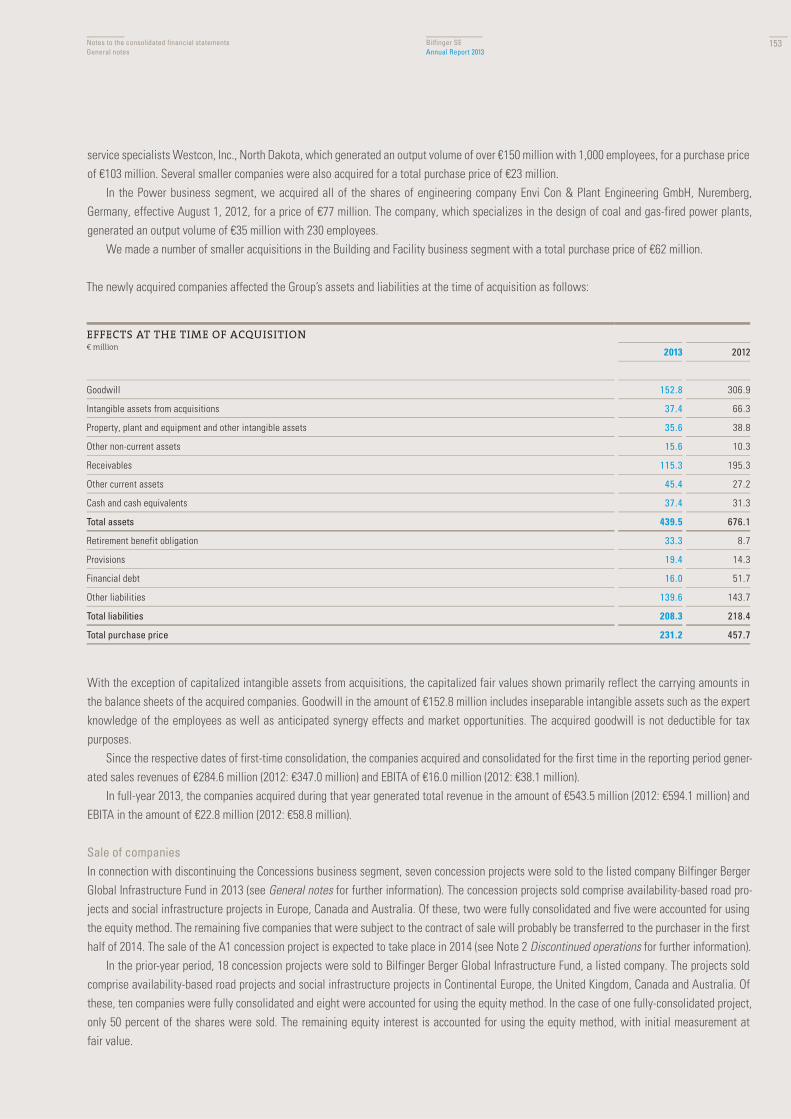
Bilfinger SEAnnual Report 2013
Notes to the consolidated financial statementsGeneral notes
service specialists Westcon, Inc., North Dakota, which generated an output volume of over €150 million with 1,000 employees, for a purchase price of €103 million. Several smaller companies were also acquired for a total purchase price of €23 million.
In the Power business segment, we acquired all of the shares of engineering company Envi Con & Plant Engineering GmbH, Nuremberg, Germany, effective August 1, 2012, for a price of €77 million. The company, which specializes in the design of coal and gas-fired power plants, generated an output volume of €35 million with 230 employees.
We made a number of smaller acquisitions in the Building and Facility business segment with a total purchase price of €62 million.
The newly acquired companies affected the Group’s assets and liabilities at the time of acquisition as follows:
With the exception of capitalized intangible assets from acquisitions, the capitalized fair values shown primarily reflect the carrying amounts in the balance sheets of the acquired companies. Goodwill in the amount of €152.8 million includes inseparable intangible assets such as the expert knowledge of the employees as well as anticipated synergy effects and market opportunities. The acquired goodwill is not deductible for tax purposes.
Since the respective dates of first-time consolidation, the companies acquired and consolidated for the first time in the reporting period gener-ated sales revenues of €284.6 million (2012: €347.0 million) and EBITA of €16.0 million (2012: €38.1 million).
In full-year 2013, the companies acquired during that year generated total revenue in the amount of €543.5 million (2012: €594.1 million) and EBITA in the amount of €22.8 million (2012: €58.8 million).
Sale of companies In connection with discontinuing the Concessions business segment, seven concession projects were sold to the listed company Bilfinger Berger Global Infrastructure Fund in 2013 (see General notes for further information). The concession projects sold comprise availability-based road pro-jects and social infrastructure projects in Europe, Canada and Australia. Of these, two were fully consolidated and five were accounted for using the equity method. The remaining five companies that were subject to the contract of sale will probably be transferred to the purchaser in the first half of 2014. The sale of the A1 concession project is expected to take place in 2014 (see Note 2 Discontinued operations for further information).
In the prior-year period, 18 concession projects were sold to Bilfinger Berger Global Infrastructure Fund, a listed company. The projects sold comprise availability-based road projects and social infrastructure projects in Continental Europe, the United Kingdom, Canada and Australia. Of these, ten companies were fully consolidated and eight were accounted for using the equity method. In the case of one fully-consolidated project, only 50 percent of the shares were sold. The remaining equity interest is accounted for using the equity method, with initial measurement at fair value.
EFFECTS AT THE TIME OF ACQUISITION€ million 2013 2012
Goodwill 152.8 306.9
Intangible assets from acquisitions 37.4 66.3
Property, plant and equipment and other intangible assets 35.6 38.8
Other non-current assets 15.6 10.3
Receivables 115.3 195.3
Other current assets 45.4 27.2
Cash and cash equivalents 37.4 31.3
Total assets 439.5 676.1
Retirement benefit obligation 33.3 8.7
Provisions 19.4 14.3
Financial debt 16.0 51.7
Other liabilities 139.6 143.7
Total liabilities 208.3 218.4
Total purchase price 231.2 457.7
153
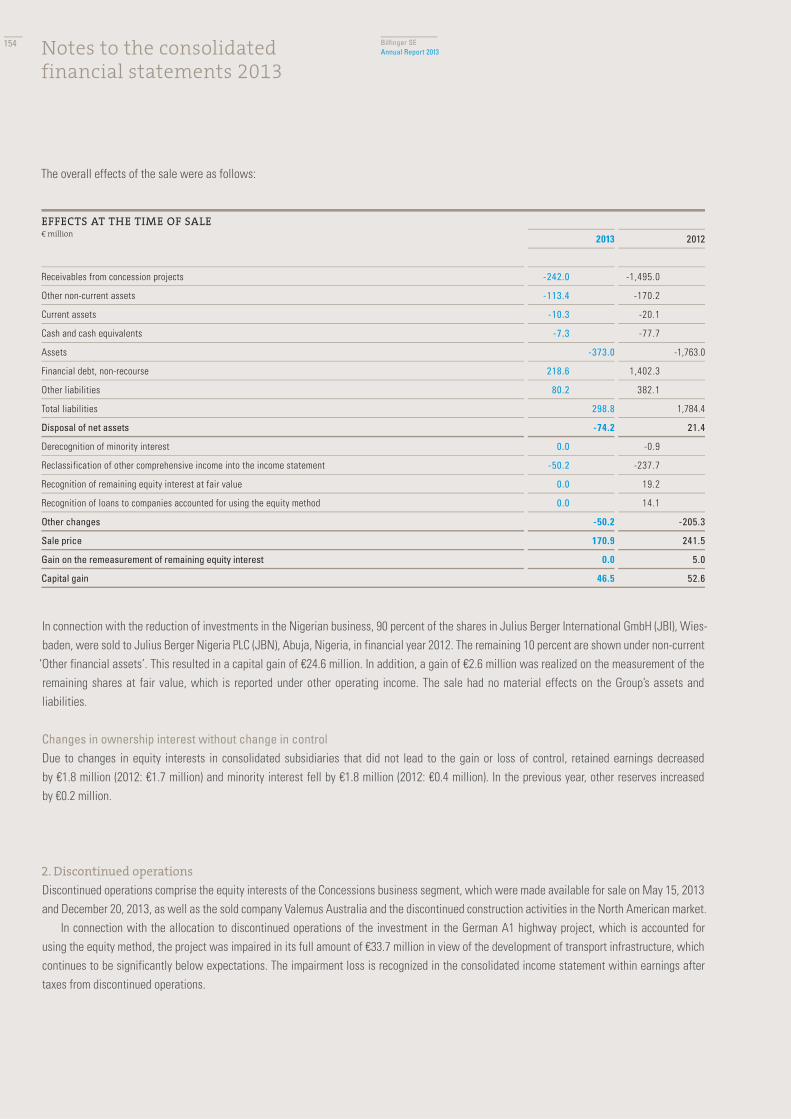
Bilfinger SEAnnual Report 2013
The overall effects of the sale were as follows:
In connection with the reduction of investments in the Nigerian business, 90 percent of the shares in Julius Berger International GmbH (JBI), Wies-baden, were sold to Julius Berger Nigeria PLC (JBN), Abuja, Nigeria, in financial year 2012. The remaining 10 percent are shown under non-current
‘Other financial assets’. This resulted in a capital gain of €24.6 million. In addition, a gain of €2.6 million was realized on the measurement of the remaining shares at fair value, which is reported under other operating income. The sale had no material effects on the Group’s assets and liabilities.
Changes in ownership interest without change in control Due to changes in equity interests in consolidated subsidiaries that did not lead to the gain or loss of control, retained earnings decreased by €1.8 million (2012: €1.7 million) and minority interest fell by €1.8 million (2012: €0.4 million). In the previous year, other reserves increased by €0.2 million.
2. Discontinued operations
Discontinued operations comprise the equity interests of the Concessions business segment, which were made available for sale on May 15, 2013 and December 20, 2013, as well as the sold company Valemus Australia and the discontinued construction activities in the North American market.
In connection with the allocation to discontinued operations of the investment in the German A1 highway project, which is accounted for using the equity method, the project was impaired in its full amount of €33.7 million in view of the development of transport infrastructure, which continues to be significantly below expectations. The impairment loss is recognized in the consolidated income statement within earnings after taxes from discontinued operations.
EFFECTS AT THE TIME OF SALE€ million 2013 2012
Receivables from concession projects -242.0 -1,495.0
Other non-current assets -113.4 -170.2
Current assets -10.3 -20.1
Cash and cash equivalents -7.3 -77.7
Assets -373.0 -1,763.0
Financial debt, non-recourse 218.6 1,402.3
Other liabilities 80.2 382.1
Total liabilities 298.8 1,784.4
Disposal of net assets -74.2 21.4
Derecognition of minority interest 0.0 -0.9
Reclassification of other comprehensive income into the income statement -50.2 -237.7
Recognition of remaining equity interest at fair value 0.0 19.2
Recognition of loans to companies accounted for using the equity method 0.0 14.1
Other changes -50.2 -205.3
Sale price 170.9 241.5
Gain on the remeasurement of remaining equity interest 0.0 5.0
Capital gain 46.5 52.6
Notes to the consolidated financial statements 2013
154

Bilfinger SEAnnual Report 2013
Notes to the consolidated financial statementsGeneral notes
Earnings from discontinued operations are comprised as follows:
Earnings after taxes from discontinued operations were fully attributable to the shareholders of Bilfinger SE, with the exception of €0.4 million (2012: €0.6 million).
The discontinued operations of the Concessions business segment, which are presented as a disposal group, are the investments not yet transferred to the purchaser and the German A1 highway project (see General notes and Note 1 Consolidated group – Sale of companies for more information). These concession projects comprise road projects, schools, prisons and public administrative buildings in Europe, Australia and the United States. Of these, three were fully consolidated and three were accounted for using the equity method.
The assets and liabilities of the disposal group classified as held for sale are comprised as follows:
The accumulated other comprehensive income after taxes of the disposal group amounts to €-26.5 million, of which €0.1 million was attributable to minority interest.
€ million
Dec. 31, 2013 Dec. 31, 2012
Receivables from concession projects 285.1 0.0
Other non-current assets 28.5 0.0
Current assets 19.8 0.0
Cash and cash equivalents 22.4 0.0
Assets classified as held for sale 355.8 0.0
Financial debt, non-recourse 284.1 0.0
Other liabilities 30.9 0.0
Liabilities classified as held for sale 315.0 0.0
€ million
2013 2012
Output volume (for information only) 38.5 49.0
Revenue 123.6 165.3
Expenses / income -135.2 -170.9
Impairment loss -33.7 -12.9
Gain on the sale of concession projects 46.5 52.6
EBIT 1.2 34.1
Net interest result 1.4 1.9
Earnings before taxes 2.6 36.0
Income tax expense 1.1 -2.4
Earnings after taxes from discontinued operations 3.7 33.6
155

Bilfinger SEAnnual Report 2013
3. Principles of consolidation
Capital consolidation takes place by offsetting the price of acquisition against the Group’s interest in the newly valued equity of the consolidated subsidiaries at the date of acquisition or first-time consolidation. The assets, liabilities and contingent liabilities of the subsidiaries are entered at their full current fair values irrespective of the size of the minority interest. With each acquisition, there is a special option of electing to recognize minority interest at fair value or at the relevant proportion of net assets. Acquisition-related costs are expensed. In the case of an acquisition achieved in stages (step acquisition), equity interests previously held are remeasured through profit or loss. Contingent consideration is recognized at the time of acquisition at fair value and in following periods is measured at fair value through profit or loss. Any goodwill ensuing from first-time consolidation is capitalized and subjected to an annual impairment test in accordance with IFRS 3 / IAS 36. Any negative goodwill is recognized in profit or loss immediately after acquisition. At deconsolidation, the residual book values of goodwill are taken into consideration in the calculation of the gain or loss on disposal.
Changes in an equity interest that do not lead to a loss of control are treated as transactions between equity holders and reported within equity. Such transactions lead to the recognition neither of goodwill nor of any disposal gains. In the case of a sale of equity interest that leads to a loss of control, the remaining equity interest is remeasured at fair value through profit or loss and the accumulated other comprehensive income previously recognized in connection with the investment is reclassified to profit or loss or, if it is an actuarial gain or loss, to retained earnings.
Losses attributable to the non-controlling interest are fully attributed to the non-controlling interest, even if this results in a negative carrying amount.
Investments accounted for using the equity method are measured at cost of acquisition plus the prorated change in net assets, whereby any goodwill is included in the carrying amount of the investment. Upon losing a significant influence or losing joint control, the remaining equity inter-est is remeasured at fair value through profit or loss.
Receivables, liabilities, income and expenses between consolidated companies have been offset. Non-current assets and inventories resulting from Group output volume have been adjusted to exclude any inter-company profits. Deferred taxes from consolidation processes affecting profit have been accrued / deferred.
.
Notes to the consolidated financial statements 2013
156

Bilfinger SEAnnual Report 2013
Notes to the consolidated financial statementsGeneral notes
4. Currency translation
In the consolidated financial statements, the assets and liabilities of the accounts prepared in foreign currencies are translated using the average exchange rate at the end of the reporting period; expenses and income are translated using the average exchange rate for the year. The aggregate differences compared with translation at the end of the reporting period are entered separately under other comprehensive income.
Currency translation took place using the following significant exchange rates:
5. Accounting policies
Intangible assets with a finite life are capitalized at cost of acquisition and amortized over their expected useful lives on a straight-line basis. The expected useful life is generally regarded as being between three and eight years. This also includes intangible assets from service conces-sion agreements. These are public-private partnership (PPP) projects, for which the right to charge or receive a use-related fee has been agreed. They are measured at the fair value of the construction volumes delivered plus the borrowing costs allocable to the construction phase and less systematic depreciation during the operating phase. In accordance with IFRS 3 / IAS 36, goodwill and other intangible assets with an indefinite or unlimited useful life are no longer amortized. Instead, these items are subjected to regular annual impairment tests, which are also carried out during the year if there are indications of a lasting reduction in value.
Property, plant and equipment are valued at the cost of acquisition or production. Their loss in value is accounted for by systematic, straight-line depreciation, except in some exceptional cases where a different method of depreciation reflects the use of the asset more adequately. Pro-duction costs include all costs that are directly or indirectly attributable to the production process. Repair costs are always expensed as incurred.
Buildings are depreciated over a useful life of 20 to 50 years using the straight-line method. The useful life of technical equipment and machinery is generally between three and ten years; other equipment including office and factory equipment is usually depreciated over three to twelve years.
1 € = Annual average At December 31
2013 2012 2013 2012
Australia AUD 1.3770 1.2413 1.5423 1.2712
United Kingdom GBP 0.8493 0.8111 0.8337 0.8161
Canada CAD 1.3685 1.2848 1.4671 1.3137
Qatar QAR 4.8366 4.6804 5.0180 4.8040
Croatia HRK 7.5791 7.5213 7.6265 7.5575
Nigeria NGN 211.5442 203.8330 220.9624 206.1139
Norway NOK 7.8051 7.4755 8.3630 7.3483
Poland PLN 4.1971 4.1843 4.1472 4.0740
Romania RON 4.4190 4.4560 4.4847 4.4287
Sweden SEK 8.6505 8.7067 8.8591 8.5820
Switzerland CHF 1.2309 1.2053 1.2276 1.2072
South Africa ZAR 12.8308 10.5546 14.5660 11.1727
Czech Republic CZK 25.9755 25.1429 27.4250 25.1400
Hungary HUF 297.0133 289.2858 296.9100 291.2900
United Arab Emirates AED 4.8795 4.7249 5.0614 4.8452
United States USD 1.3282 1.2856 1.3791 1.3194
157

Bilfinger SEAnnual Report 2013
For intangible assets and property, plant and equipment, an impairment charge is recognized wherever the recoverable amount of an asset has fallen below its carrying amount. The recoverable amount represents the higher of the net selling price and the present value of estimated future cash flows. If the reason for an impairment loss recognized in prior years no longer applies, the carrying amount is increased again accordingly, at the most up to the amount of the amortized cost of acquisition. Impairment tests are carried out at the level of the smallest cash-generating unit.
With lease agreements where the risks and rewards of ownership of the leased asset are allocated to a company of the Bilfinger Group (finance leases), the item is capitalized at the lower of its fair value or the present value of the lease payments. Systematic depreciation takes place over the useful lifetime. Payment obligations resulting from future lease payments are recognized under financial liabilities.
The classification of agreements as lease agreements takes place on the basis of the substance of the transaction. That is, a test is carried out as to whether the fulfillment of the agreement depends on the use of specific assets and whether the agreement confers the right of use of those assets.
Investments accounted for using the equity method – associates and jointly controlled entities – are valued with consideration of the prorated net asset change of the company as well as any impairments which may have been recognized.
Joint ventures are contractual agreements in which two or more parties carry out a business activity under joint control. This also includes jointly controlled operations and especially construction consortiums, which, in accordance with IAS 31, are accounted for as follows. Bilfinger as a partner in a joint venture or consortium recognizes in its financial statements the assets it controls and the liabilities and expenses it incurs, and its share of income from the sale of goods and services. Assets and liabilities remaining with the jointly controlled operations or consortiums lead to proportionate shares of earnings, which are accounted for using the equity method and recognized under receivables or payables due to joint ventures.
Deferred taxes are recognized for any deviations between the valuation of assets and liabilities according to IFRS and the tax valuation in the amount of the expected future tax charge or relief. In addition, deferred tax assets are recognized for the carryforwards of unused tax losses if their future realization is probable. Deferred tax assets and liabilities from temporary differences are offset provided that offsetting is legally possible.
Inventories of merchandise and real estate held for sale, finished and unfinished goods, raw materials and supplies are measured at cost of purchase or production or at net realizable value at the end of the reporting period if this is lower. If the net realizable value of inventories that were written down in the past has risen again, their carrying amounts are increased accordingly. Production costs include all costs that are directly or indirectly attributable to the production process. Overheads are calculated on the basis of normal employment. Financing costs are not taken into consideration.
Other assets comprise non-financial assets that are not allocated to any other balance sheet item. They are measured at the lower of cost of acquisition or fair value.
The purchase, sale or withdrawal of treasury shares is recognized directly in equity. At the time of acquisition, treasury shares entered in equity in the amount of the acquisition costs.
Provisions for pensions and similar obligations are measured for defined benefit pension plans using the projected-unit-credit method, with consideration of future salary and pension increases. As far as possible, pension plan assets are set off. The net interest expense or income resulting from the net pension obligations is presented within financial income / expense. Actuarial gains or losses from pension obligations and gains or losses on the remeasurement of plan assets are recognized in other comprehensive income.
Other provisions are recognized if there is a present obligation resulting from a past event, its occurrence is more likely than not, and the amount of the obligation can be reliably estimated. Provisions are only recognized for legal or constructive obligations towards third parties. Provi-sions are measured at their settlement amounts, i.e., with due consideration of any price and / or cost increases, and are not set off against profit contributions. In the case of a single obligation, the amount of the most likely outcome is recognized as a liability. If the effect of the time value of money is material, provisions are discounted using the market interest rate for risk-free investments.
The amounts of provisions are estimated with consideration of experiences with similar situations in the past and of all knowledge of events up to the preparation of the consolidated financial statements. The general conditions can be very complex, in particular with provisions for risks relating to contracts and litigation as well as warranty risks. For this reason, uncertainty exists with regard to the timing and exact amounts of obligations.
Other liabilities comprise non-financial liabilities that are not allocated to any other balance sheet item. They are measured at cost of acquisi-tion or settlement value.
Notes to the consolidated financial statements 2013
158

Bilfinger SEAnnual Report 2013
Notes to the consolidated financial statementsGeneral notes
Financial instruments are contracts that simultaneously give rise to a financial asset of one entity and an equity instrument or financial liability of another entity. A financial instrument is to be recognized in the balance sheet as soon as a company becomes a party to the contractual provisions of the instrument. Initial measurement is at fair value including transaction costs. Subsequent measurement of financial instruments is either at amortized cost or fair value, depending on the allocation of the instrument to the categories stipulated in IAS 39 (Financial Instruments). No use has been made of the option to designate financial instruments upon initial recognition to be measured at fair value through profit or loss.
IAS 39 divides financial assets into four categories:
Available-for-sale financial assets are any non-derivative financial assets designated as available for sale, and those that are not classified to any of the other three categories of financial assets listed above.
Financial liabilities are divided into the following categories:
The amortized cost of a financial asset or financial liability is calculated using the effective interest method from the historical cost of acquisition minus capital repaid plus or minus the accumulated amortization of any difference between the original amount and the amount repayable at maturity and minus any depreciation and impairments or plus reversals.
With current receivables and liabilities, amortized cost is equal to the nominal value or the redemption amount. Fair value is the (market) price that could be obtained on the hypothetical transfer of a certain asset or a certain liability in an orderly (market)
transaction in the respective accessible primary market or in the most advantageous market between market participants at the measurement date. For the measurement of fair value, the valuation technique is to be applied which is the most appropriate to the given circumstances and which makes use of as much objective and/or observable information as possible. Depending on the type of asset or liability to be measured, this is the market-price method (e.g., with traded financial instruments), the replacement method (e.g., with property, plant or equipment) or the discounted-cash-flow method (e.g., with OTC derivatives).
Receivables from concession projects are measured at amortized cost. Receivables due from concession projects relate to all services provided in connection with the performance of public-private partnership (PPP) projects for which a fixed payment was agreed irrespective of the extent of use.
Equity interests in non-listed companies shown under other non-current financial assets are classified as available-for-sale financial assets. They are measured at fair value if that value can be reasonably estimated; otherwise they are measured at amortized cost (AfS-AC). Initial measurement is at the settlement date. Unrealized gains and losses from changes in fair value are recognized in equity with no impact on profit or loss, with due consideration of deferred taxes.
Financial Assets Held for Trading (FAHfT) (Financial Assets at Fair Value through Profit or Loss)
Financial assets held for trading (financial assets at fair value through profit or loss)
Held-to-Maturity Investments (HtM) Held-to-maturity financial investments
Loans and Receivables (LaR) Loans and receivables
Available-for-Sale Financial Assets (AfS) Available-for-sale financial assets
Financial Liabilities Held for Trading (FLHfT) (Financial Liabilities at Fair Value through Profit or Loss)
Financial liabilities held for trading (financial liabilities at fair value through profit or loss)
Financial Liabilities at Amortized Cost (FLAC) Financial liabilities at amortized cost
159

Bilfinger SEAnnual Report 2013
Receivables and other financial assets are measured at amortized cost, with the exception of derivative financial instruments. Possible default risks are reflected by allowances for bad debts in separate accounts. Individual impairments are recognized if there is an indication of a loss in value such as delayed payment or if there is information on the contracting party’s significant financial difficulties and the present value of the expected future payments plus any payments from the disposal of sureties or other risk-reducing agreements is lower than the carrying amount. Irrecoverable receivables are written off.
Receivables from construction contracts are accounted for in accordance with IAS 11 using the percentage-of-completion (PoC) method. Revenue is recognized in relation to the percentage of completion of each contract.
The percentage of completion is generally determined on the basis of the output that has been produced at the end of the reporting period. If, for construction contracts, output has been produced which exceeds the amount of advances received, this excess is shown under trade receivables. If the amount of advances received from invoices is higher than the output produced, this excess is shown under advances received from construction contracts. Receivables from percentage of completion correspond to the balance of progress payments invoiced less progress payments received; they are shown together with trade receivables. Anticipated contract losses are accounted for in full from the time that they become known.
Receivables from the provision of services are accounted for in accordance with IAS 18 also using the percentage-of-completion method – pro-vided that the conditions for application are fulfilled – and are presented analogously to receivables from construction contracts.
Construction contracts processed in consortiums are measured according to the percentage-of-completion method. Receivables from and payables to consortiums take account not only of payments received and made, but also of internal cost allocations and prorated profits on orders.
Securities are measured at fair value. Changes in the market prices of securities held for trading are recognized in profit or loss. Changes in the market prices of other securities measured at fair value are recognized in retained earnings (fair valuation of securities reserve) with no effect on profit or loss, with due consideration of deferred taxes. With these securities, impairment losses are recognized if there is any indication of a lasting reduction in value.
Cash and cash equivalents, primarily comprising cash at banks and cash in hand, are measured at amortized cost.Financial liabilities primarily comprise financial debt as well as trade and other payables. With the exception of derivative financial
instruments, they are measured at amortized cost.Derivative financial instruments are used solely to hedge against interest-rate and currency exchange-rate risks. Purely speculative trans-
actions without any underlying basic transaction are not undertaken. The most important derivative financial instruments are currency futures, currency options and interest-rate and inflation swaps.
In accordance with IAS 39, derivative financial instruments are recognized at their fair values as assets (positive fair value) or liabilities (nega-tive fair value). Initial recognition is on the trading day.
The fair values of the currency and interest derivatives used are calculated on the basis of recognized financial-mathematical methods (discounted-cash-flow method and option-pricing model).
With derivative financial instruments related to hedging instruments, measurement depends on changes in fair value due to the type of hedging instrument.
The goal of hedging with the use of a fair-value hedge is to offset changes in the fair values of balance-sheet assets and liabilities, or of off-balance fixed obligations, through opposing changes in the market value of the hedging transaction. The carrying amount of the hedged underlying transaction is adjusted to changes in market values if these changes result from the hedged risk factors. The changes in market values of the hedging transactions and the adjustments of the the carrying amounts of the hedged underlying transactions are recognized through profit or loss.
Cash-flow hedges are used to safeguard future cash flows from assets or liabilities recognized in the balance sheet or from transactions that are planned with a high degree of certainty. Changes in the effective part of the fair value of a derivative are at first recognized under equity with no effect on profit or loss, with due consideration of deferred taxes (hedging transactions reserve), and are only recognized through profit and loss when the hedged underlying transaction is realized. The ineffective part of the hedging instrument is recognized immediately through profit or loss.
Derivative financial instruments that are not related to a hedging instrument as defined by IAS 39 are deemed to be financial assets or financial liabilities held for trading. For these financial instruments, changes in fair value are immediately recognized through profit or loss.
Notes to the consolidated financial statements 2013
160

Bilfinger SEAnnual Report 2013
Notes to the consolidated financial statementsGeneral notes
Share-based payments as defined by IFRS 2 are measured on the basis of the share price with consideration of a discount due to the lack of divi-dend entitlement at fair value at the end of the reporting period. Here, the Monte Carlo Simulation method is also used. Expenses from share-based payments are recognized on a pro-rata basis in the relevant vesting period. In the case of cash-settled share-based payment transactions, the ex-pense is shown by recognizing a provision; in the case of equity-settled share-based payment transactions, the expense is entered directly in equity.
Non-current assets held for sale and disposal groups as well as related liabilities are classified as such and presented separately in the balance sheet. Assets are classified as held for sale if the carrying amounts are primarily to be realized through a sale transaction rather than through continuing use. The sale must be highly probable and the assets or disposal groups must be immediately saleable in their present condition. These assets and disposal groups are measured at the lower of carrying amount or fair value less costs to sell, and are no longer systematically depreciated or amortized. Impairment losses are recognized if the fair value less cost to sell is lower than the carrying amount. Any write-ups due to an increase in fair value less costs to sell are limited to the impairments of the assets previously recognized.
Assets and liabilities of discontinued operations are treated as disposal groups. A discontinued operation is a separate major line of business or geographical area of operations which is held for sale. In addition, earnings after taxes from discontinued operations are presented separately in the income statement.
Revenue from construction contracts is recognized in accordance with IAS 11 Construction Contracts with the use of the percentage-of-completion method – provided that the conditions for application are fulfilled. The percentage of completion is mainly calculated on the basis of the ratio at the end of the reporting period of the output volume already delivered to the total output volume to be delivered. The percentage of completion is also calculated from the ratio of the actual costs already incurred at the end of the reporting period to the planned total costs (cost-to-cost method). If the results of construction contracts cannot be reliably estimated, revenue is calculated using the zero-profit method in the amount of the costs incurred and probably recoverable.
Revenue from the provision of services is recognized in accordance with IAS 18.20 with the use of the percentage of completion method – pro-vided that the conditions for application are fulfilled. In the area of services, percentage of completion is mainly calculated using the cost-to-cost method.
Revenue from the sale of goods is recognized according to the criteria of IAS 18.14 (revenue recognition on the transfer of significant risks and rewards of ownership).
In the context of concession projects, construction services provided are recognized as revenue in accordance with IAS 11 using the percentage of completion method.
In the operating phase of concession projects, the recognition of revenue from operating services depends upon whether a financial or an intangible asset is to be received as consideration for the construction services provided.
If a financial asset is to be recognized, i.e., the operator receives a fixed payment from the grantor irrespective of the extent of use, revenue from the provision of operating services is recognized according to IAS 18 using the percentage of completion method. The percentage of comple-tion is calculated using the cost-to-cost method.
If an intangible asset is to be received, i.e., the operator receives payments from the users or from the client depending on use, the payments for use are recognized as revenue according to IAS 18 generally in line with the extent of use of the infrastructure by the users.
If the operator receives both use-dependent and use-independent payments, revenue recognition is split in accordance with the ratio of the two types of payment.
Expenditures for research and development such as for the further development of processes and special innovative technical proposals for individual projects are generally recognized in the income statement on a project-related basis.
Borrowing costs that can be directly allocated to the acquisition, construction or production of an asset which requires a considerable period of time to be put into its intended condition for use or for sale are capitalized as part of that asset’s cost of acquisition or production. All other borrowing costs are expensed in the period in which they are incurred. In the year under review, no borrowing costs were capitalized, as in the prior year.
161

Bilfinger SEAnnual Report 2013
Assessments and estimatesWith the preparation of the consolidated financial statements, to a certain extent it is necessary to make assumptions and estimates that have an effect on the amounts and valuations shown in the Group’s balance sheet and income statement as well as on the contingent liabilities for the reporting period.
The assumptions and estimates are the result of premises that are based on currently available knowledge. If future developments differ from these assumptions, the actual amounts may differ from the originally anticipated estimates.
The assumptions and estimates primarily relate to evaluations of the following items:
__ Revenue by the percentage-of-completion method: With the use of the percentage-of-completion-method, estimates have to be made with regard to the percentage of completion, the contract costs to complete the contract and the total contract revenue. Changes in those esti-mates can lead to an increase or decrease in revenue for the period. In 2013, revenue of €5,162.1 million was realized by the percentage-of-completion method (2012: €6,710.9 million). Disclosures on the sensitivities of the extent of possible effects of changes in estimates cannot reasonably be made due to the large number of individual projects and influencing factors.
__ Allowances for bad debts: Allowances for bad debts include to a great extent estimates and assessments of individual receivables that are based on the creditworthiness of the respective client, current economic developments and collaterals received. The carrying amount of receivables at December 31, 2013 was €1,904.3 million (2012: €1,866.7 million), whereby allowances for default risks for trade receivables amounted to €27.1 million (2012: €32.1 million). Disclosures on the sensitivities of the extent of possible effects of changes in estimates cannot reasonably be made due to the large number of counterparties and relevant factors.
__ Provisions for pensions and similar obligations: Provisions for pensions and similar obligations are measured actuarially with consideration of future developments. These measurements are primarily based on assumptions regarding discount rates, expected salary trends, pension trends and life expectations. See Note 24 for details of the assumptions made and possible risks.
__ Other provisions: The recognition of provisions for risks relating to contracts and litigation as well as warranty risks, personnel-related obligations and other uncertain liabilities to a great extent involves estimates by Bilfinger. These estimates can change as a result of new information, for example with ongoing project progress or with the status of proceedings. The actual cash outflows or expenses can deviate from the original and updated estimates and can affect profit or loss accordingly. The carrying amount of other provisions at December 31, 2013 was €613.1 million (2012: €613.2 million). Disclosures on the sensitivities of the extent of possible effects of changes in estimates cannot reasonably be made due to the large number of facts and relevant factors.
__ Income taxes: Bilfinger is active in numerous tax jurisdictions. The tax items presented in the consolidated financial statements are calculated with consideration of the respective tax laws and of the relevant administrative judgments, and, due to their complexity, may be subject to deviating interpretations by taxable entities on the one hand and by local fiscal authorities on the other. Deferred tax assets are recognized if sufficient taxable income is available in the future. Among other things, the factors considered include the planned earnings from operating activities, the impact on earnings of the reversal of taxable temporary differences, and possible tax strategies. On the basis of the planned future taxable income, Bilfinger’s management assesses the measurement of deferred tax assets at the end of each reporting period. As future business developments are uncertain, assumptions are required on estimates of future taxable income and on the time when deferred tax assets can be utilized. Estimated amounts are adjusted during the period if there are sufficient indications that an adjustment is necessary. If the management assumes that deferred tax assets cannot be realized, either partially or in full, they are impaired by the appropriate amount. The carrying amount of deferred tax assets at December 31, 2013 was €186.7 million (2012: €176.9 million).
__ Impairment of goodwill: Bilfinger tests goodwill for impairment at least annually. Determining the recoverable amount of a cash-generating unit to which goodwill is allocated involves estimates by the management. It is equivalent to the value in use resulting from the discounted cash flows calculated on the basis of financial planning approved by the management. See Section 14 of the notes to the consolidated finan-cial statements for further details.
Notes to the consolidated financial statements 2013
162

Bilfinger SEAnnual Report 2013
Notes to the consolidated financial statementsGeneral notes
Summary of selected measurement methods:
Balance sheet item Measurement method
Goodwill and intangible assets with an indefinite or unlimited useful life Cost of acquisition (no amortization, regular and indication-induced impairment tests)
Intangible assets with a finite useful life Amortized cost (straight-line amortization, indication-induced impairment tests)
Property, plant and equipment Depreciated cost of acquisition or production (systematic depreciation, normally straight-line, indication-induced impairment tests)
Assets capitalized in the context of finance leasing Fair value upon capitalization or present value of minimum leasing payments less systematic depreciation (indication-induced impairment tests)
Investments accounted for using the equity method Cost of acquisition increased and reduced by the proportionate change in net assets (indication-induced impairment tests)
Equity interests Cost of acquisition (indication-induced impairment tests)
Receivables from concession projects Amortized cost (effective-interest method, indication-induced impairment tests)
Securities (AfS) Fair value
Securities (HtM) Amortized cost (effective-interest method, indication-induced impairment tests)
Inventories Lower of cost of acquisition or production or net realizable value
Receivables from construction and services contracts Percentage-of-completion method, amortized cost
Loans granted and receivables Amortized cost (effective-interest method, indication-induced impairment tests)
Other assets Lower of cost or fair value
Treasury shares Cost of acquisition
Provisions for pensions and similar obligations Projected-unit-credit method less plan assets
Other provisions Settlement amount
Financial debt and other financial liabilities Amortized cost (effective-interest method)
Other liabilities Cost or settlement amount
Derivative financial instruments Fair value
Deferred tax liabilities Taxable temporary differences
Assets held for sale / liabilities in disposal groups Lower of carrying amount upon classification or fair value less costs to sell (no syste-matic amortization / depreciation, indication-induced impairment tests)
163

Bilfinger SEAnnual Report 2013
The income and expenses of the concession projects held for sale are presented in accordance with IFRS 5 in an item ‘Earnings after taxes from discontinued operations’ and no longer in the individual items under continuing operations. The prior-year figures have been adjusted accordingly.
6. Revenue
Revenue of €5,162.1 million (2012: €6,710.9 million) includes revenue resulting from the application of the percentage-of-completion method. It also includes goods and services supplied to joint ventures and consortiums as well as shares in the results of such joint ventures and consortiums.
The main joint ventures and consortiums are related to the following construction projects:
The breakdown of revenue by business segment and by region is shown under segment reporting.
7. Other operating income
* Figures in € million, unless otherwise stated.
Notes to the income statement*
Bilfinger‘s share
Share of order value
Share of output volume in 2013
ABJV DanTysk, Germany 50% 134 80
S-2 Warsaw, Southern Ringroad 68% 123 38
Gliwice DTS 53% 73 17
Arge ThyssenKrupp Quartier 2. BA 70% 56 41
2013 2012
Income from operating investments 24.6 49.4
Gains on the disposal of property, plant and equipment 11.7 8.5
Income from the reversal of other provisions 9.1 6.4
Gains on currency translation 5.3 3.2
Income from the reversal of impairments on trade receivables 3.5 4.1
Other income 45.5 36.0
Total 99.7 107.6
Notes to the consolidated financial statements 2013
164

Bilfinger SEAnnual Report 2013
Notes to the consolidated financial statementsNotes to the income statement
The amount for income from operating investments includes a gain of €19.3 million (2012: €45.5 million) from the reduction of our investment in the Nigeria business.
Other income relates to the remeasurement of contingent consideration for the acquisition of subsidiaries of €26.4 million (2012: €3.8 million), and numerous other items of minor individual importance.
8. Other operating expense
The restructuring expenses primarily reflect expenses for planned workforce reductions in connection with the Bilfinger Excellence efficiency-enhancing program.
The expenses from operating investments, primarily comprises losses of €5.0 million on the sale of the German road-construction activities. The other expenses include impairments of other assets, costs of acquisition for the purchase of companies and the expense of a subsequent
contingent consideration of €7.0 million for the acquisition of a company, as well as numerous other items of minor individual importance.
9. Income from investments accounted for using the equity method
Income from investments accounted for using the equity method is comprised as follows:
2013 2012
Restructuring expenses Excellence 68.9 0.0
Expenses from increases in other provisions 15.0 11.9
Impairment of trade receivables 8.5 7.9
Expenses from operating investments 7.5 0.0
Losses on the disposal of property, plant and equipment 2.3 2.1
Losses on currency translation 1.7 5.8
Other expenses 20.0 19.3
Total 123.9 47.0
2013 2012
Income from investments accounted for using the equity method 32.8 31.2
Expenses from investments accounted for using the equity method -0.3 -0.2
Balance 32.5 31.0
165
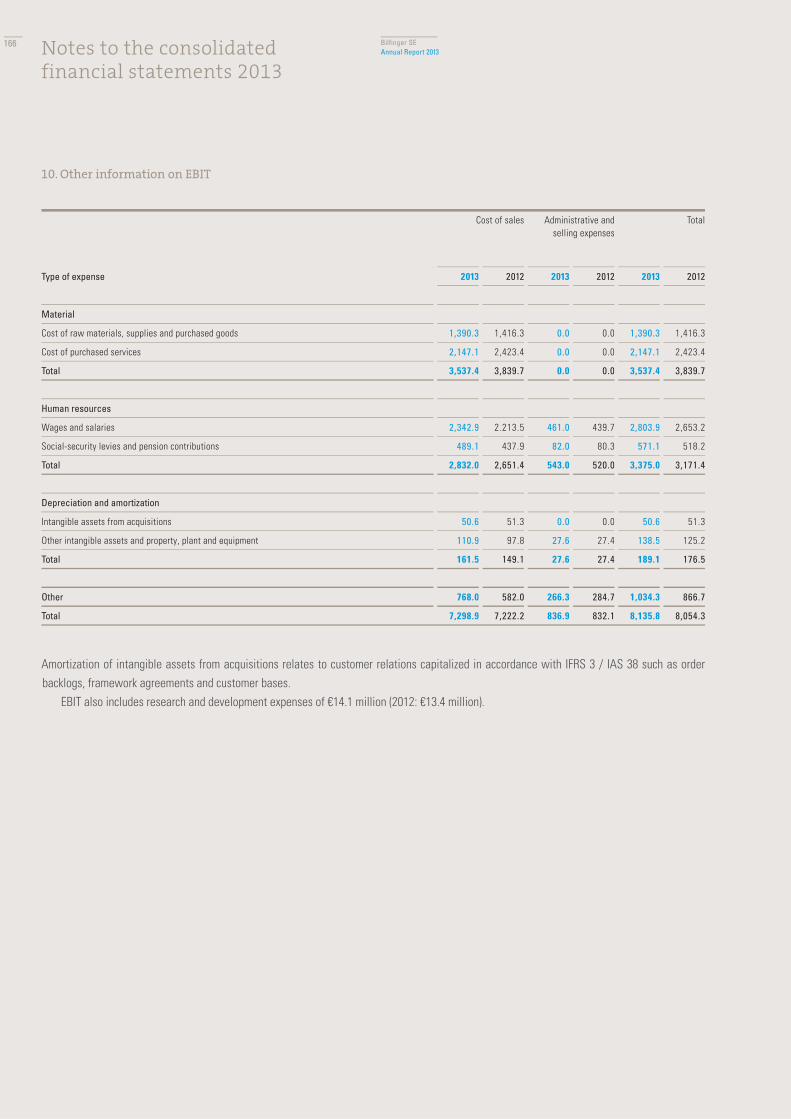
Bilfinger SEAnnual Report 2013
10. Other information on EBIT
Amortization of intangible assets from acquisitions relates to customer relations capitalized in accordance with IFRS 3 / IAS 38 such as order backlogs, framework agreements and customer bases.
EBIT also includes research and development expenses of €14.1 million (2012: €13.4 million).
Cost of sales Administrative and selling expenses
Total
Type of expense 2013 2012 2013 2012 2013 2012
Material
Cost of raw materials, supplies and purchased goods 1,390.3 1,416.3 0.0 0.0 1,390.3 1,416.3
Cost of purchased services 2,147.1 2,423.4 0.0 0.0 2,147.1 2,423.4
Total 3,537.4 3,839.7 0.0 0.0 3,537.4 3,839.7
Human resources
Wages and salaries 2,342.9 2.213.5 461.0 439.7 2,803.9 2,653.2
Social-security levies and pension contributions 489.1 437.9 82.0 80.3 571.1 518.2
Total 2,832.0 2,651.4 543.0 520.0 3,375.0 3,171.4
Depreciation and amortization
Intangible assets from acquisitions 50.6 51.3 0.0 0.0 50.6 51.3
Other intangible assets and property, plant and equipment 110.9 97.8 27.6 27.4 138.5 125.2
Total 161.5 149.1 27.6 27.4 189.1 176.5
Other 768.0 582.0 266.3 284.7 1,034.3 866.7
Total 7,298.9 7,222.2 836.9 832.1 8,135.8 8,054.3
Notes to the consolidated financial statements 2013
166

Bilfinger SEAnnual Report 2013
Notes to the consolidated financial statementsNotes to the income statement
11. Interest and other financial income / expense
Interest and other financial income / expense comprise the following items of the income statement:
Interest income is primarily earned on deposits of cash and cash equivalents with variable interest rates. Current interest expense is mainly incurred on financial debt excluding non-recourse debt with fixed interest rates.
With an unchanged investment policy, an increase in interest rates would lead to higher interest income. The interest expense for minority interest of €6.1 million (2012: €6.3 million) reflects the share in profits of the minority interest which is classi-
fied as borrowing due to contractual regulations, in particular preemption rights pursuant to IAS 32. €1.6 million of the interest expense for minority interest (2012: €1.6 million) constitutes the interest compounded on purchase-price liabilities from the acquisition of equity interests.
12. Income tax expense
Income taxes are the taxes on income and earnings paid, owed or deferred in the various countries. The calculations are based on the expected tax rates in those countries at the time of realization. Those expected tax rates are derived from the statutory regulations that are in force or enacted at the end of the reporting period.
2013 2012
Interest income 7.6 11.9
Current interest expense -31.7 -25.7
Interest cost on defined benefit obligation (DBO) -21.8 -23.9
Interest income on plan assets 8.1 -13.7 11.2 -12.7
Interest expense -45.4 -38.4
Income on securities 2.4 0.5
Interest expense for minority interest -7.7 -7.9
Other financial expense -5.3 -7.4
Total -43.1 -33.9
2013 2012
Actual taxes 100.8 82.2
Deferred taxes -29.3 19.4
Total 71.5 101.6
167

Bilfinger SEAnnual Report 2013
The tax expense calculated with the tax rate of Bilfinger SE can be reconciled with the actual tax expense as follows:
The combined income tax rate for Bilfinger SE was 30.95 percent, as in the prior year, consisting of corporate income tax at a rate of 15 percent and the solidarity surcharge, which is levied at a rate of 5.5 percent of the applicable corporate income tax, as well as trade tax at an average municipal multiplier of 432 percent.
Deferred tax assets and deferred tax liabilities are distributed among the items of the balance sheet as follows:
At the end of the reporting period, deferred taxes in the amount of €20.0 million (2012: €34.8 million) from the measurement of retirement benefit obligations according to IAS 19 as well as from the measurement of financial instruments according to IAS 39 were offset against equity.
The total amount of deferred tax assets of €186.7 million (2012: €176.9 million) includes future reductions in tax payments in an amount of €61.0 million (2012: €53.1 million) that arise from the expected utilization in future years of existing tax-loss carryforwards. The realization of the tax-loss carryforwards is reasonably certain. Non-capitalized tax-loss carryforwards for corporate income tax (or comparable taxes outside Germany) amount to €112.5 million (2012: €145.1 million) and for trade tax to €47.0 million (2012: €47.4 million). Of the tax-loss carryforwards not recognized as deferred tax assets, €5.9 million (2012: €0.0 million) will expire within the next five years, €1.5 million (2012: €0.0 million) within the next nine years, €0.2 million (2012: €8.3 million) within the next 15 years and €13.7 million (2012: €22.1 million) within the next 20 years.
Deferred tax liabilities for tax payments on possible future dividend payments out of subsidiaries’ retained earnings have not been recognized if these earnings are required for the long-term financing of the respective subsidiaries.
2013 2012
Earnings before taxes 244.0 346.9
Theoretical tax expense at 30.95% 75.5 107.4
Tax-rate differences -6.8 -9.4
Tax-rate effects of non-deductible expenses and tax-free income 2.1 0.5
Losses for which no deferred tax assets are capitalized and changes in value adjustments 2.3 0.1
Taxes from other accounting periods -1.6 3.0
Income tax expense 71.5 101.6
Deferred tax assets Deferred tax liabilities
Dec. 31, 2013 Dec. 31, 2012 Dec. 31, 2013 Dec. 31, 2012
Non-current assets 11.6 17.0 56.4 52.3
Current assets 12.8 13.7 96.5 102.6
Provisions 105.3 87.4 1.0 4.5
Liabilities 1.6 17.7 1.7 1.7
Tax-loss carryforwards 0.0
Corporate income tax (or comparable taxes outside Germany) 38.8 41.7 – –
Trade taxes 22.2 11.4 – –
Offsetting -5.6 -12.0 -5.6 -12.0
Carried in the balance sheet 186.7 176.9 150.0 149.1
Notes to the consolidated financial statements 2013
168
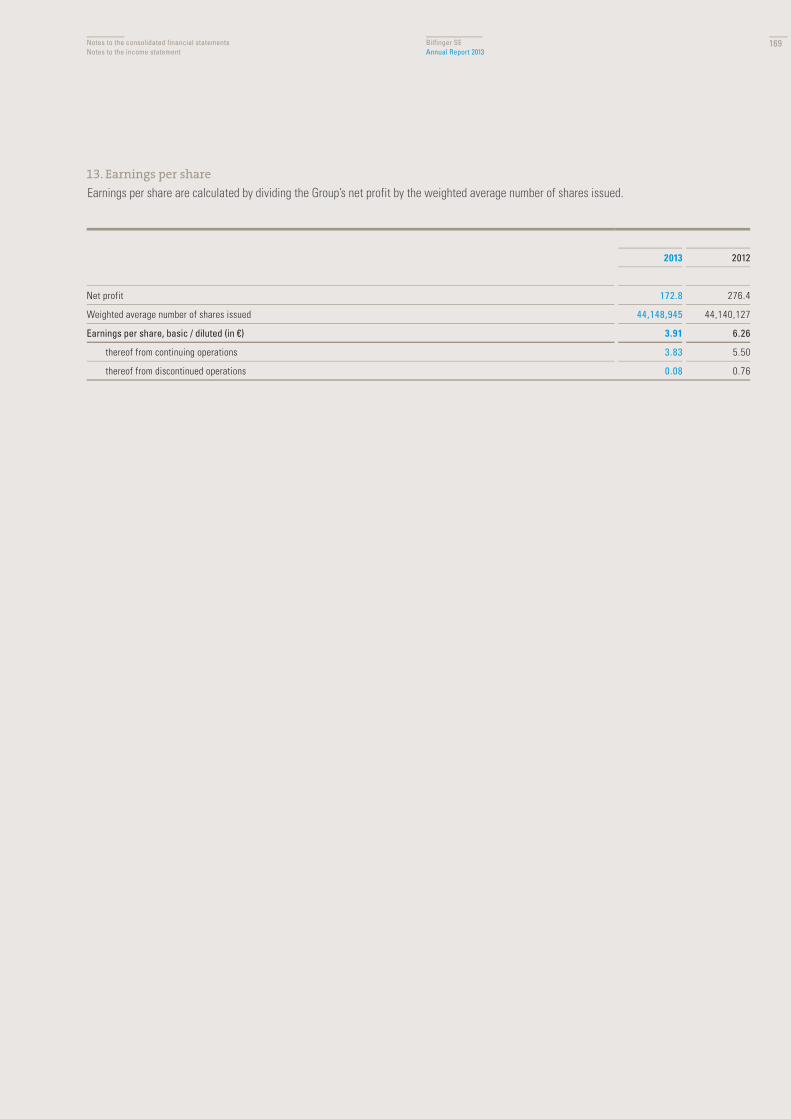
Bilfinger SEAnnual Report 2013
Notes to the consolidated financial statementsNotes to the income statement
13. Earnings per share
Earnings per share are calculated by dividing the Group’s net profit by the weighted average number of shares issued.
2013 2012
Net profit 172.8 276.4
Weighted average number of shares issued 44,148,945 44,140,127
Earnings per share, basic / diluted (in €) 3.91 6.26
thereof from continuing operations 3.83 5.50
thereof from discontinued operations 0.08 0.76
169

Bilfinger SEAnnual Report 2013
* Figures in € million unless stated otherwise.
Notes to the balance sheet*
Due to the classification of the held-for-sale concession projects of the Concessions business segment as discontinued operations, the assets and liabilities of the fully consolidated concession projects not yet transferred to the purchaser and the carrying amounts of the concession projects accounted for using the equity method are presented as of December 31, 2013 in accordance with IFRS 5 under the separate item of ‘Assets held for sale’ or ‘Liabilities held for sale.’ This is reflected by changes to numerous items of the balance sheet compared with December 31, 2012, since, in line with IFRS 5, the prior-year figures have not been adjusted.
14. Intangible assets
COST OF ACQUISITION OR PRODUCTION Licenses, software and similar rights
and assets
Goodwill Intangible assets from acquisitions
Advance payments on
intangible assets
Total
January 1, 2013 87.6 1.744.5 309.5 1.4 2,143.0
Additions to the consolidated group 12.9 152.8 37.4 0.0 203.1
Disposals in the consolidated group 0.9 0.4 0.0 0.0 1.3
Additions 11.9 0.0 0.0 1.8 13.7
Disposals 9.5 0.9 0.0 0.0 10.4
Reclassifications 1.5 -0.3 0.3 -1.3 0.2
Currency adjustments -3.0 -10.0 -6.4 0.0 -19.4
Reclassification of Concessions 0.0 0.0 0.0 0.0 0.0
December 31, 2013 100.5 1,885.7 340.8 1.9 2,328.9
ACCUMULATED AMORTIZATION AND IMPAIRMENT
Licenses, software and similar rights
and assets
Goodwill Intangible assets from acquisitions
Advance payments on
intangible assets
Total
January 1, 2013 63.8 0.4 188.7 0.0 252.9
Additions to the consolidated group 7.5 0.0 0.0 0.0 7.5
Disposals in the consolidated group 0.7 0.2 0.0 0.0 0.9
Additions 10.9 0.0 50.6 0.0 61.5
Disposals 9.4 0.0 0.0 0.0 9.4
Reclassifications 0.0 0.0 0.0 0.0 0.0
Write-ups 0.0 0.0 0.0 0.0 0.0
Currency adjustments -1.8 0.0 -4.2 0.0 -6.0
Reclassification of Concessions 0.0 0.0 0.0 0.0 0.0
December 31, 2013 70.3 0.2 235.1 0.0 305.6
Carrying amount December 31, 2013 30.2 1,885.5 105.7 1.9 2,023.3
Notes to the consolidated financial statements 2013
170

Bilfinger SEAnnual Report 2013
Notes to the consolidated financial statementsNotes to the balance sheet
COST OF ACQUISITION OR PRODUCTION Licenses, software and similar rights
and assets
Goodwill Intangible assets from acquisitions
Advance payments on
intangible assets
Total
January 1, 2012 80.2 1,434.2 242.6 0.9 1,757.9
Additions to the consolidated group 6.5 307.1 66.3 0.1 380.0
Disposals in the consolidated group 0.8 0.1 0.0 0.0 0.9
Additions 9.9 1.8 0.5 1.5 13.7
Disposals 9.8 0.4 0.3 0.0 10.5
Reclassifications 1.2 0.0 0.0 -1.1 0.1
Currency adjustments 0.4 1.9 0.4 0.0 2.7
Dec. 31, 2012 87.6 1,744.5 309.5 1.4 2,143.0
ACCUMULATED AMORTIZATION AND IMPAIRMENT
Licenses, software and similar rights
and assets
Goodwill Intangible assets from acquisitions
Advance payments on
intangible assets
Total
January 1, 2012 59.6 0.2 137.1 0.0 196.9
Additions to the consolidated group 5.3 0.2 0.0 0.0 5.5
Disposals in the consolidated group 0.0 0.0 0.0 0.0 0.0
Additions 8.3 0.0 51.3 0.0 59.6
Disposals 9.9 0.0 0.3 0.0 10.2
Reclassifications 0.0 0.0 0.0 0.0 0.0
Write-ups 0.0 0.0 0.0 0.0 0.0
Currency adjustments 0.5 0.0 0.6 0.0 1.1
December 31, 2012 63.8 0.4 188.7 0.0 252.9
Carrying amount December 31, 2012 23.8 1,744.1 120.8 1.4 1,890.1
171

Bilfinger SEAnnual Report 2013
Within the context of carrying out annual impairment tests in accordance with IFRS 3 / IAS 36, goodwill was allocated to the relevant cash-generating units. The distribution of goodwill among the business segments is as follows:
The recoverable amounts of these units at the balance sheet date correspond with their values in use, which are derived from their discounted future cash flows. The calculation is based on the planning figures over a three-year period, as approved by the Group’s management. Planning is based on past experience, current operating results and the best possible assessment by the Group’s management of future development. Market assumptions are taken into consideration with the use of external macroeconomic and industry-specific sources. For the period thereafter, for the sake of a cautious valuation, constant cash flows have been assumed, whereby future growth opportunities have not been taken into considera-tion. The discount rates before taxes for the cash-generating units in the Industrial, Power and Building and Facility business segments, calculated using the capital-asset-pricing model, are between 9.2 and 11.3 percent (2012: 9.4 to 9.6 percent) and, for the Construction business segment, 12.4 percent (2012: 11.0 to 11.2 percent).
A comparison of the recoverable amounts of the units with their carrying amounts including goodwill did not result in any need for impairments. Nor would a significant increase in the discount rate or significant negative deviations from the planning premises result in any need to impair goodwill.
Intangible assets from acquisitions reflect the portions of purchase prices attributed to acquired customer relations (e.g., order backlogs, framework agreements and client bases) and are amortized over their useful lives using the straight-line method.
2013 2012
Industrial 853 839
thereof Bilfinger Industrial Services 550 739
thereof Bilfinger Industrial Technologies 303 100
Power 364 349
Building and Facility 631 524
thereof Bilfinger Facility Services 586 485
thereof Bilfinger Government Services 38 39
thereof Bilfinger Hochbau 7 0
Construction 37 32
thereof Bilfinger Construction 33 28
thereof Bilfinger Infrastructure 4 4
Total 1,885 1,744
Notes to the consolidated financial statements 2013
172
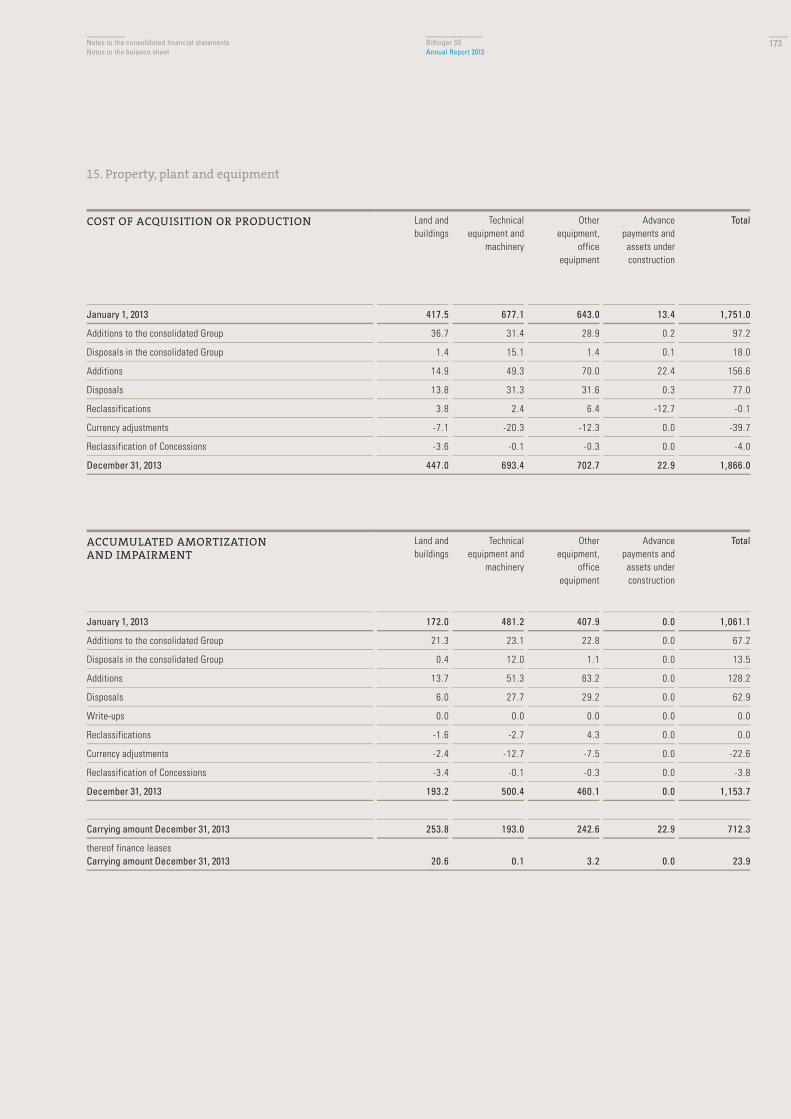
Bilfinger SEAnnual Report 2013
Notes to the consolidated financial statementsNotes to the balance sheet
15. Property, plant and equipment
COST OF ACQUISITION OR PRODUCTION Land and buildings
Technical equipment and
machinery
Other equipment,
office equipment
Advance payments and assets under construction
Total
January 1, 2013 417.5 677.1 643.0 13.4 1,751.0
Additions to the consolidated Group 36.7 31.4 28.9 0.2 97.2
Disposals in the consolidated Group 1.4 15.1 1.4 0.1 18.0
Additions 14.9 49.3 70.0 22.4 156.6
Disposals 13.8 31.3 31.6 0.3 77.0
Reclassifications 3.8 2.4 6.4 -12.7 -0.1
Currency adjustments -7.1 -20.3 -12.3 0.0 -39.7
Reclassification of Concessions -3.6 -0.1 -0.3 0.0 -4.0
December 31, 2013 447.0 693.4 702.7 22.9 1,866.0
ACCUMULATED AMORTIZATION AND IMPAIRMENT
Land and buildings
Technical equipment and
machinery
Other equipment,
office equipment
Advance payments and assets under construction
Total
January 1, 2013 172.0 481.2 407.9 0.0 1,061.1
Additions to the consolidated Group 21.3 23.1 22.8 0.0 67.2
Disposals in the consolidated Group 0.4 12.0 1.1 0.0 13.5
Additions 13.7 51.3 63.2 0.0 128.2
Disposals 6.0 27.7 29.2 0.0 62.9
Write-ups 0.0 0.0 0.0 0.0 0.0
Reclassifications -1.6 -2.7 4.3 0.0 0.0
Currency adjustments -2.4 -12.7 -7.5 0.0 -22.6
Reclassification of Concessions -3.4 -0.1 -0.3 0.0 -3.8
December 31, 2013 193.2 500.4 460.1 0.0 1,153.7
Carrying amount December 31, 2013 253.8 193.0 242.6 22.9 712.3
thereof finance leases Carrying amount December 31, 2013 20.6 0.1 3.2 0.0 23.9
173
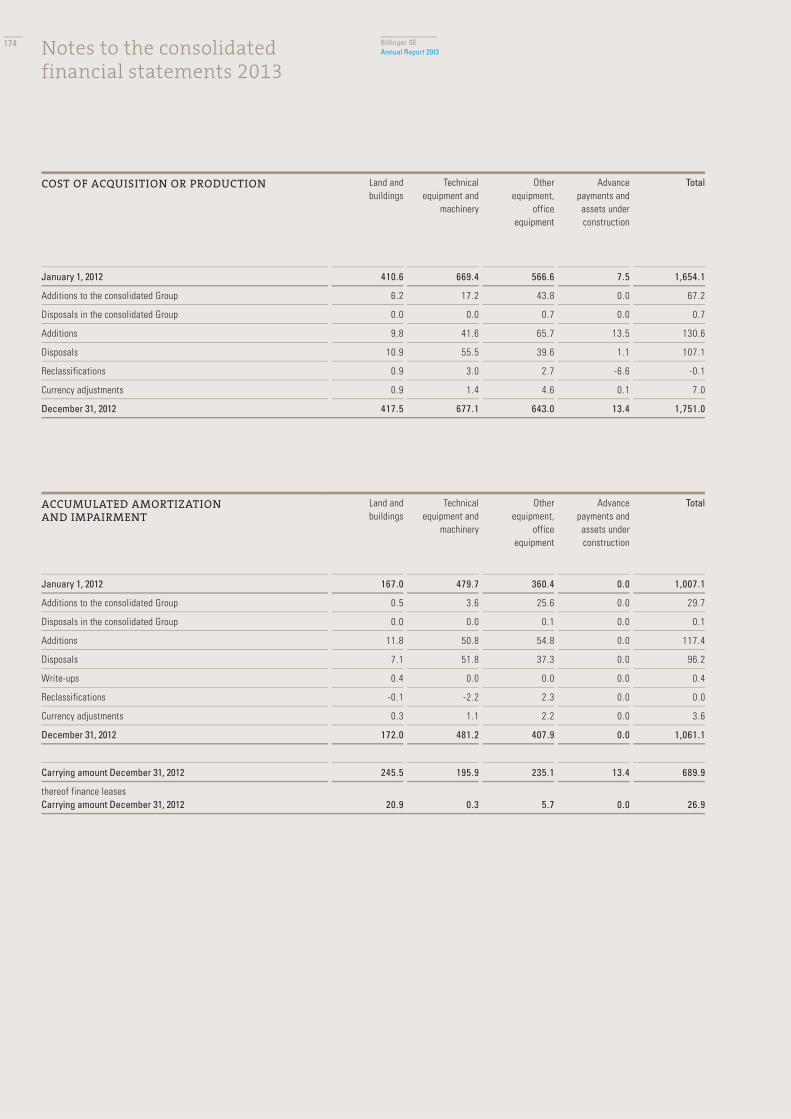
Bilfinger SEAnnual Report 2013
COST OF ACQUISITION OR PRODUCTION Land and buildings
Technical equipment and
machinery
Other equipment,
office equipment
Advance payments and assets under construction
Total
January 1, 2012 410.6 669.4 566.6 7.5 1,654.1
Additions to the consolidated Group 6.2 17.2 43.8 0.0 67.2
Disposals in the consolidated Group 0.0 0.0 0.7 0.0 0.7
Additions 9.8 41.6 65.7 13.5 130.6
Disposals 10.9 55.5 39.6 1.1 107.1
Reclassifications 0.9 3.0 2.7 -6.6 -0.1
Currency adjustments 0.9 1.4 4.6 0.1 7.0
December 31, 2012 417.5 677.1 643.0 13.4 1,751.0
ACCUMULATED AMORTIZATION AND IMPAIRMENT
Land and buildings
Technical equipment and
machinery
Other equipment,
office equipment
Advance payments and assets under construction
Total
January 1, 2012 167.0 479.7 360.4 0.0 1,007.1
Additions to the consolidated Group 0.5 3.6 25.6 0.0 29.7
Disposals in the consolidated Group 0.0 0.0 0.1 0.0 0.1
Additions 11.8 50.8 54.8 0.0 117.4
Disposals 7.1 51.8 37.3 0.0 96.2
Write-ups 0.4 0.0 0.0 0.0 0.4
Reclassifications -0.1 -2.2 2.3 0.0 0.0
Currency adjustments 0.3 1.1 2.2 0.0 3.6
December 31, 2012 172.0 481.2 407.9 0.0 1,061.1
Carrying amount December 31, 2012 245.5 195.9 235.1 13.4 689.9
thereof finance leases Carrying amount December 31, 2012 20.9 0.3 5.7 0.0 26.9
Notes to the consolidated financial statements 2013
174

Bilfinger SEAnnual Report 2013
Notes to the consolidated financial statementsNotes to the balance sheet
Finance-lease transactions in the reporting period mainly involve buildings with contract periods of up to 30 years. The payment obligation resulting from finance leases is recognized in the amount of the present value of future lease payments due.
The minimum lease payments, consisting of present value and interest portion, are shown in the following table:
16. Investments accounted for using the equity method
Investments accounted for using the equity method comprise associates and joint ventures.The change primarily results from the classification of the concession projects held for sale as discontinued operations and their presentation
in accordance with IFRS 5. In line with the proportionate equity interests held in associates, the following amounts are to be attributed to the Group:
The most important associates in the reporting period are the construction company Julius Berger Nigeria PLC., Abuja, Nigeria, and the concessions companies M6 Tolna Autópálya Koncessziós Zrt., Budapest, Hungary, and M6 Duna Autópálya Koncessziós Zrt., Budapest, Hungary.
The fair value (quoted price, i.e., Level 1 of the IFRS 13 fair value hierarchy) of the shares held by Bilfinger in Julius Berger Nigeria amounted to €131.1 million at December 31, 2013 (2012: €80.4 million), whereby Bilfinger’s equity interest decreased from 39.9 percent to 33.4 percent.
If the proportionate losses – including results directly recognized in other comprehensive income – exceed the value of the subsidiary, neither losses nor gains are recognized. The cumulative amount of unrecognized losses from associates at December 31, 2013 is €10.9 million (2012: €49.4 million). Unrecognized losses decreased by €38.5 million in the financial year (2012: €36.4 million). These amounts result from unrealized losses recognized in other comprehensive income from hedging transactions for concession projects.
< 1 year 1-5 years > 5 years Total
2013
Lease payments 4.5 6.1 12.4 23.0
Interest portion 0.2 1.0 4.9 6.1
Carrying amount / present value 4.3 5.1 7.5 16.9
2012
Lease payments 4.2 7.8 15.0 27.0
Interest portion 0.3 1.3 7.3 8.9
Carrying amount / present value 3.9 6.5 7.7 18.1
ASSOCIATES
2013 2012
Non-current assets 409.8 1,011.4
Current assets 190.3 390.6
Non-current liabilities 421.1 955.8
Current liabilities 131.4 428.0
Revenue 287.9 641.9
Profit for the year 31.1 20.3
Guarantees from Bilfinger 16.5 6.1
175

Bilfinger SEAnnual Report 2013
In line with the proportionate equity interests held in joint ventures, the following amounts are to be attributed to the Group:
Outstanding equity commitments to concession projects accounted for as joint ventures amounted to €29.6 million in 2012.
17. Receivables from concession projects
Due to the classification of the fully consolidated concession projects held for sale such as discontinued operations and their presentation in accordance with IFRS 5, no receivables from concession projects or the related non-recourse financing are presented.
In the prior-year period, receivables from concession projects represented all services provided in connection with the production of public-private-partnership (PPP) projects for which fixed payments had been agreed irrespective of the extent of use. Due to the length of the payment plans, receivables were measured at the present value of amortized cost. Funds received in the context of loan financing but not yet applied were also presented.
The capitalized amounts from concession projects had corresponding items in non-recourse financial debt.
Receivables from concession projects are comprised as follows:
JOINT VENTURES
2013 2012
Non-current assets 31.5 980.6
Current assets 6.2 63.2
Non-current liabilities 28.5 1,011.0
Current liabilities 9.2 144.9
Revenue 33.5 146.0
Expenses 33.3 134.7
Guarantees from Bilfinger 1.3 1.3
2013 2012
Receivables from concession projects 0.0 497.8
Receivables from project-financing funds not yet applied 0.0 10.5
0.0 508.3
Non-recourse financial debt 0.0 453.7
Notes to the consolidated financial statements 2013
176

Bilfinger SEAnnual Report 2013
Notes to the consolidated financial statementsNotes to the balance sheet
18. Other financial assets
The decrease in loans resulted primarily from the sale of concession projects to BBGI. Equity interests (available for sale, at cost) include shares in non-listed companies, which are measured at cost of acquisition.Securities (available for sale) primarily relate to an equity interest of 8.74 percent (2012: 17.54 percent) in the publicly listed Bilfinger Berger
Global Infrastructure Fund SICAV S.A. (BBGI). The decrease in the equity interest reflects the fact that Bilfinger did not participate in several capital increases of BBGI.
Other financial assets primarily comprise amounts that serve to fulfill pension obligations.The carrying amounts of the loans were reduced by a total of €7.7 million (2012: €36.8 million) through netting with negative market values
from hedging transactions recognized in other comprehensive income.
19. Inventories
Inventories are comprised as follows:
Inventories increased primarily due to first-time consolidation.
2013 2012
Loans 15.6 33.9
Equity interests (available for sale, at cost) 12.4 11.2
Derivative financial instruments in hedging relationships 0.7 0.9
Derivative financial instruments not in hedging relationships 0.0 0.1
Securities (available for sale) 53.4 53.7
Securities (held to maturity) 0.1 0.1
Other financial assets 55.0 58.1
Total 137.2 158.0
2013 2012
Real-estate properties held for sale 45.9 38.4
Finished goods and work in progress 27.4 10.1
Raw materials and supplies 103.7 94.2
Advance payments made 46.7 28.9
Total 223.7 171.6
177
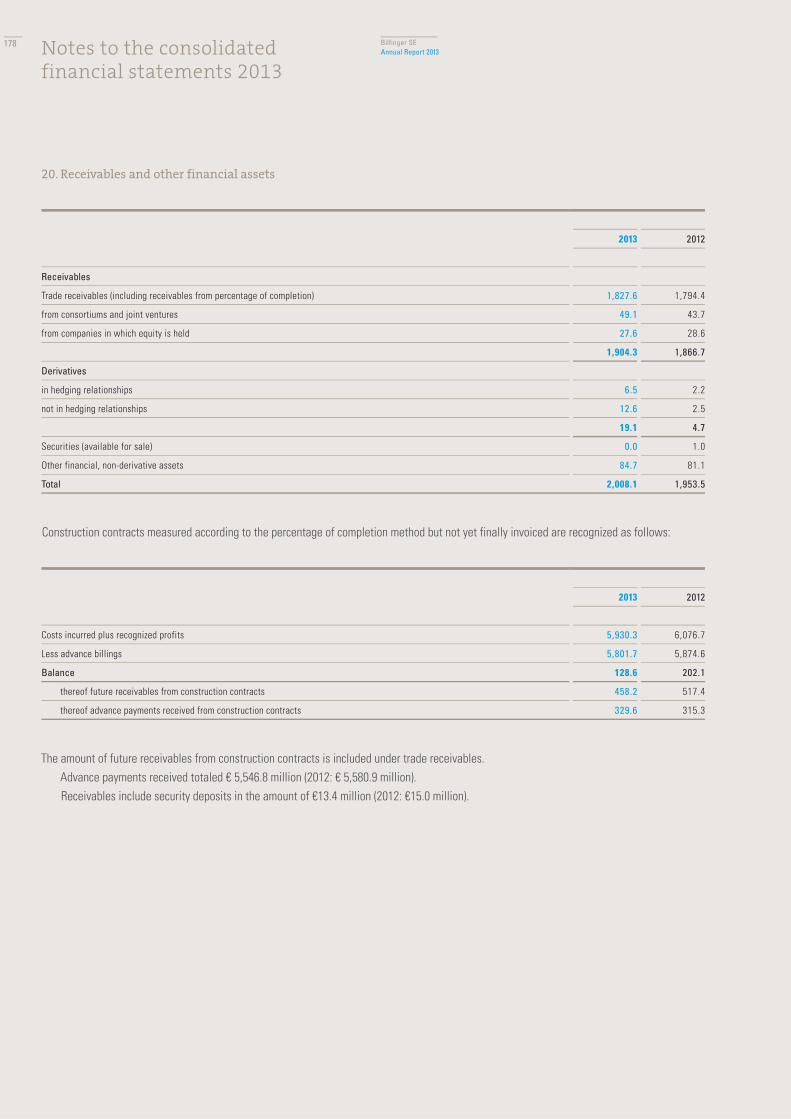
Bilfinger SEAnnual Report 2013
20. Receivables and other financial assets
Construction contracts measured according to the percentage of completion method but not yet finally invoiced are recognized as follows:
The amount of future receivables from construction contracts is included under trade receivables.Advance payments received totaled € 5,546.8 million (2012: € 5,580.9 million).Receivables include security deposits in the amount of €13.4 million (2012: €15.0 million).
2013 2012
Receivables
Trade receivables (including receivables from percentage of completion) 1,827.6 1,794.4
from consortiums and joint ventures 49.1 43.7
from companies in which equity is held 27.6 28.6
1,904.3 1,866.7
Derivatives
in hedging relationships 6.5 2.2
not in hedging relationships 12.6 2.5
19.1 4.7
Securities (available for sale) 0.0 1.0
Other financial, non-derivative assets 84.7 81.1
Total 2,008.1 1,953.5
2013 2012
Costs incurred plus recognized profits 5,930.3 6,076.7
Less advance billings 5,801.7 5,874.6
Balance 128.6 202.1
thereof future receivables from construction contracts 458.2 517.4
thereof advance payments received from construction contracts 329.6 315.3
Notes to the consolidated financial statements 2013
178

Bilfinger SEAnnual Report 2013
Notes to the consolidated financial statementsNotes to the balance sheet
Details of days overdue and impairments of trade receivables are as follows:
Impairments of trade receivables for default risks developed as follows:
All losses and gains from the impairment of trade receivables are recognized under other operating income and other operating expense.No default risk is recognizable for the receivables that are not impaired.Other financial non-derivative assets comprise receivables and assets outside the field of supplying goods and services.
21. Other assets
Other assets primarily include value-added tax claims of €50.2 million (2012: €59.9 million) and prepaid expenses of €23.1 million (2012: €26.6 million).
22. Cash and cash equivalents
At the end of the prior year, cash and cash equivalents included bank deposits of concession companies of €21.1 million, to be applied in accord-ance with project-specific financing agreements.
2013 2012
Receivables neither overdue nor impaired 1,364.7 1,341.7
Receivables overdue but not impaired
less than 30 days 288.6 258.4
30 to 90 days 69.7 73.3
91 to 180 days 25.4 32.7
more than 180 days 72.1 82.3
455.8 446.7
Residual value of impaired receivables 7.1 6.0
Total 1,827.6 1,794.4
2013 2012
Opening balance 32.1 27.6
Changes in the consolidated Group, currency differences -3.3 5.8
Allocations (impairment losses) 8.5 7.9
Utilization 6.7 5.1
Withdrawals (gains on impairment reversals) 3.5 4.1
Closing balance 27.1 32.1
179
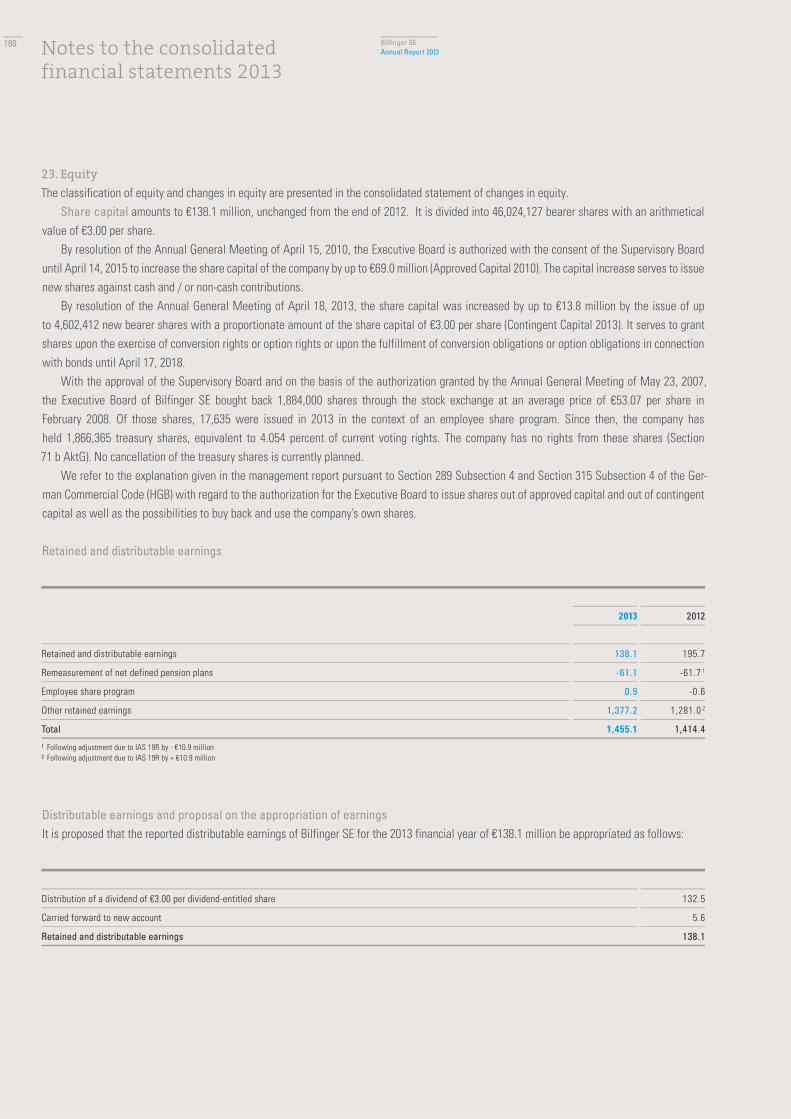
Bilfinger SEAnnual Report 2013
23. Equity
The classification of equity and changes in equity are presented in the consolidated statement of changes in equity.Share capital amounts to €138.1 million, unchanged from the end of 2012. It is divided into 46,024,127 bearer shares with an arithmetical
value of €3.00 per share. By resolution of the Annual General Meeting of April 15, 2010, the Executive Board is authorized with the consent of the Supervisory Board
until April 14, 2015 to increase the share capital of the company by up to €69.0 million (Approved Capital 2010). The capital increase serves to issue new shares against cash and / or non-cash contributions.
By resolution of the Annual General Meeting of April 18, 2013, the share capital was increased by up to €13.8 million by the issue of up to 4,602,412 new bearer shares with a proportionate amount of the share capital of €3.00 per share (Contingent Capital 2013). It serves to grant shares upon the exercise of conversion rights or option rights or upon the fulfillment of conversion obligations or option obligations in connection with bonds until April 17, 2018.
With the approval of the Supervisory Board and on the basis of the authorization granted by the Annual General Meeting of May 23, 2007, the Executive Board of Bilfinger SE bought back 1,884,000 shares through the stock exchange at an average price of €53.07 per share in February 2008. Of those shares, 17,635 were issued in 2013 in the context of an employee share program. Since then, the company has held 1,866,365 treasury shares, equivalent to 4.054 percent of current voting rights. The company has no rights from these shares (Section 71 b AktG). No cancellation of the treasury shares is currently planned.
We refer to the explanation given in the management report pursuant to Section 289 Subsection 4 and Section 315 Subsection 4 of the Ger-man Commercial Code (HGB) with regard to the authorization for the Executive Board to issue shares out of approved capital and out of contingent capital as well as the possibilities to buy back and use the company’s own shares.
Retained and distributable earnings
Distributable earnings and proposal on the appropriation of earningsIt is proposed that the reported distributable earnings of Bilfinger SE for the 2013 financial year of €138.1 million be appropriated as follows:
2013 2012
Retained and distributable earnings 138.1 195.7
Remeasurement of net defined pension plans -61.1 -61.7 1
Employee share program 0.9 -0.6
Other retained earnings 1,377.2 1,281.0 2
Total 1,455.1 1,414.4 1 Following adjustment due to IAS 19R by - €10.9 million 2 Following adjustment due to IAS 19R by + €10.9 million
Distribution of a dividend of €3.00 per dividend-entitled share 132.5
Carried forward to new account 5.6
Retained and distributable earnings 138.1
Notes to the consolidated financial statements 2013
180

Bilfinger SEAnnual Report 2013
Notes to the consolidated financial statementsNotes to the balance sheet
This proposal on the appropriation of earnings is based on the dividend-entitled share capital at March 13, 2014 of €132.5 million (divided into 44,157,762 ordinary shares). Due to a change in the number of treasury shares, the number of dividend-entitled shares may change by the time of the resolution on the appropriation of distributable earnings by the Annual General Meeting. In that case, the Executive Board and the Super-visory Board will make a correspondingly adjusted proposal to the Annual General Meeting on the appropriation of distributable earnings with an unchanged dividend of €3.00 per share. In the prior year, the dividend amounted to €3.00 per share entitled to a dividend. The total dividend distribution was €132.4 million.
Remeasurements include the deviations fully included in the retirement benefit obligation (actuarial gains and losses) between the amount of the retirement benefit obligation expected at the beginning of the year and the actual amount of the retirement benefit obligation at the end of the year, as well as the difference between the income recognized from plan assets based on the amount of the discount rate for the retirement benefit obligation and the income actually achieved from the plan assets.
The accumulated losses from remeasurement recognized in other comprehensive income and attributable to the shareholders of Bilfinger SE amount to €82.8 million before deferred taxes (2012: €81.3 million) and €61.1 million after consideration of deferred taxes (2012: €61.7 million).
As part of an employee share program 2012, employees of Group companies in Germany, once the relevant plan conditions were met, were granted the right to free bonus shares. The share buyback carried out through the stock exchange in 2012 for the issue of free shares to the em-ployees and the periodic recognition of expenses from the program in financial years 2012 and 2013 led to changes in retained earnings.
Other retained earnings principally comprise amounts established from earnings in the period under review or in previous financial years.
Other reservesThe fair-valuation measurement of securities reserve includes unrealized gains and losses on financial assets classified as available for sale and primarily relates to shares in listed investment funds.
The hedging instruments reserve includes the unrealized gains and losses from hedging highly probable future cash flows, taking into consideration any deferred tax effects, and primarily applies to interest-rate derivatives for concession projects.
The currency translation reserve reflects all currency differences arising from the translation of financial statements of foreign subsidiaries.
24. Provisions for pensions and similar obligations
Various retirement benefit obligations exist at the Bilfinger Group, whose heterogenic nature is historically based in the development of the Group with numerous corporate acquisitions. They comprise both defined contribution pension plans and defined benefit pension plans.
With defined contribution pension plans, the company makes fixed contributions on a contractual or voluntary basis to an external pension fund. Beyond those contributions, the company has no legal or constructive payment obligations in the case that the pension fund should not be sufficient to provide the retirement benefit in full. The contributions are recognized as an expense for pension provision when they fall due.
Pension plans that do not meet the definition of defined contribution pension plans are deemed to be defined benefit pension plans and are recognized in the balance sheet at the present value of the defined benefit obligation (DBO). If assets are set aside solely to pay or fund these obligations, those assets are defined as plan assets and are deducted at their fair value and the net amount is presented in the balance sheet. Any amount in excess of the obligation is presented as other financial assets – with due consideration of any asset ceilings.
Obligations from pension commitments are calculated separately for each plan by estimating the amounts of future pension entitlements, which are discounted to their present values at the end of the reporting period. A discount rate is used equivalent to the rate of return on high-grade corporate bonds with an AA rating denominated in the same currency as the pension obligations and with similar maturities. At the end of the reporting period, the amount of the pension obligations is actuarially calculated with consideration of assumptions on future developments and with application of the so-called projected-unit-credit method. The assumptions underlying the calculations are based on published country-specific statistics and on experience. In addition to estimates of future income and pension developments, they also include biometric assumptions. The latter are based on locally recognized mortality tables; these are the 2005 G Guideline Tables by Klaus Heubeck in Germany and the BGV 2010 Generation Tables in Switzerland.
181

Bilfinger SEAnnual Report 2013
Gains and losses from changes in actuarial assumptions and from experience adjustments are recognized in other comprehensive income the period in which they occur. Past service cost due to the curtailment, introduction or amendment of plans is recognized in profit or loss as incurred. The same applies to gains or losses from the settlement of plans.
The first application of the amended regulations of IAS 19 had no impact on the amounts of the provisions for pensions presented in the balance sheet, and no essential impact on earnings in the reporting period and in the prior year.
ACTUARIAL ASSUMPTIONS Euro zone Other countries (weighted)
Euro zone Other countries (weighted)
2013 2012
Discount rate 3.5% 2.8% 3.5% 2.4%
Projected increase in wages and saleries 2.75% 1.7% 2.75% 1.0%
Projected pension increase 1.4% 0.4% 1.5% 0.2%
COMPOSITION BY REGION Euro zone Switzer-land
Other countries
Total Euro zone Switzer-land
Other countries
Total
2013 2012
Defined benefit obligation of funded pension plans 173.9 82.7 28.6 285.2 174.6 84.0 20.4 279.0
Defined benefit obligation of non-funded pension plans 363.5 – 30.3 393.8 331.5 – 30.7 362.2
Defined benefit obligation of all pension plans 537.4 82.7 58.9 679.0 506.1 84.0 51.1 641.2
in percent 79% 12% 9% 100% 79% 13% 8% 100%
Defined benefit obligation of funded pension plans 173.9 82.7 28.6 285.2 174.6 84.0 20.4 279.0
Fair value of plan assets 176.7 66.5 31.1 274.3 175.4 63.4 20.4 259.2
Funded status -2.8 16.2 -2.5 10.9 -0.8 20.6 – 19.8
thereof provisions for pensions 11.6 16.2 1.5 29.3 11.4 20.6 – 32.0
thereof net assets 14.4 – 4.0 18.4 12.2 – – 12.2
Provision for funded pension plans 11.6 16.2 1.5 29.3 11.4 20.6 – 32.0
Provision for non-funded pension plans 363.5 – 30.3 393.8 331.5 – 30.7 362.2
Provisions for pensions and similar obligation, total 375.1 16.2 31.8 423.1 342.9 20.6 30.7 394.2
Notes to the consolidated financial statements 2013
182

Bilfinger SEAnnual Report 2013
Notes to the consolidated financial statementsNotes to the balance sheet
Of gross defined benefit obligation of €679.0 million (2012: €641.2 million), 79 percent relates to the countries of the euro zone. A further 12 percent (2012: 13 percent) relates to Switzerland and 9 percent (2012: 8 percent) relates to other non-euro zone countries, especially Scandinavia. In the euro zone, the majority of the pension plans in the amount of €465.8 million relates to Germany (2012: €431.0 million) and €57.6 million relates to obligations in Austria (2012: €56.8 million).
The pension plans of Group companies in Germany are generally structured so that employees receive commitments to retirement, invalidity and dependants pensions in the form of lifetime annuities whose amount depends on the length of time worked at the Group and partially also on an employee’s level of wage or salary. In addition to direct pension commitments, generally to managerial staff, commitments exist at the Bilfinger Group in the context of company agreements often reached indirectly through relief and pension funds or in the form of direct insurance. The adjust-ment of pensions to price developments takes place in line with the provisions of applicable law at the latest after three years.
For the employees of Bilfinger SE and some domestic subsidiaries, plans exist for occupational retirement, invalidity and dependents pensions granting the employees entitlement to annual contribution credits to an individual retirement benefit account. The amount of the contribution credits is staggered by contribution group or for managerial staff is contractually agreed. Furthermore, employees have the possibility to make additional contributions out of their wages or salaries in order to improve their company pensions. The interest paid on the respective retirement benefit account balances is based on the returns achieved on the related plan assets, whereby a minimum return of 2 percent per annum is guar-anteed by the company. Pension payments can, if applicable and desired by the employee, be made in a lump sum, in installments or in the form of an annuity after the employee has left the company, but at the earliest at the age of 60. The direct benefit obligation (DBO) at the end of the reporting period amounts to €114.3 million (2012: €112.0 million). Due to the fact that payments are made on a defined contribution basis, risks from deviations of the actual developments from biometric assumptions are largely excluded.
In order to protect employees’ rights from these pension commitments, assets in a total amount of €125.4 million (2012: €121.0 million) have been placed in a contractual trust arrangement (CTA), based on the model of a two-way trust and protected against insolvency. In this context, Bilfinger SE had previously transferred assets to the administration of an independent trustee. With regard to investment policy, the trustee is bound by the decisions of an investment committee commissioned by the trustor. The investment strategy follows a total return approach with strict risk limitation. No obligations exist to make further payments into the plan assets.
In Switzerland, company pensions are subject to the Federal Act on Company Retirement, Dependants and Invalid Provision (BVG), whereby such plans are to be administered by legally independent funds. These funds are managed by a board of directors comprising equal numbers of representatives of the employees and of the employers, and are subject to state supervision.
The plan benefits include retirement pension, invalidity pension and dependants pension. The BVG sets certain minimum thresholds in this respect and obliges employers and employees to pay appropriate wage-related contributions into a fund.
Employees’ pension rights exist solely in relation to the fund; there is no liability on the part of the employer. In the case of the fund having insufficient cover, however, suitable remediation measures are to be taken in order to eliminate the deficit within an appropriate time. Within the context of these measures, additional contributions may have to be paid by employees and employer. Retirement benefits are defined by the contribution primacy, risk benefits are defined by the benefit primacy.
The plan assets are invested together with the assets of other pension plans. For each employee, an individual retirement benefit account exists, to which the annual contributions are credited and accrue interest. At the end of the reporting period, obligations of €82.7 million are recognized (2012: €84.0 million) while plan assets are measured at €66.5 million (2012: €63.4 million). There is thus a cover shortfall of €16.2 million (2012: €20.6 million), primarily due to the lower level of interest rates and increased life expectancy following the introduction of the gen-eration-specific BGV 2010 mortality table in 2011. The cover shortfall is to be eliminated in the medium term by taking suitable measures, in par-ticular by reducing the interest credits on pension accounts. The employer contributions to the Swiss pension plans anticipated in 2014 amount to €2.9 million (2012: €3.0 million).
Pension obligations in Austria are claims to severance payments in accordance with national regulations which arose before 2003 and are to be paid as lump sums following termination of employment by the employer or upon retirement. Since 2003, employers have had to pay wage-related contributions to an employee benefit fund in order to finance those claims. These plans qualify as defined contribution plans and the related expenses are therefore recognized as soon as a payment obligation arises.
183

Bilfinger SEAnnual Report 2013
PENSION PLANS Funded Non-funded
Total Funded Non-funded
Total
2013 2012
Defined benefit obligation at January 1 279.0 362.2 641.2 254.1 300.0 554.1
Interest cost on DBO 8.2 13.6 21.8 9.8 14.1 23.9
Service cost 6.8 6.5 13.3 5.3 5.6 10.9
current service cost 6.8 6.6 13.4 5.3 5.6 10.9
past service cost 0.0 -0.1 -0.1 0.0 0.0 0.0
gains / losses on settlements 0.0 0.0 0.0 0.0 0.0 0.0
Settlement payments -0.1 -0.1 -0.2 -0.4 0.0 -0.4
Pension payments -11.9 -18.8 -30.7 -11.3 -15.4 -26.7
Employee contributions 3.9 0.0 3.9 4.1 0.0 4.1
Currency adjustments -4.7 -2.4 -7.1 1.7 1.3 3.0
Additions to the consolidated group 11.3 35.3 46.6 8.2 6.5 14.7
Disposals from the consolidated group 0.0 -3.7 -3.7 -5.6 -0.9 -6.5
Transfers to / from other companies -4.7 -0.2 -4.9 -5.8 1.4 -4.4
Actuarial gains (-) / losses (+) -2.6 1.4 -1.2 18.9 49.6 68.5
from changes in demographic assumptions 0.7 1.6 2.3 0.0 0.0 0.0
from changes in financial assumptions -0.7 0.0 -0.7 18.9 50.2 69.1
from experience adjustments -2.6 -0.2 -2.8 0.0 -0.6 -0.6
Defined benefit obligation at December 31 285.2 393.8 679.0 279.0 362.2 641.2
Fair value of plan assets at January 1 259.2 259.2 252.5 252.5
Interest income on plan assets 8.1 8.1 11.21 11.21
Settlement payments -0.1 -0.1 0.0 0.0
Pension payments -11.9 -11.9 -11.3 -11.3
Allocations to fund (company contributions) 16.0 16.0 -1.8 -1.8
Allocations to fund (employee contributions) 3.9 3.9 4.1 4.1
Currency adjustments -3.5 -3.5 1.5 1.5
Additions to the consolidated group 10.3 10.3 5.6 5.6
Disposals from the consolidated group -0.2 -0.2 -3.1 -3.1
Transfers to / from other companies -4.7 -4.7 -4.3 -4.3
Remeasurements -2.7 -2.7 4.82 4.82
Changes from asset ceiling -0.1 -0.1 0.0 0.0
Fair value of plan assets at December 31 274.3 274.3 259.2 259.2
Defined benefit obligation at December 31 285.2 393.8 679.0 279.0 362.2 641.2
Fair value of plan assets at December 31 274.3 274.3 259.2 259.2
Funded status at December 31 -10.9 -393.8 -404.7 -19.8 -362.2 -382.0
Net pension provisions at December 31 29.3 393.8 423.1 32.0 362.2 394.2
Net plan assets at December 31 18.4 18.4 12.2 12.2
Gains / losses recognized in profit or loss
Current service cost -6.8 -6.6 -13.4 -5.3 -5.6 -10.9
Past service cost 0.0 0.1 0.1 0.0 0.0 0.0
Gains / losses from plan settlements 0.0 0.0 0.0 0.0 0.0 0.0
Net interest cost (-) / income (+) -0.1 -13.6 -13.7 1.41 -14.1 -12.71
Net pension cost -6.9 -20.1 -27.0 -3.91 -19.7 -23.61 1 After adjustment of + €2.0 million due to IAS 19R2 After adjustment of - €2.0 million due to IAS 19R
Notes to the consolidated financial statements 2013
184

Bilfinger SEAnnual Report 2013
Notes to the consolidated financial statementsNotes to the balance sheet
In the income statement, service costs and any gains or losses from settlements are allocated to the respective functional areas and are thus included in EBIT. The net interest cost from the interest accrued on the net pension obligation is presented under interest expense.
The defined contribution pension expense amounted to €27.4 million (2012: €22.2 million); €1.2 (2012: €1.4) million thereof relate to the Execu-tive Board of Bilfinger SE.
The weighted average duration of the pension obligations is 12.1 years.
COMPOSITION OF PLAN ASSETSDec. 31, 2013 Dec. 31, 2012
Total assets 274.3 259.2
Assets with a quoted market price 224.2 213.2
Cash and cash equivalents 3.6 5.7
Equity instruments 27.3 17.4
thereof shares Europe, North America and Australia 26.4 16.9
thereof shares emerging markets 0.9 0.5
Debt instruments 90.6 89.1
thereof government bonds 54.5 48.9
thereof corporate bonds investment grade 18.9 20.8
thereof corporate bonds non-investment grade 0.3 0.0
thereof covered bonds 16.9 19.4
Investment funds 102.3 101.0
thereof equity funds 5.1 7.3
thereof bond funds 77.0 79.1
thereof money-market funds 6.0 6.2
thereof real-estate funds 0.0 0.0
thereof other funds 14.2 8.4
Other assets 0.4 0.0
Assets without a quoted market price 50.1 46.0
Equity instruments 4.0 3.6
thereof shares 3.7 3.6
thereof other equity instruments 0.3 0.0
Debt instruments 1.0 0.0
thereof bonds 0.0 0.0
thereof other debt instruments 1.0 0.0
Real-estate properties 16.5 16.9
thereof used by the Group 0.0 0.0
Qualifying insurance policies 23.2 24.9
Other assets 5.4 0.6
185

Bilfinger SEAnnual Report 2013
For the year 2014, contribution payments to pension plans of €18.9 million are planned. The pension obligations recognized at the end of the reporting period will probably lead to the following – undiscounted – cash outflows in
the next 10 financial years.
Contributions of €126.8 million were paid to state pension insurance institutions (2012: €107 million). Due to the pension plans, the Group is exposed to various risks. A reduction in the interest rate used to discount the provisions for pen-
sions (interest rate for high-grade corporate bonds) would cause the pension obligations to increase. There would be corresponding effects from higher-than-expected income and pension increases. Higher life expectancies than assumed would also lead to an increase in pension obliga-tions, especially when fixed benefits are paid which are independent of the contributions paid in the past. If plan assets exist to cover the pension obligations, it is assumed that they accrue interest at the rate of interest used to discount defined benefit obligation. If the actual interest rate is lower, this leads to an increase in the net pension obligations. For pension plans denominated in foreign currencies, exchange-rate risks also exist.
The following sensitivity analysis shows the change in the pension obligation (DBO) in millions of euros caused by a change in one of the assumptions upon which the calculation is based when all the other assumptions remain unchanged. The calculation methods are otherwise unchanged.
25. Current tax liabilities and other provisions
EXPECTED PENSION PAYMENTS
2014 2015 2016 2017 2018 2019-23
32 31 36 35 35 199
Defined benefit obligation Dec 31, 2013
0.5 percentage point increase 0.5 percentage point decrease
Discount rate -38.3 43.3
Projected wages and saleries 11.3 -10.5
Projected pension increase 24.4 -22.0
Current tax liabilities
Risks relating to contracts
and litigation
Warranty risks
Personnel-related
obligations
Restructuring measures
Excellence
Other uncertain liabilities
Otherprovisions
Total
As of January 1, 2013 101.6 238.7 124.4 85.5 0.0 164.6 613.2 714.8
Utilization 26.2 103.5 41.0 34.1 0.0 51.7 230.3 256.5
Release 0.8 49.5 19.3 5.9 0.0 6.6 81.3 82.1
Additions 41.6 126.3 28.0 30.8 66.8 53.8 305.7 347.3
Currency adjustments -1.7 -0.5 -1.0 -2.0 0.0 -1.9 -5.4 -7.1
Changes in the consolidated group 2.6 2.7 3.0 6.0 0.0 6.5 18.2 20.8
Reclassification of Concessions -0.6 0.0 0.0 -0.1 0.0 -6.9 -7.0 -7.6
As of December 31, 2013 116.5 214.2 94.1 80.2 66.8 157.8 613.1 729.6
Notes to the consolidated financial statements 2013
186

Bilfinger SEAnnual Report 2013
Notes to the consolidated financial statementsNotes to the balance sheet
Maturities of current tax liabilities and other provisions
Risks relating to contracts and litigation primarily comprise provisions for risks from current projects, provisions for reworking and provisions for litigation risks.
Warranty risks primarily comprise provisions for warranties related to individual cases from the valuation of projects. Personnel-related obligations mainly consist of provisions for employee anniversaries and pre-retirement part-time employment as well as
provisions for personnel severance compensation that do not relate to Bilfinger Excellence. The amount of employee anniversaries and pre-retirement part-time employment is calculated annually by external experts.
Provisions for restructuring measures comprise obligations in the context of the Bilfinger Excellence efficiency-enhancing program. In addition to costs for site closures, the provisions primarily relate to severance payments for departing employees.
Other contingent liabilities include a provision for risks in connection with discontinued operations, provisions for contingent losses, costs of annual financial statements, compensation for damages and consultant costs, and other miscellaneous provisions.
26. Financial debt
Project-related non-recourse financing is taken out solely on the respective financed project, without any recourse to Bilfinger. In the prior year, the Concessions business segment accounted for €453.7 million of the total amount.
Liabilities from bonds relate to an unsubordinated unsecured bond placed in December 2012 in the amount of €500 million, for which repayment is due in December 2019. In 2012, liabilities from promissory-note loans still included the tranche of a promissory-note loan placed in 2008 and repaid on July 1, 2013.
Non-current Current Total
2013 2012 2013 2012 2013 2012
Current tax liabilities 0.0 0.0 116.5 101.6 116.5 101.6
Other provisions 60.7 56.6 552.4 556.6 613.1 613.2
Risks relating to contracts and litigation 7.1 5.4 207.1 233.3 214.2 238.7
Warranty risks 17.6 15.4 76.5 109.0 94.1 124.4
Personnel-related obligations 29.6 30.2 50.6 55.3 80.2 85.5
Restructuring measures Excellence 0.0 0.0 66.8 0.0 66.8 0.0
Other uncertain liabilities 6.4 5.6 151.4 159.0 157.8 164.6
Total 60.7 56.6 668.9 658.2 729.6 714.8
Non-current Current Total
2013 2012 2013 2012 2013 2012
Project-financing debt (non-recourse) 0.0 172.8 0.0 7.1 0.0 179.9
Bank debt (non-recourse) 12.6 287.7 28.2 2.4 40.8 290.1
Financial debt, non-recourse 12.6 460.5 28.2 9.5 40.8 470.0
Bonds (recourse) 500.0 500.0 0.0 0.0 500.0 500.0
Promissory note loans (recourse) 0.0 0.0 0.0 166.0 0.0 166.0
Bank debt (recourse) 4.7 5.1 23.8 21.7 28.5 26.8
Finance leases 12.6 14.2 4.3 3.9 16.9 18.1
Financial debt, recourse 517.3 519.3 28.1 191.6 545.4 710.9
187
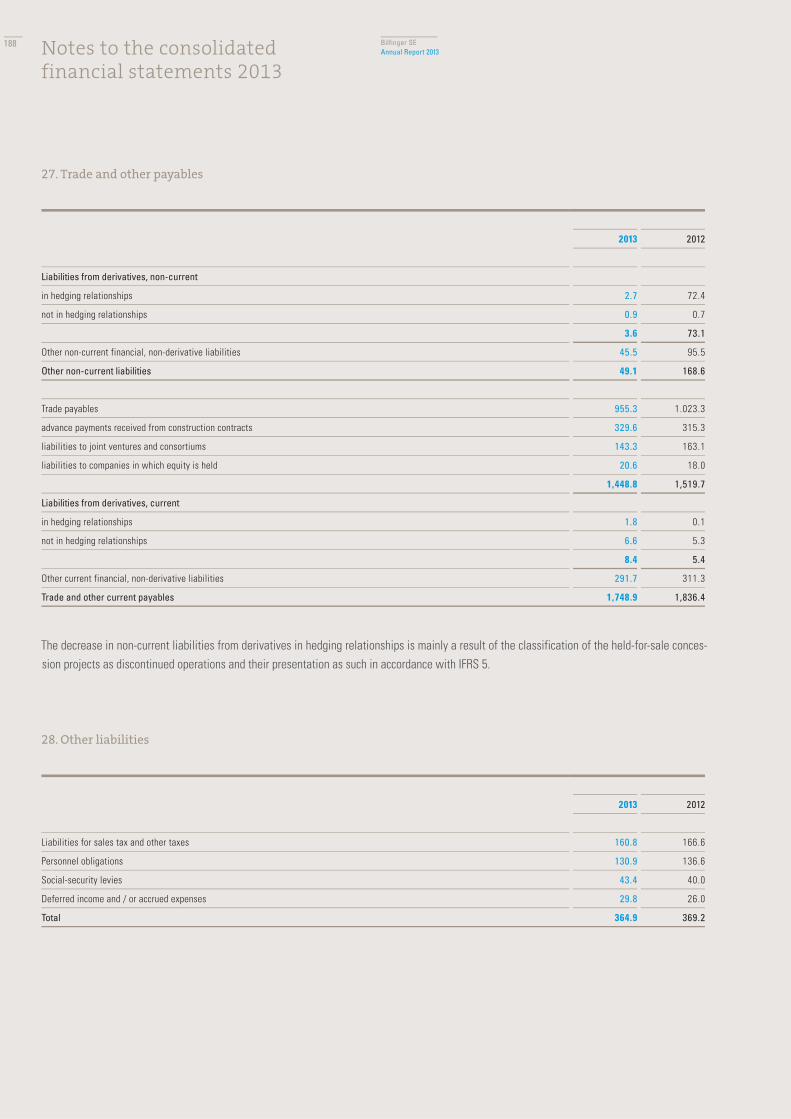
Bilfinger SEAnnual Report 2013
27. Trade and other payables
The decrease in non-current liabilities from derivatives in hedging relationships is mainly a result of the classification of the held-for-sale conces-sion projects as discontinued operations and their presentation as such in accordance with IFRS 5.
28. Other liabilities
2013 2012
Liabilities from derivatives, non-current
in hedging relationships 2.7 72.4
not in hedging relationships 0.9 0.7
3.6 73.1
Other non-current financial, non-derivative liabilities 45.5 95.5
Other non-current liabilities 49.1 168.6
Trade payables 955.3 1.023.3
advance payments received from construction contracts 329.6 315.3
liabilities to joint ventures and consortiums 143.3 163.1
liabilities to companies in which equity is held 20.6 18.0
1,448.8 1,519.7
Liabilities from derivatives, current
in hedging relationships 1.8 0.1
not in hedging relationships 6.6 5.3
8.4 5.4
Other current financial, non-derivative liabilities 291.7 311.3
Trade and other current payables 1,748.9 1,836.4
2013 2012
Liabilities for sales tax and other taxes 160.8 166.6
Personnel obligations 130.9 136.6
Social-security levies 43.4 40.0
Deferred income and / or accrued expenses 29.8 26.0
Total 364.9 369.2
Notes to the consolidated financial statements 2013
188

Bilfinger SEAnnual Report 2013
Notes to the consolidated financial statementsNotes to the balance sheet
29. Additional information on financial instruments
The carrying amounts and fair values of financial assets and financial liabilities, classified according to the categories of IAS 39 and indicating the fair value hierarchy according to IFRS 13, are as follows:
Level according to IFRS 13hierarchy
IAS 39 category
Carryingamount
Fair value
Carryingamount
Fair value
2013 2012
Assets
Receivables from concession projects 2 LaR 0.0 0.0 508.3 664.3
Equity interests (available for sale, at cost) – AfS-aC 12.4 – 11.2 –
Receivables 2 LaR 1,904.3 1,904.3 1,866.7 1,866.7
Other financial, non-derivative assets 2 LaR 155.4 155.9 173.1 173.6
Securities 1 AfS 53.4 53.4 54.7 54.7
Securities 2 HtM 0.1 0.1 0.1 0.1
Cash and cash equivalents 1 LaR 668.7 668.7 1.087.2 1.087.2
Derivatives
in hedging relationships 2 (Hedge) 7.2 7.2 3.1 3.1
not in hedging relationships 2 FAHfT 12.6 12.6 2.6 2.6
Liabilities
Financial debt, non-recourse 2 FLAC 40.8 42.2 470.0 493.1
Financial debt recourse, bonds 1 FLAC 500.0 506.9 500.0 518.7
Financial debt recourse, without bonds and finance leases 2 FLAC 28.5 28.5 192.8 192.6
Finance leases, recourse 2 (IAS 17) 16.9 24.4 18.1 25.8
Liabilities 2 FLAC 1,448.8 1,448.8 1,519.7 1,519.7
Other non-derivative liabilities 2 FLAC 337.2 337.5 406.8 413.6
Derivatives
in hedging relationships 2 (Hedge) 4.5 4.5 72.5 72.5
not in hedging relationships 2 FLHfT 7.5 7.5 6.0 6.0
Aggregated according to valuation categories
Loans and receivables LaR 2,728.4 2,728.9 3,635.3 3,791.9
Available-for-sale financial assets AfS 53.4 53.4 54.7 54.7
Available-for-sale financial assets at cost AfS-aC 12.4 – 11.2 –
Held-to-maturity financial investments HtM 0.1 0.1 0.1 0.1
Financial assets held for trading FAHfT 12.6 12.6 2.6 2.6
Financial liabilities held for trading FLHfT 7.5 7.5 6.0 6.0
Financial liabilities at amortized cost FLAC 2,355.3 2,363.9 3,089.3 3,137.7
189

Bilfinger SEAnnual Report 2013
For cash and cash equivalents, current receivables and liabilities and current other financial non-derivative assets and other non-derivative liabili-ties, the carrying amounts are approximately equal to the fair values due to the short residual terms.
The fair values of non-current financial assets and financial liabilities, which include the measurement categories loans and receivables, held-to-maturity financial investments and financial liabilities at amortized cost, correspond to the present values calculated using current market-based interest-rate parameters.
For derivatives, the fair values are determined with the use of recognized financial-mathematical methods on the basis of observable market data such as exchange rates and interest rates (forwards and swaps: present-value method; options: option-pricing models).
The fair values of the available-for-sale securities and of the recourse financial debt from the bonds issues in financial year 2012 are derived from the respective stock-exchange prices.
Equity interests are measured at cost of acquisition, as fair values cannot be reliably determined.
Hierarchy of fair values by valuation inputs:All assets and liabilities either measured at fair value or for which fair-value disclosures are required are categorized within a level of to the following IFRS 13 measurement hierarchy based on the quality and objectiveness of the inputs used in valuation:
Level 1: Current (unadjusted) prices in active markets for identical assets or liabilities.Level 2: Market data other than the inputs in Level 1 such as prices in active markets for similar assets or liabilities, prices for identical assets or liabilities in markets that are not active, market-corroborated inputs (interest rates, implied volatilities, credit spreads) and derived prices or valuation inputs. Level 2 inputs may have to be adjusted to reflect the features of the asset or liability being measured (condition, location, market activity, etc.).Level 3: Unobservable inputs, i.e., not market data but estimates and the Group’s own information. This data is to be adjusted so that it reflects the assumptions of the (fictive) market participants.
No reclassifications between the IFRS 13 measurement hierarchy levels took place in 2013.
AGGREGATED PRESENTATION ACCORDING TO IFRS 13 HIERARCHY LEVELS
Level Recognized at fair value
Fair value for information
only in the Notes
Recognized at fair value
Fair value for information
only in the Notes
2013 2012
Assets 1 53.4 668.7 54.7 1,087.2
2 19.8 2,060.3 5.7 2,704.7
3 0.0 0.0 0.0 0.0
Liabilities 1 0.0 506.9 0.0 518.7
2 12.0 1,881.4 78.5 2,644.8
3 0.0 0.0 0.0 0.0
Notes to the consolidated financial statements 2013
190
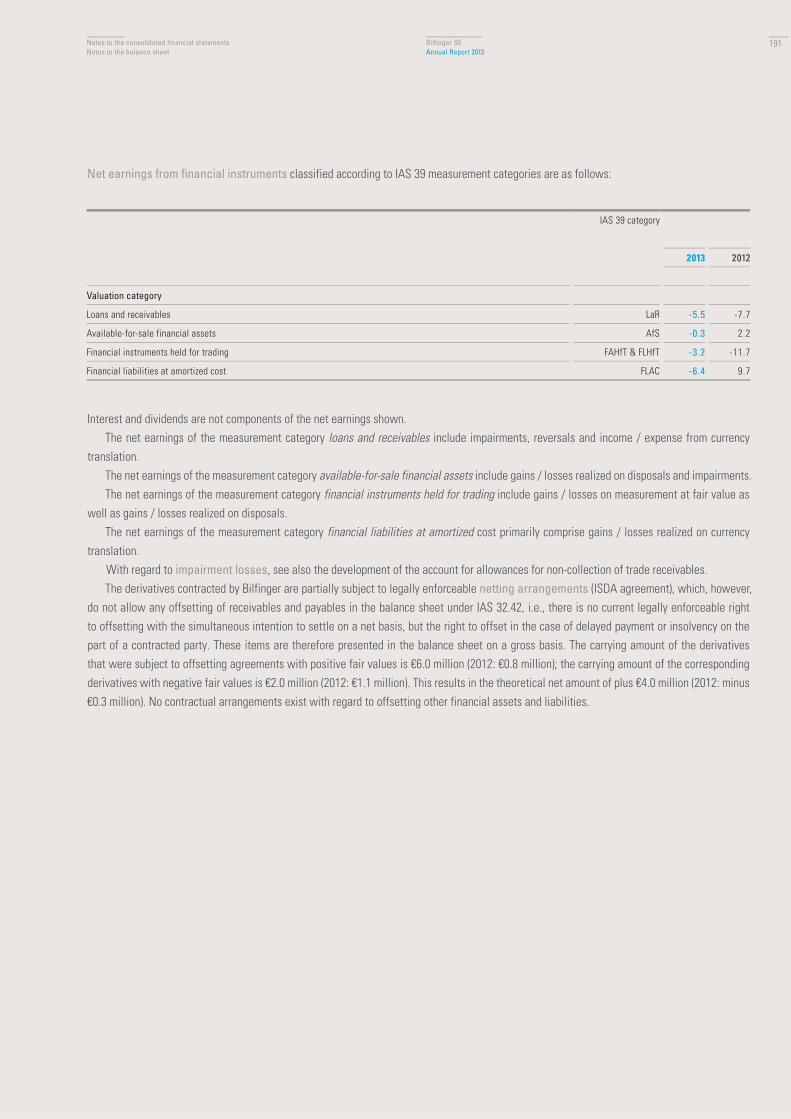
Bilfinger SEAnnual Report 2013
Notes to the consolidated financial statementsNotes to the balance sheet
Net earnings from financial instruments classified according to IAS 39 measurement categories are as follows:
Interest and dividends are not components of the net earnings shown.The net earnings of the measurement category loans and receivables include impairments, reversals and income / expense from currency
translation.The net earnings of the measurement category available-for-sale financial assets include gains / losses realized on disposals and impairments.The net earnings of the measurement category financial instruments held for trading include gains / losses on measurement at fair value as
well as gains / losses realized on disposals.The net earnings of the measurement category financial liabilities at amortized cost primarily comprise gains / losses realized on currency
translation.With regard to impairment losses, see also the development of the account for allowances for non-collection of trade receivables.The derivatives contracted by Bilfinger are partially subject to legally enforceable netting arrangements (ISDA agreement), which, however,
do not allow any offsetting of receivables and payables in the balance sheet under IAS 32.42, i.e., there is no current legally enforceable right to offsetting with the simultaneous intention to settle on a net basis, but the right to offset in the case of delayed payment or insolvency on the part of a contracted party. These items are therefore presented in the balance sheet on a gross basis. The carrying amount of the derivatives that were subject to offsetting agreements with positive fair values is €6.0 million (2012: €0.8 million); the carrying amount of the corresponding derivatives with negative fair values is €2.0 million (2012: €1.1 million). This results in the theoretical net amount of plus €4.0 million (2012: minus €0.3 million). No contractual arrangements exist with regard to offsetting other financial assets and liabilities.
IAS 39 category
2013 2012
Valuation category
Loans and receivables LaR -5.5 -7.7
Available-for-sale financial assets AfS -0.3 2.2
Financial instruments held for trading FAHfT & FLHfT -3.2 -11.7
Financial liabilities at amortized cost FLAC -6.4 9.7
191

Bilfinger SEAnnual Report 2013
30. Risks related to financial instruments, financial risk management and hedging relationships
We monitor financial risks (default risks, liquidity risks and market-price risks) with proven control mechanisms that allow for timely and trans-parent reporting. The Group’s reporting system guarantees the regular identification, analysis, assessment and management of financial risks by Group Treasury. All relevant equity interests and joint ventures are included in this monitoring. There is no extraordinary concentration of risk.
Default risk is the risk that a contracting party of a financial instrument does not fulfill its payment obligations. Substantial counterparty risks can arise in connection with the investment of liquid funds and the application of derivative financial instruments. To limit such risks, we enter into financial transactions exclusively with banks that have a rating of at least ‘A-’. In addition, on the basis of an internal limit system, a diversification of volumes and maturities takes place. Our risk consideration also includes the loss of pre-approved but not yet utilized financing in the project business.
The risk of default on receivables in our business operations is regularly monitored and controlled by the companies of the Group. In this context, use is made, for example, of guarantees and sureties.
In connection with receivables and other financial non-derivative assets, possible default risks are reflected by impairments. The maximum default risk connected with financial assets (e.g., cash and cash equivalents, securities, loans, receivables, derivative financial
instruments) is equal to their carrying amounts in the balance sheet. Liquidity risk is the risk that a company will have difficulties fulfilling the payment obligations arising from its financial liabilities. On the basis of a rolling cash-flow planning, liquidity risks in the Group are monitored and controlled centrally. Within the context of central financing, Bilfinger SE is available to its subsidiaries as a lender of last resort. With the exception of economically
less relevant regions, the Group’s internal equalization of liquidity in Europe is supported by cross-border cash pooling. Investment financing is carried out with consideration of matching maturities. Of the promissory-note bond of €250 million issued for this purpose in 2008, following the repayment of an initial tranche of €84 million in 2011, the second tranche of €166 million was also duly repaid in mid-2013. In financial year 2012, a €500 million bond with maturity in 2019 was issued. To finance working capital, we have a €500 million pre-approved credit line at attractive conditions that is in place until 2016.
The credit lines available for the execution of our project and services business continue to be appropriate to support our future corporate growth. To this end, long-term bilateral credit lines in the amount of €1.8 billion with a term until 2014 are available. In addition, we also have short-term bilateral credit lines. All credit commitments can be called due prematurely in the case of a change of control. The long-term credit agreements include a financial covenant in the form of a limitation of the dynamic gearing ratio. Any breach can lead directly or, through cross-default clauses, indirectly to the repayment call of all financing on a recourse basis. At no time did such a threat exist.
The following chart shows the future contractual undiscounted payments on financial liabilities as of December 31, 2013 and December 31, 2012 (repayments, capital repayments, interest and derivatives with negative fair values). For derivative financial liabilities to be fulfilled on a gross basis (currency derivatives), payments received and payments made are shown; for derivative financial liabilities to be fulfilled on a net basis (interest-rate and commodity derivatives), net payments are shown, whereby the cash flows on the variable side are calculated via the respective forward interest rates.
Notes to the consolidated financial statements 2013
192

Bilfinger SEAnnual Report 2013
Notes to the consolidated financial statementsNotes to the balance sheet
With its international operations, the Bilfinger Group is subject to various market-price risks, relating in particular to currency exchange rates, in-terest rates, raw-materials prices and the market values of financial investments. Our centralized risk management allows us to net out cash flows and financial positions to a large extent. We make use of derivative financial instruments to minimize residual risks and the resulting fluctuations in earnings, valuations and cash flows. We do not undertake any financial transactions beyond the underlying business risk. Hedging is primarily carried out via micro-hedges. Fundamental questions of risk management such as defining or reviewing methods, limits or risk strategies are dealt with by a steering committee with the direct involvement of the Executive Board.
Currency risk is the risk that the fair values or future payments of financial instruments might change due to exchange-rate movements. We use currency futures or currency options to hedge risks relating to foreign-currency cash flows (not translation risks) and balance sheet items denominated in foreign currencies. We generally hedge against transaction risks in the project business for the entire project period immediately after a contract is received. In some cases this is already done during the bidding phase. Risk management takes place with the use of specified risk limits for outstanding foreign-exchange items, their value at risk and marked-to-market results. All future cash flows that are not denominated in the functional currency of the respective company of the Group are subject to currency risk.
Carrying amount Total 2014 2015 2016 2017- 20 > 2020
2013
Financial debt, non-recourse 40.8 44.2 28.5 0.4 1.1 5.5 8.7
Financial debt, recourse, excluding finance leases 528.5 599.7 36.3 12.4 12.4 538.6 0.0
Finance leases, recourse 16.9 24.9 5.7 1.4 1.3 7.6 8.9
Liabilities 1,448.8 1,448.8 1,440.5 1.2 2.3 4.8 0.0
Other financial, non-derivative liabilities 337.2 340.1 300.7 10.1 17.9 7.9 3.5
Derivative financial liabilities to be fulfilled on a net basis 0.0 0.0 0.0 0.0 0.0 0.0 0.0
Derivative financial liabilities to be fulfilled on a gross basis 12.0
Payments received 604.6 515.7 43.0 40.4 5.5 0.0
Payments made 614.7 518.0 46.6 44.1 6.0 0.0
10.1 2.3 3.6 3.7 0.5 0.0
Carrying amount Total 2013 2014 2015 2016-19 > 2019
2012
Financial debt, non-recourse 470.0 820.8 38.8 81.5 29.2 120.8 550.5
Financial debt, recourse, excluding finance leases 692.8 776.5 201.5 14.3 13.1 547.6 0.0
Finance leases, recourse 18.1 28.3 5.0 2.6 1.7 4.5 14.5
Liabilities 1,519.7 1,519.7 1,498.7 14.7 1.3 5.0 0.0
Other financial, non-derivative liabilities 406.8 418.8 322.9 41.8 16.7 13.7 23.7
Derivative financial liabilities to be fulfilled on a net basis 70.0 86.8 12.7 8.3 7.5 19.8 38.5
Derivative financial liabilities to be fulfilled on a gross basis 8.5
Payments received 348.2 332.8 12.0 0.5 2.9 0.0
Payments made 350.8 333.7 13.1 0.6 3.4 0.0
2.6 0.9 1.1 0.1 0.5 0.0
193

Bilfinger SEAnnual Report 2013
Interest-rate risk is the risk that the fair values or future payments of financial instruments might change due to movements in market interest rates. We counteract the risks of interest-rate changes by continually reviewing and, when required, adjusting the composition of recourse liabili-ties subject to fixed and variable interest rates. We assess risks in consideration of future needs for new financing or refinancing on the basis of a cash-flow-at-risk model. The borrowing costs budgeted within the scope of the cost-of-capital model serve as a point of reference. To manage this, we generally apply derivative financial instruments such as interest-rate swaps and swaptions.
In the area of non-recourse project financing, however, liabilities are hedged with full maturity matching with the use of interest-rate swaps. Changes in market value occurring in this context must be reflected in the balance sheet, but they have no impact on the success of the relevant project or on the Group’s cash flows.
Inflation risks are subsumed under interest-rate risk. Inflation risk is the risk that the fair values or future payments of financial instruments might change due to movements in inflation rates or price indices.
Raw-material price risk is the risk of changes in the market prices of those raw materials that the Group purchases. Whenever possible, hedging against price fluctuations of raw materials is undertaken on the basis of fixed-price agreements for deliveries or sliding-price clauses for consumption at a physical level. If this is not possible, hedging is carried out with the use of commodity swaps, for diesel fuel or bitumen, for example.
Bilfinger uses the value-at-risk method to quantify market-price risks. The value at risk is the potential loss of a particular risk position that with a probability of 95 percent will not be exceeded during the next five days. The calculation takes place on the basis of the variance-covariance approach. The value at risk is the maximum possible loss on the basis of the specified parameters, but does not make a statement on the distribu-tion of loss or expected extent of loss if it is actually exceeded.
When calculating the value at risk for currency risks, potential changes in the valuation of the monetary financial instruments (cash and cash equivalents, receivables, interest-bearing debt, liabilities) that are not denominated in the functional currency and currency derivatives are taken into consideration.
The value at risk for the risk of changes in interest rates takes into consideration potential changes in the valuation of financial instruments that are measured at fair value. In the prior-year period, this mainly involved interest-rate swaps designated as hedging instruments in the context of cash-flow hedges, so that the risk of a change in interest rates mainly related to income and expense recognized directly in other comprehensive income (unrealized gains / losses on hedging instruments) and not in profit or loss.
The periodic effects are determined by relating the hypothetical changes in the risk variables to the volume of financial instruments held at the end of the reporting period. It is assumed that the volume at the balance sheet date is representative of the whole year.
Due to the consistent application of the financing policy, there were again no negative effects on the Group’s financial position or earnings in the reporting year.
VALUE AT RISK
2013 2012
Currency risk 9.0 8.1
Interest-rate risk 0.0 3.4
Notes to the consolidated financial statements 2013
194
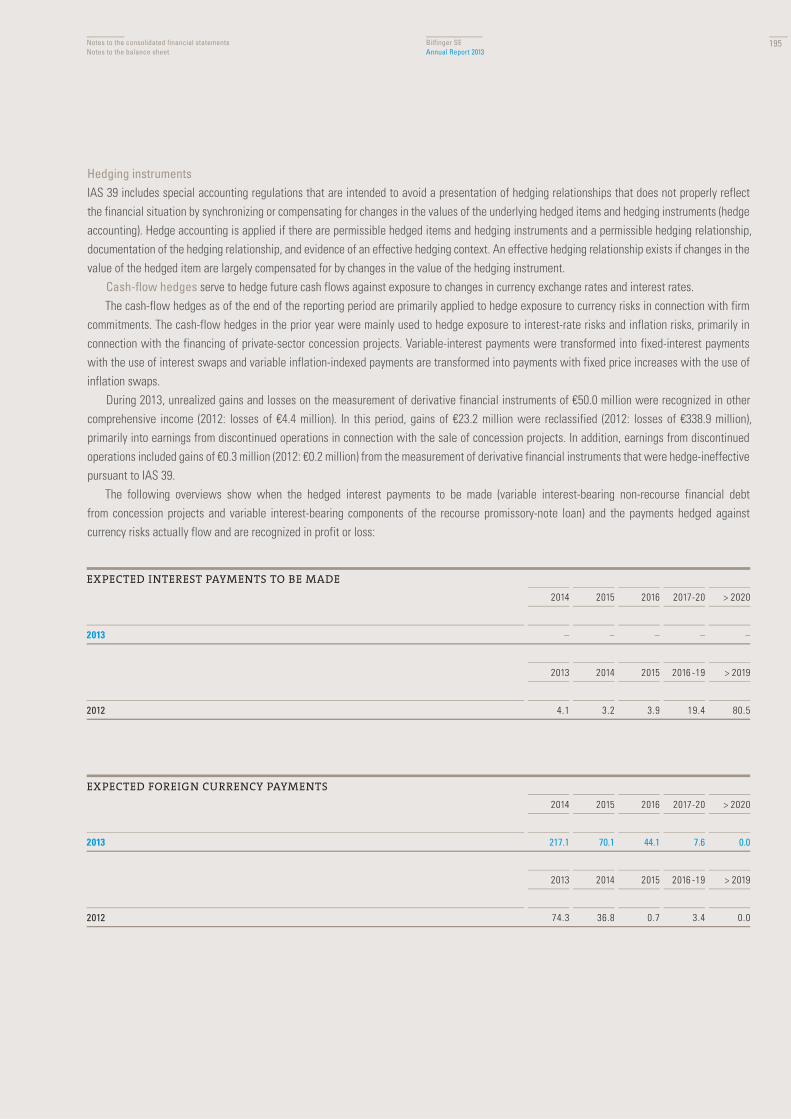
Bilfinger SEAnnual Report 2013
Notes to the consolidated financial statementsNotes to the balance sheet
Hedging instrumentsIAS 39 includes special accounting regulations that are intended to avoid a presentation of hedging relationships that does not properly reflect the financial situation by synchronizing or compensating for changes in the values of the underlying hedged items and hedging instruments (hedge accounting). Hedge accounting is applied if there are permissible hedged items and hedging instruments and a permissible hedging relationship, documentation of the hedging relationship, and evidence of an effective hedging context. An effective hedging relationship exists if changes in the value of the hedged item are largely compensated for by changes in the value of the hedging instrument.
Cash-flow hedges serve to hedge future cash flows against exposure to changes in currency exchange rates and interest rates. The cash-flow hedges as of the end of the reporting period are primarily applied to hedge exposure to currency risks in connection with firm
commitments. The cash-flow hedges in the prior year were mainly used to hedge exposure to interest-rate risks and inflation risks, primarily in connection with the financing of private-sector concession projects. Variable-interest payments were transformed into fixed-interest payments with the use of interest swaps and variable inflation-indexed payments are transformed into payments with fixed price increases with the use of inflation swaps.
During 2013, unrealized gains and losses on the measurement of derivative financial instruments of €50.0 million were recognized in other comprehensive income (2012: losses of €4.4 million). In this period, gains of €23.2 million were reclassified (2012: losses of €338.9 million), primarily into earnings from discontinued operations in connection with the sale of concession projects. In addition, earnings from discontinued operations included gains of €0.3 million (2012: €0.2 million) from the measurement of derivative financial instruments that were hedge-ineffective pursuant to IAS 39.
The following overviews show when the hedged interest payments to be made (variable interest-bearing non-recourse financial debt from concession projects and variable interest-bearing components of the recourse promissory-note loan) and the payments hedged against currency risks actually flow and are recognized in profit or loss:
EXPECTED INTEREST PAYMENTS TO BE MADE
2014 2015 2016 2017-20 > 2020
2013 – – – – –
2013 2014 2015 2016 -19 > 2019
2012 4.1 3.2 3.9 19.4 80.5
EXPECTED FOREIGN CURRENCY PAYMENTS
2014 2015 2016 2017-20 > 2020
2013 217.1 70.1 44.1 7.6 0.0
2013 2014 2015 2016 -19 > 2019
2012 74.3 36.8 0.7 3.4 0.0
195

Bilfinger SEAnnual Report 2013
The following table shows the fair values of the various types of derivative financial instruments that Bilfinger uses to hedge market-price risks. A difference is made depending on whether they are hedge-effective or hedge-ineffective pursuant to IAS 39.
31. Additional information on capital management
The goal of capital management at Bilfinger is to maintain a strong financial profile including adherence to the financial covenant. In addition to securing liquidity and limiting financial risks, the focus is on maintaining sufficient financial flexibility as a precondition for the continuous further development of our business portfolio. We aim to optimize the total cost of capital on the basis of an adequate capital structure. In 2012, for the first time, the credit quality of Bilfinger was evaluated by rating agency Standard & Poor’s. The rating as of December 31, 2013 is unchanged at BBB+ / stable outlook (investment grade).
On the basis of mid-term corporate planning and with a view to various acquisition and development scenarios, the financial scope for action is regularly analyzed in terms of any action that might need to be taken.
.
2013 2012
Derivatives with positive fair values
in hedging relationships
Currency derivatives 7.2 3.1
7.2 3.1
not in hedging relationships
Currency derivatives 12.6 2.6
12.6 2.6
Total derivatives with positive fair values 19.8 5.7
Derivatives with negative fair values
in hedging relationships
Interest-rate swaps 0.0 70.0
Currency derivatives 4.5 2.5
4.5 72.5
not in hedging relationships
Currency derivatives 7.5 6.0
7.5 6.0
Total derivatives with negative fair values 12.0 78.5
Notes to the consolidated financial statements 2013
196

Bilfinger SEAnnual Report 2013
Notes to the consolidated financial statementsNotes to the balance sheet
The key metrics used are as follows:
Non-recourse financial debt is not taken into consideration for the calculation of these metrics. At the end of the reporting period the metrics were generally well within the target values.
32. Contingent liabilities and other financial obligations
Contingent liabilities relate to guarantees, mainly provided to associates, joint ventures and non-consolidated subsidiaries. In addition, we are jointly and severally liable as partners in companies constituted under the German Civil Code and in connection with consortiums and joint ventures.
The other financial obligations from operating leases also include, in line with IAS 17, other forms of arrangements for the use of assets, in particular rental agreements.
The future payments from non-terminable operating leases primarily relate to real estate, scaffolding, items of equipment and furnishings, and vehicles.
The expenses recognized in profit or loss of operating leases amounted to €264.2 million in 2013 (2012: €200.4 million).
2013 2012
Liabilities from guarantees 40.3 35.2
Minimum lease payments on
operating leases
2013 2012
< 1 year 125.6 145.3
1-5 years 212.2 201.7
> 5 years 54.9 68.3
Target value
Key figure
Dynamic debt-equity ratio (net debt / EBITDA) < 2.5
Gearing (total debt / total capital) < 40%
Cash flow protection (funds from operations / net debt) > 40%
197

Bilfinger SEAnnual Report 2013
33. Notes to the statement of cash flows
The cash flow from operating activities of continuing and discontinued operations includes the following items in the reporting year:
Proceeds from the disposal of concession projects in the amount of €58.0 million relate to subsidiaries (2012: €270.3 million).
34. Events after the balance sheet date
There have been no significant events since the balance sheet date.
2013 2012
Interest payments 19.0 22.6
Interest received 4.3 12.7
Dividends received 15.2 18.4
Income tax payments 63.3 60.6
Tax refunds 2.0 1.4
Notes to the consolidated financial statements 2013
198

Bilfinger SEAnnual Report 2013
Notes to the consolidated financial statementsNotes to the balance sheet / Other disclosures
35. Executive and Supervisory Board
Compensation for the members of the Executive Board comprises several components:
__ Annual base salaries of €2,744 thousand (2012: €2,600 thousand)__ Variable remuneration (immediately in cash) with a long-term incentive effect in the form of a profit-sharing model of €4,693 thousand (2012: €4,878 thousand)
__ Variable remuneration (deferral, share-based) with a long-term incentive effect in the form of a profit-sharing model of €2,500 thousand (2012: €2,563 thousand)
__ Severance pay and compensation of €3,967 thousand (2012: €4,215 thousand)__ Non-cash benefits of €327 thousand (2012: €326 thousand)__ Pension commitments: For the year under review, defined contribution payments were made of €1,196 thousand (2012: €1,370 thousand) to external pension institutions and a further €180 thousand was directly paid out in retirement benefits (2012: €0 thousand).
Of share-based payments to the members of the Executive Board in 2013, the following amounts have been recognized as expenses:
Total remuneration of the members of the Supervisory Board amounts to €1,337 thousand (2012: €1,327 thousand), including reimbursement of expenses of €30 thousand (2012: €21 thousand).
Additional details including individualized remuneration are provided in the remuneration report, which is a part of the management report.Total remuneration paid to former members of the Executive Board or their surviving dependants amounted to €2,169 thousand
(2012: €2,238 thousand). The present value of future pension obligations for those persons calculated according to IAS 19 amounts to €27,264 thousand (2012: €27,524 thousand).
36. Share-based payment
Cash-settled share-based payments exist in the context of the remuneration of Executive Board members and involve a long-term incentive plan (LTI) that runs until 2015, as well as variable cash remuneration depending on the relative performance of the Bilfinger share price (deferral). Details of these payments are provided in the remuneration report, which is a part of the management report.
Equity-settled share-based payments exist in the context of an employee share program in 2012. Under this program, employees of German Group companies were able to acquire Bilfinger shares for up to 10 percent of their annual gross salary for an average price of €75.13
Other disclosures
€ thousand
2013 2012
Roland Koch (Chairman) 589 718
Joachim Enenkel 359 412
Dr. Jochen Keysberg (from November 1, 2012) 352 60
Pieter Koolen (from September 19, 2013) 103 0
Joachim Müller 450 535
Klaus Raps (until December 31, 2012) 0 -29
Thomas Töpfer (until October 31, 2013) 14 499
Total 1,867 2,195
199

Bilfinger SEAnnual Report 2013
(own investment). For a maximum of five share packages each of five shares, the plan participants received one bonus share per package, totaling 12,250 shares. In addition, for each share package, participants were granted the right to one Bilfinger share free of charge (matching share) after two, four and six years (vesting periods). A precondition for the granting of bonus and matching shares is that the plan participants do not dispose of their own investment until the end of the respective vesting period and continue to be employed at the Bilfinger Group. In total, 16,954 share packages with entitlement to matching shares were acquired by plan participants. At the end of the reporting period, the number had decreased to 16,410 share packages which – provided that the plan conditions are fulfilled – entitle the participants to obtain 16,410 matching shares in each of the years 2014, 2016 and 2018. The shares to be issued free of charge from the program have been measured at their fair value at the time of issue. That fair value for future matching shares is the result of the stock-market price of Bilfinger shares less the present value of the dividends expected during the vesting period. The average fair value of the future matching shares was €65.11 when granted.
Within the framework of an additional employee share program in the reporting period, 3,527 employees were issued with a total of 17,635 of the company’s treasury shares with certain tax advantages. Of that total, 3,211 employees acquired the shares by offsetting their price against an upcoming bonus payment. The remaining difference of €8.96 per share compared with the current stock-exchange price was borne by the company. Executives were solely able to acquire the shares at the current stock-exchange price.
The costs resulting for Bilfinger from the employee share programs are deferred pro rata temporis over the vesting period. The expense recog-nized through profit or loss of cash-settled and equity-settled share-based payments was €5.0 million in 2013 (2012: €2.6 million).
37. Related-party disclosures
Related parties as defined by IAS 24 are persons or entities that can be significantly influenced by the reporting company or that can exert a sig-nificant influence on the reporting company.
The significant transactions between fully consolidated companies of the Group and related parties mainly involved associates, joint ventures and non-consolidated subsidiaries. They are shown in the table below.
Remuneration of the Executive Board and the Supervisory Board is explained in the previous note and in the remuneration report. No further trans-actions with the Executive Board, the Supervisory Board and their close relatives who are subject to disclosure took place in the reporting year.
38. Auditors’ fees
The amounts listed below cover all of the services provided to the companies of the Bilfinger Group by our external auditors, Ernst & Young, in the 2013 financial year. The amounts of these services provided by Ernst & Young GmbH Wirtschaftsprüfunsgesellschaft are shown as ‘thereof’ in the following table.
€ million Associates Joint ventures Non-consolidated subsidiaries
2013 2012 2013 2012 2013 2012
Revenue 41.6 219.7 0.0 0.0 5.6 6.4
Services received 41.3 48.5 0.0 0.0 2.6 3.0
Receivables 20.5 18.0 2.6 19.9 13.8 17.6
Liabilities 15.9 8.3 1.7 4.1 2.9 5.6
Guarantees granted 16.5 6.1 1.3 1.3 10.9 13.5
Notes to the consolidated financial statements 2013
200
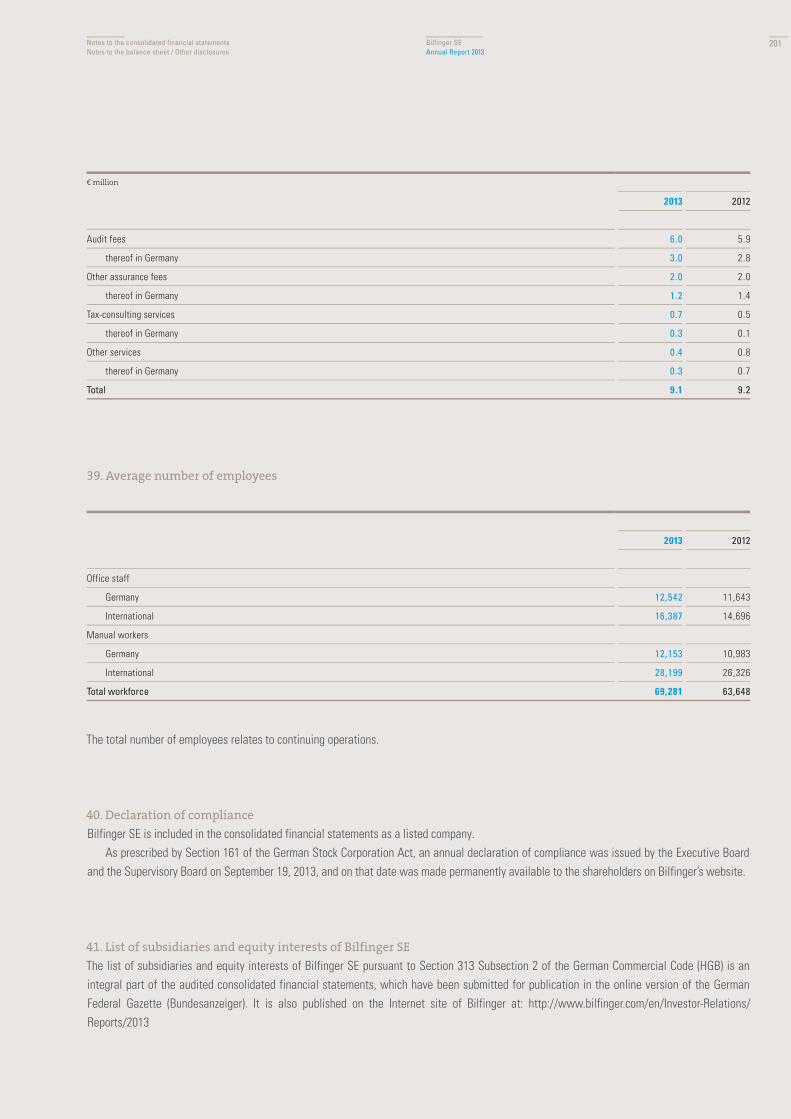
Bilfinger SEAnnual Report 2013
Notes to the consolidated financial statementsNotes to the balance sheet / Other disclosures
39. Average number of employees
The total number of employees relates to continuing operations.
40. Declaration of compliance
Bilfinger SE is included in the consolidated financial statements as a listed company.As prescribed by Section 161 of the German Stock Corporation Act, an annual declaration of compliance was issued by the Executive Board
and the Supervisory Board on September 19, 2013, and on that date was made permanently available to the shareholders on Bilfinger’s website.
41. List of subsidiaries and equity interests of Bilfinger SE
The list of subsidiaries and equity interests of Bilfinger SE pursuant to Section 313 Subsection 2 of the German Commercial Code (HGB) is an integral part of the audited consolidated financial statements, which have been submitted for publication in the online version of the German Federal Gazette (Bundesanzeiger). It is also published on the Internet site of Bilfinger at: http://www.bilfinger.com/en/Investor-Relations/Reports/2013
€ million
2013 2012
Audit fees 6.0 5.9
thereof in Germany 3.0 2.8
Other assurance fees 2.0 2.0
thereof in Germany 1.2 1.4
Tax-consulting services 0.7 0.5
thereof in Germany 0.3 0.1
Other services 0.4 0.8
thereof in Germany 0.3 0.7
Total 9.1 9.2
2013 2012
Office staff
Germany 12,542 11,643
International 16,387 14,696
Manual workers
Germany 12,153 10,983
International 28,199 26,326
Total workforce 69,281 63,648
201

202

204 Return-on-capital-employed controlling 207 Boards of the Company 210 Glossary 212 Ten-year overview 214 Financial calendar
Additional information
203

€ million
Goodwill
Property, plant and equipment
Other non-current assets
Current assets
Segment assets
Segment liabilities
Interest-bearing liabilities
Non-interest-bearing liabilities
Balance
Financial assets, project-related
Financial assets, division-related
Operating financial assets
Capital employed
EBITA adjusted
Interest income
Interest income, project-related (4.5% p.a.)
Interest income, division-related (4.5% p.a.)
Return
ROCE (return on capital employed)
WACC (weighted average cost of capital)
Value added, relative
Value added, absolute
Bilfinger SEAnnual Report 2013Return-on-capital-employed
controlling
Explanation of return-on-capital-employed controlling
Our return-on-capital-employed controlling is based on segment reporting, which is conducted in accordance with the organizational structure of our business segments. From this financial year, we are focusing only on continuing operations in order to provide better comparability over time in the consideration of return on capital employed.
Segment assets of the business segments include goodwill and intangible assets from acquisitions; property, plant and equipment; other non-current assets (with the exception of deferred tax assets), and current assets. Segment assets shown under consolidation / other include cash and cash equivalents, as well as non-current and current assets not allocated to the business segments.
Segment liabilities are deducted from segment assets. They include liabilities (with the exception of deferred tax liabilities) and provisions that are available to the company free of interest. Financial liabilities and retirement benefit obligations are not included.
We refer to segment liabilities as non-interest-bearing liabilities. The balance of segment assets and non-interest-bearing liabilities repre-sents the capital directly employed in the business segments.
Project-related and business-unit-related financial assets are allocated to the business segments in the context of return-on-capital controlling so that adequate capital resources are taken into consideration. As so-called operating financial assets, they adjust the balance, which results in the average tied-up interest-bearing assets. This item is termed capital employed.
204

Industrial Power Building and Facility
Construction Totalof segments
Consolidation /other
Totalcontinuing
operations
2013 2012 2013 2012 2013 2012 2013 2012 2013 2012 2013 2012 2013 2012
930.2 819.5 364.3 331.2 585.1 514.3 37.2 32.8 1,916.8 1,697.8 0.0 0.0 1,916.8 1,697.8
353.3 338.7 138.4 130.5 75.1 51.6 108.1 100.6 674.9 621.4 64.8 64.9 739.7 686.3
24.5 28.9 7.0 8.0 27.8 52.6 16.4 15.8 75.7 105.3 124.6 116.2 200.3 221.5
1,034.9 956.1 395.3 335.1 587.0 482.6 273.1 359.2 2,290.3 2,133.0 1,089.6 711.3 3,379.9 2,844.3
2,342.9 2,143.2 905.0 804.8 1,275.0 1,101.1 434.8 508.4 4,957.7 4,557.5 1,279.0 892.4 6,236.7 5,449.9
806.7 791.9 430.1 465.6 764.9 602.2 438.2 581.9 2,439.9 2,441.6 1,960.0 1,653.4 4,399.9 4,095.0
0.0 0.0 0.0 0.0 0.0 6.8 0.0 0.0 0.0 6.8 -1,246.0 -1,210.8 -1,246.0 -1,204.0
806.7 791.9 430.1 465.6 764.9 609.0 438.2 581.9 2,439.9 2,448.4 714.0 442.6 3,153.9 2,891.0
1,536.2 1,351.3 474.9 339.3 510.1 492.1 -3.4 -73.5 2,517.8 2,109.1 565.0 449.8 3,082.8 2,558.9
0.0 0.0 0.0 0.0 0.0 0.0 3.4 73.5 3.4 73.5 -3.4 -73.5 0.0 0.0
0.0 0.0 0.0 44.7 155.7 33.1 227.1 242.5 382.8 320.3 -382.8 -320.3 0.0 0.0
0.0 0.0 0.0 44.7 155.7 33.1 230.5 316.0 386.2 393.8 -386.2 -393.8 0.0 0.0
1,536.2 1,351.3 474.9 384.0 665.8 525.2 227.1 242.5 2,904.0 2,502.9 178.8 56.0 3,082.8 2,558.9
232.2 205.7 123.0 122.7 115.4 106.3 1.0 24.8 471.6 459.5 -62.9 -72.8 408.7 386.7
0.0 0.0 0.0 0.0 0.0 0.0 0.0 0.0 0.0 0.0 10.0 14.5 10.0 14.5
0.0 0.0 0.0 0.0 0.0 0.0 0.2 3.3 0.2 3.3 -0.2 -3.3 0.0 0.0
0.0 0.0 0.0 2.0 6.9 1.5 10.2 10.9 17.1 14.4 -17.1 -14.4 0.0 0.0
232.2 205.7 123.0 124.7 122.3 107.8 11.4 39.0 488.9 477.2 -70.2 -76.0 418.7 401.2
15.1% 15.2% 25.9% 32.5% 18.4% 20.5% 5.0% 16.1% 16.8% 19.1% – – 13.6% 15.7%
8.75% 9.25% 8.75% 9.25% 8.75% 9.25% 11.50% 11.25% 9.00% 9.25% – – 9.00% 9.25%
6.4% 6.0% 17.2% 23.2% 9.6% 11.3% -6.5% 4.8% 7.8% 9.8% – – 4.6% 6.4%
97.7 80.7 81.5 89.2 64.1 59.2 -14.7 11.7 228.6 240.8 -87.4 -76.3 141.2 164.5
Bilfinger SEAnnual Report 2013
Additional informationReturn-on-capital-employed controlling
The definition of return as used in the return-on-capital-employed concept is derived from adjusted EBITA.Interest income is earned primarily from the investment of cash deposits listed under ‘consolidation / other’. In order to determine a measure of earnings not affected by the form of financing, interest expenses are fundamentally not taken into
consideration in the context of return-on-capital-employed controlling. Project-related and business-unit-related interest income relates to credit entries on operating financial assets made by headquarters
to the benefit of the business segments.Return as defined by our return-on-capital-employed controlling is the sum of adjusted EBITA and the described additional financial
components.ROCE stands for return on capital employed, expressed as a percentage. It is compared with the weighted average cost of capital (WACC) for
the business segments and for the entire Group. The difference between ROCE and WACC is relative value added. Absolute value added is the difference between return and the cost of
capital employed, and is equal to the amount of capital employed multiplied by relative economic value added.
205

Bilfinger SEAnnual Report 2013
206

Bilfinger SEAnnual Report 2013
Roland Koch, Chairman of the Executive Board __
Strategy | Human Resources (Labor Director) | Legal | Compliance | Project Controlling | Communications & Marketing | Group Organization__
Memberships in statutory supervisory boards of other German companies:
UBS Deutschland AG, Frankfurt am Main (Chairman)
Memberships in comparable monitoring boards of other German and foreign companies:
Bilfinger North America Inc., Wilmington / USA* Hessische Staatsweingüter GmbH Kloster Eberbach, Eltville (Chairman)
Joachim Enenkel __
Divisions:Construction | Infrastructure | Piping Systems | Power Systems
Development and Technology __
Memberships in comparable monitoring boards of other German and foreign companies:
Bilfinger Infrastructure S.A., Warsaw / Poland* (Deputy Chairman)Hydrobudowa-6 S.A., Warsaw / Poland* (Deputy Chairman)
Dr. Jochen Keysberg__
Divisions:Building | Facility Services | Real Estate | Water Technologies
Government Services
Pieter Koolen (from September 19, 2013)__
Divisions:Engineering, Automation and Control | Industrial Fabrication and Installation | Industrial Maintenance | Insulation, Scaffolding and Painting | Oil and Gas | Support Services
HSEQ (Health, Safety, Environment and Quality)
Joachim Müller__Accounting | Finance | Controlling | M & A | Internal Audit | Taxes | Investor Relations | Purchasing | IT__
Memberships in comparable monitoring boards of other German and foreign companies:
Bilfinger Infrastructure S.A., Warsaw / Poland*FCHC Corporation, Reston / USA* (Deputy Chairman)Hydrobudowa-6 S.A., Warsaw / Poland*
Thomas Töpfer (until October 31, 2013)__
Industrial Services | Concessions | HSEQ (Health, Safety, Environment and Quality)
Unless otherwise indicated, all details correct at December 31, 2013. The divisional structure, however, has been taken into consideration.
* Group mandate
Boards of the CompanyExecutive Board
207

Bilfinger SEAnnual Report 2013Boards of the Company
Supervisory Board
Honorary Chairman:__
Gert Becker
Dr. hc. Bernhard Walter, Chairman__
Former Speaker of the Executive Board of Dresdner Bank AG
Memberships in statutory supervisory boards of other German companies:
Daimler AG, StuttgartDeutsche Telekom AG, Bonn
Stephan Brückner, Deputy Chairman__
Employee of Bilfinger Maintenance Südwest GmbH
Herbert Bodner (from July 1, 2013) __
Former Chairman of the Executive Board of Bilfinger SE
Volker Böhme __
Employee at Bilfinger Isoliertechnik Nord GmbH
Dr. John Feldmann __
Former Member of the Executive Board of BASF SE
Memberships in statutory supervisory boards of other German companies:
Hornbach-Baumarkt-AG, BornheimKION Group AG, Wiesbaden (Chairman) KION Material Handling GmbH, Wiesbaden (Chairman)
Lone Fønss Schrøder __
Non-executive member in administrative bodies at German and non-German companies
Memberships in statutory supervisory boards of other German companies:
Heidelberger Druckmaschinen AG, Heidelberg
Memberships in comparable monitoring boards of other German and foreign companies:
AKER Solutions ASA, Lysaker / Norway NKT Holding AS, Brøndby / Denmark Saxo Bank AS, Copenhagen / Denmark (Vice Chairman) Svenska Handelsbanken AB, Stockholm / Sweden (until March 26, 2014) Volvo Personvagnar AB, Gothenburg / Sweden
Thomas Kern __
Employee at Bilfinger HSG FM Rhein-Main GmbH
Rainer Knerler __
Chief Executive of the Berlin branch of Industriegewerkschaft Bauen-Agrar-Umwelt (Construction, Agriculture and Environment Trade Union)
Thomas Pleines (until April 18, 2013) __
Former Member of the Executive Board of Allianz Deutschland AG,Former Chairman of the Executive Board of Allianz Versicherungs AG
Memberships in statutory supervisory boards of other German companies:
DEKRA SE, Stuttgart (Chairman)
Memberships in comparable monitoring boards of other German and foreign companies:
Baloise Holding AG, Basel / Switzerland Kaba AG, Rümlang / Switzerland Südvers Holding GmbH & Co. KG, Freiburg (Chairman)
208

Bilfinger SEAnnual Report 2013
Additional informationBoards of the Company
Udo Stark __
Former Chairman of the Executive Board of MTU Aero Engines Holding AG
Memberships in comparable monitoring boards of other German and foreign companies:
Austria Pet Food GmbH, Eisenstadt / Austria
Holger Timmer __
Employee on the Executive Board of IG Metall
Jens Tischendorf (from April 18, 2013) __
Managing Director of Cevian Capital AG
Prof. Dr. Klaus Trützschler (until June 30, 2013) __
Former Member of the Executive Board of Franz Haniel & Cie. GmbH
Memberships in statutory supervisory boards of other German companies:
Deutsche Bank AG, Frankfurt / MainSartorius AG, GöttingenTAKKT AG, Stuttgart (Deputy Chairman)Zwiesel Kristallglas AG, Zwiesel (Chairman)Wuppermann AG, Leverkusen (Chairman)
Memberships in comparable monitoring boards of other German and foreign companies:
Wilh. Wehrhahn KG, Neuss
Marek Wróbel __
Employee of Multiserwis Sp.z.o.o.
Unless otherwise indicated, all details correct at December 31, 2013.
* Group mandate
Presiding Committee:__
Dr. hc. Bernhard Walter
Stephan Brückner
Dr. John Feldmann
Rainer Knerler
Audit Committee:__
Udo Stark
Herbert Bodner
(from July 2, 2013)
Volker Böhme
Thomas Kern
Prof. Dr. Klaus Trützschler
(until June 30, 2013)
Nomination Committee:__
Dr. hc. Bernhard Walter
Dr. John Feldmann
Udo Stark
209

Bilfinger SEAnnual Report 2013Glossary
__Adjusted earnings per share Adjusted net profit from continuing operations divided by the average number of shares outstanding.
Adjusted EBITA and adjusted net profit from continuing operations Metrics for enabling comparability over time and forecasting future profitability. EBITA or net profit from continuing operations are presented adjusted for exceptional items and amortization of intangible assets from acquisitions. In this context, exceptional items include profits or losses from the sale of investments as well as restructuring expenses.
Adjusted net profit See EBITA adjusted.
Associates Companies upon which a significant influence can be exercised but in which there is no majority holding or controlling interest. The holding is usually between 20 percent and 50 percent.
__Business-unit-related financial assets / interest income Accounting category in Bilfinger’s return-on-capital-employed controlling for the assess-ment of appropriate capital resources of the respective unit of the Group.
__Capital employed The average capital tied up in operative assets on the basis of which the return on capital employed (ROCE) is calculated.
Cash earnings Financial performance measure for the ability of a company to provide its own funds. Measures the financial surplus earned in a certain period from current, profit-relevant activities, but without taking into consideration the change in working capital.
Cash flow A metric for the assessment of a company’s financial strength and profitability in terms of its flows of cash. The statement of cash flows presents the changes in levels of cash and cash equivalents over the year, showing the cash inflows and outflows for operating, investing and financing activities.
Corporate governance The internationally common term for a responsible system of corporate management and monitoring with a focus on long-term value creation.
CTA Abbreviation for ‘contractual trust arrangement’, a form of financing pen-sion obligations whereby pension plan assets covering the company’s pension obligations are transferred to a trust fund . This has the effect of reducing the balance-sheet total, as the plan assets are netted out against the corresponding pension provisions. The effect is to improve the international comparability of the consolidated financial statements.
__Discounted cash-flow method Valuation model for projects and ventures. All future free cash flows are discounted to their present values and added up. Key factors are the cost of capital (discount), future free cash flows and the period of time involved.
__EBITA Abbreviation for ‘earnings before interest, taxes and amortization on intangible assets from acquisitions’. In Bilfinger’s accounting, EBITA is used as a performance measure for the profits from operating activities.
EBITA margin and adjusted EBITA margin Measure which shows the relationship of EBITA or adjusted EBITA to output volume as a percentage.
Equity consolidation A method of including minority interests in associates and joint ventures in the consolidated financial statements. The investment is initially recognized at cost and adjusted thereafter for the investor’s share of changes in the investee’s equity. These changes are generally shown in the Group’s income statement.
Equity ratio Key figure for the company’s financing structure. It states the ratio between equity and total assets.
__Fair value The amount for which an asset could be sold or a liability could be settled between knowledgeable, willing and independent parties.
__Goodwill It arises as a result of taking into consideration a company’s expected future earnings when deciding on a suitable price for it. Goodwill is capitalized under fixed assets and subjected to annual impairment tests in accordance with IFRS 3 / IAS 36.
__IASB Acronym of International Accounting Standards Board, London. This institution was established in London in 1973 with the task of creating the Inter-national Financial Reporting Standards (IFRS).
IFRIC Acronym of the International Financial Reporting Interpretations Commit-tee, London. IFRIC specifies the details of how IFRSs should be interpreted.
IFRS Acronym of International Financial Reporting Standards. They were created to facilitate the international comparison of companies’ accounts and financial reporting. Since 2005, pursuant to the European Union’s so-called IAS Directive, application of the IFRS is mandatory for the consolidated financial statements of listed companies domiciled in the European Union. The IFRS also include those standards of the International Accounting Standards (IAS) which have not yet been superseded.
ISIN code Acronym of International Securities Identification Number. Inter-nationally valid identification number for securities. Uniform system for the simplification of cross-border transactions.
210

Bilfinger SEAnnual Report 2013
Additional informationGlossary
__Joint venture Cooperation between independent companies for the conduct of a joint project.
__Non-recourse financing Debt which is secured solely against the financed project, without the possibility of any recourse liability for Bilfinger.
__Output volume This comprises the supply of goods and services by the Group and the pro-rated supply of goods and services by joint ventures in which the Group participates.
__Percentage-of-completion method (PoC) Accounting method according to IAS 11 for long-term construction contracts. Contract costs and revenues are accounted for in accordance with the percentage of completion of the contract so that the realization of profits is shown in the income statement in line with the progress made by the project.
Plan assets Assets that serve to cover pension obligations and fulfill the condi-tions of IAS 19. Plan assets are netted out against pension provisions, which reduces the balance-sheet total. See CTA. Project-related financial assets / project-related interest income Accounting category in Bilfinger’s return-on-capital-employed controlling for the assessment of appropriate capital resources of the respective units of the Group.
Public-private partnership (PPP) Public-private partnerships are private-sector solutions for real estate or infrastructure tasks in the public sector, with design, financing, construction and long-term operation from one source. Design, financing, construction and long-term operation are conducted by the private sector. Refinancing of the entire investment takes place during the operational phase by means of user fees.
__Return The measure of earnings in return-on-capital-employed controlling at Bilfinger, derived from adjusted EBITA.
Return on equity Measure of earnings which states the ratio between net profit and shareholders’ equity.
ROCE Abbreviation for ‘return on capital employed.’ Ratio between the earnings of a reporting period (return) and the average operative assets (capital employed).
__Syndicated credit lines Credit lines that are agreed upon with a group of banks (syndicate) under uniform conditions.
Statement of cash flows Presentation of liquidity developments / flows of funds taking into consideration the sources and applications of funds within a certain period. The statement of cash flows shows the separate cash flows from, or into, operating, investing and financing activities.
__Value added Difference between ROCE and the weighted average cost of capital multiplied by capital employed. If value added is positive, this means that the return on capital employed is higher than the weighted average cost of capital.
__WACC Abbreviation for ‘weighted average cost of capital.’ Serves as a measurement of the financing of the operative assets in return-on-capital-employed controlling at Bilfinger. It reflects the minimum required rate of return of shareholders and creditors.
Working capital Factor for observing changes in liquidity. It shows the difference between current assets, without cash and marketable securities, and current liabilities.
211

Bilfinger SEAnnual Report 2013Ten-year overview
GROUP€ million
pro forma pro forma
2004 2005 2006 2007 2008 2009 20091 2010 2011 2012 20121 2013
Assets
Non-current assets 1,364.8 1,951.9 2,451.2 3,139.0 3,964.3 4,914.4 4,621.7 4,459.9 3,090.3 3,519.4 2,930.8 3,134.0
Intangible assets 349.3 592.4 738.4 786.9 1,235.3 1,538.5 1,405.9 1,457.3 1,561.0 1,890.1 1,889.9 2,023.3
Property, plant and equipment 475.3 512.0 607.3 581.2 599.3 795.9 650.4 662.5 647.0 689.9 689.0 712.3
Receivables from concession projects 139.1 525.3 893.2 1,499.5 1,641.8 2,134.2 2,134.2 1,788.5 377.0 508.3 – –
Other non-current assets 288.7 187.0 84.2 167.3 299.5 215.9 213.6 358.6 341.1 254.2 194.6 211.7
Deferred tax liabilities 112.4 135.2 128.1 104.1 188.4 229.9 217.6 193.0 164.2 176.9 157.3 186.7
Current assets 2,355.6 2,404.7 2,678.2 2,988.8 2,808.7 3,026.2 3,318.9 3,477.2 4,629.3 3,330.5 3,919.1 3,397.5
Inventories, receivables, other 1,441.9 1,572.8 1,895.5 2,192.8 2,088.5 2,227.8 1,923.3 1,889.9 2,021.4 2,243.3 2,225.9 2,373.0
Cash and cash equivalents 913.7 831.9 782.7 796.0 720.2 798.4 634.7 537.5 846.6 1,087.2 1,061.5 668.7
Assets classified as held for sale – – – – – – 760.9 1,049.8 1,761.3 – 631.7 355.8
Equity and liabilities
Equity 1,130.5 1,188.8 1,206.2 1,331.9 1,141.0 1,561.4 1,561.4 1,812.2 1,792.9 2,036.7 2,036.7 2,164.7
Share capital 110.2 111.6 111.6 111.6 111.6 138.1 138.1 138.1 138.1 138.1 138.1 138.1
Reserves 963.1 1,012.3 1,031.3 1,132.0 1,034.0 1,408.2 1,408.2 1,649.6 1,502.9 1,794.9 1,794.9 1,972.0
Treasury shares – – – – -100.0 -100.0 -100.0 -100.0 -100.0 -100.0 -100.0 -99.0
Retained and distributable earnings 36.7 37.2 46.5 67.0 74.4 92.1 92.1 115.1 247.0 195.7 195.7 138.1
Minority interest 20.5 27.7 16.8 21.3 21.0 23.0 23.0 9.4 4.9 8.0 8.0 15.5
Non-current liabilities 471.1 898.8 1,319.7 1,817.1 2,602.0 2,873.4 2,822.8 2,510.7 1,158.7 1,748.3 1,230.1 1,212.8
Provisions for pensions and similar obligations97.2 130.2 159.7
135.4
218.8 286.7
286.7 312.7 324.5 394.2 393.7 423.1
Other provisions 107.7 105.3 99.5 89.0 68.6 84.3 84.3 71.5 60.0 56.6 56.4 60.7
Financial debt, recourse 85.5 86.6 90.9 70.0 306.1 319.6 269.0 183.5 181.4 519.3 519.3 517.3
Financial debt, non-recourse 114.2 485.1 808.3 1,313.9 1,488.5 1,880.3 1,880.3 1,624.1 338.7 460.5 16.3 12.6
Other liabilities 13.9 17.2 67.3 79.0 392.7 186.5 186.5 212.0 128.0 168.6 95.7 49.1
Deferred tax liabilities 52.6 74.4 94.0 129.8 127.3 116.0 116.0 106.9 126.1 149.1 148.7 150.0
Current liabilities 2,118.8 2,269.0 2,603.5 2,978.8 3,030.0 3,505.8 3,556.4 3,614.2 4,768.0 3,064.9 3,583.1 3,154.0
Current tax liabilities 55.4 50.2 71.5 80.7 120.3 132.7 91.7 118.1 88.5 101.6 101.9 116.5
Provisions 343.3 419.9 424.5 434.8 447.7 612.8 589.7 633.4 755.5 556.6 550.6 552.4
Financial debt, recourse 48.7 40.9 47.8 40.6 21.7 34.0 18.2 88.9 4.5 191.6 191.6 28.1
Financial debt, non-recourse 90.7 10.1 18.9 48.0 29.6 21.9 21.9 19.3 8.7 9.5 - 28.2
Other liabilities 1,580.7 1,747.9 2,040.8 2,374.7 2,410.7 2,704.4 2,280.8 2,051.6 2,116.2 2,205.6 2,160.9 2,113.8
Assets classified as held for sale – – – – – – 554.1 702.9 1,794.6 – 578.1 315.0
Balance-sheet total 3,720.4 4,356.6 5,129.4 6,127.8 6,773.0 7,940.6 7,940.6 7,937.1 7,719.6 6,849.9 6,849.9 6,531.5
Proportion of balance-sheet total
Non-current assets 37 % 45 % 48 % 51 % 59% 62% 58% 56% 40% 51% 43% 48%
Current assets 63 % 55 % 52 % 49 % 41% 38% 42% 44% 60% 49% 57% 52%
Shareholders’ equity 30 % 27 % 24 % 22 % 17% 20% 20% 23% 23% 30% 30% 33%
Non-current liabilities 13 % 21 % 26 % 30 % 38% 36% 35% 32% 15% 25% 18% 19%
Current liabilities 57 % 52 % 50 % 48 % 45% 44% 45% 45% 62% 45% 52% 48%1 For better comparability, assets held for sale and liabilities held for sale are reported separately.
212
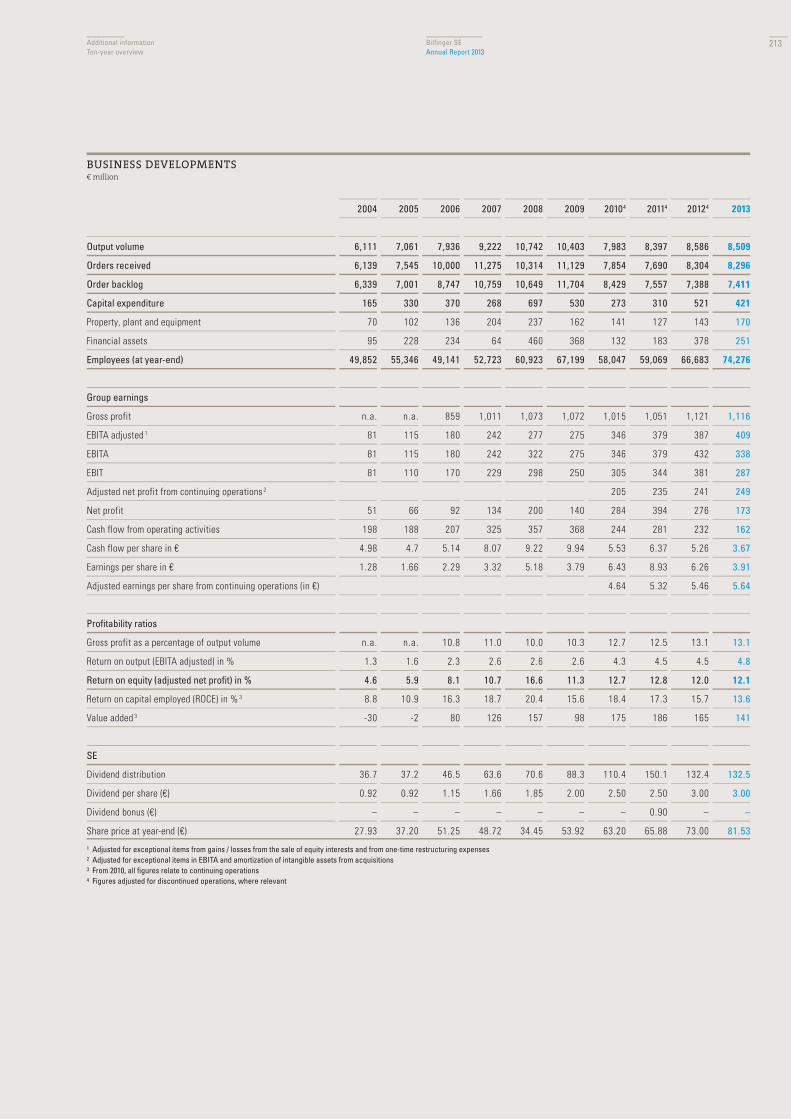
Bilfinger SEAnnual Report 2013
Additional informationTen-year overview
BUSINESS DEVELOPMENTS€ million
2004 2005 2006 2007 2008 2009 20104 20114 20124 2013
Output volume 6,111 7,061 7,936 9,222 10,742 10,403 7,983 8,397 8,586 8,509
Orders received 6,139 7,545 10,000 11,275 10,314 11,129 7,854 7,690 8,304 8,296
Order backlog 6,339 7,001 8,747 10,759 10,649 11,704 8,429 7,557 7,388 7,411
Capital expenditure 165 330 370 268 697 530 273 310 521 421
Property, plant and equipment 70 102 136 204 237 162 141 127 143 170
Financial assets 95 228 234 64 460 368 132 183 378 251
Employees (at year-end) 49,852 55,346 49,141 52,723 60,923 67,199 58,047 59,069 66,683 74,276
Group earnings
Gross profit n.a. n.a. 859 1,011 1,073 1,072 1,015 1,051 1,121 1,116
EBITA adjusted 1 81 115 180 242 277 275 346 379 387 409
EBITA 81 115 180 242 322 275 346 379 432 338
EBIT 81 110 170 229 298 250 305 344 381 287
Adjusted net profit from continuing operations 2 205 235 241 249
Net profit 51 66 92 134 200 140 284 394 276 173
Cash flow from operating activities 198 188 207 325 357 368 244 281 232 162
Cash flow per share in € 4.98 4.7 5.14 8.07 9.22 9.94 5.53 6.37 5.26 3.67
Earnings per share in € 1.28 1.66 2.29 3.32 5.18 3.79 6.43 8.93 6.26 3.91
Adjusted earnings per share from continuing operations (in €) 4.64 5.32 5.46 5.64
Profitability ratios
Gross profit as a percentage of output volume n.a. n.a. 10.8 11.0 10.0 10.3 12.7 12.5 13.1 13.1
Return on output (EBITA adjusted) in % 1.3 1.6 2.3 2.6 2.6 2.6 4.3 4.5 4.5 4.8
Return on equity (adjusted net profit) in % 4.6 5.9 8.1 10.7 16.6 11.3 12.7 12.8 12.0 12.1
Return on capital employed (ROCE) in % 3 8.8 10.9 16.3 18.7 20.4 15.6 18.4 17.3 15.7 13.6
Value added 3 -30 -2 80 126 157 98 175 186 165 141
SE
Dividend distribution 36.7 37.2 46.5 63.6 70.6 88.3 110.4 150.1 132.4 132.5
Dividend per share (€) 0.92 0.92 1.15 1.66 1.85 2.00 2.50 2.50 3.00 3.00
Dividend bonus (€) – – – – – – – 0.90 – –
Share price at year-end (€) 27.93 37.20 51.25 48.72 34.45 53.92 63.20 65.88 73.00 81.53
1 Adjusted for exceptional items from gains / losses from the sale of equity interests and from one-time restructuring expenses 2 Adjusted for exceptional items in EBITA and amortization of intangible assets from acquisitions3 From 2010, all figures relate to continuing operations4 Figures adjusted for discontinued operations, where relevant
213

Bilfinger SEAnnual Report 2013Financial calendar
May 8, 2014
Annual General Meeting(Congress Centrum Rosengarten, Mannheim, 10 a.m.)
Interim Report Q1
August 11, 2014
Interim Report Q2
November 12, 2014
Interim Report Q3
Investor Relations
Andreas MüllerPhone +49-621-459-2312 Fax +49-621-459-2761E-Mail: [email protected]
Corporate Communications
Martin BüllesbachPhone +49-621-459-2475Fax +49-621-459-2500E-Mail: [email protected]
Headquarters
Carl-Reiß-Platz 1-568165 Mannheim, GermanyPhone +49-621-459-0Fax +49-621-459-2366
You will find the addresses of our branches and affiliatesin Germany and abroadin the Internet atwww.bilfinger.com
214

Imprint
Layout, SettingBurkardt | HotzBüro für GestaltungOffenbach am Main
LithographyKatja LeppinThomas Nikolai
Printed byColorDruck Solutions GmbHLeimen
PaperHeaven 42, 150gFSC Mix SCS-COC-001048
©2014Bilfinger SE
Concept, DesignThe Hamptons Bay Design CompanyMunich
ImagesJens BoldtJürgen DannenbergThomas DashuberMiguel FerrazThomas KienzleRainer KwiotekChristoph Püschner Nadine RuppFrank SchultzeEric Vazzoler
Sakhalin Energy Investment Company Ltd.
Project description
Concept, coordination and editing:Bernd Hauseragentur.zs GmbH
Authors:Mathias BeckerDiana LaarzMathias RittgerottLisa RokahrStefan ScheyttMarkus Wanzeck
The Annual Report is publishedin German and English.
Date of publicationMarch 20, 2014 carbon neutral
natureOffice.com | DE-134-588925
print production