we are a service company, · we are a service company ... customers a reliable, cost-effective...
TRANSCRIPT

We are a service company, developing innovative solutions to deliver our customers a reliable, cost-effective electricity supply.
half yearly report 2013/14

1
// our year a snapshot
2013
/14
contents
02.04.08.09.32.
financial performance
operational performance
giving back to our communities
financial statements
debt listings and Waivers
enabling customers through technologyNew technologies like substation robotics are being developed, with many focused on faster restoration times for customers if the lights go out.
assisting our communitiesManawatu, Kapiti and Horowhenua are a little greener this year! Our team have been busy planting more than 5,000 plants that Transpower supplied as part of our community environmental programme, Greenline.
hvdc powers onA new state-of-the-art HVDC control system is helping to move up to 1,200 MW of hydro power from the South Island to North Island.
a new gas spot market for new ZealandOur Energy Market Services group has worked with New Zealand gas industry stakeholders to design and develop a successful new gas market.

2 3
// chairman’s and chief eXecutive’s revieW
financial performanceEarnings after tax, prior to net changes in the fair value of financial instruments, were $99.7 million (Dec 2012: $111.5 million).
Operating revenue for the first six months of the year increased by 10 per cent to $493.8 million (Dec 2012: $448.4 million). Operating expenses increased slightly to $140.3 million (Dec 2012: $138.8 million). Depreciation, amortisation and write-offs increased 19 per cent to $114.4 million (Dec 2012: $96.2 million) reflecting increased asset values following recent investments.
Net finance expenses increased 62 per cent to $100.5 million (Dec 2012: $61.9 million) due to higher debt levels and significantly reduced capitalised interest associated with major projects. At 31 December 2013, net debt was $3.3 billion (Dec 2012: $2.6 billion). This increase reflects on-going capital expenditure and a higher level of dividends in 2012/13, which, in part,
alison andreWCHIEF EXECUTIVE
mark verbiestCHAIRMAN
this report describes transpower’s financial and operational performance for the six months to 31 december 2013.
operating as a service company
reflects a capital restructuring. Transpower is focused on maintaining an efficient balance sheet and strong credit rating.
Capital expenditure in the six months to 31 December 2013 was $267.4 million (Dec 2012: $301.2 million). We expect capital expenditure to reduce with the commissioning of the major projects.
After changes in the fair value of financial instruments, we recorded a net profit of $153.6 million (Dec 2012: $68.0 million from continuing activities). The changes in the fair value of financial instruments, which are used to manage our interest rate and foreign exchange risks, predominantly result from fluctuations in market interest rates. We are not in the business of trading financial instruments, and they are generally held to maturity. Fair value movements are non-cash in nature and do not reflect the underlying operating performance of the business.

4
// CHAIRMAN’s AND CHIEF EXECUTIVE’s REVIEW
5
fundingWe continue to access debt capital markets to fund the costs of our grid investment programme and to refinance maturing debt. For the first time, we accessed the Australian debt capital market for debt funding and issued A$300 million of 10-year senior unsecured notes on 28 August 2013. In November 2013, we raised a further $200 million from the sale of five-year senior unsecured bonds, listed on the New Zealand debt market.
interim dividendThe Board has declared an interim dividend of $60 million (2012/13: $92 million). This is in line with the dividend forecast in our 2013/14 Statement of Corporate Intent. Higher dividends in 2012/13 reflected the impact of a capital restructuring.
revenue increasesTranspower’s transmission revenue has increased strongly in recent reporting periods. The increases are determined in accordance with the regulatory framework set by the Commerce Commission and are to recover the costs of recent major investments, such as the North Island Grid
Upgrade and HVDC Pole 3 upgrade. These projects were subject to previous regulatory approval and are vital to ensure the secure supply of electricity to consumers in the long term. Future transmission revenue increases will be lower, in line with a reducing capital expenditure programme.
The associated increases in Transpower’s net profit are also regulated by the rate of return set periodically by the Commerce Commission. A High Court judgment released in December, following an appeal by a number of regulated parties, confirmed an earlier decision by the Commerce Commission to set the post-tax rate of return for the current regulatory period (to 2014/15) at 7.2 per cent.
Our post-tax Weighted Average Cost of Capital will remain at 7.19 per cent for the remainder of our current control period.
operational performance
statement of corporate intent targetsThe six-monthly performance against our 2013/14 Statement of Corporate Intent is as follows:
financial performance targets
2013/146 months
annualised
2013/14annual target
OpERATING pROFIT MARGIN* 71.5% 70.2%
INTEREST COVERAGE* (FREE FUNDS FROM OpERATIONS INTEREST COVER) (TIMES) 2.9 2.9
RETURN ON CApITAl EMplOyED 7.3% 6.9%
RETURN ON EqUITy 12.5% 11.5%
AVERAGE TOTAl TRANSMISSION COSTS (c/kWh) 2.38 2.31
ESTIMATED ECONOMIC VAlUE ADDED ($M)* 37 67
* ACTUAl RESUlTS FOR 6 MONTHS
operational performance targets
2013/14actual for
6 months
2013/14annual target
HVAC AVAIlAbIlITy 99.1% 98.8%
HVDC bIpOlE AVAIlAbIlITy 68.9% 86.9%
NUMbER OF lOSS OF SUpply EVENTS OF GREATER
THAN 0.05 SySTEM MINUTES ** 9 15
NUMbER OF lOSS OF SUpply EVENTS OF GREATER
THAN ONE SySTEM MINUTE** 1 3
** ONE SySTEM MINUTE IS bASED ON A SySTEM pEAK OF 6,469 MW FOR THE pURpOSES OF THIS CAlCUlATION. ONE SySTEM MINUTE IS EqUIVAlENT TO THE lOSS OF TOTAl NATIONAl ElECTRICITy SUpply FOR ONE MINUTE, AT pEAK lOAD – EqUIVAlENT TO TURNING OFF A CITy THE SIZE OF HAMIlTON FOR AbOUT 40 MINUTES.
The new Hobson Street (L) and Wairau Road (R) substations are part of the North Auckland and Northland project to secure electricity supply to the upper North Island.

6
// CHAIRMAN’s AND CHIEF EXECUTIVE’s REVIEW
7
HVDC Bipole availability for the six months is well below the annual target because of work associated with the HVDC upgrade project. This work is now completed, and it is expected that the end of year result will be closer to the target.
There were nine loss of supply events greater than 0.05 system minutes, of which one event was greater than 1 system minute.
The largest event was an Automatic Under-Frequency Load Shedding (AUFLS) incident that occurred during a set of high load commissioning tests on the upgraded HVDC link. The cause of the fault was traced to a problem with the protection settings on the filter banks at Benmore. A technical solution was implemented and tested within a week to rectify the issue.
non-financial performance targets
2013/14actual for
6 months
2013/14annual target
MATERIAl bREACHES OF SySTEM OpERATOR
pERFORMANCE OblIGATIONS 0 <4
ACC WORKplACE SAFETy AUDIT STATUS TERTIARy TERTIARy
NUMbER OF FATAlITIES OR INjURIES CAUSING
pERMANENT DISAbIlITy 0 0
NUMbER OF MEDICAl TREATMENT INjURIES 16 ≤30
Over the six months to 31 December 2013, 16 medical treatment and lost time injuries were recorded (Dec 2012: 20). We continue to focus on safety behaviours and a leadership culture throughout our workforce, particularly with subcontractors.
major projectsWork is now complete on the HVDC project, which enables the HVDC link to transport 1,200 MW, up from 1,000 MW, following commissioning of Pole 3.
The North Auckland and Northland project is nearing completion, with final commissioning expected later this summer. The project will be completed well within the regulator-approved allowance.
Transpower has sought approval from the Commerce Commission to amend the Major Capex Allowance for the North Island Grid Upgrade project to $894 million, which is $70 million above the amount approved by the Electricity Commission in mid-2007. The increase is largely in the cost of the overhead transmission line and reflects higher land compensation payments and higher construction costs. Transpower has committed to recover a maximum of $876 million from transmission customers, $18 million less than the final project cost. The Commission will consult on this application and is expected to publish a draft decision in April and a final decision in August 2014.
In total, these three projects will be delivered at more than 4 per cent under the regulator approved allowance.
launch of new gas marketA new gas market designed and developed by Transpower in conjunction with major gas industry players, was launched in November. Trading on the market to date has been very positive, and we expect more participants to trade as the year progresses.
becoming a service companyTechnology is changing individual consumers’ position in the industry. Historically, consumers have been price and service takers – the electricity was either on or off and the bill was paid at the end of the month. We are entering a new era where electricity is supplied in an interactive market in which consumers can participate, and have options for service and price. The technologies to enable this – smart meters, micro-generation (e.g. photovoltaics) and demand-side response capabilities – all exist today.
Today’s consumer also has higher expectations. Information and service is expected immediately: in the age of the internet, we want to know why the power is off and when it is coming back, and we want to know now!
8
// CHAIRMAN’s AND CHIEF EXECUTIVE’s REVIEW
9
// financial statements 2013/14
10.
12.
14.15.17.32.
statement of comprehensive income
statement of financial position
statement of changes in eQuity
cash floW statement
notes to the financial statements
debt listings and Waivers
contents
financial statements 2013/14
alison andreW CHIEF EXECUTIVE
mark verbiestCHAIRMAN
So, the traditional approach where transmission companies consider themselves infrastructure businesses with a focus on asset performance and providing undifferentiated service to the end-use customer is no longer sufficient.
Transpower is changing the way that it operates, and we understand the criticality of being a service company. Pleasingly, we are starting to see the benefits of a customer focus culture and how critical this is to running the grid effectively. Decisions on how we operate and maintain the grid are now driven by the impact on electricity consumers, not just on our assets. The generators and lines companies are key partners in achieving this.
This focus has, in part, brought us strong improvement in reliability performance over the years. But it has also let us prioritise – and reduce – capex and opex on the grid by spending our dollar where it counts and ensuring cost effectiveness for the end consumer. This will become an increasingly important focus for us.
giving back to our communitiesIn September 2013, the CommunityCare Fund awarded grants totalling $504,501 to 28 community-based projects nationwide. Projects included assisting schools, sports clubs and volunteer emergency services, refurbishing community halls and nature conservation.
In the year to date, we have supplied over 5,000 plants for our community environmental programme, Greenline. These have been planted by Transpower staff volunteers.
TRANSPOWER NEW ZEALAND LIMITED AND SUBSIDIARIES TRANSPOWER NEW ZEALAND LIMITED AND SUBSIDIARIES
10 11
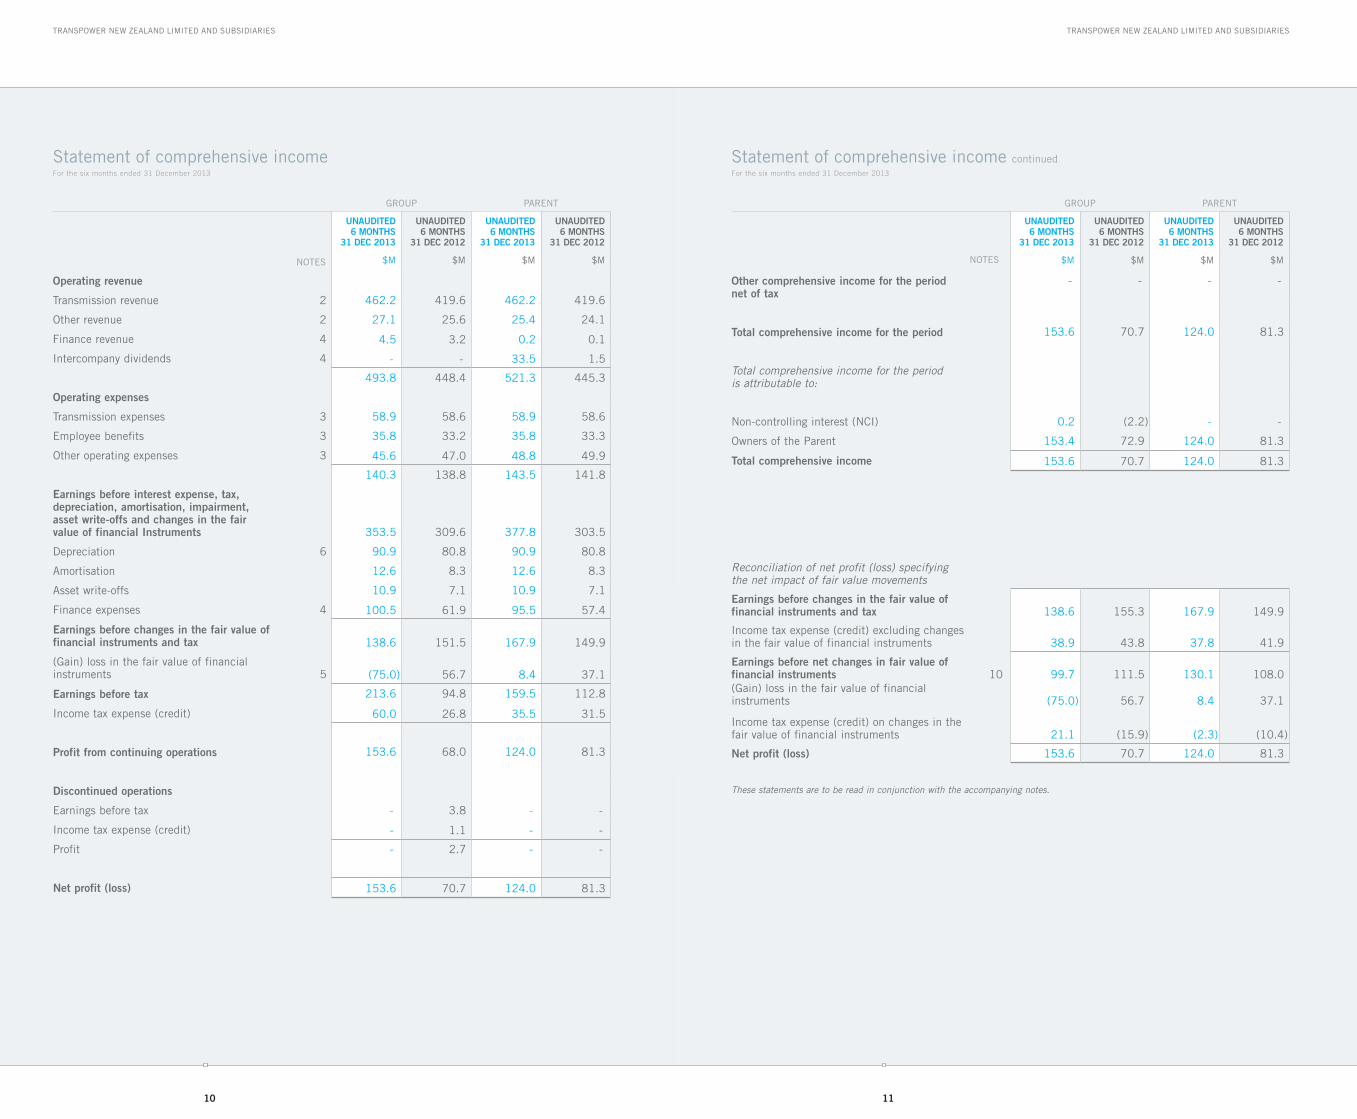
Statement of comprehensive incomeFor the six months ended 31 December 2013
Statement of comprehensive income continuedFor the six months ended 31 December 2013
GROUp pARENT
unaudited6 months
31 dec 2013
unaudited6 months
31 dec 2012
unaudited6 months
31 dec 2013
unaudited6 months
31 dec 2012
NOTES $M $M $M $M
operating revenue
Transmission revenue 2 462.2 419.6 462.2 419.6
Other revenue 2 27.1 25.6 25.4 24.1
Finance revenue 4 4.5 3.2 0.2 0.1
Intercompany dividends 4 - - 33.5 1.5
493.8 448.4 521.3 445.3
operating expenses
Transmission expenses 3 58.9 58.6 58.9 58.6
Employee benefits 3 35.8 33.2 35.8 33.3
Other operating expenses 3 45.6 47.0 48.8 49.9
140.3 138.8 143.5 141.8
earnings before interest expense, tax, depreciation, amortisation, impairment, asset write-offs and changes in the fair value of financial instruments 353.5 309.6 377.8 303.5
Depreciation 6 90.9 80.8 90.9 80.8
Amortisation 12.6 8.3 12.6 8.3
Asset write-offs 10.9 7.1 10.9 7.1
Finance expenses 4 100.5 61.9 95.5 57.4
earnings before changes in the fair value of financial instruments and tax 138.6 151.5 167.9 149.9
(Gain) loss in the fair value of financial instruments 5 (75.0) 56.7 8.4 37.1
earnings before tax 213.6 94.8 159.5 112.8
Income tax expense (credit) 60.0 26.8 35.5 31.5
profit from continuing operations 153.6 68.0 124.0 81.3
discontinued operations
Earnings before tax - 3.8 - -
Income tax expense (credit) - 1.1 - -
profit - 2.7 - -
net profit (loss) 153.6 70.7 124.0 81.3
GROUp pARENT
unaudited6 months
31 dec 2013
unaudited6 months
31 dec 2012
unaudited6 months
31 dec 2013
unaudited6 months
31 dec 2012
NOTES $M $M $M $M
other comprehensive income for the period net of tax
- - - -
total comprehensive income for the period 153.6 70.7 124.0 81.3
Total comprehensive income for the period is attributable to:
Non-controlling interest (NCI) 0.2 (2.2) - -
Owners of the parent 153.4 72.9 124.0 81.3
total comprehensive income 153.6 70.7 124.0 81.3
Reconciliation of net profit (loss) specifying the net impact of fair value movements
earnings before changes in the fair value of financial instruments and tax 138.6 155.3 167.9 149.9
Income tax expense (credit) excluding changes in the fair value of financial instruments 38.9 43.8 37.8 41.9
earnings before net changes in fair value of financial instruments 10 99.7 111.5 130.1 108.0(Gain) loss in the fair value of financial instruments (75.0) 56.7 8.4 37.1
Income tax expense (credit) on changes in the fair value of financial instruments 21.1 (15.9) (2.3) (10.4)
net profit (loss) 153.6 70.7 124.0 81.3
These statements are to be read in conjunction with the accompanying notes.
TRANSPOWER NEW ZEALAND LIMITED AND SUBSIDIARIES TRANSPOWER NEW ZEALAND LIMITED AND SUBSIDIARIES
12 13
GROUp pARENT
unaudited31 dec 2013
audited30 jun 2013
unaudited31 dec 2013
audited30 jun 2013
NOTES $M $M $M $M
assets employed
current assets
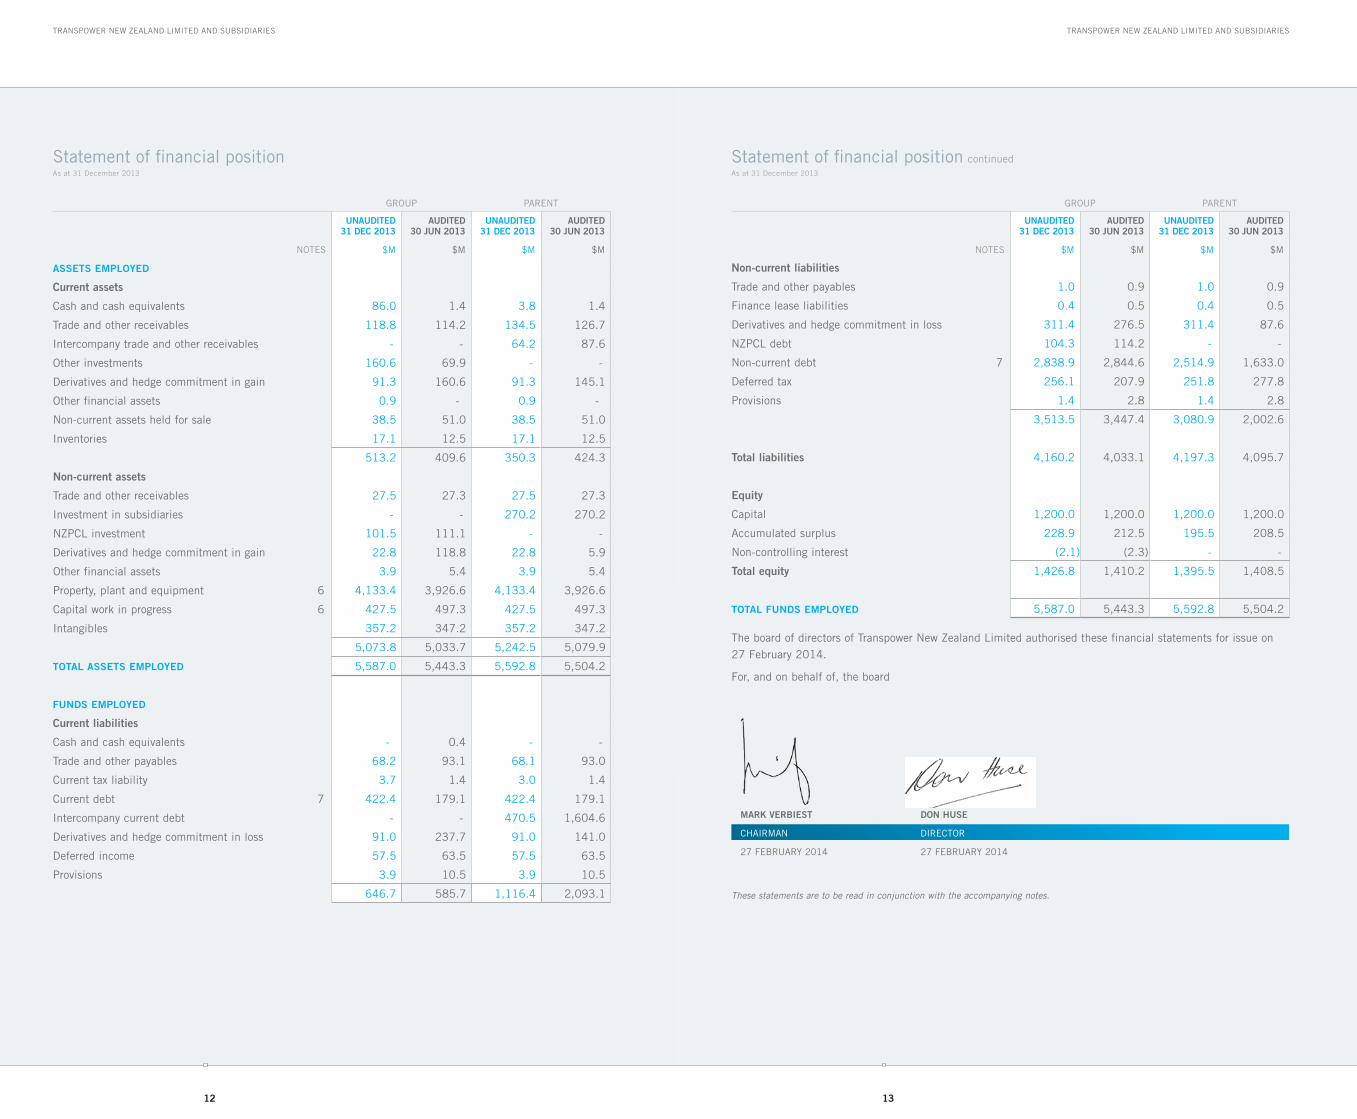
Cash and cash equivalents 86.0 1.4 3.8 1.4
Trade and other receivables 118.8 114.2 134.5 126.7
Intercompany trade and other receivables - - 64.2 87.6
Other investments 160.6 69.9 - -
Derivatives and hedge commitment in gain 91.3 160.6 91.3 145.1
Other financial assets 0.9 - 0.9 -
Non-current assets held for sale 38.5 51.0 38.5 51.0
Inventories 17.1 12.5 17.1 12.5
513.2 409.6 350.3 424.3
non-current assets
Trade and other receivables 27.5 27.3 27.5 27.3
Investment in subsidiaries - - 270.2 270.2
NZpCl investment 101.5 111.1 - -
Derivatives and hedge commitment in gain 22.8 118.8 22.8 5.9
Other financial assets 3.9 5.4 3.9 5.4
property, plant and equipment 6 4,133.4 3,926.6 4,133.4 3,926.6
Capital work in progress 6 427.5 497.3 427.5 497.3
Intangibles 357.2 347.2 357.2 347.2
5,073.8 5,033.7 5,242.5 5,079.9
total assets employed 5,587.0 5,443.3 5,592.8 5,504.2
funds employed
current liabilities
Cash and cash equivalents - 0.4 - -
Trade and other payables 68.2 93.1 68.1 93.0
Current tax liability 3.7 1.4 3.0 1.4
Current debt 7 422.4 179.1 422.4 179.1
Intercompany current debt - - 470.5 1,604.6
Derivatives and hedge commitment in loss 91.0 237.7 91.0 141.0
Deferred income 57.5 63.5 57.5 63.5
provisions 3.9 10.5 3.9 10.5
646.7 585.7 1,116.4 2,093.1
Statement of financial positionAs at 31 December 2013
Statement of financial position continuedAs at 31 December 2013
GROUp pARENT
unaudited31 dec 2013
audited30 jun 2013
unaudited31 dec 2013
audited30 jun 2013
NOTES $M $M $M $M
non-current liabilities
Trade and other payables 1.0 0.9 1.0 0.9
Finance lease liabilities 0.4 0.5 0.4 0.5
Derivatives and hedge commitment in loss 311.4 276.5 311.4 87.6
NZpCl debt 104.3 114.2 - -
Non-current debt 7 2,838.9 2,844.6 2,514.9 1,633.0
Deferred tax 256.1 207.9 251.8 277.8
provisions 1.4 2.8 1.4 2.8
3,513.5 3,447.4 3,080.9 2,002.6
total liabilities 4,160.2 4,033.1 4,197.3 4,095.7
equity
Capital 1,200.0 1,200.0 1,200.0 1,200.0
Accumulated surplus 228.9 212.5 195.5 208.5
Non-controlling interest (2.1) (2.3) - -
total equity 1,426.8 1,410.2 1,395.5 1,408.5
total funds employed 5,587.0 5,443.3 5,592.8 5,504.2
The board of directors of Transpower New Zealand limited authorised these financial statements for issue on 27 February 2014.
For, and on behalf of, the board
mark verbiest
CHAIRMAN
27 FEbRUARy 2014
don huse
DIRECTOR
27 FEbRUARy 2014
These statements are to be read in conjunction with the accompanying notes.

TRANSPOWER NEW ZEALAND LIMITED AND SUBSIDIARIES TRANSPOWER NEW ZEALAND LIMITED AND SUBSIDIARIES
14 15
GROUp UNAUDITED
ordinary shares
retained earnings
oWners of the parent nci total
$M $M $M $M $M
equity at 1 july 2013 1,200.0 212.5 1,412.5 (2.3) 1,410.2
profit for the period - 153.4 153.4 0.2 153.6
Other comprehensive income - - - - -
total comprehensive income - 153.4 153.4 0.2 153.6
Transactions with owners (dividends) - (137.0) (137.0) - (137.0)
total equity at 31 december 2013 1,200.0 228.9 1,428.9 (2.1) 1,426.8
equity at 1 july 2012 1,200.0 307.0 1,507.0 2.2 1,509.2
profit for the period - 72.9 72.9 (2.2) 70.7
Other comprehensive income - - - - -
total comprehensive income - 72.9 72.9 (2.2) 70.7
Transactions with owners (dividends) - (205.0) (205.0) - (205.0)
total equity at 31 december 2012 1,200.0 174.9 1,374.9 - 1,374.9
pARENT UNAUDITED
ORDINARy SHARES
RETAINED EARNINGS
OWNERS OF THE pARENT NCI TOTAl
$M $M $M $M $M
equity at 1 july 2013 1,200.0 208.5 1,408.5 - 1,408.5
profit for the period - 124.0 124.0 - 124.0
Other comprehensive income - - - - -
total comprehensive income - 124.0 124.0 - 124.0
Transactions with owners (dividends) - (137.0) (137.0) - (137.0)
total equity at 31 december 2013 1,200.0 195.5 1,395.5 - 1,395.5
equity at 1 july 2012 1,200.0 370.4 1,570.4 - 1,570.4
profit for the period - 81.3 81.3 - 81.3
Other comprehensive income - - - - -
total comprehensive income - 81.3 81.3 - 81.3
Transactions with owners (dividends) - (205.0) (205.0) - (205.0)
total equity at 31 december 2012 1,200.0 246.7 1,446.7 - 1,446.7
These statements are to be read in conjunction with the accompanying notes.
Statement of changes in equityFor the six months ended 31 December 2013
GROUp pARENT
unaudited6 months
31 dec 2013
unaudited6 months
31 dec 2012
unaudited6 months
31 dec 2013
unaudited6 months
31 dec 2012
$M $M $M $M
cash floW from operations
cash was provided from:
Receipts from customers 480.8 442.8 479.2 435.4
Dividends received from subsidiaries - - 33.5 1.5
Interest received 4.5 3.2 0.2 0.1
cash was applied to:
payments to suppliers and employees (173.7) (169.0) (180.3) (172.0)
Tax payments (9.6) (22.6) (9.6) (21.3)
Interest paid (115.5) (96.9) (110.5) (92.3)
net cash inflows from operations 186.5 157.5 212.5 151.4
cash floW from investments
cash was provided from:
Sale of property, plant and equipment 14.8 17.0 14.8 17.0
Short-term investments 33.3 147.6 - -
cash was applied to:
purchase of property, plant and equipment (254.6) (375.8) (254.6) (375.8)
Short-term investments (123.9) (148.3) - -
net cash outflows to investments (330.4) (359.5) (239.8) (358.8)
cash floW from financing
cash was provided from:
Increase in loans 828.7 536.9 828.7 545.1
cash was applied to:
Increase in long-term investments - - - -
Dividends paid (137.0) (205.0) (137.0) (205.0)
Repayment of loans (462.8) (131.4) (662.0) (131.4)
net cash inflows from financing 228.9 200.5 29.7 208.7
Net increase (decrease) in cash held 85.0 (1.5) 2.4 1.3
Opening balance brought forward 1.0 2.8 1.4 0.9
closing net cash carried forward 86.0 1.3 3.8 2.2
closing net cash carried forward comprises:
Cash and cash equivalents – assets 86.0 4.9 3.8 2.2
Cash and cash equivalents – liabilities - (3.6) - -
These statements are to be read in conjunction with the accompanying notes.
Cash flow statementFor the six months ended 31 December 2013
TRANSPOWER NEW ZEALAND LIMITED AND SUBSIDIARIES TRANSPOWER NEW ZEALAND LIMITED AND SUBSIDIARIES
16 17
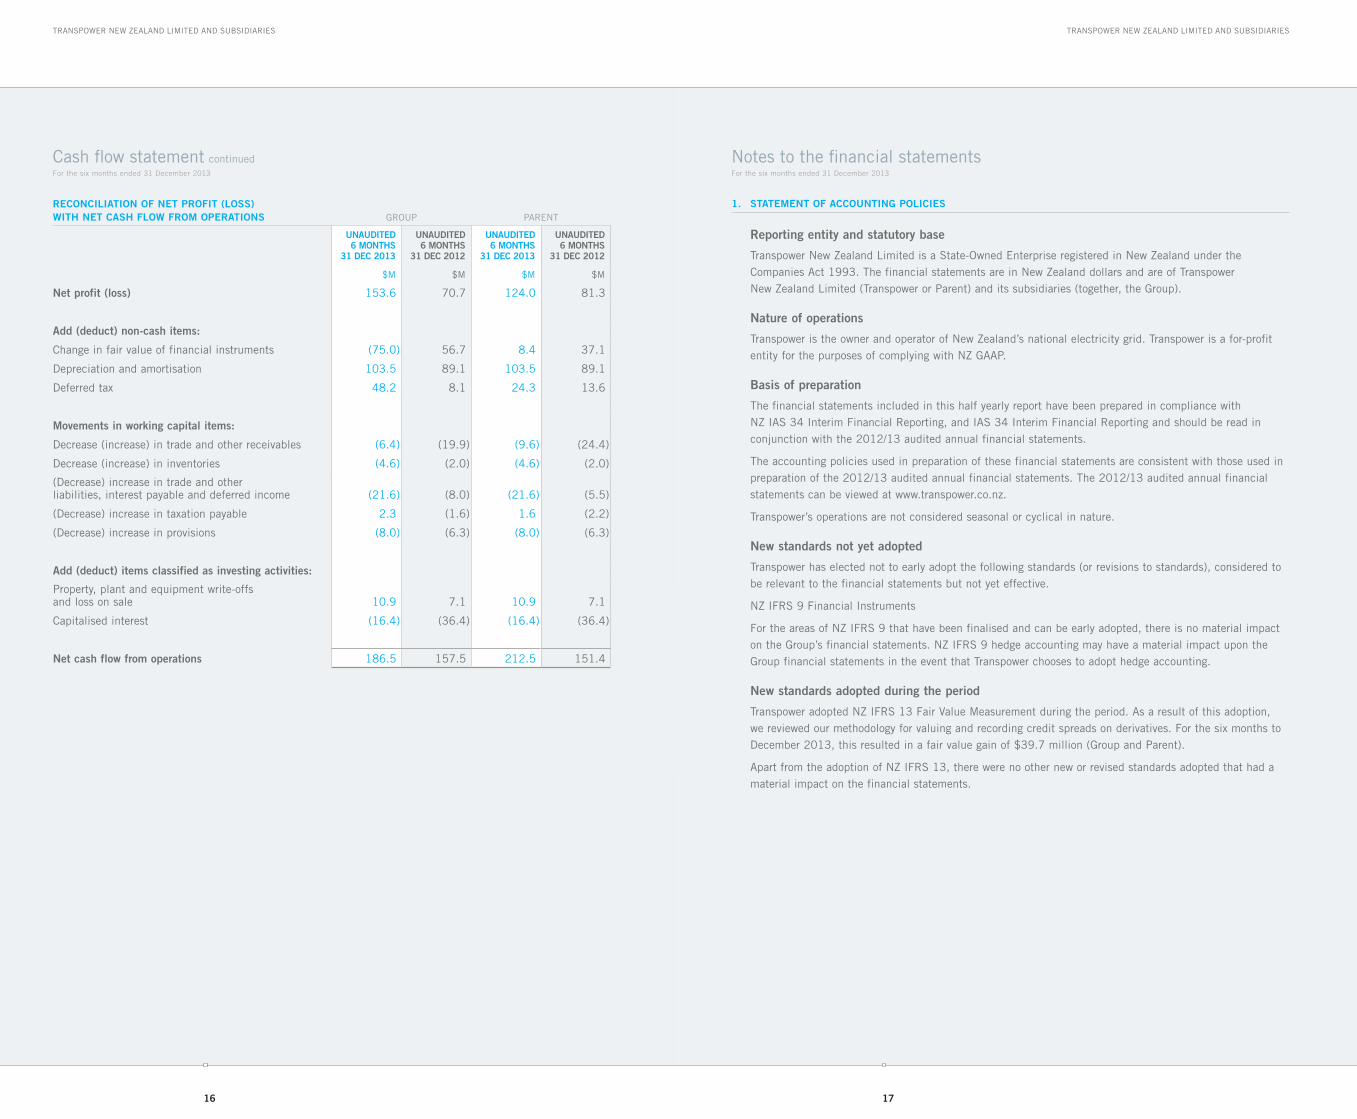
Cash flow statement continuedFor the six months ended 31 December 2013
reconciliation of net profit (loss) With net cash floW from operations GROUp pARENT
unaudited6 months
31 dec 2013
unaudited6 months
31 dec 2012
unaudited6 months
31 dec 2013
unaudited6 months
31 dec 2012
$M $M $M $M
net profit (loss) 153.6 70.7 124.0 81.3
add (deduct) non-cash items:
Change in fair value of financial instruments (75.0) 56.7 8.4 37.1
Depreciation and amortisation 103.5 89.1 103.5 89.1
Deferred tax 48.2 8.1 24.3 13.6
movements in working capital items:
Decrease (increase) in trade and other receivables (6.4) (19.9) (9.6) (24.4)
Decrease (increase) in inventories (4.6) (2.0) (4.6) (2.0)
(Decrease) increase in trade and other liabilities, interest payable and deferred income (21.6) (8.0) (21.6) (5.5)
(Decrease) increase in taxation payable 2.3 (1.6) 1.6 (2.2)
(Decrease) increase in provisions (8.0) (6.3) (8.0) (6.3)
add (deduct) items classified as investing activities:
property, plant and equipment write-offs and loss on sale 10.9 7.1 10.9 7.1
Capitalised interest (16.4) (36.4) (16.4) (36.4)
net cash flow from operations 186.5 157.5 212.5 151.4
1. statement of accounting policies
reporting entity and statutory base
Transpower New Zealand limited is a State-Owned Enterprise registered in New Zealand under the Companies Act 1993. The financial statements are in New Zealand dollars and are of Transpower New Zealand limited (Transpower or parent) and its subsidiaries (together, the Group).
nature of operations
Transpower is the owner and operator of New Zealand’s national electricity grid. Transpower is a for-profit entity for the purposes of complying with NZ GAAp.
basis of preparation
The financial statements included in this half yearly report have been prepared in compliance with NZ IAS 34 Interim Financial Reporting, and IAS 34 Interim Financial Reporting and should be read in conjunction with the 2012/13 audited annual financial statements.
The accounting policies used in preparation of these financial statements are consistent with those used in preparation of the 2012/13 audited annual financial statements. The 2012/13 audited annual financial statements can be viewed at www.transpower.co.nz.
Transpower’s operations are not considered seasonal or cyclical in nature.
new standards not yet adopted
Transpower has elected not to early adopt the following standards (or revisions to standards), considered to be relevant to the financial statements but not yet effective.
NZ IFRS 9 Financial Instruments
For the areas of NZ IFRS 9 that have been finalised and can be early adopted, there is no material impact on the Group’s financial statements. NZ IFRS 9 hedge accounting may have a material impact upon the Group financial statements in the event that Transpower chooses to adopt hedge accounting.
new standards adopted during the period
Transpower adopted NZ IFRS 13 Fair Value Measurement during the period. As a result of this adoption, we reviewed our methodology for valuing and recording credit spreads on derivatives. For the six months to December 2013, this resulted in a fair value gain of $39.7 million (Group and parent).
Apart from the adoption of NZ IFRS 13, there were no other new or revised standards adopted that had a material impact on the financial statements.
Notes to the financial statementsFor the six months ended 31 December 2013
18 19
Notes to the financial statements continuedFor the six months ended 31 December 2013
Notes to the financial statements continuedFor the six months ended 31 December 2013
TRANSPOWER NEW ZEALAND LIMITED AND SUBSIDIARIES TRANSPOWER NEW ZEALAND LIMITED AND SUBSIDIARIES
2. operating revenue GROUp pARENT
unaudited6 months
31 dec 2013
unaudited6 months
31 dec 2012
unaudited6 months
31 dec 2013
unaudited6 months
31 dec 2012
$M $M $M $M
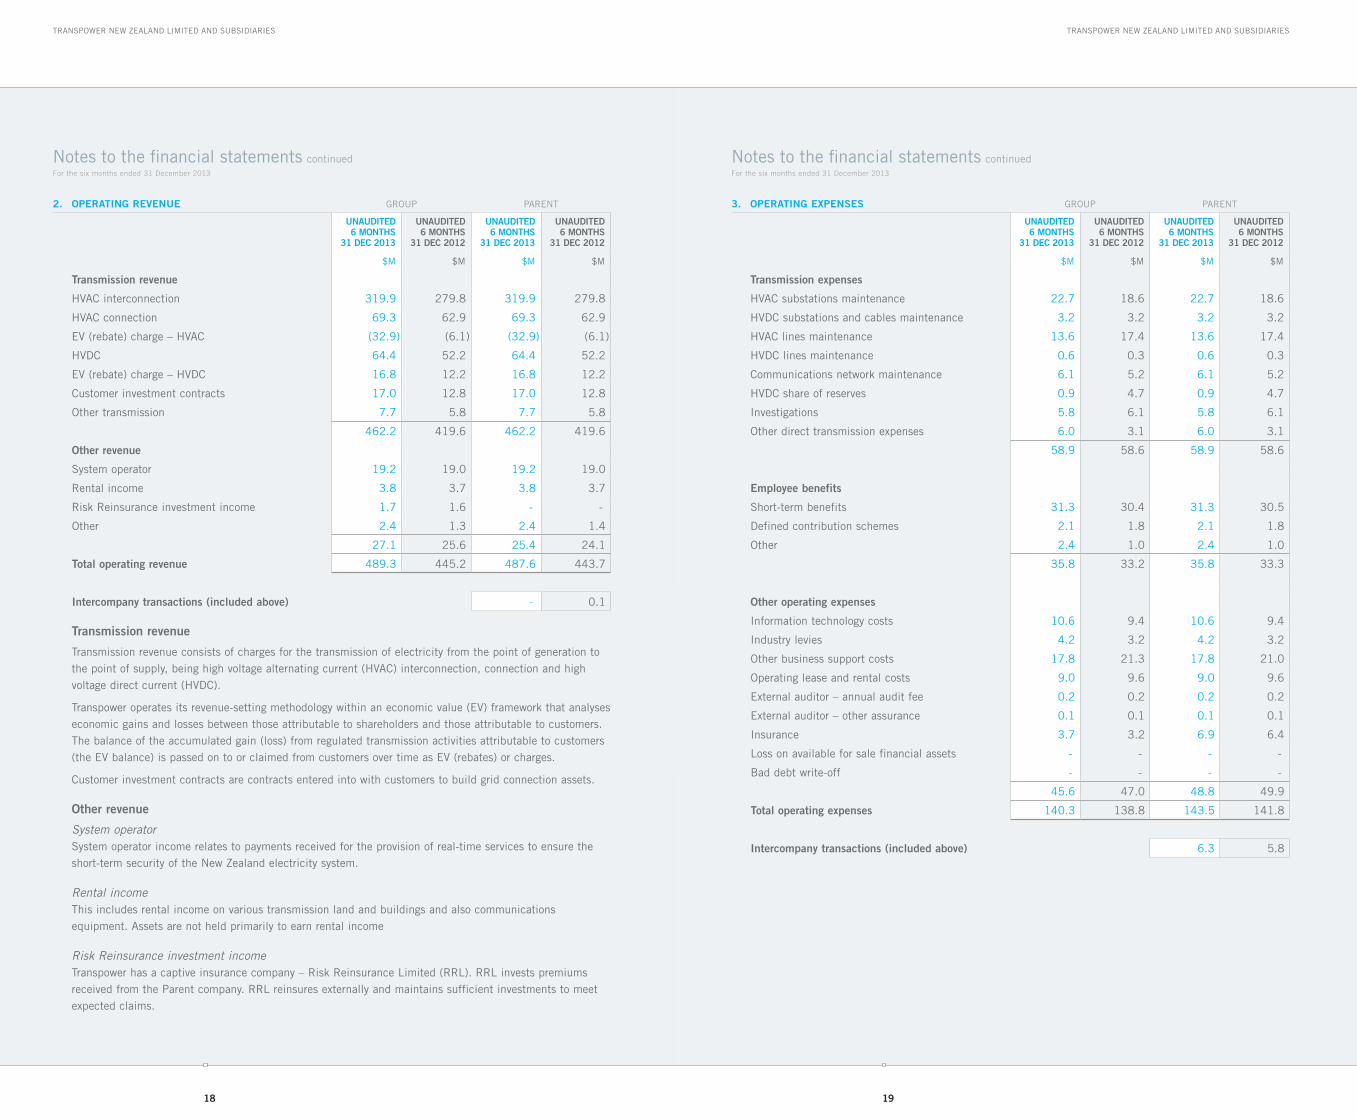
transmission revenue
HVAC interconnection 319.9 279.8 319.9 279.8
HVAC connection 69.3 62.9 69.3 62.9
EV (rebate) charge – HVAC (32.9) (6.1) (32.9) (6.1)
HVDC 64.4 52.2 64.4 52.2
EV (rebate) charge – HVDC 16.8 12.2 16.8 12.2
Customer investment contracts 17.0 12.8 17.0 12.8
Other transmission 7.7 5.8 7.7 5.8
462.2 419.6 462.2 419.6
other revenue
System operator 19.2 19.0 19.2 19.0
Rental income 3.8 3.7 3.8 3.7
Risk Reinsurance investment income 1.7 1.6 - -
Other 2.4 1.3 2.4 1.4
27.1 25.6 25.4 24.1
total operating revenue 489.3 445.2 487.6 443.7
intercompany transactions (included above) - 0.1
transmission revenue
Transmission revenue consists of charges for the transmission of electricity from the point of generation to the point of supply, being high voltage alternating current (HVAC) interconnection, connection and high voltage direct current (HVDC).
Transpower operates its revenue-setting methodology within an economic value (EV) framework that analyses economic gains and losses between those attributable to shareholders and those attributable to customers. The balance of the accumulated gain (loss) from regulated transmission activities attributable to customers (the EV balance) is passed on to or claimed from customers over time as EV (rebates) or charges.
Customer investment contracts are contracts entered into with customers to build grid connection assets.
other revenue
System operatorSystem operator income relates to payments received for the provision of real-time services to ensure the short-term security of the New Zealand electricity system.
Rental income This includes rental income on various transmission land and buildings and also communications equipment. Assets are not held primarily to earn rental income
Risk Reinsurance investment incomeTranspower has a captive insurance company – Risk Reinsurance limited (RRl). RRl invests premiums received from the parent company. RRl reinsures externally and maintains sufficient investments to meet expected claims.
3. operating eXpenses GROUp pARENT
unaudited6 months
31 dec 2013
unaudited6 months
31 dec 2012
unaudited6 months
31 dec 2013
unaudited6 months
31 dec 2012
$M $M $M $M
transmission expenses
HVAC substations maintenance 22.7 18.6 22.7 18.6
HVDC substations and cables maintenance 3.2 3.2 3.2 3.2
HVAC lines maintenance 13.6 17.4 13.6 17.4
HVDC lines maintenance 0.6 0.3 0.6 0.3
Communications network maintenance 6.1 5.2 6.1 5.2
HVDC share of reserves 0.9 4.7 0.9 4.7
Investigations 5.8 6.1 5.8 6.1
Other direct transmission expenses 6.0 3.1 6.0 3.1
58.9 58.6 58.9 58.6
employee benefits
Short-term benefits 31.3 30.4 31.3 30.5
Defined contribution schemes 2.1 1.8 2.1 1.8
Other 2.4 1.0 2.4 1.0
35.8 33.2 35.8 33.3
other operating expenses
Information technology costs 10.6 9.4 10.6 9.4
Industry levies 4.2 3.2 4.2 3.2
Other business support costs 17.8 21.3 17.8 21.0
Operating lease and rental costs 9.0 9.6 9.0 9.6
External auditor – annual audit fee 0.2 0.2 0.2 0.2
External auditor – other assurance 0.1 0.1 0.1 0.1
Insurance 3.7 3.2 6.9 6.4
loss on available for sale financial assets - - - -
bad debt write-off - - - -
45.6 47.0 48.8 49.9
total operating expenses 140.3 138.8 143.5 141.8
intercompany transactions (included above) 6.3 5.8

20 21
Notes to the financial statements continuedFor the six months ended 31 December 2013
Notes to the financial statements continuedFor the six months ended 31 December 2013
TRANSPOWER NEW ZEALAND LIMITED AND SUBSIDIARIES TRANSPOWER NEW ZEALAND LIMITED AND SUBSIDIARIES
Intercompany expenses relate to insurance premiums.
Maintenance includes inspection, servicing and repair costs.
HVDC share of reserves – The wholesale electricity market provides reserves to cover for the loss of the largest operating generation unit in each trading period. These reserves are charged to generators. At times, particularly when it is operating with only one pole, the HVDC link faces reserve charges. These are charged to the Group (as grid asset owner). Following regulatory changes, these costs are generally recoverable from customers.
Other direct transmission expenses include maintenance support, system modelling costs and training for service providers and third parties.
Information technology costs include such items as software licences, maintenance, application support and project investigations.
Other business support costs include such items as legal fees, office equipment, communications, vehicles, travel, consultants, donations and study grants.
Operating lease and rental costs comprise predominantly the leases of the Group’s administrative buildings and various items of communication equipment.
External auditor – annual audit fee was $181,000 (2012: $181,000).External auditor – other assurance was $137,000 (2012: $129,000).
Other assurance includes reviews of financial statements, trust deed reporting and regulatory financial statements.
3. operating eXpenses continued 4. net finance eXpenses GROUp pARENT
unaudited6 months
31 dec 2013
unaudited6 months
31 dec 2012
unaudited6 months
31 dec 2013
unaudited6 months
31 dec 2012
$M $M $M $M
finance revenue
Interest received 4.5 3.2 0.2 0.1
4.5 3.2 0.2 0.1
finance expenses
Interest paid and associated fees 115.5 96.7 110.5 92.2
Capitalised interest (16.4) (36.4) (16.4) (36.4)
Imputed interest 1.4 1.4 1.4 1.4
Other finance expenses - 0.2 - 0.2
100.5 61.9 95.5 57.4
total net finance expenses 96.0 58.7 95.3 57.3
intercompany dividends - - 33.5 1.5
intercompany transactions (included above)
Dividends received 33.5 1.5
Interest paid and associated fees 55.4 60.2
interest paid and associated fees
All interest paid is on debt and derivatives designated as fair value through profit or loss.
imputed interest
Imputed interest arises on customer investment contracts, transmission realignment and certain other prepaid transactions.
dividends received
On 1 November 2013, Risk Reinsurance limited, a 100% subsidiary of the parent paid, a dividend of $33.5 million to the parent.

22 23
Notes to the financial statements continuedFor the six months ended 31 December 2013
Notes to the financial statements continuedFor the six months ended 31 December 2013
TRANSPOWER NEW ZEALAND LIMITED AND SUBSIDIARIES TRANSPOWER NEW ZEALAND LIMITED AND SUBSIDIARIES
5. change in fair value of financial instruments GROUp pARENT
unaudited6 months
31 dec 2013
unaudited6 months
31 dec 2012
unaudited6 months
31 dec 2013
unaudited6 months
31 dec 2012
$M $M $M $M
accounting hedges
Foreign exchange forward contracts – hedge accounted (7.1) (11.2) (7.1) (11.2)
Hedge commitment 7.1 11.2 7.1 11.2
- - - -
other
Foreign debt (109.1) (0.3) (74.7) 9.7
Cross currency interest rate swaps 80.5 54.8 54.9 30.4
Foreign interest rate swaps 4.1 5.5 0.7 -
basis swaps (1.0) (0.8) (1.1) -
NZD interest rate swaps (29.9) (6.2) 44.4 3.7
Foreign exchange forward contracts – not hedge accounted - - - -
Investments 0.2 (0.4) - -
NZD debt (20.9) 3.9 (16.9) (6.9)
FX swaps 1.1 0.2 1.1 0.2
(75.0) 56.7 8.4 37.1
total fair value (gain) loss (75.0) 56.7 8.4 37.1
The above fair value movements are as a result of the Group recognising the financial instruments, except for intercompany balances, at fair value through profit or loss or as fair value hedges.
The Group experiences fair value movements principally through movements in underlying interest and exchange rates. The Group generally seeks to fix interest rates to provide certainty of interest rate costs. This means that, prima facie, a decrease in market interest rates will result in the Group sustaining fair value losses, and conversely, an increase in market interest rates will result in fair value gains.
Transpower values the majority of financial instruments at fair value in the statement of financial position. For cash and cash equivalents, accounts payable and receivables, fair values are materially similar to their cost due to the short-term nature of these items.
5. change in fair value of financial instruments continued
Fair value represents the amount that would, in the course of the normal operation of the financial markets, extinguish all current and future contractual obligations arising in respect of a particular financial instrument. The Group uses observable market prices and discounted cash flow techniques to calculate the fair value of its investments, debt and derivative instruments. The interest rate used for discounting is based on the applicable market swap curve, for example, for USD debt, the USD swap curve for similar rated entities would be used as the basis for discounting the expected cash flows. The swap curve is adjusted for estimated credit spreads. This is level 2 category as described by NZ IFRS 13.
Transpower has certain debt issues listed on the New Zealand debt exchange (NZDX). The volume of trades is considered insufficient to qualify for level 1.
For RRl investments in equities, quoted market prices are used. This is level 1 category as described by NZ IFRS 13.
foreign purchases
The Group hedges against foreign currency fluctuations on certain foreign purchases through the use of foreign exchange forward contracts. The hedge commitment represents the non derivative fair value movement, attributable to foreign exchange movements, on the commitment to buy the goods, i.e. before the goods or an invoice are received.
statement of financial position the following items are recorded at fair value: GROUp pARENT
unaudited31 dec 2013
audited30 jun 2013
unaudited31 dec 2013
audited30 jun 2013
$M $M $M $M
asset (liability) asset (liability) asset (liability) asset (liability)
Other investments 160.6 69.9 - -
Derivatives and hedge commitment in gain 114.1 279.4 114.1 151.0
NZpCl investment 101.5 111.1 - -
Current debt (422.4) (179.1) (422.4) (179.1)
Intercompany current debt - - (470.5) (1,604.6)
Derivatives and hedge commitment in loss (402.4) (514.2) (402.4) (228.6)
NZpCl debt (104.3) (114.2) - -
Non current debt (2,838.9) (2,844.6) (2,514.9) (1,633.0)

24 25
Notes to the financial statements continuedFor the six months ended 31 December 2013
TRANSPOWER NEW ZEALAND LIMITED AND SUBSIDIARIES TRANSPOWER NEW ZEALAND LIMITED AND SUBSIDIARIES
6. non-current assets
group
hvac transmission
lines
hvdc transmission
lines
hvac substations
hvdc substations
and submarine cables
communications administration assets
total property, plant and eQuipment
capital Work in
progress
$M $M $M $M $M $M $M $M
at 31 december 2013Cost 2,061.9 147.7 1,985.9 798.7 261.3 134.3 5,389.8 427.5 Accumulated depreciation (381.2) (36.1) (460.7) (171.3) (120.2) (86.9) (1,256.4) - Net book value 1,680.7 111.6 1,525.2 627.4 141.1 47.4 4,133.4 427.5
at 30 june 2013Cost 1,941.9 137.9 1,914.3 725.6 255.0 132.8 5,107.5 497.3 Accumulated depreciation (355.7) (34.2) (429.1) (167.4) (110.4) (84.1) (1,180.9) - Net book value 1,586.2 103.7 1,485.2 558.2 144.6 48.7 3,926.6 497.3
at 31 december 2012Cost 1,872.0 127.7 1,877.6 378.1 231.3 121.6 4,608.3 782.1 Accumulated depreciation (333.4) (32.6) (410.4) (201.4) (101.5) (80.3) (1,159.6) - Net book value 1,538.6 95.1 1,467.2 176.7 129.8 41.3 3,448.7 782.1
31 december 2013 reconciliationOpening net book value (1 july 2013) 1,586.2 103.7 1,485.2 558.2 144.6 48.7 3,926.6 497.3Additions/transfers 129.1 9.9 74.2 93.3 6.3 4.9 317.7 265.7Disposals/transfers (9.0) - (1.3) (8.8) - (0.9) (20.0) (335.5)Impairment - - - - - - - - Depreciation (25.6) (2.0) (32.9) (15.3) (9.8) (5.3) (90.9) - Closing net book value 1,680.7 111.6 1,525.2 627.4 141.1 47.4 4,133.4 427.5
30 june 2013 reconciliationOpening net book value (1 january 2013) 1,538.6 95.1 1,467.2 176.7 129.8 41.3 3,448.7 782.1 Additions/transfers 112.6 11.4 61.5 393.2 24.8 14.1 617.6 377.6 Disposals/transfers (39.1) (0.6) (7.8) (2.0) (0.1) (1.0) (50.6) (662.4)Impairment - - (3.5) - - - (3.5) - Depreciation (25.9) (2.2) (32.2) (9.7) (9.9) (5.7) (85.6) - Closing net book value 1,586.2 103.7 1,485.2 558.2 144.6 48.7 3,926.6 497.3
31 december 2012 reconciliationOpening net book value (1 july 2012) 951.0 80.2 1,354.5 164.5 127.8 43.0 2,721.0 1,288.6 Additions/transfers 622.9 16.8 148.9 20.3 13.2 4.4 826.5 306.1 Disposals/transfers (12.8) (0.4) (4.5) (0.2) - (0.1) (18.0) (812.6)Impairment - - - - - - - - Depreciation (22.5) (1.5) (31.7) (7.9) (11.2) (6.0) (80.8) - Closing net book value 1,538.6 95.1 1,467.2 176.7 129.8 41.3 3,448.7 782.1
parent
The parent now owns all of the Group’s non-current assets. The parent balances are:
unaudited 31 dec 2013
audited 30 jun 2013
unaudited 31 dec 2012
$M $M $M
net book valueproperty, plant and equipment 4,133.4 3,926.6 3,448.6 Capital work in progress 427.5 497.3 782.1 profit or lossDepreciation expense 90.9 166.4 80.8 Impairment expense - 3.5 -
property, plant and equipment
Administration assets include computer hardware, plant, equipment, furniture and motor vehicles.
land and buildings have a net book value of $173.7 million (june 2013: $182.4 million, December 2012: $203.5 million).
26 27
Notes to the financial statements continuedFor the six months ended 31 December 2013
Notes to the financial statements continuedFor the six months ended 31 December 2013
TRANSPOWER NEW ZEALAND LIMITED AND SUBSIDIARIES TRANSPOWER NEW ZEALAND LIMITED AND SUBSIDIARIES
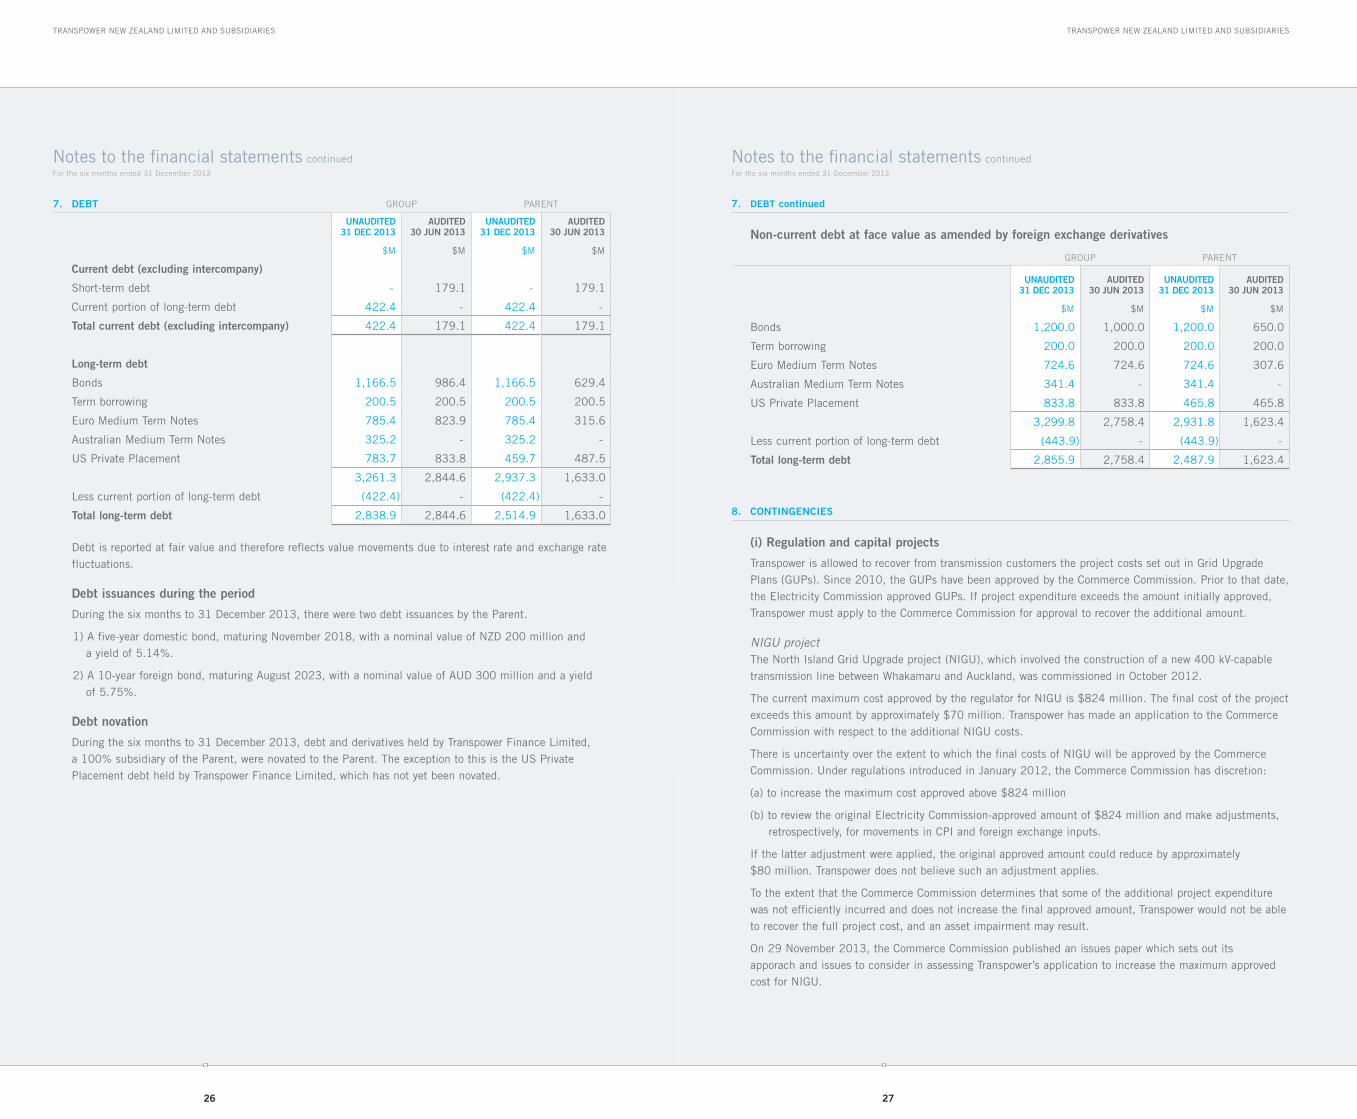
7. debt GROUp pARENT
unaudited31 dec 2013
audited30 jun 2013
unaudited31 dec 2013
audited30 jun 2013
$M $M $M $M
current debt (excluding intercompany)
Short-term debt - 179.1 - 179.1
Current portion of long-term debt 422.4 - 422.4 -
total current debt (excluding intercompany) 422.4 179.1 422.4 179.1
long-term debt
bonds 1,166.5 986.4 1,166.5 629.4
Term borrowing 200.5 200.5 200.5 200.5
Euro Medium Term Notes 785.4 823.9 785.4 315.6
Australian Medium Term Notes 325.2 - 325.2 -
US private placement 783.7 833.8 459.7 487.5
3,261.3 2,844.6 2,937.3 1,633.0
less current portion of long-term debt (422.4) - (422.4) -
total long-term debt 2,838.9 2,844.6 2,514.9 1,633.0
Debt is reported at fair value and therefore reflects value movements due to interest rate and exchange rate fluctuations.
debt issuances during the period
During the six months to 31 December 2013, there were two debt issuances by the parent.
1) A five-year domestic bond, maturing November 2018, with a nominal value of NZD 200 million and a yield of 5.14%.
2) A 10-year foreign bond, maturing August 2023, with a nominal value of AUD 300 million and a yield of 5.75%.
debt novation
During the six months to 31 December 2013, debt and derivatives held by Transpower Finance limited, a 100% subsidiary of the parent, were novated to the parent. The exception to this is the US private placement debt held by Transpower Finance limited, which has not yet been novated.
7. debt continued
non-current debt at face value as amended by foreign exchange derivatives
GROUp pARENT
unaudited31 dec 2013
audited30 jun 2013
unaudited31 dec 2013
audited30 jun 2013
$M $M $M $M
bonds 1,200.0 1,000.0 1,200.0 650.0
Term borrowing 200.0 200.0 200.0 200.0
Euro Medium Term Notes 724.6 724.6 724.6 307.6
Australian Medium Term Notes 341.4 - 341.4 -
US private placement 833.8 833.8 465.8 465.8
3,299.8 2,758.4 2,931.8 1,623.4
less current portion of long-term debt (443.9) - (443.9) -
total long-term debt 2,855.9 2,758.4 2,487.9 1,623.4
8. contingencies
(i) regulation and capital projects
Transpower is allowed to recover from transmission customers the project costs set out in Grid Upgrade plans (GUps). Since 2010, the GUps have been approved by the Commerce Commission. prior to that date, the Electricity Commission approved GUps. If project expenditure exceeds the amount initially approved, Transpower must apply to the Commerce Commission for approval to recover the additional amount.
NIGU projectThe North Island Grid Upgrade project (NIGU), which involved the construction of a new 400 kV-capable transmission line between Whakamaru and Auckland, was commissioned in October 2012.
The current maximum cost approved by the regulator for NIGU is $824 million. The final cost of the project exceeds this amount by approximately $70 million. Transpower has made an application to the Commerce Commission with respect to the additional NIGU costs.
There is uncertainty over the extent to which the final costs of NIGU will be approved by the Commerce Commission. Under regulations introduced in january 2012, the Commerce Commission has discretion:
(a) to increase the maximum cost approved above $824 million
(b) to review the original Electricity Commission-approved amount of $824 million and make adjustments, retrospectively, for movements in CpI and foreign exchange inputs.
If the latter adjustment were applied, the original approved amount could reduce by approximately $80 million. Transpower does not believe such an adjustment applies.
To the extent that the Commerce Commission determines that some of the additional project expenditure was not efficiently incurred and does not increase the final approved amount, Transpower would not be able to recover the full project cost, and an asset impairment may result.
On 29 November 2013, the Commerce Commission published an issues paper which sets out its apporach and issues to consider in assessing Transpower’s application to increase the maximum approved cost for NIGU.

28 29
Notes to the financial statements continuedFor the six months ended 31 December 2013
Notes to the financial statements continuedFor the six months ended 31 December 2013
TRANSPOWER NEW ZEALAND LIMITED AND SUBSIDIARIES TRANSPOWER NEW ZEALAND LIMITED AND SUBSIDIARIES
8. contingencies continued
(ii) guarantees
NZPCLIn November 2009, the Group partially terminated the 2003 cross border lease in respect of the majority of the HVAC transmission assets in the South Island. As a result of the partial termination, Transpower has consolidated a special purpose vehicle, NZpCl. NZpCl has a deposit with a financial institution and a loan from another financial institution. The cash flows from the deposit and loan offset. No consideration was transferred. The loan to NZpCl is guaranteed by Transpower. The substance of the transaction is such that Transpower, rather that the non-controlling interest, would be responsible for any shortfall between the value of the asset and the liability.
DebtTranspower and, in some cases, certain subsidiaries have provided guarantees in respect of Transpower’s or Transpower Finance limited’s bonds, Euro Medium Term Notes, the US private placements and its bank facilities. both principal repayments and interest payments have been guaranteed.
In addition to guaranteeing the loans outstanding, Transpower has given a negative pledge covenant that, while any of the debt issued remains outstanding, it will not (and its subsidiaries will not), subject to certain exceptions, create or permit to exist any charge or lien over any of their respective assets.
The likelihood of losses in respect of these matters is considered to be remote.
(iii) economic gain (loss) account
Transpower operates its revenue-setting methodology within an economic value (EV) framework that analyses economic gains and losses between those attributable to shareholders and those attributable to customers. Under Commerce Commission regulations, Transpower is required to pass onto or claim from customers the economic value of the net balance of any historical gains or losses incurred prior to 30 june 2012. In addition to the historical balances, further economic gains or losses arising are required to be passed on or claimed from customers in the following pricing year.
8. contingencies continued
The following are the balances and expected cash flows from the EV accounts for HVAC and HVDC customers.
hvac hvdc total
$M $M $M
30 june 2013 balance
pre-input methodology EV balances to be recovered (paid) 1 April 2013 to 31 March 2020 (47.1) 94.0 46.9
post input methodology EV balances to be recovered (paid) 1 April 2013 to 31 March 2014 (39.1) 5.9 (33.2)
post input methodology EV balances to be recovered (paid) 1 April 2014 to 31 March 2015 (11.4) (7.5) (18.9)
Total be recovered (paid) (97.6) 92.4 (5.2)
30 june 2012 balance
pre-input methodology EV balances to be recovered (paid) 1 April 2012 to 31 March 2020 (52.1) 104.1 52.0
post input methodology EV balances to be recovered (paid) 1 April 2013 to 31 March 2014 (36.5) 5.5 (31.0)
Total be recovered (paid) (88.6) 109.6 21.0
(iv) regulated rate of return
On 23 December 2010, the Commerce Commission announced the new regulatory framework that applies to Transpower and has been brought into effect by the Commerce Act (Transpower Individual price-quality path) Determination 2010 and the Commerce Act (Transpower Input Methodologies) Determination 2010. Under this framework, the Commerce Commission has determined a regulated rate of return for Transpower of 7.19 per cent.
The process leading to this decision has been subject to merits review. On 12 December 2013, the High Court upheld the Commerce Commission’s processes and decisions. In its judgment, the High Court questioned whether the WACC applied should be at the 75th percentile. The Major Electricity Users Group has sought leave to appeal the High Court’s decision to the Court of Appeal.
On 7 February 2014, the Commerce Commission announced that it would be consulting on whether it should review the 75th percentile assumption for its cost of capital calculation.
A move to a midpoint (50th percentile) WACC estimate would reduce Transpower’s annual transmission revenue by approximately $50 million.
(v) various other lawsuits, claims and investigations
Various other lawsuits, claims and investigations have been brought or are pending against the Group. The directors of Transpower cannot reasonably estimate the adverse effect (if any) on the Group if any of the foregoing claims are ultimately resolved against the Group’s interests.
30 31
Notes to the financial statements continuedFor the six months ended 31 December 2013
Notes to the financial statements continuedFor the six months ended 31 December 2013
TRANSPOWER NEW ZEALAND LIMITED AND SUBSIDIARIES TRANSPOWER NEW ZEALAND LIMITED AND SUBSIDIARIES
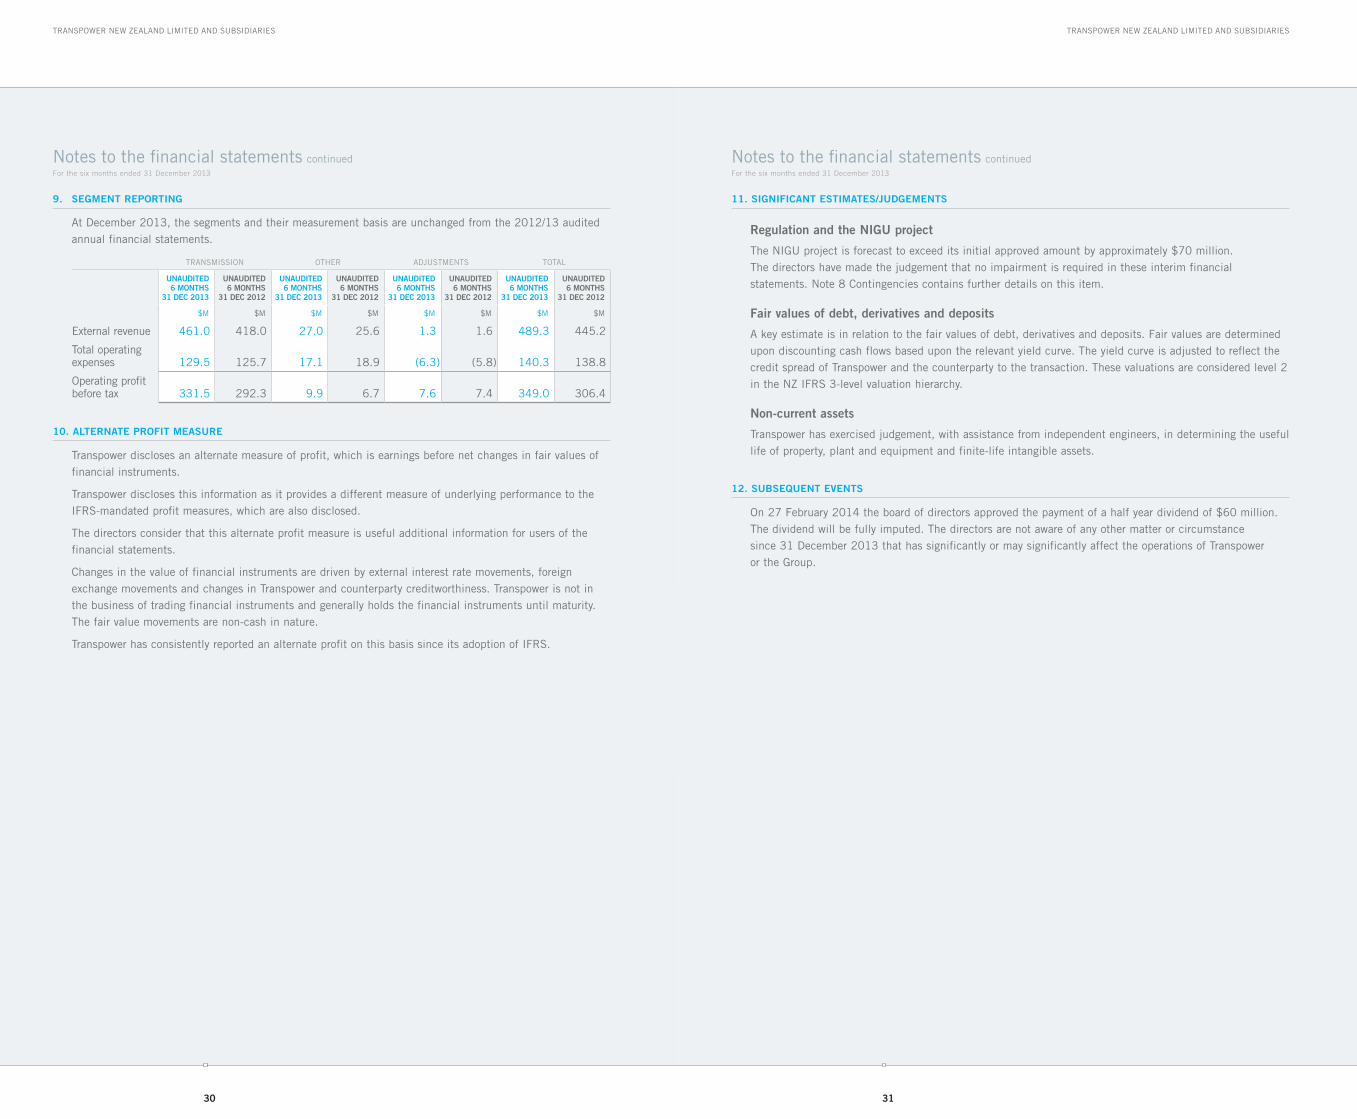
9. segment reporting
At December 2013, the segments and their measurement basis are unchanged from the 2012/13 audited annual financial statements.
TRANSMISSION OTHER ADjUSTMENTS TOTAl
unaudited6 months
31 dec 2013
unaudited6 months
31 dec 2012
unaudited6 months
31 dec 2013
unaudited6 months
31 dec 2012
unaudited6 months
31 dec 2013
unaudited6 months
31 dec 2012
unaudited6 months
31 dec 2013
unaudited6 months
31 dec 2012
$M $M $M $M $M $M $M $M
External revenue 461.0 418.0 27.0 25.6 1.3 1.6 489.3 445.2
Total operating expenses 129.5 125.7 17.1 18.9 (6.3) (5.8) 140.3 138.8
Operating profit before tax 331.5 292.3 9.9 6.7 7.6 7.4 349.0 306.4
10. alternate profit measure
Transpower discloses an alternate measure of profit, which is earnings before net changes in fair values of financial instruments.
Transpower discloses this information as it provides a different measure of underlying performance to the IFRS-mandated profit measures, which are also disclosed.
The directors consider that this alternate profit measure is useful additional information for users of the financial statements.
Changes in the value of financial instruments are driven by external interest rate movements, foreign exchange movements and changes in Transpower and counterparty creditworthiness. Transpower is not in the business of trading financial instruments and generally holds the financial instruments until maturity. The fair value movements are non-cash in nature.
Transpower has consistently reported an alternate profit on this basis since its adoption of IFRS.
11. significant estimates/judgements
regulation and the nigu project
The NIGU project is forecast to exceed its initial approved amount by approximately $70 million. The directors have made the judgement that no impairment is required in these interim financial statements. Note 8 Contingencies contains further details on this item.
fair values of debt, derivatives and deposits
A key estimate is in relation to the fair values of debt, derivatives and deposits. Fair values are determined upon discounting cash flows based upon the relevant yield curve. The yield curve is adjusted to reflect the credit spread of Transpower and the counterparty to the transaction. These valuations are considered level 2 in the NZ IFRS 3-level valuation hierarchy.
non-current assets
Transpower has exercised judgement, with assistance from independent engineers, in determining the useful life of property, plant and equipment and finite-life intangible assets.
12. subseQuent events
On 27 February 2014 the board of directors approved the payment of a half year dividend of $60 million. The dividend will be fully imputed. The directors are not aware of any other matter or circumstance since 31 December 2013 that has significantly or may significantly affect the operations of Transpower or the Group.
32
TRANSPOWER NEW ZEALAND LIMITED AND SUBSIDIARIES
board of directors
general management team address of offices
chairmanMARK VERbIEST
deputy chairmanIAN FRASER
directorsAbby FOOTEDON HUSEjAN EVANS-FREEMANMIKE pOHIOAlASTAIR SCOTT KEITH TEMpEST
chief eXecutiveAlISON ANDREW
general manager people and corporate relationsCyNTHIA bROpHy
chief financial officer HOWARD CATTERMOlE
general manager grid developmentjOHN ClARKE
general manager system operationsKIERAN DEVINE
general manager grid performanceGARTH DIblEy
general counsel and company secretaryDAVID KNIGHT
chief engineerbOb SIMpSON
general manager grid projectsKEVIN SMAll
general manager information services and technologyjIM TOCHER
WellingtonTRANSpOWER HOUSE, 96 THE TERRACEpO bOX 1021, WEllINGTON 6140TElEpHONE 64 4 495 7000FACSIMIlE 64 4 495 7100
aucklandlEVEl 5, bUIlDING 2CENTRAl pARK CORpORATE CENTRE666 GREAT SOUTH ROADpO bOX 17-215, GREENlANE, AUCKlAND 1546TElEpHONE 64 9 589 2300FACSIMIlE 64 9 589 2310
palmerston northlEVEl 5, IRD bUIlDINGCORNER ASHlEy STREETAND FERGUSON STREETpO bOX 640, pAlMERSTON NORTH 4440TElEpHONE 64 6 357 0919FACSIMIlE 64 6 357 0917
christchurch31 GIlTHORpES ROAD ISlINGTONpO bOX 21-154, EDGEWARE CHRISTCHURCH 8143TElEpHONE 64 3 590 7600FACSIMIlE 64 3 338 1290
// directory
debt listings and Waivers
Transpower has debt listed on the NZX Debt Market quoted under the ticker codes TRp010 and TRp020 (together, bonds). As a listed issuer, Transpower is subject to certain requirements and obligations under the NZX Main board/Debt Market listing Rules (listing Rules), including a continuous disclosure obligation. In addition, Transpower has obtained the following waivers:
• Waiversfromrule5.2.3,whichrequiresatleast25percentofthetrancheofbondsquotedontheNZXDebt Market to be held by at least 500 bondholders who are members of the public. Accordingly, the bonds may not be widely held, and there may be reduced liquidity in the bonds. The waiver in respect of the TRp010 bonds is for a period of one year from 7 September 2013. The waiver in respect of the TRp020 bonds is for a period of one year from 28 February 2013. In addition to disclosing the waivers and their implications and conditions in its half year and annual reports, Transpower is to notify NZX Regulation if there are any material changes to the spread of either tranche of bonds.
• Awaiverfromthepreviousrule10.5.3ofthethencurrentNZX/NZXDebtMarketListingRules,whichrequires an issuer to provide its half year report to NZX and quoted security holders within three months of the end of the first six months of each financial year of the issuer. NZX has recognised that State-Owned Enterprises (SOEs) are subject to reporting obligations that differ from those required of other companies. In particular, SOEs are not required to provide their annual reports to NZX and quoted security holders until they are provided to the responsible Minister and laid before the House.
• Awaiverfromrule11.1.1topermitTranspowertorestrictthetransferofthebondsinanythingotherthanparcels of $1,000 or if the transfer would result in any bondholder holding less than $5,000 (if not zero).

www.transpower.co.nz