wdi 2013 en q1 presentation - wirecardir.wirecard.com/.../wdi_2013__en_q1_presentation.pdfvodafone...
TRANSCRIPT
© 2013 Wirecard AG 1
Wirecard AGResults 1st quarter of fiscal 2013Investor Presentation
Aschheim, May 16 2013
© 2013 Wirecard AG 2
1. Key Figures / Highlights 1st quarter of fiscal 2013
2. Products and Solutions
3. Growth Drivers, Strategy and Outlook
4. Financial Data
Content

© 2013 Wirecard AG 3
1. Key Figures /Highlights 1st quarterof fiscal 2013

© 2013 Wirecard AG 4
Key Figures 1st quarter 2013
Key Figures / Highlights 1st quarter of fiscal 2013
Q1 2013 Q1 2012 Change in %
Results Transaction volume EUR bn 5.7 4.4 +30%
Revenues EUR mn 101.1 83.6 +21%
EBITDA EUR mn 26.3 23.3 +13%
EBIT EUR mn 21.1 19.7 +7%
Earnings after taxes EUR mn 16.5 15.3 +8%
Operating cash flow* EUR mn 22.7 18.3 +24%
* Consolidated cash flow from operating activities (adjusted)

© 2013 Wirecard AG 5
Diversified Customer Portfolio – Target IndustriesAfter the first three months in 2013 the transaction volume* amounted toEUR 5.7 billion (+ 29.5% yoy). Thereof EUR 0.8 billion (~14.0%) was generated in Asia.
At the end of period under review, the following breakdown to our targetindustries shows that positive business trends are continuing in all fields ofactivity:
Key Figures / Highlights 1st quarter of fiscal 2013
* Transaction volume: basically acceptance and issuing means of payment along with associated value added services

© 2013 Wirecard AG 6
Operational Highlights Q1 2013� Wirecard AG continued its operational growth with existing and new customers, such as
SriLankan Airlines. At the same time the company extended yet further its international network of cooperation and distribution partners.
� Telefónica Deutschland: Wirecard manages payment processing and the provisioning of the virtual „O2 Wallet mpass Card“ to NFC-enabled SIM cards for Telefónica. Furthermore the service “mpass sending money” allows transfers to be made from smartphone to smartphone practically in real time.
� Vodafone Group: Partnership with Wirecard for the introduction of its mobile payment service / creation, implementation and operation of technical Mobile Payment processes + issuing of virtual and physical co-branded Visa cards.
� UATP: Wirecard entered into a new partnership with UATP. As a result, Wirecard will now be able to offer and route payment solutions to all UATP Merchant types, including air, hotel, rail and travel agencies.
� PT Prima Vista Solusi, Indonesia : Leading Indonesian Payment Service Provider successfully integrated into Wirecard Group Operations (consolidated: Dec 2012).
Key Figures / Highlights 1st quarter of fiscal 2013

2. Products and Solutions

© 2013 Wirecard AG 8
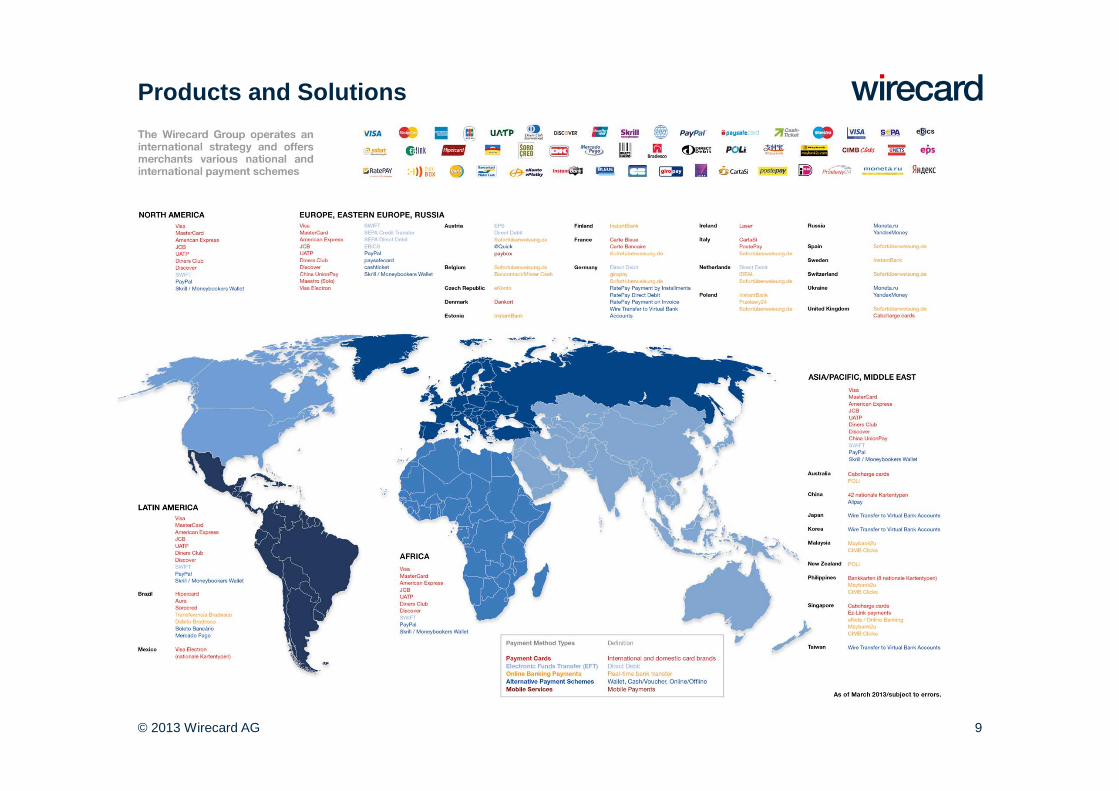
Products and Solutions
© 2013 Wirecard AG 9
Products and Solutions

© 2013 Wirecard AG 10
Wirecard provides all ingredients for co-branded mobile wallet programs (white-label)
Issuing processing services
Mobile wallet platform
Co-Brand / 3rd Party
Co-Brand / 3rd Party
Wirecard Bank AG /Wirecard Card Solutions Ltd.
WirecardMasterCard/VISA issuing license
TECHNICAL SERVICES
FINANCIAL SERVICES LICENSE
CARD ISSUER
PIN ManagementPIN Management
Card ProductionCard Production Instant IssuingInstant Issuing
Top-up Processing
Top-up Processing
RegistrationKYC
RegistrationKYC
Card & Account Mgmt.
Card & Account Mgmt.
Call centre / Administration
Interface
Call centre / Administration
Interface
White-label Mobile Application
White-label Mobile Application
White-label Consumer Service
Area
White-label Consumer Service
Area
Scheme Networks
Transaction ProcessingTransaction Processing
Fraud Protection
Fraud Protection
Risk Mgmt.Risk
Mgmt.
Card Personalization Card & PIN Mailing SP-TSM*
*Service Provider – Trusted Service Manager
Products and Solutions

© 2013 Wirecard AG 11
3. Growth Drivers, Strategy and Outlook

© 2013 Wirecard AG 12
Online, offline, mobile commerce are converging –mobile internet use to accelerate
Growth in European online retail: by ~11% - 12% yoy a verage from 2011 to 2017 (EU-17 states) (Forrester 2013)
� European online travel market to grow by ~7% yoy (2013 to 2014) (PhoCusWright’s 2013)
� The European online travel market will already account for a little morethan 40% of the total travel market in 2013 (PhoCusWright’s 2013)
� The number of users of paid content will increase by 8% to 12% through to 2017 (Forrester 2012)
� 38% of smartphone users download paid apps (BITKOM 2013)
Demand for M-POS solutions
� Average annual growth rate of 28.7% for contactless payment card systems until 2017 (Frost & Sullivan 2013)
Growth Drivers, Strategy and Outlook
© 2013 Wirecard AG 13
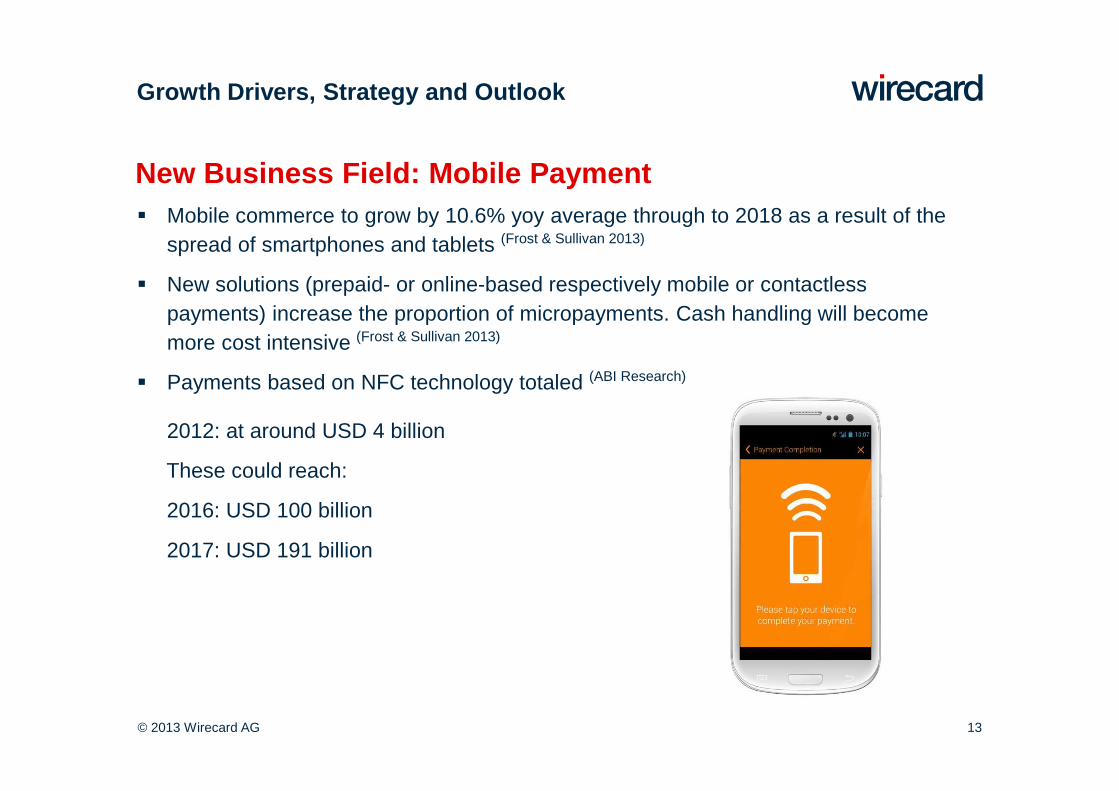
New Business Field: Mobile Payment� Mobile commerce to grow by 10.6% yoy average through to 2018 as a result of the
spread of smartphones and tablets (Frost & Sullivan 2013)
� New solutions (prepaid- or online-based respectively mobile or contactlesspayments) increase the proportion of micropayments. Cash handling will becomemore cost intensive (Frost & Sullivan 2013)
� Payments based on NFC technology totaled (ABI Research)
2012: at around USD 4 billion
These could reach:
2016: USD 100 billion
2017: USD 191 billion
Growth Drivers, Strategy and Outlook

© 2013 Wirecard AG 14
Outlook
Fiscal Year 2013: EBITDA of between EUR 120 to 130 mill ion(taking investments for mobile payment business intoaccount: EUR 25 million)
Guidance based on:
� Basic growth along with the European eCommerce market acceleration by ~11% - 12%
� Increase of the transaction volume due to new customers / existing customers
� Economies of scale from the transaction oriented business model
� Cross selling effects with existing customers
� Expansion of the Issuing- and Banking-Services
� Contribution to operating income through the M&A-transactions of 2012
Proposed Dividend: Annual General Meeting on June 20, 2013 EUR 0.11 per share (previous year: EUR 0.10)
Growth Drivers, Strategy and Outlook
4. Financial Data

© 2013 Wirecard AG 16
Key Figures Q1 2013 / Q1 2012
Financial Data
* Consolidated cash flow from operating activities (adjusted)
** Thereof 254 employees from M&A-transaction of PT Prima Vista Solusi
in EUR K Q1 2013 Q1 2012 Change in %
Revenues 101,084 83,640 +21%
EBITDA 26,334 23,258 +13%
EBIT 21,070 19,723 +7%
Profit after Taxes 16,531 15,282 +8%
Operating cash flow* 22,656 18,262 +24%
Shareholders’ equity 558,639 494,116 +13%
Total equity and liabilities 1,179,335 868,208 +36%
Employees (average) ** 894 595 +50%
thereof full-time employees ** 753 441 +71%
thereof part-time employees 141 154 (8%)
© 2013 Wirecard AG 17
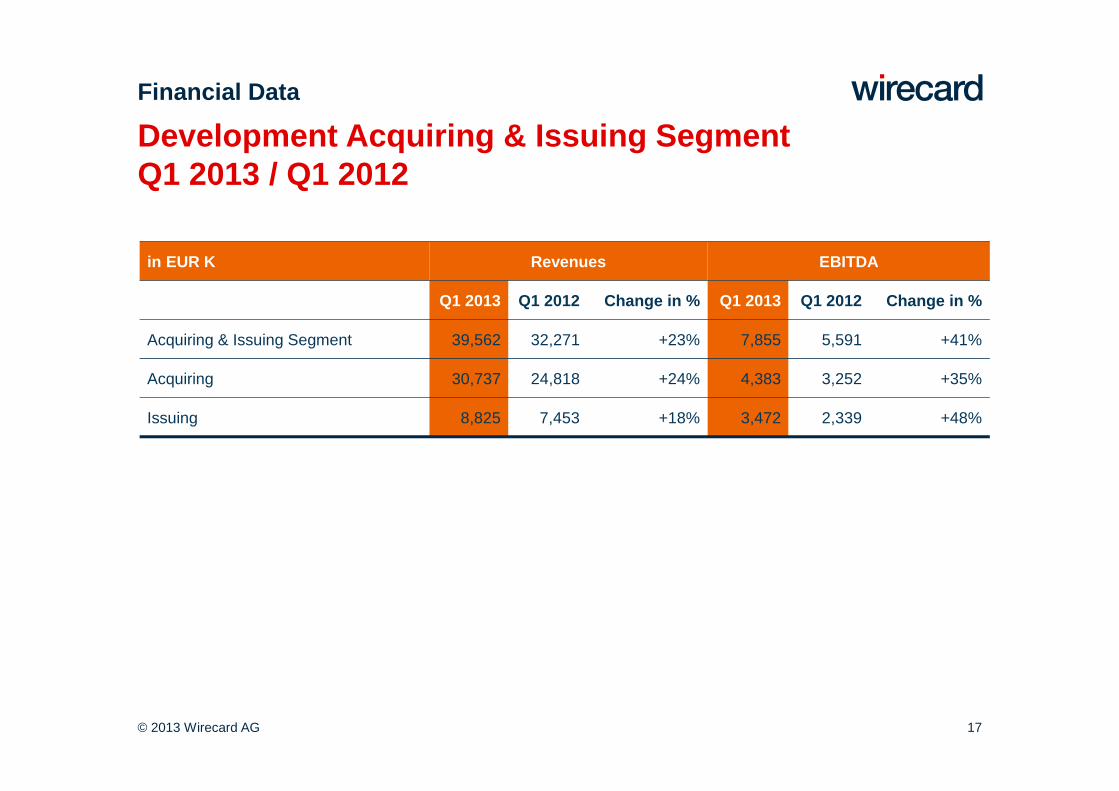
Development Acquiring & Issuing Segment Q1 2013 / Q1 2012
Financial Data
in EUR K Revenues EBITDA
Q1 2013 Q1 2012 Change in % Q1 2013 Q1 2012 Change in %
Acquiring & Issuing Segment 39,562 32,271 +23% 7,855 5,591 +41%
Acquiring 30,737 24,818 +24% 4,383 3,252 +35%
Issuing 8,825 7,453 +18% 3,472 2,339 +48%

© 2013 Wirecard AG 18
Consolidated Income Statement Q1 2013 / Q1 2012
Financial Data
* These include in 2013 special investments for hardware and software improvements to expand the existing mobile payments infrastructure,which results in personnel expenses, other operating expenses and amortization and depreciation with an amount of circa EUR 2,2 million.
in EUR K Q1 2013* of Revenues Q1 2012 of Revenues
Revenues 101,084 83,640
Own work capitalized 3,673 2,088
Cost of materials (59,188) (58.6%) (47,787) (57.1%)
Personnel expenses (11,007) (10.9%) (8,699) (10.4%)
Other operating expenses (9,068) (9.0%) (6,657) (8.0%)
Other operating income 840 673
EBITDA 26,334 26.1% 23,258 27.8%
Amortization and depreciation (5,264) (3,535)
EBIT 21,070 19,723
Financial results (954) (700)
Income tax (3,585) (3,741)
Profit after Taxes 16,531 15,282
EPS (undiluted) EUR 0.15 0.15
© 2013 Wirecard AG 19
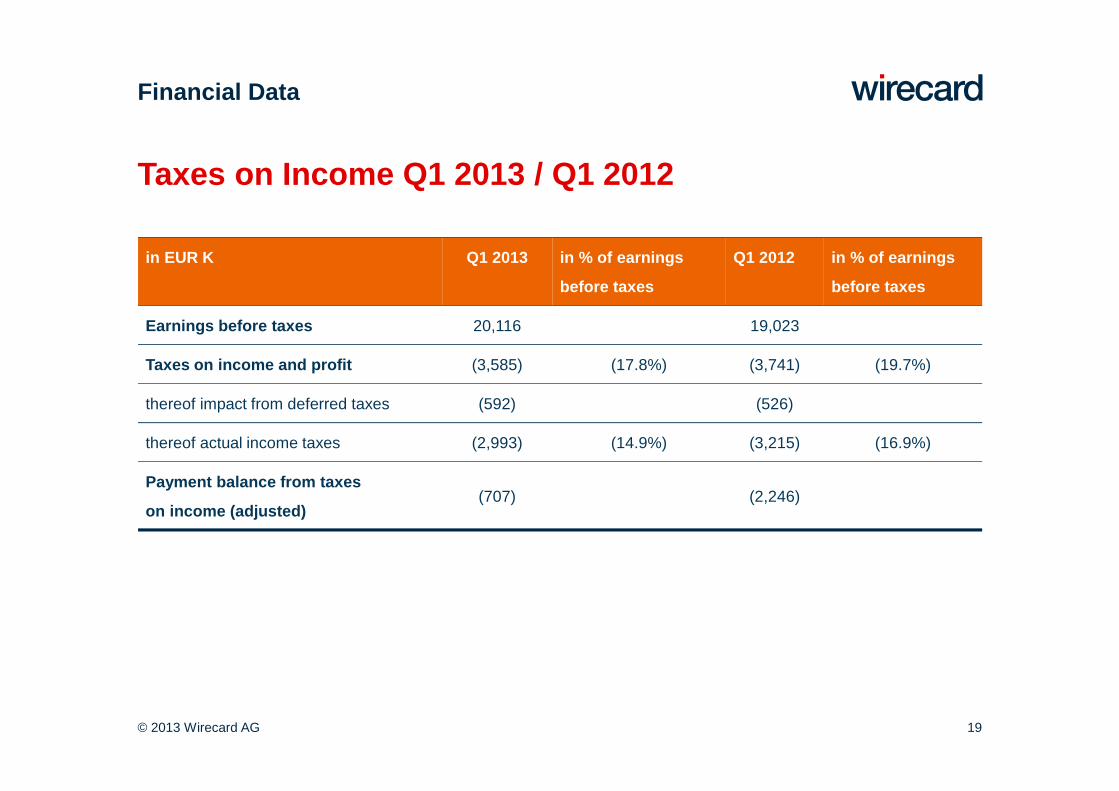
Taxes on Income Q1 2013 / Q1 2012
Financial Data
in EUR K Q1 2013 in % of earnings
before taxes
Q1 2012 in % of earnings
before taxes
Earnings before taxes 20,116 19,023
Taxes on income and profit (3,585) (17.8%) (3,741) (19.7%)
thereof impact from deferred taxes (592) (526)
thereof actual income taxes (2,993) (14.9%) (3,215) (16.9%)
Payment balance from taxes
on income (adjusted) (707) (2,246)

© 2013 Wirecard AG 20
Balance Sheet as of March 31, 2013 / December 31, 2012
Financial Data
Assets 03/31/2013 12/31/2012
Non-currrent assets 479,508 459,874
Goodwill 141,862 142,149
Deferred tax assets 576 1,112
Internally gen. intangible assets 31,459 28,797
Other intangible assets 26,238 25,607
Customer relationships 160,208 151,279
Other property, plant & equipm. 11,250 11,802
Fin. Assets/int. bearing securities 107,915 99,128
Current assets 699,827 668,010
Trade receivables 256,492 215,496
Cash and cash equivalents 322,545 358,172
Interest-bearing securities 111,116 84,332
Other 9,674 10,010
Total assets 1,179,335 1,127,884
Equity and liabilities 03/31/2013 12/31/2012
Shareholders’ equity 558,639 541,730
Liabilities 620,696 586,154
Current provisions 1,249 1,298
Tax provisions 8,515 6,236
Trade payables 223,939 187,249
Interest-bearing bank loans 113,633 94,970
Deferred income taxes 13,288 13,232
Other non-current liabilities 11,912 12,305
Other current liabilities 24,459 28,971
Customer deposits 223,701 241,893
Total equity and liabilities 1,179,335 1,127,884
in EUR K
© 2013 Wirecard AG 21
This presentation contains explicit and implicit forward-looking statements concerning Wirecard AG, its affiliated companies and their business. These statements are subject to various known and unknown risks, uncertainties and other factors due to which the actual events, financial conditions, performances and achievements of Wirecard AG may differ substantially from those expressed in such explicit or implicit statements. Wirecard AG makes these statements at the time of the publication of the presentation and is under no obligation to update the forward-looking statements in this presentation including on receipt of new information or on occurrence of future events or for other reasons. However, Wirecard AG, may change in its own free discretion any forward-looking statements should relevant factors change.
The forward-looking statements from third parties’ surveys, in particular without being limited to research reports and analysts’ statements, may prove to be incorrect. Reference to such third parties’ surveys is provided for information only and does not imply any agreement with or consent to the content of such surveys or the information, opinions or conclusions contained therein. Wirecard AG accepts no liability for the selection, completeness or correctness of third parties’ studies.
Wirecard AG mostly publishes its figures in thousands of euro (EUR K). The use of rounding means that it is possible that some figures do not add up exactly to form the totals stated, and that the figures and percentages do not exactly reflect the absolute values on which they are based.
This presentation is no offer for the sale and no invitation for offers of purchase or for subscription to of shares of Wirecard AG but is provided for information only.
Financial data (IAS/IFRS) refers to the Reports of Wirecard AG published on our website: http://www.wirecard.com/investor-relations
Disclaimer

© 2013 Wirecard AG 22
Wirecard AGEinsteinring 3585609 Aschheim / MunichGermany
Investor RelationsIris Stö[email protected]: + 49 (0) 89 4424 1424
Contact