wd- company -k and proxy reaching households worldwide
TRANSCRIPT
WD-40 COMPANY 2006 FORM 10-K AND PROXY
REACHING HOUSEHOLDS WORLDWIDE:
FRANCE AUSTRALIA PORTUGAL GERMANY

AMERICAS 65%
ASIA PACIFIC 7%
EUROPE 28%
AMERICAS- $186.8mm, up 6.1% vs. last year- Lubricant sales up 3.5% vs. last year- Household products up 10.2% vs. last year- Hand cleaners down 1.6% vs. last year
ASIA-PACIFIC- $21.0mm, up 12.1% vs. last year- Asia sales up 17.4% vs. last year- Australia sales up 2.7% vs. last year
EUROPE- $79.1mm, up 15.7% in $US vs. last year- Strong growth in UK, France, Germany,
Italy, Spain, and Eastern Europe- Forex impact reduced sales by $2.9mm,
or 3.5% vs. last year
SALES BY SEGMENT: FY06
56% OF THE COMPANY’S TOTAL WD-40 BRAND SALES COMES FROM OUTSIDE OF THE U.S.

G’day,If I had to choose a headline for a news story for our 2006performance, it would read something like this:
“We only see one market, and it is global.”
It is satisfying to look back at the growth in all our trading blocslast year. Thanks to the hard work of our team, our great brandsand the strong infrastructure and market platforms we have builtover the years, we are anticipating steady growth in all geo-graphic markets. Our WD-40® brand is showing great promisein markets like China and Russia, and we anticipate stronggrowth over the next few years. This year, the Company hasdecided to open a direct sales office in Shanghai, China, andenter the next development phase for this important market.Other global markets—including Mexico, Germany, andIndonesia, just to name a few—show great promise.
Growth through innovation.Since we started on our path of innovative product developmentin 2002, each year we learn more about our consumers’ needsand how to deliver products that meet those needs. In the lastthree years our R&D group, which we call “Team Tomorrow,”has generated close to $86 million dollars in product innovationsalone. Some of the products that are showing early signs ofsuccess are the WD-40 Smart Straw, the WD-40 No-Mess Pen,and our Spot Shot® trigger spray. WD-40 brand salesincreased by 9.8% in fiscal 2006 compared to fiscal 2005. Thebrand has now experienced global growth for five consecutiveyears.
Other products have enjoyed significant growth. Sales of all ourhousehold brands grew in 2006.
As a company, we are especially proud that our emphasis oninnovation continues to result in the development of productsthat are mainstays in the home and workplace—not onlyperpetuating the WD-40 brand legacy but also opening up newopportunities for us in a variety of trade channels and markets. Inthe U.S., for example, our WD-40 and household brands aregaining traction in areas such as janitorial services, office sup-plies, and arts and crafts.
Controlling costs.We learned more about balancing our advertising and promo-tional investment to make every dollar we invest in these areascount. With new leadership in our U.S. marketing team, we haveseen many changes in this area that have already added value ina short time.
We also had to take a hard look at our cost of goods. Oursteel prices have increased in excess of 65% since 2000. Oilprices have impacted us with plastics, lubricant products, andfreight transportation. We implemented a price increase tooffset some of these increases and we created a team toreview costs of goods and trends, and to provide strategicsolutions to minimize the pressure on us in this area.
We hope you are pleased with our results this year despitethe market challenges. We feel we did a good job at manag-ing the business.
Looking ahead.Though there are still many mountains for us to climb, we arebecoming more global each day, and our innovation andgeographic expansion will continue to drive our growth. Ianticipate that we are going to experience the same chal-lenges in our cost of goods areas. However, we are confidentthat if we manage our business with rigor, we will minimizethe impact to the bottom line.
Business is not without risk, so you should be continuallyaware of some of the areas that could affect our company.Because litigation seems to be an ever-increasing part ofsociety, your company will always have some legal exposurearound the world.
Be assured, however, that our company will take a stanceagainst frivolous lawsuits.
In closing, I encourage you to read our 10-K, which providesdetailed highlights of our company’s performance.
Of course, I would be remiss if I didn’t thank our shareholdersfor their continued support, and thank our employees for theirhard work over the past year. Each and every one of youhelped make 2006 very productive.
As the company looks ahead, we remain confident in ouroutlook. As we say at WD-40 Company, “there is somethingsignificant yet to do.”
Garry Ridge

PROFITABILITY RATIOS
(after tax)Return on Sales
Return on Assets
Return on Equity10% 10% 18%
WTD AVERAGE SHARESOUTSTANDING, DILUTED (in millions)
SALES(in millions)
SALES PER EMPLOYEE (in thousands)
EARNINGS PER SHARE(in dollars)
YEAR EARNINGS(in millions)
03 04 05 06 03 04 05 06
03 04 05 06 03 04 05 06 03 04 05 06
16.8
17.1
16.816.9
238.1 242.5
263.2
286.9
1,1181,128
1,155
1,191
1.71
1.50
1.65 1.66
28.6
25.6
27.8 28.1

Table of Contents
WD-40 Company Proxy StatementWD-40 Company Annual Report Form 10-KWD-40 Company Corporate Information

[THIS PAGE INTENTIONALLY LEFT BLANK]

WD-40 COMPANY1061 Cudahy Place
San Diego, California 92110
NOTICE OF ANNUAL MEETING OF STOCKHOLDERS
To the Stockholders:
The 2006 Annual Meeting of Stockholders will be held at the Mission Valley Hilton Hotel, 901 Camino del RioSouth, San Diego, California 92108, on Tuesday, December 12, 2006, at 2:00 p.m. for the following purposes:
1. To elect a Board of Directors for the ensuing year and until their successors are elected and qualified;
2. To ratify the appointment of PricewaterhouseCoopers LLP as the Company’s independent registeredpublic accounting firm for the fiscal year 2007; and
3. To consider and act upon such other business as may properly come before the meeting.
Only the stockholders of record at the close of business on October 17, 2006 are entitled to vote at the meeting.
By Order of the Board of DirectorsMaria M. Mitchell
Secretary
San Diego, CaliforniaNovember 6, 2006


PROXY STATEMENT
GENERAL INFORMATION
This Proxy Statement is furnished in connection with the solicitation of proxies by the Board of Directors ofWD-40 Company for use at its Annual Meeting of Stockholders to be held on December 12, 2006, and at anypostponements or adjournments thereof. This Proxy Statement and enclosed form of Proxy are first sent tostockholders on or about November 06, 2006.
At the meeting, the stockholders of WD-40 Company will vote to elect the Board of Directors for the ensuingyear and to ratify the selection of PricewaterhouseCoopers LLP as the Company’s independent registered publicaccounting firm. Detailed information concerning these matters is set forth below. Management knows of noother business to come before the meeting.
The close of business on October 17, 2006 is the record date for stockholders entitled to notice of and to vote atthe Annual Meeting of Stockholders of WD-40 Company. On October 17, 2006, WD-40 Company hadoutstanding 17,021,909 shares of $.001 par value common stock. Stockholders of record entitled to vote at themeeting will have one vote for each share so held on the matters to be voted upon. A majority of the outstandingshares will constitute a quorum at the meeting. Abstentions and broker non-votes are counted for purposes ofdetermining the presence or absence of a quorum.
If the enclosed form of Proxy is properly executed and returned, the shares represented thereby will be voted inaccordance with the instructions specified thereon. Except as described herein with respect to broker non-votes,if no specification is made, the shares will be voted by the proxy holder as set forth on the Proxy. A Proxy maybe revoked by attendance at the meeting or by filing a Proxy bearing a later date with the Secretary of theCompany.
The cost of soliciting proxies will be borne by the Company. Solicitations other than by mail may be made bytelephone or in person by employees of the Company for which the expense will be nominal.
1

PRINCIPAL SECURITY HOLDERS
The following table sets forth information concerning those persons known to the Company to be the beneficialowners of more than 5% of the common stock of the Company.
Name and Address of Beneficial Owner
Amount and NatureOf BeneficialOwnership
October 17, 2006Percentof Class
Allianz Global Investors Managed Accounts LLC 1,516,1931 8.9%680 Newport Center Dr. Suite 250Newport Beach, CA 92660
Capital Research and Management Company 926,0002 5.4%333 South Hope Street, 55th FloorLos Angeles, CA 90071
Mario L. Crivello 907,4883 5.3%San Diego, California
1 On February 14, 2006, Allianz Global Investors Managed Accounts LLC, an institutional investmentadviser, filed a report on Form 13F with the Securities and Exchange Commission to report beneficialownership, shared voting power and shared dispositive power of 865,100 shares. A breakdown of the sharedvoting power is unavailable. As of June 30, 2006, Allianz filed a report on Form 13F with the Securities andExchange Commission to report beneficial ownership of 1,516,193 shares. A current breakdown of theinvestment company holdings is not provided in the Form 13F report. Beneficial ownership information asof October 17, 2006 is unavailable.
2 On February 6, 2006, Capital Research and Management Company (“CRMC”), an institutional investmentadviser, Capital Income Builder, Inc. (“CIB”), an investment company, and SMALLCAP World Fund, Inc.(SWF), an investment company, filed a joint statement on Form 13G/A with the Securities and ExchangeCommission to report beneficial ownership of the Company’s common stock as of December 31, 2005. Atthat time, CRMC had sole dispositive power and sole voting power over all 1,562,650 shares reported, CIBhad sole voting power and no investment power over 636,650 shares, and SWF had no voting power and noinvestment power over 900,000 shares. CRMC has disclaimed beneficial ownership pursuant to Rule 13d-4under the Securities Exchange Act of 1934. As of June 30, 2006 CRMC filed a report on Form 13F with theSecurities and Exchange Commission to report beneficial ownership of 926,000 shares. A currentbreakdown of the investment company holdings is not provided in the Form 13F report. Beneficialownership information as of October 17, 2006 is unavailable.
3 Mr. Crivello has sole voting and investment power over 779,768 shares held in trust for the benefit ofothers. He also has sole voting and investment power over 14,780 shares held as custodian for others and100,940 shares held directly. Mr. Crivello also has the right to acquire 12,000 shares upon exercise of stockoptions.
2

ITEM NO. 1
NOMINEES FOR ELECTION AS DIRECTORS
AND SECURITY OWNERSHIP OF MANAGEMENT
Unless marked to the contrary, the Proxies received will be voted for the election of the ten nominees namedbelow to serve as Directors until the next Annual Meeting of Stockholders and until their successors are electedor appointed. In the event any nominee is unable or declines to serve as a Director at the time of the AnnualMeeting, any proxy granted to vote for such Director will be voted for a nominee designated by the presentBoard of Directors to fill such vacancy.
The nominees for election to the Board of Directors who receive a plurality the votes cast for the election ofDirectors by the shares present, in person or by proxy, shall be elected as Directors. Holders of common stock arenot entitled to cumulate their votes in the election of Directors. Withheld votes and broker non-votes (which aretreated as “withheld” votes) are not counted as votes in favor of any nominee. Since the nominees receiving themost votes will be elected as Directors, withheld votes and broker non-votes will have no effect upon theoutcome of the election.
Article III, Section 2 of the Bylaws of the Company, approved by stockholders on December 14, 1999, providesthat the authorized number of Directors of the Company shall be not less than nine nor more than twelve untilchanged by amendment of the Certificate of Incorporation or by a bylaw duly adopted by the stockholders. Theexact number of Directors is to be fixed from time to time by a bylaw or amendment thereof duly adopted by thestockholders or by the Board of Directors. The number of directors was fixed at ten by resolution of the Board ofDirectors adopted on November 3, 2005.
Director Independence
The Board of Directors has determined that each director nominee other than Garry O. Ridge is an independentdirector as defined in Rule 4200 of the Marketplace Rules of the Nasdaq Stock Market, Inc. (the “NasdaqRules”.)
3

Security Ownership of Directors and Executive Officers
The following table sets forth certain information, including beneficial ownership of the Company’s commonstock, for the ten nominees, for the executive officers named in the Summary Compensation Table on Page 13,and for all Directors and executive officers as a group.
Amount and Nature ofBeneficial Ownership
October 17, 20061
Director Nominee Age Principal OccupationDirector
Since Number Percent of Class
John C. Adams, Jr. 58 Investor; Retired Chairman and CEO, AutoZone, Inc. 2001 16,7262 *Giles H. Bateman 61 Investor 2003 11,1363 *Peter D. Bewley 60 Investor, Retired General Counsel, The Clorox Company 2005 7,8734 *Richard A. Collato 63 President & CEO, YMCA of San Diego County 2003 12,8643 *Mario L. Crivello 66 Investor 1994 907,4882,5 5.3%Linda A. Lang 48 Chairman & CEO, Jack in the Box, Inc. 2004 10,5346
Gary L. Luick 66 Principal, PointeBreak Solutions, Inc. 2000 13,7592 *Kenneth E. Olson 70 Investor; Former Chairman and CEO, Proxima Corporation 2000 16,9762 *Garry O. Ridge 50 President and CEO, WD-40 Company 1997 181,9607 1.1%Neal E. Schmale 60 Chairman of the Board, WD-40 Company; President and COO,
Sempra Energy2001 16,7262 *
* Less than one (1) percent
1 All shares owned directly unless otherwise indicated.
2 Mr. Adams, Mr. Crivello, Mr. Luick, Mr. Olson and Mr. Schmale each have the right to acquire 12,000shares upon exercise of stock options.
3 Mr. Bateman and Mr. Collato each have the right to acquire 10,000 shares upon the exercise of stockoptions.
4 Mr. Bewley has the right to acquire 6,000 shares upon the exercise of stock options.
5 Mr. Crivello has sole voting and investment power over 779,768 shares held in trust for the benefit ofothers. He also has sole voting and investment power over 14,780 shares held as custodian for others and100,940 shares held directly.
6 Ms. Lang has the right to acquire 8,000 shares upon the exercise of stock options.
7 Mr. Ridge has the right to acquire 172,000 shares upon exercise of stock options. Mr. Ridge has voting andinvestment power over 962 shares held under the Company’s 401(k) plan.
4

Amount and Nature ofBeneficial Ownership
October 17, 20061
Executive Officer Age Principal OccupationDirector
Since
Determined asof record date
NumberPercent of
Class
Michael L. Freeman 52 Division President, the Americas, WD-40 Company N/A 76,5182 *Michael J. Irwin 43 Executive Vice President, Chief Financial Officer and Treasurer, WD-
40 CompanyN/A
89,8743 *Graham P. Milner 51 Executive Vice President, Global Development, Chief Branding
Officer, WD-40 CompanyN/A
94,5884 *William B. Noble 47 Managing Director Europe, WD-40 Company Ltd. (U.K.) N/A 71,3005 *All Directors and
Executive Officersas a Group
1,528,3226 8.7%
* Less than one (1) percent.
1 All shares owned directly unless otherwise indicated.
2 Mr. Freeman has the right to acquire 66,000 shares upon exercise of stock options. Mr. Freeman has votingand investment power over 1762 shares held under the Company’s 401(k) plan.
3 Mr. Irwin has the right to acquire 84,804 shares upon exercise of stock options. Mr. Irwin has voting andinvestment power over 670 shares held under the Company’s 401(k) plan.
4 Mr. Milner has the right to acquire 86,200 shares upon exercise of stock options. Mr. Milner has voting andinvestment power over 1324 shares held under the Company’s 401(k) plan.
5 Mr. Noble has the right to acquire 70,100 shares upon exercise of stock options.
6 Total includes the rights of directors and executive officers to acquire 573,104 shares upon exercise of stockoptions and 4,718 shares held by executive officers under the Company’s 401(k) plan.
Nominees for Election as Directors
John C. Adams, Jr. was elected to the Board of Directors in 2001. Mr. Adams served as President and ChiefExecutive Officer of AutoZone, Inc. from 1996 until 1998, then serving as Chairman and Chief ExecutiveOfficer until his retirement in 2001. He previously served as President of the Miami division of Malone & Hyde,Inc., AutoZone’s former parent company from 1984 until 1990. Mr. Adams was an owner of NicotianaEnterprises, Inc., a food distribution company, from 1990 until 1995.
Giles H. Bateman was elected to the Board of Directors in 2003. Mr. Bateman was a co-founder and ChiefFinancial Officer of Price Club from 1976 until 1991. Mr. Bateman served as director and chairman ofCompUSA, Inc. from 1994 until 2000. Mr. Bateman is a director of Tuesday Morning, Inc, Lifetime Fitness Inc.,and United PanAm Finance Corp.
Peter D. Bewley was appointed to the Board of Directors on June 28, 2005. Mr. Bewley was the Senior VicePresident–General Counsel & Secretary of The Clorox Company from 1998 to 2005.
Richard A. Collato was elected to the Board of Directors in 2003. Mr. Collato is President & CEO of the YMCAof San Diego County. Mr. Collato is a director of Sempra Energy and Surge Global Energy.
Mario L. Crivello was elected to the Board of Directors in 1994. Mr. Crivello is retired, having been themanaging owner and master of Tuna Purse Seiners.
5

Linda A. Lang was elected to the Board of Directors in 2004. Ms. Lang has served as director, President andChief Operating Officer of Jack in the Box, Inc. since 2003. Ms. Lang was elected Chairman of the Board &Chief Executive Officer of Jack in the Box, Inc. as of October 2, 2005. Over the past 16 years, Ms. Lang has heldthe offices of Executive Vice President, Senior Vice President Marketing, Vice President and Regional VicePresident, Southern California Region, Vice President Marketing and Vice President of Products, Promotions andConsumer Research at Jack in the Box, Inc.
Gary L. Luick was elected to the Board of Directors in 2000. Mr. Luick is a Principal with PointeBreakSolutions, Inc., a provider of business transaction advisory services. Mr. Luick was the President and CEO ofClickgarden, Inc., an internet software company, from 2000 to 2001. He retired in 1988 from Allied Signal asDirector — Corporate Development. From 1989 through 1996 he served as President and CEO of GTI Corp., anetworking products company, and he was President and CEO of Coded Communications, a wireless networkingcompany, from 1997 to 1998.
Kenneth E. Olson was elected to the Board of Directors in 2000. Mr. Olson served as Chairman and CEO ofProxima Corporation, a digital imaging products company, from 1990 to 1998. He is a director of DigiradCorporation.
Garry O. Ridge joined WD-40 Company in 1987 as Managing Director, WD-40 Company (Australia) Pty. Limitedand he was responsible for Company operations throughout the Pacific and Asia. Mr. Ridge transferred to thecorporate office in 1994 as Director International Operations and was elected Vice President — International in1995. He was elected to the position of Executive Vice President/Chief Operating Officer in 1996 and he wasnamed President and Chief Executive Officer in 1997. He was also elected to the Board of Directors in 1997. Priorto joining WD-40 Company Mr. Ridge was Managing Director of Mermax Pacific Pty. Ltd. and held a number ofsenior management positions with Hawker Pacific Pty. Ltd. (a Hawker Siddeley PLC Group Company) which was alicensee for WD-40 until 1988.
Neal E. Schmale was elected to the Board of Directors in 2001. Mr. Schmale was named Chairman of the Boardin 2004. Mr. Schmale has served as President and COO of Sempra Energy since January 2006. Previously, hewas Executive Vice President and CFO of Sempra Energy from 1998 through 2005. Mr. Schmale is a director ofSempra Energy and Murphy Oil Corporation.
Board of Directors Meetings, Compensation and Committees
The Board of Directors is charged by the shareholders with managing the business affairs and exercising thecorporate power of the Company. The Board of Directors relies on the following standing committees to assist incarrying out the Board of Directors’ responsibilities: the Audit Committee, the Compensation Committee, theCorporate Governance Committee and the Finance Committee. Each of the committees has a written charterapproved by the Board of Directors and such charters are available on WD-40 Company’s Investor Relationsweb site at www.wd40.com under the “Officers & Directors” section. There were four scheduled meetings of theBoard of Directors during the last fiscal year. All directors serving for the full fiscal year attended at least 75percent of the aggregate of the total number of meetings of the Board and of all committees on which the directorserved.
Board of Directors Compensation
Effective as of the annual meeting of stockholders, each non-employee director will be entitled to receive anannual fee of $32,000 for services provided from the date of the Company’s annual meeting to the next annualmeeting. For the current year, the annual fee was $30,000. The annual fee is payable in March. The Chairman ofthe Board receives an additional annual fee of $14,000. Non-employee directors receive additional cashcompensation for service on committees. The Chairman of the Audit Committee receives $16,000 and each othermember of the Audit Committee receives $8,000. Each Chairman of the Compensation Committee, the Corporate
6
Governance Committee and the Finance Committee receives $8,000 and each other member of those committeesreceives $4,000. For service during the next year, non-employee directors will also receive non-qualified stockoptions to purchase 3,800 shares of the Company’s common stock. For the current year, the non-employeedirectors received stock options to purchase 3,500 shares. The options are granted on the date of the Company’sannual meeting pursuant to the Company’s 1990 Incentive Stock Option Plan. The stock options are immediatelyexercisable with a termination date ten years from the grant date. The exercise price for options granted to thedirectors is equal to the closing price of the Company’s shares as of the day of the annual meeting.
The Company maintains a Non-Employee Director Restricted Stock Plan providing for the issuance of shares ofrestricted common stock of the Company to each non-employee member of the Board of Directors. Shares areissued in lieu of cash compensation according to an election to be made by the director prior to November 30thof the year prior to the year of service. A director who holds shares of the Company having a value of at least$50,000 may elect to receive the entire annual director’s fee in cash. Otherwise, directors receive restricted stockin lieu of $5,500 of cash compensation and they may elect to receive restricted stock in lieu of the balance oftheir annual fee in increments of $5,500. The restricted shares are to be issued in accordance with a director’selection as soon as practicable after the first day of March. The number of shares to be issued is equal to theamount of compensation to be paid in shares divided by 90% of the closing price of the Company’s shares as ofthe first business day of March.
Restricted shares issued to a director do not become vested for resale for a period of five years or until thedirector’s retirement from the Board following the director’s 65th birthday. Unless a director has reached age 65,the shares are subject to forfeiture if, during the five year vesting period, the director resigns from service as adirector.
The Company maintains a Director Contributions Fund from which each incumbent director has the right, at aspecified time each fiscal year, to designate $6,000 in charitable contributions to be made by the Company toproperly qualified (under Internal Revenue Code Section 501(c)(3)) charitable organizations.
Stockholder Communications with Board of Directors
Stockholders may send communications to the Board of Directors by submitting a letter addressed to: WD-40Company, Corporate Secretary, 1061 Cudahy Place, San Diego, CA 92110.
The Board of Directors has instructed the Corporate Secretary to forward such communications to the chairmanof the Board of Directors. The Board of Directors has also instructed the Corporate Secretary to review suchcorrespondence and, at the Corporate Secretary’s discretion, to not forward correspondence which is deemed of acommercial or frivolous nature or inappropriate for Board of Director consideration. The Corporate Secretarymay also forward the stockholder communication within the Company to another department to facilitate anappropriate response.
7
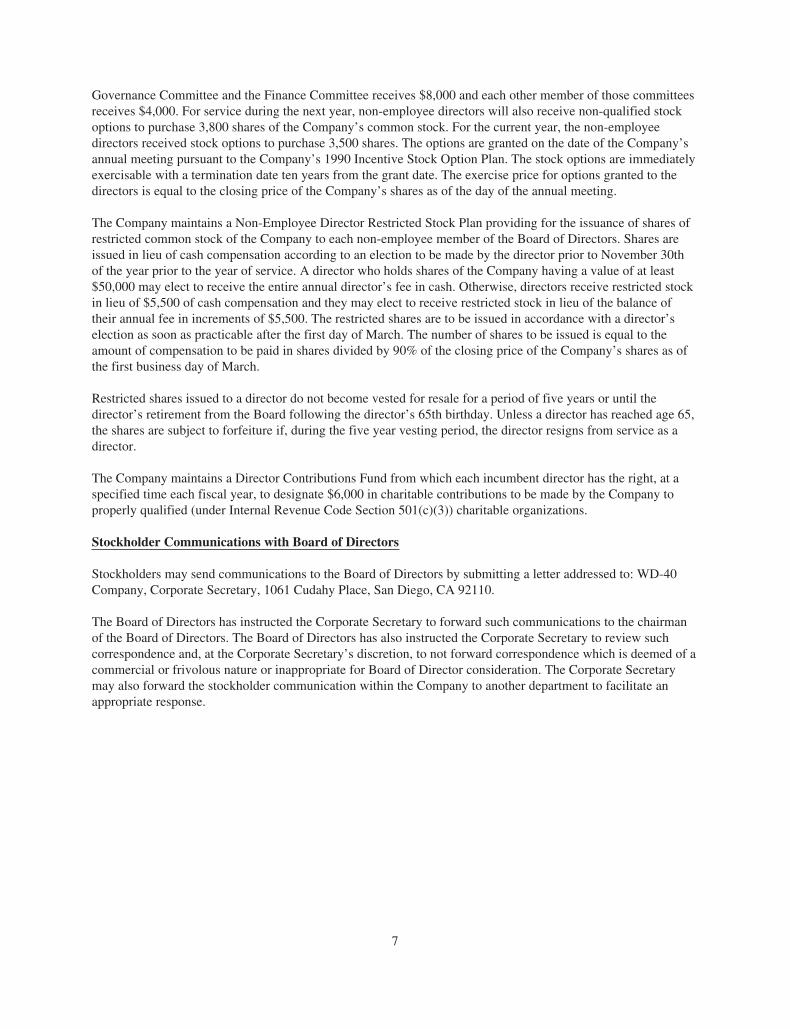
Committees
Director Audit Compensation Governance Finance
John C. Adams, Jr. Chairman ✓
Giles H. Bateman Chairman ✓
Peter D. Bewley Chairman ✓
Richard A. Collato ✓ ✓
Mario L. Crivello ✓
Linda A. Lang ✓ Chairman
Gary L. Luick ✓ ✓
Kenneth E. Olson ✓ ✓
Garry O. Ridge
Neal E. Schmale ✓
Number of Meetings Held in Fiscal Year 2006 5 4 4 3
Corporate Governance Committee
The Corporate Governance Committee is comprised of Peter D. Bewley (Chairman), John C. Adams, Jr.,Kenneth E. Olson and Neal E. Schmale. The Corporate Governance Committee also functions as the Company’snominating committee and is comprised exclusively of independent directors as defined in the Nasdaq Rules. TheCorporate Governance Committee met four times during the last fiscal year.
The Corporate Governance Committee acts in conjunction with the Board of Directors to ensure that a regularevaluation is conducted of succession plans, performance, independence, and of the qualifications and integrityof the Board of Directors. The Corporate Governance Committee also reviews the applicable skills andcharacteristics required of nominees for election as directors. The objective is to balance the composition of theBoard of Directors to achieve a combination of individuals of different backgrounds and experiences. Inevaluating the suitability of nominees, the Corporate Governance Committee takes into account many factors,including the following: whether the candidate is currently or has recently been an executive officer at a publiclytraded company; whether the candidate has substantial background in matters related to the Company’s productsor markets, in particular, supply chain management, information technology and marketing; and whether thecandidate has substantial international business experience, a substantial financial background or is serving as adirector at one or more publicly traded companies.
In determining whether to recommend a director for re-election, the Corporate Governance Committee considersthe director’s past attendance at meetings, results of annual evaluations and the director’s participation in andanticipated future contributions to the Board of Directors. A director who will have reached the age of 72 prior tothe date of the next annual meeting of stockholders will not be recommended for re-election at that meeting.
The Corporate Governance Committee reviews new Board of Director nominees through a series of internaldiscussions, reviewing available information, and interviewing selected candidates. Generally, candidates fornomination to the Board of Directors have been suggested by directors or employees. The Company does notcurrently employ a search firm or third party in connection with seeking or evaluating candidates.
The Corporate Governance Committee will consider director candidates recommended by security holders underthe same criteria as other candidates described above. Nominations may be submitted by letter addressed to:WD-40 Company Corporate Governance Committee, Corporate Secretary, 1061 Cudahy Place, San Diego, CA92110.
8

Compensation Committee
Compensation Committee Interlocks and Insider Participation
The Compensation Committee is comprised of John C. Adams, Jr. (Chairman), Mario L. Crivello, Richard A.Collato, Linda A. Lang and Gary L. Luick all of whom are independent directors as defined under the NasdaqRules. The Compensation Committee met four times during the last fiscal year.
The function of the Compensation Committee is to provide guidance to the Board of Directors and oversight forall executive compensation and benefit programs. The Committee provides recommendations for base salary andincentive compensation awards for the CEO and executive officers. The Compensation Committee also serves asthe Stock Option Committee with authority to grant options and administer the Company’s Incentive StockOption Plan. The Compensation Committee Report on Executive Compensation appears on page 17 below.
Audit Committee
The Audit Committee is comprised of Giles H. Bateman (Chairman), Gary L. Luick, Kenneth E. Olson, andRichard A. Collato. Five meetings were held during the last fiscal year to review quarterly financial reports, toconsider the annual audit and other audit services and to review the audit with the independent auditors after itscompletion. The Board of Directors has determined that Mr. Bateman is an “audit committee financial expert” asdefined by regulations adopted by the Securities and Exchange Commission. Mr. Bateman and each of the othermembers of the Audit Committee is an independent director as defined in the Nasdaq Rules. The AuditCommittee also has responsibility for the selection, appointment and oversight of independent accountants forthe Company. A separate report of the Audit Committee is set forth below.
9

AUDIT COMMITTEE REPORT
Each year the Board of Directors appoints an Audit Committee to fulfill regulatory requirements and to assist theBoard in oversight of the Company’s financial reporting, internal control functions and audit process. Eachmember of the Audit Committee meets the independence requirements set by the Nasdaq Stock Market.
The responsibilities of the Audit Committee include the selection and appointment of a independent registeredpublic accounting firm to be hired as the Company’s independent accountants. The Audit Committee is alsoresponsible for recommending to the Board that the Company’s consolidated financial statements be included inits annual report on Form 10-K.
With respect to the preparation and audit of the Company’s consolidated financial statements, management isresponsible for the preparation of the financial statements; the establishment of accounting and financialreporting principles; the establishment of disclosure controls and procedures; the establishment of internalcontrol over financial reporting; the evaluation of the effectiveness of both disclosure controls and proceduresand internal control over financial reporting; and the evaluation of changes in internal control over financialreporting that have materially affected, or are reasonably likely to materially affect, internal control overfinancial reporting. The Company’s independent registered public accountants are responsible for performing anindependent audit of the consolidated financial statements; expressing an opinion as to whether the consolidatedfinancial statements have been prepared in accordance with accounting principles generally accepted in theUnited States of America; and expressing an opinion on both management’s assessment of the effectiveness ofinternal control over financial reporting and specifically as to the effectiveness of the Company’s internal controlover financial reporting.
The Audit Committee has reviewed the consolidated financial statements of the Company for the fiscal yearended August 31, 2006. The Audit Committee has discussed the preparation of the consolidated financialstatements with management and with the Company’s independent registered public accounting firm,PricewaterhouseCoopers LLP, and the Audit Committee has met separately with PricewaterhouseCoopers LLPand with management to discuss issues relating to the preparation and audit of the financial statements.
For the fiscal year ended August 31, 2006, management has completed the documentation, testing and evaluationof the Company’s system of internal control over financial reporting as required by Section 404 of the Sarbanes-Oxley Act of 2002. The Audit Committee has been kept apprised of management’s activities in the completion ofsuch work and evaluation and the Audit Committee has provided oversight and advice with respect to the processundertaken by management. The Audit Committee will continue to oversee such work being undertaken by theCompany for the fiscal year ending August 31, 2007.
The Audit Committee has taken the following steps in making its recommendation that the Company’s financialstatements be included in its annual report on Form 10-K for the fiscal year ended August 31, 2006:
1. At regularly scheduled meetings of the Audit Committee, management and PricewaterhouseCoopersLLP provided periodic reports as to the work undertaken by the Company to complete thedocumentation, testing and evaluation of the Company’s system of internal control over financialreporting. Upon completion of such work and upon preparation of the Company’s consolidatedfinancial statements for the year ended August 31, 2006, the Audit Committee reviewed a reportprovided by management on the effectiveness of the Company’s internal control over financialreporting.
2. The Audit Committee discussed with PricewaterhouseCoopers LLP, the Company’s independentregistered public accounting firm for fiscal year ended August 31, 2006, those matters required to bediscussed by Statement on Auditing Standards No. 61 and PCAOB Auditing Standard No. 2, includinginformation concerning the scope and results of the audit. These communications and discussions areintended to assist the Audit Committee in overseeing the financial reporting and disclosure process.
10

3. The Audit Committee discussed with PricewaterhouseCoopers LLP its independence and receivedfrom PricewaterhouseCoopers LLP a letter concerning independence as required under applicableindependence standards for auditors of public companies. This discussion and disclosure helped theAudit Committee in evaluating such independence.
4. The Audit Committee reviewed and discussed with the Company’s management andPricewaterhouseCoopers LLP, the Company’s audited consolidated balance sheet at August 31, 2006,and consolidated statements of income, cash flows and stockholders’ equity for the fiscal year endedAugust 31, 2006.
5. The Audit Committee has reviewed PricewaterhouseCoopers LLP’s Report of Independent RegisteredPublic Accounting Firm and Management’s Report on Internal Control over Financial Reportingincluded in the Company’s annual report on Form 10-K.
Based on the reviews and discussions explained above, the Audit Committee recommended to the Board that theCompany’s financial statements be included in its annual report on Form 10-K for its fiscal year endedAugust 31, 2006. PricewaterhouseCoopers LLP has been selected to serve as the Company’s independentauditors for the fiscal year ending August 31, 2007.
Giles H. Bateman (Chairman)Richard A. Collato
Gary L. LuickKenneth E. Olson
Finance Committee
The Finance Committee is comprised of Linda A. Lang (Chairman), Giles H. Bateman and Peter D. Bewley.Three meetings of the Finance Committee were held during the last fiscal year. The Finance Committee isappointed by the Board for the primary purpose of assisting the Board in overseeing financial matters ofimportance to the company, including matters relating to acquisitions, investment policy, capital structure, anddividend policy. The Finance Committee also reviews the Company’s annual and long-term financial strategiesand objectives.
Section 16(a) Beneficial Ownership Reporting Compliance
Section 16(a) of the Securities Exchange Act of 1934 requires the Company’s directors and executive officers,and persons who own more than ten percent of the Company’s stock, to file with the Securities ExchangeCommission initial reports of stock ownership and reports of changes in stock ownership. Reporting persons arerequired by SEC regulation to furnish the Company with copies of all Section 16(a) reports they file.
To the Company’s knowledge, based solely on review of the copies of such reports furnished to the Companyduring the last fiscal year and written representations that no other reports were required, all Section 16(a)requirements were complied with by all persons required to report with respect to the Company’s stock duringthe last fiscal year.
11
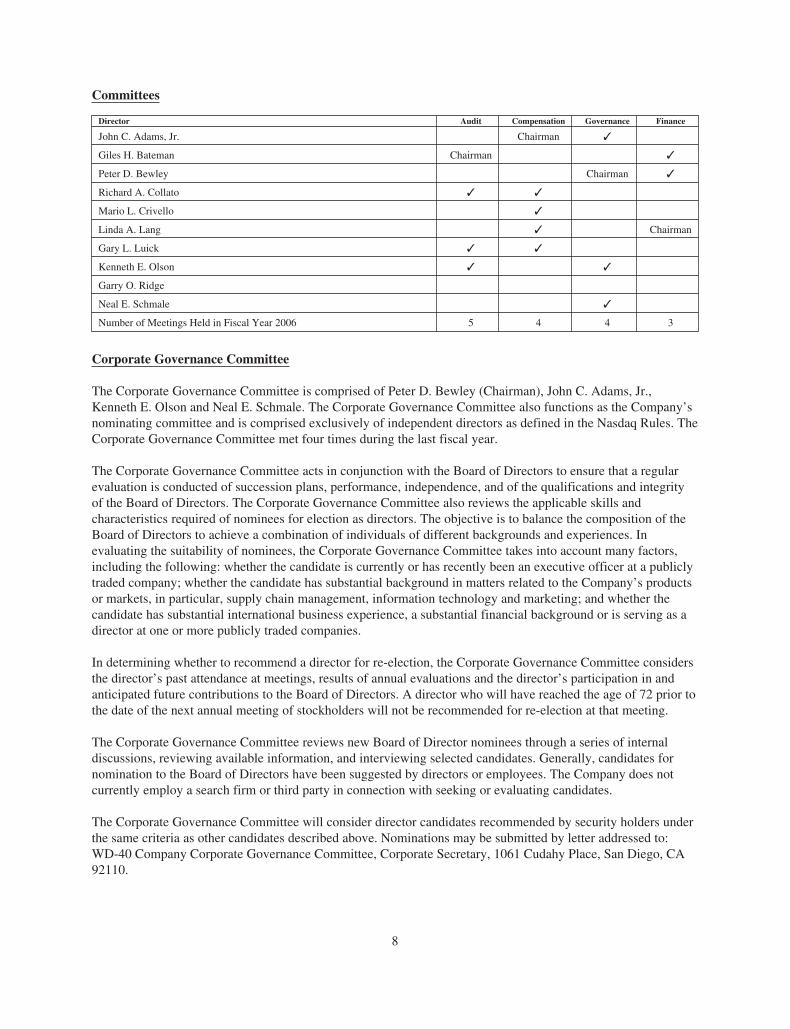
EXECUTIVE COMPENSATION
The following table shows information for the three (3) fiscal years ended August 31, 2006 concerning theCompany’s Chief Executive Officer (“CEO”) and the four most highly compensated executive officers other thanthe CEO.
Summary Compensation Table1
AnnualCompensation
Long TermCompensation
AwardsAll Other
Compensation2
Name and Principal PositionFiscal Year
Ended Aug. 31 Salary ($) Bonus ($) Stock Options (#) ($)
Garry O. Ridge 2006 $510,000 $319,400 24,000 $36,1003
President and ChiefExecutive Officer
2005 484,000 $ 93,000 12,000 34,7002004 484,000 0 30,000 33,900
Michael J. Irwin 2006 $251,000 $ 94,300 9,000 $36,1003
Executive Vice Presidentand Chief Financial Officer
2005 239,000 27,500 9,000 34,7002004 234,400 0 10,000 33,900
Graham P. Milner 2006 $227,100 $ 87,700 9,000 $36,10016
Executive Vice President,Global Development andChief Branding Officer
2005 216,200 20,000 8,000 34,7002004 212,000 0 10,000 33,900
Michael L. Freeman 2006 $242,600 $ 93,700 9,000 $36,10016
Division President, theAmericas
2005 228,900 20,600 5,000 34,7002004 228,900 0 10,000 33,900
William B. Noble4 2006 $307,000 $118,200 9,000 $59,6005
Managing Director EuropeWD-40 Company (UK) Ltd.
2005 288,700 29,700 10,000 58,0002004 269,900 94,200 10,000 54,200
1 No information for Other Annual Compensation, Restricted Stock Awards or Long Term Incentive Payoutshas been provided because there was no such reportable compensation awarded to, earned by or paid to theindividuals named. All compensation amounts have been rounded to the nearest $100.
2 “All other Compensation” includes employer contributions to the Company’s qualified retirement plans.
3 Includes $32,500 in contributions to the Company’s Profit Sharing/401(k) Plan and $3,600 in matchingcontributions to the Company’s Profit Sharing/401(k) plan.
4 Mr. Noble is employed by the Company’s UK subsidiary. Compensation amounts have been converted toU.S. Dollars at average annual exchange rates for each year.
5 Retirement contribution for Mr. Noble under the retirement plan maintained by the Company’s UKsubsidiary.
12

Stock Options
The following table sets forth stock options granted pursuant to the Restated WD-40 Company 1990 IncentiveStock Option Plan during the last fiscal year to each of the Company’s executive officers named in the SummaryCompensation Table above.
Option Grants in Last Fiscal Year
NameOptions
Granted (#)
Percent of TotalOptions Granted to
Employees inFiscal Year 20061
Exercise Price($/sh)
ExpirationDate
GrantDate
Value2
Garry O. Ridge3 24,000 11.14% $27.27 10/18/2015 $132,960Michael J. Irwin4 9,000 4.18% $27.27 10/18/2015 $ 49,860Graham P. Milner5 9,000 4.18% $27.27 10/18/2015 $ 49,860Michael L. Freeman6 9,000 4.18% $27.27 10/18/2015 $ 49,860William B. Noble7 9,000 4.18% $27.27 10/18/2015 $ 49,860
The options may be exercised for cash or in lieu of cash, an option holder may tender shares of the Company’scommon stock previously held by the option holder. In permitting the exchange of stock upon exercise ofoptions, the 1990 Incentive Stock Option Plan restricts the exercise of options with previously owned stock toshares held for a minimum of six months.
1 The total number of options granted to employees in fiscal year 2006 was 215,500.
2 The Grant Date Value of $5.54 per share has been determined as of October 18, 2005 using the Black-Scholes Option Valuation model. The following assumptions were used in determining the value: (i) adividend yield of 3.23%; (ii) expected volatility of 0.2511; (iii) a 4.77-year risk-free interest rate of 4.32%;and (iv) an expected option term/life of 4.77 years.
3 Mr. Ridge’s options are non-qualified stock options with 8,160 shares exercisable on October 18, 2006;7,920 shares exercisable on October 18, 2007; and 7,920 shares exercisable on October 18, 2008.
4 Mr. Irwin’s options are non-qualified stock options with 3,060 shares exercisable October 18, 2006; 2,970shares exercisable October 18, 2007; and 2,970 shares exercisable October 18, 2008.
5 Mr. Milner’s options are non-qualified stock options with 3,060 shares exercisable October 18, 2006; 2,970shares exercisable October 18, 2007; and 2,970 shares exercisable October 18, 2008.
6 Mr. Freeman’s options are non-qualified stock options with 3,060 shares exercisable October 18, 2006;2,970 shares exercisable October 18,2007; and 2,970 shares exercisable October 18, 2008.
7 Mr. Noble’s options are non-qualified stock options with 3,060 shares exercisable October 18, 2006; 2,970shares exercisable October 18, 2007; and 2,970 shares exercisable October 18, 2008.
13

The following table sets forth the number of shares acquired on exercise of stock options in the Company’s lastfiscal year, the aggregate dollar value realized on exercise of such options and the number and dollar value ofunexercised options as of August 31, 2006 for the Company’s executive officers named in the SummaryCompensation Table above.
Aggregated Option Exercises in Last Fiscal Year andFiscal Year End Option Values
Name
SharesAcquired on
Exercise
ValueRealized
($)
Number of UnexercisedOptions at August 31, 2006
(#)
Value of UnexercisedIn-The-Money Options at
August 31, 20061
Exercisable Unexercisable Exercisable Unexercisable
Garry O. Ridge 20,000 $239,000 152,200 19,800 $998,300 $146,520Michael J. Irwin 2,400 $ 17,330 75,894 8,910 $801,547 $ 65,459Graham P. Milner 5,000 $ 35,899 77,620 8,580 $767,576 $ 63,122Michael L. Freeman 25,000 $219,543 67,100 14,900 $513,629 $ 56,133William B. Noble 5,000 $ 54,235 60,760 9,340 $536,280 $ 69,195
Supplemental Death and Retirement Benefit Plans
The Company maintains Supplemental Death Benefit Plans for certain key employees. Under the Death BenefitPlan agreements, a participating employee’s designated beneficiary or the employee’s estate will receive a deathbenefit equal to the employee’s then current base salary in the event of death prior to retirement from theCompany. No death benefit is payable if retirement benefits become due upon the employee’s retirement underthe Retirement Benefit Plan agreement.
The Company also maintains Supplemental Retirement Benefit Plans for certain key employees. Under theRetirement Benefit Plan agreements, participating employees will receive retirement benefits in the event of theparticipant’s retirement on or after a designated retirement date. The annual retirement benefit for participatingemployees will be equal to twenty-five percent (25%) of the employee’s then current base salary, payable inquarterly installments over a period of fifteen years.
All benefits under the plans will be subject to payroll taxes and required withholding for state and federal incometaxes as deferred compensation. The benefits are funded by key man life insurance policies purchased and ownedby the Company. The Board of Directors determines which key employees will participate in the plans and theamount of benefits payable for each participant. Non-employee directors do not participate in the plans.
Based upon current (2007) base salaries, the death benefits and annual retirement benefits to be provided underthe plans to the executive officers named in the Summary Compensation Table above are set forth below. Theretirement benefit will not be payable unless the executive officer retires with the Company on or after reachingthe specified retirement age. In such event, the actual amount of the annual benefit will be dependent upon theexecutive’s then current annual salary.
NameDeath
Benefit
AnnualRetirement
BenefitRetirement
Age
Garry O. Ridge $535,500 $133,875 65Michael J. Irwin $266,500 $ 66,625 65Graham P. Milner $238,700 $ 59,675 65Michael L. Freeman $266,500 $ 66,625 65William B. Noble — $ 80,299 65
Change of Control Severance Agreements
On February 14, 2006, the Company terminated pre-existing employment agreements with the executive officersnamed in the Summary Compensation Table above. Each executive officer serves in office at the pleasure of the
14

Board of Directors. On February 14, 2006, the Company entered into Change of Control Severance Agreements(“Severance Agreements”) with each of the named executive officers and with one additional executive officer.The new Severance Agreements provide that each executive officer will receive certain severance benefits if heis terminated without “Cause” or resigns for “Good Reason”, as those terms are defined in the SeveranceAgreements, within two years after a “Change of Control” as defined in the Severance Agreements andsummarized below. If the executive officer’s employment is terminated during the aforementioned two-yearperiod by the Company without Cause or by the executive officer for Good Reason, the executive officer will beentitled to a lump sum payment (subject to limits provided by reference to Section 280G of the Internal RevenueCode which limits the deductibility of certain payments to executives upon a change in control) of twice theexecutive officer’s salary, calculated based on the greater of the executive officer’s then current annual salary ora 5-year average, plus twice the executive officer’s bonus compensation, calculated based on the greater of themost recent annual bonus compensation or a 5-year average. Further, any of the executive officer’s stock optionsand other equity incentive benefits that are not then fully vested will be accelerated and vested in full followingsuch termination of employment within such two-year period and the executive officer will be entitled tocontinuation of health and welfare benefits under the Company’s then existing benefit plans or equivalentbenefits. No employment rights or benefits other than the change of control severance benefits are provided bythe Severance Agreements.
For purposes of the Severance Agreements and subject to the express provisions and limitations containedtherein, Change of Control means a transaction or series of transactions by which a person or persons actingtogether acquire more than 30% of the Company’s outstanding shares; a change in a majority of the incumbentmembers of the Company’s board of directors as specified in the Severance Agreements, a reorganization,merger or consolidation as specified in the Severance Agreements or a sale of substantially all of the assets orcomplete liquidation of the Company. As specified more particularly in the Severance Agreements, Change ofControl does not include a reorganization, merger or consolidation or a sale or liquidation where a majority ofincumbent members of the board of directors continue in office and more than 60% of the Company’spre-transaction shareholders continue to maintain control of the resulting or successor company.
The Severance Agreements have a term of two years, subject to automatic renewal for successive two yearperiods unless notice of non-renewal is provided by the Company’s board of directors not less than six monthsprior to the end of the current term. The term of the Severance Agreements will be automatically extended for aterm of two years following any Change of Control.
15

COMPENSATION COMMITTEE REPORT ON EXECUTIVE COMPENSATION
Role and Membership of the Compensation Committee
The Compensation Committee of the Board (the “Committee”) is responsible for setting and administering thepolicies that govern executive compensation and the stock ownership programs for employees of the Company.The Committee also serves as the Stock Option Committee under the Company’s 1990 Incentive Stock OptionPlan. The Committee operates pursuant to a charter that further outlines the specific authority, duties andresponsibilities of the Committee. The charter is periodically reviewed and revised by the Committee and theBoard and is available on the Company’s website at www.wd40.com under the “Officers & Directors” section.
During the fiscal year ended August 31, 2006, the Compensation Committee was comprised of John C. Adams,Jr. (Chairman), Mario L. Crivello, Richard A. Collato, Linda A. Lang and Gary L. Luick. None of the Committeemembers is currently or has been at any time an officer or an employee of WD-40 Company. The Committeemeets at scheduled times during the year and holds additional meetings from time to time to review and discussexecutive compensation issues. The Committee may also consider and take action by written consent. TheCommittee met four times during fiscal year 2006.
The Company’s Human Resources Department supports the Compensation Committee in its work and in somecases acts pursuant to delegated authority to fulfill various functions in administering the Company’scompensation programs. The Committee has the authority to engage the services of outside advisers, experts andothers to assist the Committee with its responsibilities. In accordance with this authority, the Committee directlyengages Compensia, Inc. as independent outside compensation consultant to advise the Committee oncompensation practices and policies relating to the executive officers. The independent consulting firm does notadvise management of the Company, and receives no other compensation from the Company.
Executive Compensation Philosophy
WD-40 Company’s executive compensation program is designed to achieve four primary objectives:
• Attract and retain executive officers capable of leading WD-40 Company to the fulfillment of itsbusiness objectives.
• Offer competitive compensation opportunities that reward individual contributions and the achievementof key corporate milestones.
• Align the interests of executive officers and stockholders through long-term equity compensation.
• Ensure that total compensation is commensurate with the performance and value created forstockholders.
The main components used to support these objectives are base salary, performance incentive, pension/profitsharing and equity compensation (each of which is discussed in detail below). For each of these elements of pay,the Company’s strategy is to examine peer group compensation practices and deliver pay in the 25th to 75thpercentile of the peer group with an overarching goal of ensuring an appropriate pay-for-performance alignment.
Peer Group
The peer group the Committee examines to assess the competitiveness of the Company’s executive compensationincludes consumer products companies that are in a comparable range with respect to several metrics, principallybusiness strategy, market capitalization, and revenues. The peer group may include some or all of the companiesthat are included in the market indices in the graph included under “Stock Performance Graph” in this ProxyStatement, labor market competitors and other companies regarded as having executive compensation bestpractices.
16
The peer group is reviewed annually by the Committee and adjustments are made as necessary to ensure thegroup continues to properly reflect the market in which the Company competes for talent. The Committee alsoreviews annually the executive pay practices and levels of other similarly sized companies as reported in industrysurveys and reports from compensation consulting firms. This information is considered when makingrecommendations for each element of compensation.
Components of Executive Compensation Program
Base Salary
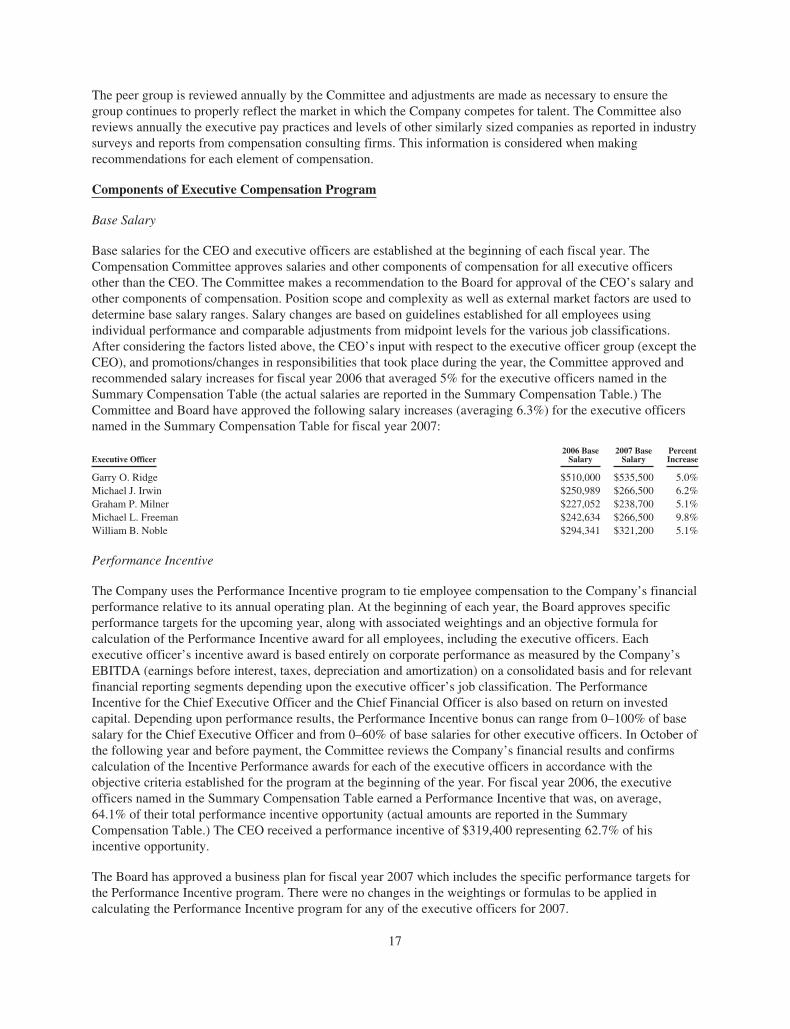
Base salaries for the CEO and executive officers are established at the beginning of each fiscal year. TheCompensation Committee approves salaries and other components of compensation for all executive officersother than the CEO. The Committee makes a recommendation to the Board for approval of the CEO’s salary andother components of compensation. Position scope and complexity as well as external market factors are used todetermine base salary ranges. Salary changes are based on guidelines established for all employees usingindividual performance and comparable adjustments from midpoint levels for the various job classifications.After considering the factors listed above, the CEO’s input with respect to the executive officer group (except theCEO), and promotions/changes in responsibilities that took place during the year, the Committee approved andrecommended salary increases for fiscal year 2006 that averaged 5% for the executive officers named in theSummary Compensation Table (the actual salaries are reported in the Summary Compensation Table.) TheCommittee and Board have approved the following salary increases (averaging 6.3%) for the executive officersnamed in the Summary Compensation Table for fiscal year 2007:
Executive Officer2006 Base
Salary2007 Base
SalaryPercentIncrease
Garry O. Ridge $510,000 $535,500 5.0%Michael J. Irwin $250,989 $266,500 6.2%Graham P. Milner $227,052 $238,700 5.1%Michael L. Freeman $242,634 $266,500 9.8%William B. Noble $294,341 $321,200 5.1%
Performance Incentive
The Company uses the Performance Incentive program to tie employee compensation to the Company’s financialperformance relative to its annual operating plan. At the beginning of each year, the Board approves specificperformance targets for the upcoming year, along with associated weightings and an objective formula forcalculation of the Performance Incentive award for all employees, including the executive officers. Eachexecutive officer’s incentive award is based entirely on corporate performance as measured by the Company’sEBITDA (earnings before interest, taxes, depreciation and amortization) on a consolidated basis and for relevantfinancial reporting segments depending upon the executive officer’s job classification. The PerformanceIncentive for the Chief Executive Officer and the Chief Financial Officer is also based on return on investedcapital. Depending upon performance results, the Performance Incentive bonus can range from 0–100% of basesalary for the Chief Executive Officer and from 0–60% of base salaries for other executive officers. In October ofthe following year and before payment, the Committee reviews the Company’s financial results and confirmscalculation of the Incentive Performance awards for each of the executive officers in accordance with theobjective criteria established for the program at the beginning of the year. For fiscal year 2006, the executiveofficers named in the Summary Compensation Table earned a Performance Incentive that was, on average,64.1% of their total performance incentive opportunity (actual amounts are reported in the SummaryCompensation Table.) The CEO received a performance incentive of $319,400 representing 62.7% of hisincentive opportunity.
The Board has approved a business plan for fiscal year 2007 which includes the specific performance targets forthe Performance Incentive program. There were no changes in the weightings or formulas to be applied incalculating the Performance Incentive program for any of the executive officers for 2007.
17

Pension and Profit Sharing Plans
Since 1963 the Company has maintained tax qualified Pension and Profit Sharing Plans for the benefit of all fulltime employees, including executive officers. The Company’s present WD-40 Company Profit Sharing/401(k)Plan provides for mandatory employer contributions for participating employees equal to 10% of their coveredcompensation and permits discretionary employer contributions up to 5% of their covered compensation. ThePlan also allows employees, with 401(k) tax treatment, to defer up to the allowable IRS limits for each calendaryear and provides a matching contribution equal to one-half of such amounts deferred, up to a maximum of 3.3%of their covered compensation. In calendar year 2006, covered compensation includes all salary and bonuscompensation up to $220,000 and the maximum amount permitted to be contributed to the Plan for an employee,including 401(k) deferrals and employer matching contributions, is $44,000. The Plan serves to provideCompany employees with tax-advantaged retirement savings as an additional component of overallcompensation. The Company’s contributions to the Plan may be invested by employees in a Company StockFund invested in shares of the Company’s common stock.
Equity Compensation
Equity compensation is a critical component to the Company’s efforts to attract and retain executives and keyemployees, encourage employee ownership in the Company, link pay with performance and align the interests ofexecutive officers with those of stockholders. The Company provides executive officers with a substantialeconomic interest in the long-term appreciation of the Company’s common stock through the grant of stockoptions at the beginning of each fiscal year, subject to vesting restrictions. Stock options provide value only if theCompany’s stock price increases (which benefits all stockholders), and only if the executive or employee remainswith the Company until his or her options vest. The Company’s standard practice is to grant options that vestover a three-year period.
The Company is sensitive to the concerns of its stockholders regarding the dilutive impact of stock options.Accordingly, the Company has designed its option grant practices to reflect an appropriate balance betweenstockholders’ dilution concerns and the Company’s need to remain competitive by recruiting and retaining high-performing employees.
• All of the Company’s equity plans have been approved by stockholders.
• The Company’s aggregate stock granting practices are conservative. For fiscal year 2006, the Boardgranted options to purchase a total of 215,500 shares to 64 Company employees, including the CEO andexecutive officers who, as a group, received 69,000 of the total options granted. The options weregranted on October 18, 2005 with an exercise price of $27.27 per share.
• The guidelines for equity grants are structured in consideration of peer group practice with respect to theeconomic value of equity compensation provided, but also taking company performance against theCompany’s internal business plan and compared to the peer group into account.
• Equity grants to individual executive officers are generally based on Company/individual performancein the preceding year, but also on the expected future contribution and long-term retention of theexecutive officer.
Due to changes in equity accounting regulations and the related shift in equity compensation practices, theCompensation Committee asked management to conduct a comprehensive review of the Company’s executiveand broader employee equity program in 2005 and 2006. The purpose of this review was to determine if thecurrent stock option program: i) supports the Company’s executive/employee attraction and retention initiatives;ii) provides the appropriate incentive to executives and employees to create long-term stockholder value; and iii)serves the best interests of the Company’s stockholders. At this time, the Committee believes that stock optionspriced at the full fair market value of the Company’s common stock on the date of grant best achieve theobjectives stated above. However, the Committee believes that it will be prudent to consider other forms ofequity compensation if business conditions and/or competitive practice change.
18

For fiscal year 2007, the Committee approved the following stock option grants to the executive officers namedin the Summary Compensation Table:
Executive Officer2007 Stock Option
Grant
Garry O. Ridge 35,000Michael J. Irwin 10,000Graham P. Milner 10,000Michael L. Freeman 10,000William B. Noble 10,000
The options were granted on October 17, 2006 with an exercise price of $35.99 per share.
Benefits and Perquisites
The benefits and perquisites offered to the Company’s executive officers are substantially the same as thoseoffered to all employees. The Company provides medical and other benefits to executives that are generallyavailable to other employees, as well as a company car, laptop computer and cellular telephone. Frequent flyermileage is available to employees for personal use and for upgrades from coach or business class as provided forbusiness travel according to the Company’s travel policies. The Company maintains Supplemental Death andRetirement Plans for certain key employees including all of the executive officers named in the SummaryCompensation Table. The plans are described in greater detail under the Executive Compensation section of thisProxy Statement.
Compliance with Internal Revenue Code Section 162(m)
Section 162(m) of the Internal Revenue Code (the “Code”) generally provides that publicly held companies maynot deduct compensation paid to certain of its top executive officers to the extent that such compensation exceeds$1 million per officer in a calendar year. Compensation that is “performance-based compensation” within themeaning of the Code does not count toward the $1 million limit. The Compensation Committee has determinedthat ordinary income recognized by the Company’s executive officers as a result of their exercise of stockoptions granted by the Board under the Company’s 1990 Incentive Stock Option Plan having an exercise price atleast equal to the fair market value of the Company’s common stock on the date of grant, qualifies asperformance-based compensation as defined under Section 162(m) of the Code. The Company expects thatamounts of compensation paid to each of its executive officers in 2006 will not exceed the $1 million limit underSection 162(m) of the Code. The Committee believes it is in the best interests of the Company to have executiveofficer compensation be fully deductible under Section 162(m). However, the Committee and Board neverthelessretain the discretion to provide compensation that potentially may not be fully deductible to reward performanceand/or enhance retention.
Conclusion
The Compensation Committee believes that the Company’s compensation program is consistent with itsphilosophy and goals for success. Furthermore, the executive officer compensation program is responsible toshareholder interests as evidenced by the Company’s less than 50th percentile overall compensation marketposition compared to above 60th percentile performance for fiscal year 2006 relative to peers in key measures ofrevenue growth, operating income growth, EBITDA growth, and growth in market capitalization.
John C. Adams, Jr. (Chairman)Richard A. CollatoMario L. Crivello
Linda A. LangGary L. Luick
19

STOCK PERFORMANCE GRAPH
The following graph compares the cumulative total stockholder return on the Company’s Common Shares withthe cumulative total return of a Peer Group of consumer product companies, the Standard & Poor’s 500Composite Stock Index (“S & P 500”), the Standard & Poor’s Small Cap 600 Composite Stock Index (“S & P600”) and the Russell 2000 Composite Stock Index (“Russell 2000”) for the five fiscal years ending August 31,2006. The comparison assumes $100 invested on August 31, 2001 in the Company’s Common Shares and ineach of the indices.
COMPARISON OF FIVE-YEAR CUMULATIVE RETURNS
WD-40 Company, a Peer Group and the S&P 500 Index, S & P Small Cap 600 Index, Russell 2000 Index.
50.00
100.00
150.00
200.00
2001 2002 2003 2004 2005 2006
WD-40 COMPANYS & P 500S & P SMALLCAP 600RUSSELL 2000PEER GROUP
Year ended August 31
2001 2002 2003 2004 2005 2006
WD-40 Company 100.00 131.63 150.13 151.03 156.91 194.83S & P 500 100.00 82.01 91.90 102.43 115.29 125.53S & P Small Cap 600 100.00 90.47 111.00 127.50 161.28 172.77Russell 2000 100.00 84.56 109.15 121.55 149.62 163.63Peer Group 100.00 121.88 127.20 140.48 153.01 165.38
The Peer Group returns are based upon beginning-of-year market capitalization weighting of the cumulativereturns for the following 11 consumer product companies: Alberto-Culver Co., Church & Dwight, Inc., EnescoGroup, Inc., Kimball International, Lancaster Colony Corp., La-Z-Boy Chair Co., National Presto Industries,Inc., Oneida Ltd., RPM Inc.-Ohio, Scotts Company and Valspar Corp.
20

ITEM NO. 2
RATIFICATION OF APPOINTMENT OF INDEPENDENT ACCOUNTANTS
The Audit Committee of the Board of Directors has appointed PricewaterhouseCoopers LLP as the independentregistered public accounting firm for the Company to audit the consolidated financial statements of the Companyfor fiscal year 2007. Although ratification by stockholders is not required by law, the Audit Committee hasdetermined that it is desirable to request ratification of this selection by the stockholders. Notwithstanding itsselection, the Audit Committee, in its discretion, may appoint new independent accountants at any time duringthe year if the Audit Committee believes that such a change would be in the best interests of the Company and itsstockholders. If the stockholders do not ratify the appointment of Pricewaterhouse-Coopers LLP, the AuditCommittee may reconsider its selection.
A majority of the votes of the common stock present or represented at the meeting is required for approval.Broker non-votes will be voted in favor of approval. PricewaterhouseCoopers LLP acted as the Company’sindependent registered public accounting firm during the past fiscal year and, unless the Audit Committeeappoints new independent accountants, PricewaterhouseCoopers LLP will continue to act in such capacity duringthe current fiscal year. It is anticipated that a representative of PricewaterhouseCoopers LLP will attend theAnnual Meeting of Stockholders, will have an opportunity to make a statement if he or she desires to do so andwill be available to respond to appropriate questions.
The Audit Committee’s policy is to pre-approve all audit and permissible non-audit products and servicesprovided by the independent accountants. These products and services may include audit services, audit-relatedservices, tax services, software and other products or services. Pre-approval is generally provided for up to oneyear and any pre-approval is detailed as to the particular service or category of services and is generally subjectto a specific budget. The independent accountants and management are required to periodically report to theAudit Committee regarding the extent of services provided by the independent accountants in accordance withthis pre-approval, and the fees for the services performed to date. The Audit Committee may also pre-approveparticular services on a case-by-case basis. The possible effect on the independence of the accountants isconsidered by the Audit Committee. There is no direct or indirect understanding or agreement that places a limiton current or future years’ audit fees.
Audit Fees
PricewaterhouseCoopers LLP has provided audit services to the Company for each of the past two fiscal years.Audit fees consist of fees for professional services rendered for the audit of the Company’s consolidated annualfinancial statements and review of the interim consolidated financial statements included in quarterly reports andservices that are normally provided by PricewaterhouseCoopers LLP in connection with statutory and regulatoryfilings or engagements. Audit fees also include fees for professional services rendered for the audits of(i) management’s assessment of the effectiveness of internal control over financial reporting and (ii) theeffectiveness of internal control over financial reporting. The aggregate fees billed to the Company byPricewaterhouseCoopers LLP for audit services performed for the Company for the past two fiscal years were$891,000 for the year ended August 31, 2005 and $869,000 for the year ended August 31, 2006.
Audit-Related Fees
Audit-related services consist of assurance and related services that are reasonably related to the performance ofthe audit or review of the Company’s consolidated financial statements and are not reported under “Audit Fees.”No audit-related services were provided during the fiscal years ending on August 31, 2005 and August 31, 2006.
21

Tax Fees
PricewaterhouseCoopers LLP has provided tax compliance, tax advice, and tax planning services to theCompany for each of the past two fiscal years. The tax services provided to the Company by the auditors duringeach of the fiscal years ended August 31, 2005 and August 31, 2006 consisted of tax return preparation, taxpayment-planning services and assistance with tax audits and appeals (to the extent permitted.) The aggregatefees billed to the Company by PricewaterhouseCoopers LLP for tax services performed for the Company for thepast two fiscal years were $163,964 for the year ended August 31, 2005 and $35,000 for the year endedAugust 31, 2006.
All Other Fees
PricewaterhouseCoopers LLP provided access to online research reference material for the fiscal year endingAugust 31, 2005 and August 31, 2006. The aggregate fees billed to the Company by PricewaterhouseCoopersLLP for other services performed for the Company for the past two fiscal years were $3,000 for the year endedAugust 31, 2005 and $3,000 for the year ended August 31, 2006.
STOCKHOLDER PROPOSALS
Stockholder proposals must be received by the Company no sooner than May 9, 2007 and not later thanJuly 9, 2007 to be included in the Proxy Statement and form of Proxy for the next annual meeting.
By Order of the Board of DirectorsMaria M. Mitchell
Secretary
Dated: November 6, 2006
IT IS IMPORTANT THAT PROXIES BE RETURNED PROMPTLY. THEREFORE, STOCKHOLDERSARE URGED TO FILL IN, SIGN AND RETURN THE ACCOMPANYING FORM OR FORMS OF
PROXY IN THE ENCLOSED ENVELOPE.
22

UNITED STATESSECURITIES AND EXCHANGE COMMISSION
Washington, D. C. 20549
FORM 10-K
ANNUAL REPORT PURSUANT TO SECTION 13 or 15(d)OF THE SECURITIES EXCHANGE ACT OF 1934
For the Fiscal Year Ended August 31, 2006
Commission File No. 000-06936
WD-40 COMPANY(Exact Name of Registrant as specified in Charter)
Delaware 95-1797918(State or other jurisdiction of
incorporation or organization)(I.R.S. Employer
Identification No.)
1061 Cudahy Place, San Diego, California 92110(Address of principal executive offices) (Zip Code)
Registrant’s telephone number, including area code (619) 275-1400
Securities registered pursuant to Section 12(b) of the Act:
Title of Class: None
Securities registered pursuant to Section 12(g) of the Act:
Title of Class: Common Stock, $.001 par value
Indicate by check mark if the Registrant is a well-known seasoned issuer, as defined in Rule 405 of the SecuritiesAct: Yes ‘ No È
Indicate by check mark if the Registrant is not required to file reports pursuant to Section 13 or Section 15(d) of theAct: Yes ‘ No È.
Indicate by check mark whether the Registrant (1) has filed all reports required to be filed by Section 13 or 15(d) of theSecurities Exchange Act of 1934 during the preceding 12 months (or for such shorter period that the Registrant wasrequired to file such reports), and (2) has been subject to such filing requirements for the past 90days: Yes È No ‘.
Indicate by check mark if disclosure of delinquent filers pursuant to Item 405 of Regulation S-K is not containedherein, and will not be contained, to the best of Registrant’s knowledge, in definitive proxy or information statementsincorporated by reference in Part III of this Form 10-K or any amendment to this Form 10-K: È.
Indicate by check mark whether the registrant is a large accelerated filer, an accelerated filer, or a non-accelerated filer.See definition of “accelerated filer and large accelerated filer” in Rule 12b-2 of the Exchange Act:
Large accelerated filer ‘ Accelerated filer È Non-accelerated filer ‘
Indicate by check mark whether the registrant is a shell company (as defined in Rule 12b-2 of the ExchangeAct): Yes ‘ No È
The aggregate market value (closing price) of the voting stock held by non-affiliates of the Registrant as ofFebruary 28, 2006 was $483,505,000.
As of October 17, 2006 the Registrant had 17,021,909 shares of Common Stock outstanding.
DOCUMENTS INCORPORATED BY REFERENCE
The Proxy Statement for the annual meeting of stockholders on December 12, 2006 is incorporated by reference intoPART III, Items 10, 11, 12 and 14.


PART I
ITEM 1 - Business
(a) General Development of Business.
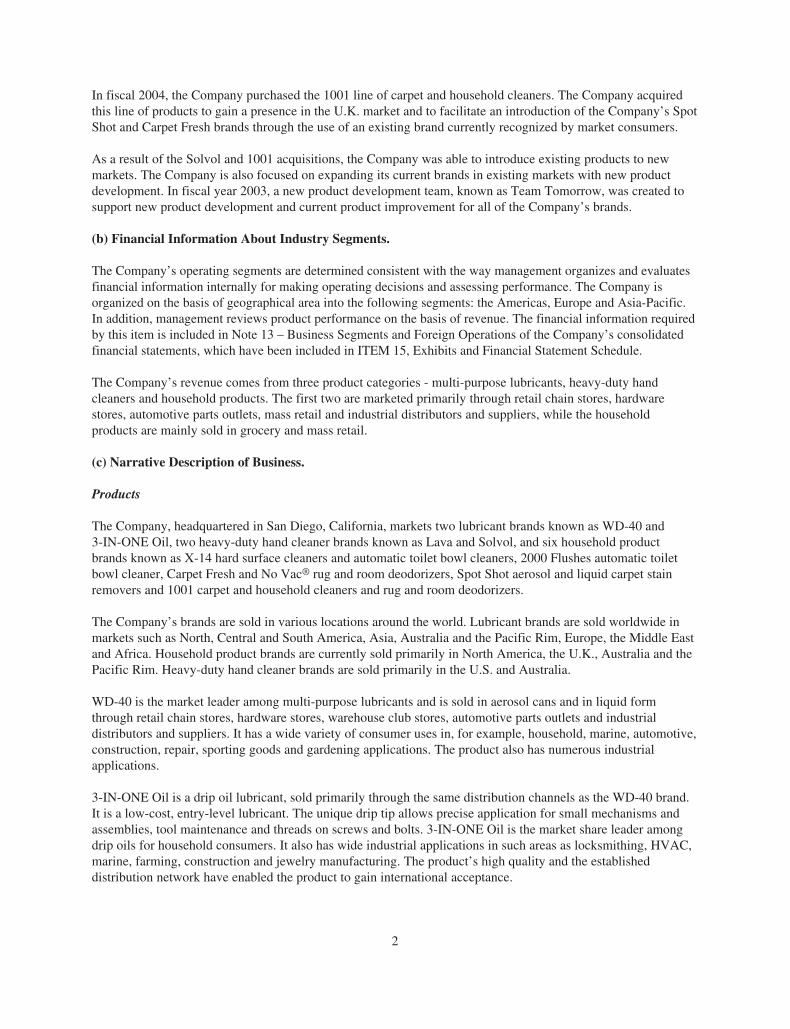
For more than four decades, WD-40 Company (the Company) sold only one product, WD-40®. WD-40 is amulti-purpose product which acts as a lubricant, rust preventative, penetrant, cleaner and moisture displacer. InDecember 1995, the Company acquired the 3-IN-ONE® Oil brand. 3-IN-ONE Oil is a lower cost general-purposelubricant that is useful when precise applications of a lubricant are needed. In April 1999, the Company acquiredthe Lava® brand heavy-duty hand cleaner and in October 2000, acquired the Solvol® brand heavy-duty handcleaner. The four brands complement each other, providing the Company with a line of both lubricant and heavy-duty hand cleaning products aimed at the Do-It-Yourself (“DIY”), hardware, automotive and other retail andindustrial markets. In April 2001, the Company acquired three additional brands of household cleaning products,2000 Flushes®, X-14® and Carpet Fresh®. The Company added to its fortress of brands through the acquisition inMay 2002 of the Spot Shot® brand, which is an aerosol and liquid carpet stain remover and a leading brand in thecarpet stain remover category. The Spot Shot brand fits well within the Company’s brand portfolio, alongside theother household product brands. In April 2004, the Company again added to its brands with its purchase of the1001® line of carpet and household cleaners. The 1001 brand provides the Company an opportunity to expand itshousehold products market in the U.K. with a recognized U.K. brand name.
The acquisition of the 3-IN-ONE Oil brand provided the Company with an existing network of distribution in 17countries, including several markets in which the WD-40 brand had not been sold. The Company used thisdistribution network to introduce the WD-40 brand to these markets and to add distribution channels in some ofthe markets that had been previously established.
The Lava brand is more than 100 years old and is well recognized by U.S. consumers. When the Lava brand wasacquired, the Company identified that the Lava consumer and the WD-40 consumer shared similar characteristicsand believed the distribution network developed through the WD-40 brand could effectively promote growth inthe U.S. With the Lava acquisition, the Company concluded that it would benefit by an increased position in theU.S. grocery channel. This was a catalyst for the Global Household Brands acquisition.
In fiscal 2001, the Company acquired the business, brand trademarks, patents and other tangible and intangibleassets known as Global Household Brands, which included the three principal brand trademarks 2000 Flushesand X-14 automatic toilet bowl cleaners, X-14 hard surface cleaners and Carpet Fresh rug and room deodorizers.The acquisition was made to move the Company forward in its fortress of brands strategy, while also providingeconomies of scale in sales, manufacturing, and administration, and to strengthen the Company’s position in thegrocery trade channel. The Global Household Brands’ broker network and grocery business, combined with theWD-40 Company’s DIY distribution, gave the Company growth potential for all brands across new tradechannels.
In fiscal 2001, the Company also acquired the Solvol brand of heavy-duty hand cleaners in Australia andsubsequently extended that brand into a liquid product, a benefit from the technology obtained in the acquisitionof the Lava brand. These liquid products have contributed to the growth of the Solvol brand.
In fiscal 2002, the Company completed the acquisition of the business, worldwide brand trademarks and otherintangible assets of Heartland Corporation. The principal brand acquired by the Company was the Spot Shotbrand, an aerosol carpet stain remover. The acquisition of this brand expanded the Company’s product offerings.The acquisition also included related Spot Shot products and a group of developing brands, which weresubsequently sold to former employees of Heartland.
1
In fiscal 2004, the Company purchased the 1001 line of carpet and household cleaners. The Company acquiredthis line of products to gain a presence in the U.K. market and to facilitate an introduction of the Company’s SpotShot and Carpet Fresh brands through the use of an existing brand currently recognized by market consumers.
As a result of the Solvol and 1001 acquisitions, the Company was able to introduce existing products to newmarkets. The Company is also focused on expanding its current brands in existing markets with new productdevelopment. In fiscal year 2003, a new product development team, known as Team Tomorrow, was created tosupport new product development and current product improvement for all of the Company’s brands.
(b) Financial Information About Industry Segments.
The Company’s operating segments are determined consistent with the way management organizes and evaluatesfinancial information internally for making operating decisions and assessing performance. The Company isorganized on the basis of geographical area into the following segments: the Americas, Europe and Asia-Pacific.In addition, management reviews product performance on the basis of revenue. The financial information requiredby this item is included in Note 13 – Business Segments and Foreign Operations of the Company’s consolidatedfinancial statements, which have been included in ITEM 15, Exhibits and Financial Statement Schedule.
The Company’s revenue comes from three product categories - multi-purpose lubricants, heavy-duty handcleaners and household products. The first two are marketed primarily through retail chain stores, hardwarestores, automotive parts outlets, mass retail and industrial distributors and suppliers, while the householdproducts are mainly sold in grocery and mass retail.
(c) Narrative Description of Business.
Products
The Company, headquartered in San Diego, California, markets two lubricant brands known as WD-40 and3-IN-ONE Oil, two heavy-duty hand cleaner brands known as Lava and Solvol, and six household productbrands known as X-14 hard surface cleaners and automatic toilet bowl cleaners, 2000 Flushes automatic toiletbowl cleaner, Carpet Fresh and No Vac® rug and room deodorizers, Spot Shot aerosol and liquid carpet stainremovers and 1001 carpet and household cleaners and rug and room deodorizers.
The Company’s brands are sold in various locations around the world. Lubricant brands are sold worldwide inmarkets such as North, Central and South America, Asia, Australia and the Pacific Rim, Europe, the Middle Eastand Africa. Household product brands are currently sold primarily in North America, the U.K., Australia and thePacific Rim. Heavy-duty hand cleaner brands are sold primarily in the U.S. and Australia.
WD-40 is the market leader among multi-purpose lubricants and is sold in aerosol cans and in liquid formthrough retail chain stores, hardware stores, warehouse club stores, automotive parts outlets and industrialdistributors and suppliers. It has a wide variety of consumer uses in, for example, household, marine, automotive,construction, repair, sporting goods and gardening applications. The product also has numerous industrialapplications.
3-IN-ONE Oil is a drip oil lubricant, sold primarily through the same distribution channels as the WD-40 brand.It is a low-cost, entry-level lubricant. The unique drip tip allows precise application for small mechanisms andassemblies, tool maintenance and threads on screws and bolts. 3-IN-ONE Oil is the market share leader amongdrip oils for household consumers. It also has wide industrial applications in such areas as locksmithing, HVAC,marine, farming, construction and jewelry manufacturing. The product’s high quality and the establisheddistribution network have enabled the product to gain international acceptance.
2

The Company purchased the Lava brand of heavy-duty hand cleaner in fiscal 1999. The Lava brand is more than100 years old and has exceptional awareness among American consumers. At the time of the acquisition, thebrand consisted of two sizes of bar soap and one size of liquid cleaner. Prior to the Company’s acquisition, thebrand had been sold in a limited number of domestic trade channels, notably supermarkets and drug stores.Because of its heavy-duty characteristics, the Lava brand appeals to consumers who shop in other channels suchas hardware, automotive and club stores. The Company acquired the Solvol brand in Australia during fiscal year2001. Solvol, Australia’s leading brand of heavy duty hand cleaner, was sold as a bar soap at the time ofacquisition. Shortly after acquiring the Solvol brand, the Company increased the product offering of the brand byadding a liquid cleaner.
The Company acquired the X-14, 2000 Flushes and Carpet Fresh brands in fiscal 2001. X-14 is sold as a liquidmildew stain remover, a liquid bathroom soap scum remover, a liquid daily shower cleaner, an automatic toiletbowl cleaner and an aerosol and liquid all-purpose bathroom cleaner. 2000 Flushes is a pioneering line of long-duration automatic toilet bowl cleaners. Carpet Fresh initiated the rug and room deodorizer category upon itsintroduction in 1978. The Carpet Fresh powder is sprinkled on carpets and vacuumed. Carpet Fresh is also soldas an aerosol foam, which does not require vacuuming. At the time of the acquisition, the brands were soldprimarily through grocery, drug and mass retail channels.
The Company acquired the Spot Shot brand in fiscal 2002. The Spot Shot brand is currently an aerosol and liquidcarpet stain remover. At the time of the acquisition, the brand was sold as an aerosol product primarily throughfood and mass retail, club stores, hardware and home center stores. The Company has been focused on expandingthe growth of the brand through product and packaging innovation, increasing brand awareness, consumer usageand household penetration, along with expanding the brand into new trade channels.
In April 2004, the Company acquired the 1001 business. The 1001 brand includes carpet and household cleanersand is sold primarily through mass retail, grocery and home center stores. The brand was acquired with theexpectation that the Company would be able to successfully introduce its other household product formulationsunder the 1001 brand in order to expand the Company’s household products business into the U.K. market.During the fourth quarter of fiscal year 2004, the Carpet Fresh and Spot Shot brands were introduced under the1001 brand in the U.K. The Carpet Fresh No Vac formula is one of the first aerosol rug and room deodorizers inthe U.K. market.
The Company continues to be focused and committed to innovation and new product development. TheCompany is encouraged by its accelerated pace of innovation, including potential new products currently indevelopment. The Company sees innovation as an important factor to the success of its brands and intends tocontinue to work on future product, packaging and promotional innovations.
Financial information about segment operations and product lines appears in Note 13 – Business Segments andForeign Operations of the Company’s consolidated financial statements, which have been included in ITEM 15,Exhibits and Financial Statement Schedule.
Sources and Availability of Raw Materials
The Company relies on multiple suppliers for the primary components for its products. The Company’s primarycomponents include aerosol cans and petroleum-based products, which are manufactured from commodities thatare subject to volatile price changes. The availability of these components is affected by a variety of supply anddemand factors, including global market trends, plant capacity decisions and natural disasters. The Companyexpects these components to continue to be readily available in the future, although the Company is exposed tovolatile commodity prices.
3

Research and Development
The Company recognizes the importance of innovation to its long-term success and is focused on and committedto research and new product development activities. The Company has a new-product development team knownas Team Tomorrow. This team engages in consumer research, product development, current productimprovement and testing activities, and also leverages its development capabilities by partnering with a networkof outside resources including the Company’s current and prospective outsource suppliers. The Companyincurred research and development expenses of $3.8 million, $2.5 million and $1.9 million in fiscal years 2006,2005 and 2004, respectively. None of this research activity was customer-sponsored.
Seasonality
Historically, the Company has achieved its highest quarterly sales levels during its fourth fiscal quarter. Thesepatterns are largely reflective of the customers’ seasonal purchasing patterns, as well as the timing of theCompany’s promotional activities. However, due to new product introductions and international sales growth,these patterns may not continue in future years.
Manufacturing
The Company outsources the manufacturing of its finished products to various suppliers (contractmanufacturers). The Company uses contract manufacturers in the United States, Canada, United Kingdom,Australia, South Korea and India. Although the Company does not have any definitive minimum purchaseobligations included in the contract terms with contract manufacturers, supply needs are communicated, and theCompany is committed to purchase the products produced based on orders and short-term projections provided tothe contract manufacturers. In addition, the Company has expanded its manufacturer sourcing outside of itstraditional contract manufacturing and distribution model in order to support recent product introductions.
Significant Customer
Wal-Mart Stores, Inc. is a significant U.S. mass retail customer and offers a variety of the Company’s products.Sales to U.S. Wal-Mart stores accounted for approximately 9 percent of the Company’s consolidated net salesduring each of fiscal years 2006, 2005 and 2004. Excluding sales to U.S. Wal-Mart stores, sales to affiliates ofWal-Mart worldwide accounted for approximately 4 percent during each of fiscal years 2006 and 2005, andapproximately 5 percent during fiscal year 2004.
Order Backlog
Order backlog is not a significant factor in the Company’s business.
Competition
The market for the Company’s products, especially its household products, is highly competitive and is expectedto be increasingly competitive in the future. The Company’s products compete both within their own productclasses as well as within product distribution channels, competing with many other products for store placementand shelf space. Competition in international markets varies by country. The Company is aware of manycompeting products, some of which sell for lower prices or are produced and marketed by companies with greaterfinancial resources than those of the Company. The Company relies on the awareness of its brands amongconsumers, the value offered by those brands as perceived by consumers, product innovation and its multiplechannel distribution as its primary strategies. New products typically encounter intense competition, which mayrequire substantial advertising and promotional support. When or if a new product achieves consumer acceptance,ongoing advertising and promotional support may be required to maintain its relative market position.
4

Trademarks and Patents
The Company owns numerous patents, but relies primarily upon its established trademarks, brand names andmarketing efforts, including advertising and sales promotion, to compete effectively. The WD-40, 3-IN-ONE,Lava, Solvol, X-14, 2000 Flushes, Carpet Fresh and No Vac, Spot Shot and 1001 trademarks are registered invarious countries throughout the world.
Employees
At August 31, 2006, the Company employed 244 people worldwide: 129 by the United States parent corporation,6 of whom are based in the Malaysian regional office; 10 by the Company’s Canadian subsidiary; 90 by theUnited Kingdom subsidiary, including 16 in Germany, 12 in France, 11 in Spain and 7 in Italy; 12 by theAustralian subsidiary; and 3 by WD-40 Manufacturing Company, the Company’s manufacturing subsidiary. Themajority of the Company’s employees are engaged in sales and/or marketing activities.
(d) Financial Information About Foreign and Domestic Operations and Export Sales.
The information required by this item is included in Note 13 - Business Segments and Foreign Operations, of theCompany’s consolidated financial statements, which have been included in ITEM 15, Exhibits and FinancialStatement Schedule. The Company is subject to a variety of risks due to its foreign operations, includingcurrency risk and credit risk. The Company attempts to minimize its exposure to foreign currency exchangefluctuations by the use of forward contracts on non-functional currency cash balances. With the continuingexpansion of the Company’s business in Asia, Latin America, Eastern Europe, the Middle East and various statesin the former Soviet Union, the Company is subject to increased credit risk for products sold to customers inthese areas.
(e) Access to SEC Filings
Interested readers can access the Company’s annual reports on Form 10-K, quarterly reports on Form 10-Q,current reports on Form 8-K and any amendments to those reports filed or furnished pursuant to Section 13(a) or15(d) of the Securities Exchange Act of 1934, as amended, through the Investor Relations section of theCompany’s website at www.wd40.com. These reports can be accessed free of charge from the Company’swebsite as soon as reasonably practicable after the Company electronically files such materials with, or furnishesthem to, the Commission. Note that nothing on the Company’s website has been incorporated into this document.
Interested readers may also read and copy any materials that the Company files at the SEC Public ReferenceRoom at 100 F Street, N.E., Washington D.C. 20549. Readers may obtain information on the operation of thePublic Reference Room by calling the SEC at 1-800-SEC-0330. The SEC also maintains an internet site(www.sec.gov) that contains the Company’s reports.
ITEM 1A - Risk Factors
The following risks and uncertainties, as well as other factors described elsewhere in this report or in other filingsof the Company with the SEC, could adversely affect the Company’s business, financial condition and results ofoperations. Additional risks and uncertainties that are not presently known to the Company or that are notcurrently believed by the Company to be material may also harm the Company’s business operations andfinancial results.
Component Supply Risk
The Company depends upon its suppliers for the supply of the primary components for its products. Suchcomponents are subject to significant price volatility beyond the control or influence of the Company. Petroleum-
5

based products, from which WD-40 and 3-IN-ONE are manufactured, have had significant price volatility in thepast, and may in the future. Rising oil prices also impact the Company’s cost of transporting its products.Historically, the Company has generally found alternate sources of constituent chemicals for its products readilyavailable. As component and raw material costs are the main contribution to cost of goods sold for all of theCompany’s products, any significant fluctuation in the costs of components could also have a material impact onthe gross margins realized on the Company’s products. Specifically, future can prices are exposed to fluctuationsresulting from changes in tariffs on steel as well as general supply and demand economics; therefore, anysignificant increase or decrease in steel tariffs and/or the supply and demand of steel could have a significantimpact on the costs of purchasing cans and the Company’s cost of goods. In the event there is more significantprice volatility or higher component costs generally, the Company may not be able to maintain, or may choosenot to maintain, its gross margins by raising its product prices. Should the Company choose to increase productprices, such increases may adversely affect demand and unit sales. Increases in the prices for the componentscould have a material adverse effect on the Company’s business, operating results, financial position and cashflows.
Reliance on Supply Chain
The Company relies on third party contract manufacturers for the production of its finished goods. The Companydoes not have direct control over the management or business of the primary contract manufacturers utilized inthe manufacturing of the Company’s products, except indirectly through terms as negotiated in contracts withthose manufacturers. Should the terms of doing business with the Company’s primary contract manufacturerschange, the Company’s cost structure may be impacted, which could have a direct impact on the Company’sprofit margins.
The Company’s contract manufacturers rely upon two key vendors for the supply of empty cans used in theproduction of WD-40, Carpet Fresh, 3-IN-ONE, Spot Shot, X-14 and 1001 products. Additionally, the Companyrelies on single manufacturers for the production of 2000 Flushes and X-14 automatic toilet bowl cleaners, X-14hard surface cleaners, Carpet Fresh powder and Lava bar soap. The loss of any of these suppliers ormanufacturers could disrupt or interrupt the production of the Company’s products. Although the Company hasan emergency recovery plan to help mitigate the potential loss of suppliers or manufacturers, the inability toreplace lost suppliers or manufacturers in a reasonable amount of time could have a material adverse effect on theCompany’s business, operating results, financial position and cash flows.
The Company also relies on third party logistics providers for the distribution of its products to customers. TheCompany does not have direct control over the management or business of the logistics providers, exceptindirectly through terms as negotiated in contracts. Should the terms of doing business with the Company’slogistics providers change, the distribution of products to customers may be disrupted, which could have a directimpact on the Company’s profitability. The inability to replace lost logistics providers in a reasonable amount oftime could also have a material adverse effect on the Company’s business, operating results, financial positionand cash flows.
Additionally, as the Company continues to focus on innovation, there is an increasing need for global andmultiple sourcing strategies. The inability of the Company to find adequate sourcing to support innovationinitiatives could have a material adverse effect on the Company’s business, operating results, financial positionand cash flows.
Inventory Risks
Due to growing innovation efforts, the Company must carry higher levels of inventory. Therefore, the Companyfaces risks associated with managing both increased levels and types of inventory throughout a more complexsupply chain. The Company’s financial condition, results of operations or cash flows could be adversely affectedin the event that the Company is not able to effectively manage inventory at appropriate levels.
6
Competition
The market for the Company’s products is highly competitive and is expected to be increasingly competitive inthe future. The Company’s products compete both within their own product classes as well as within productdistribution channels, competing with many other products for store placement and shelf space. Competition ininternational markets varies by country. The Company is aware of many competing products, some of which sellfor lower prices.
These considerations as well as increased competition generally could result in price reductions, reduced grossmargins, and a loss of market share, any of which could have a material adverse effect on the Company’sbusiness, operating results, financial position and cash flows. In addition, many of the Company’s competitorshave significantly greater financial, technical, product development, marketing and other resources. There can beno assurance that the Company will be able to compete successfully against current and future competitors orthat competitive pressures faced by the Company will not materially adversely affect its business, operatingresults, financial position and cash flows.
Volume Growth
A large percentage of the Company’s revenue comes from mature markets that are subject to increasedcompetition. During fiscal year 2006, approximately 56% of the Company’s sales were generated in U.S.markets. U.S. markets for lubricants, household products and hand cleaners are considered mature and aregenerally characterized by high household penetration. The Company’s ability to achieve volume growth isdependent on its ability to drive growth through innovation and investment in its established brands and itsability to capture market share from competitors. During fiscal year 2006, the Company increased prices on amajority of its product portfolio. Price increases may slow volume growth or create declines in volume in theshort term as customers adjust to price increases. If the Company is unable to increase market share in existingproduct lines, or bring innovation to grow its product categories, or develop, acquire or successfully launch newproducts, the Company may not achieve its volume growth objectives.
Political and Economic Risks
The Company’s domestic and international operations are exposed to the risk of political and economicuncertainties. Changes in political and economic conditions may affect product cost, availability, distribution,pricing, purchasing, and consumption patterns. While the Company seeks to manage its business in considerationof these risks, there can be no assurance that the Company will be successful in doing so.
As the Company’s sales extend to various countries around the globe, financial results in affected areas areexposed to a higher degree of risk. Examples of regions currently exposed to such types of risk include LatinAmerica, the Middle East and parts of Asia. There can be no assurance that the Company will be able tosuccessfully mitigate against current and future risk associated with political and economic uncertainties, or thatthe risks faced by the Company will not materially adversely affect its business, operating results, financialposition and cash flows. As sales grow within various regions around the world, the Company’s exposure to thisrisk will increase.
International Operations
The Company’s sales outside of the U.S. were approximately 44% of net sales in fiscal year 2006. The Companyhas faced and will continue to face substantial risks associated with having foreign operations, includingrestrictions on repatriating foreign profits back to the U.S. and the imposition of tariffs or trade restrictions.These risks could have a significant impact on the Company’s ability to sell its products on a competitive basis ininternational markets and may have a material adverse effect of the Company’s results of operations or financialposition.
7
Also, the Company’s operations outside of the U.S. are subject to the risk of new and different legal andregulatory requirements in local jurisdictions, potential difficulties in staffing and managing local operations,potentially higher incidence of fraud or corruption, credit risk of local customers or distributors and potentiallyadverse tax consequences.
The Company is also exposed to foreign currency exchange rate risk with respect to its sales, profits, and assetsand liabilities denominated in currencies other than the U.S. dollar. Although the Company uses instruments tohedge certain foreign currency risks, it is not fully protected against foreign currency fluctuations and, therefore,the Company’s reported earnings will be affected by changes in foreign currency exchange rates.
Business Risks
With the trend toward consolidation in the retail marketplace, the Company’s customer base is shifting towardfewer, but larger, customers who purchase in larger volumes. A large percentage of the Company’s sales are tomass retail customers. Sales to one of these customers (Wal-Mart and affiliates) accounted for approximately13% of the Company’s net sales in fiscal year 2006. The loss of, or reduction in, orders from any of theCompany’s most significant customers could have a material adverse effect on the Company’s brand values,business and financial results.
Large customers also seek price reductions, added support or promotional concessions, which may negativelyimpact the Company’s ability to maintain existing profit margins.
The Company does not typically enter into long-term contracts with its customers. Accordingly, these customerscould reduce their purchasing levels or cease buying products from the Company at anytime and for any reason.In addition, the Company is subject to changes in customer purchasing patterns. These types of changes mayresult from changes in the manner in which customers purchase and manage inventory levels, or display andpromote products within their stores. Other potential factors such as customer disputes regarding shipments, fees,merchandise condition or related matters may also impact operating results.
The Company also faces the risk of diminishing product categories or shifts within these categories. Currently,the Company faces challenges related to its household products brands. Household products have shortdifferentiated life cycles and often need continuous innovation to address consumers’ changing needs and tastes.As a result of the dynamic nature of these product categories, the ability to understand consumer preferences andinnovate is key to the Company’s ongoing success. In the event that the Company is unable to meet consumerpreferences through innovation, its brands and product offerings may be at risk of impairment.
New Product Development Risks
The Company’s long-term growth is reliant, in part, on the success of new product introductions. The Companycompetes in several product categories where there are frequent introductions of new products and lineextensions. The ability to understand consumer preferences and identify technological trends is key tomaintaining and improving the competitiveness of its product offerings. The development and introduction ofnew products requires significant research and development, marketing and manufacturing expenditures, whichthe Company may not recoup if the new products do not gain market acceptance. There are inherent risksassociated with new product development, including product launch delays, which could result in the Companynot being first to market, inventory costs if managed ineffectively, product design failures, product defects andthe failure of new products to achieve expected levels of consumer acceptance. As the Company continues tofocus on innovation, the Company’s financial condition, results of operations or cash flows could be adverselyaffected in the event that the Company is not able to effectively develop and introduce new products and lineextensions.
8

Operating Results and Net Earnings May Not Meet Expectations
The Company cannot be sure that its operating results and net earnings will meet its expectations. If the Company’sassumptions and estimates are incorrect or do not come to fruition, or if the Company does not achieve all of its keygoals, then the Company’s actual performance could vary materially from its expectations. The Company’soperating results and net earnings may be influenced by a number of factors, including the following:
• The introduction of new products and line extensions by the Company or its competitors
• The mix of products with varying profitability sold in a given quarter
• The mix of products sold within channels with varying profitability in a given quarter
• The Company’s ability to control its internal costs and the cost of raw materials
• The effectiveness of the Company’s advertising, marketing and promotional programs
• Changes in product pricing policies by the Company or its competitors
• Consumer and customer reaction to price increases
• The ability of the Company to execute its strategies and to maintain and enhance profits in the face of aconsolidating retail environment
• Changes in accounting policies and accounting standards
• The ability of the Company to achieve business plans, including volume growth and pricing plans, as aresult of high levels of competitive activity
• The ability to maintain key customer relationships
• The ability of major customers and other debtors to meet their obligations as they come due
• The failure of parties contracting with the Company to perform their obligations and the loss of orinability to renew contracts of importance to the Company’s performance
• The Company’s reliance on brokers to maintain and grow distribution in the grocery channel
• The ability to successfully manage regulatory, tax and legal matters, including resolution of pendingmatters within current estimates
• Substantial costs associated with regulatory compliance
• The ability of the Company to attract and retain qualified personnel
• The ability of the Company to maintain the value of its brands
• Expenses for impairment of goodwill, trademarks and other intangible assets and equity investments inexcess of projections
• Expenses for impairment and obsolescence of property, plant and equipment
9
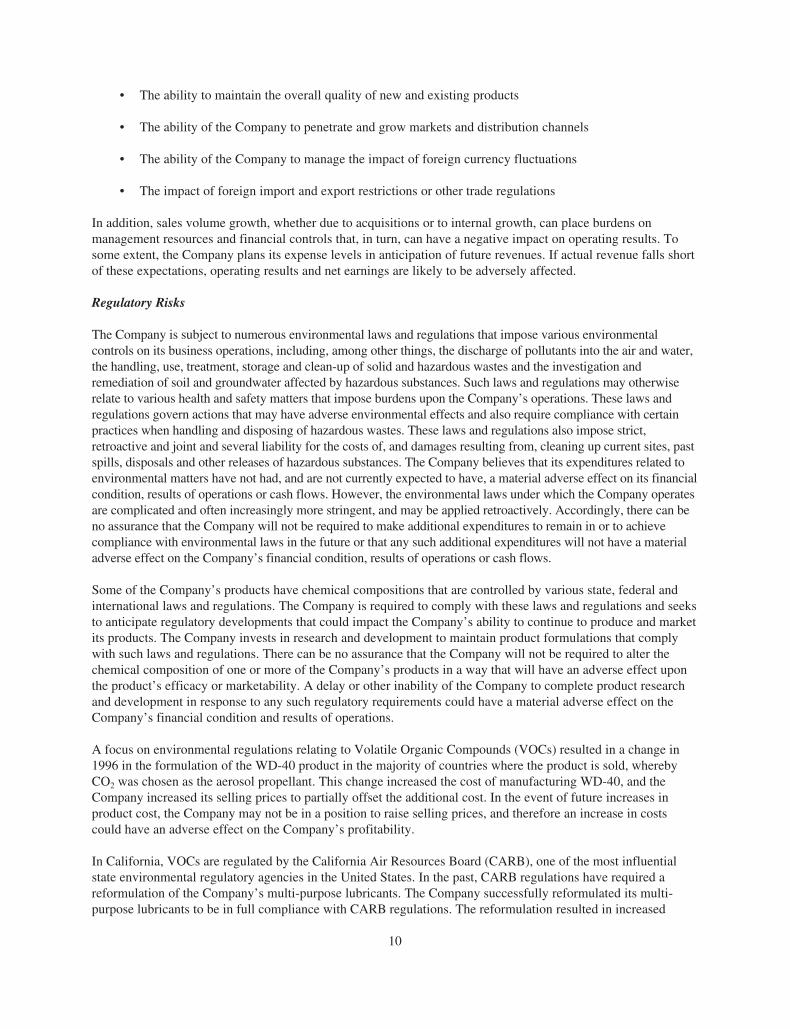
• The ability to maintain the overall quality of new and existing products
• The ability of the Company to penetrate and grow markets and distribution channels
• The ability of the Company to manage the impact of foreign currency fluctuations
• The impact of foreign import and export restrictions or other trade regulations
In addition, sales volume growth, whether due to acquisitions or to internal growth, can place burdens onmanagement resources and financial controls that, in turn, can have a negative impact on operating results. Tosome extent, the Company plans its expense levels in anticipation of future revenues. If actual revenue falls shortof these expectations, operating results and net earnings are likely to be adversely affected.
Regulatory Risks
The Company is subject to numerous environmental laws and regulations that impose various environmentalcontrols on its business operations, including, among other things, the discharge of pollutants into the air and water,the handling, use, treatment, storage and clean-up of solid and hazardous wastes and the investigation andremediation of soil and groundwater affected by hazardous substances. Such laws and regulations may otherwiserelate to various health and safety matters that impose burdens upon the Company’s operations. These laws andregulations govern actions that may have adverse environmental effects and also require compliance with certainpractices when handling and disposing of hazardous wastes. These laws and regulations also impose strict,retroactive and joint and several liability for the costs of, and damages resulting from, cleaning up current sites, pastspills, disposals and other releases of hazardous substances. The Company believes that its expenditures related toenvironmental matters have not had, and are not currently expected to have, a material adverse effect on its financialcondition, results of operations or cash flows. However, the environmental laws under which the Company operatesare complicated and often increasingly more stringent, and may be applied retroactively. Accordingly, there can beno assurance that the Company will not be required to make additional expenditures to remain in or to achievecompliance with environmental laws in the future or that any such additional expenditures will not have a materialadverse effect on the Company’s financial condition, results of operations or cash flows.
Some of the Company’s products have chemical compositions that are controlled by various state, federal andinternational laws and regulations. The Company is required to comply with these laws and regulations and seeksto anticipate regulatory developments that could impact the Company’s ability to continue to produce and marketits products. The Company invests in research and development to maintain product formulations that complywith such laws and regulations. There can be no assurance that the Company will not be required to alter thechemical composition of one or more of the Company’s products in a way that will have an adverse effect uponthe product’s efficacy or marketability. A delay or other inability of the Company to complete product researchand development in response to any such regulatory requirements could have a material adverse effect on theCompany’s financial condition and results of operations.
A focus on environmental regulations relating to Volatile Organic Compounds (VOCs) resulted in a change in1996 in the formulation of the WD-40 product in the majority of countries where the product is sold, wherebyCO2 was chosen as the aerosol propellant. This change increased the cost of manufacturing WD-40, and theCompany increased its selling prices to partially offset the additional cost. In the event of future increases inproduct cost, the Company may not be in a position to raise selling prices, and therefore an increase in costscould have an adverse effect on the Company’s profitability.
In California, VOCs are regulated by the California Air Resources Board (CARB), one of the most influentialstate environmental regulatory agencies in the United States. In the past, CARB regulations have required areformulation of the Company’s multi-purpose lubricants. The Company successfully reformulated its multi-purpose lubricants to be in full compliance with CARB regulations. The reformulation resulted in increased
10
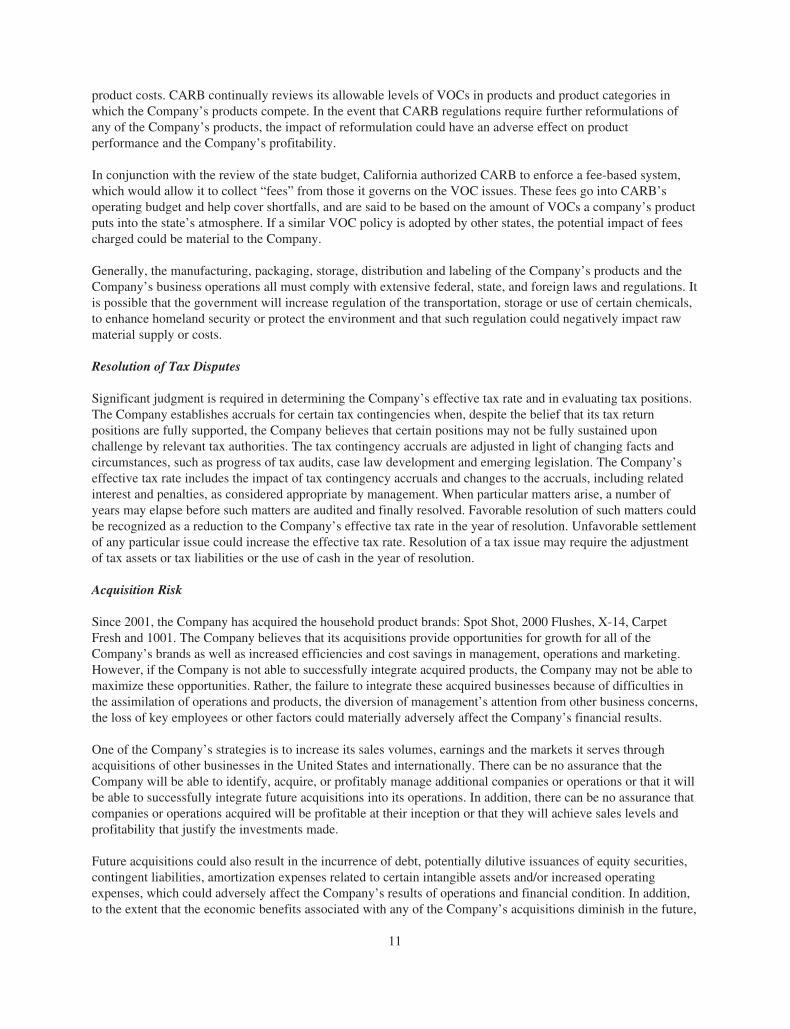
product costs. CARB continually reviews its allowable levels of VOCs in products and product categories inwhich the Company’s products compete. In the event that CARB regulations require further reformulations ofany of the Company’s products, the impact of reformulation could have an adverse effect on productperformance and the Company’s profitability.
In conjunction with the review of the state budget, California authorized CARB to enforce a fee-based system,which would allow it to collect “fees” from those it governs on the VOC issues. These fees go into CARB’soperating budget and help cover shortfalls, and are said to be based on the amount of VOCs a company’s productputs into the state’s atmosphere. If a similar VOC policy is adopted by other states, the potential impact of feescharged could be material to the Company.
Generally, the manufacturing, packaging, storage, distribution and labeling of the Company’s products and theCompany’s business operations all must comply with extensive federal, state, and foreign laws and regulations. Itis possible that the government will increase regulation of the transportation, storage or use of certain chemicals,to enhance homeland security or protect the environment and that such regulation could negatively impact rawmaterial supply or costs.
Resolution of Tax Disputes
Significant judgment is required in determining the Company’s effective tax rate and in evaluating tax positions.The Company establishes accruals for certain tax contingencies when, despite the belief that its tax returnpositions are fully supported, the Company believes that certain positions may not be fully sustained uponchallenge by relevant tax authorities. The tax contingency accruals are adjusted in light of changing facts andcircumstances, such as progress of tax audits, case law development and emerging legislation. The Company’seffective tax rate includes the impact of tax contingency accruals and changes to the accruals, including relatedinterest and penalties, as considered appropriate by management. When particular matters arise, a number ofyears may elapse before such matters are audited and finally resolved. Favorable resolution of such matters couldbe recognized as a reduction to the Company’s effective tax rate in the year of resolution. Unfavorable settlementof any particular issue could increase the effective tax rate. Resolution of a tax issue may require the adjustmentof tax assets or tax liabilities or the use of cash in the year of resolution.
Acquisition Risk
Since 2001, the Company has acquired the household product brands: Spot Shot, 2000 Flushes, X-14, CarpetFresh and 1001. The Company believes that its acquisitions provide opportunities for growth for all of theCompany’s brands as well as increased efficiencies and cost savings in management, operations and marketing.However, if the Company is not able to successfully integrate acquired products, the Company may not be able tomaximize these opportunities. Rather, the failure to integrate these acquired businesses because of difficulties inthe assimilation of operations and products, the diversion of management’s attention from other business concerns,the loss of key employees or other factors could materially adversely affect the Company’s financial results.
One of the Company’s strategies is to increase its sales volumes, earnings and the markets it serves throughacquisitions of other businesses in the United States and internationally. There can be no assurance that theCompany will be able to identify, acquire, or profitably manage additional companies or operations or that it willbe able to successfully integrate future acquisitions into its operations. In addition, there can be no assurance thatcompanies or operations acquired will be profitable at their inception or that they will achieve sales levels andprofitability that justify the investments made.
Future acquisitions could also result in the incurrence of debt, potentially dilutive issuances of equity securities,contingent liabilities, amortization expenses related to certain intangible assets and/or increased operatingexpenses, which could adversely affect the Company’s results of operations and financial condition. In addition,to the extent that the economic benefits associated with any of the Company’s acquisitions diminish in the future,
11
the Company may be required to record write-downs of goodwill, intangible assets or other assets associated withsuch acquisitions, which could also adversely affect the Company’s operating results.
Debt Financing Risk
The Company has historically paid out a large part of its earnings to stockholders in the form of regular quarterlydividends. The past acquisitions have been funded to a large extent by debt. In order to service the debt, theCompany is required to use its income from operations to make interest and principal payments required by theterms of the loan agreements. In addition, the Company is required by covenants within the loan agreements tomaintain certain financial ratios and compliance with other financial terms.
In fiscal years 2001 and 2002, the Company announced reductions to its regular quarterly dividend from $0.32 to$0.27 per share in April 2001 and from $0.27 to $0.20 per share in July 2002 (reducing the annual dividend sinceApril 2001 from $1.28 to $0.80) in order to make more of its cash flow available for debt service requirements.In April 2005, the Company announced an increase to its regular quarterly dividend from $0.20 to $0.22 pershare (increasing the annual dividend from $0.80 to $0.88). However, if operating income is not sufficient toproperly service the debt or otherwise allow the Company to maintain compliance with the terms of its loans, theCompany could be required to seek additional financing through the issuance of more debt or the sale of equitysecurities, or the Company might be required to reduce dividends. An increase in the Company’s debt serviceobligations could result in lower earnings if anticipated gross and net margins are not maintained.
The Company may also incur substantial additional debt in the future for other reasons, including acquisitions. Ifnew debt is added to current debt levels, the Company’s related risks could intensify.
Protection of Intellectual Property
The Company relies on trademark, trade secret, patent and copyright laws to protect its intellectual property. TheCompany cannot be sure that these intellectual property rights will be successfully asserted in the future or that theywill not be invalidated or circumvented. In addition, laws of some of the foreign countries in which the Company’sproducts are or may be sold do not protect the Company’s intellectual property rights to the same extent as the lawsof the United States. The failure of the Company to protect its proprietary information and any successfulintellectual property challenges or infringement proceedings against the Company could make it less competitiveand could have a material adverse effect on the Company’s business, operating results and financial condition.
Intellectual Property Infringement
It is possible that the Company could be found to have violated the trademark, trade secret, copyright, patent orother intellectual property rights of others. Such a finding could result in the need to cease the use of a trademark,trade secret, copyrighted work or patented invention in the Company’s business and to pay a substantial amountfor past infringement. It could also be necessary to pay a substantial amount in the future if the rights holder iswilling to permit the Company to continue to use the intellectual property rights. Either having to cease use or topay such amounts could make the Company less competitive and could have a material adverse impact on itsbusiness, operating results and financial condition.
Volatility in the Insurance Market
The Company re-evaluates its insurance coverage annually. From time to time, insurance contracts may be muchmore expensive, less protective or even unavailable. In such a case the Company may decide to increase levels ofself-insurance, thereby undertaking additional risk.
12
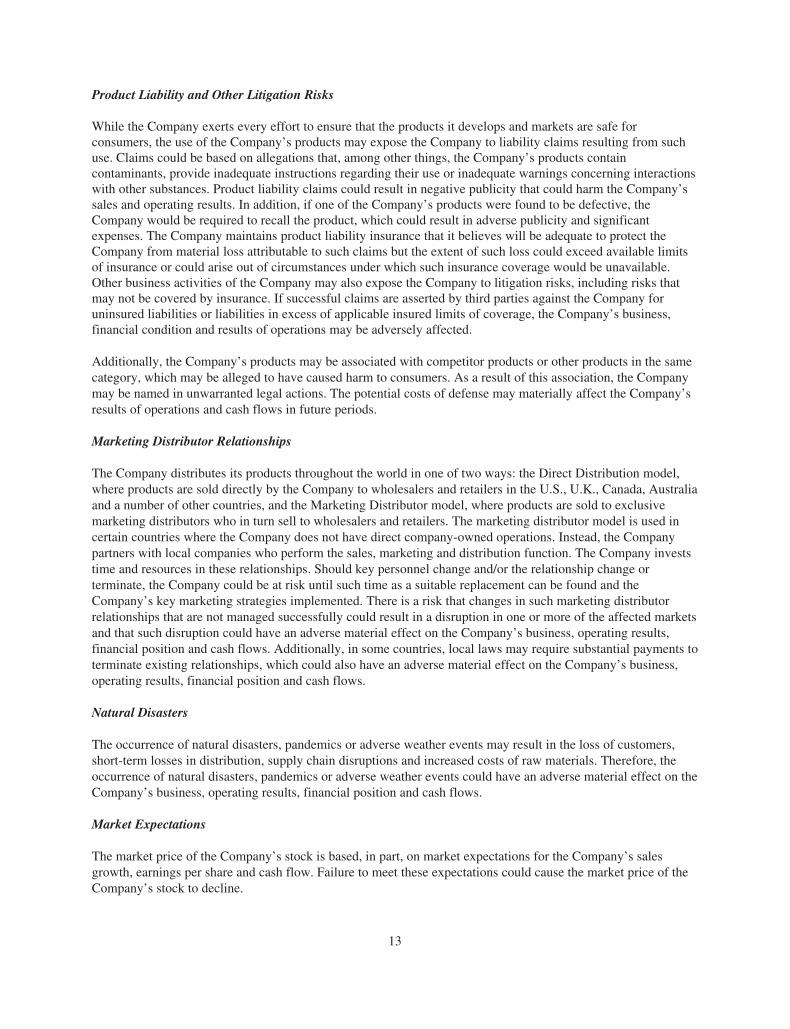
Product Liability and Other Litigation Risks
While the Company exerts every effort to ensure that the products it develops and markets are safe forconsumers, the use of the Company’s products may expose the Company to liability claims resulting from suchuse. Claims could be based on allegations that, among other things, the Company’s products containcontaminants, provide inadequate instructions regarding their use or inadequate warnings concerning interactionswith other substances. Product liability claims could result in negative publicity that could harm the Company’ssales and operating results. In addition, if one of the Company’s products were found to be defective, theCompany would be required to recall the product, which could result in adverse publicity and significantexpenses. The Company maintains product liability insurance that it believes will be adequate to protect theCompany from material loss attributable to such claims but the extent of such loss could exceed available limitsof insurance or could arise out of circumstances under which such insurance coverage would be unavailable.Other business activities of the Company may also expose the Company to litigation risks, including risks thatmay not be covered by insurance. If successful claims are asserted by third parties against the Company foruninsured liabilities or liabilities in excess of applicable insured limits of coverage, the Company’s business,financial condition and results of operations may be adversely affected.
Additionally, the Company’s products may be associated with competitor products or other products in the samecategory, which may be alleged to have caused harm to consumers. As a result of this association, the Companymay be named in unwarranted legal actions. The potential costs of defense may materially affect the Company’sresults of operations and cash flows in future periods.
Marketing Distributor Relationships
The Company distributes its products throughout the world in one of two ways: the Direct Distribution model,where products are sold directly by the Company to wholesalers and retailers in the U.S., U.K., Canada, Australiaand a number of other countries, and the Marketing Distributor model, where products are sold to exclusivemarketing distributors who in turn sell to wholesalers and retailers. The marketing distributor model is used incertain countries where the Company does not have direct company-owned operations. Instead, the Companypartners with local companies who perform the sales, marketing and distribution function. The Company investstime and resources in these relationships. Should key personnel change and/or the relationship change orterminate, the Company could be at risk until such time as a suitable replacement can be found and theCompany’s key marketing strategies implemented. There is a risk that changes in such marketing distributorrelationships that are not managed successfully could result in a disruption in one or more of the affected marketsand that such disruption could have an adverse material effect on the Company’s business, operating results,financial position and cash flows. Additionally, in some countries, local laws may require substantial payments toterminate existing relationships, which could also have an adverse material effect on the Company’s business,operating results, financial position and cash flows.
Natural Disasters
The occurrence of natural disasters, pandemics or adverse weather events may result in the loss of customers,short-term losses in distribution, supply chain disruptions and increased costs of raw materials. Therefore, theoccurrence of natural disasters, pandemics or adverse weather events could have an adverse material effect on theCompany’s business, operating results, financial position and cash flows.
Market Expectations
The market price of the Company’s stock is based, in part, on market expectations for the Company’s salesgrowth, earnings per share and cash flow. Failure to meet these expectations could cause the market price of theCompany’s stock to decline.
13

Internal Control over Financial Reporting
The management of WD-40 Company is responsible for establishing and maintaining adequate internal controlover financial reporting. Internal control over financial reporting is a process to provide reasonable assuranceregarding the reliability of financial reporting for external purposes in accordance with accounting principlesgenerally accepted in the United States. Internal control over financial reporting includes maintaining records inreasonable detail that accurately and fairly reflect the Company’s transactions, providing reasonable assurancethat receipts and expenditures are made in accordance with management’s authorization, and providingreasonable assurance that the unauthorized acquisition, use or disposition of the Company’s assets that couldhave a material effect on the financial statements would be prevented or detected on a timely basis. Because of itsinherent limitations, internal control over financial reporting is not intended to provide absolute assurance that amisstatement in the Company’s financial statements would be prevented or detected. The Company’s continuinggrowth and expansion in global markets will place additional significant pressure on the Company’s system ofinternal control over financial reporting. Any failure to maintain an effective system of internal control overfinancial reporting could limit the Company’s ability to report its financial results accurately and timely or todetect and prevent fraud.
ITEM 1B - Unresolved Staff Comments
None.
ITEM 2 - Properties
The Americas
The Company owns and occupies an office and plant facility at 1061 Cudahy Place, San Diego, California 92110.The building consists of approximately 11,000 square feet of office space and 4,000 square feet of plant andstorage area. The Company leases an additional 8,000 square feet of office and storage space in San Diego. TheCompany leases approximately 2,100 square feet of office space in total for sales offices in Springfield, NewJersey and Miami, Florida. The Company leases approximately 2,000 square feet of office space in Toronto,Ontario, Canada.
Europe
The Company owns and occupies an office and plant facility at Kiln Farm, Milton Keynes, England. Thebuilding consists of approximately 8,600 square feet of office space and 4,100 square feet of plant and storagearea. In addition, the Company leases space for the branch offices in Germany, France, Spain and Italy.
Asia-Pacific
The Company leases approximately 3,500 square feet of office space in Epping, New South Wales, Australia.The Company also leases approximately 1,700 square feet of office space for a regional office in Kuala Lumpur,Malaysia and an additional 7,500 square feet of office space in Shanghai, China.
With minor adjustments, the Company believes that these properties should be sufficient to meet its needs foroffice and plant facilities for the near future. Increased growth may cause the Company to acquire and/or modifyits space in future years.
ITEM 3 - Legal Proceedings
The Company is party to various claims, legal actions and complaints, including product liability litigation,arising in the ordinary course of business.
14

On April 19, 2006, a legal action was filed against the Company in the United States District Court, SouthernDistrict of California (Drimmer v. WD-40 Company). After several of the plaintiff’s factual claims weredismissed by way of motion, the plaintiff filed an amended complaint on September 20, 2006, seeking classaction status and alleging that the Company misrepresented that its 2000 Flushes Bleach and 2000 Flushes BluePlus Bleach automatic toilet bowl cleaners (ATBCs) are safe for plumbing systems and unlawfully omitted toadvise consumers regarding the allegedly damaging effect the use of the ATBCs has on toilet parts made ofplastic and rubber. The amended complaint seeks to remedy such allegedly wrongful conduct: (i) by requiring theCompany to identify all consumers who have purchased the ATBCs and to return money as may be ordered bythe court; and (ii) by the granting of other equitable relief, interest, attorneys’ fees and costs. Though a newnamed plaintiff brought this case, it is legally and factually identical to a similar case that was dismissed by theSan Diego Superior Court in April 2005, and the Company intends to vigorously defend this case in the samemanner as before. If class action certification is granted in this aforementioned legal action, it is reasonablypossible that the outcome could have a material adverse effect on the operating results, financial position andcash flows of the Company. There is not sufficient information to estimate the Company’s exposure at this time.
The Company has been named as a defendant in an increasing number of lawsuits brought by a growing group ofattorneys on behalf of individual plaintiffs who assert that exposure to products that allegedly contain benzene isa cause of certain cancers. The Company is one of many defendants in these legal proceedings whose productsare alleged to contain benzene. However, the Company specifies that its suppliers provide constituent ingredientsfree of benzene, and the Company believes its products have always been formulated without containingbenzene. Except for self-insured retention amounts applicable to each separately filed lawsuit, the Companyexpects that the benzene lawsuits will be adequately covered by insurance and will not have a material impact onthe Company’s financial condition or results of operations. The Company is vigorously defending these lawsuitsin an effort to demonstrate conclusively that its products do not contain benzene, and that they have notcontained benzene in prior years. The Company is unable to assess the expected cost of defense of these lawsuitsin future periods. If the number of benzene lawsuits filed against the Company continues to increase, it isreasonably possible that such costs of defense may materially affect the Company’s results of operations andcash flows in future periods.
On May 28, 2004, separate but substantially identical legal actions were filed by Sally S. Hilkene against theCompany in the United States District Court for the District of Kansas and in the District Court of JohnsonCounty, Kansas. The plaintiff asserted claims for damages for alleged fraud in connection with the acquisition ofHeartland Corporation by the Company on May 31, 2002. The plaintiff alleged federal and state securities fraudand common law fraud claims against the Company and also sought to rescind the purchase agreement for theHeartland Corporation acquisition. On October 3, 2006, the plaintiff and the Company agreed that the plaintiffwould dismiss her claims against the Company with prejudice in exchange for a mutual release and theCompany’s agreement to dismiss its counterclaim for an unpaid purchase price adjustment for the HeartlandCorporation acquisition in the approximate amount of $34,000. On October 10, 2006, this settlement agreementwas executed, and the claims against the Company were dismissed.
ITEM 4 - Submission of Matters to a Vote of Security Holders
Not applicable.
15

Executive Officers of the Registrant
The following table sets forth the names and ages of, and the positions and offices held by, all executive officerswithin the Company:
Name Age Position
Garry O. Ridge 50 President and Chief Executive Officer. Mr. Ridge joined the Company’sAustralian subsidiary, WD-40 Company (Australia) Pty. Limited, in1987 as Managing Director and has held several senior managementpositions prior to his election as CEO in 1997.
Michael J. Irwin 43 Executive Vice President, Chief Financial Officer, and Treasurer. Mr.Irwin joined the Company in May 1995 as Director of U.S. Marketing,and later served as Director of Marketing for The Americas. In April1998 he was promoted to Vice President, Marketing for The Americas,was named Senior Vice President, Chief Financial Officer and Treasurerin May 2001, and in September 2002 was named Executive VicePresident.
Graham P. Milner 52 Executive Vice President, Global Development and Chief BrandingOfficer. Mr. Milner joined the Company in 1992 as InternationalDirector, was appointed Vice President, Sales and Marketing, TheAmericas, in March 1997, became Senior Vice President, The Americas,in April 1998, and was named Executive Vice President, GlobalDevelopment and Chief Branding Officer in September of 2002.
Michael L. Freeman 53 Division President, The Americas. Mr. Freeman joined the Company in1990 as Director of Marketing and was named Director of Operations in1994. He became Vice President, Administration and Chief InformationOfficer in December 1996, was promoted to Senior Vice President,Operations in September 2001, and was named Division President, TheAmericas, in September 2002.
Geoffrey J. Holdsworth 44 Managing Director, WD-40 Company (Australia) Pty. Limited. Mr.Holdsworth joined the Company’s Australian subsidiary, WD-40Company (Australia) Pty. Limited, in 1996 as General Manager. Prior tojoining WD-40 Company, Mr. Holdsworth held sales managementpositions at Columbia Pelikan Pty. Ltd., Australia.
William B. Noble 48 Managing Director, WD-40 Company Ltd. (U.K.). Mr. Noble joined theCompany’s Australian subsidiary, WD-40 Company (Australia) Pty.Limited, in 1993 as International Marketing Manager for the AsiaRegion. He was appointed Managing Director, Europe in December1996.
All executive officers hold office at the pleasure of the Board of Directors.
16

PART II
ITEM 5 - Market For Registrant’s Common Equity, Related Stockholder Matters and Issuer Purchases ofEquity Securities
The Company’s common stock is traded on The Nasdaq Stock Market (National Market System). As ofAugust 31, 2006, the approximate number of holders of record of the Company’s common stock was 1,337. Thefollowing table sets forth the range of high and low sales prices on The Nasdaq Stock Market of the Company’scommon stock for the periods indicated, as reported by Nasdaq.
SELECTED STOCK INFORMATION
FISCAL 2006 FISCAL 2005
HIGH LOW DIVIDEND HIGH LOW DIVIDEND
First Quarter $29.22 $25.35 $0.22 $30.05 $27.25 $0.20Second Quarter $31.85 $26.00 $0.22 $34.18 $27.61 $0.20Third Quarter $33.70 $29.41 $0.22 $33.76 $27.56 $0.22Fourth Quarter $35.40 $29.91 $0.22 $30.00 $25.02 $0.22
The Company has historically paid regular quarterly cash dividends on its common stock. The Board of Directorsof the Company presently intends to continue the payment of regular quarterly cash dividends on the commonstock. The Company’s ability to pay dividends could be affected by future business performance, liquidity,capital needs, alternative investment opportunities and loan covenants.
Issuance of Unregistered Securities
On March 1, 2006, the Company issued a total of 6,099 shares of its common stock to seven of its non-employeedirectors pursuant to the Company’s Amended and Restated WD-40 Company 1999 Non-Employee DirectorRestricted Stock Plan (the Plan). The shares were issued in lieu of cash compensation for all or part of eachelecting director’s annual fee for services as a director. The number of shares issued was determined according toa formula set forth in the Plan equal to the total compensation to be paid in shares divided by 90% of the closingprice of the Company’s shares on the first business day of March 2006. On March 1, 2006, the Company issuedshares to directors under the Plan with an aggregate market value of $185,000 in lieu of cash compensation in theamount of $167,000. The issuance of the shares of the Company’s common stock to the directors was exemptfrom registration under the Securities Act of 1933 (the “Act”) pursuant to Section 4(2) of the Act as a transactionby an issuer not involving a public offering. The shares issued to directors are subject to certain restrictions upontransfer.
17
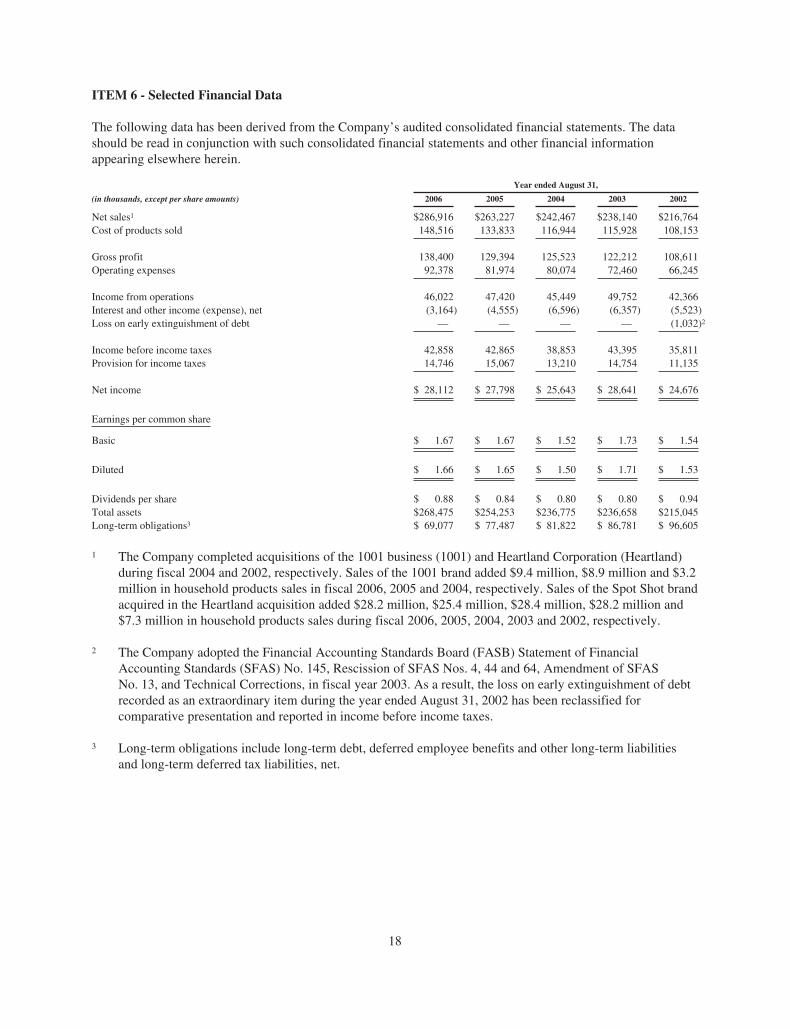
ITEM 6 - Selected Financial Data
The following data has been derived from the Company’s audited consolidated financial statements. The datashould be read in conjunction with such consolidated financial statements and other financial informationappearing elsewhere herein.
Year ended August 31,
(in thousands, except per share amounts) 2006 2005 2004 2003 2002
Net sales1 $286,916 $263,227 $242,467 $238,140 $216,764Cost of products sold 148,516 133,833 116,944 115,928 108,153
Gross profit 138,400 129,394 125,523 122,212 108,611Operating expenses 92,378 81,974 80,074 72,460 66,245
Income from operations 46,022 47,420 45,449 49,752 42,366Interest and other income (expense), net (3,164) (4,555) (6,596) (6,357) (5,523)Loss on early extinguishment of debt — — — — (1,032)2
Income before income taxes 42,858 42,865 38,853 43,395 35,811Provision for income taxes 14,746 15,067 13,210 14,754 11,135
Net income $ 28,112 $ 27,798 $ 25,643 $ 28,641 $ 24,676
Earnings per common share
Basic $ 1.67 $ 1.67 $ 1.52 $ 1.73 $ 1.54
Diluted $ 1.66 $ 1.65 $ 1.50 $ 1.71 $ 1.53
Dividends per share $ 0.88 $ 0.84 $ 0.80 $ 0.80 $ 0.94Total assets $268,475 $254,253 $236,775 $236,658 $215,045Long-term obligations3 $ 69,077 $ 77,487 $ 81,822 $ 86,781 $ 96,605
1 The Company completed acquisitions of the 1001 business (1001) and Heartland Corporation (Heartland)during fiscal 2004 and 2002, respectively. Sales of the 1001 brand added $9.4 million, $8.9 million and $3.2million in household products sales in fiscal 2006, 2005 and 2004, respectively. Sales of the Spot Shot brandacquired in the Heartland acquisition added $28.2 million, $25.4 million, $28.4 million, $28.2 million and$7.3 million in household products sales during fiscal 2006, 2005, 2004, 2003 and 2002, respectively.
2 The Company adopted the Financial Accounting Standards Board (FASB) Statement of FinancialAccounting Standards (SFAS) No. 145, Rescission of SFAS Nos. 4, 44 and 64, Amendment of SFASNo. 13, and Technical Corrections, in fiscal year 2003. As a result, the loss on early extinguishment of debtrecorded as an extraordinary item during the year ended August 31, 2002 has been reclassified forcomparative presentation and reported in income before income taxes.
3 Long-term obligations include long-term debt, deferred employee benefits and other long-term liabilitiesand long-term deferred tax liabilities, net.
18
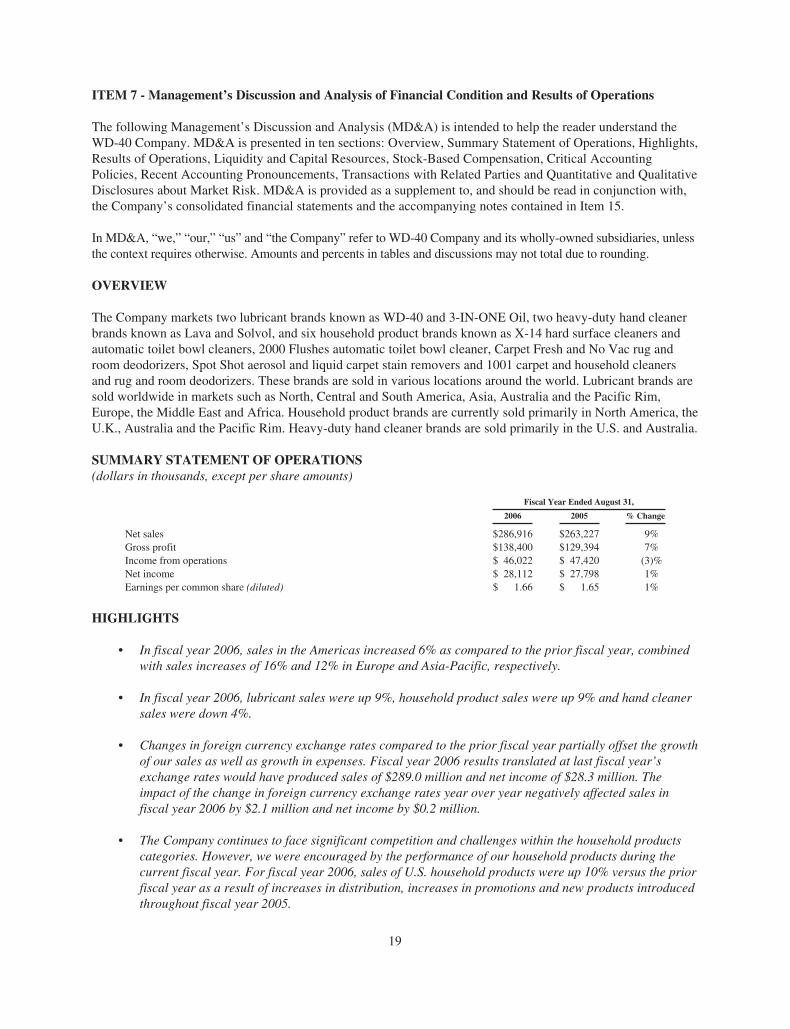
ITEM 7 - Management’s Discussion and Analysis of Financial Condition and Results of Operations
The following Management’s Discussion and Analysis (MD&A) is intended to help the reader understand theWD-40 Company. MD&A is presented in ten sections: Overview, Summary Statement of Operations, Highlights,Results of Operations, Liquidity and Capital Resources, Stock-Based Compensation, Critical AccountingPolicies, Recent Accounting Pronouncements, Transactions with Related Parties and Quantitative and QualitativeDisclosures about Market Risk. MD&A is provided as a supplement to, and should be read in conjunction with,the Company’s consolidated financial statements and the accompanying notes contained in Item 15.
In MD&A, “we,” “our,” “us” and “the Company” refer to WD-40 Company and its wholly-owned subsidiaries, unlessthe context requires otherwise. Amounts and percents in tables and discussions may not total due to rounding.
OVERVIEW
The Company markets two lubricant brands known as WD-40 and 3-IN-ONE Oil, two heavy-duty hand cleanerbrands known as Lava and Solvol, and six household product brands known as X-14 hard surface cleaners andautomatic toilet bowl cleaners, 2000 Flushes automatic toilet bowl cleaner, Carpet Fresh and No Vac rug androom deodorizers, Spot Shot aerosol and liquid carpet stain removers and 1001 carpet and household cleanersand rug and room deodorizers. These brands are sold in various locations around the world. Lubricant brands aresold worldwide in markets such as North, Central and South America, Asia, Australia and the Pacific Rim,Europe, the Middle East and Africa. Household product brands are currently sold primarily in North America, theU.K., Australia and the Pacific Rim. Heavy-duty hand cleaner brands are sold primarily in the U.S. and Australia.
SUMMARY STATEMENT OF OPERATIONS(dollars in thousands, except per share amounts)
Fiscal Year Ended August 31,
2006 2005 % Change
Net sales $286,916 $263,227 9%Gross profit $138,400 $129,394 7%Income from operations $ 46,022 $ 47,420 (3)%Net income $ 28,112 $ 27,798 1%Earnings per common share (diluted) $ 1.66 $ 1.65 1%
HIGHLIGHTS
• In fiscal year 2006, sales in the Americas increased 6% as compared to the prior fiscal year, combinedwith sales increases of 16% and 12% in Europe and Asia-Pacific, respectively.
• In fiscal year 2006, lubricant sales were up 9%, household product sales were up 9% and hand cleanersales were down 4%.
• Changes in foreign currency exchange rates compared to the prior fiscal year partially offset the growthof our sales as well as growth in expenses. Fiscal year 2006 results translated at last fiscal year’sexchange rates would have produced sales of $289.0 million and net income of $28.3 million. Theimpact of the change in foreign currency exchange rates year over year negatively affected sales infiscal year 2006 by $2.1 million and net income by $0.2 million.
• The Company continues to face significant competition and challenges within the household productscategories. However, we were encouraged by the performance of our household products during thecurrent fiscal year. For fiscal year 2006, sales of U.S. household products were up 10% versus the priorfiscal year as a result of increases in distribution, increases in promotions and new products introducedthroughout fiscal year 2005.
19

• The rising cost of products sold negatively affected gross margins during fiscal year 2006 as comparedto the prior fiscal year. We continue to be concerned about rising costs of components and rawmaterials. We began to incur increased costs during the fourth quarter of fiscal year 2004 and havecontinued to see further cost increases. To combat these cost increases, the Company implemented priceincreases on certain products during the third quarter of fiscal year 2005. Since that time, the Companyhas continued to experience increases in product costs. As a result, the Company implementedadditional price increases on certain products during the third quarter of fiscal year 2006.
• We continue to be focused on and committed to innovation. We are encouraged by the Company’saccelerated pace of innovation, including potential new products currently in development. We seeinnovation as an important factor to the success of our brands, and we intend to continue ourcommitment to work on future product, packaging and promotional innovations.
• Selling, general and administrative expenses were up 13% during fiscal year 2006 as compared to theprior fiscal year due primarily to increases in bonus expense, employee-related costs, stock-basedcompensation due to the adoption of a new accounting pronouncement (SFAS No. 123R), research anddevelopment costs, freight costs and professional services.
• The Company adopted SFAS No. 123R, “Share-Based Payment” at the beginning of fiscal year 2006.The incremental increase in compensation costs related to the adoption of SFAS No. 123R, excludingthe associated tax benefits, totaled $1.8 million during fiscal year 2006 and was recorded as acomponent of selling, general and administrative expenses.
• Advertising and sales promotion expenses were up 12% during fiscal year 2006 as compared to theprior fiscal year due primarily to increased consumer broadcast and print advertising in the U.S.related to new products.
• As of August 31, 2006, inventory increased to $15.3 million, up from $8.0 million at August 31, 2005.The increase is primarily due to inventory acquired to support new product introductions andpromotions. Recent product introductions have required the Company to acquire products outside of itshistorical contract packager model, which has resulted in the need for the Company to carry higherlevels of inventory.
RESULTS OF OPERATIONS
Year Ended August 31, 2006 Compared with the Year Ended August 31, 2005
Net Sales
Net Sales by Segment Fiscal Year Ended August 31,
(in thousands) 2006 2005 $ Change % Change
Americas $186,769 $176,106 $10,663 6%Europe 79,101 68,353 10,748 16%Asia-Pacific 21,046 18,768 2,278 12%
Total net sales $286,916 $263,227 $23,689 9%
20

Please refer to the discussion under “Segment Results” included later in this section for further detailed results bysegment. Changes in foreign currency exchange rates compared to the prior fiscal year negatively impacted thegrowth of the Company’s sales. The current fiscal year results translated at last fiscal year’s exchange rateswould have produced sales of $289.0 million, thus, the impact of the change in foreign currency exchange ratesyear over year negatively affected fiscal year 2006 sales by $2.1 million, or 1%.
Net Sales by Product Line Fiscal Year Ended August 31,
(in thousands) 2006 2005 $ Change % Change
Lubricants $190,468 $174,084 $16,384 9%Household products 89,822 82,237 7,585 9%Hand cleaners 6,626 6,906 (280) (4)%
Total net sales $286,916 $263,227 $23,689 9%
By product line, sales of lubricants include WD-40 and 3-IN-ONE; sales of household products include CarpetFresh, No Vac, X-14, 2000 Flushes, Spot Shot and 1001; and hand cleaner sales include Lava and Solvol.
Gross Profit
Gross profit was $138.4 million, or 48.2% of sales in fiscal year 2006, compared to $129.4 million, or 49.2% ofsales in fiscal year 2005. The decrease in the gross margin percentage was primarily attributable to the increasein cost of products sold. The increase in cost of products negatively affected gross margins in all of theCompany’s regions. This increase was primarily due to the significant rise in costs for components and rawmaterials, including aerosol cans and petroleum-based products. As a result of the general upward trend of costsin the market, we are concerned about the possibility of continued rising costs of components, raw materials andfinished goods. Gross margin percentage was also negatively impacted during the current fiscal year as theCompany incurred costs associated with impaired, slow-moving and reworked inventory. As a result, theCompany focused on reducing excess inventory of certain products and offered significant discounts, whichreduced the gross margin percentage. The discounts and costs associated with the impaired, slow-moving andreworked inventory negatively impacted the gross margin percentage by 0.4% in fiscal year 2006. The increasein cost of products sold and the costs associated with impaired, slow-moving and reworked inventory werepartially offset by a decrease in advertising and promotional discounts and other discounts, which positivelyimpacted gross margin percentage by 0.3%. This decrease resulted from both timing and reductions in certaintraditional advertising and promotional activities that have experienced declines in consumer response.Advertising and promotional discounts, which are recorded as a reduction to sales, include coupon redemptions,consideration and allowances given to retailers for space in their stores, consideration and allowances given toobtain favorable display positions in retailers’ stores and co-operative advertising and promotional activity. Thetiming of these promotional activities, as well as shifts in product mix, may cause fluctuations in gross marginpercentage from period to period.
As the result of the continued trend of rising costs, the Company has implemented price increases on certainproducts. The Company began to experience rising costs during the fourth quarter of fiscal year 2004 and hascontinued to experience further cost increases. To reduce the impact of these cost increases, the Companyimplemented price increases on certain products during the third quarter of fiscal year 2005. However, costs ofcomponents, raw materials and finished goods have continued to rise since last fiscal year’s third quarter. As aresult, the Company implemented additional price increases during the third quarter of fiscal year 2006. Theincrease in pricing of certain products worldwide added approximately 1.6% to gross margin percentage in fiscalyear 2006 compared to fiscal year 2005.
Although the price increases helped reduce the current effect of rising costs on gross margin percentage, furtherrises in the cost of products could offset the benefits of the price increases. The Company is also examiningsupply chain cost savings initiatives in an effort to further reduce the impact of increased costs on gross marginpercentage. Additionally, the Company believes that innovation will be a key factor in improving gross marginpercentage in the long term.
21

Note that the Company’s gross margins may not be comparable to those of other reporting entities, since someentities include all costs related to distribution of their products in cost of products sold, whereas we exclude theportion associated with amounts paid to third parties for distribution to our customers from our contractpackagers, and include these costs in selling, general and administrative expenses.
Selling, General and Administrative Expenses
Selling, general and administrative expenses (SG&A) for fiscal year 2006 increased to $71.8 million from $63.5million for the prior fiscal year. The increase in SG&A was largely attributable to increases in bonus expense,employee-related costs, stock-based compensation expense due to the adoption of a new accountingpronouncement, research and development costs, freight costs and professional services. Bonus expenseincreased $2.8 million versus the prior fiscal year, as many regions did not achieve profit and other performanceexpectations in the prior fiscal year, which resulted in a lower prior fiscal year bonus expense. Employee-relatedcosts, which include salaries, profit sharing and other fringe benefits, increased $1.9 million versus the priorfiscal year as a result of annual compensation increases and additional staffing. Beginning in fiscal year 2006, theCompany adopted SFAS No. 123R, “Share-Based Payment”, which requires the expensing of stock options. Theadoption of this new accounting pronouncement resulted in a $1.8 million incremental increase in compensationexpense during fiscal year 2006. Research and development costs increased $1.3 million due to increased newproduct development activity. Freight costs increased $0.6 million due to sales growth and increased fuelsurcharges. The $0.7 million increase in professional services costs related to information technology, marketing,legal and tax-related consulting.
Also contributing to the increase in SG&A was $1.2 million of increased miscellaneous expenses such asdepreciation and amortization, overhead expenses, insurance expenses, travel expenses and meeting expenses.These increases were partially offset by $1.0 million of decreased bad debt expense primarily related torecoveries of bad debt, including a preference claim, $0.4 million of decreased sales commissions and $0.1million of decreased investor relations costs, as well as $0.5 million of foreign currency translation impact. Thecurrent fiscal year SG&A expenses translated at last fiscal year’s exchange rates would have produced totalSG&A expenses of $72.3 million.
The Company continued its research and development investment in support of its focus on innovation. Researchand development costs were $3.8 million in fiscal year 2006 compared to $2.5 million in fiscal year 2005. TheCompany’s new-product development team, known as Team Tomorrow, engages in consumer research, productdevelopment, current product improvement and testing activities. This team leverages its developmentcapabilities by partnering with a network of outside resources including the Company’s current and prospectiveoutsource suppliers.
As a percentage of sales, SG&A was 25.0% in fiscal year 2006 and 24.1% in fiscal year 2005.
Advertising and Sales Promotion Expenses
Advertising and sales promotion expenses increased to $20.1 million in fiscal year 2006, up from $17.9 millionin fiscal year 2005 and, as a percentage of sales, increased to 7.0% in fiscal year 2006 from 6.8% in fiscal year2005. In fiscal year 2005, marketing investment was concentrated in the first quarter. However, marketinginvestment in the U.S. was reduced during the remainder of last fiscal year as the Company reevaluated themarket dynamics and its strategies to determine which programs would be the most effective. In fiscal year 2006,the Company began to increase marketing investment in the second quarter and continued during the remainderof the fiscal year, as the Company aligned its advertising and sales promotion activities with the distribution ofits current and new products.
As a percentage of sales, advertising and sales promotion expenses may fluctuate period to period based upon thetype of marketing activities employed by the Company, as the costs of certain promotional activities are required
22

to be recorded as reductions to sales, and others remain in advertising and sales promotion expenses. In fiscalyear 2006, the total promotional costs recorded as reductions to sales were $15.6 million versus $18.8 million infiscal year 2005. Therefore, the Company’s total investment in advertising and sales promotion activities totaled$35.7 million in fiscal year 2006 versus $36.7 million in fiscal year 2005.
Amortization of Intangible Asset Expense
Amortization of intangible asset expense was $532,000 in fiscal year 2006, compared to $552,000 in fiscal year2005. The amortization relates to the non-contractual customer relationships intangible asset acquired in the 1001acquisition, which was completed in April 2004. This intangible asset is being amortized over its estimated eight-year life.
Income from Operations
Income from operations was $46.0 million, or 16.0% of sales in fiscal year 2006, compared to $47.4 million, or18.0% of sales in fiscal year 2005. The decrease in income from operations as a percentage of sales was due tothe items discussed above.
Interest Expense, net
Interest expense, net was $3.5 million compared to $5.1 million for the fiscal years ended August 31, 2006 and2005, respectively. The change in interest expense, net was primarily due to reduced principal balance on long-term borrowings resulting from a $10 million principal payment made in May 2005 and a $10.7 million principalpayment made in October 2005.
Other Income / Expense, net
Other income, net was $339,000 in fiscal year 2006, compared to $578,000 in the prior fiscal year, a decrease of$239,000, which was due to reduced foreign currency exchange gains.
Provision for Income Taxes
The provision for income taxes was 34.41% of income before income taxes for fiscal 2006, a decrease from35.15% in fiscal year 2005. The decrease in tax rate is due to the benefits of I.R.C. Section 199 related toqualified production activities provided by the American Jobs Creation Act of 2004, as well as foreign tax creditsand the tax benefit of municipal bond interest. These tax benefits were partially offset by the impact of reducedlow income housing credits, the growth of worldwide income and non-deductible stock-based compensationexpense related to stock options granted to some non-U.S. taxpayers.
Net Income
Net income was $28.1 million, or $1.66 per common share on a fully diluted basis for the fiscal year endedAugust 31, 2006, compared to $27.8 million, or $1.65 per common share for the prior fiscal year. The change inforeign currency exchange rates year over year had a negative impact of $0.2 million on fiscal year 2006 netincome.
23

Segment Results
Following is a discussion of sales by region for the fiscal years ended August 31, 2006 and 2005.
Americas
Net Sales Fiscal Year Ended August 31,
(in thousands) 2006 2005 $ Change % Change
Lubricants $102,732 $ 99,259 $ 3,473 3%Household products 78,553 71,276 7,277 10%Hand cleaners 5,484 5,571 (87) (2)%
Sub-total $186,769 $176,106 $10,663 6%
% of consolidated 65% 67%
Changes in foreign currency exchange rates compared to the prior fiscal year positively impacted the growth ofsales. The fiscal year 2006 results translated at last fiscal year’s exchange rates would have produced sales of$185.8 million in this region. Thus, the impact of the change in foreign currency exchange rates year over yearpositively affected sales in fiscal year 2006 by approximately $1.0 million.
The increase in lubricant sales in the Americas during fiscal year 2006 compared to the prior fiscal year was theresult of WD-40 sales growth in Canada and Latin America as sales increased by 12% and 23%, respectively.Growth in Canada was due to the launch of the WD-40 Smart Straw and the WD-40 No-Mess Pen. The WD-40Smart Straw and the WD-40 No-Mess Pen were introduced in the third and fourth quarters of fiscal year 2005,respectively. Growth in Latin America was primarily due to increased promotional activity and new distribution.Price increases implemented during the fiscal year 2005 third quarter on certain products, as well as additionalprice increases implemented during the current fiscal year third quarter, also contributed to the sales growth inthe Americas in fiscal year 2006. In the U.S., WD-40 sales increased 1%, as sales growth from the launch of theWD-40 Smart Straw and price increases were largely offset by decreased sales as a result of a large promotion infiscal year 2005 not repeated in fiscal year 2006.
Despite the significant competition within the household brands category, the Company’s household productswere still able to achieve sales growth. Household product sales in fiscal year 2006 were up by $7.3 million, or10%, compared to fiscal year 2005 due primarily to increases in the U.S. Sales in the U.S. increased by $6.8million, or 10%. The increases in household product sales resulted from a variety of reasons, including increasedpromotional activity, increased distribution and new products that were introduced throughout fiscal year 2005.While the Company’s household products achieved sales growth in fiscal year 2006 versus last fiscal year, theseproducts continue to experience significant competition within their categories, and in related categories as well.
Spot Shot sales increased 11% in the U.S. during the current fiscal year as compared to the prior fiscal year dueto increased promotional activities with key customers and sales from new products, Spot Shot Pro and Spot Shotwith a trigger format. Additionally, during most of the prior fiscal year, Spot Shot experienced decreased sales asa result of a key U.S. customer temporarily replacing Spot Shot with competitor products as it performedcompetitor sales testing. Although Spot Shot was successful and maintained distribution, these tests caused salesto be lower in the prior fiscal year. Overall, Spot Shot continues to outperform new entrants as well asestablished products on the shelf. The Company has committed research and development resources to createmeaningful innovation for the Spot Shot brand, including Spot Shot Pro and Spot Shot with a trigger format. SpotShot Pro is an aerosol carpet stain remover targeted to frequent and commercial users, and the new Spot Shotproduct with a trigger delivery format is a liquid carpet stain remover. Both of these new products also provideinnovation through an odor neutralizing formula.
Over the past two years, retailers have reduced shelf space for traditional rug and room deodorizers forreallocation to other air care products. As a result, the rug and room deodorizer category as a whole has declined
24

in the mass retail and grocery trade channels. Despite the declines in the rug and room deodorizer category,Carpet Fresh was able to achieve sales growth in the U.S. of 11% in fiscal year 2006 versus fiscal year 2005 dueto increased promotional activities and expanded distribution, which included new trade channels. The Companycontinues to refine its marketing, promotions and pricing strategies, and has committed research anddevelopment resources to create innovation for the Carpet Fresh brand.
U.S. sales of the X-14 hard surface cleaners increased 32% in fiscal year 2006 versus fiscal year 2005 dueprimarily to increased promotional activities, growth in non-grocery trade channels and the full year benefit fromthe launch of two new innovative products. During the fourth quarter of fiscal year 2004 and first quarter of fiscalyear 2005, the Company introduced two new products, X-14 Orange Aerosol and X-14 Oxy Citrus.
U.S. sales of 2000 Flushes/X-14 automatic toilet bowl cleaners were up 4% in fiscal year 2006 compared to theprior fiscal year due to increased promotional activities performed by the Company, as well as promotionalactivities performed by a key customer. However, sales of the automatic toilet bowl cleaning category are beingpressured overall due to competition from the manual bowl cleaning category.
To address the challenges and opportunities that exist within the competitive environments of the household productscategories, the Company continues to focus on innovation through product, packaging and promotional strategies.
Sales of heavy-duty hand cleaners for the Americas decreased 2% in fiscal year 2006 compared to the prior fiscalyear. Although sales of heavy-duty hand cleaners decreased slightly, distribution remains consistent through thegrocery trade and other classes of trade.
For this region, 87% of sales came from the U.S., and 13% came from Canada and Latin America in fiscal year2006, compared to the distribution in fiscal year 2005, when 88% of sales came from the U.S., and 12% camefrom Canada and Latin America.
Europe
Net Sales Fiscal Year Ended August 31,
(in thousands) 2006 2005 $ Change % Change
Lubricants $69,742 $59,427 $10,315 17%Household products 9,359 8,908 451 5%Hand cleaners — 18 (18) (100)%
Sub-total $79,101 $68,353 $10,748 16%
% of consolidated 28% 26%
For the fiscal year ended August 31, 2006, sales in Europe grew to $79.1 million, up $10.7 million, or 16%, oversales in the prior fiscal year. Changes in foreign currency exchange rates compared to the same prior fiscal yearpartially offset the growth of sales. Fiscal year 2006 results translated at last fiscal year’s exchange rates wouldhave produced sales of $82.0 million in this region. Thus, the impact of the change in foreign currency exchangerates year over year negatively affected the current fiscal year sales by approximately $2.9 million, or 4%.
The countries where the Company sells through a direct sales force include the U.K, Spain, Portugal, Italy, France,Germany, the Netherlands, Denmark, Austria and Switzerland. Sales from these countries increased 15% in fiscal year2006 versus fiscal year 2005. Sales from these countries also accounted for 71% of the region’s sales in both fiscalyear 2006 and 2005. Percentage increases in sales in U.S. dollars across the various parts of the region over the priorfiscal year are as follows: the U.K., 11%; France, 16%; the German sales region, 23%; Spain/Portugal, 7%; and Italy,21%. In the long term, the number of countries where the Company sells through a direct sales force is expected toincrease, and these direct sales markets are expected to continue to be important contributors to the region’s growth.
25
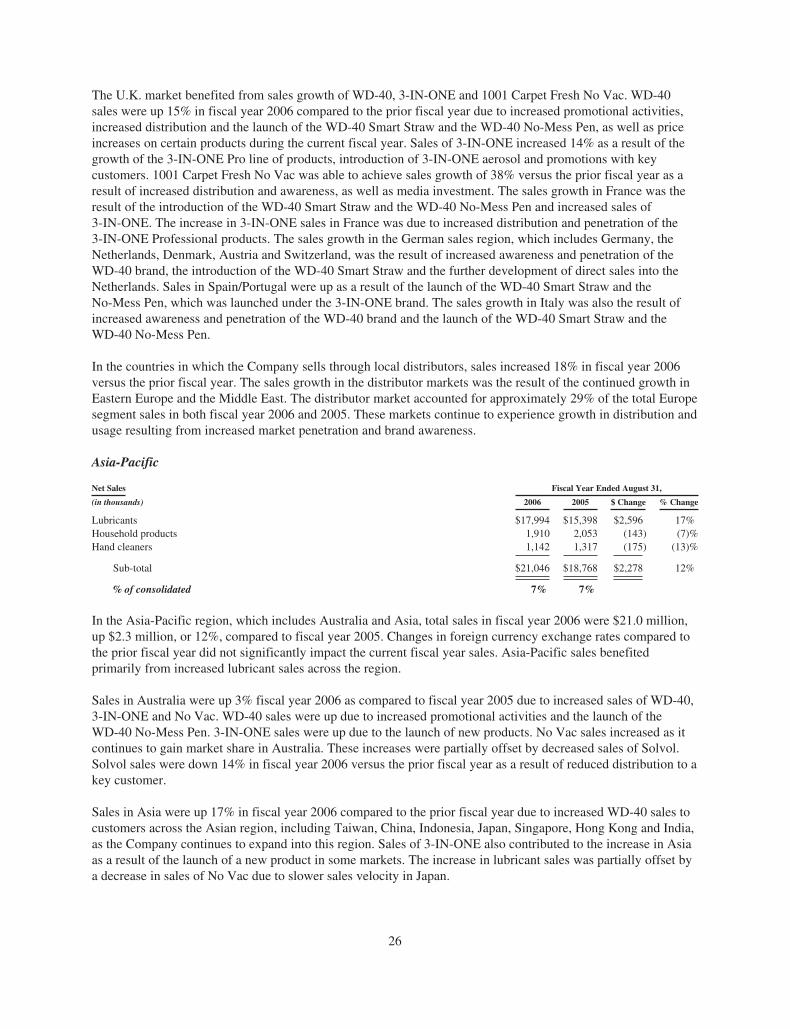
The U.K. market benefited from sales growth of WD-40, 3-IN-ONE and 1001 Carpet Fresh No Vac. WD-40sales were up 15% in fiscal year 2006 compared to the prior fiscal year due to increased promotional activities,increased distribution and the launch of the WD-40 Smart Straw and the WD-40 No-Mess Pen, as well as priceincreases on certain products during the current fiscal year. Sales of 3-IN-ONE increased 14% as a result of thegrowth of the 3-IN-ONE Pro line of products, introduction of 3-IN-ONE aerosol and promotions with keycustomers. 1001 Carpet Fresh No Vac was able to achieve sales growth of 38% versus the prior fiscal year as aresult of increased distribution and awareness, as well as media investment. The sales growth in France was theresult of the introduction of the WD-40 Smart Straw and the WD-40 No-Mess Pen and increased sales of3-IN-ONE. The increase in 3-IN-ONE sales in France was due to increased distribution and penetration of the3-IN-ONE Professional products. The sales growth in the German sales region, which includes Germany, theNetherlands, Denmark, Austria and Switzerland, was the result of increased awareness and penetration of theWD-40 brand, the introduction of the WD-40 Smart Straw and the further development of direct sales into theNetherlands. Sales in Spain/Portugal were up as a result of the launch of the WD-40 Smart Straw and theNo-Mess Pen, which was launched under the 3-IN-ONE brand. The sales growth in Italy was also the result ofincreased awareness and penetration of the WD-40 brand and the launch of the WD-40 Smart Straw and theWD-40 No-Mess Pen.
In the countries in which the Company sells through local distributors, sales increased 18% in fiscal year 2006versus the prior fiscal year. The sales growth in the distributor markets was the result of the continued growth inEastern Europe and the Middle East. The distributor market accounted for approximately 29% of the total Europesegment sales in both fiscal year 2006 and 2005. These markets continue to experience growth in distribution andusage resulting from increased market penetration and brand awareness.
Asia-Pacific
Net Sales Fiscal Year Ended August 31,
(in thousands) 2006 2005 $ Change % Change
Lubricants $17,994 $15,398 $2,596 17%Household products 1,910 2,053 (143) (7)%Hand cleaners 1,142 1,317 (175) (13)%
Sub-total $21,046 $18,768 $2,278 12%
% of consolidated 7% 7%
In the Asia-Pacific region, which includes Australia and Asia, total sales in fiscal year 2006 were $21.0 million,up $2.3 million, or 12%, compared to fiscal year 2005. Changes in foreign currency exchange rates compared tothe prior fiscal year did not significantly impact the current fiscal year sales. Asia-Pacific sales benefitedprimarily from increased lubricant sales across the region.
Sales in Australia were up 3% fiscal year 2006 as compared to fiscal year 2005 due to increased sales of WD-40,3-IN-ONE and No Vac. WD-40 sales were up due to increased promotional activities and the launch of theWD-40 No-Mess Pen. 3-IN-ONE sales were up due to the launch of new products. No Vac sales increased as itcontinues to gain market share in Australia. These increases were partially offset by decreased sales of Solvol.Solvol sales were down 14% in fiscal year 2006 versus the prior fiscal year as a result of reduced distribution to akey customer.
Sales in Asia were up 17% in fiscal year 2006 compared to the prior fiscal year due to increased WD-40 sales tocustomers across the Asian region, including Taiwan, China, Indonesia, Japan, Singapore, Hong Kong and India,as the Company continues to expand into this region. Sales of 3-IN-ONE also contributed to the increase in Asiaas a result of the launch of a new product in some markets. The increase in lubricant sales was partially offset bya decrease in sales of No Vac due to slower sales velocity in Japan.
26

The Asian region represents important long-term growth potential for the Company. Because of this potential,the Company will begin direct operations in China during fiscal year 2007 to help accelerate the growth of themarkets in this region.
The Company continues to combat counterfeit products, which remain an issue within the Asian market,particularly in China. In fiscal year 2004, the Company released a uniquely shaped WD-40 can into the market inChina and has introduced this style of packaging across all of Asia. Although there have been attempts tocounterfeit the shaped can, this packaging reduces the ability of counterfeiters to imitate the Company’s products.
Year Ended August 31, 2005 Compared with the Year Ended August 31, 2004
Net Sales
Net Sales by Segment Fiscal Year Ended August 31,
(in thousands) 2005 2004 $ Change % Change
Americas $176,106 $166,142 $ 9,964 6%Europe 68,353 57,703 10,650 18%Asia-Pacific 18,768 18,622 146 1%
Total net sales $263,227 $242,467 $20,760 9%
Please refer to the discussion under “Segment Results” included later in this section for further detailed results bysegment. Changes in foreign currency exchange rates compared to fiscal year 2004 contributed to the growth ofthe Company’s sales. Fiscal year 2005 results translated at fiscal year 2004 exchange rates would have producedsales of $259.9 million, thus, the impact of the change in foreign currency exchange rates year over yearpositively affected fiscal year 2005 sales by $3.4 million, or 1%.
Net Sales by Product Line Fiscal Year Ended August 31,
(in thousands) 2005 2004 $ Change % Change
Lubricants $174,084 $157,911 $16,173 10%Household products 82,237 77,913 4,324 6%Hand cleaners 6.906 6,643 263 4%
Total net sales $263,227 $242,467 $20,760 9%
By product line, sales of lubricants include WD-40 and 3-IN-ONE; hand cleaner sales include Lava and Solvol;and sales of household products include Carpet Fresh, No Vac, X-14, 2000 Flushes, Spot Shot and 1001. Sales of1001 contributed $8.9 million during the fiscal year ended August 31, 2005. The 1001 brand was acquired inApril 2004 and contributed $3.2 million to sales in fiscal year 2004.
Gross Profit
Gross profit was $129.4 million, or 49.2% of sales in fiscal year 2005, compared to $125.5 million, or 51.8% ofsales in fiscal year 2004. The 2.6% decrease in the gross margin percentage for the fiscal year ended August 31,2005 versus the fiscal year ended August 31, 2004 was attributable to the increase in cost of products sold. Theincrease in cost of products negatively affected gross margins in all of the Company’s regions. This increase wasprimarily due to the significant rise in costs for components and raw materials, including aerosol cans andpetroleum-based products.
To reduce the impact of these rising costs, the Company implemented a plan to increase prices for some of itsproducts; the majority of such price increases were implemented in the third quarter of fiscal year 2005. Theincrease in pricing of certain products worldwide added approximately 0.8% to gross margin percentage in fiscalyear 2005 compared to fiscal year 2004.
27

The price increases are intended to reduce the effect of rising costs on gross margin percentage; however, furtherrises in the cost of products could offset the benefits of the price increases. In addition, shifts in product mix aswell as the timing of certain promotional activities could also cause fluctuations in gross margin percentage fromperiod to period.
Note that the Company’s gross margins may not be comparable to those of other reporting entities, since someentities include all costs related to distribution of their products in cost of products sold, whereas we exclude theportion associated with amounts paid to third parties for distribution to our customers from our contractpackagers, and include these costs in selling, general and administrative expenses.
Selling, General and Administrative Expenses
Selling, general and administrative expenses (SG&A) for fiscal year 2005 increased to $63.5 million from $58.3million for fiscal year 2004. The increase in SG&A was attributable to a number of items including: $0.8 millionrelated to increased foreign currency exchange rates; $1.7 million of increased freight due to fuel surcharges, achange in customer purchase patterns which increased the frequency of shipments, but in smaller quantities, andsales growth; $2.0 million of increased employee-related costs which include salaries, profit sharing and otherfringe benefits; $0.7 million of increased miscellaneous expenses such as travel, office expenses and amortizationand depreciation; $0.6 million of increased research and development costs related to increased new productdevelopment activity; $0.3 million of increased expenses primarily due to a preference claim associated with thebankruptcy of a customer; and $0.4 million of increased professional services. Costs incurred for Sarbanes-Oxleycompliance also continued to rise over the high costs incurred during fiscal year 2004 in areas such as employee-related costs, miscellaneous expenses and professional services. These increases were partially offset by $1.3million of decreased sales commissions, insurance costs, investor relations costs and meeting and other expenses.
The Company continued its research and development investment in support of its focus on innovation. Researchand development costs in fiscal year 2005 were $2.5 million compared to $1.9 million in fiscal year 2004. TheCompany’s new-product development team, known as Team Tomorrow, engages in consumer research, productdevelopment, current product improvement and testing activities. This team leverages its developmentcapabilities by partnering with a network of outside resources including the Company’s current and prospectiveoutsource suppliers.
As a percentage of sales, SG&A was 24.1% in fiscal year 2005 and 24.0% in fiscal year 2004.
Advertising and Sales Promotion Expenses
Advertising and sales promotion expenses decreased to $17.9 million in fiscal year 2005, down from $21.5million in fiscal year 2004, and as a percentage of sales, decreased to 6.8% in fiscal year 2005 from 8.9% infiscal year 2004. The decrease is mainly related to reduced spending for print media and television media in theU.S., partially offset by increased television media spending in Europe. Advertising spending in the U.S. wasreduced after the first quarter fiscal year 2005 due to declines in consumer response to certain traditionaladvertising programs. Throughout the remainder of fiscal year 2005, the Company performed testing of newmarketing programs and reevaluated the market dynamics and its strategies to determine which programs wouldbe the most effective.
As a percentage of sales, advertising and sales promotion expenses may fluctuate period to period based upon thetype of marketing activities employed by the Company, as the costs of certain promotional activities are requiredto be recorded as reductions to sales, and others remain in advertising and sales promotion expenses. In fiscalyear 2005, the total promotional costs recorded as reductions to sales were $18.8 million versus $20.2 million infiscal year 2004. Therefore, the Company’s total advertising and sales promotion expenses totaled $36.7 millionin fiscal year 2005 versus $41.7 million in fiscal year 2004.
28

Amortization of Intangible Asset Expense
Amortization of intangible asset expense was $552,000 in fiscal year 2005, compared to $224,000 in fiscal year2004. The amortization relates to the non-contractual customer relationships intangible asset acquired in the 1001acquisition, which was completed in April 2004. This intangible asset is being amortized over its eight-year life.
Income from Operations
Income from operations was $47.4 million, or 18.0% of sales in fiscal year 2005, compared to $45.4 million, or18.7% of sales in fiscal year 2004. The decrease in income from operations as a percentage of sales was due tothe items discussed above.
Interest Expense, net
Interest expense, net was $5.1 million and $6.4 million for the fiscal years ended August 31, 2005 and 2004,respectively. The change in interest expense, net was primarily due to reduced principal balance on long-termborrowings resulting from two $10 million principal payments, which were made in May 2004 and 2005,respectively. Interest income related to refunds from amended federal tax returns also contributed to thereduction in interest expense, net.
Other Income / Expense, net
Other income, net was $0.6 million in fiscal 2005, compared to other expense, net of $0.2 million in fiscal year2004, an increase of $0.8 million, which was due to increased foreign currency exchange gains.
Provision for Income Taxes
The provision for income taxes was 35.15% of taxable income in fiscal 2005, an increase from 34.00% in fiscalyear 2004. The increase in tax rate was due to the impact of reduced low-income housing credits, the growth ofworldwide income and the reduction of Extraterritorial Income (ETI) benefits.
Net Income
Net income was $27.8 million, or $1.65 per common share on a fully diluted basis for the fiscal year endedAugust 31, 2005, compared to $25.6 million, or $1.50 per common share for the fiscal year ended August 31,2004. The change in foreign currency exchange rates year over year had a positive impact of $0.4 million onfiscal year 2005 net income.
Segment Results
Following is a discussion of sales by region for the fiscal years ended August 31, 2005 and 2004.
Americas
Net Sales Fiscal Year Ended August 31,
(in thousands) 2005 2004 $ Change % Change
Lubricants $ 99,259 $ 86,983 $12,276 14%Household products 71,276 73,757 (2,481) (3)%Hand cleaners 5,571 5,402 169 3%
Sub-total $176,106 $166,142 $ 9,964 6%
% of consolidated 67% 69%
29

The increase in lubricant sales in the Americas in fiscal year 2005 compared to fiscal year 2004 relates to thegrowth in WD-40 sales across the U.S., Canada and Latin America, where sales increased by 17%, 9% and 13%,respectively. Price increases implemented during the fiscal year 2005 third quarter on certain products alsocontributed to the sales growth. In the U.S., WD-40 sales were up due to improved display and distributionthrough home centers, the success of the WD-40 Big Blast and the launch of the WD-40 Smart Straw and theWD-40 No-Mess Pen. The WD-40 Big Blast was introduced in the second quarter of fiscal 2004, and the WD-40Smart Straw and the WD-40 No-Mess Pen were introduced in the third and fourth quarters of fiscal year 2005,respectively. Growth in Latin America was primarily due to strong results in Mexico, Puerto Rico, the Caribbeanand Central America, associated with increased promotional activity and new distribution. The Latin Americaregion also benefited from a more stable political and economic environment versus previous years. Canadiansales benefited from strong sales in all trade channels, as well as strong promotional execution during fiscal year2005, partially offset by decreased sales as a result of reduced promotional activities by a key customer. Theincreases in WD-40 sales were partially offset by a 10% decline in 3-IN-ONE sales in the U.S. as compared tofiscal year 2004. This decline was also a result of reduced promotional activities by a key home center customer.
Household product sales in fiscal year 2005 were down by $2.5 million, or 3%, compared to fiscal year 2004 dueto declines in the U.S. Sales in the U.S. decreased by $2.4 million, or 3%, due to decreased sales of Spot Shot andCarpet Fresh. These declines were the result of several factors, including competitor activity, changes tocustomer-specific programs, lost or decreased distribution compared to fiscal year 2004 and the effects of othercompetitive factors within and among their product categories that are further described below. The Company’shousehold brands continue to experience significant competition within their categories and in related categories.
Spot Shot sales declined 11% in fiscal year 2005 as compared to fiscal year 2004 due to heightened competitiveactivity and customer sales testing, partially offset by sales from new products, Spot Shot Pro and Spot Shot witha trigger format, during the fiscal year 2005 fourth quarter. During fiscal year 2005, certain customers continuedto perform on-going head-to-head sales testing versus competitor products. Although Spot Shot was successfulversus the competitor products and maintained distribution, this sales testing process caused sales to be lowerthan fiscal year 2004. Overall, Spot Shot continues to outperform new entrants as well as established products onthe shelf. The Company has committed research and development resources to create meaningful innovation forthe Spot Shot brand, including Spot Shot Pro and Spot Shot with a trigger format. Spot Shot Pro is an aerosolcarpet stain remover targeted to frequent and commercial users, and the new Spot Shot product with a triggerdelivery format is a liquid carpet stain remover. Both of these new products also provide innovation through anodor neutralizing formula.
Within the past two years, retailers have reduced shelf space for traditional rug and room deodorizers forreallocation to other air care products. As a result, the rug and room deodorizer category as a whole has declinedin the mass retail and grocery trade channels. Sales of Carpet Fresh in the U.S. declined 15% in fiscal year 2005due to lost distribution with a key customer, competitive activity within and around the category and the effectsfrom reallocation of shelf space. In an effort to offset some of these losses, the Company responded with a morecompetitive product offer in size and value. New powder fragrance introductions also helped grow powder salesversus fiscal year 2004. Despite these general trends in the rug and room deodorizer and air care categories, theCarpet Fresh brand gained market share within the rug and room deodorizer category in the grocery tradechannel. In addition, the Company expanded distribution through new channels, which resulted in sales growth inthe fourth quarter of fiscal year 2005. The Company continues to refine its marketing, promotions and pricingstrategies, and has committed research and development resources to create innovation for the Carpet Freshbrand.
Despite the significant competition within the household brands category, the Company was still able to achievesales growth for two of its brands in fiscal year 2005 versus fiscal year 2004. U.S. sales of 2000 Flushes/X-14automatic toilet bowl cleaners were up 3% in fiscal year 2005 compared to fiscal year 2004 due to the sales ofthe 2000 Flushes clip-on product which was introduced during the second quarter of fiscal year 2004.
30
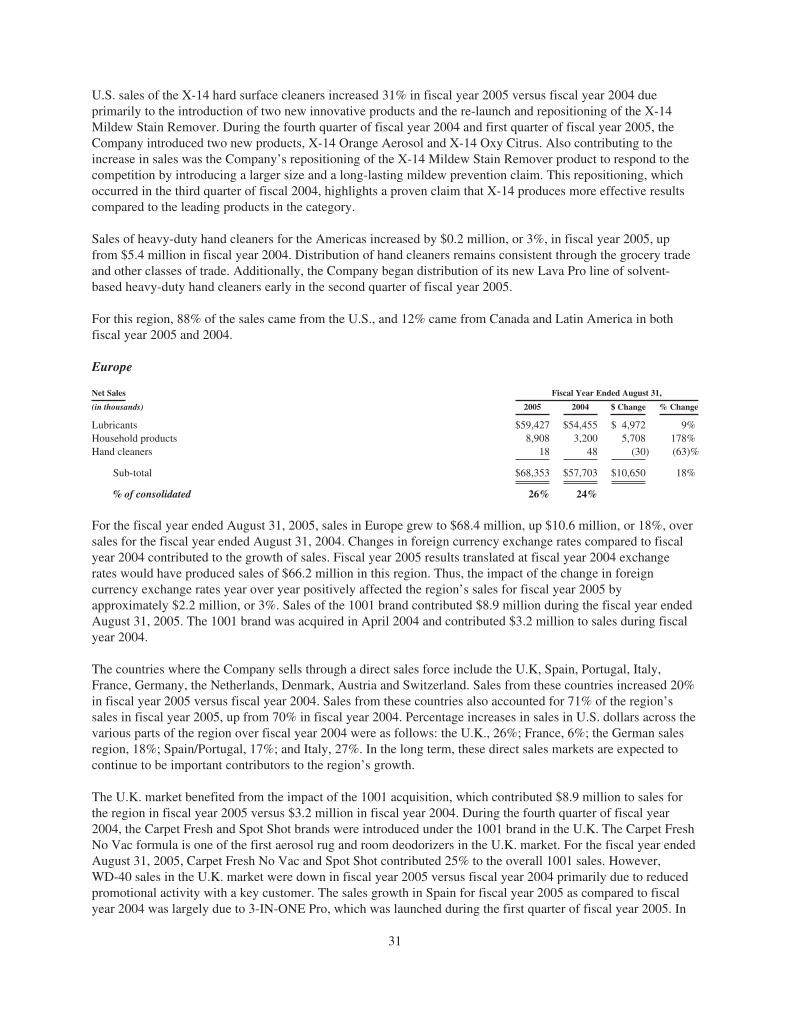
U.S. sales of the X-14 hard surface cleaners increased 31% in fiscal year 2005 versus fiscal year 2004 dueprimarily to the introduction of two new innovative products and the re-launch and repositioning of the X-14Mildew Stain Remover. During the fourth quarter of fiscal year 2004 and first quarter of fiscal year 2005, theCompany introduced two new products, X-14 Orange Aerosol and X-14 Oxy Citrus. Also contributing to theincrease in sales was the Company’s repositioning of the X-14 Mildew Stain Remover product to respond to thecompetition by introducing a larger size and a long-lasting mildew prevention claim. This repositioning, whichoccurred in the third quarter of fiscal 2004, highlights a proven claim that X-14 produces more effective resultscompared to the leading products in the category.
Sales of heavy-duty hand cleaners for the Americas increased by $0.2 million, or 3%, in fiscal year 2005, upfrom $5.4 million in fiscal year 2004. Distribution of hand cleaners remains consistent through the grocery tradeand other classes of trade. Additionally, the Company began distribution of its new Lava Pro line of solvent-based heavy-duty hand cleaners early in the second quarter of fiscal year 2005.
For this region, 88% of the sales came from the U.S., and 12% came from Canada and Latin America in bothfiscal year 2005 and 2004.
Europe
Net Sales Fiscal Year Ended August 31,
(in thousands) 2005 2004 $ Change % Change
Lubricants $59,427 $54,455 $ 4,972 9%Household products 8,908 3,200 5,708 178%Hand cleaners 18 48 (30) (63)%
Sub-total $68,353 $57,703 $10,650 18%
% of consolidated 26% 24%
For the fiscal year ended August 31, 2005, sales in Europe grew to $68.4 million, up $10.6 million, or 18%, oversales for the fiscal year ended August 31, 2004. Changes in foreign currency exchange rates compared to fiscalyear 2004 contributed to the growth of sales. Fiscal year 2005 results translated at fiscal year 2004 exchangerates would have produced sales of $66.2 million in this region. Thus, the impact of the change in foreigncurrency exchange rates year over year positively affected the region’s sales for fiscal year 2005 byapproximately $2.2 million, or 3%. Sales of the 1001 brand contributed $8.9 million during the fiscal year endedAugust 31, 2005. The 1001 brand was acquired in April 2004 and contributed $3.2 million to sales during fiscalyear 2004.
The countries where the Company sells through a direct sales force include the U.K, Spain, Portugal, Italy,France, Germany, the Netherlands, Denmark, Austria and Switzerland. Sales from these countries increased 20%in fiscal year 2005 versus fiscal year 2004. Sales from these countries also accounted for 71% of the region’ssales in fiscal year 2005, up from 70% in fiscal year 2004. Percentage increases in sales in U.S. dollars across thevarious parts of the region over fiscal year 2004 were as follows: the U.K., 26%; France, 6%; the German salesregion, 18%; Spain/Portugal, 17%; and Italy, 27%. In the long term, these direct sales markets are expected tocontinue to be important contributors to the region’s growth.
The U.K. market benefited from the impact of the 1001 acquisition, which contributed $8.9 million to sales forthe region in fiscal year 2005 versus $3.2 million in fiscal year 2004. During the fourth quarter of fiscal year2004, the Carpet Fresh and Spot Shot brands were introduced under the 1001 brand in the U.K. The Carpet FreshNo Vac formula is one of the first aerosol rug and room deodorizers in the U.K. market. For the fiscal year endedAugust 31, 2005, Carpet Fresh No Vac and Spot Shot contributed 25% to the overall 1001 sales. However,WD-40 sales in the U.K. market were down in fiscal year 2005 versus fiscal year 2004 primarily due to reducedpromotional activity with a key customer. The sales growth in Spain for fiscal year 2005 as compared to fiscalyear 2004 was largely due to 3-IN-ONE Pro, which was launched during the first quarter of fiscal year 2005. In
31

local currency, sales in France were flat. WD-40 sales were down due to a change in the purchasing patterns of akey customer. This decline was offset by the continued launch of 3-IN-ONE Pro during fiscal year 2005. Thesales growth in Italy was the result of increased awareness and penetration of the WD-40 brand, as well as thebenefit of additional sales staff as compared to fiscal year 2004. The sales growth in the German sales region,which includes Germany, the Netherlands, Denmark, Austria and Switzerland, was also the result of increasedawareness and penetration of the WD-40 brand, in addition to the further development of direct sales into theNetherlands.
In the countries in which the Company sells through local distributors, sales increased 14% in fiscal year 2005versus fiscal year 2004. The distributor market increased sales by $2.5 million as a result of growth in the MiddleEast and Eastern Europe. The distributor market accounted for approximately 29% of the total Europe segment salesin fiscal year 2005 compared to 30% in fiscal year 2004 as a result of the 1001 acquisition in the third quarter offiscal year 2004, which increased the total sales of the European direct markets. These markets continue toexperience growth in distribution and usage resulting from increased market penetration and brand awareness.
Asia-Pacific
Net Sales Fiscal Year Ended August 31,
(in thousands) 2005 2004 $ Change % Change
Lubricants $15,398 $16,473 $(1,075) (7)%Household products 2,053 958 1,095 114%Hand cleaners 1,317 1,191 126 11%
Sub-total $18,768 $18,622 $ 146 1%
% of consolidated 7% 8%
In the Asia-Pacific region, which includes Australia and Asia, total sales for fiscal year 2005 were $18.8 million,up $0.1 million, or 1%, compared to fiscal year 2004. Changes in foreign currency exchange rates compared tofiscal year 2004 contributed $0.3 million to fiscal year 2005 sales. The fiscal year 2005 results translated at fiscalyear 2004 exchange rates would have produced sales of $18.4 million in this region. Asia-Pacific sales benefitedfrom the increased market penetration of No Vac rug and room deodorizers, which were launched in Australiaand parts of Asia during the third quarter of fiscal year 2004. Also contributing to Asia-Pacific sales was thelaunch of the Solvol Citrus Bar in Australia during the first quarter of fiscal year 2005. WD-40 sales alsoincreased in Australia; however, these sales increases were largely offset by a decline in WD-40 sales in Asia.
Sales in Asia were down 10% in fiscal year 2005 as compared to fiscal year 2004 due to decreased WD-40 salesresulting from slower sales caused by increased prices in primary markets including China, Taiwan andMalaysia. The decrease in lubricant sales was slightly offset by the growth of No Vac.
Sales in Australia were up 27% in fiscal year 2005 versus fiscal year 2004 primarily due to increased sales of NoVac rug and room deodorizers, as distribution and market share continues to grow. No Vac sales representedapproximately 26% of total fiscal year 2005 sales in Australia. Sales of lubricants in Australia also increased infiscal year 2005 as compared to fiscal year 2004. Lubricant sales benefited from promotions with a large homecenter retailer. Sales of hand cleaners increased compared to fiscal year 2004 as a result of the launch of theSolvol Citrus Bar during the first quarter of fiscal year 2005.
The Company continues to combat counterfeit products, which remain an issue within the Asian market,particularly in China. In fiscal year 2004, the Company released a uniquely shaped WD-40 can into the market inChina and has introduced this style of packaging across all of Asia. Although there have been attempts tocounterfeit the shaped can, this packaging reduces the ability of counterfeiters to imitate the Company’s products.
32
LIQUIDITY AND CAPITAL RESOURCES
As of August 31, 2006, the Company had $64.3 million remaining on an original $75 million, 7.28% fixed-rateterm loan. The loan matures in 2011, with the second principal payment of $10.7 million having been made afterthe close of the fiscal year on October 18, 2006, and subsequent payments in similar amounts due eachOctober 18th for five years thereafter. During the first quarter of fiscal year 2006, the Company also had a $10million revolving line of credit with no outstanding balance. This revolving line of credit matured in October2005. In consideration of the balance of cash on hand, and in an effort to reduce fees associated with maintainingan available line of credit, the Company did not renew the line of credit.
Under the fixed-rate term loan, the Company is required to maintain minimum consolidated net worth greaterthan the sum of $57 million plus 25% of consolidated net income for each fiscal quarter beginning with the firstfiscal quarter of 2002, plus proceeds of all equity securities other than those issued under the employee stockoption plan.
A consolidated fixed charge coverage ratio greater than 1.20:1.00 on the last day of any fiscal quarter must bemaintained. The Company is also limited to a maximum ratio of funded debt to earnings before interest, taxes,depreciation and amortization (EBITDA) of 2.25 to 1.00.
This facility also limits the Company’s ability, without prior approval from the Company’s lenders, to incuradditional unsecured indebtedness, sell, lease or transfer assets, place liens on properties, complete certainacquisitions, mergers or consolidations, enter into guarantee obligations, enter into related party transactions andmake certain loan advances and investments.
The events of default under the credit facility include the following:
• Failure to pay principal or interest when due
• Failure to comply with covenants, representations or warranties, terms or conditions under the creditagreements
• Commencing any proceeding for bankruptcy, insolvency, reorganization, dissolution or liquidation
• The sale, transfer, abandonment, forfeiture or disposal of the WD-40 trademark or any other trademarkused in a material product line
The Company is in compliance with all debt covenants as required by the credit facility.
The Company’s cash balance has not been used to prepay the term loan due to certain prepayment penaltiesunder the loan agreements.
The Company’s primary source of funds is cash flow from operations, which is expected to provide sufficientfunds to meet both short and long-term operating needs, as well as future dividends, which are determined on aquarterly basis.
For the fiscal year ended August 31, 2006, cash and cash equivalents increased by $8.1 million, from $37.1million at the end of fiscal year 2005 to $45.2 million at August 31, 2006. Operating cash flow of $28.2 millionwas offset by cash used in investing activities of $2.6 million and cash used in financing activities of $18.0million.
Current assets increased by $14.3 million to $115.5 million at August 31, 2006, up from $101.2 million atAugust 31, 2005. Inventory increased to $15.3 million, up by $7.2 million from $8.0 million at August 31, 2005
33

due to inventory acquired to enhance the effectiveness of the Company’s supply chain and to support newproduct introductions and promotions, primarily the WD-40 No-Mess Pen and the WD-40 Smart Straw. As aresult of recent product introductions, the Company has expanded its supplier base, which has required theCompany to carry higher levels of inventory. This represents a shift from our historical contract manufacturermodel that had allowed the Company to carry minimal levels of inventory. Under the historical contractmanufacturer model, the Company acquires products upon sales to customers, thus reducing the need to carryinventory. Inventory has also increased as a result of the Company now acquiring certain finished goods directlyfrom manufacturers. Previously, these products had been acquired from a distributor who had acquired them onbehalf of the Company. Product held at contract packagers decreased to $1.4 million, down from $1.8 million atAugust 31, 2005 due to timing. Other current assets decreased by $1.9 million to $4.9 million at August 31, 2006,down from $6.8 million at August 31, 2005 due to decreased federal income taxes receivable as a result of anI.R.S. audit of amended tax returns. The I.R.S. audit resulted in a reduced amount of expected taxes receivable aswell as a corresponding increase in current deferred tax assets.
Current liabilities were $43.7 million at August 31, 2006, down from $46.7 million at August 31, 2005. Accountspayable and accrued liabilities decreased by $6.2 million due to a reduction in accrued advertising expenses,timing of payments and lower sales levels in August of fiscal year 2006 compared to August of fiscal year 2005.Accrued payroll and related expenses were up $3.7 million due to an increase in bonus accrual and profit sharingaccrual. Income taxes payable decreased $0.4 million due to the timing of payments for federal income taxes.
At August 31, 2006, working capital increased to $71.9 million, up $17.4 million from $54.5 million at the end offiscal year 2005. The current ratio was 2.6 at August 31, 2006, up from 2.2 at August 31, 2005.
Net cash provided by operating activities for the fiscal year ended August 31, 2006 was $28.2 million. Thisamount consisted of $28.1 million from net income with an additional $6.3 million of adjustments for non-cashitems, including depreciation and amortization, gains on sales of equipment, deferred income tax expense, excesstax benefits from exercises of stock options, distributions received and equity losses from VML Company L.L.C.(VML) and stock-based compensation partially offset by $6.2 million related to changes in the working capital asdescribed above and changes in other long-term liabilities.
Net cash used in investing activities for the fiscal year ended August 31, 2006 was $2.6 million. Capitalexpenditures of $2.9 million were primarily in the areas of machinery and equipment, computer hardware andsoftware, buildings and improvements, furniture and fixtures and vehicle replacements.
For fiscal year 2006, net cash used in financing activities included a $10.7 million principal payment on debt inOctober 2005 and $14.8 million of dividend payments, partially offset by $7.0 million in proceeds from theexercise of common stock options and $0.5 million of excess tax benefits from exercises of stock options. The$10.7 million payment on debt was the first principal payment on the Company’s original $75 million, 7.28%fixed-rate term loan.
Management believes the Company has access to sufficient capital through the combination of available cashbalances and internally generated funds. Management considers various factors when reviewing liquidity needsand plans for available cash on hand including: future debt principal and interest payments, early debt repaymentpenalties, future capital expenditure requirements, future dividend payments (which are determined on aquarterly basis by the Company’s Board of Directors), alternative investment opportunities, loan covenants andany other relevant considerations currently facing the business.
On October 6, 2006, the Company’s Board of Directors declared a cash dividend of $0.22 per share payable onOctober 31, 2006 to shareholders of record on October 17, 2006. The Company’s ability to pay dividends couldbe affected by future business performance, liquidity, capital needs, alternative investment opportunities and loancovenants.
34

The following schedule summarizes the Company’s contractual obligations and commitments to make futurepayments as of August 31, 2006:
Contractual Obligations: Payments Due by Period
Total 1 year 2-3 years 4-5 years After 5 years
Long-term debt $64,286,000 $10,714,000 $21,428,000 $21,428,000 $10,716,000Interest payments on long-term debt 12,870,000 4,095,000 5,850,000 2,730,000 195,000Operating leases 2,585,000 1,327,000 1,094,000 164,000 —Marketing commitments 844,000 422,000 422,000 — —
Total contractual cash obligations $80,585,000 $16,558,000 $28,794,000 $24,322,000 $10,911,000
The following summarizes other commercial commitments as of August 31, 2006:
• The Company has relationships with various suppliers (contract manufacturers) who manufacture theCompany’s products. Although the Company does not have any definitive minimum purchaseobligations included in the contract terms with contract manufacturers, supply needs are communicatedand the Company is committed to purchase the products produced based on sales forecasts provided tothe contract manufacturers, ranging from two to five months.
• As of August 31, 2006, the Company has also committed to purchase finished goods and raw materialsof $2.2 million in fiscal year 2007; and $0.6 million in fiscal year 2008.
• The Company provides fixed retirement benefits to certain of its key executives under a supplementalemployee retirement plan. Under the plan, the Company is committed to pay benefits to current retireesof $141,000 in fiscal year 2007, $141,000 in fiscal year 2008, $84,000 in fiscal year 2009, $84,000 infiscal year 2010, $84,000 in fiscal year 2011 and $84,000, thereafter. Benefits payable to currentemployees vest upon retirement. As a result, the timing of payments is uncertain. However, theCompany has actuarially determined the present value of all future benefit payments to be $1.8 million.
STOCK-BASED COMPENSATION
Effective September 1, 2005, the Company began recording compensation expense associated with stock options inaccordance with SFAS No. 123R, “Share-Based Payment”. Prior to September 1, 2005, the Company accounted forstock-based compensation related to stock options under the recognition and measurement principles of AccountingPrinciples Board Opinion No. 25; therefore, the Company measured compensation expense for its stock option planusing the intrinsic value method, that is, as the excess, if any, of the fair market value of the Company’s stock at thegrant date over the amount required to be paid to acquire the stock, and provided the disclosures required by SFASNos. 123 and 148. The Company has adopted the modified prospective transition method provided under SFASNo. 123R, and as a result, has not retroactively adjusted results from prior periods. Under this transition method,compensation expense associated with stock options recognized in fiscal year 2006 includes: 1) expense related tothe remaining unvested portion of all stock option awards granted prior to September 1, 2005, based on the grantdate fair value estimated in accordance with the original provisions of SFAS No. 123; and 2) expense related to allstock option awards granted subsequent to September 1, 2005, based on the grant date fair value estimated inaccordance with the provisions of SFAS No. 123R.
The adoption of SFAS No. 123R also resulted in certain changes to the Company’s accounting for its restrictedstock awards, which is discussed in more detail in Note 11 - Stock-Based Compensation, included in the Notes toConsolidated Financial Statements under Part IV - Item 15.
As a result of the adoption of SFAS No. 123R, the Company’s net income for the fiscal year ended August 31,2006 includes an additional $1.8 million of compensation expense and an additional $0.5 million of income taxbenefits related to the Company’s stock-based compensation arrangements as compared to fiscal year 2005.
35

As of August 31, 2006, there was $1.4 million and $0.3 million of unamortized compensation costs related tonon-vested stock option awards and non-vested restricted stock awards, respectively. These costs are expected tobe recognized over weighted-average periods of 1.6 years and 3.7 years, respectively.
The Company continues to estimate the fair value of each option award on the date of grant using the Black-Scholes option valuation model with the assumptions described in Note 11 to the Consolidated FinancialStatements.
The Company has evaluated the potential use of other forms of long-term stock-based compensationarrangements. Currently, the Company expects to continue to grant stock options to employees and directors.However, as with all compensation arrangements, the granting of stock options is subject to periodic review.
Readers are also directed to refer to Note 11 - Stock-Based Compensation, included in the Notes to ConsolidatedFinancial Statements under Part IV - Item 15.
CRITICAL ACCOUNTING POLICIES
The Company’s results of operations and financial condition, as reflected in the Company’s consolidatedfinancial statements, have been prepared in accordance with accounting principles generally accepted in theUnited States of America. Preparation of financial statements requires management to make estimates andassumptions affecting the reported amounts of assets, liabilities, revenues and expenses and the disclosures ofcontingent assets and liabilities. Management uses historical experience and other relevant factors whendeveloping estimates and assumptions. These estimates and assumptions are continually evaluated. Note 1 to theCompany’s consolidated financial statements includes a discussion of significant accounting policies. Theaccounting policies discussed below are the ones management considers critical to an understanding of theCompany’s consolidated financial statements because their application places the most significant demands onour judgment. The Company’s financial results may have been different if different assumptions had been usedor other conditions had prevailed. The Company’s critical accounting policies have been reviewed with the AuditCommittee of the Board of Directors.
Revenue Recognition
Sales are recognized as revenue at the time of delivery to the customer when risk of loss and title pass.Management must make judgments and certain assumptions in the determination of when delivery occurs.Through an analysis of end of period shipments, the Company determines an average time of transit that is usedto estimate the time of delivery. Differences in judgments or estimates, such as the lengthening or shortening ofthe estimated delivery time used, could result in material differences in the timing of revenue recognition. Salesare recorded net of allowances for damaged goods returns, trade promotions, coupons and cash discounts.
Accounting for Sales Incentives
The Company records sales incentives as a reduction of sales in its income statement. The Company offerson-going trade promotion programs with customers, and consumer coupon programs that require the Company toestimate and accrue the expected costs of such programs. Programs include cooperative marketing programs,shelf price reductions, coupons, rebates, consideration and allowances given to retailers for space in their stores,consideration and allowances given to obtain favorable display positions in the retailers’ stores and otherpromotional activity. Costs related to rebates, co-operative advertising and other promotional activity arerecorded upon delivery of products to customers. Costs related to coupon offers are based upon historicalredemption rates and are recorded as incurred, when coupons are circulated.
Estimated sales incentives are calculated and recorded at the time related sales are made and are based primarilyon historical rates and consideration of recent promotional activities. The determination of sales incentive
36
liabilities requires the Company to use judgment for estimates that include current and past trade-promotionspending patterns, status of trade-promotional activities and the interpretation of historical spending trends bycustomer and category. We review our assumptions and adjust our reserves quarterly. Our financial statementscould be materially impacted if the actual promotion rates fluctuate from the estimated rate. If the Company’saccrual estimates for sales incentives at August 31, 2006 were to differ by 10%, the impact on net sales would beapproximately $0.5 million.
Allowance for Doubtful Accounts
The preparation of financial statements requires our management to make estimates and assumptions relating tothe collectibility of our accounts receivable. Management specifically analyzes historical bad debts, customercredit worthiness, current economic trends and changes in our customer payment terms when evaluating theadequacy of the allowance for doubtful accounts.
Accounting for Income Taxes
Current income tax expense is the amount of income taxes expected to be payable for the current year. Adeferred income tax liability or asset is established for the expected future tax consequences resulting from thedifferences in financial reporting and tax bases of assets and liabilities. A valuation allowance is provided if it ismore likely than not that some or all of the deferred tax assets will not be realized.
The Company establishes accruals for certain tax contingencies when, despite the belief that the Company’s taxreturn positions are fully supported, the Company believes that certain positions may not be fully sustained uponchallenge by relevant tax authorities. The tax contingency accruals are adjusted in light of changing facts andcircumstances, such as the progress of tax audits, case law and emerging legislation. The Company’s taxcontingency accruals are reflected as a component of income taxes payable.
U.S. income tax expense is provided on remittances of foreign earnings and on unremitted foreign earnings thatare not indefinitely reinvested. U.S. income taxes and foreign withholding taxes are not provided when foreignearnings are indefinitely reinvested in accordance with APB Opinion No. 23, “Accounting for Income Taxes,Special Areas.” The Company determines whether its foreign subsidiaries will invest their undistributed earningsindefinitely and reassesses this determination on a periodic basis. Change to the Company’s determination maybe warranted based on the Company’s experience as well as plans regarding future international operations andexpected remittances.
Valuation of Long-lived Assets, Intangible Assets and Goodwill
The Company assesses the potential impairment of long-lived assets, identifiable intangibles and related goodwillwhenever events or changes in circumstances indicate that the carrying value may not be recoverable. Forgoodwill and intangibles determined to have indefinite lives, impairment is tested at least annually under theguidance of SFAS No. 142, during our second fiscal quarter of each year unless there are indicators during aninterim period that assets may have become impaired. The Company’s impairment test is based on a discountedcash flow approach that requires significant management judgment and estimates, such as forecasted revenue,advertising and promotional expenses, cost of products sold, gross margins, operating margins, the success ofproduct innovations and introductions, customer retention and the selection of appropriate discount and royaltyrates. Management judgments and estimates are based on assumptions that are most reasonably likely to occur.For goodwill, impairment occurs when the carrying value of a reporting unit exceeds the fair value of thatreporting unit. For intangible assets, impairment occurs when the carrying value of an asset exceeds its fair value.In addition, intangible assets with indefinite lives are evaluated quarterly to determine whether events andcircumstances continue to support an indefinite useful life.
37

Events and circumstances that we consider important which could trigger impairment include the following:
• Significant underperformance relative to historical or projected future operating results
• Significant changes in the manner of our use of the acquired assets or the strategy for our overallbusiness
• Significant negative industry or economic trends
• Significant decline in our stock price for a sustained period
• Decreased market capitalization relative to net book value
• Unanticipated technological change or competitive activities
• Loss of key distribution
• Loss of key personnel
• Acts by government and courts
When there is indication that the carrying value of intangibles or long-lived assets may not be recoverable basedupon the existence of one or more of the above indicators, an impairment loss would be recognized if thecarrying amount of the asset exceeds its fair value. When there is an indication of impairment of goodwill, animpairment loss would be recognized to the extent that the carrying amount of the goodwill exceeds its impliedfair value.
During the second quarter of fiscal year 2006, the Company tested its goodwill and indefinite-lived intangibleassets for impairment based on future discounted cash flows compared to related book values. Based on thisreview, the Company determined that there were no instances of impairment.
RECENT ACCOUNTING PRONOUNCEMENTS
In September 2006, the Financial Accounting Standards Board (FASB) issued SFAS No. 157, “Fair ValueMeasurements”. SFAS No. 157 defines fair value, establishes a framework for measuring fair value and expandsdisclosures about fair value measurements. This statement is effective for financial statements issued for fiscalyears beginning after November 15, 2007, and interim periods within those fiscal years. The Company iscurrently evaluating SFAS No. 157 to determine the impact, if any, on its financial statements.
In June 2006, the FASB issued Interpretation No. 48 (FIN 48), “Accounting for Uncertainty in Income Taxes —an interpretation of FASB Statement No. 109.” FIN 48 clarifies the recognition threshold and measurementattribute for the financial statement recognition and measurement of a tax position taken or expected to be takenin a tax return. FIN 48 also provides guidance on derecognition, classification, interest and penalties, accountingin interim periods, disclosure and transition. FIN 48 is effective for fiscal years beginning after December 15,2006. The Company will adopt this interpretation as required. Management is currently assessing the effect thatFIN 48 will have on the Company’s results of operations, financial condition and liquidity.
In December 2004, the FASB issued FSP No. 109-1, “Application of FASB Statement No. 109, Accounting forIncome Taxes, to the Tax Deduction on Qualified Production Activities Provided by the American Jobs CreationAct of 2004.” FSP No. 109-1 states that qualified domestic production activities should be accounted for as aspecial deduction under SFAS No. 109, “Accounting for Income Taxes.” Any benefit from the deduction shouldbe reported in the period in which the deduction is claimed on the tax return. On May 24, 2006, the U.S. Treasury
38

Department issued the final regulations concerning the Tax Deduction on Qualified Production ActivitiesProvided by the American Jobs Creation Act of 2004. Based on the final regulations, the Company hascompleted its evaluation of the impact of Internal Revenue Code Section 199 provided by the Act and determinedthat the deduction, which will be included in the fiscal year 2006 tax return, resulted in a reduction ofapproximately one-half of one percent to the Company’s effective tax rate for fiscal year 2006.
In December 2004, the FASB issued FSP No. 109-2, “Accounting and Disclosure Guidance for the ForeignEarnings Repatriation Provision within the American Jobs Creation Act of 2004.” FSP No. 109-2 amends theexisting accounting literature that requires companies to record deferred taxes on foreign earnings, unless theyintend to indefinitely reinvest those earnings outside the U.S. This pronouncement temporarily allows companiesthat are evaluating whether to repatriate foreign earnings under the American Jobs Creation Act of 2004 to delayrecognizing any related taxes until that decision is made. This pronouncement also requires companies that areconsidering repatriating earnings to disclose the status of their evaluation and the potential amounts beingconsidered for repatriation. The Company completed its evaluation in the second quarter of fiscal year 2006 andforesees no benefit in the repatriation of foreign earnings. As a result, the Company will not be repatriatingearnings under the provisions of this act.
TRANSACTIONS WITH RELATED PARTIES
VML Company L.L.C. (VML), a Delaware Limited Liability Company, was formed in April 2001, at which timethe Company acquired a 30% membership interest. Since formation, VML has served as the Company’s contractmanufacturer for certain household products and acts as a warehouse distributor for other product lines of theCompany. Although VML has begun to expand its business to other customers, the Company continues to be itslargest customer. VML makes profit distributions to the Company and the 70% owner on a discretionary basis inproportion to each party’s respective interest.
The Company has a put option to sell its interest in VML to the 70% owner, and the 70% owner has a call optionto purchase the Company’s interest. The sale price in each case is established pursuant to formulas based onVML’s operating results.
Under Financial Interpretation No. 46, “Consolidation of Variable Interest Entities, an interpretation ofAccounting Research Bulletin No. 51,” VML qualifies as a variable interest entity, and it has been determinedthat the Company is not the primary beneficiary. The Company’s investment in VML is accounted for using theequity method of accounting, and its equity in VML earnings or losses is recorded as a component of cost ofproducts sold, as VML acts primarily as a contract manufacturer to the Company. The Company recorded equitylosses related to its investment in VML of $0.1 million for the fiscal year ended August 31, 2006, and equityearnings of $0.4 million and $0.5 million for the fiscal years ended August 31, 2005 and 2004, respectively.
The Company’s maximum exposure to loss as a result of its involvement with VML was $1.0 million as ofAugust 31, 2006. This amount represents the balance of the Company’s equity investment in VML, which ispresented as investment in related party on the Company’s consolidated balance sheets. The Company’sinvestment in VML as of August 31, 2005 was $1.1 million.
Cost of products sold which were purchased from VML, net of rebates and equity earnings or losses, wasapproximately $41.0 million, $38.4 million and $36.6 million during the fiscal years ended August 31, 2006,2005 and 2004, respectively. The Company had product payables to VML of $0.5 million and $1.9 million atAugust 31, 2006 and 2005, respectively. Additionally, the Company receives rental income from VML, which isrecorded as a component of other income (expense), net. Rental income from VML was $0.2 million for each ofthe fiscal years ended August 31, 2006, 2005 and 2004. Additionally, the Company acquired $2.0 million ofinventory from VML during the fourth quarter of fiscal year 2006. The inventory purchased from VML consistedof certain finished goods that had been acquired from other manufacturers on behalf of the Company. As theCompany transitioned to direct acquisition of these finished goods, it acquired the remaining inventory at VML.
39

FORWARD-LOOKING STATEMENTS
The Private Securities Litigation Reform Act of 1995 provides a “safe harbor” for certain forward-lookingstatements. This report contains forward-looking statements, which reflect the Company’s current views withrespect to future events and financial performance.
These forward-looking statements are subject to certain risks and uncertainties. The words “aim,” “believe,”“expect,” “anticipate,” “intend,” “estimate” and other expressions that indicate future events and trends identifyforward-looking statements.
Actual future results and trends may differ materially from historical results or those anticipated depending uponfactors including, but not limited to, the near term growth expectations for lubricants, household products andheavy-duty hand cleaners in the Americas, the impact of changes in product distribution, competition for shelfspace, plans for product and promotional innovation, the impact of new product introductions on the growth ofsales, the impact of customer mix and raw material, component and finished goods costs on gross margins, theimpact of promotions on sales, the rate of sales growth in the Asia-Pacific region, direct European countries andEastern Europe, the impact of changes in inventory management, the effect of future income tax provisions andaudit outcomes on tax rates, the amount of future capital expenditures, foreign currency exchange rates andfluctuations in those rates, the effects of, and changes in, worldwide economic conditions, legal proceedings andthe other risk factors identified in Item 1A.
Readers also should be aware that while the Company does, from time to time, communicate with securitiesanalysts, it is against the Company’s policy to disclose to them any material non-public information or otherconfidential commercial information. Accordingly, shareholders or readers should not assume that the Companyagrees with any statement or report issued by any analyst irrespective of the content of the statement or report.Further, the Company has a policy against confirming financial forecasts or projections issued by others.Accordingly, to the extent that reports issued by securities analysts contain any projections, forecasts or opinions,such reports are not the responsibility of the Company.
ITEM 7A – Quantitative and Qualitative Disclosures About Market Risk
Foreign Currency Risk
The Company is exposed to a variety of risks, including foreign currency fluctuations. In the normal course of itsbusiness, the Company employs established policies and procedures to manage its exposure to fluctuations inforeign currency values and changes in the market value of its investments.
The Company’s objective in managing its exposure to foreign currency exchange rate fluctuations is to reduce theimpact of adverse fluctuations in earnings and cash flows associated with foreign currency exchange rate changes.Accordingly, the Company’s U.K. subsidiary utilizes forward contracts to limit its exposure on converting cashbalances maintained in Euros into British sterling. The Company regularly monitors its foreign exchange exposures toensure the overall effectiveness of its foreign currency hedge positions. However, there can be no assurance theCompany’s foreign currency hedging activities will substantially offset the impact of fluctuations in currency exchangerates on its results of operations and financial position. While the Company engages in foreign currency hedgingactivity to reduce its risk, for accounting purposes, none of the foreign exchange contracts are designated as hedges.
Interest Rate Risk
As of August 31, 2006, the Company had $64.3 million remaining on an original $75 million, 7.28% fixed-rateterm loan. During the first quarter of fiscal year 2006, the Company also had a $10 million revolving line ofcredit with no outstanding balance. The $10 million revolving line of credit was subject to interest ratefluctuations, with a variable interest rate based on the LIBOR rate plus 1.75%. However, the Company is notcurrently exposed to interest rate risk as the line of credit matured in October 2005, and the Company did notrenew the line of credit.
40
ITEM 8 - Financial Statements and Supplementary Data
The Company’s consolidated financial statements at August 31, 2006 and 2005 and for each of the three years inthe period ended August 31, 2006, and the Report of PricewaterhouseCoopers LLP, Independent RegisteredPublic Accounting Firm, are included in this Annual Report on Form 10-K in Item 15.
QUARTERLY FINANCIAL INFORMATION (UNAUDITED)
The following table sets forth certain unaudited quarterly consolidated financial information for each of the twoyears in the period ended August 31, 2006. Amounts are presented in thousands, except for earnings per sharedata.
QUARTER ENDED:NET
SALESGROSSPROFIT
NETINCOME
DILUTEDEARNINGSPER SHARE
November 30, 2004 $ 60,688 $ 30,569 $ 5,635 $0.34February 28, 2005 61,076 29,647 5,278 0.31May 31, 2005 65,149 31,252 6,362 0.38August 31, 2005 76,314 37,926 10,523 0.63
$263,227 $129,394 $27,798 $1.65(1)
November 30, 2005 $ 67,215 $ 32,314 $ 7,513 $0.45February 28, 2006 71,480 34,276 7,231 0.43May 31, 2006 73,052 35,419 7,046 0.42August 31, 2006 75,169 36,391 6,322 0.37
$286,916 $138,400 $28,112 $1.66(1)
(1) Amounts in table may not total due to rounding.
ITEM 9 – Changes in and Disagreements With Accountants on Accounting and Financial Disclosure
Not applicable.
ITEM 9A – Controls and Procedures
Evaluation of Disclosure Controls and Procedures
The term “ disclosure controls and procedures” is defined in Rules 13a-15(e) and 15d-15(e) promulgated underthe Securities and Exchange Act of 1934 (Exchange Act). The term disclosure controls and procedures meanscontrols and other procedures of a Company that are designed to ensure the information required to be disclosedby the Company in the reports that it files or submits under the Act is recorded, processed, summarized andreported, within the time periods specified in the Commission’s rules and forms. Disclosure controls andprocedures include, without limitation, controls and procedures designed to ensure that information required tobe disclosed by a Company in the reports that it files or submits under the Act is accumulated and communicatedto the Company’s management, including its principal executive and principal financial officers, or personsperforming similar functions, as appropriate to allow timely decisions regarding required disclosures. TheCompany’s chief executive officer and chief financial officer have evaluated the effectiveness of the Company’sdisclosure controls and procedures as of August 31, 2006, the end of the period covered by this report (theEvaluation Date), and they have concluded that, as of the Evaluation Date, such controls and procedures wereeffective at ensuring that required information will be disclosed on a timely basis in the Company’s reports filedunder the Exchange Act. Although management believes the Company’s existing disclosure controls andprocedures are adequate to enable the Company to comply with its disclosure obligations, management continuesto review and update such controls and procedures. The Company has a disclosure committee, which consists ofcertain members of the Company’s senior management.
41

Management’s Report on Internal Control over Financial Reporting
Management is responsible for establishing and maintaining adequate internal control over financial reporting, assuch term is defined in Exchange Act rule 13a-15(f). Under the supervision and with the participation of ourChief Executive Officer and Chief Financial Officer, our management conducted an evaluation of theeffectiveness of our internal control over financial reporting based upon the framework in Internal Control —Integrated Framework issued by the Committee of Sponsoring Organizations of the Treadway Commission.Based on that evaluation, our management concluded that our internal control over financial reporting is effectiveas of August 31, 2006.
Because of its inherent limitations, internal control over financial reporting may not prevent or detectmisstatements. Also, projections of any evaluation of effectiveness to future periods are subject to the risk thatcontrols may become inadequate because of changes in conditions, or that the degree of compliance with thepolicies or procedures may deteriorate.
PricewaterhouseCoopers LLP, an independent registered public accounting firm, has audited management’sassessment of the effectiveness of our internal control over financial reporting as of August 31, 2006, as stated intheir report included in this Annual Report on Form 10-K on pages i and ii.
Changes in Internal Control over Financial Reporting
For the year ended August 31, 2006, there were no significant changes to the Company’s internal control overfinancial reporting that materially affected, or would be reasonably likely to materially affect, its internal controlover financial reporting.
ITEM 9B – Other Information
Not applicable.
PART III
ITEM 10 - Directors and Executive Officers of the Registrant
Certain information required by this item is set forth under the captions “Security Ownership of Directors andExecutive Officers,” “Nominees for Election as Directors,” “Corporate Governance Committee”, “CompensationCommittee Interlocks and Insider Participation,” “Audit Committee” and “Section 16(a) Beneficial OwnershipReporting Compliance” in the Company’s Proxy Statement to be filed with the Securities and ExchangeCommission in connection with the 2006 Annual Meeting of Stockholders on December 12, 2006 (the ProxyStatement), which information is incorporated by reference herein. Additional information concerning executiveofficers of the Registrant required by this item is included in this Annual Report on Form 10-K under theheading, “Executive Officers of the Registrant” following Item 4 of Part I.
The registrant has a financial reporting code of ethics applicable to its principal executive officer, principalfinancial officer, principal accounting officer or controller and persons performing similar functions. A copy ofthe code of ethics applicable to such persons may be found on the Registrant’s internet website on the Officers &Directors link from the Investor Relations page at www.wd40.com.
ITEM 11 - Executive Compensation
The information required by this item is incorporated by reference to the Proxy Statement under the headings“Board of Directors Compensation”, “Executive Compensation,” “Compensation Committee Report onExecutive Compensation” and “Stock Performance Graph.”
42

ITEM 12 - Security Ownership of Certain Beneficial Owners and Management
Certain information required by this item is incorporated by reference to the Proxy Statement under the headings“Principal Security Holders” and “Security Ownership of Directors and Executive Officers.”
The following table provides information regarding shares of the Company’s common stock authorized forissuance under equity compensation plans as of August 31, 2006:
Equity Compensation Plan Information
Plan category
Number of securities to beissued upon exercise of
outstanding options, warrantsand rights ( a )
Weighted-average exerciseprice of outstanding options,
warrants and rights ( b )
Number of securitiesremaining available for future
issuance under equitycompensation plans
(excluding securities reflectedin column ( a )) ( c )
Equity compensation plans approved by securityholders 1,317,922 $26.71 1,330,4431
Equity compensation plans not approved by securityholders n/a n/a n/a
Total 1,317,922 $26.71 1,330,443
1 Includes 18,389 shares available pursuant to the Company’s 1999 Non-Employee Director Restricted StockPlan.
Non-Employee Director Restricted Stock Plan
On October 28, 2003, the Board of Directors adopted the Third Amended and Restated WD-40 Company 1999Non-Employee Director Restricted Stock Plan. The plan was approved by the Company’s stockholders at theannual meeting of stockholders held on December 16, 2003. Pursuant to the plan and the director compensationpolicy in effect for 2006, shares are issued to non-employee directors of the Company in lieu of cashcompensation of up to $30,000 according to an election to be made by the director by November 30 of the prioryear. A director who holds shares of the Company having a value of at least $50,000 may elect to receive his orher entire annual director’s fee in cash. Otherwise, directors must elect to receive restricted stock in lieu of cashin the amount of $5,500, $11,000, $16,500, $22,000, $27,500 or $30,000. The restricted shares are to be issued inaccordance with a director’s election as soon as practicable after the first day of March. The number of shares tobe issued is equal to the amount of compensation to be paid in shares divided by 90% of the closing price of theCompany’s shares as of the first business day of March or other date of issuance of such shares. Restricted sharesissued to a director do not become vested for resale for a period of five years or until the director’s retirementfrom the Board following the director’s 65th birthday. Unless a director has reached age 65, the shares aresubject to forfeiture if, during the five-year vesting period, the director resigns from service as a director.
ITEM 13 – Certain Relationships and Related Transactions
Not Applicable.
ITEM 14 – Principal Accounting Fees and Services
The information required by this item is incorporated by reference to the Proxy Statement under the heading“Ratification of Appointment of Independent Accountants.”
43

PART IV
ITEM 15 – Exhibits and Financial Statement Schedule
Page
(a) Documents filed as part of this report
(1) Report of Independent Registered Public Accounting Firm iConsolidated Balance Sheets at August 31, 2006 and 2005 iiiConsolidated Statements of Operations for Years Ended August 31, 2006, 2005 and 2004 ivConsolidated Statements of Shareholders’ Equity and Comprehensive Income for Years EndedAugust 31, 2006, 2005 and 2004 vConsolidated Statements of Cash Flows for Years Ended August 31, 2006, 2005 and 2004 viNotes to Consolidated Financial Statements vii
All other schedules are omitted because they are not applicable or the required information is shown in theconsolidated financial statements or notes thereto.
44

(2) Exhibits
Exhibit
No. Description
Articles of Incorporation and Bylaws.
3(a) Certificate of Incorporation, incorporated by reference from the Registrant’s Form 10-Q filed January14, 2000, Exhibit 3(a) thereto.
3(b) Bylaws, incorporated by reference from the Registrant’s Form 8-K filed October 20, 2005, Exhibit 3thereto.
Material Contracts.
Executive Compensation Plans and Arrangements (Exhibits 10(a) through 10(l) are managementcontracts and compensatory plans or arrangements required to be filed as exhibits pursuant toITEM 15(b)).
10(a) Form of WD-40 Company Supplemental Death Benefit Plan applicable to certain executive officersof the Registrant, incorporated by reference from the Registrant’s Form 10-K filed November 7,2001, Exhibit 10(a) thereto.
10(b) Form of WD-40 Company Supplemental Retirement Benefit Plan applicable to certain executiveofficers of the Registrant, incorporated by reference from the Registrant’s Form 10-K filedNovember 7, 2001, Exhibit 10(b) thereto.
10(c) Fourth Amendment and Restatement, WD-40 Company 1990 Incentive Stock Option Plan,incorporated by reference from the Registrant’s Proxy Statement filed on November 4, 2003(appendix thereto).
10(d) Form of Indemnity Agreement between the Registrant and its executive officers and directors,incorporated herein by reference from the Registrant’s Proxy Statement filed on November 9, 1999(Appendix D thereto).
10(e) Third Amended and Restated WD-40 Company 1999 Non-Employee Director Restricted Stock Planincorporated by reference from the Registrant’s Proxy Statement filed on November 4, 2003(appendix thereto).
10(f) Change of Control Severance Agreement between WD-40 Company and Garry O. Ridge datedFebruary 14, 2006, incorporated by reference from the Registrant’s Form 10-Q filed April 10, 2006,Exhibit 10(a) thereto.
10(g) Change of Control Severance Agreement between WD-40 Company and Michael J. Irwin datedFebruary 14, 2006, incorporated by reference from the Registrant’s Form 10-Q filed April 10, 2006,Exhibit 10(b) thereto.
10(h) Change of Control Severance Agreement between WD-40 Company and Michael L. Freeman datedFebruary 14, 2006, incorporated by reference from the Registrant’s Form 10-Q filed April 10, 2006,Exhibit 10(c) thereto.
10(i) Change of Control Severance Agreement between WD-40 Company and Geoffrey J. Holdsworthdated February 14, 2006, incorporated by reference from the Registrant’s Form 10-Q filed April 10,2006, Exhibit 10(d) thereto.
45

Exhibit
No. Description
10(j) Change of Control Severance Agreement between WD-40 Company and Graham P. Milner datedFebruary 14, 2006, incorporated by reference from the Registrant’s Form 10-Q filed April 10, 2006,Exhibit 10(e) thereto.
10(k) Change of Control Severance Agreement between WD-40 Company and William B. Noble datedFebruary 14, 2006, incorporated by reference from the Registrant’s Form 10-Q filed April 10, 2006,Exhibit 10(f) thereto.
10(l) Compensation Agreement between WD-40 Company and Geoff Holdsworth dated August 9, 2006,incorporated by reference from the Registrant’s Form 8-K filed August 9, 2006, Exhibit 10 thereto.
21 Subsidiaries of the Registrant.
23 Consent of Independent Registered Public Accounting Firm.
31(a) Certification of Chief Executive Officer pursuant to Section 302 of the Sarbanes-Oxley Act of 2002.
31(b) Certification of Chief Financial Officer pursuant to Section 302 of the Sarbanes-Oxley Act of 2002.
32(a) Certification of Chief Executive Officer pursuant to Section 906 of the Sarbanes-Oxley Act of 2002.
32(b) Certification of Chief Financial Officer pursuant to Section 906 of the Sarbanes-Oxley Act of 2002.
46

SIGNATURES
Pursuant to the requirements of Section 13 or 15(d) of the Securities Exchange Act of 1934, the Registrant hasduly caused this annual report to be signed on its behalf by the undersigned, thereunto duly authorized.
WD-40 COMPANYRegistrant
/s/ MICHAEL J. IRWIN
MICHAEL J. IRWINExecutive Vice PresidentChief Financial Officer(Principal Financial Officer)Date 10/25/06
Pursuant to the requirements of the Securities Exchange Act of 1934, this report has been signed below by thefollowing persons on behalf of the Registrant and in the capacities and on the dates indicated.
/s/ JAY REMBOLT
JAY REMBOLTVice President of Finance, Controller(Principal Accounting Officer)Date 10/25/06
/s/ GARRY O. RIDGE
GARRY O. RIDGEChief Executive Officer and Director(Principal Executive Officer)Date 10/25/06
/s/ JOHN C. ADAMS
JOHN C. ADAMS, JR., DirectorDate 10/19/06
/s/ GILES H. BATEMAN
GILES H. BATEMAN, DirectorDate 10/19/06
/s/ PETER D. BEWLEY
PETER D. BEWLEY, DirectorDate 10/19/06
/s/ RICHARD A. COLLATO
RICHARD A. COLLATO, DirectorDate 10/19/06
/s/ MARIO L. CRIVELLO
MARIO L. CRIVELLO, DirectorDate 10/19/06
47

/s/ LINDA A. LANG
LINDA A. LANG, DirectorDate 10/19/06
/s/ GARY L. LUICK
GARY L. LUICK, DirectorDate 10/19/06
/s/ KENNETH E. OLSON
KENNETH E. OLSON, DirectorDate 10/19/06
/s/ NEAL E. SCHMALE
NEAL E. SCHMALE, DirectorDate 10/19/06
48
Report of Independent Registered Public Accounting Firm
To the Board of Directors and Shareholders of WD-40 Company:
We have completed integrated audits of WD-40 Company’s 2006 and 2005 consolidated financialstatements and of its internal control over financial reporting as of August 31, 2006 and an audit of its 2004consolidated financial statements in accordance with the standards of the Public Company Accounting OversightBoard (United States). Our opinions, based on our audits, are presented below.
Consolidated financial statements
In our opinion, the consolidated financial statements listed in the index appearing under Item 15(a)(1)present fairly, in all material respects, the financial position of WD-40 Company and its subsidiaries atAugust 31, 2006 and August 31, 2005, and the results of their operations and their cash flows for each of thethree years in the period ended August 31, 2006 in conformity with accounting principles generally accepted inthe United States of America. These financial statements are the responsibility of the Company’s management.Our responsibility is to express an opinion on these financial statements based on our audits. We conducted ouraudits of these statements in accordance with the standards of the Public Company Accounting Oversight Board(United States). Those standards require that we plan and perform the audit to obtain reasonable assurance aboutwhether the financial statements are free of material misstatement. An audit of financial statements includesexamining, on a test basis, evidence supporting the amounts and disclosures in the financial statements, assessingthe accounting principles used and significant estimates made by management, and evaluating the overallfinancial statement presentation. We believe that our audits provide a reasonable basis for our opinion.
As discussed in Note 1 to the consolidated financial statements, the Company changed its method ofaccounting for share-based payments during the year ended August 31, 2006.
Internal control over financial reporting
Also, in our opinion, management’s assessment, included in Management’s Report on Internal ControlOver Financial Reporting appearing under Item 9A, that the Company maintained effective internal control overfinancial reporting as of August 31, 2006 based on criteria established in Internal Control - IntegratedFramework issued by the Committee of Sponsoring Organizations of the Treadway Commission (COSO), isfairly stated, in all material respects, based on those criteria. Furthermore, in our opinion, the Companymaintained, in all material respects, effective internal control over financial reporting as of August 31, 2006,based on criteria established in Internal Control - Integrated Framework issued by the COSO. The Company’smanagement is responsible for maintaining effective internal control over financial reporting and for itsassessment of the effectiveness of internal control over financial reporting. Our responsibility is to expressopinions on management’s assessment and on the effectiveness of the Company’s internal control over financialreporting based on our audit. We conducted our audit of internal control over financial reporting in accordancewith the standards of the Public Company Accounting Oversight Board (United States). Those standards requirethat we plan and perform the audit to obtain reasonable assurance about whether effective internal control overfinancial reporting was maintained in all material respects. An audit of internal control over financial reportingincludes obtaining an understanding of internal control over financial reporting, evaluating management’sassessment, testing and evaluating the design and operating effectiveness of internal control, and performing suchother procedures as we consider necessary in the circumstances. We believe that our audit provides a reasonablebasis for our opinions.
A company’s internal control over financial reporting is a process designed to provide reasonableassurance regarding the reliability of financial reporting and the preparation of financial statements for externalpurposes in accordance with generally accepted accounting principles. A company’s internal control overfinancial reporting includes those policies and procedures that (i) pertain to the maintenance of records that, inreasonable detail, accurately and fairly reflect the transactions and dispositions of the assets of the company;(ii) provide reasonable assurance that transactions are recorded as necessary to permit preparation of financial
i

statements in accordance with generally accepted accounting principles, and that receipts and expenditures of thecompany are being made only in accordance with authorizations of management and directors of the company;and (iii) provide reasonable assurance regarding prevention or timely detection of unauthorized acquisition, use,or disposition of the company’s assets that could have a material effect on the financial statements.
Because of its inherent limitations, internal control over financial reporting may not prevent or detectmisstatements. Also, projections of any evaluation of effectiveness to future periods are subject to the risk thatcontrols may become inadequate because of changes in conditions, or that the degree of compliance with thepolicies or procedures may deteriorate.
/s/ PricewaterhouseCoopers LLP
San Diego, CaliforniaOctober 24, 2006
ii

WD-40 CompanyConsolidated Balance SheetsAugust 31, 2006 and 2005
August 31, 2006 August 31, 2005
AssetsCurrent assets:
Cash and cash equivalents $ 45,206,000 $ 37,120,000Trade accounts receivable, less allowance for cash discounts, returns and doubtful
accounts of $1,839,000 and $1,506,000 44,491,000 44,487,000Product held at contract packagers 1,385,000 1,814,000Inventories 15,269,000 8,041,000Current deferred tax assets, net 4,331,000 2,946,000Other current assets 4,858,000 6,784,000
Total current assets 115,540,000 101,192,000
Property, plant and equipment, net 8,940,000 8,355,000Goodwill 96,118,000 95,858,000Other intangibles, net 42,722,000 42,884,000Investment in related party 972,000 1,112,000Other assets 4,183,000 4,852,000
$268,475,000 $254,253,000
Liabilities and Shareholders’ EquityCurrent liabilities:
Current portion of long-term debt $ 10,714,000 $ 10,714,000Accounts payable 11,287,000 13,671,000Accounts payable to related party 463,000 1,945,000Accrued liabilities 11,678,000 14,058,000Accrued payroll and related expenses 7,485,000 3,828,000Income taxes payable 2,040,000 2,484,000
Total current liabilities 43,667,000 46,700,000
Long-term debt 53,571,000 64,286,000Deferred employee benefits and other long-term liabilities 1,895,000 1,838,000Long-term deferred tax liabilities, net 13,611,000 11,363,000
Total liabilities 112,744,000 124,187,000
Commitments and contingencies (Notes 7,8,9 and 14)Shareholders’ equity:
Common stock, $.001 par value, 36,000,000 shares authorized — 17,510,668 and17,222,410 shares issued 17,000 17,000
Paid-in capital 62,322,000 52,990,000Unearned stock-based compensation — (136,000)Retained earnings 103,335,000 89,983,000Accumulated other comprehensive income 5,083,000 2,238,000Common stock held in treasury, at cost (534,698 shares) (15,026,000) (15,026,000)
Total shareholders’ equity 155,731,000 130,066,000
$268,475,000 $254,253,000
The accompanying notes are an integral part of these consolidated financial statements.iii
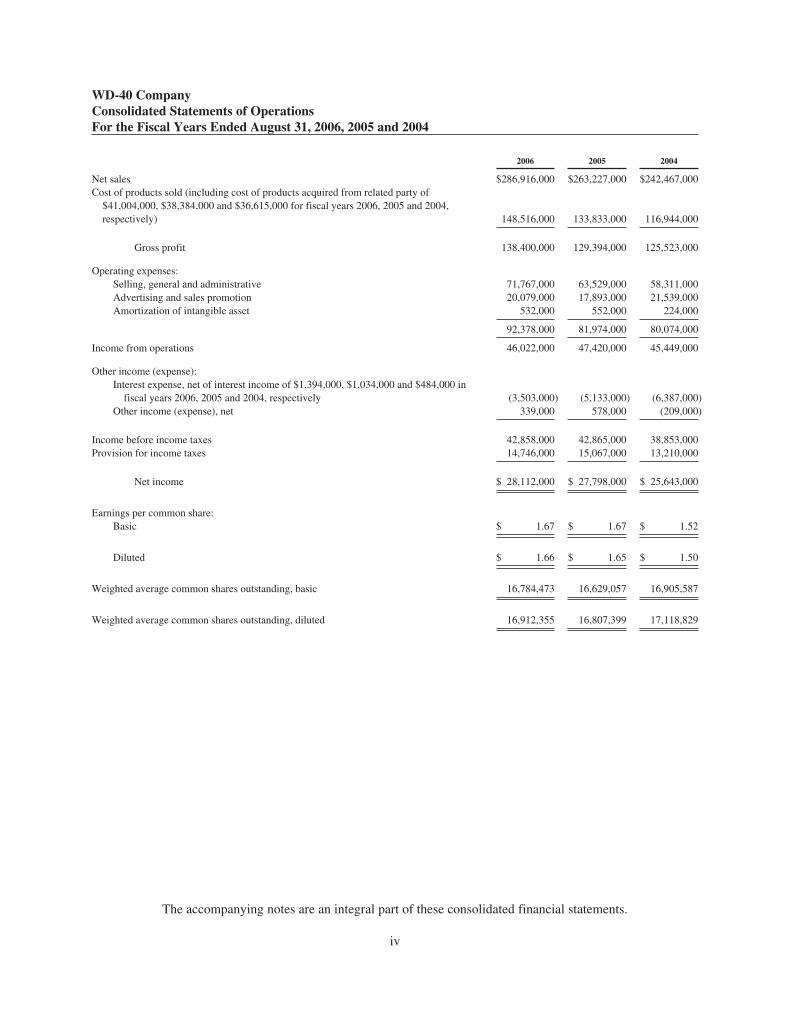
WD-40 CompanyConsolidated Statements of OperationsFor the Fiscal Years Ended August 31, 2006, 2005 and 2004
2006 2005 2004
Net sales $286,916,000 $263,227,000 $242,467,000Cost of products sold (including cost of products acquired from related party of
$41,004,000, $38,384,000 and $36,615,000 for fiscal years 2006, 2005 and 2004,respectively) 148,516,000 133,833,000 116,944,000
Gross profit 138,400,000 129,394,000 125,523,000
Operating expenses:Selling, general and administrative 71,767,000 63,529,000 58,311,000Advertising and sales promotion 20,079,000 17,893,000 21,539,000Amortization of intangible asset 532,000 552,000 224,000
92,378,000 81,974,000 80,074,000
Income from operations 46,022,000 47,420,000 45,449,000
Other income (expense):Interest expense, net of interest income of $1,394,000, $1,034,000 and $484,000 in
fiscal years 2006, 2005 and 2004, respectively (3,503,000) (5,133,000) (6,387,000)Other income (expense), net 339,000 578,000 (209,000)
Income before income taxes 42,858,000 42,865,000 38,853,000Provision for income taxes 14,746,000 15,067,000 13,210,000
Net income $ 28,112,000 $ 27,798,000 $ 25,643,000
Earnings per common share:Basic $ 1.67 $ 1.67 $ 1.52
Diluted $ 1.66 $ 1.65 $ 1.50
Weighted average common shares outstanding, basic 16,784,473 16,629,057 16,905,587
Weighted average common shares outstanding, diluted 16,912,355 16,807,399 17,118,829
The accompanying notes are an integral part of these consolidated financial statements.
iv

WD
-40
Com
pany
Con
solid
ated
Stat
emen
tsof
Shar
ehol
ders
’E
quit
yan
dC
ompr
ehen
sive
Inco
me
For
the
Fis
calY
ears
End
edA
ugus
t31
,200
6,20
05an
d20
04.
Com
mon
Stoc
kP
aid-
InC
apit
al
Une
arne
dSt
ock-
Bas
edC
ompe
nsat
ion
Ret
aine
dE
arni
ngs
Acc
umul
ated
Oth
erC
ompr
ehen
sive
Inco
me
(Los
s)
Tre
asur
ySt
ock
Tot
alSh
areh
olde
rs’
Equ
ity
Com
preh
ensi
veIn
com
eSh
ares
Am
ount
Shar
esA
mou
nt
Bal
ance
atA
ugus
t31,
2003
16,7
28,5
71$1
7,00
0$4
0,60
7,00
0$
—$
64,0
68,0
00$
512,
000
—$
—$1
05,2
04,0
00Is
suan
ceof
com
mon
stoc
kup
onex
erci
seof
optio
ns35
7,24
07,
914,
000
7,91
4,00
0T
axbe
nefi
tfro
mex
erci
seof
stoc
kop
tions
965,
000
965,
000
Issu
ance
ofre
stri
cted
com
mon
stoc
k3,
204
110,
000
110,
000
Stoc
k-ba
sed
com
pens
atio
nfo
rop
tions
issu
edto
dire
ctor
s20
,000
20,0
00C
ash
divi
dend
s($
0.80
per
shar
e)(1
3,55
9,00
0)(1
3,55
9,00
0)A
cqui
sitio
nof
trea
sury
stoc
k53
4,69
8(1
5,02
6,00
0)(1
5,02
6,00
0)E
quity
adju
stm
entf
rom
fore
ign
curr
ency
tran
slat
ion,
neto
fta
x($
578,
000)
1,14
7,00
01,
147,
000
$1,
147,
000
Net
inco
me
25,6
43,0
0025
,643
,000
25,6
43,0
00
Bal
ance
atA
ugus
t31,
2004
17,0
89,0
1517
,000
49,6
16,0
00—
76,1
52,0
001,
659,
000
534,
698
(15,
026,
000)
112,
418,
000
$26,
790,
000
Issu
ance
ofco
mm
onst
ock
upon
exer
cise
ofop
tions
128,
567
2,83
9,00
02,
839,
000
Tax
bene
fitf
rom
exer
cise
ofst
ock
optio
ns37
7,00
037
7,00
0Is
suan
ceof
rest
rict
edco
mm
onst
ock
4,82
815
8,00
0(1
58,0
00)
—A
mor
tizat
ion
ofun
earn
edst
ock-
base
dco
mpe
nsat
ion-
rest
rict
edst
ock
22,0
0022
,000
Cas
hdi
vide
nds
($0.
84pe
rsh
are)
(13,
967,
000)
(13,
967,
000)
Equ
ityad
just
men
tfro
mfo
reig
ncu
rren
cytr
ansl
atio
n,ne
tof
tax
($16
,000
)57
9,00
057
9,00
0$
579,
000
Net
inco
me
27,7
98,0
0027
,798
,000
27,7
98,0
00
Bal
ance
atA
ugus
t31,
2005
17,2
22,4
1017
,000
52,9
90,0
00(1
36,0
00)
89,9
83,0
002,
238,
000
534,
698
(15,
026,
000)
130,
066,
000
$28,
377,
000
Issu
ance
ofco
mm
onst
ock
upon
exer
cise
ofop
tions
282,
159
7,01
8,00
07,
018,
000
Stoc
k-ba
sed
com
pens
atio
nex
pens
e-st
ock
optio
ns1,
775,
000
1,77
5,00
0T
axbe
nefi
tfro
mex
erci
seof
stoc
kop
tions
614,
000
614,
000
Rec
lass
ofun
earn
edst
ock-
base
dco
mpe
nsat
ion
rela
ted
toth
ere
stri
cted
stoc
kup
onad
optio
nof
SFA
SN
o.12
3R(1
36,0
00)
136,
000
—Is
suan
ceof
rest
rict
edco
mm
onst
ock
6,09
9—
Am
ortiz
atio
nof
unea
rned
stoc
k-ba
sed
com
pens
atio
n-re
stri
cted
stoc
k61
,000
61,0
00C
ash
divi
dend
s($
0.88
per
shar
e)(1
4,76
0,00
0)(1
4,76
0,00
0)E
quity
adju
stm
entf
rom
fore
ign
curr
ency
tran
slat
ion,
neto
fta
xbe
nefi
t$56
0,00
02,
845,
000
2,84
5,00
0$
2,84
5,00
0N
etin
com
e28
,112
,000
28,1
12,0
0028
,112
,000
Bal
ance
atA
ugus
t31,
2006
17,5
10,6
68$1
7,00
0$6
2,32
2,00
0$
—$1
03,3
35,0
00$5
,083
,000
534,
698
$(15
,026
,000
)$1
55,7
31,0
00$3
0,95
7,00
0
The
acco
mpa
nyin
gno
tes
are
anin
tegr
alpa
rtof
thes
eco
nsol
idat
edfi
nanc
ials
tate
men
ts.
v

WD-40 CompanyConsolidated Statements of Cash FlowsFor the Fiscal Years Ended August 31, 2006, 2005 and 2004
2006 2005 2004
Cash flows from operating activities:Net income $ 28,112,000 $ 27,798,000 $ 25,643,000Adjustments to reconcile net income to net cash provided by operating activities:
Depreciation and amortization 3,467,000 3,007,000 2,369,000Gains on sales and disposals of property and equipment (38,000) (24,000) (49,000)Deferred income tax expense 1,396,000 3,474,000 4,504,000Tax benefit from exercise of stock options — 377,000 965,000Excess tax benefits from exercise of stock options (503,000) — —Distributions received and equity losses (earnings) from related party, net 140,000 (180,000) (281,000)Stock-based compensation 1,836,000 22,000 130,000Changes in assets and liabilities:
Trade accounts receivable 1,146,000 (3,635,000) 3,153,000Product held at contract packagers 429,000 161,000 (271,000)Inventories (6,889,000) (1,655,000) (1,306,000)Other assets 1,976,000 (970,000) (479,000)Accounts payable and accrued expenses (1,621,000) 3,262,000 74,000Accounts payable to related party (1,481,000) 14,000 (2,758,000)Income taxes payable 147,000 (125,000) (321,000)Deferred employee benefits and other long-term liabilities 80,000 38,000 118,000
Net cash provided by operating activities 28,197,000 31,564,000 31,491,000
Cash flows from investing activities:Acquisition of a business — — (11,555,000)Purchases of short-term investments (31,675,000) — —Sales of short-term investments 31,675,000 — —Proceeds from collections on note receivable 125,000 50,000 100,000Capital expenditures (2,947,000) (3,101,000) (2,358,000)Proceeds from sales of property and equipment 267,000 162,000 169,000
Net cash used in investing activities (2,555,000) (2,889,000) (13,644,000)
Cash flows from financing activities:Repayments of long-term debt (10,714,000) (10,000,000) (10,000,000)Proceeds from issuance of common stock 7,018,000 2,839,000 7,914,000Excess tax benefits from exercise of stock options 503,000 — —Treasury stock purchases — — (15,026,000)Dividends paid (14,760,000) (13,967,000) (13,559,000)
Net cash used in financing activities (17,953,000) (21,128,000) (30,671,000)
Effect of exchange rate changes on cash and cash equivalents 397,000 140,000 286,000
Increase (decrease) in cash and cash equivalents 8,086,000 7,687,000 (12,538,000)
Cash and cash equivalents at beginning of year 37,120,000 29,433,000 41,971,000
Cash and cash equivalents at end of year $ 45,206,000 $ 37,120,000 $ 29,433,000
Supplemental disclosure of cash flow information:
Cash paid for interest and fees $ 4,813,000 $ 5,993,000 $ 6,621,000Cash paid for income taxes, net of tax refunds received $ 11,016,000 $ 10,366,000 $ 7,972,000
The accompanying notes are an integral part of these consolidated financial statements.
vi
WD-40 CompanyNotes to Consolidated Financial StatementsAugust 31, 2006, 2005 and 2004
1. Summary of Significant Accounting Policies
The Company
WD-40 Company (the Company), based in San Diego, California, markets two lubricant brands known asWD-40® and 3-IN-ONE Oil®, two heavy-duty hand cleaner brands known as Lava® and Solvol®, and sixhousehold product brands known as X-14® hard surface cleaners and automatic toilet bowl cleaners, 2000Flushes® automatic toilet bowl cleaner, Carpet Fresh® and No Vac® rug and room deodorizers, Spot Shot®
aerosol and liquid carpet stain removers and 1001® carpet and household cleaners and rug and room deodorizers.
The Company’s brands are sold in various locations around the world. Lubricant brands are sold worldwide inmarkets such as North, Central and South America, Asia, Australia and the Pacific Rim, Europe, the Middle Eastand Africa. Household product brands are currently sold primarily in North America, the U.K., Australia and thePacific Rim. Heavy-duty hand cleaner brands are sold primarily in the U.S. and Australia.
Principles of Consolidation
The consolidated financial statements include the accounts of the Company and its wholly-owned subsidiaries.All intercompany transactions and balances have been eliminated.
Use of Estimates
The preparation of financial statements in conformity with accounting principles generally accepted in the UnitedStates of America requires management to make estimates and assumptions that affect the reported amounts ofassets and liabilities and disclosure of contingent assets and liabilities at the date of the financial statements andthe reported amounts of revenues and expenses during the reporting period. Actual results could differ from thoseestimates.
Sales Concentration
Wal-Mart Stores, Inc. is a significant U.S. mass retail customer and offers a variety of the Company’s products.Sales to U.S. Wal-Mart stores accounted for approximately 9 percent of the Company’s consolidated net salesduring each of fiscal years 2006, 2005 and 2004. Excluding sales to U.S. Wal-Mart stores, sales to affiliates ofWal-Mart worldwide accounted for approximately 4 percent during each of fiscal years 2006 and 2005, andapproximately 5 percent during fiscal year 2004.
Cash and Cash Equivalents
Cash equivalents are highly liquid investments purchased with an original maturity of three months or less.
Trade Accounts Receivable and Allowance for Doubtful Accounts
Trade accounts receivable are recorded at the invoiced amount and do not bear interest. The allowance fordoubtful accounts is the Company’s best estimate of the amount of probable credit losses in existing accountsreceivable. The Company determines the allowance based on historical write off experience and by industry andregional economic data. Account balances are charged off against the allowance when the Company feels it isprobable that the receivable will not be recovered. The Company does not have any off-balance sheet creditexposure related to its customers.
vii

WD-40 CompanyNotes to Consolidated Financial StatementsAugust 31, 2006, 2005 and 2004
The following are the changes in the allowance for doubtful accounts during the fiscal years ended August 31,2006, 2005 and 2004.
Balanceat Beginning
of Period
AdditionsCharged toCosts andExpenses Deductions*
Balanceat End of
Period
Allowance for doubtful accounts
Year ended August 31, 2004 $1,131,000 $ 336,000 $ 625,000 $842,000
Year ended August 31, 2005 $ 842,000 $ 588,000 $ 654,000 $776,000
Year ended August 31, 2006 $ 776,000 $(259,000) $(245,000) $762,000
* Write off (recoveries) of doubtful accounts
Product Held at Contract Packagers
The manufacturing of the Company’s products is outsourced to contract packagers. These contract packagerspackage products to rigid specifications, and upon order from WD-40 Company, ship ready-to-sell inventory tothe Company’s customers. The Company transfers certain raw materials and product components to thesecontract packagers for use in the manufacturing process. Packagers are obligated to pay the Company for the rawmaterials and components upon receipt. Amounts receivable as of the balance sheet date are reported as productheld at contract packagers in the accompanying consolidated balance sheets.
Inventories
Inventories are stated at the lower of cost (as determined based on the average cost method) or market. Whennecessary, the Company provides allowances to adjust the carrying value of its inventory to the lower of cost ormarket, including any costs to sell or dispose. Appropriate consideration is given to obsolescence, excessiveinventory levels, product deterioration and other factors in evaluating net realizable value for the purposes ofdetermining the lower of cost or market.
Property, Plant and Equipment
Property, plant and equipment is stated at cost. Depreciation has been computed using the straight-line methodbased upon estimated useful lives of ten to thirty years for buildings and improvements, three to fifteen years formachinery and equipment, five years for vehicles, three to ten years for furniture and fixtures and three to fiveyears for software and computer equipment. Depreciation expense totaled $2.3 million, $2.0 million and $1.8million in fiscal years 2006, 2005 and 2004, respectively. These amounts include factory depreciation expenserecognized as cost of products sold totaling $0.7 million, $0.5 million and $0.4 million in fiscal years 2006, 2005and 2004, respectively.
Software Development Costs
The Company capitalizes qualifying software costs, which are incurred during the application development stage,and amortizes them over their estimated useful lives of three to five years. The Company capitalized $0.2 millionduring the fiscal year ended August 31, 2006, and $0.3 million during each of the fiscal years ended August 31,2005 and 2004. Capitalized software costs are included in property, plant and equipment in the accompanying
viii
WD-40 CompanyNotes to Consolidated Financial StatementsAugust 31, 2006, 2005 and 2004
consolidated balance sheets. Amortization expense totaled $0.4 million in both fiscal year 2006 and 2005, and$0.3 million in fiscal year 2004.
Goodwill and Other Intangibles
Effective January 1, 2002, the company adopted Statement of Financial Accounting Standards (SFAS) No. 142,“Goodwill and Other Intangible Assets.” This statement changed the accounting for goodwill and indefinite-livedintangible assets from an amortization approach to an impairment-only approach.
Goodwill and other intangibles principally relate to the excess of the purchase price over the fair value oftangible assets acquired. Goodwill and intangible assets that have indefinite useful lives are tested at leastannually for impairment during the Company’s second fiscal quarter and otherwise as may be required. Duringthe current fiscal year second quarter, the Company tested its goodwill and indefinite-lived intangible assets forimpairment. Based on this test, the Company determined that there were no instances of impairment.
The Company tests for goodwill impairment based on the SFAS No. 142 goodwill impairment model, which is atwo-step process. First, the impairment model requires comparison of the book value of net assets to the fairvalue of the related reporting units that have goodwill assigned to them. If the fair value is determined to be lessthan book value, a second step is performed to compute the amount of impairment. In the second step, theimplied fair value of goodwill is estimated as the fair value of the reporting unit used in the first step less the fairvalues of all other net tangible and intangible assets of the reporting unit. If the carrying amount of goodwillexceeds its implied fair market value, an impairment loss is recognized in an amount equal to that excess, not toexceed the carrying amount of the goodwill. The Company tests for impairment of intangible assets withindefinite useful lives in accordance with SFAS No. 142 based on discounted future cash flows compared to therelated book values. The Company’s impairment test is based on a discounted cash flow approach that requiressignificant management judgment and estimates with respect to forecasted revenue, advertising and promotionalexpenses, cost of products sold, gross margins, operating margins, the success of product innovations andintroductions, customer retention and the selection of appropriate discount and royalty rates.
In addition to the annual impairment tests, goodwill and intangible assets with indefinite lives are evaluated eachreporting period. Goodwill is evaluated each reporting period to determine whether events and circumstanceswould more likely than not reduce the fair value of a reporting unit below its carrying value. Intangible assetswith indefinite lives are evaluated each reporting period to determine whether events and circumstances continueto support an indefinite useful life and to determine whether any indicators of impairment exist. Indicators suchas underperformance relative to historical or projected future operating results, changes in the Company’sstrategy for its overall business or use of acquired assets, decline in the Company’s stock price for a sustainedperiod, unexpected adverse industry or economic trends, unanticipated technological change or competitiveactivities, loss of key distribution, change in consumer demand, loss of key personnel and acts by governmentsand courts may signal that an asset has become impaired.
Intangible assets with definite lives are amortized over their useful lives and are also evaluated each reportingperiod to determine whether events and circumstances continue to support their remaining useful lives.
Long-lived Assets
The Company assesses potential impairments to its long-lived assets when there is evidence that events orchanges in circumstances indicate that the carrying value of an asset may not be recoverable. Any required
ix

WD-40 CompanyNotes to Consolidated Financial StatementsAugust 31, 2006, 2005 and 2004
impairment loss would be measured as the amount by which the asset’s carrying value exceeds its fair value,which is the amount at which the asset could be bought or sold in a current transaction between willing parties,and would be recorded as a reduction in the carrying value of the related asset and a charge to results ofoperations. An impairment loss would be recognized when the sum of the expected future undiscounted net cashflows is less than the carrying amount of the asset. No impairment losses have been identified by the Company.
Fair Value of Financial Instruments
The Company’s financial instruments include cash equivalents, trade receivables, accounts payable, debt andforeign currency exchange contracts. The carrying amounts of these instruments approximate fair value becauseof the short maturities or variable interest rates.
The fair value of the Company’s debt was approximately $66.8 million and $80.3 million at August 31, 2006 and2005, respectively. The fair value of the Company’s debt is based on discounted future cash flows using currentmarket interest rates.
Concentration of Credit Risk
Financial instruments, which potentially subject the Company to significant concentrations of credit risk, consistprincipally of cash and accounts receivable. The Company’s policy is to place its cash in high credit qualityfinancial institutions, in investments that include operating and money market accounts and, periodically,auction-rate securities. The Company’s accounts receivable are primarily derived from customers located inNorth America, South America, Asia-Pacific and Europe. Additionally, the Company limits its credit exposurefrom trade receivables by performing on-going credit evaluations of customers, as well as insuring its accountsreceivable in selected markets.
Revenue Recognition
Sales are recognized as revenue at the time of delivery to the customer when risk of loss and title pass. Sales arerecorded net of allowances for damaged goods returns, trade promotions, coupons and cash discounts.
The Company records sales incentives as a reduction of sales in its income statement. The Company offerson-going trade promotion programs with customers, and consumer coupon programs that require the Company toestimate and accrue the expected costs of such programs. Programs include cooperative marketing programs,shelf price reductions, coupons, rebates, consideration and allowances given to retailers for space in their stores,consideration and allowances given to obtain favorable display positions in the retailers’ stores and otherpromotional activity. Costs related to rebates, co-operative advertising and other promotional activity arerecorded upon delivery of products to customers. Costs related to coupon offers are based upon historicalredemption rates and are recorded as incurred, when coupons are circulated.
Cost of Products Sold
The components of cost of products sold primarily include the cost of products manufactured on the Company’sbehalf by its contract packagers, net of volume and other rebates. The costs to manufacture WD-40 concentrateare also included in cost of products sold, which include direct labor, direct materials and supplies; in-boundfreight costs related to purchased raw materials; and depreciation of machinery and equipment used in themanufacturing process.
x
WD-40 CompanyNotes to Consolidated Financial StatementsAugust 31, 2006, 2005 and 2004
Selling, General and Administrative Expenses
The components of selling, general and administrative expenses include costs related to selling the product suchas the cost of the sales force and related sales and broker commissions; freight paid to third-party companies todistribute finished goods from the Company’s contract packagers to its customers; other general andadministrative costs related to the Company’s business such as general overhead, legal and accounting fees,insurance, and depreciation; and other employee-related costs to support marketing, human resources, finance,supply chain, information technology and research and development activities.
Shipping and Handling Costs
Shipping and handling costs included in selling, general and administrative expenses were $16.3 million, $15.8million and $13.9 million in fiscal 2006, 2005 and 2004, respectively.
Advertising Costs
The Company primarily advertises through television and print media. The Company’s policy is to expenseadvertising costs as incurred. Advertising expenses for the fiscal years ended 2006, 2005 and 2004 were $5.5million, $4.6 million and $7.1 million, respectively.
Research and Development
The Company is involved in research and development efforts that include the continual development of newproducts and the improvement of existing products. All research and development costs are expensed as incurredand are included in selling, general and administrative expenses. Research and development expenses for thefiscal years ended 2006, 2005 and 2004 were $3.8 million, $2.5 million and $1.9 million, respectively. Theseexpenses include general research and development activities, as well as internal staff, overhead, design testing,market research and consultants.
Income Taxes
Current income tax expense is the amount of income taxes expected to be payable for the current year. Adeferred income tax liability or asset is established for the expected future tax consequences resulting from thedifferences in financial reporting and tax bases of assets and liabilities. A valuation allowance is provided if it ismore likely than not that some or all of the deferred tax assets will not be realized.
The Company establishes accruals for certain tax contingencies when, despite the belief that the Company’s taxreturn positions are fully supported, the Company believes that certain positions may be challenged and that theCompany’s positions may not be fully sustained. The tax contingency accruals are adjusted in light of changingfacts and circumstances, such as the progress of tax audits, case law and emerging legislation. The Company’stax contingency accruals are reflected as a component of income taxes payable.
U.S. income tax expense is provided on remittances of foreign earnings and on unremitted foreign earnings thatare not indefinitely reinvested. Where unremitted foreign earnings are indefinitely reinvested, no provision forfederal and state tax expense is made.
xi

WD-40 CompanyNotes to Consolidated Financial StatementsAugust 31, 2006, 2005 and 2004
Foreign Currency
Assets and liabilities of the Company’s foreign subsidiaries are translated into U.S. dollars at exchange rates ineffect at the balance sheet date. Income and expense items are translated at the average exchange rates prevailingduring the period. Gains and losses from translation are included in accumulated other comprehensive income(loss). Gains or losses resulting from foreign currency transactions (transactions denominated in a currency otherthan the entity’s functional currency) are included in the consolidated statement of operations as other income(expense). Aggregate foreign currency transaction gains (losses) were $110,000, $387,000 and ($377,000) for theyears ended August 31, 2006, 2005 and 2004, respectively.
The Company uses foreign currency forward contracts to reduce the risk of foreign currency transactions of oneof its wholly-owned foreign subsidiaries. The principal currency affected is the Euro. Forward contracts areaccounted for on a mark-to-market basis, with realized and unrealized gains or losses recognized currently. Cashflows from settlements of forward contracts are included in operating activities in the consolidated statements ofcash flows. While the Company engages in foreign currency hedging activity to reduce its risk, for accountingpurposes, none of the foreign exchange contracts are designated as hedges.
The Company continually monitors its positions with, and the credit quality of, the major international financialinstitutions which are counterparties to its foreign currency forward contracts, and has not experiencednonperformance by any of these counterparties. As a matter of policy, the Company does not purchase contractsthat exceed the amount of the foreign denominated cash and accounts receivable balances. At August 31, 2006,the Company had approximately $4.2 million of foreign exchange contracts outstanding, which mature starting inSeptember 2006 and continue to mature through December 2006. The amount of net realized and unrealizedgains on the foreign exchange contracts was not material for all periods presented.
Earnings per Share
Basic earnings per common share is calculated by dividing net income for the period by the weighted averagenumber of common shares outstanding during the period. Diluted earnings per common share is calculated bydividing net income for the period by the weighted average number of common shares outstanding during theperiod increased by the weighted average number of potentially dilutive common shares (dilutive securities) thatwere outstanding during the period. Dilutive securities are comprised of options granted under the Company’sstock option plan.
Stock-Based Compensation
Effective September 1, 2005, the Company began recording compensation expense associated with stock optionsin accordance with SFAS No. 123R, “Share-Based Payment”. Prior to September 1, 2005, the Companyaccounted for stock-based compensation related to stock options under the recognition and measurementprinciples of Accounting Principles Board Opinion No. 25; therefore, the Company measured compensationexpense for its stock option plan using the intrinsic value method, that is, as the excess, if any, of the fair marketvalue of the Company’s stock at the grant date over the amount required to be paid to acquire the stock, andprovided the disclosures required by SFAS Nos. 123 and 148. The Company has adopted the modifiedprospective transition method provided under SFAS No. 123R, and as a result, has not retroactively adjustedresults from prior periods. Under this transition method, compensation expense associated with stock optionsrecognized in fiscal year 2006 includes: 1) expense related to the remaining unvested portion of all stock optionawards granted prior to September 1, 2005, based on the grant date fair value estimated in accordance with the
xii

WD-40 CompanyNotes to Consolidated Financial StatementsAugust 31, 2006, 2005 and 2004
original provisions of SFAS No. 123; and 2) expense related to all stock option awards granted subsequent toSeptember 1, 2005, based on the grant date fair value estimated in accordance with the provisions of SFASNo. 123R.
The adoption of SFAS No. 123R also resulted in certain changes to the Company’s accounting for its restrictedstock awards, which is discussed in Note 11 in more detail.
Segment Information
The Company discloses certain information about the Company’s operating segments, which are determinedconsistent with the way management organizes and evaluates financial information internally for makingoperating decisions and assessing performance. The Company is organized on the basis of geographical areas. Inaddition, management assesses revenue on the basis of products.
Recent Accounting Pronouncements
In September 2006, the Financial Accounting Standards Board (FASB) issued SFAS No. 157, “Fair ValueMeasurements”. SFAS No. 157 defines fair value, establishes a framework for measuring fair value and expandsdisclosures about fair value measurements. This statement is effective for financial statements issued for fiscalyears beginning after November 15, 2007, and interim periods within those fiscal years. The Company iscurrently evaluating SFAS No. 157 to determine the impact, if any, on its financial statements.
In June 2006, the FASB issued Interpretation No. 48 (FIN 48), “Accounting for Uncertainty in Income Taxes —an interpretation of FASB Statement No. 109.” FIN 48 clarifies the recognition threshold and measurementattribute for the financial statement recognition and measurement of a tax position taken or expected to be takenin a tax return. FIN 48 also provides guidance on derecognition, classification, interest and penalties, accountingin interim periods, disclosure and transition. FIN 48 is effective for fiscal years beginning after December 15,2006. The Company will adopt this interpretation as required. Management is currently assessing the effect thatFIN 48 will have on the Company’s results of operations, financial condition and liquidity.
In December 2004, the FASB issued FSP No. 109-1, “Application of FASB Statement No. 109, Accounting forIncome Taxes, to the Tax Deduction on Qualified Production Activities Provided by the American Jobs CreationAct of 2004.” FSP No. 109-1 states that qualified domestic production activities should be accounted for as aspecial deduction under SFAS No. 109, “Accounting for Income Taxes.” Any benefit from the deduction shouldbe reported in the period in which the deduction is claimed on the tax return. On May 24, 2006, the U.S. TreasuryDepartment issued the final regulations concerning the Tax Deduction on Qualified Production ActivitiesProvided by the American Jobs Creation Act of 2004. Based on the final regulations, the Company hascompleted its evaluation of the impact of Internal Revenue Code Section 199 provided by the Act and determinedthat the deduction, which will be included in the fiscal year 2006 tax return, resulted in a reduction ofapproximately one-half of a percent to the Company’s effective tax rate for fiscal year 2006.
In December 2004, the FASB issued FSP No. 109-2, “Accounting and Disclosure Guidance for the ForeignEarnings Repatriation Provision within the American Jobs Creation Act of 2004.” FSP No. 109-2 amends theexisting accounting literature that requires companies to record deferred taxes on foreign earnings, unless theyintend to indefinitely reinvest those earnings outside the U.S. This pronouncement temporarily allows companiesthat are evaluating whether to repatriate foreign earnings under the American Jobs Creation Act of 2004 to delayrecognizing any related taxes until that decision is made. This pronouncement also requires companies that are
xiii

WD-40 CompanyNotes to Consolidated Financial StatementsAugust 31, 2006, 2005 and 2004
considering repatriating earnings to disclose the status of their evaluation and the potential amounts beingconsidered for repatriation. The Company completed its evaluation in the second quarter of fiscal year 2006 andforesees no benefit in the repatriation of foreign earnings. As a result, the Company will not be repatriatingforeign earnings under the provisions of this act.
2. Acquisitions
On April 2, 2004, the Company purchased the 1001 line of carpet and household cleaners from PZ CussonsP.L.C. for 6.2 million pounds sterling ($11.4 million, at the then current exchange rates) paid in cash, and anadditional $0.2 million of acquisition costs for a total purchase price of $11.6 million. The acquisition includedessentially all key elements to continue the 1001 business including: the 1001 trade name, intellectual property ofthe brand, all pertinent information surrounding the manufacturing of the 1001 products including productformulations, access and knowledge of current customers of the products, key marketing knowledge andmaterials, and research supporting current products and potential new products. The Company acquired this lineof products to gain a presence in the U.K. market, and to leverage an introduction of the Company’s Spot Shotand Carpet Fresh brands through the use of an existing brand currently recognized by market consumers. Thepurchase price exceeds the fair market value of the identifiable assets acquired, due to the expectations that theCompany will be able to successfully introduce its other household product formulations under the 1001 brand inorder to expand the Company’s household products business into the U.K. market.
The acquisition was accounted for using the purchase method of accounting in accordance with SFAS No. 141,“Business Combinations,” and, accordingly, 1001 results of operations have been included in the consolidatedfinancial statements since the date of acquisition.
The following table presents the allocation of the purchase price to the various assets of the 1001 business, as ofthe April 2, 2004 acquisition date, based on an independent valuation of assets acquired performed by a third-party valuation firm:
1001 Trade name $ 3,713,000Non-contractual customer relationships 4,354,000Goodwill 3,488,000
Total purchase price $11,555,000
3. Goodwill and Other Intangibles
Goodwill and other intangibles principally relate to the excess of the purchase price over the fair value oftangible assets acquired. Goodwill and intangible assets that have indefinite useful lives are tested at leastannually for impairment during the Company’s second fiscal quarter and otherwise as may be required. Duringthe current fiscal year second quarter, the Company tested its goodwill and indefinite-lived intangible assets forimpairment. Based on this test, the Company determined that there were no instances of impairment.
xiv

WD-40 CompanyNotes to Consolidated Financial StatementsAugust 31, 2006, 2005 and 2004
Acquisition-related Goodwill
Changes in the carrying amounts of goodwill by segment for the fiscal years ended August 31, 2006 and 2005 aresummarized below:
Acquisition-related Goodwill
Americas Europe Asia-Pacific Total
Balance as of August 31, 2004 $85,612,000 $9,008,000 $1,212,000 $95,832,000Translation adjustments 16,000 10,000 — 26,000
Balance as of August 31, 2005 $85,628,000 $9,018,000 $1,212,000 $95,858,000Translation adjustments 39,000 221,000 — 260,000
Balance as of August 31, 2006 $85,667,000 $9,239,000 $1,212,000 $96,118,000
Indefinite-lived Intangible Assets
Intangible assets, excluding goodwill, which are not amortized as they have been determined to have indefinitelives, consist of the trade names Carpet Fresh, X-14, 2000 Flushes, Spot Shot and 1001.
Changes in indefinite-lived intangibles by segment for the fiscal years ended August 31, 2006 and 2005 aresummarized below:
Indefinite-lived Intangibles
Americas Europe Asia-Pacific Total
Balance as of August 31, 2004 $35,700,000 $3,661,000 $ — $39,361,000Translation adjustments — (5,000) — (5,000)
Balance as of August 31, 2005 $35,700,000 $3,656,000 $ — $39,356,000Translation adjustments — 206,000 — 206,000
Balance as of August 31, 2006 $35,700,000 $3,862,000 $ — $39,562,000
Definite-lived Intangible Assets
The Company’s definite-lived intangible asset consists of the non-contractual customer relationships acquired inthe 1001 acquisition. This definite-lived intangible asset is included in the Europe segment and is beingamortized on a straight-line basis over its estimated eight-year life. This asset is recorded in pounds sterling andconverted to U.S. dollars for reporting purposes. The following table summarizes the non-contractual customerrelationships intangible asset and the related amortization:
As of August 31,
2006 2005
Gross carrying amount $ 4,528,000 $4,287,000Accumulated amortization (1,368,000) (759,000)
Net carrying amount $ 3,160,000 $3,528,000
Year Ended August 31,
2006 2005
Amortization expense $ 532,000 $ 552,000
xv

WD-40 CompanyNotes to Consolidated Financial StatementsAugust 31, 2006, 2005 and 2004
The estimated amortization expense for the non-contractual customer relationships intangible asset is based oncurrent foreign currency exchange rates, and amounts in future periods may differ from those presented due tofluctuations in those rates. The estimated amortization for the non-contractual customer relationships intangibleasset in future fiscal years is as follows:
Fiscal year 2007 $ 566,000Fiscal year 2008 566,000Fiscal year 2009 566,000Fiscal year 2010 566,000Fiscal year 2011 566,000Thereafter 330,000
$3,160,000
Changes in definite-lived intangibles by segment for the fiscal years ended August 31, 2006 and 2005 aresummarized below:
Definite-lived Intangibles
Americas Europe Asia-Pacific Total
Balance as of August 31, 2004 $ — $4,067,000 $ — $4,067,000Amortization — (552,000) — (552,000)Translation adjustments — 13,000 — 13,000
Balance as of August 31, 2005 $ — $3,528,000 $ — $3,528,000Amortization — (532,000) — (532,000)Translation adjustments — 164,000 — 164,000
Balance as of August 31, 2006 $ — $3,160,000 $ — $3,160,000
xvi

WD-40 CompanyNotes to Consolidated Financial StatementsAugust 31, 2006, 2005 and 2004
4. Selected Financial Statement Information
As of August 31,
2006 2005
InventoriesRaw materials and components $ 1,110,000 $ 1,672,000Work-in-process(1) 2,196,000 288,000Finished goods 11,963,000 6,081,000
$ 15,269,000 $ 8,041,000
(1) Consists of WD-40 No-Mess Pens that require final packaging before being offered for sale.
Other Current AssetsPrepaid expenses and other $ 4,229,000 $ 4,140,000Federal income taxes receivable 629,000 2,644,000
$ 4,858,000 $ 6,784,000
Property, Plant and Equipment, netLand $ 583,000 $ 572,000Buildings and improvements 4,196,000 4,012,000Furniture and fixtures 1,090,000 1,063,000Computer and office equipment 3,513,000 2,806,000Software 3,207,000 2,799,000Machinery, equipment and vehicles 7,135,000 6,135,000
19,724,000 17,387,000Less: accumulated depreciation (10,784,000) (9,032,000)
$ 8,940,000 $ 8,355,000
Other Intangibles, netIntangibles with indefinite lives $ 39,562,000 $39,356,000Intangibles with definite lives 4,528,000 4,287,000Less: accumulated amortization (1,368,000) (759,000)
$ 42,722,000 $42,884,000
Accrued LiabilitiesAccrued advertising and sales promotion expenses $ 6,854,000 $ 9,189,000Other 4,824,000 4,869,000
$ 11,678,000 $14,058,000
Accrued Payroll and Related ExpensesAccrued bonus $ 3,928,000 $ 1,056,000Accrued profit sharing 1,404,000 1,159,000Accrued payroll 1,141,000 1,040,000Accrued payroll taxes 779,000 365,000Other 233,000 208,000
$ 7,485,000 $ 3,828,000
Note: Certain prior year amounts have been reclassified to conform to the current year presentation.
xvii

WD-40 CompanyNotes to Consolidated Financial StatementsAugust 31, 2006, 2005 and 2004
5. Stock Repurchase Plan
On April 6, 2004, the Company’s Board of Directors approved a share buy-back plan. Under the plan, which wasin effect for up to twelve months, the Company was authorized to acquire up to $15 million of the Company’soutstanding shares. During the last five months of fiscal year 2004, the Company completed the repurchaseprogram by acquiring 534,698 shares at a total cost of $15.0 million.
6. Earnings per Common Share
The schedule below summarizes the elements included in the calculation of basic and diluted earnings percommon share for the fiscal years ended August 31, 2006, 2005 and 2004.
Year Ended August 31,
2006 2005 2004
Net income $28,112,000 $27,798,000 $25,643,000
Weighted average common shares outstanding:Weighted average common shares outstanding, basic 16,784,473 16,629,057 16,905,587Weighted average dilutive securities 127,882 178,342 213,242
Weighted average common shares outstanding , diluted 16,912,355 16,807,399 17,118,829
Weighted average options outstanding totaling 359,507, 270,455 and 143,467 for the fiscal years endedAugust 31, 2006, 2005 and 2004, respectively, were excluded from the calculation of diluted EPS, as the optionshave an exercise price greater than or equal to the average market value of the Company’s common stock duringthe respective periods. Additionally for the fiscal year ended August 31, 2006, weighted average optionsoutstanding totaling 198,585 were also excluded from the calculation of diluted EPS under the treasury stockmethod as they were anti-dilutive. These options were anti-dilutive as a result of the assumed proceeds from(i) amounts option holders must pay for exercising stock options, (ii) the amount of compensation costs for futureservice that the Company has not yet recognized as expense, and (iii) the amount of tax benefits that would berecorded in additional paid-in capital upon exercise of the options.
7. Long-term Debt
Long-term debt is comprised of the following:
As of August 31,
2006 2005
Term loan $ 64,286,000 $ 75,000,000Revolving line of credit — —
Total debt 64,286,000 75,000,000Less: current portion (10,714,000) (10,714,000)
Long-term debt(1) $ 53,571,000 $ 64,286,000
(1) Amounts in table may not total due to rounding.
On October 18, 2001, the Company replaced two variable-rate term loans with proceeds from a $75 million long-term obligation and a $15 million variable rate revolving line of credit financed through Prudential Capital and
xviii

WD-40 CompanyNotes to Consolidated Financial StatementsAugust 31, 2006, 2005 and 2004
Union Bank. The $75 million long-term obligation consists of a fixed-rate note with a 10-year term and requiredinterest-only payments for the first three years. The note bears interest at an annualized rate of 7.28%. Therevolving line of credit had a variable rate based on the LIBOR rate plus 1.75% and matured in October of 2005.
The term loan agreement has covenant requirements, which require the Company to maintain minimumconsolidated net worth greater than the sum of $57 million plus 25% of consolidated net income for each fiscalquarter beginning with the first fiscal quarter of 2002, plus proceeds of all equity securities other than thoseissued under the employee stock option plan. A consolidated fixed charge coverage ratio greater than 1.20:1.00on the last day of any fiscal quarter must be maintained. The Company is also limited to a maximum ratio offunded debt to earnings before interest, taxes, depreciation and amortization (EBITDA) of 2.25 to 1.00. The termloan is collateralized by the Company’s cash, property, inventory, trade receivables and intangible assets. Theterm loan also includes certain provisions for prepayment penalties.
The events of default under the fixed-rate term loan include the following:
• Failure to pay principal or interest when due
• Failure to comply with covenants, representations and warranties, or other terms and conditions underthe credit agreements
• Commencing any proceeding for bankruptcy, insolvency, reorganization, dissolution or liquidation
• The sale, transfer, abandonment, forfeiture or disposal of the WD-40 trademark or any other trademarkused in a material product line
In the event of default, the term loan may be due and callable immediately at the option of the holders.
This facility also limits the Company’s ability, without prior approval from the Company’s lenders, to incuradditional unsecured indebtedness, sell, lease or transfer assets, place liens on properties, complete certainacquisitions, mergers or consolidations, enter into guarantee obligations, enter into related party transactions andmake certain loan advances and investments. The Company is in compliance with all debt covenants as requiredby the credit facility.
The aggregate maturities of the remaining fixed-rate term loan are as follows:
Year ending August 31, 2007 $10,714,0002008 10,714,0002009 10,714,0002010 10,714,0002011 10,714,000Thereafter 10,716,000
Total $64,286,000
8. Related Parties
VML Company L.L.C. (VML), a Delaware Limited Liability Company, was formed in April 2001, at which timethe Company acquired a 30% membership interest. Since formation, VML has served as the Company’s contractmanufacturer for certain household products and acts as a warehouse distributor for other product lines of the
xix
WD-40 CompanyNotes to Consolidated Financial StatementsAugust 31, 2006, 2005 and 2004
Company. Although VML has begun to expand its business to other customers, the Company continues to be itslargest customer. VML makes profit distributions to the Company and the 70% owner on a discretionary basis inproportion to each party’s respective interest.
The Company has a put option to sell its interest in VML to the 70% owner, and the 70% owner has a call optionto purchase the Company’s interest. The sale price in each case is established pursuant to formulas based onVML’s operating results.
Under Financial Interpretation No. 46, “Consolidation of Variable Interest Entities, an interpretation ofAccounting Research Bulletin No. 51,” VML qualifies as a variable interest entity, and it has been determinedthat the Company is not the primary beneficiary. The Company’s investment in VML is accounted for using theequity method of accounting, and its equity in VML earnings or losses is recorded as a component of cost ofproducts sold, as VML acts primarily as a contract manufacturer to the Company. The Company recorded equitylosses related to its investment in VML of $0.1 million for the fiscal year ended August 31, 2006, and equityearnings of $0.4 million and $0.5 million for the fiscal years ended August 31, 2005 and 2004, respectively.
The Company’s maximum exposure to loss as a result of its involvement with VML was $1.0 million as ofAugust 31, 2006. This amount represents the balance of the Company’s equity investment in VML, which ispresented as investment in related party on the Company’s consolidated balance sheets. The Company’sinvestment in VML as of August 31, 2005 was $1.1 million.
Cost of products sold which were purchased from VML, net of rebates and equity earnings or losses, wasapproximately $41.0 million, $38.4 million and $36.6 million during the fiscal years ended August 31, 2006,2005 and 2004, respectively. The Company had product payables to VML of $0.5 million and $1.9 million atAugust 31, 2006 and 2005, respectively. Additionally, the Company receives rental income from VML, which isrecorded as a component of other income (expense), net. Rental income from VML was $0.2 million for each ofthe fiscal years ended August 31, 2006, 2005 and 2004. Additionally, the Company acquired $2.0 million ofinventory from VML during the fourth quarter of fiscal year 2006. The inventory purchased from VML consistedof certain finished goods that had been acquired from other manufacturers on behalf of the Company. As theCompany transitioned to direct acquisition of these finished goods, it acquired the remaining inventory at VML.
9. Commitments and Contingencies
The Company was committed under certain non-cancelable operating leases and marketing agreements atAugust 31, 2006 which provide for the following future fiscal year minimum lease payments:
2007 2008 2009 2010 2011 Thereafter
Operating leases $1,327,000 $ 749,000 $345,000 $117,000 $47,000 $ —Marketing commitments 422,000 422,000 — — — —
$1,749,000 $1,171,000 $345,000 $117,000 $47,000 $ —
Rent expense was $1,137,000 for each of the years ended August 31, 2006 and 2005, and $1,065,000 for the yearended August 31, 2004.
The Company has relationships with various suppliers (contract manufacturers) who manufacture the Company’sproducts. Although the Company does not have any definitive minimum purchase obligations included in thecontract terms with the contract manufacturers, supply needs are communicated and the Company is committed
xx

WD-40 CompanyNotes to Consolidated Financial StatementsAugust 31, 2006, 2005 and 2004
to purchase the products produced based on orders and short-term projections provided to the contractmanufacturers, ranging from two to five months. The Company is also obligated to purchase back obsolete orslow-moving inventory. The Company has acquired inventory under these commitments, the amounts of whichhave been immaterial.
As of August 31, 2006, the Company has also committed to purchase finished goods and raw materials of $2.2million in fiscal year 2007; and $0.6 million in fiscal year 2008.
The Company is party to various claims, legal actions and complaints, including product liability litigation,arising in the ordinary course of business. With the possible exception of the legal proceedings discussed below,management is of the opinion that none of these matters will have a material adverse effect on the Company’sfinancial position, results of operations or cash flows.
On April 19, 2006, a legal action was filed against the Company in the United States District Court, SouthernDistrict of California (Drimmer v. WD-40 Company). After several of the plaintiff’s factual claims weredismissed by way of motion, the plaintiff filed an amended complaint on September 20, 2006, seeking classaction status and alleging that the Company misrepresented that its 2000 Flushes Bleach and 2000 Flushes BluePlus Bleach automatic toilet bowl cleaners (ATBCs) are safe for plumbing systems and unlawfully omitted toadvise consumers regarding the allegedly damaging effect the use of the ATBCs has on toilet parts made ofplastic and rubber. The amended complaint seeks to remedy such allegedly wrongful conduct: (i) by requiring theCompany to identify all consumers who have purchased the ATBCs and to return money as may be ordered bythe court; and (ii) by the granting of other equitable relief, interest, attorneys’ fees and costs. Though a newnamed plaintiff brought this case, it is legally and factually identical to a similar case that was dismissed by theSan Diego Superior Court in April 2005, and the Company intends to vigorously defend this case in the samemanner as before. If class action certification is granted in this aforementioned legal action, it is reasonablypossible that the outcome could have a material adverse effect on the operating results, financial position andcash flows of the Company. There is not sufficient information to estimate the Company’s exposure at this time.
The Company has been named as a defendant in an increasing number of lawsuits brought by a growing group ofattorneys on behalf of individual plaintiffs who assert that exposure to products that allegedly contain benzene isa cause of certain cancers. The Company is one of many defendants in these legal proceedings whose productsare alleged to contain benzene. However, the Company specifies that its suppliers provide constituent ingredientsfree of benzene, and the Company believes its products have always been formulated without containingbenzene. Except for self-insured retention amounts applicable to each separately filed lawsuit, the Companyexpects that the benzene lawsuits will be adequately covered by insurance and will not have a material impact onthe Company’s financial condition or results of operations. The Company is vigorously defending these lawsuitsin an effort to demonstrate conclusively that its products do not contain benzene, and that they have notcontained benzene in prior years. The Company is unable to assess the expected cost of defense of these lawsuitsin future periods. If the number of benzene lawsuits filed against the Company continues to increase, it isreasonably possible that such costs of defense may materially affect the Company’s results of operations andcash flows in future periods.
On May 28, 2004, separate but substantially identical legal actions were filed by Sally S. Hilkene against theCompany in the United States District Court for the District of Kansas and in the District Court of JohnsonCounty, Kansas. The plaintiff asserted claims for damages for alleged fraud in connection with the acquisition ofHeartland Corporation by the Company on May 31, 2002. The plaintiff alleged federal and state securities fraudand common law fraud claims against the Company and also sought to rescind the purchase agreement for the
xxi

WD-40 CompanyNotes to Consolidated Financial StatementsAugust 31, 2006, 2005 and 2004
Heartland Corporation acquisition. On October 3, 2006, the plaintiff and the Company agreed that the plaintiffwould dismiss her claims against the Company with prejudice in exchange for a mutual release and theCompany’s agreement to dismiss its counterclaim for an unpaid purchase price adjustment for the HeartlandCorporation acquisition in the approximate amount of $34,000. On October 10, 2006, this settlement agreementwas executed, and the claims against the Company were dismissed.
As permitted under Delaware law, the Company has agreements whereby it indemnifies senior officers anddirectors for certain events or occurrences while the officer or director is, or was, serving at the Company’srequest in such capacity. The maximum potential amount of future payments the Company could be required tomake under these indemnification agreements is unlimited; however, the Company maintains Director andOfficer insurance coverage that mitigates the Company’s exposure with respect to such obligations. As a result ofthe Company’s insurance coverage, management believes that the estimated fair value of these indemnificationagreements is minimal. No liabilities have been recorded for these agreements as of August 31, 2006.
From time to time, the Company enters into indemnification agreements with certain contractual parties in theordinary course of business, including agreements with lenders, lessors, contract manufacturers, marketingdistributors, customers and certain vendors. All such indemnification agreements are entered into in the contextof the particular agreements and are provided in an attempt to properly allocate risk of loss in connection with theconsummation of the underlying contractual arrangements. Although the maximum amount of future paymentsthat the Company could be required to make under these indemnification agreements is unlimited, managementbelieves that the Company maintains adequate levels of insurance coverage to protect the Company with respectto most potential claims arising from such agreements and that such agreements do not otherwise have valueseparate and apart from the liabilities incurred in the ordinary course of the Company’s business. No liabilitieshave been recorded with respect to such indemnification agreements as of August 31, 2006.
When, as part of an acquisition, the Company acquires all of the stock or all of the assets and liabilities of anothercompany, the Company assumes the liability for certain events or occurrences that took place prior to the date of theacquisition. The maximum potential amount of future payments the Company could be required to make for suchobligations is undeterminable at this time. No liabilities have been recorded as of August 31, 2006 for unknownpotential obligations arising out of the conduct of businesses acquired by the Company in recent years.
10. Income Taxes
The provision for income taxes includes the following:
Year Ended August 31,
2006 2005 2004
Current Tax ProvisionFederal $10,829,000 $ 7,729,000 $ 5,286,000State 953,000 1,060,000 825,000Foreign 2,393,000 2,709,000 2,625,000
Total current 14,175,000 11,498,000 8,736,000
Deferred Tax ProvisionUnited States 401,000 3,190,000 4,222,000Foreign 170,000 379,000 252,000
Total deferred 571,000 3,569,000 4,474,000
$14,746,000 $15,067,000 $13,210,000
xxii

WD-40 CompanyNotes to Consolidated Financial StatementsAugust 31, 2006, 2005 and 2004
Income before income taxes includes approximately $6,395,000, $7,480,000 and $7,175,000 related to foreignoperations for the years ended August 31, 2006, 2005 and 2004, respectively.
Deferred tax assets and deferred tax liabilities are comprised of the following:
As of August 31,
2006 2005
Deferred Tax AssetsAccrued payroll and related expenses $ 697,000 $ 203,000State income taxes paid 233,000 222,000Accounts receivable 929,000 757,000Accounts payable and accrued liabilities 2,098,000 1,386,000Deferred employee benefits and other long-term liabilities 668,000 631,000Stock option expense 494,000 —Net operating loss 120,000 12,000Other 540,000 740,000
Total deferred tax assets 5,779,000 3,951,000
Deferred Tax LiabilitiesProperty, plant and equipment, net (198,000) (295,000)Amortization of tax goodwill and intangibles (13,551,000) (10,331,000)Investment in low income housing partnerships (813,000) (921,000)Investment in VML partnership (323,000) (172,000)Other (174,000) (649,000)
Total deferred tax liabilities (15,059,000) (12,368,000)
Net deferred tax liabilities $ (9,280,000) $ (8,417,000)
Note: Certain prior year amounts have been reclassified to conform to the current year presentation.
As of August 31, 2006, the Company had state net operating loss (NOL) carryforwards of approximately$1,817,000 which begin to expire in 2014. In the current year, the Company used state NOL carryforwards of$1,537,000. In the fourth quarter of fiscal year 2006, the Company concluded an audit by the Internal RevenueService for fiscal years 2004, 2003 and 2002. The audit settlement did not have a material impact on theCompany’s financial statements.
A reconciliation of the statutory federal income tax rate to the Company’s effective tax rate follows for the fiscalyears ended August 31, 2006, 2005 and 2004:
Year Ended August 31,
2006 2005 2004
Amount computed at U.S. statutory federal tax rate $15,000,000 $15,003,000 $13,599,000State income taxes, net of federal benefit 1,010,000 654,000 950,000Low income housing and research and experimentation credits (177,000) (474,000) (509,000)Benefit from resolution of pending tax matters — — (410,000)Benefit from qualified domestic production deduction (218,000) — —Benefit from extra territorial income deductions (212,000) (211,000) (221,000)Benefit from municipal bond interest (106,000) — —Effect of foreign operations (362,000) (141,000) 112,000Other (189,000) 236,000 (311,000)
$14,746,000 $15,067,000 $13,210,000
Note: Certain prior year amounts have been reclassified to conform to the current year presentation.
xxiii

WD-40 CompanyNotes to Consolidated Financial StatementsAugust 31, 2006, 2005 and 2004
The Company has provided U.S. income tax and foreign withholding tax on the undistributed earnings of certainforeign subsidiaries not indefinitely reinvested. As of August 31, 2006, the Company has not provided for U.S.income taxes and foreign withholding taxes on $25,074,000 of undistributed earnings of certain foreignsubsidiaries indefinitely reinvested outside of the U.S. Determination of the amount of unrecognized deferredU.S. income tax liability is not practicable because of the complexities associated with its hypotheticalcalculation; however, unrecognized foreign tax credits would be available to reduce a large portion of the U.S.liability.
11. Stock-Based Compensation
Effective September 1, 2005, the Company began recording compensation expense associated with stock optionsin accordance with SFAS No. 123R, “Share-Based Payment”. Prior to September 1, 2005, the Companyaccounted for stock-based compensation related to stock options under the recognition and measurementprinciples of Accounting Principles Board Opinion No. 25; therefore, the Company measured compensationexpense for its stock option plan using the intrinsic value method, that is, as the excess, if any, of the fair marketvalue of the Company’s stock at the grant date over the amount required to be paid to acquire the stock, andprovided the disclosures required by SFAS Nos. 123 and 148. The Company has adopted the modifiedprospective transition method provided under SFAS No. 123R, and as a result, has not retroactively adjustedresults from prior periods. Under this transition method, compensation expense associated with stock optionsrecognized in fiscal year 2006 includes: 1) expense related to the remaining unvested portion of all stock optionawards granted prior to September 1, 2005, based on the grant date fair value estimated in accordance with theoriginal provisions of SFAS No. 123; and 2) expense related to all stock option awards granted subsequent toSeptember 1, 2005, based on the grant date fair value estimated in accordance with the provisions of SFASNo. 123R.
In November 2005, the FASB issued FASB Staff Position (FSP) No. FAS 123(R)-3, “Transition Election Relatedto Accounting for the Tax Effects of Share-Based Payment Awards,” to provide an alternate transition method(“short-cut” or “simplified” method) for the implementation of SFAS No. 123(R). This FSP provides thatcompanies may elect to use a specified short-cut method to calculate the historical pool of windfall tax benefitsupon adoption of SFAS No. 123(R). This method comprises (a) a computational component that establishes abeginning balance of the additional paid-in-capital pool (“APIC pool”) related to employee stock-basedcompensation and (b) a simplified method to determine the subsequent impact on the APIC pool of employeeawards that are fully vested and outstanding upon the adoption of SFAS No. 123(R). The Company has electedthe short-cut method as set forth in this FSP to determine its APIC pool. For the fiscal year ended August 31,2006, the Company determined that it does have a pool of windfall tax benefits.
The adoption of SFAS No. 123R also resulted in certain changes to the Company’s accounting for its restrictedstock awards, which is discussed below in more detail.
As a result of the adoption of SFAS No. 123R, the Company’s net income for the fiscal year ended August 31,2006 includes $1.8 million of compensation expense and $0.5 million of income tax benefits related to theCompany’s stock options. The compensation expense related to all of the Company’s stock-based compensationarrangements is recorded as a component of selling, general and administrative expenses, consistent with theclassification of the cash compensation paid to the related option holder. Prior to the Company’s adoption ofSFAS No. 123R, the Company presented tax benefits resulting from the exercise of stock options as cash flowsfrom operating activities on the Company’s consolidated statements of cash flows. SFAS No. 123R requires thatcash flows resulting from tax deductions in excess of the cumulative compensation cost recognized for options
xxiv

WD-40 CompanyNotes to Consolidated Financial StatementsAugust 31, 2006, 2005 and 2004
exercised (excess tax benefits) be classified as cash inflows from financing activities and cash outflows fromoperating activities.
The Company issues new shares upon the exercise of stock options and the issuance of restricted stock.
Stock Options
At August 31, 2006, the Company had one stock option plan. Under the Company’s current stock option plan, theBoard of Directors may grant options to purchase up to 4,480,000 shares of the Company’s common stock toofficers, key employees and non-employee directors of the Company. At August 31, 2006, options for 1,312,054shares remained available for future grant under the plan. Options cancelled due to forfeiture or expiration returnto the pool available for grant. The plan is administered by the Board of Directors or its designees and providesthat options granted under the plan will be exercisable at such times and under such conditions as may bedetermined by the Board of Directors at the time of grant of such option, however options may not be granted forterms in excess of ten years. Options outstanding under the plan have been granted with immediate vesting,vesting after one year and vesting over a period of three years. Compensation expense related to stock optionsgranted is recognized ratably over the service vesting period for the entire option award. The total number ofstock option awards expected to vest is adjusted by estimated forfeiture rates. The terms of the plan provide forthe granting of options at an exercise price not less than 100 percent of the fair market value of the stock at thedate of grant, as determined by the closing market value stock price on the grant date. The exercise price ofsubstantially all options granted during the fiscal years ended August 31, 2006, 2005 and 2004 was greater thanor equal to the market value on the date of grant and, accordingly, no stock-based compensation expense for suchoptions is reflected in net income for fiscal year 2005. However, during the year ended August 31, 2004, certainoptions were issued to non-employee directors at an exercise price below fair market value on the date of thegrant as a result of the option exercise price being determined as the closing price of the stock on the day prior tothe date of grant. These options were issued in accordance with the plan and the Director Compensation Policy.Stock-based compensation expense for such options, net of related tax effects, included in reported net incomefor the year ended August 31, 2004 aggregated $13,000.
The estimated fair value of each option award granted was determined on the date of grant using the Black-Scholes option valuation model with the following weighted-average assumptions for option grants during thefiscal years ended August 31, 2006, 2005 and 2004:
Year Ended August 31,
2006 2005 2004
Risk-free interest rate 4.34% 2.90% 2.27%Expected volatility of common stock 25.11% 41.35% 43.42%Dividend yield 3.22% 2.88% 2.70%Expected option term 4.85 years 3.18 years 3.13 years
The computation of the expected term is based on a weighted average calculation combining the average life ofoptions that have already been exercised or cancelled with the estimated life of all unexercised options. Theincrease in the expected term period over period is due to anticipated lower volatility in the future and to achange in the mix of employees receiving stock option awards. The expected volatility is based on the historicalvolatility of the Company’s stock. For option grants during the fiscal year ended August 31, 2006, the expectedvolatility computation is based on the average of the volatility over the most recent one-year period, the mostrecent period commensurate with the expected option term and WD-40’s long-term mean reversion volatility.For option grants during the fiscal years ended August 31, 2005 and 2004, the expected volatility computation is
xxv

WD-40 CompanyNotes to Consolidated Financial StatementsAugust 31, 2006, 2005 and 2004
based on the volatility over the five and three-year periods prior to the date of grant of such prior year options.Beginning in the first quarter of fiscal year 2006, the Company revised its volatility calculation method to includeconsideration of both long-term and short-term volatility measures in addition to volatility over the periodcommensurate with the expected option term. The Company expects this revised methodology to be a betterpredictor of future volatility. The risk-free interest rate is based on the implied yield on a U.S. Treasury constantmaturity with a remaining term equal to the expected term of the option. The dividend yield is based on theprojected annual dividend payment per share, divided by the stock price at the grant date.
A summary of the status of the Company’s stock option plan as of August 31, 2006, 2005 and 2004 and ofchanges in options outstanding under the plan during the three years ended August 31, 2006 is as follows:
Number of Shares
Weighted-AverageExercise Price
per Share
Weighted-AverageRemaining
Contractual Term(in years)
AggregateIntrinsic Value
Options outstanding at August 31, 2003 1,332,562 $23.73Options granted 326,450 $29.66Options exercised (357,240) $22.17Options forfeited or expired (31,852) $24.97
Options outstanding at August 31, 2004 1,269,920 $25.57
Options vested and exercisable at August 31, 2004 813,675 $23.84
Options granted 276,650 $27.80Options exercised (128,567) $22.08Options forfeited or expired (36,107) $28.20
Options outstanding at August 31, 2005 1,381,896 $26.27
Options vested and exercisable at August 31, 2005 881,871 $25.17
Options granted 247,000 $27.35Options exercised (282,159) $24.87Options forfeited or expired (28,815) $29.04
Options outstanding at August 31, 2006 1,317,922 $26.71 6.46 $10,590,000
Options vested and exercisable at August 31, 2006 870,240 $26.16 5.45 $ 7,472,000
The Company’s determination of fair value is affected by the Company’s stock price as well as a number ofassumptions that require judgment. The weighted-average fair value of each option granted during the fiscalyears ended August 31, 2006, 2005 and 2004, estimated as of the grant date using the Black-Scholes optionvaluation model, was $5.61, $7.28 and $8.13 per option, respectively. The total intrinsic value of optionsexercised was $2.0 million, $1.2 million, and $4.1 million during the fiscal years ended August 31, 2006, 2005and 2004, respectively.
As of August 31, 2006, there was $1.4 million of unamortized compensation cost related to non-vested stockoption awards, which is expected to be recognized over a remaining weighted-average vesting period of 1.6years.
Cash received from stock option exercises for the fiscal years ended August 31, 2006, 2005 and 2004 was $7.0million, $2.8 million and $7.9 million, respectively. The income tax benefits from stock option exercises totaled$0.6 million , $0.4 million and $1.0 million for the fiscal years ended August 31, 2006, 2005 and 2004,respectively.
xxvi

WD-40 CompanyNotes to Consolidated Financial StatementsAugust 31, 2006, 2005 and 2004
For stock options granted prior to the adoption of SFAS No. 123R, the following table illustrates the pro formaeffect on net income and earnings per common share as if the Company had applied the fair value recognitionprovisions of SFAS No. 123 in determining stock-based compensation for awards under the plan:
Year Ended August 31,
2005 2004
Net income, as reported $27,798,000 $25,643,000Add: Stock-based compensation expense included in reported net income, net of related tax effects — 13,000Deduct: Total stock-based compensation expense determined under fair value-based method for all awards, net
of related tax effects (1,229,000) (1,022,000)
Pro forma net income $26,569,000 $24,634,000
Earnings per common share:Basic - as reported $ 1.67 $ 1.52
Basic - pro forma $ 1.60 $ 1.46
Diluted - as reported $ 1.65 $ 1.50
Diluted - pro forma $ 1.59 $ 1.45
Restricted Stock
Pursuant to the Company’s current Amended and Restated WD-40 Company 1999 Non-Employee DirectorRestricted Stock Plan (the Plan) and the director compensation policy in effect for 2006, restricted shares areissued to non-employee directors of the Company in lieu of cash compensation of up to $30,000 according to anelection made by each director by November of the prior year. A director who holds shares of the Companyhaving a value of at least $50,000 may elect to receive his or her annual director’s fee in cash. Otherwise,directors must elect to receive restricted stock in lieu of cash in the amount of $5,500, $11,000, $16,500,$22,000, $27,500 or $30,000. The restricted shares are to be issued in accordance with the director’s election assoon as practicable after the first day of March. The number of shares to be issued is equal to the amount ofcompensation to be paid in shares divided by 90% of the closing price of the Company’s shares as of the firstbusiness day of March or other date of issuance of such shares. Compensation expense related to restricted stockissued is recognized ratably over the service vesting period. Restricted shares issued to a director do not becomevested for resale for a period of five years or until the director’s retirement from the Board following thedirector’s 65 th birthday. Unless a director has reached age 65, the shares are subject to forfeiture if, during thefive-year vesting period, the director resigns from service as a director. During the years ended August 31, 2006,2005 and 2004, the Company issued 6,099, 4,828 and 3,204 shares of restricted stock, respectively.
In accordance with SFAS No. 123R, the fair value of restricted stock awards is estimated based on the closingmarket value stock price on the date of share issuance. The total number of restricted stock awards expected tovest is adjusted by estimated forfeiture rates. As of August 31, 2006, there was $260,000 of unamortizedcompensation cost related to non-vested restricted stock awards, which is expected to be recognized over aremaining weighted-average vesting period of 3.7 years. The unamortized compensation cost related tonon-vested restricted stock awards was recorded as unearned stock-based compensation in shareholders’ equity atAugust 31, 2005. As part of the adoption of SFAS No. 123R, such unamortized compensation cost wasreclassified as a component of paid-in-capital.
xxvii

WD-40 CompanyNotes to Consolidated Financial StatementsAugust 31, 2006, 2005 and 2004
A summary of the status of the Company’s restricted stock awards as of August 31, 2006 and of changes inrestricted stock outstanding under the plan during the three years ended August 31, 2006 is as follows:
Number ofShares
Weighted-AverageGrant Date FairValue per Share
Restricted stock awards outstanding at August 31, 2003 9,349 $22.42Shares issued 3,204 $34.34Shares vested (1,462) $30.19Shares forfeited — $ —
Restricted stock awards outstanding at August 31, 2004 11,091 $24.84Shares issued 4,828 $32.62Shares vested (3,958) $26.16Shares forfeited — $ —
Restricted stock awards outstanding at August 31, 2005 11,961 $28.87Shares issued 6,099 $30.32Shares vested (201) $30.32Shares forfeited — $ —
Restricted stock awards outstanding at August 31, 2006 17,859 $29.35
12. Other Benefit Plans
The Company has a WD-40 Company Profit Sharing/401(k) Plan and Trust (the Profit Sharing/401(k) Plan)whereby regular U.S. full-time employees who have completed certain minimum service requirements can defera portion of their income through contributions to a trust. The Profit Sharing/401(k) Plan provides for Companycontributions to the trust, as approved by the Board of Directors, as follows: 1) matching contributions to eachparticipant up to 50% of the first 6.6% of compensation contributed by the participant; 2) fixed non-electivecontributions in the amount equal to 10% of eligible compensation; and 3) a discretionary non-electivecontribution in an amount to be determined by the Board of Directors up to 5% of eligible compensation. TheCompany’s contributions are subject to overall employer contribution limits and may not exceed the amountdeductible for income tax purposes. The Profit Sharing/401(k) Plan may be amended or discontinued at any timeby the Company.
Total Company contribution expense for the WD-40 Company Profit Sharing/401(k) Plan during the years endedAugust 31, 2006, 2005 and 2004 was approximately $2,117,000, $1,781,000 and $1,509,000, respectively.
The Company’s international subsidiaries have similar benefit plan arrangements, dependent upon the localapplicable laws and regulations. The plans provide for Company contributions to an appropriate third party plan,as approved by the subsidiary’s Board of Directors. Company contribution expense related to the internationalplans during the years ended August 31, 2006, 2005 and 2004 was approximately $833,000, $754,000 and$673,000, respectively.
The Company provides fixed retirement benefits to certain of its key executives under a supplemental employeeretirement plan. The accumulated benefit obligation was $1,794,000 and $1,720,000 at August 31, 2006 and2005, respectively. The service and interest costs amounted to approximately $215,000, $205,000 and $194,000for the years ended August 31, 2006, 2005 and 2004, respectively. During each of the years ended August 31,2006, 2005 and 2004, the plan paid benefits of approximately $141,000. A weighted-average discount rate of6.5% and a weighted-average rate of compensation increase of 4.0% were used to calculate the accumulatedbenefit obligation and service costs for each of the fiscal years ended August 31, 2006, 2005 and 2004.
xxviii

WD-40 CompanyNotes to Consolidated Financial StatementsAugust 31, 2006, 2005 and 2004
13. Business Segments and Foreign Operations
The Company evaluates the performance of its segments and allocates resources to them based on sales,operating income and expected return. The Company is organized based on geographic location. Segment datadoes not include inter-segment revenues and incorporates costs from corporate headquarters into the America’ssegment, without allocation to other segments. The Company’s segments are run independently, and as a result,there are few costs that could be considered only costs from headquarters that would qualify for allocation toother segments. The most significant portions of costs from headquarters relate to the Americas segment both asa percentage of time and sales. Therefore, any allocation to other segments would be arbitrary.
The table below presents information about reportable segments for the fiscal years ended August 31:
TheAmericas Europe
Asia-Pacific Total
2006Net sales $186,769,000 $79,101,000 $21,046,000 $286,916,000Income from operations $ 28,714,000 $13,088,000 $ 4,220,000 $ 46,022,000Depreciation and amortization expense $ 2,124,000 $ 1,250,000 $ 93,000 $ 3,467,000Interest income $ 1,153,000 $ 223,000 $ 18,000 $ 1,394,000Interest expense $ 4,897,000 $ — $ — $ 4,897,000Total assets $208,261,000 $55,274,000 $ 4,940,000 $268,475,000
2005Net sales $176,106,000 $68,353,000 $18,768,000 $263,227,000Income from operations $ 30,706,000 $12,261,000 $ 4,453,000 $ 47,420,000Depreciation and amortization expense $ 1,682,000 $ 1,238,000 $ 87,000 $ 3,007,000Interest income $ 852,000 $ 161,000 $ 21,000 $ 1,034,000Interest expense $ 6,167,000 $ — $ — $ 6,167,000Total assets $203,716,000 $45,399,000 $ 5,138,000 $254,253,000
2004Net sales $166,142,000 $57,703,000 $18,622,000 $242,467,000Income from operations $ 29,898,000 $10,968,000 $ 4,583,000 $ 45,449,000Depreciation and amortization expense $ 1,455,000 $ 841,000 $ 73,000 $ 2,369,000Interest income $ 412,000 $ 58,000 $ 14,000 $ 484,000Interest expense $ 6,871,000 $ — $ — $ 6,871,000Total assets $190,435,000 $41,741,000 $ 4,599,000 $236,775,000
xxix

WD-40 CompanyNotes to Consolidated Financial StatementsAugust 31, 2006, 2005 and 2004
Net Sales
2006 2005 2004
Product Line InformationLubricants $190,468,000 $174,084,000 $157,911,000Household products 89,822,000 82,237,000 77,913,000Hand cleaners 6,626,000 6,906,000 6,643,000
$286,916,000 $263,227,000 $242,467,000
Geographical InformationUnited States $161,624,000 $154,369,000 $146,004,000United Kingdom 25,432,000 22,818,000 18,040,000Other international 99,860,000 86,040,000 78,423,000
$286,916,000 $263,227,000 $242,467,000
Non-current Assets
2006 2005
Geographical InformationUnited States $126,917,000 $127,597,000International 26,018,000 25,464,000
$152,935,000 $153,061,000
The Company completed the acquisition of the 1001 line of carpet and household cleaners on April 2, 2004.Sales of the products acquired in the 1001 acquisition are included in the Europe segment and householdproducts product line. During the years ended August 31, 2006 and 2005, sales of 1001 products were$9.4 million and $8.9 million, respectively. During the year ended August 31, 2004, sales of 1001 products were$3.2 million for the five months following acquisition.
14. Subsequent Events
On October 6, 2006, the Company’s Board of Directors declared a cash dividend of $0.22 per share payable onOctober 31, 2006 to shareholders of record on October 17, 2006.
xxx

[THIS PAGE INTENTIONALLY LEFT BLANK]

[THIS PAGE INTENTIONALLY LEFT BLANK]
[THIS PAGE INTENTIONALLY LEFT BLANK]

BOARD OF DIRECTORSINVESTOR RELATIONS CONTACT
John C. Adams Jr.Compensation Committee ChairmanInvestorFormer Chairman and CEOAutoZone, Inc.
Giles H. BatemanAudit Committee ChairmanFormer CFO and DirectorPrice Club
Peter D. BewleyCorporate GovernanceCommittee ChairmanFormer Sr. Vice President, General Counseland Corporate SecretaryThe Clorox Company
Richard A. CollatoPresident and CEOYMCA of San Diego County
Mario CrivelloInvestor
Linda LangFinance Committee ChairmanChairman & CEOJack in the Box, Inc.
Gary L. LuickPrincipalPointeBreak Solutions, Inc.
Kenneth E. OlsonInvestorFormer Chairman and CEOProxima Corp.
Garry O. RidgePresidentChief Executive OfficerWD-40 Company
Gerald C. Schleif (Retired Dec. 2005)Former President and CEOWD-40 Company
Neal E. SchmaleChairman of the BoardPresident and COOSempra Energy
EXECUTIVE OFFICERS
Michael L. FreemanDivision PresidentThe Americas
Geoffrey J. HoldsworthManager Director, Asia/PacificWD-40 Company (Australia) Pty. Ltd.
Michael J. IrwinExecutive Vice PresidentChief Financial Officer
Graham P. MilnerExecutive Vice PresidentGlobal DevelopmentChief Branding Officer
William B. NobleManaging Director, EuropeWD-40 Company (UK) Ltd.
Garry O. RidgePresidentChief Executive Officer
OFFICERS
Ernest Bernarducci, Ph.DVice President, Research and Technology
Nancy L. ElyVice President, Human ResourcesAssistant Secretary
Peter DumiakVice President, USA Sales (National Accts.)
Stephen H. FantusVice President, Sales (Mass/Drug)
Diane GazzolaPresidentWD-40 Company (Canada) Ltd.
Robert HoaglandVice President, Information Technology
Timothy LesmeisterVice President, Marketing-USA
Maria MitchellVice President, Corporate and Investor Relations,Corporate Secretary
Kevin NoheltyVice President, Americas Distribution& Logistics
Jay RemboltVice President, Finance/ControllerPrincipal Accounting Officer
Rick SoaresVice President, USA Sales—Regions
Patrick WadeVice President, Sourcing and Production
GENERAL COUNSEL
Gordon and Rees LLP101 W. Broadway, Suite 1600San Diego, California 92101
INDEPENDENT ACCOUNTANTS
PricewaterhouseCoopers LLP750 B Street, Suite 2900San Diego, California 92101
TRANSFER AGENT and REGISTRAR
Computershare Investor Services, LLC2 North LaSalle StreetChicago, Illinois 60602Phone: 312-588-4180
ANNUAL MEETING
December 12, 2006, 2:00 PMMission Valley Hilton901 Camino Del Rio SouthSan Diego, California 92108Phone: 619-543-9000
Maria M. MitchellVice President Corporate and Investor RelationsPhone: 619-275-9350Fax: [email protected]
CORPORATE BRANDSUPPORT CENTRE
WD-40 Company1061 Cudahy PlaceSan Diego, California 92110Phone: 619-275-1400
OPERATING SUBSIDIARIES
WD-40 Company (UK) Ltd.WD-40 Company (Canada) Ltd.WD-40 Company (Australia) Pty. Ltd.
AMERICAS BRAND SUPPORT CENTRE
WD-40 Company1061 Cudahy PlaceSan Diego, California 92110
EUROPEAN BRAND SUPPORT CENTRE
WD-40 Company (UK) Ltd.Brick CloseKiln Farm, Keynes MK11 3LJUnited Kingdom
CANADA BRAND SUPPORT CENTRE
WD-40 Company (Canada) Ltd.555 Burnhamthorpe Rd., Ste 200Etobicoke, Ontario M9C 2Y3Canada
ASIA/PACIFIC BRANDSUPPORT CENTRE
WD-40 Company (Australia) Pty. Ltd.Suite 23, 2nd Floor41 Rawson StreetEpping, N.S.W. 2121Australia
LISTED
NASDAQ National Market SystemSymbol: WDFCIndustry Sector: Consumer Goods
COPY OF FORM 10 K
Beneficial owners may obtain without charge a copy ofWD-40 Company’s annual report on Form 10-K filedwith the Securities and Exchange Commission (SEC) for2006 by writing to the Corporate Secretary, WD-40Company, P.O. Box 80607, San Diego, California 92138-0607
Corporate information as of November 6, 2006
Copyrighted © 2006 WD-40 Company. All rightsreserved. WD-40®, 3-IN-ONE®, Solvol®, Lava®, X-14®,2000 Flushes®, Carpet Fresh®, Spot Shot®, 1001® and NoVac® are registered trademarks of WD-40 Company.
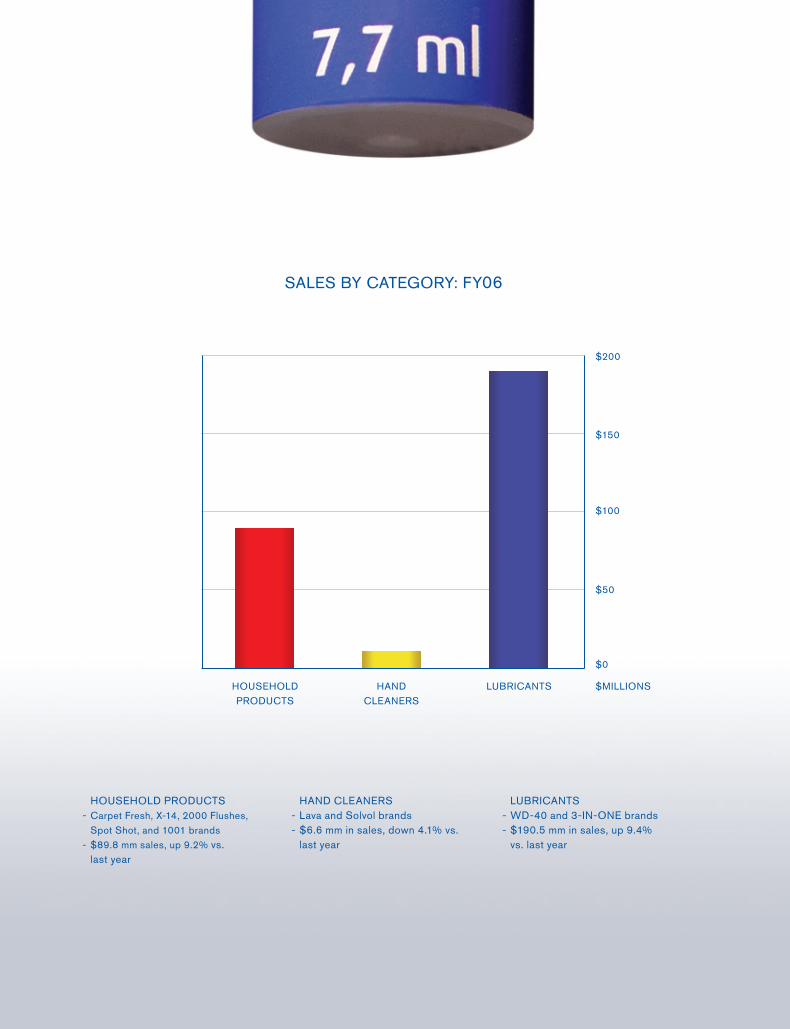
HOUSEHOLD PRODUCTS- Carpet Fresh, X-14, 2000 Flushes, Spot Shot, and 1001 brands- $89.8 mm sales, up 9.2% vs. last year
HAND CLEANERS- Lava and Solvol brands- $6.6 mm in sales, down 4.1% vs. last year
LUBRICANTS- WD-40 and 3-IN-ONE brands- $190.5 mm in sales, up 9.4% vs. last year
SALES BY CATEGORY: FY06
$0
$50
$100
$150
$MILLIONSHOUSEHOLD PRODUCTS
HAND CLEANERS
LUBRICANTS
$200

THE U.K. LATIN AMERICA ITALY CANADA
1061 Cudahy PlaceSan Diego, California 92110www.wd40.com