wbea presentation
DESCRIPTION
Presentation to Chamber Members at the April 14, 2011 Networking LuncheonTRANSCRIPT

WBEA Environmental Monitoring in the Regional Municipality of Wood BuffaloRegional Municipality of Wood Buffalo
Carna MacEachern BSc., M.B.A.Executive DirectorExecutive Director
Kevin Percy Ph.D.Lead ScientistLead Scientist
Presentation to Fort McMurray Chamber of Commerce Networking Luncheon
Sawridge Inn and Conference Centre, April 14 1

Our Mission: “WBEA monitors air quality and air quality related environmental impacts to generate accurate and transparent information which enables stakeholders to make informed decisions”
We monitor air in the RMWB 24 hours a day, 365 days a year through air quality, t t i l i t l ff tterrestrial environmental effects, and human exposure monitoring programs
Multi-stakeholder, independent, objective , p , jand not for profit
Information collected is openly shared with stakeholders and the public
2

WBEA MembersFirst Nations
Fort McKay First NationsFort McKay Métis Local #122
Environmental
Industry MembersCanadian Natural Resources LtdConoco Phillips Canada***C E IEnvironmental
Fort McMurray Environmental AssociationPembina Institute for Appropriate Development
***Cenovus Energy IncDevon Canada CorpHusky Energy Corp.Imperial Exxon-Mobile Oil
GovernmentAlberta EnvironmentAlberta Health ServicesEnergy Resources Conservation Board
MEG Energy CorpNexen IncShell Canada Energy IncSuncor Energygy
***Environment Canada***Health CanadaRegional Municipality of Wood Buffalo (RMWB)
Syncrude Canada LtdTotalWilliams Energy
( )
***new members
3

WBEA Monitoring Programs
Air Quality Monitoring:Most extensive continuous ambient air network in Alberta
g g
Most extensive continuous ambient air network in Alberta
Land Monitoring:Terrestrial program detects characterizes and quantifies the impacts ofTerrestrial program detects, characterizes and quantifies the impacts of air emissions on terrestrial ecosystems and traditional land resources
Human Monitoring:Human Monitoring:Redesigned to respond to current air quality issues related to odours, while meeting human exposure monitoring requirements found in industry approvals
4
Program SupportTechnical•Data QA/QC•Database Development &
Business•Communications & Outreach•Accountingp
Management•Strategic Planning (5 Year)
g•Business Planning•Contracting•LegalLegal
5

WBEA has been responsive and adaptive• Additional staff including a lead scientist and atmospheric
chemistchemist.• New office space• Forward-looking, science-based monitoring
M i f li t bi t i lit it i• Moving from compliance to ambient air quality monitoring while retaining regulatory reporting role
• Supported by high quality, international scientific team• Enabled by significant new investment by industry ($2.5 M to
>$9 M yearly)
6

WBEA Science Team 2011 • WBEA
– Science Staff: Dr. Kevin Percy, Dr. Yu-Mei Hsu– Science Advisors: Dr. Allan Legge, Dr. Doug Maynard (NRCan)gg , g y ( )– Air Technical QA/QC: Sanjay Prasad, Gary Cross– Data management: Martin Hansen, Eric Nosal– Terrestrial: Veronica Chisholm, Amanda Horning, Dr. Ken Foster– Science Communication: Jane Percy, Melissa Pennell
• WBEA contracted scientistsC d– Canada
• Dr. Bernard Mayer, University of Calgary• Dr. Milo Nosal, University of Calgary• Mr Tom Dann (Head Air Toxics Environment Canada Ottawa
7
Mr. Tom Dann, (Head, Air Toxics, Environment Canada, Ottawa, retired 2010)

WBEA Science Team (cont’d)United States– United States
• Drs John Watson, Judy Chow and Xiaoliang Wang, Desert Research Institute, Reno, NV
• Dr. Sagar Krupa, University of MinnesotaD M L di EPA ORD RTP NC• Dr. Matt Landis, EPA-ORD, RTP, NC
• Dr. Eric Edgerton, ARA, RTP, NC• Dr. Joe Graney, Binghamton University, NY• Dr. R. K. M. Jayanty, Research Triangle Institute, RTP, NCDr. R. K. M. Jayanty, Research Triangle Institute, RTP, NC• Dr. Joel Blum, University of Michigan, Ann Arbor, MI• Dr. Bill Studebaker, Research Triangle Institute, RTP, NC• Dr. Andrzej Bytnerowicz, Forest Service, Riverside, CA
D M k F F t S i Ri id CA• Dr. Mark Fenn, Forest Service, Riverside, CA• Dr. Witold Fraczek, ESRI, Redlands, CA• Dr. Bob O’Brien, Portland State University, Portland, OR• Dr. Dale Vitt, University of Illinois, Champaign, IL, y , p g ,• Drs. Kelman Wieder, Melanie Vile, Villanova University, PA
8

WBEA Science Team (cont’d)EuropeEurope– Dr. Neil Cape, Centre for Ecology and Hydrology, UK– Dr. Sirkku Manninen, University of Helsinki
• Scientists collaborating and Science Advisors– Drs. Cris Mihele, Jeff Brook, Tom Harner, Bob Vet, Environment
Canada,Downsview, ONCanada,Downsview, ON– Brian Wiens, Rachel Mintz, Dr. Magda Scarlatt, Environment Canada,
Edmonton– Dr. Ted Hogg, NRCan-CFS, Edmontongg– Dr. Ken van Rees, University of Saskatchewan– Dr. Mike Miller, Argonne National Laboratory– Dr. Sandy McLaughlin, Oak Ridge National Laboratory y g g y– Dr. Tom Nash III, University of Wisconsin, Madison, WI– Dr. Dale Johnson, University of Nevada, Reno, NV 9

Transparent and Accessible Science
• Our science team has:*– 3,374 peer-reviewed career publications
• Data availability– Raw continuous air quality data 1 hour old at www.wbea.org– AQI every hour (AQHI in June 2011) at www.wbea.org– Annual reports at www.wbea.org (trends, passive, integrated data)– Peer-reviewed publications, reports at www.wbea.org– Interim reports available to members at www.wbea.org
*reported to Alberta Environmental Monitoring Panel Secretariat March 25 10

Continuous and Time-Integrated Monitoring for Compliance and Ambient Air Qualityfor Compliance and Ambient Air Quality
111111

WBEA operates 15 Air Stations
121212

Air Quality Monitoring
Types of Measurements• Continuous
– SO2, NOx, NH3, PM2.5, O3, H2S/TRS, THC, CO, met.
– 2 tall met. towers • Time integrated
– PM10, metals, PAH, VOC• Specialized
– PFGC (TRS, VOC, HC)– Trace SO2, NOx, NH3
• Pilot projects– ASPS, E-nose, passive
validation and comparison
13

Accessing air data at www.wbea.org
14
WBEA Specialized Measurements
151515

Ambient Ion Chemistry
AIMAMS#1AMS#1
(b) HNO3
m3 )
1 5
2.0(a) HNO2
m3 )
3
4
cent
ratio
n ( µ
g/m
1.0
1.5
cent
ratio
n ( µ
g/m
2
3
0 4 8 12 16 20
Con
c
0.0
0.5
0 4 8 12 16 20
Con
c
0
1
161616
Hour0 4 8 12 16 20
Hour0 4 8 12 16 20
Hsu & Landis 2010

A Significant Air Quality Issue; DUST!A Significant Air Quality Issue; DUST!
171717
Concern of Fort McKay Community Members during October 17-18 Berry Workshop

Sequential Dichot Pilot Study• Objectives
– Fine and Coarse PM (ranges and ratios)( g )– Major Elements (mass balance/imbalance)– Detectability and Variability of Minor/Trace Elements
Photochemistry h l dPhotochemistryand
Combustion
Mechanical and Biological Processes
181818
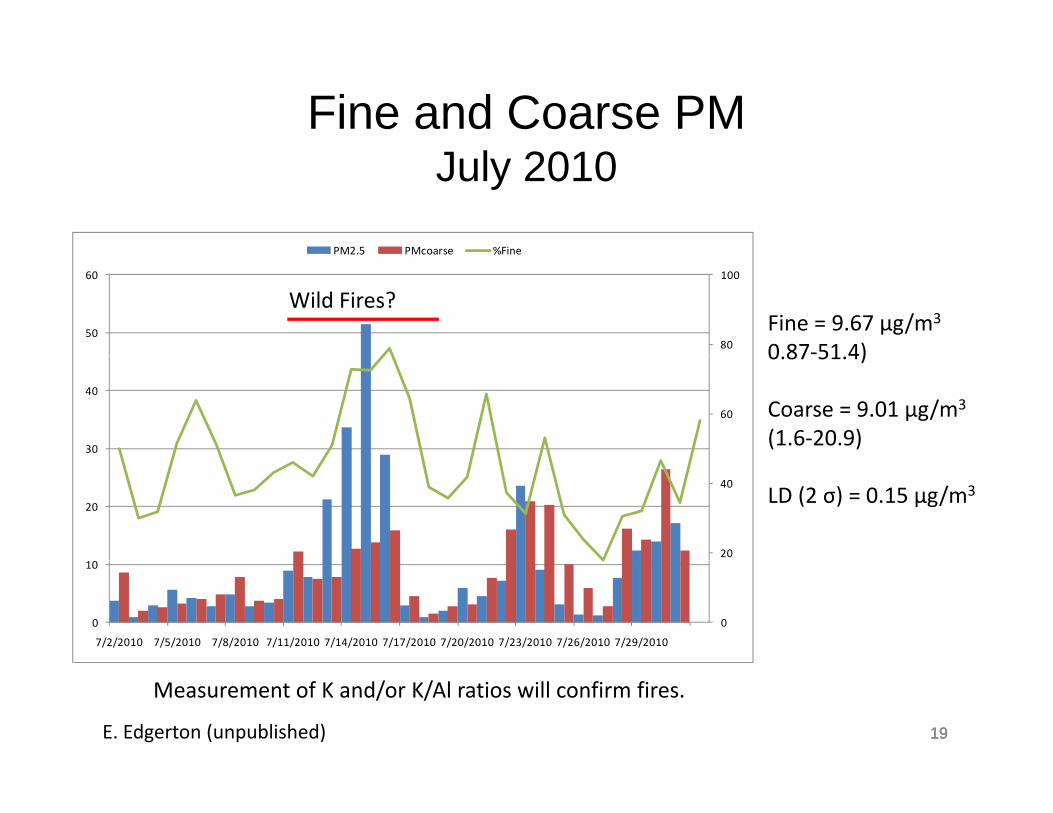
Fine and Coarse PMJuly 2010
PM2 5 PMcoarse %Fine
80
100
50
60
PM2.5 PMcoarse %Fine
Wild Fires?Fine = 9.67 µg/m3
0 87‐51 4)
60
30
40
0.87 51.4)
Coarse = 9.01 µg/m3
(1.6‐20.9)
20
40
20LD (2 σ) = 0.15 µg/m3
00
10
7/2/2010 7/5/2010 7/8/2010 7/11/2010 7/14/2010 7/17/2010 7/20/2010 7/23/2010 7/26/2010 7/29/2010
1919
Measurement of K and/or K/Al ratios will confirm fires.
19E. Edgerton (unpublished)

T t i l E i t l Eff t M it iTerrestrial Environmental Effects Monitoring (TEEM) Program
2020
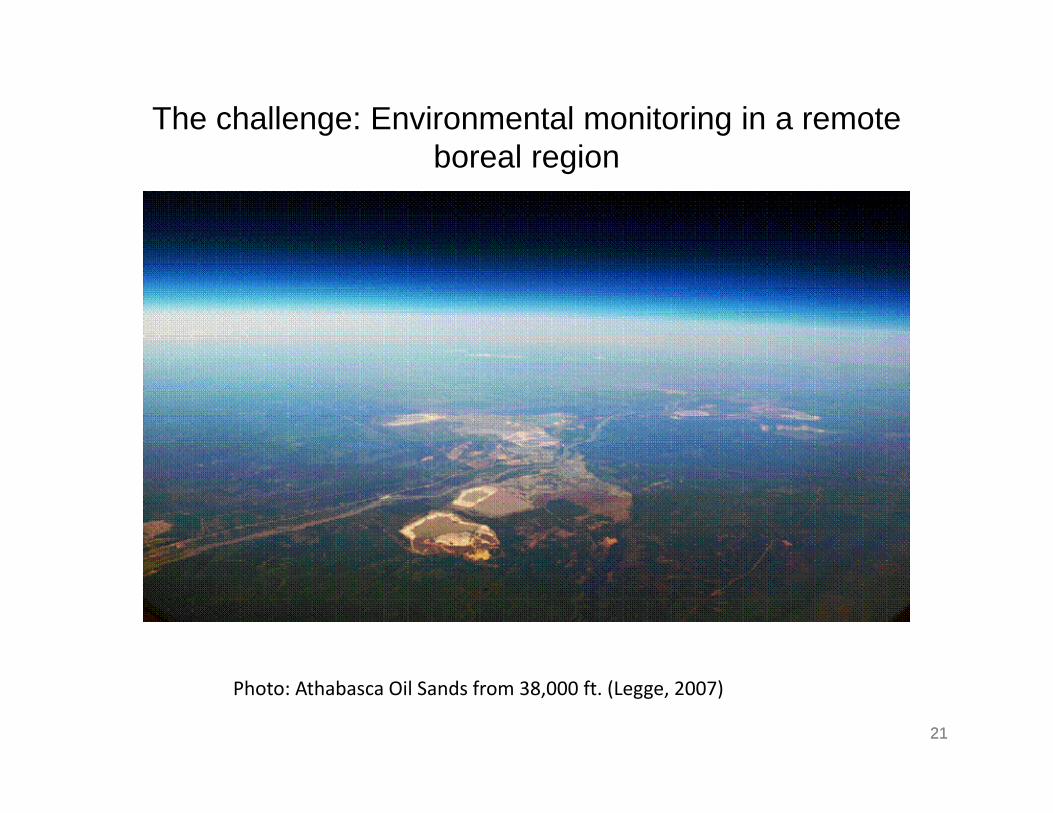
The challenge: Environmental monitoring in a remote b l iboreal region
2121
Photo: Athabasca Oil Sands from 38,000 ft. (Legge, 2007)

Pollutant pathway and WBEA activitiesEmissions
SOURCEcharacterization, apportionment
D iti dry wet bulk
Ho
Transformation photochemistry, aerosol formation
Deposition
Transfer to terrestrial
dry, wet, bulk ours daDeposition velocity/flux
Effects on Individuals
Eff A bl
foliar, tree, mosses, lichens, soil biology
ays ye
Effects on Assemblages
Biogeochemistry
Stand, bog, composition, condition
N, S, C, H2O, major ions, metals
ears d
Bioaccumulation
Structure and Function pollution, insects, climate, resilience, health
traditional food quality
decades
Hydrology
SINK22

We are calculating “Real‐World” emission factors for emission inventory reporting y p g
232323
Dilution sampling for fixed sourcesNovel portable emissions monitoring system for heavy haulers Watson et al. 2010

DRI filter pack and VOC canister
242424
Wang et al. 2010. AWMA Speciality Conference, Xian, China, May 11‐14, 2010

Heavy Hauler Emissions October 2009
Tail Pipe CO2 (ppm)
0200004000060000
4e+7Number
Concentration(cm-3)
01e+72e+73e+74e+7
Black Carbon40
Black CarbonConcentration
(mg/m3)0
20
PM2.5 Concentration3 20
3040
(mg/m3)01020
CO(ppm) 200
400600
0
NOx
(ppm)02004006008001000
252525
IdleDump Dump Dump Dump
Load Load Load Load
Chow, J. et al. 2010

Measuring Deposition in the Remote Boreal Forest
Ion exchange resinsIon exchange resins
Passive monitoring
6
5
4(ppb
)
(a) JPH4 Yt = 1.554 + 0.349t
Passive monitoring
3
2
1C
once
ntra
tion
MAPE 14.0295MAD 0.4482MSD 0.2881
Accuracy Measures
ActualFits
20092008200720062005200420032002200120000
Year
26

Ecologically Analogous Plots Across Deposition Zones
30 m, 4 level met and inputs
Co-measurement and regional
25 new plots
COTAG
tripod
Early-warning and flux 27
Davies, M. (2010). Report to WBEA

Source Apportionment/Receptor Modeling: Li ki i i t tLinking emissions to receptors
N% in lichens
Berryman et al. 2010
282828

Full Study Results Available May 23
359 sites sampled in 2008Graney et al. (2010) pilot study results
29

MOU for the Study of Airborne PAH, Hg and Metals
PAH passives 15 sites
Hg at WBEA AMS #6
PAH passives 15 sites
Dry and wet PAH deposition
at WBEA AMS #5, 11, 13
30
Human Exposure Monitoring Program
31

AAAQO: 1 hr 10 ppb, 24 h 2 ppb H2S
3232

What species contribute to odours: Semi-continuous VOC, HC, RSC measurement in Fort McKay 2010?
Pneumatically-focused gas
canister
chromatography at AMS 1 Fort McKay
333333
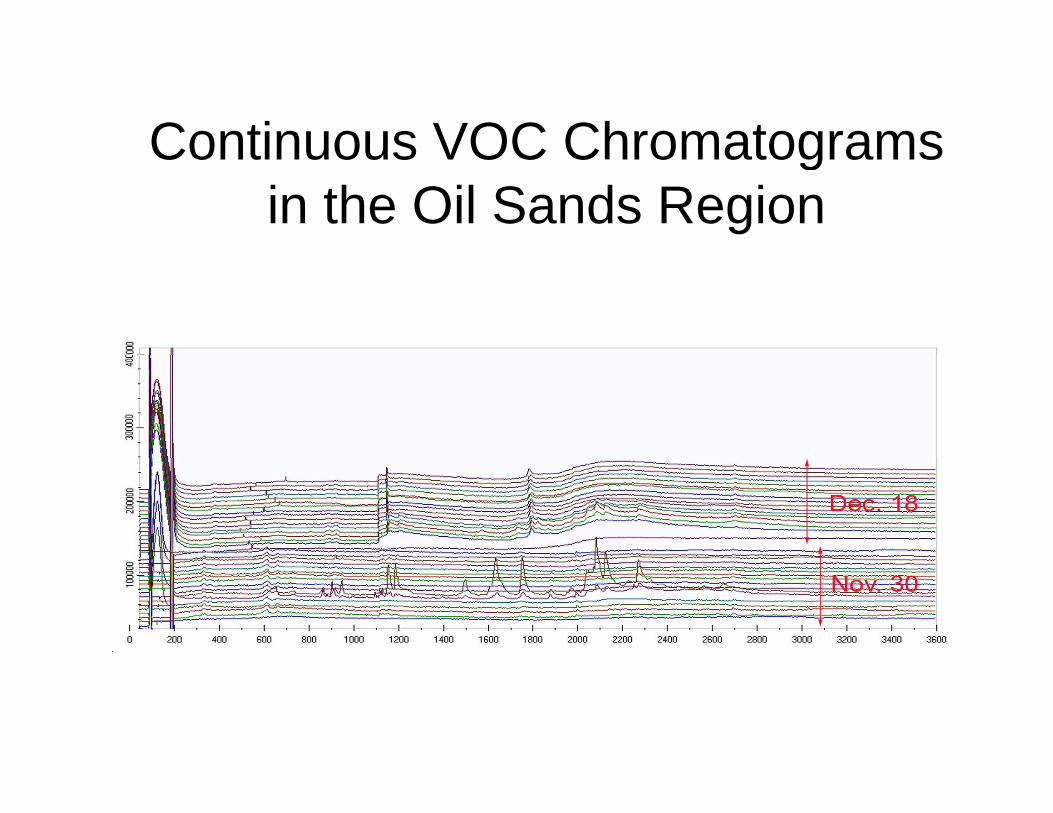
Continuous VOC ChromatogramsContinuous VOC Chromatogramsin the Oil Sands Region
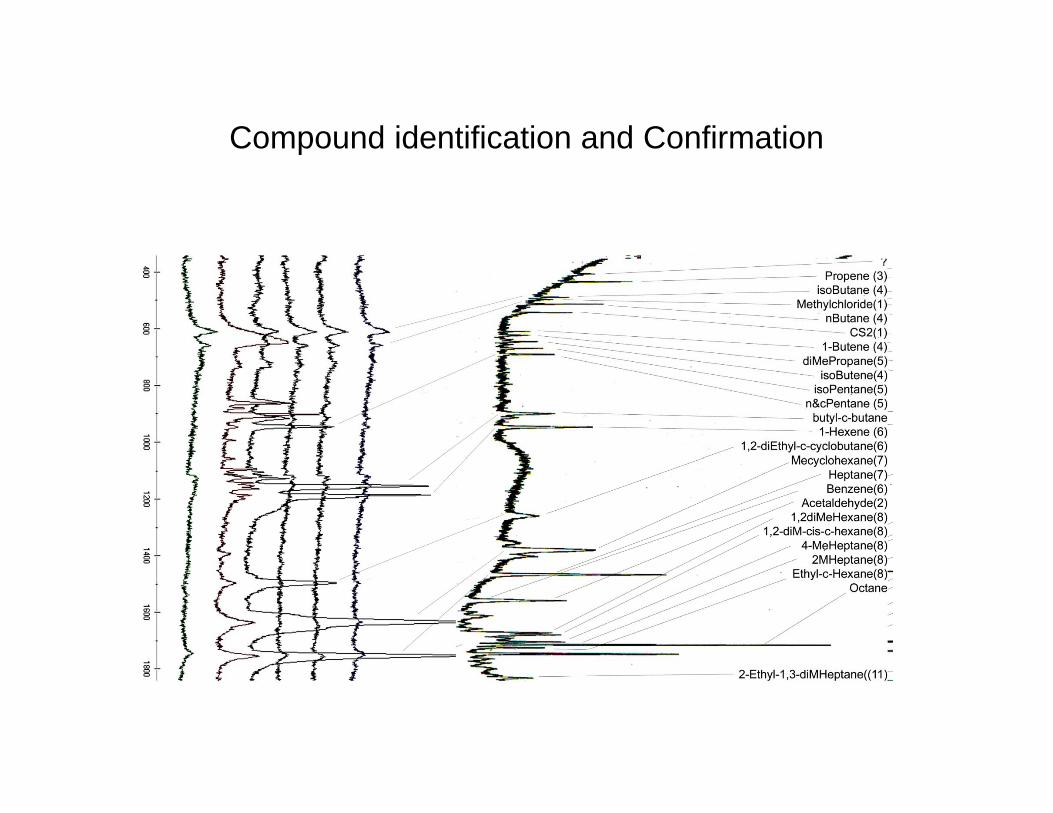
Compound identification and Confirmationp

Odour WorkshopOdour Workshop
• April 13, Sawridgep g• Over 50 attendees from Fort McKay First Nations,
ENGO, industry, GOA, WBEA. Presentations given: Od ti d t Od t h– Odour perception and measurement - Odotech
– Measurement, reporting of Exceedance of AAAQO - WBEA– Results of new odour compound speciation - WBEA– New Air Quality Health Index – AENV– Community odour compound sampling – Fort McKay

U i WBEA S i O t hUpcoming WBEA Science Outreach
International Symposium “Alberta Oil Sands: Energy Industry and the
www.apworkshop.org
• International Symposium Alberta Oil Sands: Energy, Industry and the Environment”– May 23– 12 invited papers 1 hr Panel Discussion– 12 invited papers, 1 hr Panel Discussion– Book (19 chapters) published 2012 in Elsevier Developments in
Environmental Science Series • 43rd Air Pollution Workshop43 Air Pollution Workshop
– May 24-25 oral presentations– Field Trip May 26
37

Thank You
www wbea org38
www.wbea.org