wb56 seia app2 -...
TRANSCRIPT

1
APPENDIX 2. PROJECTING THE FUTURE IN TANZANIA,UGANDA, AND RWANDA
Detailed projections of the cost and financing of secondary-schoolexpansion have been completed in Tanzania, Uganda, and Rwanda.1
The estimates have been developed for education sector reviews toshape medium-term expenditure frameworks. In each case the educa-tion system has been modeled from school and population census datato generate enrollment projections through to 2015. Primary enroll-ment growth is shaped to achieve gross enrollment rates in excess of100 percent by 2015 with reduced repetition and dropout.
The expansion of secondary enrollment is treated as a policy variableand is not linked mechanically to the growing output of primary school-ing. The reason is that growth in secondary places will not simply expandto absorb growing proportions of primary leavers. During periods whereprimary output grows fastest, primary/secondary transition rates in thesecountries are likely to fall for a period before recovering. The approachadopted in the modeling identifies different plausible rates of growth inthe number of lower-secondary places, taking into account historic ratesof school construction, capacity of teacher training, and likely changes inbudgetary allocation to secondary schooling.
Costs are generated from disaggregated Ministry of Education andMinistry of Finance data that separates costs for different types of teach-ers, nonteaching staff, and various nonsalary costs including boarding,food subsidies, and learning materials. Unit costs for different schooltypes are then used to generate cost drivers. Development costs areestimated using known school and classroom building costs.
On this basis it is possible to project flows of pupils and costs underdifferent scenarios.2 This produces estimates of budget shares needed to
42912v 3
Pub
lic D
iscl
osur
e A
utho
rized
Pub
lic D
iscl
osur
e A
utho
rized
Pub
lic D
iscl
osur
e A
utho
rized
Pub
lic D
iscl
osur
e A
utho
rized
Pub
lic D
iscl
osur
e A
utho
rized
Pub
lic D
iscl
osur
e A
utho
rized
Pub
lic D
iscl
osur
e A
utho
rized
Pub
lic D
iscl
osur
e A
utho
rized

2 • Sustainable Financing of Secondary Education in Sub-Saharan Africa
finance growth and identifies gaps in financing. As part of the analysisnonfinancial constraints on growth are also noted.
Since the three countries have differently configured education systems,different starting points, and different policy priorities, the projections varyin some of the parameters they model and in the assumptions on whichthey are based. They illustrate what is possible within affordable levels offinancing given clear prioritization and consistent implementation ofreform and expansion strategies.
CASE 1: SECONDARY-SCHOOL DEVELOPMENT IN TANZANIA
Tanzania has one of the lowest secondary-school enrollment rates inSSA and a very small proportion of its labor force has completedsecondary schooling, with adverse effects on its international competi-tiveness. Primary enrollments reached high levels in the 1970s but thenfell back in the 1980s. Since then a new commitment to achievinguniversal primary education has seen gross enrollment rates rise to over100 percent. As a result, the number of primary graduates is set to tripleby 2008/9, assuming repetition and dropout fall in line with targets thathave been set. Without expansion in secondary schooling the transitionrate will fall rapidly. This may have an adverse effect on primarycompletion rates. For these and other reasons the Secondary EducationDevelopment Programme (SEDP) has been agreed with support fromthe World Bank.
Enrollments at secondary level will not simply grow at the rate ofincrease of primary graduates. In the past the flow into governmentschools as been regulated to reflect the number of places available andthis will continue to be the case with expansion. The Tanzania ProjectionModel therefore sets rates of expansion for new enrollments in grade 8(first year secondary), and derives subsequent enrollments from thisform that include assumptions about repetition, promotion, anddropout rates based on Ministry of Education and Culture ambitions toincrease internal efficiency and increase GER2. Projected growth rates forthe nongovernment sector are based on estimates derived from analysisof recent expansion and the constraints to further growth that arise fromaffordability and school location.
The central projections presented below are based on a medium-growthvariant of the model that responds to the stated intention of increasingparticipation rates at the secondary level to closer to the average for
Appendix 2 • 3
similar SSA countries, which is about GER2 25 percent. In 2003, GER2 inTanzania was about 7 percent for government schools and 4 percent fornongovernment schools.
ASSUMPTIONS
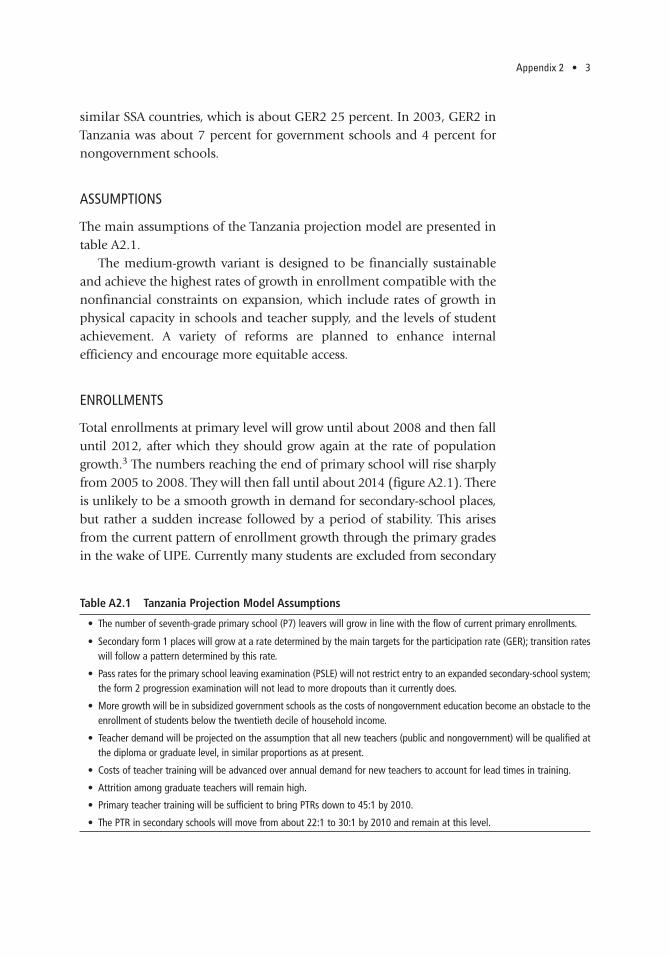
The main assumptions of the Tanzania projection model are presented intable A2.1.
The medium-growth variant is designed to be financially sustainableand achieve the highest rates of growth in enrollment compatible with thenonfinancial constraints on expansion, which include rates of growth inphysical capacity in schools and teacher supply, and the levels of studentachievement. A variety of reforms are planned to enhance internalefficiency and encourage more equitable access.
ENROLLMENTS
Total enrollments at primary level will grow until about 2008 and then falluntil 2012, after which they should grow again at the rate of populationgrowth.3 The numbers reaching the end of primary school will rise sharplyfrom 2005 to 2008. They will then fall until about 2014 (figure A2.1). Thereis unlikely to be a smooth growth in demand for secondary-school places,but rather a sudden increase followed by a period of stability. This arisesfrom the current pattern of enrollment growth through the primary gradesin the wake of UPE. Currently many students are excluded from secondary
Table A2.1 Tanzania Projection Model Assumptions
• The number of seventh-grade primary school (P7) leavers will grow in line with the flow of current primary enrollments.
• Secondary form 1 places will grow at a rate determined by the main targets for the participation rate (GER); transition rateswill follow a pattern determined by this rate.
• Pass rates for the primary school leaving examination (PSLE) will not restrict entry to an expanded secondary-school system;the form 2 progression examination will not lead to more dropouts than it currently does.
• More growth will be in subsidized government schools as the costs of nongovernment education become an obstacle to theenrollment of students below the twentieth decile of household income.
• Teacher demand will be projected on the assumption that all new teachers (public and nongovernment) will be qualified atthe diploma or graduate level, in similar proportions as at present.
• Costs of teacher training will be advanced over annual demand for new teachers to account for lead times in training.
• Attrition among graduate teachers will remain high.
• Primary teacher training will be sufficient to bring PTRs down to 45:1 by 2010.
• The PTR in secondary schools will move from about 22:1 to 30:1 by 2010 and remain at this level.

4 • Sustainable Financing of Secondary Education in Sub-Saharan Africa
education because they fail to pass the primary school leaving examination.It is assumed that the examination will cease to restrict entry over time andthat by 2010 most will pass, consistent with UPE policy (figure A2.2).
Enrollments at secondary level will be determined by the availabilityof places. The model allows increases in form 1 entrants of about 20 per-cent a year over the period until 2008, falling to 10 percent after 2010.
Figure A2.1 Total Primary Enrollment
Source: Authors’ projections.
Figure A2.2 P7 Enrollment and PSLE Passes
Source: Authors’ projections.
0
1,000,000
2,000,000
3,000,000
4,000,000
5,000,000
6,000,000
7,000,000
8,000,000
9,000,000
2003 2004 2005 2006 2007 2008 2009 2010 2011 2012 2013 2014Year
Num
ber o
f stu
dent
s
2015
0
200,000
400,000
600,000
800,000
1,000,000
1,200,000
1,400,000
Num
ber o
f stu
dent
s
S7 EnrollmentS7 Passes
2003 2004 2005 2006 2007 2008 2009 2010 2011 2012 2013 2014 2015Year

Appendix 2 • 5
The private sector is assumed to grow at 15 percent, falling to 5 percentafter 2010. Its growth will be constrained by the costs of attendance and theeconomic returns to owners. During the period of high growth, PTRs willincrease from about 22:1 to 30:1. This will reduce new teacher demandand costs (figure A2.4).
Figure A2.3 Total Enrollments at Secondary Level, Forms 1–4
Source: Authors’ projections.
Figure A2.4 Pupil-Teacher Ratios, Forms 1–4
Source: Authors’ projections.
0
200,000
400,000
600,000
800,000
1,000,000
1,200,000
1,400,000
1,600,000
1,800,000
2,000,000
Num
ber o
f stu
dent
s
Government totalNongovernment total Total
2003 2004 2005 2006 2007 2008 2009 2010 2011 2012 2013 2014Year
2015
0
5
10
15
20
25
30
35
40
PTR Government
Nongovernment
Diploma teachersto Forms 1–4Graduate teachersto Forms 5–6
2003 2004 2005 2006 2007 2008 2009 2010 2011 2012 2013 2014Year
2015

6 • Sustainable Financing of Secondary Education in Sub-Saharan Africa
ENROLLMENT AND TRANSITION RATES
Under the medium-growth scenario GER2 will grow from about 11 percentto nearly 40 percent by 2015 (with a gradual reduction in the number ofpupils outside the official age range) (figure A2.5). Transition rates will firstincrease to 35 percent by 2006, then fall to 23 percent by 2009, beforerecovering to over 24–50 percent by 2015 (figure A2.6). This fall cannot be
Figure A2.6 Transition Rates from S7 to Form 1—Government and Nongovernment
Source: Authors’ projections.
Figure A2.5 GER2, Forms 1–4
Source: Authors’ projections.Note: Currently, 40 percent of GER2 enrollment is outside the official age range of 14–17 years.
0
5
10
15
20
25
30
35
40
45
Perc
enta
ge GER governmentGER nongovernmentGER overall using 2002 census
2003 2004 2005 2006 2007 2008 2009 2010 2011 2012 2013 2014Year
2015
0
5
10
15
20
25
30
35
40
45
50
Tran
sitio
n ra
te (%
)
NominalgovernmentNominalnongovernment Nominal total
2003 2004 2005 2006 2007 2008 2009 2010 2011 2012 2013 2014Year
2015

Appendix 2 • 7
avoided and results from the expanded wave of primary-school leaversreaching secondary entrance level.
TEACHER DEMAND
The number of new teachers needed is substantial. It will require atripling or more of training capacity. Trainees will have to be enrolledbetween one and three years in advance of being needed in schools,depending on the pattern of teacher training (figure A2.7).4 Even withthese reductions in training time, demand is so high that about 20 per-cent of all upper secondary-school leavers would need to train to beteachers at peak demand (figure A2.8). This may not be realistic givenalternate opportunities.5
UNIT COSTS
Secondary unit costs are expected to increase initially (reflecting improvedquality related inputs) and then stabilize over the projection period(figure A2.9).
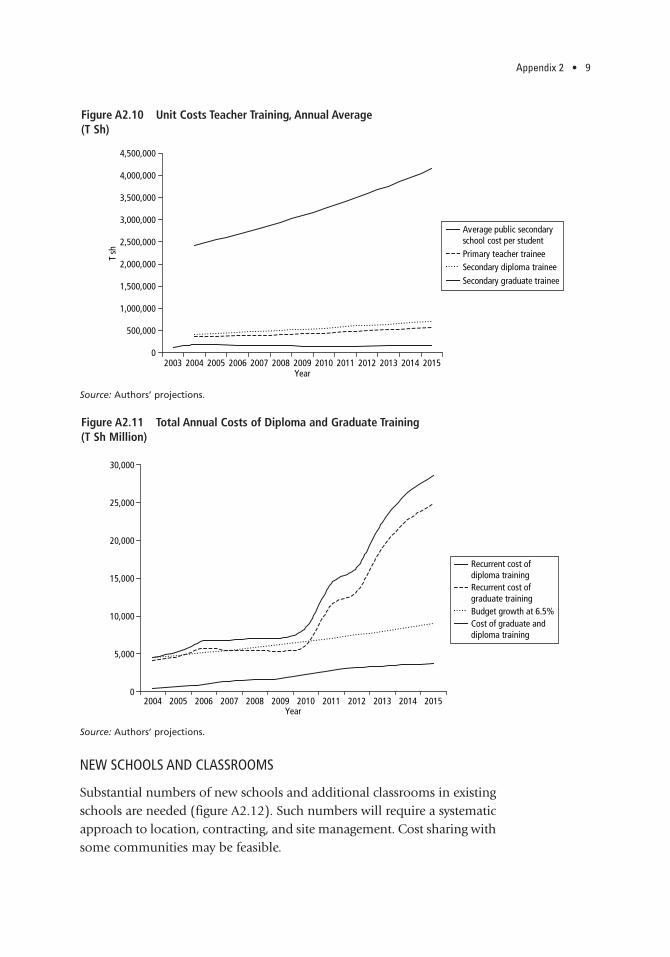
Graduate teacher training is very expensive (up to 20 times the costsof diploma training per trained teacher) and currently takes four years(figures A2.10 and A2.11). It seems likely that within five years of
Figure A2.7 Additional Teachers Needed, Graduate and Diploma Training
Source: Authors’ projections.Note: Numbers are not lagged for training time to produce increased output.
0
1,000
2,000
3,000
4,000
5,000
6,000
7,000
8,000
Num
ber o
f tea
cher
s ne
eded
Additional graduate teachersAdditional diploma teachersTotal new teachers needed
2003 2004 2005 2006 2007 2008 2009 2010 2011 2012 2013 2014Year
2015

8 • Sustainable Financing of Secondary Education in Sub-Saharan Africa
Figure A2.9 Annual Secondary School Unit Costs, Total and Teachers’ Salaries Only (T Sh)
Source: Authors’ projections.
Figure A2.8 Form 4 Leavers Entering Diploma and Graduate Training (Percent)
Source: Authors’ projections.
0
2
4
6
8
10
12
14
16
18
20
Perc
enta
ge % Diploma entrants% Graduateentrants% All eachertraining entrants
2004 2005 2006 2007 2008 2009 2010 2011 2012 2013 2014Year
2015
0
20,000
40,000
60,000
80,000
100,000
120,000
140,000
160,000
180,000
200,000
T sh
Average publicsecondary schoolcost per student Teachersalaries/student
2004 2005 2006 2007 2008 2009 2010 2011 2012 2013 2014Year
2015
graduation, teacher attrition will be least 50 percent. New policy is neededon graduate training and posting to reduce costs and attrition. Themodel assumes shorter periods for both graduate (three years) anddiploma (one year) training.
Appendix 2 • 9
NEW SCHOOLS AND CLASSROOMS
Substantial numbers of new schools and additional classrooms in existingschools are needed (figure A2.12). Such numbers will require a systematicapproach to location, contracting, and site management. Cost sharing withsome communities may be feasible.
0
500,000
1,000,000
1,500,000
2,000,000
2,500,000
3,000,000
3,500,000
4,000,000
4,500,000
T sh
Average public secondaryschool cost per student Primary teacher traineeSecondary diploma traineeSecondary graduate trainee
2003 2004 2005 2006 2007 2008 2009 2010 2011 2012 2013 2014Year
2015
Figure A2.10 Unit Costs Teacher Training, Annual Average (T Sh)
Source: Authors’ projections.
Figure A2.11 Total Annual Costs of Diploma and Graduate Training (T Sh Million)
Source: Authors’ projections.
0
5,000
10,000
15,000
20,000
25,000
30,000
Recurrent cost ofdiploma trainingRecurrent cost ofgraduate trainingBudget growth at 6.5%Cost of graduate anddiploma training
2004 2005 2006 2007 2008 2009 2010 2011 2012 2013 2014Year
2015

10 • Sustainable Financing of Secondary Education in Sub-Saharan Africa
COSTS
The recurrent annual costs of the whole system, including primary andtertiary sectors, will grow from about T Sh 375 billion to T Sh 1,000 bil-lion by 2015/16. This creates a shortfall of about T Sh 220 billion a yearwhen compared to budget growth at 6.5 percent per year. Therefore, toachieve all the outcomes projected requires additional finance.
The “finance gap” for secondary education (the difference betweenwhat is needed and what would be available from the education budgetassuming IMF-projected growth) is substantial but could be metthrough a combination of reallocation within the education budget andadditional external support (figures A2.13 and A2.14). Expenditure onprimary education will slow for a period after 2007 as total enrollmentcontracts. This could release resources for investment at other levels.
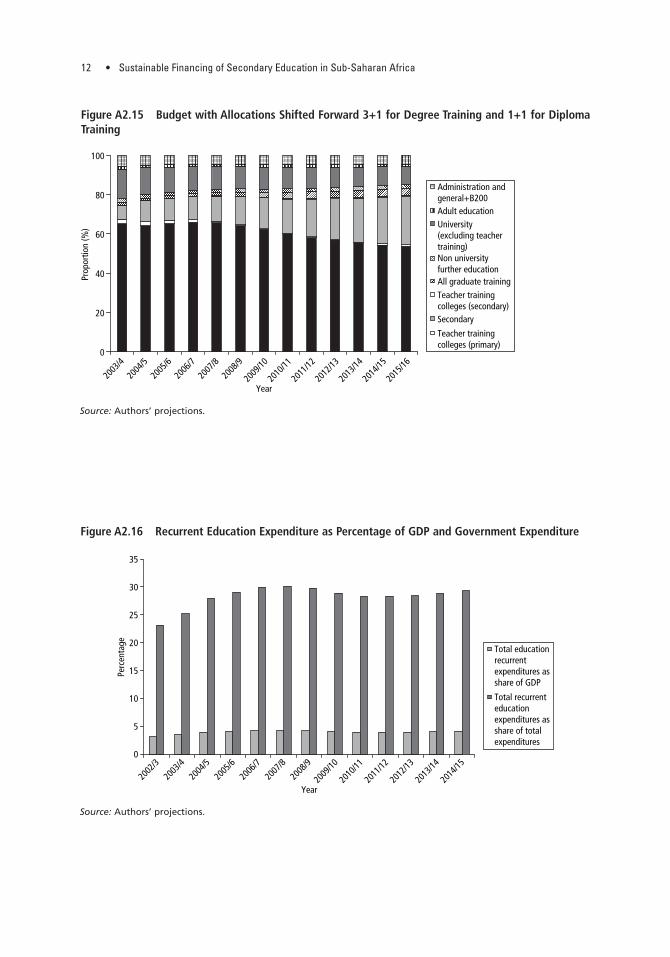
The projections can be realized by increasing secondary education’sbudget share from 7 percent to about 25 percent by 2015 (figure A2.15).Higher education allocations would grow at a slower rate than budgetgrowth and therefore shrink as a proportion of the total (figure A2.16).6
The proportion of GDP allocated to education would rise to just over4 percent and the percentage of the government budget allocated toeducation would need to settle at about 30 percent.
CONCLUSION
GER2 in Tanzania can rise to 40 percent with the assumptions of theseprojections. This enrollment rate requires a less restrictive policy on
0
200
400
600
800
1,000
1,200
1,400
1,600
1,800
Num
ber
Government schoolsNongovernment schoolsGovernment classroomsNongovernment classroomsTotal rehabilitated classrooms
2004 2005 2006 2007 2008 2009 2010 2011 2012 2013 2014Year
2015
Figure A2.12 Number of Schools, Classrooms, and Classroom Rehabilitations Needed
Source: Authors’ projections.

Appendix 2 • 11
0
200
400
600
800
1,000
1,200
Year
T sh
bill
ions
Total budget (T Sh billions)(growth using IMF projections)PrimaryTeacher training colleges(primary and secondary)
SecondaryAll graduate training
University (excluding teachertraining)Total budget needed
2003
/4
2004
/5
2005
/6
2006
/7
2007
/8
2008
/9
2009
/10
2010
/11
2011
/12
2012
/13
2013
/14
2014
/15
2015
/16
Figure A2.13 Recurrent Budget and Expenditure by Subsector (T Sh Billion)
Source: Authors’ projections.
Figure A2.14 Finance Gap, Recurrent and Development Expenditures—Secondary Education Only(T Sh Billions)
Source: Authors’ projections.Note: No forward shift of development expenditure shown.
0
50
100
150
200
250
300
350
T sh
bill
ions
Secondary recurrentgap - schools + teachertrainingSecondary developmentgap - schools + teachertrainingTotal gap (T Sh billions)
2004 2005 2006 2007 2008 2009 2010 2011 2012 2013 2014Year
2015
promotion from primary education, substantial school and classroombuilding, greatly expanded teacher training, and higher PTRs at the sec-ondary level. It also requires reforms in curriculum to increase relevanceand achievement that can help reduce repetition and dropout rates.
12 • Sustainable Financing of Secondary Education in Sub-Saharan Africa
0
5
10
15
20
25
30
35
Perc
enta
ge
Total educationrecurrentexpenditures asshare of GDP
Total recurrenteducationexpenditures asshare of totalexpenditures
Year20
03/4
2002
/3
2004
/5
2005
/6
2006
/7
2007
/8
2008
/9
2009
/10
2010
/11
2011
/12
2012
/13
2013
/14
2014
/15
Figure A2.16 Recurrent Education Expenditure as Percentage of GDP and Government Expenditure
Source: Authors’ projections.
0
20
40
60
80
100
Prop
ortio
n (%
)
Administration andgeneral+B200Adult educationUniversity(excluding teachertraining)Non universityfurther educationAll graduate trainingTeacher trainingcolleges (secondary)Secondary
Teacher trainingcolleges (primary)
Year20
03/4
2004
/5
2005
/6
2006
/7
2007
/8
2008
/9
2009
/10
2010
/11
2011
/12
2012
/13
2013
/14
2014
/15
2015
/16
Figure A2.15 Budget with Allocations Shifted Forward 3+1 for Degree Training and 1+1 for DiplomaTraining
Source: Authors’ projections.
Appendix 2 • 13
Changes in budget shares and feasible additional financing are neededto achieve these outcomes.
CASE 2: POSTPRIMARY EDUCATION AND TRAINING (PPET) IN UGANDA7
Uganda has developed its education system consistently since itreturned to stable government. Gross enrollment rates at primary edu-cation are over 110 percent and it is thought that over 90 percent ofchildren enter grade 1. After the announcement of free UPE the num-bers enrolled in primary increased substantially. The number graduat-ing from grade 7 is set to more than double by 2010 and the selectionof students into secondary school is becoming a very visible politicalissue. Since the late 1990s nongovernment secondary schools havemushroomed, most being run commercially for profit. The non-government sector appears to be reaching the limits of affordabilityand growth has now slowed. The government of Uganda has developeda new policy on PPET to meet rising demand and increase access to sec-ondary schools and beyond.
The goals of new investment in Uganda’s PPET can be defined as fol-lows:
• expanding access to populations currently excluded in an equitableway
• improving quality, relevance, and consequently achievement in knowl-edge, skills, and competencies that are fundamental to subsequentlearning, employment, and livelihoods
• providing opportunities to develop higher-level knowledge, skills, andcompetencies that have utility and are valued
• encouraging values, motives, and behaviors consistent with nationalaspirations and needs
A framework for policy has been developed through a broad consul-tation. It identifies achievable policy goals costed to fall within a realisticbudgetary envelope. The Uganda baseline projection for PPET contains anumber of assumptions and a range of programmatic activities designedto achieve stated government goals at sustainable cost. Specifically, thebaseline would allow the UPE “bulge” of enrollments to be absorbedwithout a serious decline in transition rates, and with increasing GER2. Itanticipates the building of secondary-level institutions operating at costssimilar to day secondary schools in every subcounty currently withoutsuch a facility by 2011. The baseline projection also supports a substantial

14 • Sustainable Financing of Secondary Education in Sub-Saharan Africa
program of classroom and institutional rehabilitation to make full use ofexisting assets.
A package of reforms is envisaged that include those focused onimproved access and equity through school and classroom building, pro-poor capitation, fee waivers, and bursary schemes, and new provision inunderserved areas. Improved efficiency is needed and can be achievedthrough management reforms, raising the PTR, increasing teachers’ timeon task, reducing repetition, adopting formula funding of schools,improving accountability, using matching grants to generate additionalresources, and reducing the number of small schools. Improved qualityshould arise from a reformed core curriculum with more a concentratedcore, a more outcomes-based curriculum linked to attainment targets,much improved textbook provision, more school-based teacher educa-tion, and more effective regulation of the private sector.
OUTCOMES ACHIEVABLE WITH AN INTEGRATED PPET POLICY
• increased secondary participation to levels where more than half of allchildren could complete four years of secondary level education andtraining
• provision of secondary-level institutions in all subcounties with lowfee schools in the poorest areas
• improved access for girls and other disadvantaged groups through anexpanded bursary scheme and other measures
• rehabilitation of existing business, technical, vocational, educational,and training (BTVET) institutions
• creation of some specialized science and technology institutions toserve marginalized areas
• improved efficiency through better school management of teachersand other resources
• implementation of a core curriculum focused on basic and generallyuseful knowledge and skills, relevant both to school leavers and thosewho continue studying, consisting of a limited number of subjectsteachable in all types of schools including the smallest
• provision of curriculum pathways that could include more activity-basedwork, focused on skills and competencies valued by the labor market,and offered in schools that decided to offer a broader range of options
• development of more competence-based and attainment-target-relatedcurricula and examinations linked to minimum and desirable standards
• realization of the goal that all children have access to textbooks in coresubjects

Appendix 2 • 15
• promotion of outreach activities using school and other facilities tooffer short, modularized, skill-based training at the community leveland at affordable costs
• integration of school-level PPET provision within a coordinatedstrategy inclusive of secondary schools and BTVET institutions
• reconfiguration of postsecondary, preuniversity, further education andtraining into a coherent system
• rationalization of systems of qualifications to recognize equiva-lences between pathways to certified competence in employment-related skills
THE BASELINE MODEL
The Uganda baseline model assumes that the medium-term budgetaryframework (MTBF) will allow growth in resources at 6.5 percent per yearand that overall transition rates from primary to secondary can be sus-tained at 40–50 percent as the wave of increased primary enrollmentpasses through the system. GER2 will climb from 30 percent to over45 percent, a level at which gender parity is more likely. Entrants to gov-ernment schools would grow at 7.5 percent per year for the first five yearsand then slow to 5 percent per year. It is assumed that private sectorgrowth will continue but begin to slow as price constraints exclude low-income households. Enrollment should climb in government schools toabout 610,000 and private schools to 720,000, although the latter figuremay be optimistic. This would occur alongside a rise in the PTR fromabout 23:1 to 30:1. The demand for newly trained teachers would besomewhat less than 1,500 per year for government schools and about2,000 per year for private schools.
The baseline model requires about 16 percent of total public recur-rent expenditure on education to be allocated to secondary and about4 percent to BTVET. The latter is likely to be an overestimate given thepast performance of the sector. Overall about 20 percent of the recurrenteducation budget would need to be allocated to PPET. The proportion ofdevelopment expenditure needed would be less. This scenario is plausi-ble, especially if growth in subsidies at the tertiary level was restrained.
Total primary enrollments are likely to grow from about 7 million toa peak of 8 million in 2005. By 2012 they fall back to 7 million as theeffects of UPE work their way through (figure A2.17). If dropouts fall thenthe total enrollment will remain at higher levels. Falling repetition woulddecrease total enrollments as the cohort moves through the grades morequickly. Age cohort growth is assumed at 3 percent. The number of primary

16 • Sustainable Financing of Secondary Education in Sub-Saharan Africa
graduates passing the PSLE peaks in 2005 (650,000) and 2009 (825,000)and then declines (figure A2.18). These graduates constitute the cohortseeking access to secondary form 1 (S1).
In 2002, about 102,000 PSLE holders were selected for entry to S1 ingovernment schools. Private schools provided 131,000 places. High rates
0
200,000
400,000
600,000
800,000
1,000,000
1,200,000
Num
ber o
f stu
dent
s
Enrollment P7Primary schoolleavingcertificate passes
200320022001 2004 2005 2006 2007 2008 2009 2010 2011 2012Year
Figure A2.18 Primary Enrollment in P7 and PSLE Passes
Source: Authors’ projections.
0
1,000,000
2,000,000
3,000,000
4,000,000
5,000,000
6,000,000
7,000,000
8,000,000
9,000,000
Num
ber o
f stu
dent
s
200320022001 2004 2005 2006 2007 2008 2009 2010 2011 2012Year
Figure A2.17 Primary Enrollment
Source: Authors’ projections.

Appendix 2 • 17
of growth in the private sector are unlikely. It seems probable that fee ratesfor private secondary schools are approaching the limit of affordabilityfor the marginal household. This projection plans for secondary entrantsto government schools to grow to about 160,000 by 2010 (figure A2.19)
In 2002 the nominal transition rate into S1 government schools wasabout 23 percent and into private schools 32 percent (figure A2.20).
0
20,000
40,000
60,000
80,000
100,000
120,000
140,000
160,000
180,000
200,000
Num
ber o
f stu
dent
s
200320022001 2004 2005 2006 2007 2008 2009 2010 2011 2012Year
Figure A2.19 Enrollment in S1 Government
Source: Authors’ projections.
0
10
20
30
40
50
60
Perc
enta
ge GovernmentPrivateOverall
20032002 2004 2005 2006 2007 2008 2009 2010 2011 2012Year
Figure A2.20 Nominal Transition Rate P7–S1 (Percent)
Source: Authors’ projections.

18 • Sustainable Financing of Secondary Education in Sub-Saharan Africa
The projection illustrates how transition rates will decline and thenrecover over a 10-year period on current assumptions about growth inresources and places. This is unavoidable unless the secondary-schools sys-tem is reformed more radically to provide places at much lower unit costs.
ENROLLMENT GROWTH
Secondary-school enrollments in government schools will increase fromabout 375,000 to over 620,000 and private schools are likely to growfrom perhaps 420,000 to over 625,000 over the projection period to 2012(figure A2.21). Technical/farm schools and technical institutes are likelyto enroll less than 20,000 by 2012. The level may be even lower given thecurrent pattern of preference for such schools. A total of 3,400 candidatesapplied for technical/farm school in 2002 and less than 2,000 wereaccepted on the basis of the lowest grade of PSLE pass. This is less than 1percent of P7 enrollment.
Enrollment patterns in secondary schooling are assumed to remainstatic in terms of repetition (which is already low), and dropout. Ifdropout rates are reduced, enrollment should increase, but this seemsunlikely unless direct-to-households costs fall. Fees and other costs couldbe reduced in government schools. Most obviously, increased PTRswould reduce salary costs per child and some of the benefit might be
0
100,000
200,000
300,000
400,000
500,000
600,000
700,000
800,000
Num
ber o
f stu
dent
s
GovernmentPrivateOther BTVET institutions
200320022001 2004 2005 2006 2007 2008 2009 2010 2011 2012Year
Figure A2.21 Total Enrollment, Government and Private
Source: Authors’ projections.

Appendix 2 • 19
passed on in the form of reduced fees. Other cost-saving measures mightalso be possible, assuming management systems were introduced thatwere sensitive to costs and efficiency.
The output from the national teacher colleges (NTCs) is above thatjustified by new demand, and does not take into account the stock oftrained teachers who have recently graduated and have not beenemployed as teachers—these may number as many as 20,000. NTCenrollment should therefore fall. However, the cost implications of thiscannot be simulated until a decision is made on what would be donewith the staff of these institutions. Enrollments and the costs in the NTCshave been held constant in the baseline model.
Enrollments in the BTVET system assume that enrollments in thepost-school colleges, technical institutes, and technical schools/farmschools grow at 5 percent per year (figure A2.22). These BTVET collegeshave high unit costs, which constrain growth. Their enrollment shouldgrow faster than 5 percent under different arrangements wherebytheir structures, governance, and financing are substantially reformedand cost recovery applied to areas of effective demand. The currentprojections only account for fully subsidized places. There is considerableuncertainty about the numbers of privately financed students actuallyenrolled. Publicly supported enrollment should increase by about60 percent over the projection period to over 40,000 (including NTCsand 14 new community polytechnics).
0
5,000
10,000
15,000
20,000
25,000
Num
ber o
f stu
dent
s
CP students
Technical schools
Techical institutes
All subsidised students
NTCs
20032002 2004 2005 2006 2007 2008 2009 2010 2011 2012Year
Figure A2.22 Enrollment in BTVET
Source: Authors’ projections.

20 • Sustainable Financing of Secondary Education in Sub-Saharan Africa
0
2,000
4,000
6,000
8,000
10,000
12,000
14,000
16,000
18,000
Num
ber o
f tea
cher
s
Teachers on payrollTeachers off payrollCP teachers
200320022001 2004 2005 2006 2007 2008 2009 2010 2011 2012Year
Figure A2.23 Teachers On and Off Payroll (Government Schools)
Source: Authors’ projections.
DEMAND FOR TEACHERS
The proposed increases in PTR from about 22:1 to 33:1 by 2012 are centralto the affordability of increases in the supply of government school places.If these increases do not occur then public costs will escalate and participa-tion rates will not rise fast without large budgetary increases for PPET.
In 2002 employment of on-payroll teachers was estimated at about14,400. This may be slightly optimistic: at the end of 2001 about 13,000were employed. Since then an uncertain number have been taken ontothe payroll as some grant-maintained schools have been taken over. Thenumber of teachers employed rises in the simulation to about 17,000 by2012. This ceiling is necessary to stay within the resource envelope.
About 15 percent of teachers in government schools are not onthe payroll but are financed from other income including school fees(figure A2.23). It has been assumed that this proportion stays constant.This does not preclude these teachers joining the payroll as teachersretire or leave the service and being replaced by others.
The model assumes that the proportion of graduate teachers increasesat 2 percent per year from current levels. The indications are that less than1,400 new teachers are required in government schools per year as a resultof expansion, attrition at 5 percent, and an increasing PTR (figure A2.24).This is well below the output of the NTC system and the output of otherproviders of teachers at tertiary level, which appears to exceed about

Appendix 2 • 21
7,000 per year. Even if new demand from private schools is consideredthe totals are still within current training capacity. When including thestock of unemployed teachers (perhaps 20,000 or more) available fromprevious years’ training as a result of recruitment freezes, the real demandfor newly trained teachers diminishes to very low levels.
UNIT COSTS
Figure A2.25 shows unit costs for different subsectors for 2001. This indi-cates that public unit costs for secondary-level provision vary from aboutU Sh 145,000 to over U Sh 700,000 and that colleges often exceed U Sh 1million. University costs usually exceed U Sh 3 million per student (notshown). Community polytechnics have been costed at two levels—thatproposed in the last BTVET development plan, and that suggested by theconstrained figures used to define the low-cost pilot suggested in this report.
General secondary schools are relatively cost effective in providingadditional places to expand access. Pass rates are also higher in secondaryschools than in technical/farm schools and technical institutes, raising thedifferential for costs per successful graduate to over 4:1—that is, foursecondary-school places cost as much as one technical/farm school place.Simply put, the mix of school types chosen for expansion will determinethe number that can be afforded within the resource envelope in a ratiosimilar to that of their recurrent costs.
0
200
400
600
800
1000
1200
1400
1600
1800
Teac
hers
nee
ded
Government teachersPrivate teachersNew CP teachers
20032002 2004 2005 2006 2007 2008 2009 2010 2011 2012Year
Figure A2.24 Total New Teachers Needed
Source: Authors’ projections.

22 • Sustainable Financing of Secondary Education in Sub-Saharan Africa
DEVELOPMENT ACTIVITIES
The resource envelope created by assumed growth of 6.5 percent peryearin the MTBF is sufficient to allow the construction of up to 300 newclassrooms per year accommodating 50 pupils at a cost of U Sh 8 millionper classroom; rehabilitation of up to 140 unusable classroom spaces peryear at U Sh 2.5 million; up to 60 new schools per year at a cost of U Sh140 million; and construction of up to 40 laboratories/workshops peryear at about U Sh 20 million. It would allow the construction of 14 com-munity polytechnics at U Sh 200 million. This would allow the increasedenrollments in government schools indicated in previous figures. Changingthe cost assumptions would change the volume of activity that could besustained. If cost management could successfully reduce building costs,more structures could be provided.
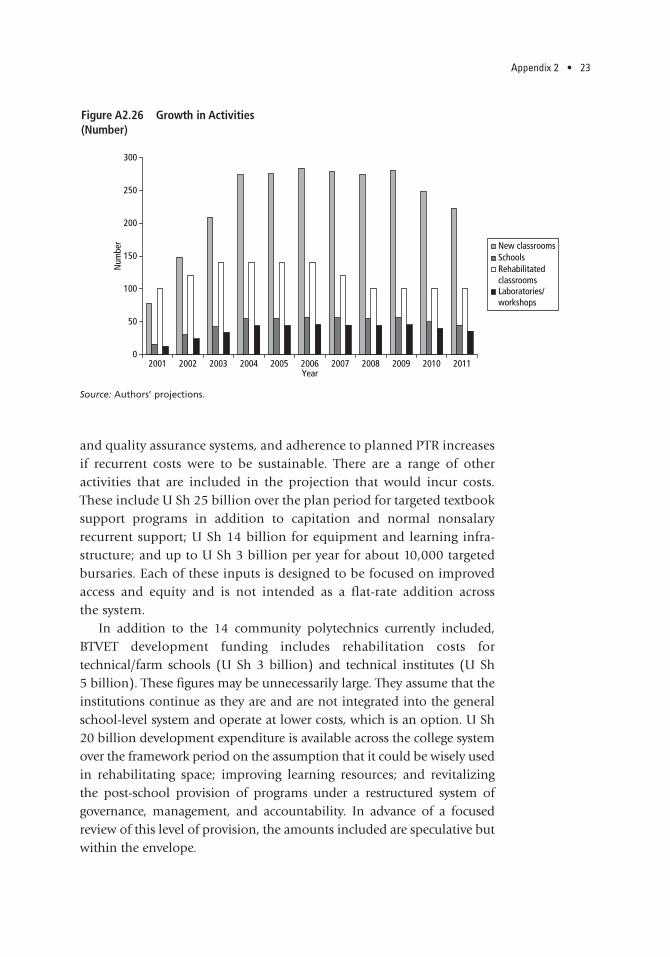
In sum, these activities would result in the development of 470 newschools and 14 community polytechnics by 2012, which is more thanenough to ensure that every subcounty currently lacking a secondaryschool acquired one, over 2,300 new classrooms could be added toexisting schools, about 1,200 classrooms could be rehabilitated, andover 350 laboratories or workshops could be built (figure A2.26). Thissubstantial rate of construction could be afforded, along with the recur-rent cost burden it creates, but it would require efficient procurement
0
200,000
400,000
600,000
800,000
1,000,000
1,200,000
1,400,000
1,600,000
1,800,000
2,000,000
Institutions
U s
h
Govt S
ec Sc
hools
Tech
Sch/F
arm Sc
hools
Tech
nical
Institu
tes
Ugand
a Coll
eges
of Com
merce
Ugand
a Tech
nical
Colleg
es
Agricu
ltural
Colleg
es
Coope
rative
Colleg
e
Health
Train
ing Coll
eges
Meteoro
logy T
rainin
g Coll
ege
Health
Tutor
s Coll
ege
Hotel o
f Tou
rism
Wild Li
fe an
d Tou
rism
Nation
al Te
ache
rs Coll
eges
Origina
l CP
Modifie
d CP
CP Ins
tructo
rs Coll
ege
PTCs I
NSET
PTCs P
reSET
Figure A2.25 Government Estimates of Unit Costs for 2002 (U Sh)
Source: Authors’ projections.
Appendix 2 • 23
and quality assurance systems, and adherence to planned PTR increasesif recurrent costs were to be sustainable. There are a range of otheractivities that are included in the projection that would incur costs.These include U Sh 25 billion over the plan period for targeted textbooksupport programs in addition to capitation and normal nonsalaryrecurrent support; U Sh 14 billion for equipment and learning infra-structure; and up to U Sh 3 billion per year for about 10,000 targetedbursaries. Each of these inputs is designed to be focused on improvedaccess and equity and is not intended as a flat-rate addition across the system.
In addition to the 14 community polytechnics currently included,BTVET development funding includes rehabilitation costs fortechnical/farm schools (U Sh 3 billion) and technical institutes (U Sh5 billion). These figures may be unnecessarily large. They assume that theinstitutions continue as they are and are not integrated into the generalschool-level system and operate at lower costs, which is an option. U Sh20 billion development expenditure is available across the college systemover the framework period on the assumption that it could be wisely usedin rehabilitating space; improving learning resources; and revitalizingthe post-school provision of programs under a restructured system ofgovernance, management, and accountability. In advance of a focusedreview of this level of provision, the amounts included are speculative butwithin the envelope.
0
50
100
150
200
250
300
Num
ber New classrooms
SchoolsRehabilitatedclassroomsLaboratories/workshops
200320022001 2004 2005 2006 2007 2008 2009 2010 2011Year
Figure A2.26 Growth in Activities (Number)
Source: Authors’ projections.

24 • Sustainable Financing of Secondary Education in Sub-Saharan Africa
PROJECTIONS
Under this projection scenario GER2 would increase from about 35percent to over 45 percent by 2012. Enrollment should be distributedbetween government and private schools in similar ratios to those thatcurrently exist. For reasons mentioned above, it is not realistic to expectprivate sector enrollment to continue to grow faster than in govern-ment schools because of cost constraints related to the distribution ofhousehold incomes. The GER2 for four years of secondary is shownbelow (figure A2.27). These estimated GERs might be higher if censusdata establish that population growth rates are falling. At the end of theprojection period they reach about 45 percent. Faster progress is notpossible within the resource envelope.
RECURRENT AND DEVELOPMENT EXPENDITURE
It is assumed that the MTBF grows at 6.5 percent from baseline levels in2002. Secondary recurrent expenditure tracks the MTBF with little morethan a 5 percent overspend over the period. Secondary developmentexpenditure is in greater proportional deficit on a much smaller base asa result of the substantial investment in construction to create capacity.This should not be problematic and is an investment that will be repaidin future years as enrollment rate growth falls and development needs
0
5
10
15
20
25
30
35
40
45
50
Perc
enta
ge GovernmentPrivateOverall
200320022001 2004 2005 2006 2007 2008 2009 2010 2011 2012Year
Figure A2.27 Nominal GER2, 2001–12
Source: Authors’ projections.

Appendix 2 • 25
0
20
40
60
80
100
120
140
U s
h bi
llion
s Recurrent expendituresecondaryDevelopmentexpenditureMTBF recurrentMTBF development
20032002 2004 2005 2006 2007 2008 2009 2010 2011 2012Year
Figure A2.28 Recurrent and Development Expenditure, Secondary Education
Source: Authors’ projections.
diminish. Construction to appropriate standards should be discountedover the lifetime of buildings, which should be at least 50 years. Ifgrowth was as low as 5 percent in the government budget, then largerdeficits would appear over 10 percent of the recurrent budget that wouldneed addressing.
The BTVET recurrent budget is in surplus even when the recurrent costof the 14 pilot community polytechnics is included (the polytechnics arecosted at U Sh 200 million to build, 24:1 PTR, and U Sh 50,000 per pupil(that is, three times normal secondary-school capitation). The surplusesare a little less than the projected secondary deficits.
The balance of expenditure varies over time when projected expenditureis compared with the MTBF growing at 6.5 percent. Although both gen-eral secondary and BTVET parts of the budget are close to balance, theydeliver different levels of access and participation per Ugandan shillingbecause of their related unit costs. The secondary-school system currentlycosts about U Sh 65 billion per year, and enrolls an estimated 370,000pupils (2002). The BTVET technical/farm schools and technical institutesappear to enroll about 12,000 at a recurrent cost of about U Sh 5 billion(see figures A2.28–A2.31).
The proportion of the recurrent education budget that would beneeded to sustain the projection and its activities is shown in figure A2.32.Secondary would require about 17 percent of the education budget andBTVET 3 percent. This totals 20 percent—more than allocations in recentyears, which have totaled about 18 percent.

26 • Sustainable Financing of Secondary Education in Sub-Saharan Africa
The baseline projection requires an increase in the allocation tosecondary and BTVET if it is to be realized. The following actions canreduce the shortfall:
• Initial teacher training in NTCs and for community polytechnic teachersis scaled down.
• BTVET recurrent costs are overestimated as a result of projectingenrollment growth from baseline enrollment figures and unit coststhat are themselves overestimates.
–10
–5
0
5
10
15
Billi
ons
U s
h
SecondaryBTVET CPsBTVET no CPs
2003
2002
2004
2005
2006
2007
2008
2009
2010
2011
2012
Year
Figure A2.30 Balance of Recurrent Expenditure, MTBF at 6.5 Percent
Source: Authors’ projections.
0
5
10
15
20
25
30
35
40
45
U s
h bi
llion
s Recurrent no CPsRecurrent with CPsRecurrent MTBFDevelopmetnt no CPsDevelopment with CPsDevt MTBF
20032002 2004 2005 2006 2007 2008 2009 2010 2011 2012Year
Figure A2.29 Recurrent and Development Expenditure, BTVET
Source: Authors’ projections.

Appendix 2 • 27
• Faster progress towards PTR targets is achieved, which would reducegrowth in teachers’ salaries.
• New arrangements are made for medium-term strategic developmentof the post-school colleges, which involve greater cost recover for thosein demand and redeployment for those with few students.
–8
–6
–4
–2
0
2
4
6
Billi
ons
Ush
SecondaryBTVET CPsBTVET no CPs
2003
2002
2004
2005
2006
2007
2008
2009
2010
2011
2012
Year
Figure A2.31 Balance of Development Expenditure, MTBF at 6.5 Percent
Source: Authors’ projections.
0
5
10
15
20
25
Perc
enta
ge
Recurrent expenditureon education forBTVETRecurrent expenditureon education forsecondary
200320022001 2004 2005 2006 2007 2008 2009 2010 2011 2012Year
Figure A2.32 Percentage of Public Recurrent Expenditure on Education Needed for Secondary Education and BTVET
Source: Authors’ projections.

28 • Sustainable Financing of Secondary Education in Sub-Saharan Africa
CONCLUSION
Uganda can increase participation at the secondary level and substantiallystay within affordable levels of financing. The financial shortfall is aboutU Sh 8 billion a year for recurrent and development costs for secondaryand BTVET, and is less than 10 percent of the total education budget overthe projection period. Increased secondary participation can only beachieved if PTRs increase, curriculum reform takes place to adapt to theneeds of expanded groups of pupils, and expansion is concentratedingeneral secondary schools rather than high-cost BTVET institutions.Scaling down teacher training to reflect demand could create savings thatwould reduce financing gaps.
CASE 3: NINE YEAR BASIC EDUCATION IN RWANDA
The government of Rwanda has committed itself to providing nine yearsbasic education to meet its aspiration to expand access to lower-second-ary education for all Rwandan children. At the heart of this commitmentis the desire to ensure that all children, irrespective of socioeconomicbackground, have access to a minimum level of education that providesbasic skills and knowledge for useful citizenship, and provides thefoundation for postbasic education. According to the Education SectorStrategic Plan 2002 (amended April 2003), “The government’s primaryobjective in vision 2020 for education is to provide Universal PrimaryEducation (UPE—grades 1 through 6) by 2010 and subsequently BasicEducation (grades 1 through 9 for all by 2015.” The government also seesthe move towards 9-year basic education as part of its poverty reductionstrategy, designed to build on and complement the achievement ofgender-equitable primary schooling.
The Ministry of Education gives priority to the development of primaryeducation in the Education Sector Strategic Plan. Much remains to beachieved. Repetition and dropout in primary education is a very seriousproblem and may not fall as planned, quality and achievement are veryvaried and far from satisfactory, classrooms and learning material needfurther investment, and double-shift schools constitute over 85 percent ofschools at grades 1–3. The development of Nine Year Basic Education mustprotect the gains made so far and ensure that improvements in access, par-ticipation, and completion continue. This implies continued prioritizationof the sector, including the following actions:
• Make about 50 percent of educational resources available for primaryeducation.

Appendix 2 • 29
• Diminish PTRs to allow reductions in double shifting.• Make investments in learning material to increase the number of
books per child to at least 1:3 in core subjects within a developmentalcurriculum.
• Enhance teacher training and support in-service. • Improve quality and quantity of physical infrastructure.
Double shifting is a particular issue because it is concentrated among theyoungest pupils. They are most at risk of premature dropout and repetition,and may also experience the least-qualified teachers at a time when theirlearning needs, and their capacity to learn, are probably greatest. Doubleshifting may have a different impact on boys and girls whose responsibili-ties outside the school vary. This is both a curriculum issue (curricula haveto be such that they can be taught successfully to at least 80 percent of pupilsunder the conditions that actually exist), and one of physical capacity. Pre-vious plans have assumed double shifting continues at current levels. If itdoes, repetition and dropouts are unlikely to fall, and the least-qualifiedteachers will continue to have the highest workloads. If the PTR can be low-ered to 45:1 and feasible investment in classroom buildings made over a10-year period, double shifting could be considerably reduced, with benefitsfor time on task, more attention to learners’ needs, and higher-quality learn-ing, leading to less repetition (see Appendix 5). Total numbers of childrenin primary schools are likely to fall between 2005 and 2015, after which theywill begin to increase again at the rate of population growth among six yearolds. This is a window of opportunity to improve the quality of access.
Expansion at Tronc Commun (lower secondary) level depends on thequality and quantity of primary school graduates. Thus the rate at whichTronc Commun should grow has to be balanced against the continuingneeds for development at primary level. Very rapid growth at TroncCommun in advance of secure gains in primary schooling may not bethe best option. Growth rates have to be matched to realistic assessmentsof priorities and benefits related to exclusion and poverty reduction.Tronc Commun will grow, not least in response to the rising number ofprimary graduates. It should not grow so fast that resources are divertedfrom primary education or that management capacity is overstretchedand quality undermined.
Baseline data have been drawn from government statistics and statedpolicy. The projection takes the following issues into account:
• The need to reduce the primary PTR from 67:1 to 45:1 to reduce doubleshifting in primary 1–3, and to maintain investment in primary educa-tion at or about 50 percent of the recurrent budget.

30 • Sustainable Financing of Secondary Education in Sub-Saharan Africa
• The changing flow of primary pupils completing grade 6, assumingrepetition and dropout fall.
• The demand for new secondary teachers, and the need to find an alter-native method of training to the high-cost, four-year Kigali Institute ofEducation (KIE) program.
• The costs of fee-free Tronc Commun, interpreted as a subsidy to schoolsof RF 11,000 per child to replace the element currently paid privately.
• Reductions in boarding at rates consistent with protecting vulnerablechildren and orphans.
• Private secondary schooling growing at no more than 5 percent peryear as a result of limited demand for unsubsidized places. Highergrowth would not be constrained and may occur, but it would do sowithout further public subsidy.
• Gradual reduction in the share of the budget absorbed by highereducation. This would limit the number of publicly sponsored studentsbut would not inhibit the growth in the number of off-budget studentsfinanced in other ways.
• Classroom construction/new schools at an average of RF 4, RF 5, andRF 6 million per furnished classroom at primary, Tronc Commun, andupper secondary, respectively.
• A ceiling of 30 percent of government resources allocated to education.• The need to consider the nonfinancial constraints on growth.
The central projection creates a sustainable financing frameworkdesigned to maintain progress towards universal primary education.Elements of progress will include increasing completion rates andreducing repetition and dropout; increasing Tronc Commun GERsfrom 20 percent to more than 45 percent, thus tripling enrollment by 2015 from 130,000 to over 400,000; and achieving transition ratesinto Tronc Commun above 75 percent by 2015.8 The costs of teachertraining, a major constraint on growth at Tronc Commun, have beenincluded. The assumption is that KIE enrollments will remain atcurrent levels, which will be sufficient to meet demand for upper-secondary teachers. Most training of new Tronc Commun teachers isplanned to be conducted through colleges of education operating atless than RF 300,000 per trainee per year, with one year training incollege and one year in school. It has been assumed that subsidizedboarding will be reduced to below 10 percent at Tronc Commun andbelow 20 percent at upper secondary. This creates savings of up to RF8.5 billion a year by 2015.

Appendix 2 • 31
Investment to improve quality at primary level will continue to bringthe PTR down to 1:45. This is sufficient to minimize double shifting ingrades 1–3 to below 15 percent, which is necessary to reduce repetitionand dropout in the early grades. An additional RF 1,500 capitation forlearning materials has been included from 2005 to enhance qualityimprovement and move towards acceptable ratios of textbooks per child.The primary GER will fall to about 100 percent as overage pupils andrepeaters are reduced.9 Completion rates should improve over the periodbut need to be interpreted with caution.10 Classroom construction coststo achieve these outcomes at primary would be between RF 4–6 billiona year, at costs per classroom of RF 4,000,000. The number of new pri-mary teachers needed falls from about 3,000 in the early years to averageabout 300 from 2011–15. This will release capacity that may be used totrain Tronc Commun teachers.
The resources available for the central projection are financed by (i)30 percent of government resources allocated to education and (ii)external resource flows. The projection identifies the gaps betweenrecurrent domestic resources and expenditure with and without fee-freeTronc Commun. Fee-free subsidies at RF 11,000 per pupil at TroncCommun account for about RF 1 billion, rising to RF 4 billion by 2015.The overall funding gap is about RF 16 billion for most of the projec-tion period and fall towards 2015. This gap, however, does not take intoaccount needs to invest in learning materials at Tronc Commun andabove, or the possible impact on salaries of radically reducing thenumbers of untrained teachers in secondary schools. The gap alsoassumes that subsidized boarding is reduced as planned and that thenumber of administrators is frozen at current levels. The gap also dependson government revenues growing as anticipated in macroeconomicprojections which indicate sustained increases at 5 percent a year thatmay not be realized.
Construction costs increase from RF 6 to RF 14 billion11 for the fullprogram and would be less if more modest targets for growth and thereduction of double shifting were adopted. If classroom building andfurnishing costs were less than RF 4, RF 5, and RF 6 million at primary,Tronc Commun, and upper secondary respectively, the amounts wouldfall correspondingly. Alternatively if high-cost science, technology,and vocational institutions were created then much more fundingwould be required.
The main assumptions of the central projection are summarized intable A2.2.

32 • Sustainable Financing of Secondary Education in Sub-Saharan Africa
Table A2.2 Assumptions—Central Projection Rwanda
• The number of primary grade 6 leavers will grow in line with the flow of current enrollments through primary school. Thesewill rise sharply until 2010 as the wave of expanded numbers passes through. After this the number of grade 6 completerswill stabilize.
• Primary teacher training needs to be sufficient to bring PTRs down from 67:1 to 45:1 before 2015. This would reduce theneed for double shifting, assuming new classroom space is created. Double shifting diminishes to below 15 percent by 2015.
• Secondary form 1 places will grow at a rate determined by affordability within the resource envelope and the nonfinancialconstraints of growth. Expansion from 2005 increases entrants at between 8 percent a year, rising to 15 percent over theprojection period for government and fee-free schools and 5 percent for private schools.
• Transition rates into Tronc Commun will rise from their current levels to reach over 70 percent by 2015. In the short termthey may fall as a result of the rapid increase in grade 6 completers in advance of expanded capacity. Transition from TroncCommun to upper secondary will stabilize just below 40 percent as a result of limiting growth at this level in favor ofexpanded Tronc Commun.
• GERs at Tronc Commun will rise from below 20 percent to about 48 percent by 2015, and from 11 percent to 14 percentat upper secondary. This would require enrollment of 410,000 (a three-fold increase) at Tronc Commun and 114,000(a 60 percent increase) by 2015.
• Most growth is assumed to be in government and fee-free schools as the costs of unsubsidized private education becomean obstacle to the enrollment of those with low household incomes. The model assumes the sector grows at 5 percent.
• Teacher demand is projected on the assumption that all new teachers will be qualified, and that unqualified teacherswill be upgraded over time. This cannot be achieved at KIE training costs per trained teacher. It has therefore beenassumed that KIE continues to recruit about 400 trainees a year (350 a year after four years), and that four collegesof education are established for secondary teacher training and staffed appropriately. This could take 3–5 years tocome on stream before the period of high growth in Tronc Commun numbers, depending on recruitment of staff andavailability of facilities. Without expanded capacity offering shorter (1+1 years) of training, the proportion of untrainedteachers will rise to over two-thirds of all teachers at Tronc Commun, and class sizes will become excessive. Eightypercent of secondary teachers are male and the proportion should be reduced.
• The costs of teacher training have been advanced over annual demand for new teachers to account for the time it takes toproduce a trained teacher (at least four years in KIE and 1+1 in a reformed system with colleges of education).
• Attrition among secondary teachers is assumed at 5 percent, but may be higher and should be monitored.
• The PTR will remain at about 30:1 (class size 45) at Tronc Commun and 25:1 (class size 40) at upper secondary.
• The number of secondary administrators has been frozen at current levels.
• Each secondary child has been budgeted RF 5,000 for learning materials above other costs in high cost projections; RF 3,000in mid-cost projections and RF 1,500 in low-cost projections. Mechanisms should be established to ensure the ratio of booksper child in core subjects falls to acceptable levels.
• The cost of fee-free Tronc Commun has been estimated separately on the basis of a RF 11,000 capitation per child to schools,which would enable them to waive the equivalent of the day school fee. Boarding costs in excess of this would be metprivately, though current food subsidies would continue for reduced numbers of boarders.
• Higher education expenditure has been stabilized until 2015. This assumes that expansion will be financed off-budget andthat the number of publicly sponsored students will be restricted to an affordable level. Per-student costs at university levelappear to exceed those at school level by factor of 100 or more, making sustaining universal primary education expansionat lower-secondary level contingent on budgetary restraint at the higher education level.
• Classroom building and furnishing costs have been estimated at RF 3, RF 4, and RF 5 million in the base year for primary,TroncCommun, and upper secondary. The procurement system needs to identify where additional classrooms are needed and wherenew schools need to be established on the basis of school mapping. Although some expansion may be accommodated inconverted buildings, this option will be exhausted in two or three years, and such buildings may not be located where theyare needed. Therefore, new building on a substantial scale is needed in the medium term. Many primary classrooms will alsoneed constructing.
(continued)

Appendix 2 • 33
ENROLLMENTS
Total primary enrollment is projected to remain stable until about 2009,after which it will fall as a result of reduced entry rates into grade 1, andreduced repetition (figure A2.33). After 2015 growth will return to the rateof population growth for 6-year-olds—about 2.2 percent a year. Grossenrollment rates at primary will fall as overage and repeating pupilsdiminish (figure A2.34).
It will be possible to reduce double shifting in primary to less than 15percent by 2015 if the assumptions of the central projection are realized(figure A2.35).
The number of pupils completing grade 6 (enrollment – repeaters)will rise rapidly until 2010 if repetition and dropout rates fall. Entrantsinto S1 of Tronc Commun are projected to grow between 7–12 percent a
0
200,000
400,000
600,000
800,000
1,000,000
1,200,000
1,400,000
1,600,000
1,800,000
2,000,000
Num
ber o
f stu
dent
s
2004 2005 2006 2007 2008 2009 2010 2011 2012 2013 2014Year
2015
Figure A2.33 Total Primary Enrollment
Source: Authors’ projections.
Table A2.2 (continued)• It is assumed that unit costs per child at secondary fall as a result of reduced boarding. In Tronc Commun the number of
places is reduced by 2015 to about 25,000, and 14,000 at upper secondary. This should be sufficient to absorb essentialboarding and accommodate vulnerable children.
• Expansion of Tronc Commun should address the imbalance of boys and girls entering government and fee-free institutions.However, the must be due attention to location, safety, and facilities, including boarding.
• The model assumes that repetition rates fall to 5 percent or below in primary and secondary with minimal dropout. Thisrequires attention to school management and learning quality if such reductions are not to result in lowered achievement.
• It is assumed that the resources available grow in line with macroeconomic projections and government priorities to increasethe share of domestic resources allocated to education to 30 percent by 2015.This yields a resource envelope rising from aboutRF 25 billion in 2004 to nearly RF 70 billion by 2015. Additional education expenditure would be met from external resources.

34 • Sustainable Financing of Secondary Education in Sub-Saharan Africa
year (figure A2.36). Higher rates would require a much greater supply ofteachers and classrooms and face nonfinancial constraints. Transitionrates will fall then recover.
Enrollments in Tronc Commun in all schools will rise three timesto reach 410,000 by 2015. Upper secondary is planned not to expandsubstantially until after 2015 (figure A2.37).
0
10
20
30
40
50
60
70
80
90
Doub
le s
hift
perc
enta
ge
2004 2005 2006 2007 2008 2009 2010 2011 2012 2013 2014Year
2015
Figure A2.35 Double Shift in Grades 1–3
Source: Authors’ projections.
0
20
40
60
80
100
120
140Pe
rcen
tage
2004 2005 2006 2007 2008 2009 2010 2011 2012 2013 2014Year
2015
Figure A2.34 GER Primary
Source: Authors’ projections.

Appendix 2 • 35
The number of new primary teachers needed to keep pace with thisgrowth and reduce the primary PTR to 45:1 averages 2,800 a year until2010, after which it falls to less than 1,000 once 45:1 has been achieved(figure A2.38).
0
50,000
100,000
150,000
200,000
250,000
300,000
Num
ber o
f stu
dent
s
Primary completersOverall selected
2004 2005 2006 2007 2008 2009 2010 2011 2012 2013 2014 2015Year
Figure A2.36 Primary Completers (2004) and S1 Entrants (2005)
Source: Authors’ projections.
0
50,000
100,000
150,000
200,000
250,000
300,000
350,000
400,000
450,000
Num
ber o
f stu
dent
s
Total Tronc CommunTotal upper secondary
2004 2005 2006 2007 2008 2009 2010 2011 2012 2013 2014 2015Year
Figure A2.37 Secondary Enrollment Growth
Source: Authors’ projections.

36 • Sustainable Financing of Secondary Education in Sub-Saharan Africa
At Tronc Commun level significant growth in teacher output is neededthat cannot be achieved through the KIE programs at current cost levels(figure A2.39). The projection assumes that KIE output remains at about350 a year, and national colleges of education are established to trainTronc Commun teachers.
The cost of training secondary teachers is mostly in KIE (RF 1.5–2billion per year) though the output is only about 350. National colleges
0
500
1,000
1,500
2,000
2,500
Num
ber o
f tea
cher
s ne
eded
Number produced by KIECoE output needed
Plus 1600 untrained teachers to be upgraded
KIE output
College of education output needed
2005 2006 2007 2008 2009 2010 2011 2012 2013 2014Year
2015
Figure A2.39 Trained Secondary Teachers Needed Each Year
Source: Authors’ projections.
0
500
1,000
1,500
2,000
2,500
3,000
3,500
4,000
4,500
Num
ber o
f new
teac
hers
2005 2006 2007 2008 2009 2010 2011 2012 2013 2014Year
2015
Figure A2.38 Number of New Teachers Needed
Source: Authors’ projections.

Appendix 2 • 37
of education could provide the numbers needed for Tronc Communexpansion at much lower costs with much greater output—by 2015eight times the KIE output for a little over half the cost (figure A2.40).
Cost per pupil at primary would rise, reflecting reduced PTRs andquality inputs. Costs at Tronc Commun and upper secondary would fallas subsidized boarding was reduced. The ratio of unit costs of Tronc Com-mun to primary would fall from about 5:1 to 2:1, making expandedsecondary more affordable (figure A2.41).
0
500
1,000
1,500
2,000
2,500
Out
put (
num
ber)
and
cost
(RF
mill
ions
)
Output of KIEAnnual cost ofKIE trainingCoE outputneededCost of CoEplaces for TC
2006 2007 2008 2009 2010 2011 2012 2013 2014Year
2015
Figure A2.40 Number and Cost of New Teachers
Source: Authors’ projections.
0
10,000
20,000
30,000
40,000
50,000
60,000
70,000
80,000
Cost
RF
Overall primaryunit cost (RF)Overall TroncCommun unitcost (RF)Overall uppersecondary unitcost (RF)
2004 2005 2006 2007 2008 2009 2010 2011 2012 2013 2014Year
2015
Figure A2.41 Public Costs Per Pupil Per Year
Source: Authors’ projections.

38 • Sustainable Financing of Secondary Education in Sub-Saharan Africa
Recurrent expenditure on primary would rise to about RF 35 billion by2015. Higher education public expenditure would be stable. By 2015 TroncCommun would approach the value of the higher education budget atabout RF 12 billion (and exceed it if it were fee free) (figure A2.42).
Budget shares for primary would be maintained at about 50 percent.Higher education would decline from over 30 percent to less than 20 per-cent. Tronc Commun and upper secondary would rise from 16 percent to23 percent, dependent on large reductions in nonteaching salary costs atsecondary. KIE would continue to absorb most expenditure on teachereducation, with a small output (figure A2.43).
Education would take about 30 percent of domestic resources by 2015and about 5 percent of GDP. This assumes GDP growth of 5 percent andrevenue growth to 14 percent of GDP (figure A2.44).
Overall educational expenditure would reach RF 72 billion, of whichas much as RF 70 billion might be available from domestic resources,assuming economic growth remains on track. However, there would be afinancing gap averaging about RF 16 billion until 2010. Fee-free TroncCommun would add between RF 1 and RF 4 billion to the recurrent costgap (figure A2.45).
The number of new classrooms needed per year would be about 1,100at primary, assuming double shifting is to be reduced. At Tronc Commun250 classrooms a year would be needed initially, rising to about 1,000 by2015 if class sizes are not to rise above 45 (figure A2.46).
0
5
10
15
20
25
30
35
40
45
Expe
nditu
re R
F bi
llion
s
Primary recurrent
Lower secondary(excluding TTCs)Upper secondary
HE (includingexpatriate salaries)
Teacher training KIE
Teacher trainingsecondary CoE
2004 2005 2006 2007 2008 2009 2010 2011 2012 2013 2014Year
2015
Figure A2.42 Expenditure by Subsector
Source: Authors’ projections.

Appendix 2 • 39
Development expenditure to sustain the central projection needs to risefrom RF 6 billion to RF 14 billion by 2015. Less would be needed if class-room construction costs were less than RF 4, RF 5, and RF 6 million forprimary, Tronc Commun, and upper secondary, respectively (figure A2.47).The expenditure needed averages about 20 percent of recurrent expenditure.
0
20
40
60
80
100
Prop
ortio
n (%
)
Teacher training secondary CoETeacher training KIEhigher educationScience and technologyInformalUpper secondaryLower secondary Primary recurrentPreschool
2004 2005 2006 2007 2008 2009 2010 2011 2012 2013 2014Year
2015
Figure A2.43 Budget Share (Percent)
Source: Authors’ projections.
0
5
10
15
20
25
30
35
Perc
ent a
lloca
tion
Education as % GDPEducation as % of domestic resources
2004 2005 2006 2007 2008 2009 2010 2011 2012 2013 2014Year
2015
Figure A2.44 Education as Percentage of GDP and Government Budget
Source: Authors’ projections.

40 • Sustainable Financing of Secondary Education in Sub-Saharan Africa
0
10
20
30
40
50
60
70
80
90
2004 2005 2006 2007 2008 2009 2010 2011 2012 2013 2014 2015Year
Gap
RF
billi
ons
Totaleducationexpenditure
Fee freeTroncCommunEducationresources
Gap withdomesticresources
Gap withfee free (dayschoolcosts)
Figure A2.45 Expenditure and Gaps (Recurrent Only)
Source: Authors’ projections.
0
200
400
600
800
1,000
1,200
1,400
1,600
2006 2007 2008 2009 2010 2011 2012 2013 2014 2015Year
Num
ber o
f cla
ssro
oms Total Tronc
Commun
Total U sec
TotalclassroomsTC and Usec
Figure A2.46 Number of Classrooms Needed
Source: Authors’ projections.

Appendix 2 • 41
-2,000
0
2,000
4,000
6,000
8,000
10,000
12,000
14,000
16,000
2006 2007 2008 2009 2010 2011 2012 2013 2014 2015
Year
Cost
RF
mill
ions
Cost ofprimaryclassrooms
Cost of TCclassrooms-government
Cost ofuppersecondaryclassrooms
Primary +TC + U Secwith nosubsidy toprivate
Figure A2.47 Development Budget Costs
Source: Authors’ projections.
CONCLUSION
The broad conclusion is that the assumptions of the central projectionlead to a financially sustainable outcome with considerable progress onuniversalizing primary education and substantial expansion of access toTronc Commun by 2015. Achievement of the outcomes depends onwhether the projected pattern of allocation of resources is realized, andwhether the nonfinancial constraints on growth can be managed. Successalso depends on concerted action to reduce unit costs at the secondarylevel, without which expansion will be financially unsustainable.
NOTES1. More detailed reports are available in sector review papers. Projections date
from 2003–2005.2. Only selected scenarios are included in these summaries.3. Falling total enrollment results from reductions in overage enrollment and
repetition.4. The intention is that training at diploma level will be reduced from two
years to one, and at degree level from four years to three.5. Currently (2004) there are enough places in higher and further education
to enroll all leavers who complete secondary school successfully.6. Higher education currently consumes more public resources than all sec-
ondary schooling. The proportion is therefore planned to fall.7. The PPET projections and report are available at http://www.sussex.ac.uk/
education/documents/fulloptions.pdf. PPET has been superceded by UPPET andupdated 2006 projections and a report are available at http://www.sussex.ac.uk/education/documents/financing_universal_post_primary_education.pdf.

42 • Sustainable Financing of Secondary Education in Sub-Saharan Africa
8. The standard definition of the transition rate is as follows: (Number ingrade 6 – repeaters)/(entrants to S1 the following year).
This definition can create misleading results. The rate is likely to fallbefore increasing unless S1 grows faster than primary output, which isunlikely before 2010. To prevent the transition rate falling, S1 would haveto grow at over 30 percent a year in some years.
9. The primary GER can fall as the number of repeaters reduces. The netenrollment rate should continue to increase.
10. The completion rate is defined as follows: (the number enrolled in grade6 – repeaters)/(number of 12 year olds).
This rate can fall as the mix of overage pupils in grade 6 changes. Thisstandard method of calculation can produce ambiguous results. An alterna-tive completion rate definition is as follows:
(the number enrolled in grade 6 – repeaters)/(number of new entrantssix years before).
11. This global figure does not separately account for rehabilitation of existingstock, which would be an additional cost.