ways of managing nih resources - report
TRANSCRIPT

1
Ways of Managing NIH Resources
October 2011

Options for Managing NIH Resources
A. Current Way of Managing
– Bottom out success rates (doing nothing but letting
the system correct itself)
B. Other Options
− Reducing or limiting size of awards
− Limiting number of awards held by an PI
− Limiting the amount of funds an PI can hold
− Limiting salaries of PIs
2

Current Way of Managing
3

Current Way of Managing
• Generally project based
• Competitive peer review
• Average of $414K per year for 4.3 years
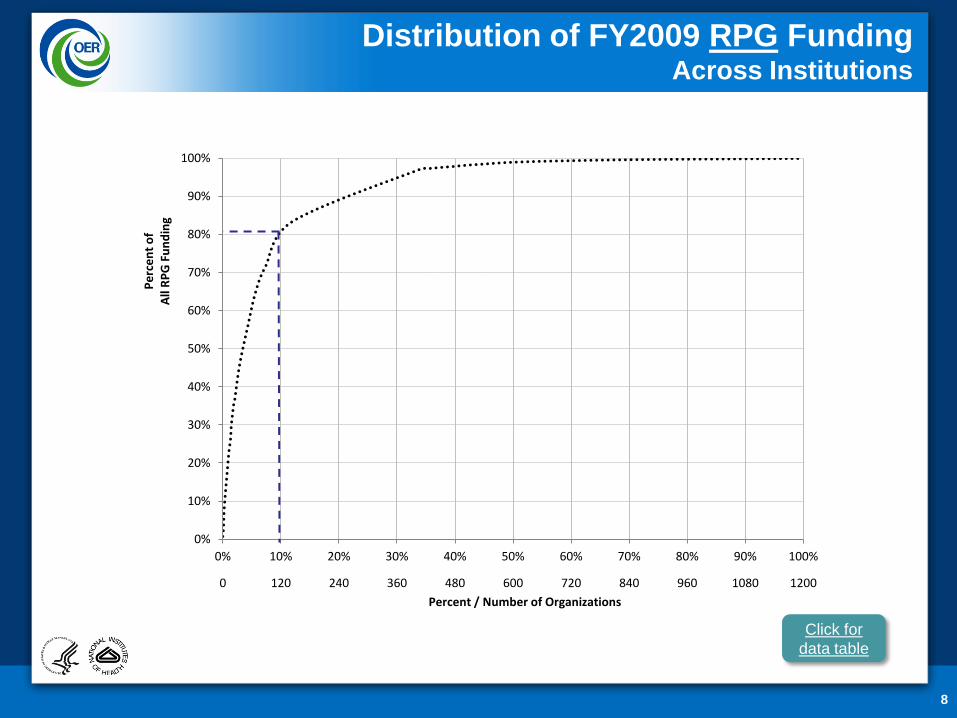
• Approximately 50 institutions get 70% of the funds
• Approximately 20% of the investigators get 50% of
the funds
4

Applications, Awards, and Success Rates Research Project Grants (RPG)
5
Click for
data table

NIH Grant Support by Type of Organization
6
Click for
data table

Distribution of FY2009 RPG Funding by Institution Type
7
Click for
data table
8
0 120 240 360 480 600 720 840 960 1080 1200
0%
10%
20%
30%
40%
50%
60%
70%
80%
90%
100%
0% 10% 20% 30% 40% 50% 60% 70% 80% 90% 100%
Pe
rce
nt
of
A
ll R
PG
Fu
nd
ing
Percent / Number of Organizations
Distribution of FY2009 RPG Funding Across Institutions
Click for
data table

Distribution of RPG Support to PIs FY 2009
9
Click for
data table

Current Way of Managing
10
Using FY 2010 budget and actual numbers of
applications, the effect of NIH budget reductions on
RPG success rate:
10% reduction in NIH RPG Budget = 12.3% Success Rate*
20% reduction in NIH RPG Budget = 4.1% Success Rate*
FY10 RPGs = 20.6% Success Rate
* Assumes no cuts to non-competing

Option: Reducing or Limiting Size of Award
11

Option: Reducing Average Size of an Award
12
FY 2010 Competing RPG Awards: 9,287
Total Cost: $3,732,077,099
Average Cost: $401,860
Average Cost - $25k: $376,860
Total Savings: $232,175,000
Example of effect on number of RPG Awards in FY 2010:
FY10 Actual Estimated Effect
Competing RPG awards: 9,287 9,903
RPG success rate*: 20.5% 21.7%
* This RPG success rate is modified to exclude competing supplements, P01 awards and ARRA
funding. There are of course many ways to reduce average cost. Flat dollar amount cuts would
disproportionately affect smaller grants, while a flat or graduated percentage cut may be fairer.

Success Rates Vary by Size FY 2010 Unsolicited New R01 Applications
13
Click for
data table

Managing Success Rates
14 Data provided by OER Division of Information Services
Click HERE for interactive version of this slide
Click HERE for
interactive version
of this slide

Reallocating Funding by Size of Award Examples
15
FY 2010 R01 Funding*
Request Size Funding Awards Success Rate
Small ($250K) $654,962,808 1,998 15%
Medium ($500K) $542,820,338 1,187 16%
Large ($1M) $230,067,631 305 19%
Total $1,427,850,777 3,490 15%
* Unsolicited new (type 1) awards
Example 1
Request Size Funding Awards Success Rate
Small ($250K) $738,290,811 2,259 17%
Medium ($500K) $531,974,954 1,171 15%
Large ($1M) $157,585,012 209 13%
Total $1,427,850,777 3,639 16%
Example 2
Request Size Funding Awards Success Rate
Small ($250K) $825,148,553 2,525 18%
Medium ($500K) $481,482,983 1,060 14%
Large ($1M) $121,219,240 161 12%
Total $1,427,850,777 3,745 17%
Example 1
149 Additional Awards
Example 2
255 Additional Awards
FY 2010 Actual

Option: Limiting the Number of Awards Per PI
16

17
Click for
data table
Distribution of Awards by Number of RPGs Held

Distribution of Awards
Top 20% Highest Funded Investigators
18
Click for
data table

Percent of Total NIH Institute and Center (IC) RPG
Awardees Receiving ≥ 3 RPGs from That IC, FY 2010
19
0.0%
0.0%
0.0%
0.5%
0.8%
1.3%
1.4%
1.6%
1.7%
2.1%
2.1%
2.2%
2.4%
2.7%
3.5%
3.6%
3.7%
3.9%
4.2%
4.8%
5.0%
5.0%
5.9%
6.0%
7.1%
0.0% 1.0% 2.0% 3.0% 4.0% 5.0% 6.0% 7.0% 8.0%
NIMHD
NINR
OD
NCCAM
NCRR
NLM
FIC
NHGRI
NICHD
NIGMS
NIDCD
NIDCR
NEI
NIBIB
NIA
NIEHS
NIMH
NIAMS
NIDDK
NIAAA
NHLBI
NINDS
NIDA
NCI
NIAID
% of Awardees with ≥ 3 RPG Awards
Insti
tute
/Cen
ter
Click for
data table

Number of RPG Awards Held
20
Click HERE for
interactive version
of this slide

Option: Limit Number of Awards per PI Examples
FY 2010 – No Limits – Projecting 9,455 competing NIH RPGs with 20.6% success rate
Limit to 5 RPGs per PI – Estimate 9,470 competing (+15) NIH RPGs with 20.6% success
rate
Limit to 3 RPGs per PI – Estimate 9,719 competing (+264) NIH RPGs with 21.1% success
rate
Limit to 2 RPGs per PI – Estimate 10,411 competing (+956) NIH RPGs with 22.6%
success rate
21

Option: Limiting the Amount of Funds per PI
22

RPG Awardees: Number and Total Dollars
Awarded, FY 2010
23
All RPG Awardees, FY 2010
Total RPG $ Per Awardee Number of RPG
Awardees Total RPG $ $500,000 or less 16,424 $4,957,902,065 500,000 to $1 Million 6,529 $4,528,256,909 $1 Million to $5 Million 3,156 $5,487,835,609 $5 Million to $10 Million 67 $439,525,125 $10 Million to $15 Million 11 $135,326,646 More than $15 Million 13 $309,311,116
Top 20 Percent RPG Awardees
Total RPG $ Per Awardee Number of RPG
Awardees Total RPG $ 500,000 to $1 Million 2,011 $1,714,841,292 $1 Million to $5 Million 3,138 $5,467,348,993 $5 Million to $10 Million 67 $439,525,125 $10 Million to $15 Million 11 $135,326,646 More than $15 Million 13 $309,311,116
*Top 20 % RPG awardees are based on total RPG $s awarded

Data from Division of Information Services, ORIS/OER
PIs by Amount of RPG Support
24
Click HERE for
interactive version
of this slide
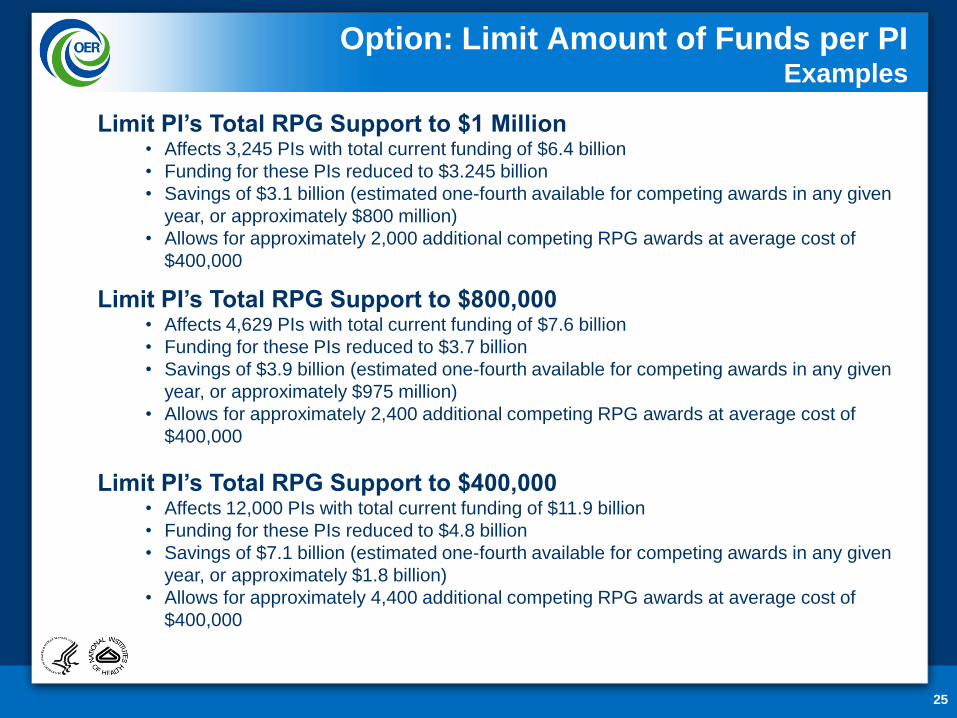
Option: Limit Amount of Funds per PI Examples
25
Limit PI’s Total RPG Support to $1 Million • Affects 3,245 PIs with total current funding of $6.4 billion
• Funding for these PIs reduced to $3.245 billion
• Savings of $3.1 billion (estimated one-fourth available for competing awards in any given
year, or approximately $800 million)
• Allows for approximately 2,000 additional competing RPG awards at average cost of
$400,000
Limit PI’s Total RPG Support to $800,000 • Affects 4,629 PIs with total current funding of $7.6 billion
• Funding for these PIs reduced to $3.7 billion
• Savings of $3.9 billion (estimated one-fourth available for competing awards in any given
year, or approximately $975 million)
• Allows for approximately 2,400 additional competing RPG awards at average cost of
$400,000
Limit PI’s Total RPG Support to $400,000 • Affects 12,000 PIs with total current funding of $11.9 billion
• Funding for these PIs reduced to $4.8 billion
• Savings of $7.1 billion (estimated one-fourth available for competing awards in any given
year, or approximately $1.8 billion)
• Allows for approximately 4,400 additional competing RPG awards at average cost of
$400,000

Option: Limiting Salaries of PIs
26

27
Distribution of PIs by Level of Effort
Click for
data table

We welcome your thoughts and suggestions.
Email us at
28