waypoint - mavcom.my · market capitalisation of the listed aviation companies also increased by...
TRANSCRIPT

WAYPOINT
MALAYSIAN AVIATION COMMISSION ● MAY 2018
KEY HIGHLIGHTS
Strong industry performance to continue in 2018 as passenger traffic
expected to breach 100.0 million
2017 was a year of strong industry performance in comparison to 2016 and the challenging
2014/2015 period. In 2017, passenger traffic grew 8.1% Year-on-Year (YoY) (2016: 6.2%
YoY) to 99.1 million. MAVCOM is forecasting growth of 6.5% – 7.0% YoY in 2018
to 105.6 million – 106.1 million passengers, marking three consecutive years of growth
exceeding 5.0% YoY, if realised. Operating profitability at industry level in 2017 was
RM1.6 billion—lower in comparison to 2016—but a significant turnaround from a
cumulative operating loss of RM0.5 billion in 2014; while the negative spread between cost
per available seat kilometre (CASK) and revenue per available seat kilometre (RASK) was
reduced by 42.5% in 2017 from the prior year. Market capitalisation of the listed aviation
companies also increased by 38.4% to RM25.6 billion at end-2017 from RM18.5 billion at
the beginning of 2014, outperforming the FTSE Bursa Malaysia KLCI by 50.5%
between 2014 and 2017. Such growth has been supported by strong demand, improved
seat inventory control, and a low fuel price environment between 2015 and 2016.
Expected increase in oil prices will exert pressure on airlines’ profitability
In 2017, the price of crude oil and jet fuel increased by 44.8% YoY and 52.7% YoY,
respectively. Despite this, the average fares for Malaysian carriers fell by 7.7% YoY to
RM371 in 2017 (2016: RM402). For the first four months of 2018, the average crude oil
and jet fuel prices increased by 18.4% YoY and 25.3% YoY, respectively, while the
International Air Transport Association (IATA) and the United States Energy Information
Administration are forecasting oil prices to increase between 10.7% YoY and 30.5%
YoY in 2018. This may exert downward pressure on the airlines’ profitability when
fares are currently low.
Malaysia’s air connectivity in 2017 improved with more destinations and
seats, in line with other countries in the Southeast Asia region
Malaysia enjoyed a net increase of eight international destinations which it is
connected to and a net increase of approximately 360,000 seats, thereby strengthening
the country’s degree of international air connectivity. Asia has been and will continue to
be the principal region of focus for Malaysia’s connectivity, as 59.8% of air traffic rights
(ATRs) awarded by MAVCOM to Malaysian carriers in 2017 were for routes to the
Association of Southeast Asian Nations (ASEAN) Member States, China, and India. In
addition, 56.4% of airports that Malaysia is connected to are airports within the Asia
Pacific region which focus on serving short-to-medium haul regional destinations.
Other ASEAN Member States such as Thailand, Indonesia, Vietnam, and Cambodia have
also taken significant strides in increasing the number of destinations and seats to boost
their respective air connectivity.
13 out of 22 ground handling companies were profitable in 2016
Based on the latest available audited accounts, the ground handling services segment
reported a 4.7% operating profit margin in 2016, with an aggregate revenue of RM994.4
million.
WAYPOINT
MALAYSIAN AVIATION INDUSTRY OUTLOOK MAY 2018

WAYPOINT
MALAYSIAN AVIATION COMMISSION ● MAY 2018 2
GLOSSARY OF SOURCES
Sources
AirportIS -
AENA Aena SME, S.A.
ASL Holders Licence holders of ASL issued by MAVCOM
AOL Holders Licence holders of AOL issued by MAVCOM
ASP Holders Licence holders of ASP issued by MAVCOM
BITRE Bureau of Infrastructure, Transport, and Regional Economics,
Australia
BNM Bank Negara Malaysia
CAPA Centre for Aviation
DOS Department of Statistics, Malaysia
FTSE Bursa
Malaysia KLCI -
GHL Holders Licence holders of GHL issued by MAVCOM
IATA International Air Transport Association
IMF International Monetary Fund
MAVCOM Malaysian Aviation Commission
MOTAC Ministry of Tourism and Culture Malaysia
Thomson Reuters -
UK CAA UK Civil Aviation Authority
US FAA US Federal Aviation Administration
World Bank -

WAYPOINT
MALAYSIAN AVIATION COMMISSION ● MAY 2018 3
TABLE OF ABBREVIATIONS
Abbreviations Abbreviations
Act 771 Malaysian Aviation
Commission Act 2015 GHL Ground Handling Licence
AED United Arab Emirates
Dirham GIC Division
Government Investment
Companies Division
AOC Air Operator
Certificate GOM Government of Malaysia
AOL Aerodrome Operator
Licence HHI
Herfindahl-Hirschman
Index
ASEAN
Association of
Southeast Asian
Nations
LCC Low-cost Carrier
ASK Available Seat
Kilometres Lion Air PT. Lion Mentari Airlines
ASL Air Service Licence Menzies John Menzies plc.
ASP Air Service Permit MIER Malaysian Institute of
Economic Research
ATR Air Traffic Rights MOF Inc. Ministry of Finance
(Incorporated)
bbl Barrel O&D Origin and Destination
BP Global BP plc. OPEC
Organization of the
Petroleum Exporting
Countries
CAAM Civil Aviation
Authority of Malaysia PETRONAS Petroliam Nasional Berhad
CASK Cost per Available
Seat Kilometre PMI Purchasing Managers’ Index
CHF Swiss Franc RAS Rural Air Services
CR2
Concentration ratio of
top two biggest
companies
RASK Revenue per Available Seat
Kilometre
DCA Department of Civil
Aviation, Malaysia RHS Right Hand Side
Etihad Etihad Airways RM Ringgit Malaysia
EUR European Euro RPK Revenue Passenger
Kilometre
GateGroup GateGroup Holding
AG STOLport
Short Take-Off and Landing
Airports
GBP Pound Sterling MAS Malaysian Airline System
Berhad
GDP Gross Domestic
Product STIDC
Sarawak Timber Industry
Development Corporation

WAYPOINT
MALAYSIAN AVIATION COMMISSION ● MAY 2018 4
Abbreviations Abbreviations
UK United Kingdom VietJet VietJet Aviation Joint Stock
Company
US United States YoY Year-on-Year
USD United States Dollar MAVCOM Malaysian Aviation
Commission

WAYPOINT
MALAYSIAN AVIATION COMMISSION ● MAY 2018 5
MALAYSIAN AIRPORT CODES
No. Airport
Code Airport Name No.
Airport
Code Airport Name
1 AOR Sultan Abdul Halim
Airport (Alor Setar) 18 LGL
Long Lellang
STOLport
2 BBN Bario STOLport 19 LKH Long Akah STOLport
3 BKI Kota Kinabalu
International Airport 20 LMN Limbang Airport
4 BKM Ba’kelalan STOLport 21 LWY Lawas STOLport
5 BTU Bintulu Airport 22 MKM Mukah STOLport
6 IPH Sultan Azlan Shah
Airport (Ipoh) 23 MKZ Melaka Airport
7 JHB Senai International
Airport 24 MUR Marudi STOLport
8 KBR Sultan Ismail Petra
Airport (Kota Bharu) 25 MYY Miri Airport
9 KCH Kuching International
Airport 26 MZV Mulu Airport
10 KTE Kerteh Airport 27 ODN Long Seridan
STOLport
11 KUA Sultan Ahmad Shah
Airport (Kuantan) 28 PEN
Penang International
Airport
12 KUD Kudat STOLport 29 SBW Sibu Airport
13 KUL Kuala Lumpur
International Airport 30 SDK Sandakan Airport
14 LBP Long Banga
STOLport 31 SZB
Skypark Terminal
Sultan Abdul Aziz Shah
Airport (Subang)
15 LBU Labuan Airport 32 TGC Tanjung Manis Airport
16 LDU Lahad Datu Airport 33 TGG Sultan Mahmud Airport
(Kuala Terengganu)
17 LGK Langkawi
International Airport 34 TWU Tawau Airport

WAYPOINT
MALAYSIAN AVIATION COMMISSION ● MAY 2018 6
OTHER AIRPORT CODES
No. Airport
Code Airport Name No.
Airport
Code Airport Name
1 DXB
Dubai International
Airport, United Arab
Emirates
3 PKU
Sultan Syarif Kasim II
International Airport,
Indonesia (Pekanbaru)
2 DOH Hamad International
Airport, Qatar (Doha) 4 SIN
Singapore Changi Airport,
Singapore

WAYPOINT
MALAYSIAN AVIATION COMMISSION ● MAY 2018 7
LICENCE AND PERMIT HOLDERS
Abbreviations AeroDarat AeroDarat Services Sdn. Bhd.
AirAsia AirAsia Berhad
AirAsia X AirAsia X Berhad
Brahim’s SATS Brahim’s SATS Food Services Sdn. Bhd.
Firefly FlyFirefly Sdn. Bhd.
GTR Ground Team Red Sdn. Bhd.
MAB Kargo MAB Kargo Sdn. Bhd.
MAHB Malaysia Airports Holding Berhad
Malindo Malindo Airways Sdn. Bhd.
MAB Malaysia Airlines Berhad
PetDagang PETRONAS Dagangan Berhad
Petron Petron Malaysia Refining and Marketing Berhad
Pos Aviation Pos Aviation Sdn. Bhd.
Raya Airways Raya Airways Sdn. Bhd.
Sabah Air Sabah Air Aviation Sdn. Bhd.
Senai Airport Senai Airport Terminal Services Sdn. Bhd.
Shell Malaysia Shell Malaysia Trading Sdn. Bhd.
Shell Timur Shell Timur Sdn. Bhd.
SSSB Sanzbury Stead Sdn. Bhd.
TMDSB Tanjung Manis Development Sdn. Bhd.

WAYPOINT
MALAYSIAN AVIATION COMMISSION ● MAY 2018 8
CONTENTS
2018 Economic Outlook ....................................................................................... 12
Global Economy is Expected to Grow by 3.9% YoY in 2018 ............................. 12
Malaysia’s GDP is Expected to Grow by 5.5% – 6.0% YoY in 2018 ................. 12
2018 Passenger Traffic Outlook .......................................................................... 13
Global Passenger Traffic is Expected to Grow by 6.0% YoY in 2018 ................ 13
Asia Pacific Passenger Traffic is Expected to Grow by 7.0% YoY in 2018 ....... 14
Malaysian Carriers to Increase Seats Capacity by 2.2% YoY in 2018 .............. 15
Net Increase of Six Additional Aircraft in 2018 ................................................... 16
Malaysia’s Passenger Traffic is Forecasted to Grow by 6.5% – 7.0% YoY in 2018
............................................................................................................................ 17
Global Economy Grew by 3.8% YoY in 2017 ...................................................... 18
Malaysia’s GDP Grew by 5.9% YoY in 2017 ....................................................... 19
Lower Tourist Arrivals in 2017 ............................................................................ 20
Stronger Overall Trade Activities in 2017 Across Regions .............................. 21
Higher Jet Fuel Price but More Favourable Exchange Rate ............................ 22
Aviation Services Segment .................................................................................. 23
64 out of 69 Industry Players Generated RM32.7 billion of Revenue in 2017 ... 23
Scheduled Passenger Service Market ................................................................ 24
AirAsia is the Dominant Player for the Scheduled Passenger Service Market .. 24
Monopoly Structure of Domestic Routes did not Translate into High RASK...... 25
Non-Scheduled Services Segments ................................................................... 27
Highly Concentrated Business Segments Have Lower Profit Margins .............. 27
Aerodrome Operators Segment .......................................................................... 28
Heavy Government Involvement in the Aerodrome Operations Segment ......... 28
Near Monopoly Market Structure ....................................................................... 28
Four Main Hubs in Malaysia – KUL, PEN, JHB, and BKI .................................. 29
KEY HIGHLIGHTS ........................................................................................ 1
GLOSSARY OF SOURCES .......................................................................... 2
TABLE OF ABBREVIATIONS ....................................................................... 3
MALAYSIAN AIRPORT CODES ................................................................... 5
OTHER AIRPORT CODES ............................................................................ 6
LICENCE AND PERMIT HOLDERS .............................................................. 7
LIST OF FIGURES ...................................................................................... 10
LIST OF TABLES ........................................................................................ 11
SECTION 1: 2018 INDUSTRY OUTLOOK .................................................. 12
SECTION 2: MACRO OVERVIEW .............................................................. 18
SECTION 3: INDUSTRY STRUCTURE ....................................................... 23

WAYPOINT
MALAYSIAN AVIATION COMMISSION ● MAY 2018 9
Air Connectivity Index .......................................................................................... 31
ATRs Awarded by MAVCOM as of 31 December 2017 ..................................... 32
Scheduled Services .............................................................................................. 34
8.1% YoY Growth for Passenger Traffic in 2017 ............................................... 34
Aircraft and Cargo Movements Continued to Grow in 2017 .............................. 37
Improved Load Factors on the Back of Lower Average Fares ........................... 39
The Spread between CASK and RASK Narrowed in 2017 ................................ 41
Malaysian Carriers’ Revenue was Boosted by Ancillary Revenue .................... 42
Non-Scheduled Services ...................................................................................... 43
Smaller Revenue, but Significantly Higher Operating Profit Margin in 2017...... 43
Aerodrome Operations ......................................................................................... 44
Revenue Supported by Robust Passenger Traffic Growth ................................ 44
Market Performance of Listed License Holders ................................................ 45
Types of Ground Handling Services ................................................................... 46
Market Structure of the Ground Handling Services Sub-segment .................. 48
Ground Handling Services Sub-Segment is Highly Concentrated ..................... 48
High Number of Ground Handling Companies in Malaysia ............................... 50
Profitability of Ground Handling Service Providers.......................................... 50
General Ground Handling was the Biggest Sub-segment in Terms of Revenue in
2016 .................................................................................................................... 50
GHL Holders’ Profitability at Par with Selected Global Ground Handling
Companies ......................................................................................................... 52
SECTION 4: INDUSTRY PERFORMANCE ................................................. 34
SECTION 5: DOMESTIC GROUND HANDLING SERVICES SEGMENT .... 46
APPENDIX A: DATA TABLES .................................................................... 53
. ................................................................................................................... 71

WAYPOINT
MALAYSIAN AVIATION COMMISSION ● MAY 2018 10
List of Figures
Figure 1: Malaysia’s GDP Growth, 2010 – 2018F ...................................................... 13
Figure 2: Seats Capacity Growth by Malaysian Carriers, 2010 – 2018F .................... 15
Figure 3: Malaysian Carriers’ Fleet Size, 2010 – 2018F ............................................. 16
Figure 4: Passenger Traffic, 2010 – 2018F ................................................................ 17
Figure 5: Quarterly Malaysia’s and Global GDP Growth, 2016 – 2017 ...................... 19
Figure 6: Quarterly Malaysia’s Tourist Arrivals, 2016 – 2017 ..................................... 20
Figure 7: Trade Value Quarterly YoY Growth Trends, 2016 – 2017........................... 21
Figure 8: Oil, Jet Fuel, and Exchange Rate Trends, 2016 – 2017.............................. 22
Figure 9: Percentage of Airlines’ Market Share for Domestic and International Routes
by Passengers and Revenue, 2017 ............................................................................ 24
Figure 10: Domestic Routes and Concentration Levels, 2017 ................................... 25
Figure 11: RASK for Domestic Routes, 2017 ............................................................. 26
Figure 12: Number of Destinations Served by Airports, 2017 .................................... 29
Figure 13: Traffic Breakdown by Regions of Travel, 2017 .......................................... 30
Figure 14: Traffic Breakdown by O&D and Hub Traffic, 2017 .................................... 30
Figure 15: Breakdown of ATRs Awarded by Region, 2016 – 2017 ............................ 33
Figure 16: Annual Passenger Traffic Trend, 2011 – 2017 .......................................... 34
Figure 17: Quarterly Passenger Traffic Trend, 2016 – 2017 ...................................... 35
Figure 18: Quarterly Passenger Traffic Trend by Regions, 2016 – 2017 ................... 36
Figure 19: Malaysia’s Aircraft Movements, 2016 – 2017 ............................................ 37
Figure 20: Malaysia’s Cargo Movements, 2016 – 2017 ............................................. 38
Figure 21: Malaysian Carriers’ Load Factors Trend, 2010 – 2017 ............................. 39
Figure 22: Malaysian Carriers’ Average Fares Trend, 2010 – 2017 ........................... 40
Figure 23: Malaysian Carriers’ RASK and CASK Trends, 2016 – 2017 ..................... 41
Figure 24: Revenue and Operating Profit Margin of Malaysian Carriers, 2016 – 2017
.................................................................................................................................... 42
Figure 25: Revenue and Operating Profit Margin of ASP Holders, 2016 – 2017 ....... 43
Figure 26: Revenue and Operating Profit Margin of AOL Holders, 2016 – 2017 ....... 44
Figure 27: Monthly Market Capitalisation of AirAsia, AirAsia X, and MAHB, 2014 – 2017
.................................................................................................................................... 45
Figure 28: Relative Performance of Aviation Sector Against FTSE Bursa Malaysia
KLCI, 2014 – 2017 ...................................................................................................... 45
Figure 29: Number of GHL Holders at Airports in Malaysia, 2017.............................. 49
Figure 30: Revenue for Ground Handling Sub-Segment by Business, 2016 ............. 50
Figure 31: Operating Profit Margin for Ground Handling Sub-Segments, 2015 – 2016
.................................................................................................................................... 51

WAYPOINT
MALAYSIAN AVIATION COMMISSION ● MAY 2018 11
List of Tables
Table 1: Global GDP Forecast by IMF ........................................................................ 12
Table 2: Malaysia’s GDP Forecast by IMF, World Bank, and Market Consensus ..... 12
Table 3: Passenger and Cargo Traffic Forecasts by IATA ......................................... 13
Table 4: Passenger Traffic Forecasts by IATA ........................................................... 14
Table 5: 4Q17 Growth of Selected Economies ........................................................... 18
Table 6: Summary of Licensed Aviation Services Providers ...................................... 23
Table 7: Summary of Non-Scheduled Services’ Market Structure, 2017 ................... 27
Table 8: Air Connectivity Index and Ranking of ASEAN Member States, 2016 – 2017
.................................................................................................................................... 31
Table 9: Changes to Number of Seats and International Destinations for ASEAN
Member States, 2016 – 2017 ...................................................................................... 31
Table 10: Breakdown of ATRs Awarded, 2016 – 2017 ............................................... 32
Table 11: Revenue and Operating Profit Margins of ASPs’ Business Segments, 2015
– 2017 ......................................................................................................................... 43
Table 12: Types of Ground Handling Services ........................................................... 46
Table 13: Three Sub-segments of Ground Handling Services ................................... 46
Table 14: Number of Companies by Sub-segment, 2017 ........................................... 47
Table 15: Number of Companies by Types of Business ............................................. 47
Table 16: Market Structure of GHL Market, 2016 ....................................................... 48
Table 17: Number of Ground Handling Companies in Selected Countries, 2017 ...... 50
Table 18: Revenue and Operating Profit Margin of Selected Ground Handling
Companies, 2017 ........................................................................................................ 52

WAYPOINT
MALAYSIAN AVIATION COMMISSION ● MAY 2018 12
SECTION 1: 2018 INDUSTRY OUTLOOK
2018 Economic Outlook
Global Economy is Expected to Grow by 3.9% YoY in 2018
The IMF forecasts that the global economy will grow by 3.9% YoY in 2018 (2017: 3.6%
YoY). It is expected that this growth would be supported by favourable global financial
conditions, as well as, consumer and business sentiments. Improving business sentiment
would boost private investments which in turn, would have a positive impact on the
economic growth of large exporting countries. This group of countries, which mainly
comprises the emerging market economies are expected to grow at 4.9% YoY in 2018
as they benefit from the domestic demand of the advanced economies.
Table 1: Global GDP Forecast by IMF
Economies 2018 YoY GDP Growth Forecast (%)
Global 3.9
- Advanced Economies 2.5
- Emerging Market Economies 4.9 Source: IMF
Malaysia’s GDP is Expected to Grow by 5.5% – 6.0% YoY in 2018
The IMF and the World Bank have forecasted that in 2018, Malaysia’s GDP will grow by
5.3% YoY and 5.4% YoY respectively, slightly lower than the market consensus of 5.5%
YoY (see Table 2). Malaysia’s actual GDP growth in 2017 was 5.9% YoY. Both the IMF
and the World Bank expect Malaysia’s GDP to be underpinned by strong domestic and
external demand, the latter particularly from the advanced economies.
Table 2: Malaysia’s GDP Forecast by IMF, World Bank, and Market Consensus
Economies 2018 YoY GDP Growth Forecast (%)
IMF 5.3
World Bank 5.4
Market Consensus 5.5 Source: IMF, Thomson Reuters, World Bank

WAYPOINT
MALAYSIAN AVIATION COMMISSION ● MAY 2018 13
The BNM is forecasting for Malaysia’s GDP to grow by 5.5% – 6.0% YoY in 2018
(see Figure 1), driven by strong domestic demand, as well as, the general improvement of
the global economy. Furthermore, the BNM also highlighted that the MIER Business
Conditions Index had consistently indicated sustained expansion of the economy
throughout 2017.
Figure 1: Malaysia’s GDP Growth, 2010 – 2018F
Source: BNM, Thomson Reuters
2018 Passenger Traffic Outlook
Global Passenger Traffic is Expected to Grow by 6.0% YoY in 2018
IATA expects global passenger and cargo traffic to grow by 6.0% YoY and 4.5%
YoY, respectively in 2018 (see Table 3). These forecasts were underpinned by favourable
business sentiments and global employment conditions, characterised by low
unemployment rates and growing wages. These factors will result in strong demand for air
travel, by both leisure and business travellers.
Table 3: Passenger and Cargo Traffic Forecasts by IATA
Key Figures 2018 YoY Growth Forecast1 (%)
Global Passenger Traffic 6.0
Global Cargo Traffic 4.5 Source: IATA
In 2017, cargo traffic grew by 9.3% YoY due to companies restocking their inventories in
response to strong consumer demand. This is in comparison to an average annual growth
of 2.0% in global cargo traffic historically. The current growth trend is expected to
continue in 2018 along with the steady expansion of e-commerce activities. Cargo traffic
growth in 2017 was exceptionally high as the cargo market recovered from the aftermath
of the 2009 global financial crisis.
1 Growth forecasts in terms of RPK.
10.6
5.3
5.5
4.7
6.0
5.0
4.2
5.9 6.0
5.5
0
2
4
6
8
10
12
2010 2011 2012 2013 2014 2015 2016 2017 2018F
Yo
Y G
row
th (
%)

WAYPOINT
MALAYSIAN AVIATION COMMISSION ● MAY 2018 14
Asia Pacific Passenger Traffic is Expected to Grow by 7.0% YoY in 2018
IATA has forecasted that the passenger traffic for the Asia Pacific region will grow
by 7.0% YoY, compared to its global forecast of 6.0% YoY (see Table 4). The Asia
Pacific region constitutes 33.7% of global passenger traffic in 2017, making it the largest
market in the world. Growth in this region will be driven by the strong demand for air
travel from the domestic markets in China, India, Japan, as well as the ASEAN Member
States. Within ASEAN, passenger traffic growth will mainly be driven by the LCCs—
AirAsia, Lion Air, and VietJet—as they continue to take delivery of aircraft in 2018.
According to CAPA, the fleet size of airlines in the ASEAN region is expected to grow by
7.0% YoY in 2018. Furthermore, it was observed that the Middle Eastern network carriers
such as Emirates, Etihad, and Qatar Airways had slowed their expansion into this region
as they prioritised addressing the challenges within their region. This would give many
opportunities for the Asia Pacific airlines to fill in available gaps in the market.
Table 4: Passenger Traffic Forecasts by IATA
Region 2018 YoY Passenger Traffic Growth Forecast2
(%)
Global 6.0
- North America 3.5
- Europe 6.0
- Asia Pacific 7.0
- Middle East 7.0
- Latin America 8.0
- Africa 8.0 Source: IATA
Meanwhile, passenger traffic growth in Africa and Latin America will benefit from the
recovering economic conditions within those regions. Africa is expected to report 3.4%
YoY GDP growth in 2018, compared to 1.4% YoY and 2.8% YoY in 2016 and 2017,
respectively. Similarly, GDP for Latin America is expected to grow by 2.0% YoY in 2018
(2016: -0.6% YoY; 2017: 1.3% YoY). In 2017, both regions comprised 7.4% of the global
passenger traffic.
2 Growth forecasts in terms of RPK.

WAYPOINT
MALAYSIAN AVIATION COMMISSION ● MAY 2018 15
Malaysian Carriers to Increase Seats Capacity by 2.2% YoY in 2018
IATA forecasts that the global capacity in terms of ASK to grow by 5.7% YoY in 2018,
which is faster than the expected growth rates of Malaysian carriers’ capacity (in terms of
ASK) of 1.7% YoY. In terms of seats, the Malaysian carriers are expected to add 2.2%
YoY additional seats into the market (see Figure 2). Save for the 1.3% YoY contraction
in seats capacity in 2016, the expected growth in 2018 will be the lowest since 2012, when
seats capacity grew by 2.7% YoY.
In 2013, the number of seats expanded by 15.1% YoY due to Malindo’s entry into the
market. This prompted other Malaysian carriers to increase capacity significantly. During
that time, AirAsia, AirAsia X, and MAS3 injected 10.4% YoY, 13.0% YoY, and 27.3%
YoY additional seats, respectively. As a result, the load factors for Malaysian carriers
dropped from 77.9% in 2012 to 64.0% in 2013. Both the domestic and international
average fares also dropped by 10.1% YoY and 9.0% YoY, respectively. Since then, MAS
and Firefly have cut seats capacity after the MH370 and MH17 tragedies, and increased
competition at SZB, respectively. Meanwhile, AirAsia, AirAsia X, and Malindo had been
increasing their seats capacities consistently during the same period.
In 2018, the overall low growth in seats capacity for Malaysian carriers is expected
to further improve load factors as traffic growth is expected to exceed the capacity
expansion. Malaysian carriers will be deploying their capacities on routes to and from
North Asia, India, and the ASEAN Member States. These regions are expected to report
strong economic growth in 2018, which will in turn, boost demand for air travel.
Figure 2: Seats Capacity Growth by Malaysian Carriers, 2010 – 2018F
Source: AirportIS
3 MAS’ business, property, rights, liabilities, and affairs were transferred to MAB on 1 September 2015
pursuant to the Malaysian Airline System Berhad (Administration) Act 2015, gazetted on 5 January 2015.
51.6 53.061.0
67.5 70.2 69.373.3 74.9
11.4
2.7
15.1
10.7
3.9
-1.3
5.82.2
-40
-30
-20
-10
0
10
20
2011 2012 2013 2014 2015 2016 2017 2018F
0
20
40
60
80
100
120
140
Yo
Y G
row
th (%
)Sea
ts (
mill
ion
)
Seats Capacity YoY Growth (RHS)

WAYPOINT
MALAYSIAN AVIATION COMMISSION ● MAY 2018 16
Net Increase of Six Additional Aircraft in 2018
Malaysian carriers are expected to increase their fleet size to 261 aircraft in 2018
(2017: 252) (see Figure 3). Generally, MAB contributes to the increase in fleet size as it is
scheduled to receive widebody aircraft such as Airbus 330-200s and Airbus 350-900s in
2018. MAB’s new widebody aircraft are expected to fill the gaps left by Boeing 777-200s
that were retired in 2017. Other airlines, such as Malindo and Firefly are planning to reduce
the number of their turbo-propeller aircraft. New delivery of narrow body aircraft is
expected to mainly replace the current fleet, for example, replacement of the Airbus 320
CEO with the Airbus 320 NEO.
Figure 3: Malaysian Carriers’ Fleet Size, 2010 – 2018F
Source: ASL Holders
39 44 53 64 65 61 56 49 52
106132
141
164 165 160 160 161171
32
3735
44 52 55 6242
38
2010 2011 2012 2013 2014 2015 2016 2017 2018F
0
50
100
150
200
250
300
Fle
et S
ize
Widebody Narrow Body Others
WAYPOINT
MALAYSIAN AVIATION COMMISSION ● MAY 2018 17
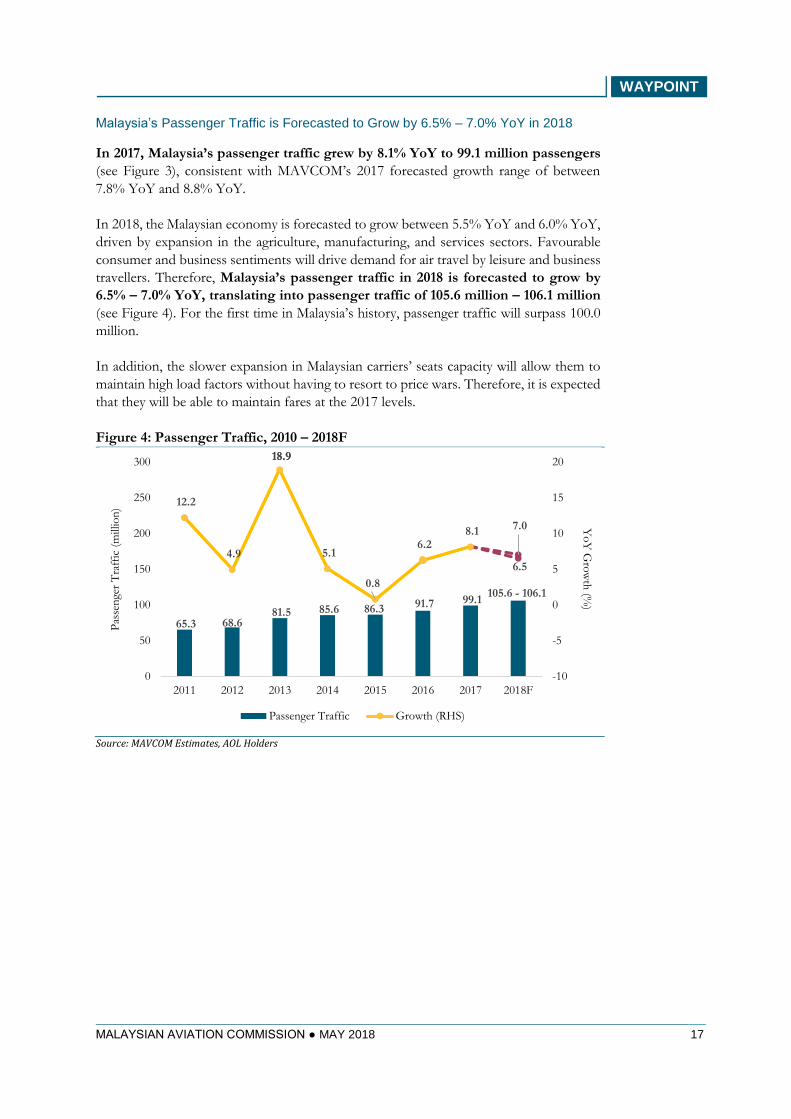
Malaysia’s Passenger Traffic is Forecasted to Grow by 6.5% – 7.0% YoY in 2018
In 2017, Malaysia’s passenger traffic grew by 8.1% YoY to 99.1 million passengers
(see Figure 3), consistent with MAVCOM’s 2017 forecasted growth range of between
7.8% YoY and 8.8% YoY.
In 2018, the Malaysian economy is forecasted to grow between 5.5% YoY and 6.0% YoY,
driven by expansion in the agriculture, manufacturing, and services sectors. Favourable
consumer and business sentiments will drive demand for air travel by leisure and business
travellers. Therefore, Malaysia’s passenger traffic in 2018 is forecasted to grow by
6.5% – 7.0% YoY, translating into passenger traffic of 105.6 million – 106.1 million
(see Figure 4). For the first time in Malaysia’s history, passenger traffic will surpass 100.0
million.
In addition, the slower expansion in Malaysian carriers’ seats capacity will allow them to
maintain high load factors without having to resort to price wars. Therefore, it is expected
that they will be able to maintain fares at the 2017 levels.
Figure 4: Passenger Traffic, 2010 – 2018F
Source: MAVCOM Estimates, AOL Holders
65.3 68.6 81.5 85.6 86.3 91.7 99.1
18.9
7.0
12.2
4.9
18.9
5.1
0.8
6.2 8.1
6.5
-10
-5
0
5
10
15
20
0
50
100
150
200
250
300
2011 2012 2013 2014 2015 2016 2017 2018F
Yo
Y G
row
th (%
)
Pas
sen
ger
Tra
ffic
(m
illio
n)
Passenger Traffic Growth (RHS)
105.6 - 106.1

WAYPOINT
MALAYSIAN AVIATION COMMISSION ● MAY 2018 18
SECTION 2: MACRO OVERVIEW
Global Economy Grew by 3.8% YoY in 2017
The global economy reported 3.8% YoY growth in 2017, whereas the ASEAN economy
grew 5.3% YoY. According to the BNM, the global economy reported 3.2% YoY
growth in 4Q17 (3Q17: 3.3% YoY). The world economy saw growth in wage, as well as,
lower unemployment rates. This contributed towards higher private consumption and
increased demand for manufacturing products. In response to the higher demand by
consumers, firms increased capital spending in machinery and equipment. These factors
supported the growth of the world’s major economies (see Table 5).
Table 5: 4Q17 Growth of Selected Economies
Regions 3Q17 GDP YoY
Growth (%)
4Q17 GDP YoY
Growth (%)
Philippines 7.2 6.5
China 6.8 6.8
Malaysia 6.2 5.9
Indonesia 5.1 5.2
Korea 3.8 2.8
Singapore 11.2 3.6
Europe 2.7 2.7
US 2.6 2.9
UK 1.7 1.4 Source: Thomson Reuters

WAYPOINT
MALAYSIAN AVIATION COMMISSION ● MAY 2018 19
Malaysia’s GDP Grew by 5.9% YoY in 2017
The Malaysian economy registered overall GDP growth of 5.9% YoY in 2017, with
the country’s GDP reporting consistently higher quarterly YoY growth of between 5.6%
to 6.2% from 1Q17 to 4Q17 (see Figure 5). The BNM reported that, in 4Q17, the
Malaysian economy was driven by strong growth in private consumption
expenditure (7.0% YoY). This was supported by higher spending on food and non-
alcoholic beverages, communication, and restaurants and hotels. On the production side,
services, agriculture, and manufacturing were the key economic drivers.
Figure 5: Quarterly Malaysia’s and Global GDP Growth, 2016 – 2017
Source: DOS, Thomson Reuters
4.1 4.04.3 4.5
5.6 5.86.2
5.9
2.3 2.3 2.32.6 2.6 2.9 3.0 3.2
0
1
2
3
4
5
6
7
1Q16 2Q16 3Q16 4Q16 1Q17 2Q17 3Q17 4Q17
Yo
Y G
row
th (
%)
Malaysia's GDP Global GDP

WAYPOINT
MALAYSIAN AVIATION COMMISSION ● MAY 2018 20
Lower Tourist Arrivals in 2017
According to the data from MOTAC, Malaysia’s tourist arrivals fell 3.0% YoY to 25.9
million in 2017 (2016: 26.8 million). Tourist arrivals declined every quarter in 2017, relative
to corresponding quarters in the previous years (see Figure 6). The decline in tourist
arrivals was mainly due to the lower number of Singaporean tourists. In 2017,
tourists from Singapore made up 47.9% of total tourist arrivals. One reason that had been
cited for this was the introduction of the vehicle entry fee imposed on Singaporean-
registered vehicles effective November 2016.
Despite that, it is worth noting that tourist arrivals from other countries such as Brunei,
China, South Korea, Thailand, and Taiwan grew between 3.1% YoY and 19.4% YoY. This
was in line with the data provided by the Immigration Department of Malaysia, which
showed that the arrivals of foreign nationals at KUL had increased 14.8% YoY (2016:
4.5 million; 2017: 5.1 million).
Figure 6: Quarterly Malaysia’s Tourist Arrivals, 2016 – 2017
Source: DOS, MOTAC, Thomson Reuters
6.7 6.4 6.7 7.0 6.6 6.3 6.5 6.5
2.84.6
3.35.3
-0.5 -0.7
-3.2
-7.3
-25
-20
-15
-10
-5
0
5
0
2
4
6
8
10
12
14
16
18
20
1Q16 2Q16 3Q16 4Q16 1Q17 2Q17 3Q17 4Q17
Yo
Y G
row
th (%
)To
uri
sts
(mill
ion
)
Total Tourists Tourists Arrival Growth (RHS)

WAYPOINT
MALAYSIAN AVIATION COMMISSION ● MAY 2018 21
Stronger Overall Trade Activities in 2017 Across Regions
In line with the stronger growth of the economy in 2017, higher demand for
manufacturing products boosted the growth of global trade (see Figure 7). The Asian
economies such as China, Korea, and Taiwan reported stronger trade value growth, driven
by the electrical and electronics and commodities sectors. Malaysia’s export growth in 2017
was higher than ASEAN’s export growth. For example, in 4Q17, Malaysia’s exports grew
by 12.4% YoY, whereas ASEAN’s exports grew by 6.7% YoY. There was a general
improvement in the PMI due to the stronger demand for manufacturing products in the
advanced economies that contributed towards growth for exports and imports in 2017.
Figure 7: Trade Value Quarterly YoY Growth Trends, 2016 – 2017
Source: DOS, Thomson Reuters
-10
-5
0
5
10
15
20
1Q16 2Q16 3Q16 4Q16 1Q17 2Q17 3Q17 4Q17
Yo
Y G
row
th (
%)
Exports Malaysia Imports Malaysia Global Exports
Global Imports ASEAN Exports ASEAN Imports

WAYPOINT
MALAYSIAN AVIATION COMMISSION ● MAY 2018 22
Higher Jet Fuel Price but More Favourable Exchange Rate
World crude oil price increased by 44.8% YoY from USD37/bbl in 2016 to USD54/bbl
in 2017. At the same time, the global jet fuel price increased by 52.7% YoY (2016:
USD43/bbl; 2017: USD66/bbl). The general upward trend in the crude oil price was
contributed by the coordinated efforts of OPEC and Russia to reduce oversupply of oil
in the market till end 2018. Between 1Q17 and 3Q17, the concern on OPEC’s and Russia’s
production cuts was mitigated by the increase in the US shale oil production—hitting a
record high of 9.6 million barrels per day in November 2017 (+17.0% YoY)—as seen in
Figure 8.
In 2017, on average, the RM had weakened against the USD from RM4.12/USD in 2016
to RM4.32/USD due to the USD benefiting from three interest rate hikes by the United
States Federal Reserve System.
However, as seen in Figure 8, the quarterly data in 2017 showed that the RM had
strengthened against the USD from 2Q17 onwards due to uncertainties in the US
economic policies. The BNM also attributed the stronger RM to the liberalisation of
bond market and foreign exchange hedging requirements announced in 2Q17.
Figure 8: Oil, Jet Fuel, and Exchange Rate Trends, 2016 – 2017
Source: DOS, Thomson Reuters
3.80
4.00
4.20
4.40
4.60
4.80
5.00
0
10
20
30
40
50
60
70
80
1Q16 2Q16 3Q16 4Q16 1Q17 2Q17 3Q17 4Q17
RM
/U
SD
USD
/b
bl
Crude Oil Jet Fuel RM/USD (RHS)

WAYPOINT
MALAYSIAN AVIATION COMMISSION ● MAY 2018 23
SECTION 3: INDUSTRY STRUCTURE
Aviation Services Segment
64 out of 69 Industry Players Generated RM32.7 billion of Revenue in 2017
As of 31 December 2017, MAVCOM had issued 65 licences/permits across four aviation
services segments, in addition to the four licences/permits that were issued by the CAAM
(previously known as the DCA) prior to MAVCOM’s establishment (see Table 6). These
companies reported total revenue of RM32.7 billion in 2017 with an average
operating profit margin of 5.8%. 91.6% of the total revenue generated by the industry
was contributed by the scheduled airlines and aerodrome operators. Between the four
aviation services segments, the aerodrome operators reported an aggregate operating profit
margin of 20.9% in 2017, which made them the most profitable aviation services providers
in the aviation industry.
Table 6: Summary of Licensed Aviation Services Providers
Type of
Licence
No. of
Licence
Holders
Aviation
Services
Segment
Revenue
(RM million)
Operating Profit
Margin (%)
2016 2017 2016 2017
ASL 7 Scheduled
Services4 21,637.7 25,912.4 6.6 2.1
ASP5 27
Non-
Scheduled
Services
1,999.7 1,838.0 10.4 16.7
GHL 30 Ground
Handling6 994.4 N/A 4.4 N/A
AOL 5 Aerodrome
Operator 4,491.2 4,957.6 19.7 20.9
TOTAL 69 29,123.0 32,708.0 8.8 5.8
Source: MAVCOM
Appendix B provides the list of the licence and permit holders issued by MAVCOM as of
31 December 2017.
4 ASL holders’ revenue and operating profit margin numbers reflect only the scheduled passenger service
providers. The number excludes one scheduled cargo service provider.
5 This includes five conditional ASP holders that have yet to commence operations as they are in the process
of obtaining their AOCs.
6 GHL holders’ revenue and operating profit margin numbers were based on the latest 2016 audited accounts
and excluded one scheduled cargo service provider, one non-scheduled services provider, one passenger
service provider, and four refuelling service providers because including these companies would overstate the
GHL holders’ financial numbers.

WAYPOINT
MALAYSIAN AVIATION COMMISSION ● MAY 2018 24
Scheduled Passenger Service Market
AirAsia is the Dominant Player for the Scheduled Passenger Service Market
In terms of passengers carried in 2017, AirAsia had the biggest market share of 56.3% in
the domestic market and 27.6% in the international market (see Figure 9). In terms of
revenue, AirAsia had the biggest market share of 48.9% in the domestic market, whereas
MAB had the biggest share of 24.9% in the international market.
Figure 9: Percentage of Airlines’ Market Share for Domestic and International
Routes by Passengers and Revenue, 2017
Source: MAVCOM Estimates, AirportIS
With more than 80 airlines operating the international routes to and from Malaysia, the
international market had a low HHI7 of 0.1362 in 2017. As for the domestic routes,
the HHI in 2017 was 0.3698, which was more concentrated compared with the
international routes as there were only four airlines operating in the domestic market.
Furthermore, the international market was less concentrated compared to the domestic
market as only airlines with majority local ownership could operate in the domestic market.
7 HHI is an index that measures the degree of concentration in an industry, with ‘0’ denoting no concentration
and ‘1’ denoting a monopoly.
56.348.9
27.613.9
11.4
14.1
5.6
3.1
0.8
0.3
12.4
9.5
8.1
6.2
25.738.6
16.7
24.9
35.4 40.6
0
10
20
30
40
50
60
70
80
90
100
Passengers Revenue Passengers Revenue
Domestic International
Sh
are
(%)
AirAsia AirAsia X Firefly Malindo MAB Others

WAYPOINT
MALAYSIAN AVIATION COMMISSION ● MAY 2018 25
Monopoly Structure of Domestic Routes did not Translate into High RASK
In 2017, all domestic routes8 reported load factors above 65.0% with an average load
factor of 82.3% (2016: 75.3%) (see Figure 10). The improvement was due to the cautious
capacity expansion, as well as, strong air travel demand in 2017. The JHB-KUL route
reported the highest increase in load factor between 2016 and 2017 (2016: 68.9%; 2017:
80.0%). This route is currently being served by two airlines, namely, AirAsia and MAB
with a total of 72-weekly flights.
In terms of the concentration ratio, 14 out of 40 domestic routes had HHI values of
1.0000 in 2017, which basically means that there was only one airline operating on those
routes. The average HHI for domestic routes recorded less concentration from 0.5606 in
2016 to 0.4367 in 2017. Although the international passenger traffic market was less
concentrated in 2017, on the individual route basis, approximately 55.4% of the
international routes were operated by just one airline. The international routes
reported an average load factor of 81.0% in 2017, slightly below the average load factor of
domestic routes.
Figure 10: Domestic Routes and Concentration Levels, 2017
Source: MAVCOM Analysis, AirportIS
8 Domestic routes exclude the RAS routes in Sabah and Sarawak.
0
10
20
30
40
50
60
70
80
90
100
0.00
0.10
0.20
0.30
0.40
0.50
0.60
0.70
0.80
0.90
1.00
BK
I-JH
B
BK
I-K
BR
JHB
-KC
H
JHB
-MY
Y
JHB
-PE
N
JHB
-SB
W
KB
R-K
CH
KB
R-P
EN
KT
E-S
ZB
KU
A-K
UL
MK
Z-P
EN
JHB
-TG
G
JHB
-TW
U
KC
H-L
GK
IPH
-JH
B
JHB
-LG
K
BK
I-P
EN
KC
H-P
EN
LG
K-P
EN
BK
I-K
CH
KU
L-L
BU
AO
R-K
UL
KU
L-S
BW
KU
L-S
DK
LG
K-S
ZB
PE
N-S
ZB
JHB
-SZ
B
KU
L-T
GG
KU
L-T
WU
SZ
B-T
GG
AO
R-S
ZB
BT
U-K
UL
KB
R-S
ZB
KU
L-M
YY
JHB
-KU
L
KC
H-K
UL
KU
L-P
EN
KB
R-K
UL
BK
I-K
UL
KU
L-L
GK
Lo
ad F
actor (%
)
HH
I
HHI Load Factor

WAYPOINT
MALAYSIAN AVIATION COMMISSION ● MAY 2018 26
The RASK for domestic routes9 in 2017 ranged from RM0.12 to RM0.68, of which only
three domestic routes reported RASK of above RM0.40 in 2017, namely, the KTE-
SZB, KBR-PEN, and LGK-PEN routes (see Figure 11). The KTE-SZB and KBR-PEN
routes were operated by only one airline each, which are Malindo and Firefly, respectively.
Not all domestic routes with an HHI of 1.0000 reported high level of RASK. For example,
the BKI-JHB and BKI-KBR routes reported low RASK of RM0.15 in 2017 even though
these two routes were operated by one airline (AirAsia), and had no viable alternative
modes of transport. The RASK for international routes in 2017 ranged between
RM0.02 and RM0.67, where the route with the highest RASK was MKZ-PKU and the
route with the lowest RASK was KUL-DOH.
Figure 11: RASK for Domestic Routes, 2017
Source: MAVCOM Analysis, AirportIS
9 Domestic routes exclude the RAS routes in Sabah and Sarawak.
0.00
0.10
0.20
0.30
0.40
0.50
0.60
0.70
KT
E-S
ZB
KB
R-P
EN
LG
K-P
EN
KU
A-K
UL
PE
N-S
ZB
JHB
-SZ
B
SZ
B-T
GG
KB
R-S
ZB
IPH
-JH
B
AO
R-S
ZB
MK
Z-P
EN
LG
K-S
ZB
JHB
-KU
L
KU
L-P
EN
JHB
-TG
G
KB
R-K
UL
JHB
-PE
N
KU
L-T
GG
BK
I-K
CH
JHB
-LG
K
AO
R-K
UL
JHB
-KC
H
KC
H-K
UL
JHB
-SB
W
KU
L-L
GK
JHB
-MY
Y
KC
H-P
EN
KB
R-K
CH
BT
U-K
UL
BK
I-K
BR
BK
I-JH
B
JHB
-TW
U
BK
I-K
UL
KC
H-L
GK
KU
L-M
YY
KU
L-S
BW
KU
L-L
BU
KU
L-T
WU
BK
I-P
EN
KU
L-S
DK
RA
SK
(R
M)

WAYPOINT
MALAYSIAN AVIATION COMMISSION ● MAY 2018 27
Non-Scheduled Services Segments
Highly Concentrated Business Segments Have Lower Profit Margins
Three business sub-segments—aerial work, oil and gas, and on-demand charter—reported
profitability in 2017 (see Table 7). The total market size in 2017, in terms of revenue,
was RM1.8 billion, generated by 22 companies. The biggest business sub-segment of
the non-scheduled services segment in 2017 was the oil and gas sub-segment, which
reported RM1.0 billion in revenue. This sub-segment was also the most profitable in 2017
with 28.4% operating profit margin, whereas the least profitable sub-segment was the
surveying, observation, and patrol business which registered RM9.4 million operating
losses. In this market, the most concentrated business segment was the least
profitable in 2017 showing that less competition does not necessarily lead to higher
profits. The failure for these companies to record higher profits in the absence of
competition could also be attributed to their inefficient operations.
Table 7: Summary of Non-Scheduled Services’ Market Structure, 2017
Type of Business
No. of
Licence
Holders
HHI 2017 Revenue
(RM million)
2017 Operating
Profit Margin (%)
Surveying,
Observation & Patrol 1 1.0000 2.2 -422.0
Pleasure Flying 3 0.8205 5.3 -78.5
On-demand Cargo 2 0.6739 100.7 -6.0
Aerial Work – cloud
seeding, mapping 2 0.6426 71.3 5.4
Oil & Gas 5 0.4677 1,008.5 28.4
On-demand Charter 9 0.4316 650.1 5.6
TOTAL 22 1,838.0 16.7 Source: MAVCOM

WAYPOINT
MALAYSIAN AVIATION COMMISSION ● MAY 2018 28
Aerodrome Operators Segment
Heavy Government Involvement in the Aerodrome Operations Segment
There are 42 airports in Malaysia operated by four companies, namely, MAHB, Senai
Airport, TMDSB, and SSSB. MAHB currently operates a total of 39 airports, whereas Senai
Airport, TMDSB, and SSSB operate JHB, TGC, and KTE, respectively. In this respect,
MAHB is a near monopoly airport operator in the country. Both MAHB and SSSB are
under indirect control of the GOM. MAHB is indirectly controlled by the GOM via
Khazanah, PNB, and EPF while SSSB via PETRONAS. This is by virtue of the GIC
Division’s10 stake in Khazanah and PETRONAS, respectively. The GIC Division also has
one golden share in MAHB. MAHB is currently a public-listed company on Bursa
Malaysia.
TMDSB is under the control of the Sarawak state government via the STIDC. This puts
TMDSB in the same category as MAHB and SSSB, which are publicly-owned entities.
Therefore, Senai Airport is the only privately-owned airport operator in Malaysia as
it is a wholly-owned subsidiary of MMC Corporation Berhad, which is a public-listed
company on Bursa Malaysia.
Near Monopoly Market Structure
By virtue of operating 39 out of 42 airports in the country, MAHB has the largest market
share in Malaysia, calculated in terms of revenue, at 98.5% (RM4.9 billion) as at 31
December 2017. The other three airport operators generated less than RM100.0 million
of aggregated revenue.
In terms of the number of passengers served, MAHB handled 96.8% of passenger traffic
in Malaysia. The main reason for this dominance is MAHB’s control over KUL which—
as the main airport serving Kuala Lumpur—handled 58.8% of passenger traffic for
Malaysia in 2017. KUL handled 58.4 million passengers in 2017, followed by BKI at 8.0
million passengers. The HHI for the airports industry in Malaysia is highly concentrated at
0.9363.
10 Previously known as MOF Inc.

WAYPOINT
MALAYSIAN AVIATION COMMISSION ● MAY 2018 29
Four Main Hubs in Malaysia – KUL, PEN, JHB, and BKI
The geographical spread of top aviation hubs in Malaysia may indicate the existence of
natural geographical networks. In this case, the airport network structure in the country
can be divided into four – central Peninsular Malaysia (KUL), northern Peninsular
Malaysia (PEN), southern Peninsular Malaysia (JHB), and East Malaysia (BKI).
Figure 1211 highlights that 18 out of 34 airports currently have commercial operations
serve less than three destinations.
Figure 12: Number of Destinations Served by Airports, 2017
Source: MAVCOM Analysis, AirportIS
11 The chart excludes unutilised STOLports
136
3325
19 18 1510 8 7 7 6 5 5 5 4 4 3 3 3 3 3 3 2 2 2 2 2 2 2 2 2 2 1 1
0
20
40
60
80
100
120
140
KU
L
BK
I
PE
N
MY
Y
JHB
KC
H
SZ
B
LG
K
BT
U
SB
W
MU
R
KB
R
MK
M
TW
U
LW
Y
SD
K
BB
N
BK
M
LB
U
LM
N
MZ
V
TG
G
AO
R
IPH
KU
A
KU
D
LB
P
LG
L
LK
H
MK
Z
OD
N
TG
C
KT
E
LD
U
No
. o
f D
esti
nat
ion
s

WAYPOINT
MALAYSIAN AVIATION COMMISSION ● MAY 2018 30
Most airports in Malaysia are focused on domestic passengers. This is true even for
airports such as BKI, PEN, KCH, JHB, and LGK, despite their designations as
international airports. Apart from KUL, both IPH and MKZ have larger proportion of
international than domestic traffic (see Figure 1312). Thus, MAHB and Senai Airport are
the only two airport operators in the country that serve domestic, ASEAN, and
international traffic. This contrasts with TMDSB and SSSB—via TGC and KTE—which
only cater to the domestic traffic.
Figure 13: Traffic Breakdown by Regions of Travel, 2017
Source: MAVCOM Analysis, AirportIS
Most airports in Malaysia predominantly cater to O&D passengers. KUL, as the
major hub airport in Malaysia, has a passenger composition of 32.6% hub passengers and
67.4% O&D passengers as of 2017 (see Figure 1412). Similarly, other airports in Malaysia
are supported by demand for point-to-point services between airports.
Figure 14: Traffic Breakdown by O&D and Hub Traffic, 2017
Source: MAVCOM Analysis, AirportIS
12 The chart excludes unutilised STOLports
0
10
20
30
40
50
60
70
80
90
100
KU
L
BK
I
PE
N
JHB
LG
K
KC
H
SZ
B
LB
U
MK
Z
BB
N
LW
Y
TG
G
KU
A
MU
R
KU
D
KB
R
BK
M
IPH
LB
P
KT
E
MK
M
MZ
V
MY
Y
OD
N
SB
W
BT
U
LD
U
SD
K
AO
R
TG
C
LG
L
TW
U
LK
H
LM
N
% S
har
e
Domestic ASEAN International
0
10
20
30
40
50
60
70
80
90
100
KU
L
BK
I
PE
N
JHB
LG
K
KC
H
SZ
B
LB
U
MK
Z
BB
N
LW
Y
TG
G
KU
A
MU
R
KU
D
KB
R
BK
M
IPH
LB
P
KT
E
MK
M
MZ
V
MY
Y
OD
N
SB
W
BT
U
LD
U
SD
K
AO
R
TG
C
LG
L
TW
U
LK
H
LM
N
% S
har
e
O&D Hub

WAYPOINT
MALAYSIAN AVIATION COMMISSION ● MAY 2018 31
Air Connectivity Index
The connectivity ranking of the ASEAN Member States remained the same between 2016
and 2017 as the air connectivity index increased across all countries in 2017 (see Table
8). Vietnam reported the highest increase in the connectivity index from 60.8 to 74.4,
whereas Brunei reported the smallest increase from 4.9 to 5.3. Based on Table 9, in 2017,
Vietnam reported the highest percentage increase in the number of seats at 19.6%. At the
same time, its number of destinations also increased by 15—also the highest—to 76
destinations.
Table 8: Air Connectivity Index and Ranking of ASEAN Member States, 2016 –
2017
Country
Connectivity
Ranking Connectivity Score
2016 2017 2016 2017
Thailand 1 1 142.7 153.0
Singapore 2 2 103.5 107.8
Indonesia 3 3 88.4 99.4
Malaysia 4 4 79.6 88.8
Philippines 5 5 71.6 77.6
Vietnam 6 6 60.8 74.4
Cambodia 7 7 15.1 21.4
Myanmar 8 8 13.8 14.7
Laos 9 9 5.0 5.5
Brunei 10 10 4.9 5.3 Source: MAVCOM Estimates, AirportIS
Changes in the air connectivity index could be contributed by changes in the number of
seats and number of destinations. In 2017, the number of destinations and seats for
Malaysia increased by 6.9% YoY and 13.5% YoY, respectively (see Table 9). In
comparison, Thailand, Indonesia, and Vietnam reported more aggressive increases for
both metrics in 2017.
Table 9: Changes to Number of Seats and International Destinations for ASEAN
Member States, 2016 – 2017
Country
Number of
Destinations % Change
Number of Seats
(million) % Change
2016 2017 2016 2017
Thailand 151 180 19.2 4.06 4.49 10.6
Singapore 153 161 5.2 3.65 3.73 2.2
Indonesia 60 70 16.7 1.86 2.17 16.7
Malaysia 116 124 6.9 2.65 3.01 13.5
Philippines 63 66 4.8 1.46 1.56 7.2
Vietnam 61 77 26.2 1.44 1.72 19.6
Cambodia 41 53 29.3 0.52 0.61 17.8
Myanmar 23 26 13.0 0.32 0.34 6.7
Laos 19 22 15.8 0.16 0.17 10.3
Brunei 15 18 20.0 0.10 0.11 4.6 Source: MAVCOM Estimates, AirportIS

WAYPOINT
MALAYSIAN AVIATION COMMISSION ● MAY 2018 32
Although Indonesia had a lower number of international destinations and seats compared
to Malaysia, it had more seats to destinations such as SIN and DXB that have a higher
degree of international traffic. For example, Indonesia had 463,193 and 57,596 to SIN and
DXB, respectively in 2017. Malaysia had 21.8% and 25.8% fewer seats than Indonesia to
SIN and DXB, respectively. Hence, Indonesia obtained a higher connectivity score
compared to Malaysia.
A Technical Paper on the Air Connectivity Index is available on MAVCOM’s website to
further elaborate on this subject (please see Technical Paper: Defining and Measuring Air
Connectivity).
ATRs Awarded by MAVCOM as of 31 December 2017
In 2017, ASL holders were awarded 209 additional ATRs (see Table 10), with Malindo
receiving the highest number of ATRs at 81, followed by AirAsia at 77. Since MAVCOM’s
inception in March 2016, the two ASL holders had been awarded a total of 140 and 85
ATRs, respectively. However, in 2017, there were 52 ATRs that were revoked as ASL
holders failed to utilise the rights within six months from the date of issuance. Out of the
52 ATRs that were revoked in 2017, 33 ATRs were awarded to Malindo, which represented
23.6% of total ATRs that were given to the airline between 2016 and 2017. ASL holders
can also surrender the ATRs that they no longer require. In 2017, there were five ATRs
that were surrendered.
Table 10: Breakdown of ATRs Awarded, 2016 – 2017
Airline
Total Domestic &
International ATRs
Awarded
Fail to Operate13 Surrendered14
2016 2017 2016 2017 2016 2017
AirAsia 8 77 7 9 - -
AirAsia X 17 15 7 2 4 3
Firefly - 2 - - - -
MAB 14 32 - 6 - 1
Malindo 59 81 - 33 3 1
Raya Airways 1 2 - 2 1 -
TOTAL 99 209 14 52 8 5
Source: MAVCOM
The ASL holders sometimes surrender or fail to utilise their ATRs due to:
• their inability to secure the necessary approvals to operate the routes from other
relevant authorities;
• the proposed route was later deemed as commercially unviable;
• the unavailability of aircraft due to changes in the aircraft delivery schedule; or
• the changes to the ASL holders’ business strategy.
13 ATRs revoked for failing to operate within six months from the ATRs’ date of issuance.
14 ATRs surrendered by the ASL holders.

WAYPOINT
MALAYSIAN AVIATION COMMISSION ● MAY 2018 33
In 2017, out of the 209 ATRs awarded by MAVCOM to the ASL holders, 59.8% were
for routes to ASEAN, China, and India (see Figure 15). AirAsia and Malindo received
the highest number of ATRs for these three regions representing 19.1% and 27.3% of the
total ATRs that were granted in 2017. 65 ATRs that were approved for new routes and
new destinations across 15 countries, with AirAsia X being the only airline that was
awarded ATRs for destinations in Africa, the Americas, and Europe. The ATRs awarded
to Malaysian carriers reflected their growth strategies of focusing on the ASEAN Member
States, China, and India, where demand for air travel are most likely to be the highest.
Figure 15: Breakdown of ATRs Awarded by Region, 2016 – 2017
Source: MAVCOM
Section 5 provides details on the market structure of the ground handling services market.
8
77
17 15
0 2
14
32
59
81
1 2
0
10
20
30
40
50
60
70
80
2016 2017 2016 2017 2016 2017 2016 2017 2016 2017 2016 2017
AirAsia AirAsia X Firefly MAB Malindo Raya Airways
Num
ber
of
AT
Rs
Domestic Africa Americas ASEAN India
China Rest of Asia Australasia Europe Middle East

WAYPOINT
MALAYSIAN AVIATION COMMISSION ● MAY 2018 34
SECTION 4: INDUSTRY PERFORMANCE
Scheduled Services
8.1% YoY Growth for Passenger Traffic in 2017
In 2017, Malaysia’s passenger traffic grew by 8.1% YoY to 99.1 million (see Figure
16), which was well within MAVCOM’s 2017 passenger traffic forecast of 7.8% – 8.8%
YoY. During the same period, the number of seats capacity increased by 5.4% YoY. The
growth of passenger traffic in 2017 was the highest recorded since 2013. Indeed, 2013 was
an exceptional year when Malaysian carriers had engaged in a price war to defend their
market shares upon the entry of Malindo into the market.
The 2017 passenger traffic growth was supported by the growth of international and
domestic passenger traffic at 13.4% YoY and 3.3% YoY, respectively. For the
international segment, traffic to the ASEAN destinations grew by 10.8% YoY, while the
non-ASEAN traffic grew by 16.0% YoY.
Figure 16: Annual Passenger Traffic Trend, 2011 – 2017
Source: MAVCOM Analysis, AOL Holders
65.3 68.6 81.5 85.6
86.3 91.7 99.1
12.2
4.9
18.9
5.1
0.8
6.28.1
-15
-10
-5
0
5
10
15
20
25
0
50
100
150
200
250
300
2011 2012 2013 2014 2015 2016 2017
Yo
Y G
row
th (%
)
Pas
sen
ger
Tra
ffic
(m
illio
n)
Passenger Traffic Growth (RHS)

WAYPOINT
MALAYSIAN AVIATION COMMISSION ● MAY 2018 35
In 2015, MAB had cut its capacity by 30.0%, which resulted in subdued passenger traffic
growth in the first two quarters of 2016 (see Figure 17). In 2017, due to the low base effect,
passenger traffic grew at rates between 7.1% YoY and 13.0% YoY during the first three
quarters of 2017. Furthermore, airlines benefited from the low jet fuel prices between
2016 and the first nine months of 2017, which allowed them to lower their average
fares and stimulate demand for air travel. This contributed to the strong growth rates—
mid-single digit to double digits—between 3Q16 and 3Q17.
Figure 17: Quarterly Passenger Traffic Trend, 2016 – 2017
Source: MAVCOM Analysis, AOL Holders
21.8 21.623.6 24.3 24.0 24.5 25.2 25.6
4.1
0.1
8.610.2 9.9
13.0
7.15.2
-20
-15
-10
-5
0
5
10
15
0
5
10
15
20
25
30
35
40
45
50
1Q16 2Q16 3Q16 4Q16 1Q17 2Q17 3Q17 4Q17
Yo
Y G
row
th (%
)
Pas
sen
ger
Tra
ffic
(m
illio
n)
Passenger Traffic Growth (RHS)

WAYPOINT
MALAYSIAN AVIATION COMMISSION ● MAY 2018 36
As previously mentioned, the passenger traffic for Malaysia in 2017 was boosted by the
growth of ASEAN and international traffic (see Figure 18). Between 1Q17 and 4Q17,
both ASEAN and international traffic reported growth rates of between 8.3% to 12.7%
YoY and 11.7% to 17.6% YoY, respectively. In contrast, the growth of domestic traffic
had decelerated in 3Q17 and declined in 4Q17 due to the reduction in domestic
capacity by MAB and Firefly. During the year, the two carriers retired a number of aircraft
such as, Boeing 737-400, Boeing 737-800, and ATR72-600 from their fleet. These aircraft
were predominantly used for domestic destinations.
Figure 18: Quarterly Passenger Traffic Trend by Regions, 2016 – 2017
Source: MAVCOM Analysis, AOL Holders
8.28.9
1.1
-1.5
8.3
11.9
12.7
9.8
11.7
17.6
13.812.6
-5
0
5
10
15
20
1Q17 2Q17 3Q17 4Q17
Yo
Y G
row
th (
%)
Domestic ASEAN International

WAYPOINT
MALAYSIAN AVIATION COMMISSION ● MAY 2018 37
Aircraft and Cargo Movements Continued to Grow in 2017
Similar to the passenger traffic growth, both the aircraft and cargo movements grew
by 4.5% YoY and 9.7% YoY, respectively. Aircraft movements grew slower than
passenger traffic in 2017 in view of higher wide-body aircraft movements. This is in line
with the faster international passenger traffic growth that are typically carried by wide-
body aircraft. Cargo movements in 2017 were supported by the strong freight growth of
10.4% YoY despite the decline in mail growth (-6.7% YoY).
On a quarterly basis, the aircraft movements reported strong YoY growth between 4Q16
and 3Q17 (see Figure 19). During this period, there was a low base effect from the cutting
of capacity in 2015 by MAB as explained earlier. Growth had tapered off in 4Q17 as
aircraft movements only grew by 1.3% YoY during the quarter.
Figure 19: Malaysia’s Aircraft Movements, 2016 – 2017
Source: MAVCOM Analysis, AOL Holders
213.6 209.5 219.4 226.1 223.8 223.9 230.5 229.1
-0.5
-2.9
2.1
6.6
4.8
6.85.1
1.3
-20
-15
-10
-5
0
5
0
50
100
150
200
250
300
350
400
450
500
1Q16 2Q16 3Q16 4Q16 1Q17 2Q17 3Q17 4Q17
Yo
Y G
row
th (%
)
Mo
vem
ents
(th
ousa
nd
)
Aircraft Movement Growth (RHS)

WAYPOINT
MALAYSIAN AVIATION COMMISSION ● MAY 2018 38
In 2017, approximately 96.7% of the cargo traffic in Malaysia was contributed by freight,
while the balance came from mail. There was double digit growth in cargo traffic for 1Q17
and 3Q17 (see Figure 20). The strong growth in 2017 due to the recovery from a series of
negative quarterly YoY growth since 2016. The decline in cargo movements in 2016 was
due to the capacity reduction by MAB Kargo. Malaysia’s cargo movements were in line
with the growth of imports and exports for Malaysia.
Figure 20: Malaysia’s Cargo Movements, 2016 – 2017
Source: MAVCOM Analysis, AOL Holders
210.7 220.9 222.1 255.0
240.4 242.2 250.3 265.0
-16.3-13.5
-10.7
3.9
14.19.6
12.7
3.9
-60
-50
-40
-30
-20
-10
0
10
0
100
200
300
400
500
1Q16 2Q16 3Q16 4Q16 1Q17 2Q17 3Q17 4Q17
Yo
Y G
row
th (%
)
Met
ric
To
nn
es (
tho
usa
nd
)
Cargo Movement Growth (RHS)

WAYPOINT
MALAYSIAN AVIATION COMMISSION ● MAY 2018 39
Improved Load Factors on the Back of Lower Average Fares
2017 showed improvement in the load factors for Malaysian carriers as they
reported an average load factor of 82.8% (2016: 78.8%). It was also observed that, on
average, the load factors from 2016 onwards were higher than the load factors reported
pre-2016. As an illustration, the load factors between 2010 and 2015 ranged from 72.0%
to 79.6%, (2016 – 2017: 75.9% – 87.4%) (see Figure 21). The improvement in load factors
over the past two years reflected the matching of capacity and passenger demand as some
airlines rationalised their capacities, as well as, stronger air travel demand.
Figure 21: Malaysian Carriers’ Load Factors Trend, 2010 – 2017
Source: MAVCOM Analysis, AirportIS
73.7
72.0
74.4
76.8
71.
974.4
74.0
73.7
73.8
74.0
73.1
75.1
75.3
76.5 79.6
77.3
76.5
75.0
73.2
73.9
72.5
71.
973.4
75.0
76.9
75.9 8
1.2
80.9
82.4
81.
180.2 8
7.4
0
10
20
30
40
50
60
70
80
90
100
1Q
10
2Q
10
3Q
10
4Q
10
1Q
11
2Q
11
3Q
11
4Q
11
1Q
12
2Q
12
3Q
12
4Q
12
1Q
13
2Q
13
3Q
13
4Q
13
1Q
14
2Q
14
3Q
14
4Q
14
1Q
15
2Q
15
3Q
15
4Q
15
1Q
16
2Q
16
3Q
16
4Q
16
1Q
17
2Q
17
3Q
17
4Q
17
Lo
ad F
acto
r (%
)

WAYPOINT
MALAYSIAN AVIATION COMMISSION ● MAY 2018 40
Between 2010 and 2017, average fares for both domestic and international routes
decreased significantly. The domestic and international average fares in 2017 were
RM221 and RM498, respectively (2010: Domestic – RM322, International – RM664). This
could be due to the increased competition (entry of Malindo in 2013) and lower jet fuel
prices from 2015 onwards. In 2017, the international average fares continued to decline
from RM531 in 4Q16 to RM467 in 4Q17 (see Figure 21). However, the domestic average
fares in 2017 remained at similar levels with the year 2016.
Figure 22: Malaysian Carriers’ Average Fares Trend, 2010 – 2017
Source: MAVCOM Analysis, AirportIS
320
325
315 329
245
255
255
248
241
259
232
245
229 252
245
246
222
217 229
237
224
226
247
234
205
223
219 239
207
207 236
234
666
676
648
665
570
575640
607
549
547
501
511
505
490 527 5
85
587
526
527 559
567
533
601
570
519
508
524
531
521
499
506
467
0
100
200
300
400
500
600
700
800
1Q
10
2Q
10
3Q
10
4Q
10
1Q
11
2Q
11
3Q
11
4Q
11
1Q
12
2Q
12
3Q
12
4Q
12
1Q
13
2Q
13
3Q
13
4Q
13
1Q
14
2Q
14
3Q
14
4Q
14
1Q
15
2Q
15
3Q
15
4Q
15
1Q
16
2Q
16
3Q
16
4Q
16
1Q
17
2Q
17
3Q
17
4Q
17
Aver
age
Far
es (
RM
)
Domestic Fares International Fares

WAYPOINT
MALAYSIAN AVIATION COMMISSION ● MAY 2018 41
The Spread between CASK and RASK Narrowed in 2017
On average, the RASK for Malaysian carriers were 7.6% higher YoY in 2017 (2016: 15.3
sen; 2017: 16.5 sen). The 2017 RASK ranged between 15.9 sen and 16.8 sen (2016: 14.2
sen – 15.4 sen) (see Figure 23). The increase in RASK was achieved by higher load factors
and outpaced the increase in CASK (+3.1% YoY). This resulted in the reduction of the
RASK and CASK spread in 2017 by 42.5% YoY. Indeed, the Malaysian carriers
benefited by the continued strong demand for air travel on the back of slow
expansion in capacity in 2017.
Figure 23: Malaysian Carriers’ RASK and CASK Trends, 2016 – 2017
Source: MAVCOM Analysis, ASL Holders
15.3
14.2
14.9
15.4
16.3
15.9 16.0
16.8
16.316.1
15.9 16.0
17.1
16.516.7
17.5
-1.0
-1.9
-1.1-0.6
-0.9-0.6 -0.7 -0.7
-3
-2
-1
0
1
2
3
4
5
13
14
14
15
15
16
16
17
17
18
18
1Q16 2Q16 3Q16 4Q16 1Q17 2Q17 3Q17 4Q17
Sp
read (sen
)
RA
SK
an
d C
ASK
(se
n)
RASK CASK Spread (RHS)

WAYPOINT
MALAYSIAN AVIATION COMMISSION ● MAY 2018 42
Malaysian Carriers’ Revenue was Boosted by Ancillary Revenue
The Malaysian carriers’ revenue grew 19.8% YoY to RM25.9 billion in 2017 (2016:
RM21.6 billion) due to overall 8.1% YoY growth in Malaysia’s passenger traffic
reported over the same period (see Figure 24). Their revenue was supported by ancillary
income as averages fares (base fares) were falling (-3.8% YoY). Therefore, ancillary
revenue played an important role to supplement the airlines’ revenue, especially in
a low fare environment.
In terms of profitability, the operating profit margin for Malaysian carriers declined from
6.6% in 2016 to 2.1% in 2017 as jet fuel prices increased from an average of USD43/bbl
to USD66/bbl over the period. At the same time, the RM depreciated by 4.9% YoY over
the same period which resulted in the jet fuel prices to increase by 52.7% YoY in RM
terms.
Figure 24: Revenue and Operating Profit Margin of Malaysian Carriers, 2016 – 2017
Source: MAVCOM Analysis, ASL Holders
18.220.3 20.3
22.4 23.1 23.8 21.6
25.9
6.9
-6.0
3.41.4
-3.9
-16.1
6.62.1
-60
-50
-40
-30
-20
-10
0
10
0
5
10
15
20
25
30
35
40
45
50
2010 2011 2012 2013 2014 2015 2016 2017
Op
erating P
rofit M
argin (%
)
Rev
enue
(bill
ion
)
Revenue Operating Profit Margin (RHS)

WAYPOINT
MALAYSIAN AVIATION COMMISSION ● MAY 2018 43
Non-Scheduled Services
Smaller Revenue, but Significantly Higher Operating Profit Margin in 2017
The non-scheduled services segment’s operating profit margin in 2017 improved
to 16.7% (2016: 10.4%) (see Figure 25). This was mainly contributed by a 47.1% YoY
increase in profit via an improvement in the oil and gas sub-segment (see Table 11)
brought by compensation payments resulting from the termination of contracts by clients
of two ASP holders.
Figure 25: Revenue and Operating Profit Margin of ASP Holders, 2016 – 2017
Source: MAVCOM Analysis, ASL Holders
Table 11: Revenue and Operating Profit Margins of ASPs’ Business Segments, 2015
– 2017
Business Segment Revenue (RM million)
Operating Profit Margin
(%)
2015 2016 2017 2015 2016 2017
Aerial work - cloud
seedling, mapping 79.0 94.8 71.3 -2.5 22.0 5.4
Oil & gas 1,405.6 1,118.8 1,008.5 16.9 14.2 28.4
On-demand cargo 93.8 91.2 100.7 -6.3 -5.5 -6.0
On-demand charter 142.2 689.7 650.1 3.5 5.4 5.6
Pleasure flying 1.5 1.2 5.3 -41.2 -91.8 -78.5
Surveying,
observation & patrol 0.7 7.0 2.2 14.0 29.4 -422.0
Source: MAVCOM
1.72.0
1.8
13.5
10.4
16.7
0
2
4
6
8
10
12
14
16
18
0.0
0.5
1.0
1.5
2.0
2.5
3.0
3.5
4.0
4.5
5.0
2015 2016 2017
Op
erating P
rofit M
argin (%
)
Rev
enue
(bill
ion
)
Revenue Operating Profit Margin (RHS)

WAYPOINT
MALAYSIAN AVIATION COMMISSION ● MAY 2018 44
Aerodrome Operations
Revenue Supported by Robust Passenger Traffic Growth
More than 90.0% of the total revenue and operating profit for Malaysian airport operators
were made by MAHB. Therefore, the segment’s financial performance would be
influenced by MAHB’s financial performance. Revenue for the Malaysian airport
operators grew by 10.4% YoY supported by 8.1% YoY passenger traffic growth in
2017 (see Figure 25). As mentioned earlier, both the ASEAN and international passenger
traffic grew strongly in 2017 and contributed significantly to the airport operators’ revenue.
Figure 26: Revenue and Operating Profit Margin of AOL Holders, 2016 – 2017
Source: MAVCOM Analysis, AOL Holders
2.62.9
3.7
4.3
3.6
4.34.5
5.0
22.321.3
18.7
14.6
11.5
18.219.7
20.9
-10
-5
0
5
10
15
20
25
0
1
2
3
4
5
6
7
8
9
2010 2011 2012 2013 2014 2015 2016 2017
Op
erating P
rofit M
argin (%
)
Rev
enue
(bill
ion
)
Revenue Operating Profit Margin (RHS)

WAYPOINT
MALAYSIAN AVIATION COMMISSION ● MAY 2018 45
Market Performance of Listed License Holders
At the beginning of 2014, the cumulative market capitalisation of AirAsia, AirAsia X, and
MAHB was RM18.5 billion. By end-2017, the three companies recorded total market
capitalisation of RM25.6 billion (see Figure 27). AirAsia X was the only company that
showed lower market capitalisation as at end-2017 (RM1.4 billion; start-2014: RM1.9
billion). Over the same period, the FTSE Bursa Malaysia KLCI fell from 1,866.96 points
to 1,717.86 points. And so, in terms of relative performance, the listed aviation
companies had outperformed the market by 50.5% between 2014 and 2017 (see
Figure 28).
Figure 27: Monthly Market Capitalisation of AirAsia, AirAsia X, and MAHB, 2014
– 2017
Source: Thomson Reuters
Figure 28: Relative Performance of Aviation Sector Against FTSE Bursa Malaysia
KLCI, 2014 – 2017
Source: MAVCOM Analysis, Thomson Reuters
0
2
4
6
8
10
12
14
16
Jan
-14
Mar
-14
May
-14
Jul-
14
Sep
-14
No
v-1
4
Jan
-15
Mar
-15
May
-15
Jul-
15
Sep
-15
No
v-1
5
Jan
-16
Mar
-16
May
-16
Jul-
16
Sep
-16
No
v-1
6
Jan
-17
Mar
-17
May
-17
Jul-
17
Sep
-17
No
v-1
7
RM
(b
illio
n)
AirAsia AirAsia X MAHB
50
70
90
110
130
150
Jan
-14
Mar
-14
May
-14
Jul-
14
Sep
-14
No
v-1
4
Jan
-15
Mar
-15
May
-15
Jul-
15
Sep
-15
No
v-1
5
Jan
-16
Mar
-16
May
-16
Jul-
16
Sep
-16
No
v-1
6
Jan
-17
Mar
-17
May
-17
Jul-
17
Sep
-17
No
v-1
7
Rel
ativ
e P
erfo
rman
ce I
nd
ex
Aviation Sector Index FTSE Bursa Malaysia KLCI
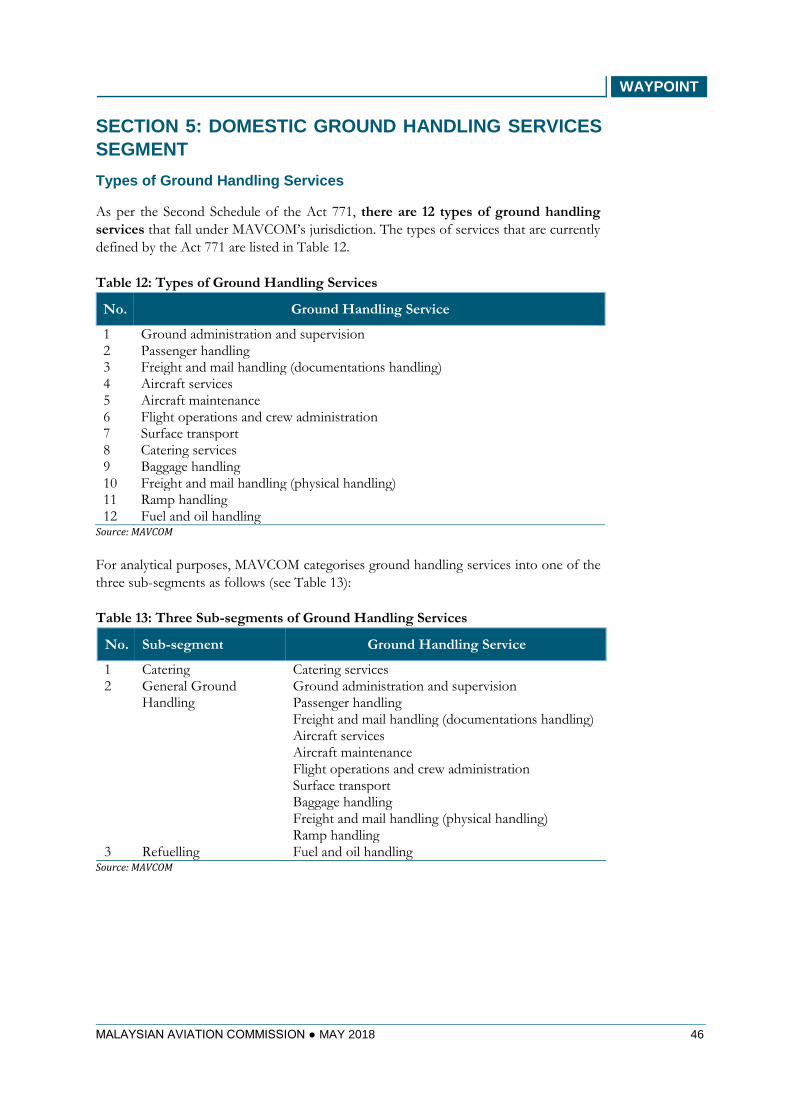
WAYPOINT
MALAYSIAN AVIATION COMMISSION ● MAY 2018 46
SECTION 5: DOMESTIC GROUND HANDLING SERVICES
SEGMENT
Types of Ground Handling Services
As per the Second Schedule of the Act 771, there are 12 types of ground handling
services that fall under MAVCOM’s jurisdiction. The types of services that are currently
defined by the Act 771 are listed in Table 12.
Table 12: Types of Ground Handling Services
No. Ground Handling Service
1 Ground administration and supervision 2 Passenger handling 3 Freight and mail handling (documentations handling) 4 Aircraft services 5 Aircraft maintenance 6 Flight operations and crew administration 7 Surface transport 8 Catering services 9 Baggage handling 10 Freight and mail handling (physical handling) 11 Ramp handling 12 Fuel and oil handling
Source: MAVCOM
For analytical purposes, MAVCOM categorises ground handling services into one of the
three sub-segments as follows (see Table 13):
Table 13: Three Sub-segments of Ground Handling Services
No. Sub-segment Ground Handling Service
1 Catering Catering services 2 General Ground
Handling Ground administration and supervision Passenger handling Freight and mail handling (documentations handling) Aircraft services Aircraft maintenance Flight operations and crew administration Surface transport Baggage handling Freight and mail handling (physical handling) Ramp handling
3 Refuelling Fuel and oil handling Source: MAVCOM

WAYPOINT
MALAYSIAN AVIATION COMMISSION ● MAY 2018 47
A ground handler may provide multiple services within the list shown in Table 12. Under
these circumstances, GHL holders are categorised according to the sub-segment that
generates the most revenue for them. Prior to MAVCOM’s establishment, there were
65 ground handlers operating in Malaysian airports. MAVCOM’s rationalisation of
the ground handling services segment had resulted in the issuance of GHLs to just
30 companies as of 31 December 2017. The breakdown of GHL holders according to
the three sub-segments are as follows (see Table 14).
Table 14: Number of Companies by Sub-segment, 2017
Sub-segment Number of Companies
Catering 3 General Ground Handling 19 Refuelling 8 Total 30
Source: MAVCOM
A ground handling business in Malaysia has traditionally been set up as part of an
airline operating company. For example, AeroDarat and GTR were the ground handling
divisions of MAB and AirAsia, respectively. There are also ground handling companies
that were set up specifically to serve the general aviation market due to the different
requirements in terms of products and service levels. For instance, general aviation
typically uses single-engine aircraft and has low movement volumes (relative to
commercial airlines).
Among the 30 GHL holders, there are also eight companies (see Table 15) whose ground
handling services do not make up the biggest portion of their revenue. As an example,
Raya Airways—that was issued a GHL—is an ASL holder that operates scheduled cargo
services. In addition, PetDagang is an example of a GHL holder that operates a petroleum
product retail business, which is not within the aviation services market.
Table 15: Number of Companies by Types of Business
No. Company Main Business Activity Other Licence/Permit Issued by MAVCOM
1 Malindo Scheduled air transport service ASL 2 Petron Petroleum products retailer - 3 PetDagang Petroleum products retailer - 4 Raya Airways Scheduled cargo service ASL 5 Sabah Air Non-scheduled air transport service ASP 6 Senai Airport Airport operator AOL 7 Shell Malaysia Petroleum products retailer - 8 Shell Timur Petroleum products retailer -
Source: MAVCOM

WAYPOINT
MALAYSIAN AVIATION COMMISSION ● MAY 2018 48
Market Structure of the Ground Handling Services Sub-segment
Ground Handling Services Sub-Segment is Highly Concentrated
Generally, the ground handling services sub-segment is highly concentrated.
However, concentration levels may depend on the types of business within this market.
Typically, the biggest two companies within each business segment hold more than 80.0%
of the segment. Among the three sub-segments, general ground handling is the most
fragmented market, followed by catering and refuelling. There are currently 15 GHL
holders that operate general ground handling businesses with an HHI of 0.3764 (see Table
16). The other two sub-segments have higher concentration ratios because there is a small
number of players operating catering and refuelling businesses. The reason for this is the
two sub-segments require on-site facilities and equipment that may be constrained by the
airports’ land space such as kitchens (for caterers) and fuel farms (for refuelers).
Table 16: Market Structure of GHL Market, 2016
Type of Business Number of Companies
CR2 HHI
Catering 3 0.9914 0.6526 General Ground Handling 15 0.8436 0.3764 Refuelling 4 0.9557 0.6752 TOTAL 22
Source: MAVCOM

WAYPOINT
MALAYSIAN AVIATION COMMISSION ● MAY 2018 49
The GHL holders neither operate at just one airport nor operate at all airports in Malaysia.
Therefore, market concentration for the ground handling services segment would be more
accurate if it is measured at each individual airport. The number of ground handling
services operators at airports in Malaysia vary from just a single player to 16 players
in an airport (see Figure 2915,16).
Figure 29: Number of GHL Holders at Airports in Malaysia, 2017
Source: MAVCOM
The different number of players at different airports reflected the level of activities
at each individual airport such as KUA and MKZ. These airports had only one GHL
holder in operation as of 2016. In 2016, aircraft movements in KUL was 356,614
movements (there are 13 GHL holders in KUL), whereas for KUA, it was 3,493
movements.
15 The numbers in the chart include the GHL holders that are also ASL, ASP, or AOL holders, and petroleum
products retailers.
16 The chart only shows airports served by the GHL holders. Ground handling services at other airports are
fulfilled via self-handling by the airlines themselves.
2 1 1 1 1
12 8
7 7
4 5
4 4 3 2 3 3 2 3 2 2 1 1 1
4
3
31
2 1
2 11 2 1 1
1 1 11
1
16
13
11
9
7 76
54 4 4 4
3 3 3 32
1 1 1
0
2
4
6
8
10
12
14
16
18
SZ
B
KU
L
BK
I
PE
N
KC
H
LG
K
MY
Y
IPH
JHB
BT
U
SB
W
SD
K
AO
R
KB
R
LB
U
TG
G
TW
U
KT
E
KU
A
MK
Z
No
. o
f P
laye
rs
Catering General Ground Handling Refuelling

WAYPOINT
MALAYSIAN AVIATION COMMISSION ● MAY 2018 50
High Number of Ground Handling Companies in Malaysia
Malaysia has many ground handling companies considering the size of its aviation services
market. For example, Australia, Spain, and the UK have fewer ground handling companies
(see Table 17) despite reporting higher aircraft movements and passenger traffic in 2017
than Malaysia. Even the US has only 45 ground handling companies despite recording 15.6
million aircraft movements in 2016 (Malaysia: 0.9 million in 2017).
Table 17: Number of Ground Handling Companies in Selected Countries, 2017
Country Passenger
Traffic (million)
Aircraft Movement (million)
Number of Ground
Handling Companies
US17 944.3 15.6 45 Malaysia 99.1 0.9 30 UK 284.6 2.4 19 Spain 249.2 2.2 11 Australia 156.4 1.5 9
Source: MAVCOM, AENA, AirlineUpdate.com, Australia BITRE, UK CAA, US FAA
Profitability of Ground Handling Service Providers
General Ground Handling was the Biggest Sub-segment in Terms of Revenue in 2016
Based on the latest available 2016 audited accounts, revenue for the general ground
handlers increased to RM645.9 million (2015: RM257.9 million). This was due to the
revenue of two GHL holders were only accounted for in 2016 as they existed as
departments of two ASL holders in the previous year (see Figure 30). The revenue for
other sub-segments such as catering and refuelling in 2016 remained largely similar to the
level reported in the previous year.
Figure 30: Revenue for Ground Handling Sub-Segment by Business, 2016
Source: MAVCOM, GHL Holders
17 Latest available data from the US FAA in 2016.
339.5
257.9
18.9
328.8
645.9
20.4
0
100
200
300
400
500
600
700
Catering General Ground Handling Refuelling
RM
mill
ion
2015 2016

WAYPOINT
MALAYSIAN AVIATION COMMISSION ● MAY 2018 51
The ground handling segment’s operating profit margins ranged between -3.7% and 16.4%
in 2016 (see Figure 31). Out of the 22 companies, only 13 GHL holders were
profitable at the operating level – two from refuelling, three from catering, and nine
from general ground handling sub-segments. Catering was the only sub-segment with all
its players reporting profits. Between 2015 and 2016, only the general ground handling
sub-segment reported smaller operating profit margin at 4.0% in 2016 (2015: 16.4%) due
to the losses reported by new general ground handling companies which commenced
operations in 2016.
Figure 31: Operating Profit Margin for Ground Handling Sub-Segments, 2015 –
2016
Source: MAVCOM, GHL Holders
4.4
16.4
-3.7
6.1
4.0 4.5
-5
0
5
10
15
20
Catering General Ground Handling Refuelling
Op
erat
ing
Pro
fit
Mar
gin
(%
)
2015 2016

WAYPOINT
MALAYSIAN AVIATION COMMISSION ● MAY 2018 52
GHL Holders’ Profitability at Par with Selected Global Ground Handling Companies
While the Malaysian GHL holders reported low operating margins, these numbers are
consistent with those reported by selected global ground handling companies (see Table
18). Indeed, the global ground handling companies reported single-digit operating profit
margins. Dnata is the only ground handling company that reported double-digit operating
profit margin of 10.0% This illustrates the highly competitive environment of the ground
handling services market.
Table 18: Revenue and Operating Profit Margin of Selected Ground Handling
Companies, 2017
Ground Handling Company
Ground Handling Sub-Segment
Revenue in Local
Currency (billion)
Operating Profit Margin
(%)
LSG Group Catering EUR3.2 1.4 GateGroup Catering18 CHF4.6 3.7 Menzies General Ground Handling19 GBP2.5 3.2 Dnata General Ground Handling AED12.2 10.0 BP Global Refuelling20 USD244.6 3.9
Source: BP Global, Dnata, GateGroup, LSG Group, Menzies
18 Aviation-related revenue for the GateGroup made up 61.3% of total revenue, which includes both in-flight
catering and in-flight retailing business.
19 Aviation-related revenue for Menzies made up 52.9% of total revenue. The company operates mainly in
North America and Europe.
20 Aviation-related revenue for the BP Group made up 89.8% of total revenue. The company supplies more
than 420,000bbl/day of jet fuels in Australia, Europe, Mexico, New Zealand, and the US.

WAYPOINT
MALAYSIAN AVIATION COMMISSION ● MAY 2018 53
APPENDIX A: DATA TABLES
All the tables in Appendix A correspond to all the figures in the report.
Table A1: Malaysia’s GDP Growth, 2010 – 2018F
Year YoY Growth (%)
2010 10.6
2011 5.3
2012 5.5
2013 4.7
2014 6.0
2015 5.0
2016 4.2
2017 5.9
2018F 5.5 – 6.0 Source: BNM, Thomson Reuters
Table A2: Seats Capacity Growth by Malaysian Carriers, 2010 – 2018F
Year Seats (million) YoY Growth (%)
2011 51.6 11.4
2012 53.0 2.7
2013 61.0 15.1
2014 67.5 10.7
2015 70.2 3.9
2016 69.3 -1.3
2017 73.3 5.8
2018F 74.9 2.2 Source: AirportIS
Table A3: Malaysian Carriers’ Fleet Size, 2010 – 2018F
Year Wide Body Aircraft Narrow Body Aircraft Others
2010 39 106 32
2011 44 132 37
2012 53 141 35
2013 64 164 44
2014 65 165 52
2015 61 160 55
2016 56 160 62
2017 49 161 42
2018F 52 171 38 Source: ASL Holders

WAYPOINT
MALAYSIAN AVIATION COMMISSION ● MAY 2018 54
Table A4: Passenger Traffic, 2010 – 2018F
Year Passenger Traffic
(million) YoY Growth (%)
2011 65.3 12.2
2012 68.6 4.9
2013 81.5 18.9
2014 85.6 5.1
2015 86.3 0.8
2016 91.7 6.2
2017 99.1 8.1
2018F 105.6 – 106.1 6.5 – 7.0 Source: MAVCOM Estimates, AOL Holders
Table A5: Quarterly Malaysia’s and Global GDP Growth, 2016 – 2017
Quarter
Malaysia’s GDP
YoY Growth
(%)
Global GDP YoY Growth (%)
1Q16 4.1 2.3
2Q16 4.0 2.3
3Q16 4.3 2.3
4Q16 4.5 2.6
1Q17 5.6 2.6
2Q17 5.8 2.9
3Q17 6.2 3.0
4Q17 5.9 3.2 Source: DOS, Thomson Reuters
Table A6: Quarterly Malaysia’s Tourist Arrivals, 2016 – 2017
Quarter Total Tourist (million) YoY Growth (%)
1Q16 6.7 2.8
2Q16 6.4 4.6
3Q16 6.7 3.3
4Q16 7.0 5.3
1Q17 6.6 -0.5
2Q17 6.3 -0.7
3Q17 6.5 -3.2
4Q17 6.5 -7.3 Source: DOS, MOTAC, Thomson Reuters

WAYPOINT
MALAYSIAN AVIATION COMMISSION ● MAY 2018 55
Table A7: Trade Value Quarterly YoY Growth Trends, 2016 – 2017
Quarter
YoY Growth (%)
Exports
Malaysia
Imports
Malaysia
Global
Exports
Global
Imports
ASEAN
Exports
ASEAN
Imports
1Q16 1.0 2.3 -8.4 -7.6 2.8 3.0
2Q16 2.0 2.4 -3.9 -2.7 2.9 2.9
3Q16 -0.6 -1.8 -2.5 -1.5 4.1 4.5
4Q16 2.2 1.6 1.5 2.0 5.3 6.0
1Q17 9.8 12.9 10.9 9.7 6.5 7.5
2Q17 9.6 10.7 7.7 6.6 7.6 8.9
3Q17 11.8 13.4 11.1 9.6 7.1 8.1
4Q17 12.4 14.4 13.2 13.7 6.7 7.9 Source: DOS, Thomson Reuters
Table A8: Oil, Jet Fuel, and Exchange Rate Trends, 2016 – 2017
Quarter Crude Oil
(USD/bbl)
Jet Fuel
(USD/bbl) RM/USD
1Q16 37.1 43.5 4.3
2Q16 36.8 46.0 3.9
3Q16 49.0 57.4 4.0
4Q16 48.8 59.1 4.1
1Q17 53.8 66.3 4.5
2Q17 50.3 62.7 4.4
3Q17 46.0 59.2 4.3
4Q17 50.6 69.3 4.2 Source: DOS, Thomson Reuters
Table A9: Percentage of Airlines’ Market Share for Domestic and International
Routes by Passengers and Revenue, 2017
Airline
Domestic International
Passengers
(%) Revenue (%)
Passengers
(%) Revenue (%)
AirAsia 56.3 48.9 27.6 13.9
AirAsia X - - 11.4 14.1
Firefly 5.6 3.1 0.8 0.3
Malindo 12.4 9.5 8.1 6.2
MAB 25.7 38.6 16.7 24.9
Others - - 35.4 40.6 Source: MAVCOM Estimates, AirportIS

WAYPOINT
MALAYSIAN AVIATION COMMISSION ● MAY 2018 56
Table A10: Domestic Routes and Concentration Levels, 2017
Route HHI Load Factor (%)
BKI-JHB 1.0000 88.7
BKI-KBR 1.0000 88.7
JHB-KCH 1.0000 88.7
JHB-MYY 1.0000 88.7
JHB-PEN 1.0000 88.8
JHB-SBW 1.0000 88.7
KBR-KCH 1.0000 88.7
KBR-PEN 1.0000 77.7
KTE-SZB 1.0000 78.0
KUA-KUL 1.0000 64.8
MKZ-PEN 1.0000 78.0
JHB-TGG 1.0000 88.6
JHB-TWU 1.0000 88.9
KCH-LGK 1.0000 87.9
IPH-JHB 0.9999 77.9
JHB-LGK 0.9621 88.7
BKI-PEN 0.9020 87.9
KCH-PEN 0.8892 87.3
LGK-PEN 0.6226 86.9
BKI-KCH 0.6218 84.8
KUL-LBU 0.6046 75.6
AOR-KUL 0.5384 73.7
KUL-SBW 0.5335 82.2
KUL-SDK 0.5313 86.3
LGK-SZB 0.5175 77.9
PEN-SZB 0.5125 77.9
JHB-SZB 0.5124 77.9
KUL-TGG 0.5119 78.9
KUL-TWU 0.5104 84.5
SZB-TGG 0.5064 77.8
AOR-SZB 0.5010 77.9
BTU-KUL 0.5008 79.4
KBR-SZB 0.5004 77.9
KUL-MYY 0.4537 79.8
JHB-KUL 0.4370 80.0
KCH-KUL 0.3855 80.1
KUL-PEN 0.3825 83.7
KBR-KUL 0.3795 79.9
BKI-KUL 0.3706 81.7
KUL-LGK 0.3697 80.9
Source: MAVCOM Analysis, AirportIS
Note: Domestic routes exclude the RAS routes in Sabah and Sarawak

WAYPOINT
MALAYSIAN AVIATION COMMISSION ● MAY 2018 57
Table A11: RASK for Domestic Routes, 2017
Route RASK (sen)
KTE-SZB 0.68 KBR-PEN 0.56 LGK-PEN 0.55 KUA-KUL 0.37 PEN-SZB 0.35 JHB-SZB 0.34 SZB-TGG 0.34 KBR-SZB 0.31 IPH-JHB 0.30 AOR-SZB 0.30 MKZ-PEN 0.29 LGK-SZB 0.25 JHB-KUL 0.24 KUL-PEN 0.23 JHB-TGG 0.23 KBR-KUL 0.21 JHB-PEN 0.21 KUL-TGG 0.21 BKI-KCH 0.20 JHB-LGK 0.19 AOR-KUL 0.19 JHB-KCH 0.18 KCH-KUL 0.18 JHB-SBW 0.17 KUL-LGK 0.17 JHB-MYY 0.17 KCH-PEN 0.16 KBR-KCH 0.15 BTU-KUL 0.15 BKI-KBR 0.15 BKI-JHB 0.15 JHB-TWU 0.14 BKI-KUL 0.14 KCH-LGK 0.13 KUL-MYY 0.13 KUL-SBW 0.13 KUL-LBU 0.13 KUL-TWU 0.13 BKI-PEN 0.12 KUL-SDK 0.12
Source: MAVCOM Analysis, AirportIS
Note: Domestic routes exclude the RAS routes in Sabah and Sarawak

WAYPOINT
MALAYSIAN AVIATION COMMISSION ● MAY 2018 58
Table A12: Number of Destinations Served by Airports, 2017
Airport Destinations Served
KUL 136
BKI 33
PEN 25
MYY 19
JHB 18
KCH 15
SZB 10
LGK 8
BTU 7
SBW 7
MUR 6
KBR 5
MKM 5
TWU 5
LWY 4
SDK 4
BBN 3
BKM 3
LBU 3
LMN 3
MZV 3
TGG 3
AOR 2
IPH 2
KUA 2
KUD 2
LBP 2
LGL 2
LKH 2
MKZ 2
ODN 2
TGC 2
KTE 1
LDU 1 Source: MAVCOM Analysis, AirportIS
Note: The table excludes unutilised STOLports

WAYPOINT
MALAYSIAN AVIATION COMMISSION ● MAY 2018 59
Table A13: Traffic Breakdown by Regions of Travel, 2017
Airport Domestic ASEAN International
KUL 26.9 35.1 37.9 BKI 67.3 5.8 26.9 PEN 56.7 36.1 7.1 JHB 86.0 9.2 4.8 LGK 88.9 7.5 3.6 KCH 92.2 7.6 0.1 SZB 90.6 9.3 0.1 LBU 99.7 - 0.3 MKZ 42.0 57.7 0.3 BBN 100.0 - - LWY 100.0 - - TGG 100.0 - - KUA 83.4 16.6 - MUR 100.0 - - KUD 100.0 - - KBR 100.0 - - BKM 100.0 - - IPH 14.3 85.7 - LBP 100.0 - - KTE 100.0 - - MKM 100.0 - - MZV 100.0 - - MYY 96.4 3.6 - ODN 100.0 - - SBW 100.0 - - BTU 99.9 0.1 - LDU 100.0 - - SDK 100.0 - - AOR 100.0 - - TGC 100.0 - - LGL 100.0 - - TWU 98.7 1.3 - LKH 100.0 - - LMN 100.0 - -
Source: MAVCOM Analysis, AirportIS
Note: The table excludes unutilised STOLports

WAYPOINT
MALAYSIAN AVIATION COMMISSION ● MAY 2018 60
Table A14: Traffic Breakdown by O&D and Hub Traffic, 2017
Airport O&D Traffic (%) Hub Traffic (%)
KUL 66.9 33.1
BKI 92.7 7.3
PEN 95.9 4.1
JHB 95.0 5.0
LGK 98.3 1.7
KCH 94.0 6.0
SZB 95.2 4.8
LBU 99.0 1.0
MKZ 100.0 -
BBN 99.1 0.9
LWY 99.5 0.5
TGG 99.9 0.1
KUA 100.0 -
MUR 88.5 11.5
KUD 100.0 -
KBR 99.7 0.3
BKM 100.0 -
IPH 100.0 -
LBP 100.0 -
KTE 100.0 -
MKM 98.5 1.5
MZV 98.4 1.6
MYY 95.2 4.8
ODN 100.0 -
SBW 97.9 2.1
BTU 98.0 2.0
LDU 100.0 -
SDK 99.4 0.6
AOR 100.0 -
TGC 92.7 7.3
LGL 100.0 -
TWU 98.6 1.4
LKH 100.0 -
LMN 99.5 0.5
Source: MAVCOM Analysis, AirportIS
Note: The chart excludes unutilised STOLports

WAYPOINT
MALAYSIAN AVIATION COMMISSION ● MAY 2018 61
Table A15: Breakdown of ATRs Awarded by Region, 2016 – 2017
Region
AirAsia AirAsia
X Firefly MAB Malindo
Raya
Airways Total
2016
2017
2016
2017
2016
2017
2016
2017
2016
2017
2016
2017
2016
2017
Domestic 3 31 - - - 2 2 3 25 14 - - 30 50
Africa - - 1 - - - - - - - - - 1 -
Americas - - 1 - - - - - - - - - 1 -
ASEAN 4 22 - 1 - - - 4 12 26 - - 16 53
India - 10 - 1 - - 1 6 5 3 - 2 6 22
China - 8 7 3 - - 8 11 7 28 - - 22 50
Rest of Asia
1 6 3 7 - - 3 6 7 4 1 - 15 23
Australasia - - 2 1 - - - 2 1 4 - - 3 7
Europe - - - 1 - - - - - - - - - 1
Middle East
- - 3 1 - - - - 2 2 - - 5 3
Total 8 77 17 15 - 2 14 32 59 81 1 2 99 209
Source: MAVCOM
Table A16: Annual Passenger Traffic Trend, 2011 – 2017
Year Passenger Traffic
(million) YoY Growth (%)
2011 65.3 12.2
2012 68.6 4.9
2013 81.5 18.9
2014 85.6 5.1
2015 86.3 0.8
2016 91.7 6.2
2017 99.1 8.1 Source: MAVCOM Analysis, AOL Holders
Table A17: Quarterly Passenger Traffic Trend, 2016 – 2017
Quarter Passenger Traffic (million) YoY Growth (%)
1Q16 21.8 4.1
2Q16 21.6 0.1
3Q16 23.6 8.6
4Q16 24.3 10.2
1Q17 24.0 9.9
2Q17 24.5 13.0
3Q17 25.2 7.1
4Q17 25.5 5.2 Source: MAVCOM Analysis, AOL Holders
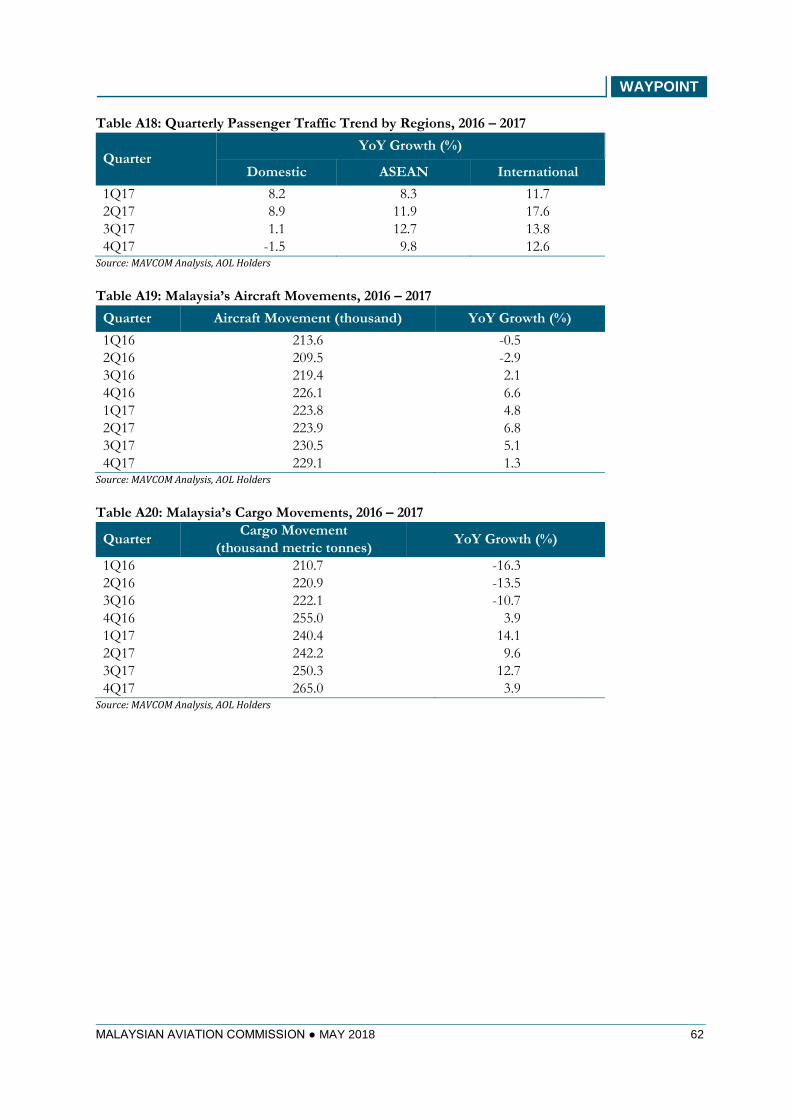
WAYPOINT
MALAYSIAN AVIATION COMMISSION ● MAY 2018 62
Table A18: Quarterly Passenger Traffic Trend by Regions, 2016 – 2017
Quarter YoY Growth (%)
Domestic ASEAN International
1Q17 8.2 8.3 11.7
2Q17 8.9 11.9 17.6
3Q17 1.1 12.7 13.8
4Q17 -1.5 9.8 12.6 Source: MAVCOM Analysis, AOL Holders
Table A19: Malaysia’s Aircraft Movements, 2016 – 2017
Quarter Aircraft Movement (thousand) YoY Growth (%)
1Q16 213.6 -0.5
2Q16 209.5 -2.9
3Q16 219.4 2.1
4Q16 226.1 6.6
1Q17 223.8 4.8
2Q17 223.9 6.8
3Q17 230.5 5.1
4Q17 229.1 1.3 Source: MAVCOM Analysis, AOL Holders
Table A20: Malaysia’s Cargo Movements, 2016 – 2017
Quarter Cargo Movement
(thousand metric tonnes) YoY Growth (%)
1Q16 210.7 -16.3
2Q16 220.9 -13.5
3Q16 222.1 -10.7
4Q16 255.0 3.9
1Q17 240.4 14.1
2Q17 242.2 9.6
3Q17 250.3 12.7
4Q17 265.0 3.9 Source: MAVCOM Analysis, AOL Holders

WAYPOINT
MALAYSIAN AVIATION COMMISSION ● MAY 2018 63
Table A21: Malaysian Carriers’ Load Factors Trend, 2010 – 2017
Quarter Load Factor (%)
1Q10 73.7
2Q10 72.0
3Q10 74.4
4Q10 76.8
1Q11 71.9
2Q11 74.4
3Q11 74.0
4Q11 73.7
1Q12 73.8
2Q12 74.1
3Q12 73.1
4Q12 75.1
1Q13 75.3
2Q13 76.5
3Q13 79.6
4Q13 77.3
1Q14 76.5
2Q14 75.0
3Q14 73.2
4Q14 73.9
1Q15 72.5
2Q15 71.9
3Q15 73.4
4Q15 75.0
1Q16 76.9
2Q16 75.9
3Q16 81.2
4Q16 80.9
1Q17 82.4
2Q17 81.1
3Q17 80.2
4Q17 87.4 Source: MAVCOM Analysis, AirportIS

WAYPOINT
MALAYSIAN AVIATION COMMISSION ● MAY 2018 64
Table A22: Malaysian Carriers’ Average Fares Trend, 2010 – 2017
Quarter Domestic (RM) International (RM)
1Q10 320 666
2Q10 325 676
3Q10 315 648
4Q10 329 665
1Q11 245 570
2Q11 255 575
3Q11 255 640
4Q11 248 607
1Q12 241 549
2Q12 259 547
3Q12 232 501
4Q12 245 511
1Q13 229 505
2Q13 252 490
3Q13 245 527
4Q13 246 585
1Q14 222 587
2Q14 217 526
3Q14 229 527
4Q14 237 559
1Q15 224 567
2Q15 226 533
3Q15 247 601
4Q15 234 570
1Q16 205 519
2Q16 223 508
3Q16 219 524
4Q16 239 531
1Q17 207 521
2Q17 207 499
3Q17 236 506
4Q17 234 467
Source: MAVCOM Analysis, AirportIS

WAYPOINT
MALAYSIAN AVIATION COMMISSION ● MAY 2018 65
Table A23: Malaysian Carriers’ RASK and CASK Trends, 2016 – 2017
Quarter RASK (sen) CASK (sen) RASK-CASK Spread
(sen)
1Q16 15.3 16.3 -1.0 2Q16 14.2 16.1 -1.9 3Q16 14.9 15.9 -1.1 4Q16 15.4 16.0 -0.6 1Q17 16.3 17.1 -0.9 2Q17 15.9 16.5 -0.6 3Q17 16.0 16.7 -0.7 4Q17 16.8 17.5 -0.7
Source: MAVCOM Analysis, ASL Holders
Table A24: Revenue and Operating Profit Margin of Malaysian Carriers, 2016 –
2017
Year Revenue (RM billion) Operating Profit Margin
(%)
2010 18.2 6.9
2011 20.3 -6.0
2012 20.3 3.4
2013 22.4 1.4
2014 23.1 -3.9
2015 23.8 -16.1
2016 21.6 6.6
2017 25.9 2.1 Source: MAVCOM Analysis, ASL Holders
Table A25: Revenue and Operating Profit Margin of ASP Holders, 2016 – 2017
Year Revenue (RM billion) Operating Profit Margin
(%)
2015 1.7 13.5
2016 2.0 10.4
2017 1.8 16.7 Source: MAVCOM Analysis, ASP Holders

WAYPOINT
MALAYSIAN AVIATION COMMISSION ● MAY 2018 66
Table A26: Revenue and Operating Profit Margin of AOL Holders, 2016 – 2017
Year Revenue (RM billion) Operating Profit Margin
(%)
2010 2.6 22.3
2011 2.9 21.3
2012 3.7 18.7
2013 4.3 14.6
2014 3.6 11.5
2015 4.3 18.2
2016 4.5 19.7
2017 5.0 20.9 Source: MAVCOM Analysis, AOL Holders
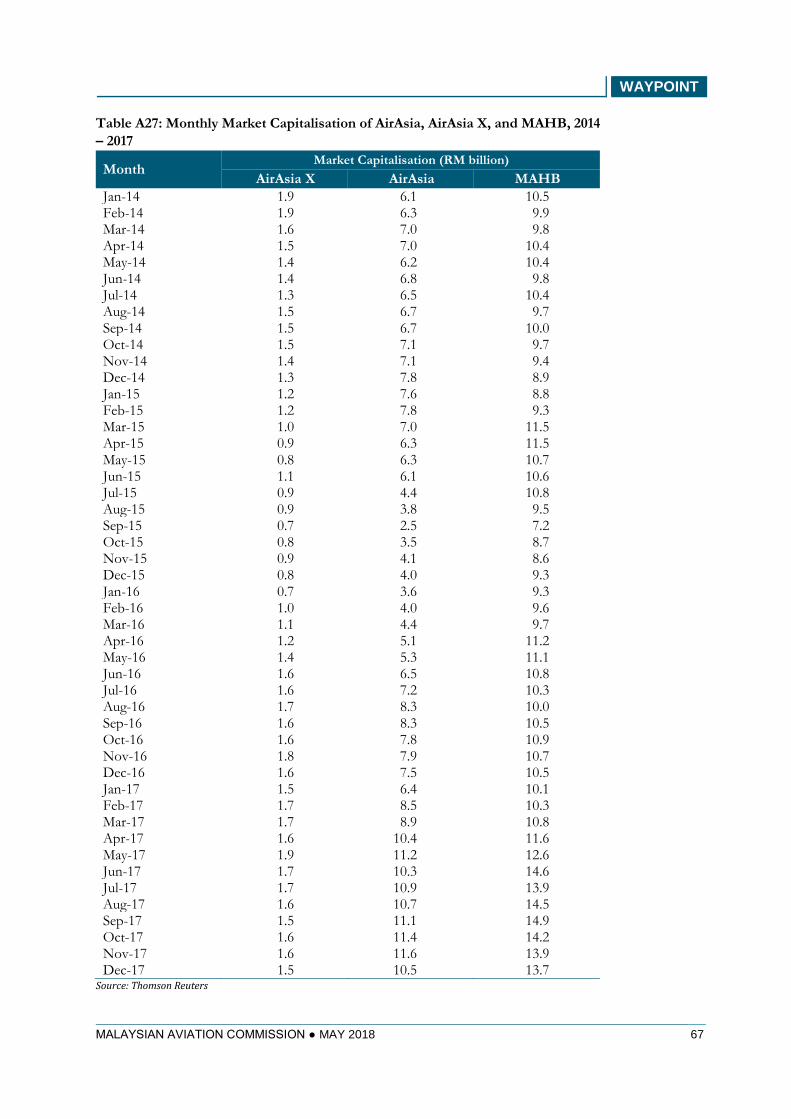
WAYPOINT
MALAYSIAN AVIATION COMMISSION ● MAY 2018 67
Table A27: Monthly Market Capitalisation of AirAsia, AirAsia X, and MAHB, 2014
– 2017
Month Market Capitalisation (RM billion)
AirAsia X AirAsia MAHB
Jan-14 1.9 6.1 10.5 Feb-14 1.9 6.3 9.9 Mar-14 1.6 7.0 9.8 Apr-14 1.5 7.0 10.4 May-14 1.4 6.2 10.4 Jun-14 1.4 6.8 9.8 Jul-14 1.3 6.5 10.4 Aug-14 1.5 6.7 9.7 Sep-14 1.5 6.7 10.0 Oct-14 1.5 7.1 9.7 Nov-14 1.4 7.1 9.4 Dec-14 1.3 7.8 8.9 Jan-15 1.2 7.6 8.8 Feb-15 1.2 7.8 9.3 Mar-15 1.0 7.0 11.5 Apr-15 0.9 6.3 11.5 May-15 0.8 6.3 10.7 Jun-15 1.1 6.1 10.6 Jul-15 0.9 4.4 10.8 Aug-15 0.9 3.8 9.5 Sep-15 0.7 2.5 7.2 Oct-15 0.8 3.5 8.7 Nov-15 0.9 4.1 8.6 Dec-15 0.8 4.0 9.3 Jan-16 0.7 3.6 9.3 Feb-16 1.0 4.0 9.6 Mar-16 1.1 4.4 9.7 Apr-16 1.2 5.1 11.2 May-16 1.4 5.3 11.1 Jun-16 1.6 6.5 10.8 Jul-16 1.6 7.2 10.3 Aug-16 1.7 8.3 10.0 Sep-16 1.6 8.3 10.5 Oct-16 1.6 7.8 10.9 Nov-16 1.8 7.9 10.7 Dec-16 1.6 7.5 10.5 Jan-17 1.5 6.4 10.1 Feb-17 1.7 8.5 10.3 Mar-17 1.7 8.9 10.8 Apr-17 1.6 10.4 11.6 May-17 1.9 11.2 12.6 Jun-17 1.7 10.3 14.6 Jul-17 1.7 10.9 13.9 Aug-17 1.6 10.7 14.5 Sep-17 1.5 11.1 14.9 Oct-17 1.6 11.4 14.2 Nov-17 1.6 11.6 13.9 Dec-17 1.5 10.5 13.7
Source: Thomson Reuters

WAYPOINT
MALAYSIAN AVIATION COMMISSION ● MAY 2018 68
Table A28: Relative Performance of Aviation Sector Against FTSE Bursa Malaysia,
2014 – 2017
Month Aviation Sector Index FTSE Bursa Malaysia
KLCI Jan-14 100 100 Feb-14 97 97 Mar-14 99 98 Apr-14 101 99 May-14 97 100 Jun-14 98 100 Jul-14 98 101 Aug-14 97 100 Sep-14 98 100 Oct-14 99 99 Nov-14 97 99 Dec-14 97 95 Jan-15 95 94 Feb-15 99 95 Mar-15 105 97 Apr-15 101 98 May-15 96 97 Jun-15 96 93 Jul-15 87 93 Aug-15 76 93 Sep-15 56 86 Oct-15 70 88 Nov-15 74 89 Dec-15 76 90 Jan-16 74 91 Feb-16 79 89 Mar-16 82 89 Apr-16 94 92 May-16 96 90 Jun-16 101 87 Jul-16 103 88 Aug-16 108 89 Sep-16 110 89 Oct-16 109 89 Nov-16 110 90 Dec-16 106 87 Jan-17 97 88 Feb-17 111 90 Mar-17 115 91 Apr-17 128 93 May-17 139 95 Jun-17 144 94 Jul-17 143 95 Aug-17 145 95 Sep-17 149 95 Oct-17 147 94 Nov-17 146 93 Dec-17 139 92
Source: MAVCOM Analysis, Thomson Reuters

WAYPOINT
MALAYSIAN AVIATION COMMISSION ● MAY 2018 69
Table A29: Number1 of GHL Holders at Airports2 in Malaysia, 2017
Airport Catering General Ground
Handling Refuelling Total
SZB - 12 4 16
KUL 2 8 3 13
BKI 1 7 3 11
PEN 1 7 1 9
KCH 1 4 2 7
LGK 1 5 1 7
MYY - 4 2 6
IPH - 4 1 5
JHB - 3 1 4
BTU - 2 2 4
SBW - 3 1 4
SDK - 3 1 4
AOR - 2 1 3
KBR - 3 - 3
LBU - 2 1 3
TGG - 2 1 3
TWU - 1 1 2
KTE - - 1 1
KUA - 1 - 1
MKZ - 1 - 1 Source: MAVCOM
Notes:
1) The numbers in the table include the GHL holders that are also ASL, ASP, or AOL holders, and petroleum
products retailers
2) The table only shows airports that the GHL holders are serving. Ground handling services at other airports are
fulfilled via self-handling by the airlines themselves

WAYPOINT
MALAYSIAN AVIATION COMMISSION ● MAY 2018 70
Table A30: Revenue for Ground Handling Sub-Segment by Business, 2016
Business Revenue (RM million)
2015 2016
Catering 339.5 328.8
General Ground Handling 257.9 645.9
Refuelling 18.9 20.4 Source: MAVCOM, GHL Holders
Table A31: Operating Profit Margin for Ground Handling Sub-Segment by
Business, 2015-2016
Business Operating Profit Margin (%)
2015 2016
Catering 4.4 6.1
General Ground Handling 16.4 4.0
Refuelling -3.7 4.5 Source: MAVCOM, GHL Holders

WAYPOINT
MALAYSIAN AVIATION COMMISSION ● MAY 2018 71
APPENDIX B: LIST OF LICENCE AND PERMIT HOLDERS
Table B1: AOL Holders
No. Company Name
1 Malaysia Airports Holdings Bhd.
2 Senai Airport Terminal Services Sdn. Bhd.
3 Sanzbury Stead Sdn. Bhd.
4 Tanjung Manis Development Sdn. Bhd. Source: MAVCOM
Table B2: ASL Holders
No. Company Name
1 AirAsia Berhad
2 AirAsia X Berhad
3 Fly Firefly Sdn. Bhd.
4 Malaysia Airlines Berhad
5 Malindo Airways Sdn. Bhd.
6 MASwings Sdn. Bhd.
7 Raya Airways Sdn. Bhd. Source: MAVCOM

WAYPOINT
MALAYSIAN AVIATION COMMISSION ● MAY 2018 72
Table B3: ASP Holders
No. Company Name
1 Aerial Power Lines Sdn. Bhd.
2 Aeromanager Sdn. Bhd.
3 Afjet Sdn. Bhd.
4 Airod Sdn. Bhd.
5 Asia Jet Partner Malaysia Sdn. Bhd.*
6 Asia Tenggara Aviation Services Sdn. Bhd.
7 Awan Inspirasi Sdn. Bhd.
8 Berjaya Air Sdn. Bhd. *
9 Cempaka Helicopter Corporation Sdn. Bhd.
10 Eastflite Aviation Services Sdn. Bhd.*
11 Executive Jets Asia Sdn. Bhd.*
12 flyGlobal Sdn. Bhd.
13 Helistar Resources Sdn. Bhd.
14 Hevilift (M) Sdn. Bhd.
15 Hornbill Skyways Sdn. Bhd.
16 Jet Premier One (M) Sdn. Bhd.*
17 Layang Layang Aerospace Sdn. Bhd.
18 MHS Aviation Berhad
19 My Jet Xpress Airlines Sdn. Bhd.
20 Myballoon Adventure Sdn. Bhd.
21 PLUS Helicopter Services Sdn. Bhd.
22 Pos Asia Cargo Express Sdn. Bhd.
23 Prima Air Sdn. Bhd.
24 Sabah Air Aviation Sdn. Bhd.
25 Sazma Aviation Sdn. Bhd.
26 Systematic Aviation Services Sdn. Bhd.
27 Weststar Aviation Services Sdn. Bhd. Source: MAVCOM
Notes: * Conditional ASP holders. MAVCOM may grant a conditional approval to enable the applicant to initiate an
application for an AOC with CAAM. If the applicant fails to obtain the AOC within the period of one year or such
other period as determined by MAVCOM, the conditional approval shall lapse.

WAYPOINT
MALAYSIAN AVIATION COMMISSION ● MAY 2018 73
Table B4: GHL Holders
No Company Name
1 AeroDarat Services Sdn. Bhd.
2 Aerohandlers Sdn. Bhd.*
3 BCS Contract & Supply Services Sdn. Bhd.
4 Brahim's SATS Food Services Sdn. Bhd.
5 Bukit Wang Resources (M) Sdn. Bhd.
6 Cloudera Aviation Services Sdn. Bhd.
7 Conor Engineering & Services Sdn. Bhd.
8 D'viation Solutions Sdn. Bhd.*
9 Elite Jets Sdn. Bhd.
10 Group Team Red Sdn. Bhd.
11 Hasrat Asia (M) Sdn. Bhd.
12 Helitech Aviation Services Sdn. Bhd.*
13 Jets Fuels Sdn. Bhd.
14 KLM Line Maintenance Sdn. Bhd.*
15 Malindo Airways Sdn. Bhd.*
16 Mas Awana Services Sdn. Bhd.*
17 MNM Aviation Services Sdn. Bhd.
18 Nusantara Aviation Services Sdn. Bhd.
19 Petron Malaysia Refining & Marketing Bhd.*
20 PETRONAS Dagangan Berhad*
21 POS Aviation Sdn. Bhd.
22 Raya Airways Sdn. Bhd.
23 Sabah Air Aviation Sdn. Bhd.
24 Safeair Technical Sdn. Bhd.
25 Senai Airport Terminal Services Sdn. Bhd.*
26 Shell Malaysia Trading Sdn. Bhd.*
27 Shell Timur Sdn. Bhd.*
28 Skypark FBO Malaysia Sdn. Bhd.
29 Smooth Route Sdn. Bhd.
30 Total Megalink Sdn. Bhd.* Source: MAVCOM
Notes: * Conditional GHL holders. MAVCOM may grant a conditional approval to enable the applicant to initiate an
application for a Technical Approval with CAAM. If the applicant fails to obtain the Technical Approval within the
period of one year or such other period as determined by MAVCOM, the conditional approval shall lapse.
WAYPOINT
MALAYSIAN AVIATION COMMISSION ● MAY 2018 74
©2018 ALL RIGHTS RESERVED. No part of this report may be
used, copied, photocopied, or duplicated in any form or by any
means or redistributed without the prior consent of MAVCOM.
No opinions and articles published in this report are exhaustive on
the subject or topic they cover and are not intended to be a
substitute for legal advice or opinion on the topic. Under no
circumstances shall MAVCOM be liable to any person for actions
and decisions taken from reliance on any information contained in
this report.
If you have any queries or comments, please contact:
Level 19, Menara 1 Sentrum
201, Jalan Tun Sambanthan
50470 Kuala Lumpur
Malaysia
Tel: +603 2772 0600
Fax: +603 2772 0601
Email: [email protected]