wawanesa insurance annual report · wawanesa is a canadian mutual company owned by its...
TRANSCRIPT

WaWanesa Insurance2011 annual report

The WaWanesa Life insurance company
400–200 Main street Winnipeg, Manitoba r3c 1a8Book value of shares $93,165,000
WaWanesa GeneraL insurance company
9050 Friars road san Diego, california 92108Book value of shares $260,067,000
WaWanesa hoLdinGs u.s. inc.
9050 Friars roadsan Diego, california 92108Book value of shares $13,627,000
Wawanesa is a Canadian mutual company owned by its policyholders. With assets of
over $7 billion and nearly 2 million policies inforce, Wawanesa is one of the 10 largest
property and casualty insurers in Canada.
Wawanesa has a rich history dating back to September 25, 1896, when it was founded in
the Village of Wawanesa, Manitoba. Today, our head office continues to be located in the
Village of Wawanesa with the executive offices located in Winnipeg, Manitoba.
Wawanesa has 100% ownership of three subsidiary companies.

1
MIssIon anD Values
MIssIon
“Earning your trust since 1896”… As a policyholder-owned mutual insurance company,
we will continue to earn trust by providing quality products and services at the lowest
price which supports long-term growth and financial stability.
Values
• We treat others in a respectful and truthful manner.
• We conduct business with integrity, honesty, consistency and fairness.
• We act ethically and lawfully.
• We take pride in making service a priority.
• We encourage collaboration, innovation and excellence.
• We support the communities in which we work and live.
2
The year just ended proved to be a challenging one for our Company.
While we made significant progress on many chosen
initiatives and grew our business at a reasonable pace,
we are reporting disappointing underwriting results.
Renewal of our major insurance systems has been a
high priority in recent years and I am pleased to report
that we made major strides forward in 2011.
During the year, we successfully implemented a
new claims system (Guidewire’s ClaimCentre) across
the entire organization. Final conversions and
decommissioning of the old system will be complete
by mid-2012. The project team did a tremendous job
on this two-year project that was completed on time
and on budget. The team consisted of a combination
of Wawanesa staff from information services, executive
office claims and
each regional
claims department
augmented by
external consultants.
This is the first step
in our renewal of all
insurance systems
and the success has
certainly provided confidence in our ability to complete
the renewal of all systems in the coming years.
Also in 2011, we completed the introduction of our
broker transaction portal which provides brokers
with the ability to send insurance transactions to
us electronically. This is our first transaction portal
offering and will provide an improved service offering
to our brokers. We are actively transferring brokers to
this environment.
Work continues on a number of other initiatives.
Progress was made on the development of an enterprise
data warehouse. Late in the year, a project was initiated
to replace our financial reporting systems with a new
state-of-the-art system. This work will be conducted
during 2012 and 2013. Furthering our renewal of core
insurance systems, during 2012 we will initiate the
project to replace our policy administration system.
Development of a formal Enterprise Risk Management
program began in earnest during the year. We recognize
the value of an increased focus on managing individual
risks but also the need to consider combinations of risks
through modeling and stress testing.
We implemented a completely new rating system in
Quebec late in the year. It was clear to us that a more
sophisticated rating approach was required to reinforce
our competitive position in the market. This was a
major undertaking that has significantly changed our
business approach. We will be monitoring the impact
quite carefully throughout 2012.
Since 1995, we have
operated in the
United States both as
a branch of Wawanesa
Mutual and through
our wholly-owned
subsidiary,
Wawanesa General.
We completed
a corporate reorganization during 2011 and now
operate solely as Wawanesa General. This simplifies
our corporate structure and will reduce future
administrative costs.
Our plans for 2012 include continuing with enterprise
system renewal and taking the actions required to
improve our underwriting results whether by rate
increases, product changes or other means. As well,
we are considering two emerging issues. Regulatory
During the year, we successfully implemented a new claims system (Guidewire’s ClaimCentre) across the entire organization.
presIDent’s report

3
capital requirements are increasing. While we have
always reported very strong capital ratios and would
continue to do so under these new requirements,
the new requirements related to certain investment
types could reduce the reported ratio. Accordingly,
we will be reviewing our investment policies during
2012. We are also studying our earthquake exposure.
Prudent management of earthquake risk requires that
we maintain an extensive reinsurance program with
highly rated reinsurers. But earthquake exposures have
grown dramatically in recent years and reinsurance
rates have increased due to recent global earthquake
activity. This has resulted in increased reinsurance costs
and as a result, higher premiums for our policyholders
purchasing earthquake coverage. We intend to continue
carefully monitoring our earthquake exposures and
coverages as part of our management of this risk.
consolIDateD FInancIal results
For the first time, our financial statements have been
prepared in accordance with International Financial
Reporting Standards (IFRS). The preparation for the
transition to IFRS was a major undertaking conducted
over a number of years
by our accounting
and finance staff. The
preparation was well
done and provided for a
very successful transition
to IFRS. As a result of
the transition to IFRS,
Wawanesa Life has
been consolidated into
the Wawanesa Mutual
financial statements for the first time. This required
a change in the presentation of the Statements of
Operations and the new format does not provide
traditional property and casualty disclosures.
Accordingly, there is expanded note disclosure which
provides appropriate presentation of the results of both
our property and casualty and life operations. Separate
financial statements will continue to be prepared for
Wawanesa Life.
On a consolidated basis, premium revenues increased
by 5.6% while investment income increased 6.2%.
Profit for the year was $108 million, down from
$129 million in 2010. Profits declined in both property
and casualty and life operations with severe weather
negatively impacting property and casualty results and
the low interest rate environment requiring reserve
increases in life operations.
Total assets increased to $7 billion and total capital
increased to $2.3 billion. Our capital ratio remains
very strong at 302%, much in excess of regulatory
requirements while our A.M. Best rating was stable at
A+ (Superior).
property anD casualty operatIons
Financial Results
Overall business growth was good but somewhat
reduced from 2010’s growth rate. While inforce policies
increased by 2% and written premiums increased
by 5.4%, regional results varied considerably. Many
regions grew quite well, some reported moderate
growth and a couple of regions declined slightly.
Our underwriting results
were disappointing and
the story is severe weather,
mainly in Western Canada.
We are reporting an
underwriting loss in our
property and casualty
operations of $90 million
compared to a $50 million
loss in 2010.
Property results, both personal and commercial,
were very poor in 2011. Our underwriting loss
was $120 million with a combined ratio of 115%.
While a number of areas reported poor results, the
increased severe weather activity in Western Canada
was the primary driver of the results. Total weather
catastrophe costs were $259 million in 2011, up almost
$100 million from 2010 and more than double the
2009 levels.
3
For the first time, our financial statements have been prepared in accordance with International Financial Reporting Standards (IFRS).
4
The severe weather was most extreme in Alberta where
catastrophe costs increased by $100 million to total
$200 million in 2011. The catastrophic events started
early with the Slave Lake wildfire in May, continued
through the summer with many wind and hail
storms and ended with a major Calgary windstorm
in November. It is very difficult to address these fast
ramp-ups in claims costs but we are responding in an
appropriate but aggressive manner. Our reinsurance
arrangements certainly helped cushion the financial
blow of this increased catastrophe activity. However,
catastrophe reinsurance is designed to assist companies
with unexpected extreme events and if the level of
catastrophe activity experienced in the last couple of
years becomes the norm in the future, reinsurance costs
and availability may be impacted.
Our automobile results improved significantly in
2011. The main contributor to the improvement was
the Ontario automobile line of business, but while
improving significantly, we are still reporting an
underwriting loss in the line. It appears the Ontario
market has stabilized to a significant extent as result of
the September, 2010 reforms but there are still elements
of the reforms that have not been completed. It is
hoped that the government and regulator maintain
their resolve to take the necessary actions to further
stabilize the market. All other regions reported
good results except for disappointing results in the
United States.
Further declines in the interest rate environment
required an increase in policy reserves which reduced
underwriting income in the amount of $13 million.
Net investment income increased from $232 million
to $245 million. Overall, profit before taxes in
our property and casualty operations declined to
$155 million from $183 million.
Regional Results
The Maritime Region operated very effectively in
2011 with continued growth and overall underwriting
profitability. Policy counts increased by over 3% and
premiums increased by 8%. Auto results were good
but offset somewhat by losses in the property line.
While the auto insurance environment in the region
has been quite stable for many years, governments in
both New Brunswick and Nova Scotia are introducing
modifications to the auto insurance systems. It is
hoped that these changes do not threaten the premium
stability that has existed for the last number of years.
Our business in the Quebec Region has been declining
in recent years. We are reporting modest business
reductions in 2011. In response, we introduced a
completely updated pricing and rating approach late
in 2011 that is designed to re-establish our competitive
position and reverse recent business declines. The
impact of this major change will be monitored carefully
in 2012.
The Ontario Region grew significantly in 2011. Policy
counts increased by 5% while premium income
increased by 14%. A significant portion of the growth
occurred in the property line. After a number of
difficult years in the automobile line, underwriting
results improved significantly in 2011, although an
underwriting loss was still reported for 2011. There
is still uncertainty in the automobile environment
as the 2010 reforms are not fully in effect thus there
is still doubt that the desired results will be realized.
Accordingly, we continue to carefully monitor
the environment.
The Winnipeg Region had another stable operating year
in 2011. Policy growth of nearly 2%, premium growth
of 11% and a break-even underwriting position are
being reported. Much of the growth occurred in NW
Ontario where an underwriting loss was reported, while
Manitoba results were profitable.
The Prairie Region grew nicely in 2011 with a 2%
increase in policies and a 10% increase in premiums.
Severe weather events impacted the region again in
2011 although not to the same extent as in 2010. While
this resulted in a reduced underwriting loss, the loss is
still substantial in spite of significant rate increase in
recent years. We will continue to address this shortfall.
Southern Alberta and Northern Alberta Regions are
reporting very similar results for 2011. Policy counts
increased by 2–3% while written premiums increased

5
5–6%. Both reported overall underwriting losses with
very good auto profitability but disastrous underwriting
results in the property line. The underwriting loss for
property in all of Alberta was $86 million. The poor
property results were the result of the severe weather
mentioned above. Seventeen events occurred in Alberta
with a gross loss cost of $200 million. Of this total,
$183 million was property losses and $17 million
was auto losses. As mentioned, it is very difficult to
address rapid claims increases. We are responding in
an appropriate but aggressive manner via a variety of
product and pricing changes. Heavy catastrophic claims
activity also creates
a very challenging
environment for our
claims department staff.
The British Columbia
Region reported another
year of substantial
growth. Policies
increased by over 5%
with written premium
growth of 12%. This growth came in spite of substantial
premium rate increases for earthquake coverage
made necessary by the increasing costs of securing
reinsurance protection for earthquake exposures. While
a modest underwriting loss was reported, we believe
actions taken during 2011 and early 2012 will improve
the region’s 2012 results.
Our United States operation was challenged in 2011
by poor economic conditions in California and a
very competitive environment. A small decline in
policies was experienced along with a small increase
in premiums. Underwriting results were disappointing
with a significant loss being reported. Our focus for
2012 is on improving underwriting results while
maintaining business levels.
lIFe operatIons
Financial Results
Wawanesa Life achieved good results in new business
activity and strong policy persistency which are both
contributing to record premium revenues. Premium
income net of reinsurance grew to $106 million in
2011, surpassing $100 million for the first time. All
lines of business contributed to this achievement.
However, like others in the life insurance industry, we
continued to encounter challenges with low interest
rates, stock market volatility and actuarial standards
updates. The stock market decline and record low
interest rates required reserve increases. Significant
mortality assumption changes related to the valuation
of individual insurance contract liabilities also served
to increase reserves. These changes generally had
a negative impact on permanent products and a
favourable impact on
term products which
created a significant
loss from participating
business, offsetting
positive results reported
for non-participating
business. Wawanesa Life
is reporting a net loss of
$1.7 million for the year.
Operational Comments
New business sales of individual insurance totaled
$5.3 million, 11% ahead of 2010 and consistent with
the results achieved over the last few years. Production
was strong across Wawanesa Life with eight of nine
regions surpassing 2010 numbers. Policy persistency
was very good with inforce net premium growing by
4% to $40.7 million.
Management action was taken this year to address
the prolonged period of low interest rates being
experienced. These actions included changes to
investment mix and increases in asset duration.
Premium increases were required to lessen the new
business strain of current permanent business.
During 2011, plans were put in motion to replace the
Individual Operation’s various legacy systems. Much
of the year was spent detailing the current system
strengths and weaknesses, scoping areas of desirable
business process improvement and evaluating possible
vendor solutions. Vendor selection was completed
by year end and work is now beginning on the
Wawanesa Life achieved good results in new business activity and strong policy persistency which are both contributing to record premium revenues.

6
implementation. This is a significant investment
for Wawanesa Life. The objective is to modernize
the technology environment and gain efficiencies
in the back office environment which will enhance
policyholder and broker servicing. When complete,
Wawanesa Life will be in a good position to continue
its history of steady growth.
New business sales of group insurance reached
$4.7 million. While this is off the record numbers of
2010, it is well ahead of historical production levels.
Net premium revenue was $34.3 million, an increase of
29% from 2010.
Action was taken early in the year to mitigate the
unfavourable claim trends that were emerging from the
newly launched 3-9 life group plan. Premium and plan
design changes were made to the product, returning it
to a solid financial footing.
New business activity
continues to meet targeted
expectations.
While we have experienced
recent success in growing
the group insurance base,
we want to ensure that our
approach will continue to
produce steady, profitable
growth in the long term. Accordingly, an operational
review of our group product pricing and underwriting
approach was undertaken in 2011. As a result of
this review, we will be updating some of our current
underwriting and pricing practices during 2012.
Wawanesa Life continued to demonstrate its financial
strength despite the economic and financial market
challenges in 2011. The MCCSR (Minimum Continuing
Capital and Surplus Requirements) ratio is well in
excess of 200%, significantly above the requirement
set by the Office of the Superintendent of Financial
Institutions. In addition, Wawanesa Life continues to
be rated as A (Excellent) by A.M. Best.
acknoWleDgeMents
While there were no senior management changes in
2011, there were some changes in the composition of
our Board of Directors.
At the annual meeting in May, 2011, two long-serving
members retired from the Board of Directors. Both
were dedicated to Wawanesa and committed to the
long-term success of the Company. Barry W. Harrison
retired after 17 years of service including serving as
Board Chair from 2006 until his retirement. Susan M.
Van De Velde served Wawanesa for 18 years and chaired
various Board committees. Both Susan and Barry
were instrumental in the development of enhanced
governance processes over a number of years. We
thank them both for their significant contribution
to Wawanesa.
As a result of Barry’s
retirement, the Board selected
Richard R. Bracken as the
new Board Chair. Richard
has been a member of the
Board since 2004. He is an
experienced business person
and very involved in the
Winnipeg community.
Also at the annual meeting, Robert O. Landry was
elected as a director of all Wawanesa companies.
Mr. Landry is a resident of Toronto and a former
property and casualty insurance industry executive,
having served as President and CEO of a leading
commercial property and casualty company. He is
a former Board member of the Insurance Bureau of
Canada and a Past Chair of The Insurance Institute
of Canada.
Our Company continues to grow and prosper in a
challenging environment. We are clear in our direction
and we are preparing for the future by developing
operational depth and flexibility. I would like to
offer sincere thanks to our employees and brokers
who continued to demonstrate their commitment to
Wawanesa in 2011.
Ken McCrea, CA, FLMI
President and Chief Executive Officer
We are clear in our direction and we are preparing for the future by developing operational depth and flexibility.
7
February 21, 2012
to the DIrectors oF the WaWanesa Mutual Insurance coMpany
The accompanying summary consolidated financial statements, which
comprise the summary consolidated balance sheets as at December 31,
2011 and 2010 and the summary consolidated statements of operations for
the years ended December 31, 2011 and 2010, are derived from the audited
consolidated financial statements of The Wawanesa Mutual Insurance
Company for the years ended December 31, 2011 and 2010. We expressed
an unmodified audit opinion on those consolidated financial statements in
our report dated February 21, 2012.
The summary consolidated financial statements do not contain all the
disclosures required by International Financial Reporting Standards.
Reading the summary consolidated financial statements, therefore, is not
a substitute for reading the audited consolidated financial statements of
The Wawanesa Mutual Insurance Company.
Management’s Responsibility for the Summary Consolidated Financial Statements
Management is responsible for the preparation of a summary of the
audited consolidated financial statements in accordance with International
Financial Reporting Standards.
Auditor’s Responsibility
Our responsibility is to express an opinion on the summary consolidated
financial statements based on our procedures, which were conducted in
accordance with Canadian Auditing Standards (“CAS”) 810, “Engagements
to Report on Summary Financial Statements.”
Opinion
In our opinion, the summary consolidated financial statements derived
from the audited consolidated financial statements of The Wawanesa
Mutual Insurance Company for the years ended December 31, 2011 and
2010 are a fair summary of those consolidated financial statements, in
accordance with International Financial Reporting Standards.
Chartered Accountants
Winnipeg, Manitoba
the WaWanesa Mutual Insurance coMpany
report oF the InDepenDent auDItor on the suMMary consolIDateD FInancIal stateMents
Founded in 1896
Incorporated May 1, 1929
Head Office
Wawanesa, Manitoba
Executive Office
900–191 Broadway
Winnipeg, Manitoba
oFFIcers anD corporate ManageMent
K. E. McCrea, CA, FLMI President and Chief Executive Officer
G. N. Bass, Q.C. Vice President, General Counsel and Secretary
B. A. MacKinnon, FCAS, FCIA, MAAA Vice President and Chief Actuary
G. J. Timlick, CA Vice President and Chief Financial Officer
S. J. Goy, ACAS, CIP Vice President, Insurance Products
R. G. LaPage, FCIP, CRM Vice President, Regional Insurance Operations
C. R. Loeppky, BScCS Vice President, Information Services
C. B. Luby, FCIP, CRM Vice President, Marketing and Business Development
B. K. MacIntyre, BBA, FCIP Vice President, Claims
T. L. Nelson, FLMI/M, CHRP, CIP Vice President, Human Resources
K. P. Boyd, CA Controller
P. R. Mulaire, CMA, FCIP, CIA Manager, Internal Audit

8
February 21, 2012
to the DIrectors oF the WaWanesa Mutual Insurance coMpany
I have valued the insurance contract liabilities of the Company for its
consolidated balance sheets as at December 31, 2011 and their change
in the consolidated statements of operations for the year then ended
in accordance with accepted actuarial practice including selection of
appropriate assumptions and methods.
In my opinion, the amount of insurance contract liabilities makes
appropriate provision for all policyholder obligations, and the consolidated
financial statements fairly present the result of the valuation.
Brett A. MacKinnon, FCAS, FCIA, MAAA
Winnipeg, Manitoba
the WaWanesa Mutual Insurance coMpany
appoInteD actuary’s reportregIonal oFFIces
Maritime 1010 St. George Boulevard Moncton, New Brunswick B. E. MacKenzie, CIP Vice President, Maritime Region
Québec 8585 Décarie Boulevard Montréal, Québec C. Auclair, PAA Vice President, Québec Region
Ontario 100–4110 Yonge Street Toronto, Ontario T. R. Greer Vice President, Ontario Region
Winnipeg 700–200 Main Street Winnipeg, Manitoba E. Rossong, FCIP Vice President, Winnipeg Region
Prairie Wawanesa, Manitoba W. G. McGregor, FCIP Vice President, Prairie Region
Northern Alberta 100, 8657–51st Avenue Edmonton, Alberta K. E. Hartry, FCIP, MBA Vice President, Northern Alberta Region
Southern Alberta 600, 708–11th Avenue S.W. Calgary, Alberta M. M. Cote-Johnson, CIP Vice President, Southern Alberta Region
British Columbia 400–1985 West Broadway Vancouver, British Columbia G. R. Haigh, FCIP, CAIB Vice President, British Columbia Region
United States 9050 Friars Road San Diego, California D. G. Fitzgibbons, CPCU Vice President, United States Operations

9
As at December 31
2011 2010
(000s)
Assets
Cash and cash equivalents $ 90,211 $ 59,262
Accrued investment income 30,774 29,873
Investments 5,622,206 5,310,015
Other assets 1,312,578 1,189,937
Total assets $ 7,055,769 $ 6,589,087
Liabilities
Insurance contract liabilities $ 4,209,645 $ 3,835,944
Other liabilities 513,638 514,953
Total liabilities 4,723,283 4,350,897
Equity 2,332,486 2,238,190
Total liabilities and equity $ 7,055,769 $ 6,589,087
the WaWanesa Mutual Insurance coMpany
suMMary consolIDateD Balance sheets
A complete set of audited consolidated financial statements are available at www.wawanesa.com

10
For the year ended December 31
2011 2010
(000s)
Revenue
Net premiums written $ 2,416,305 $ 2,298,202
Change in unearned premiums (71,298) (94,768)
Net premiums earned 2,345,007 2,203,434
Net investment income 294,994 277,672
Instalment service charges earned 35,660 33,886
2,675,661 2,514,992
Expenses
Net claims and insurance benefits incurred $ 1,905,568 $ 1,757,365
Other expenses incurred 616,878 2,522,446 573,644 2,331,009
Profit before income taxes 153,215 183,983
Provision for income taxes 45,365 54,563
Profit for the year $ 107,850 $ 129,420
Profit (loss) for the year attributed to:
Policyholders of the Company $ 114,543 $ 130,013
Participating policyholders’ interest (6,693) (593)
$ 107,850 $ 129,420
the WaWanesa Mutual Insurance coMpany
suMMary consolIDateD stateMents oF operatIons
A complete set of audited consolidated financial statements are available at www.wawanesa.com
11
the WaWanesa Mutual Insurance coMpany
consolIDateD suppleMentary InForMatIon
automobile
property
life
other
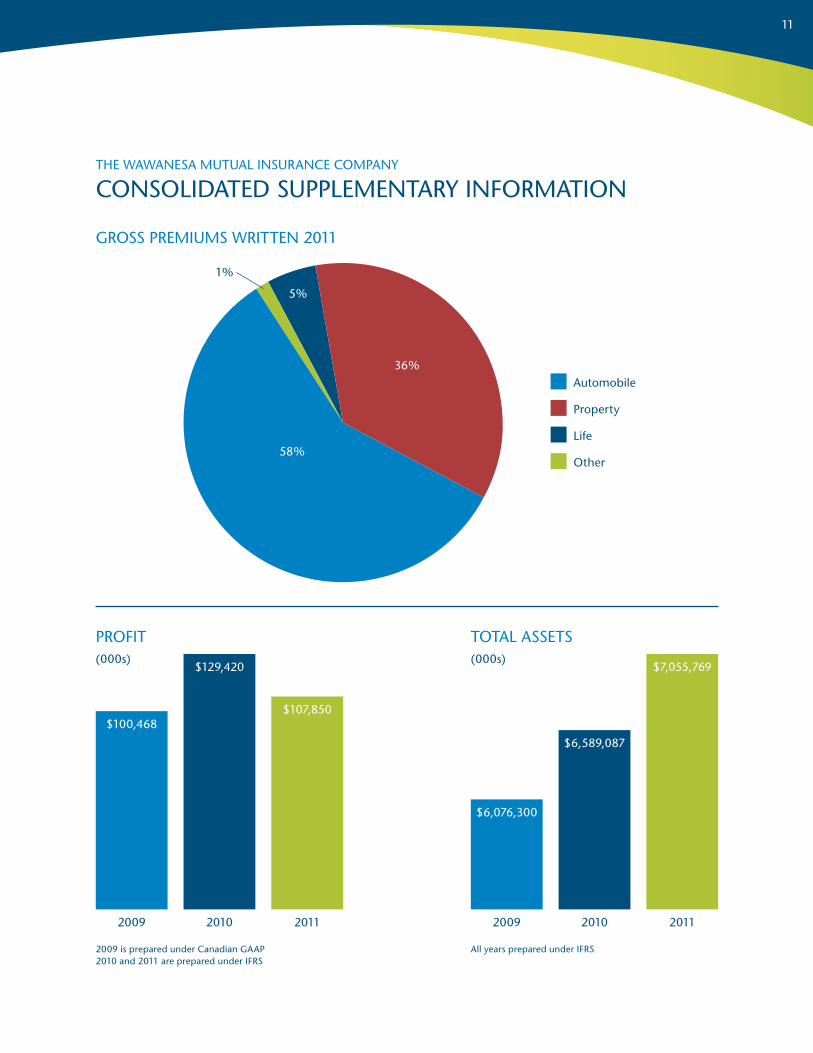
gross preMIuMs WrItten 2011
proFIt total assets
58%
36%
5%
1%
2009 2009
$100,468
$6,076,300
2010 2010
$129,420
$6,589,087
2011 2011
$107,850
$7,055,769
2009 is prepared under canadian gaap 2010 and 2011 are prepared under IFrs
all years prepared under IFrs
(000s) (000s)
12
the WaWanesa Mutual Insurance coMpany
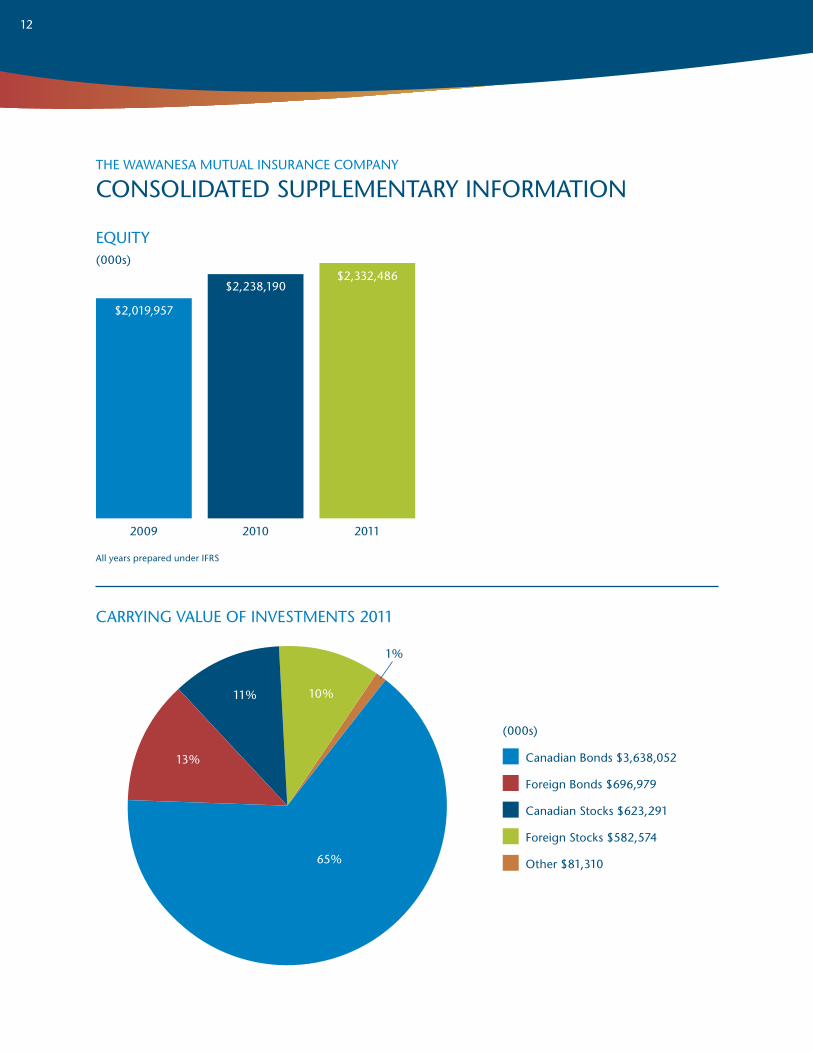
consolIDateD suppleMentary InForMatIon
equIty
carryIng Value oF InVestMents 2011
2009 2010 2011
all years prepared under IFrs
$2,019,957
$2,238,190$2,332,486
canadian Bonds $3,638,052
Foreign Bonds $696,979
canadian stocks $623,291
Foreign stocks $582,574
other $81,31065%
13%
11% 10%
1%
(000s)
(000s)

13
P&C Operations consist of The Wawanesa Mutual Insurance Company in Canada and Wawanesa General Insurance Company in the U.S. Our P&C Operations have conducted business in Canada and the U.S. for over 100 years and 35 years, respectively.
P&C Operations provide automobile, personal and
commercial property, and liability insurance products
in all major areas of Canada as well as in California
and Oregon. Wawanesa’s P&C insurance products
are distributed by over 1,300 independent insurance
brokers except in Quebec and the U.S. where products
are distributed through company agents.
Key Facts
• Total assets of $6.3 billion
• Strong financial position with equity of $2.3 billion
• Over $2.3 billion in annual policy premiums
• Over 2,300 employees across Canada and in the U.S.
key FInancIal Measures
The following information and charts may not be IFRS
measurements, but are derived from elements of the
financial statements (2011 and 2010 are prepared under
IFRS, 2009 is prepared under Canadian GAAP), and are
consistent with financial measures used in the P&C
insurance industry.
property anD casualty (p&c) operatIons proFIle
(000s)
gross preMIuMs WrItten
Gross premiums written is the premiums for all insurance policies placed inforce during the period including new
policies and renewals. It is a measure of how much insurance P&C Operations sold to our customers during the period.
2009 2010 2011
automobile
personal property
commercial property
other
$1,3
38,4
26
$543
,540
$176
,768
$32,
923
$195
,136
$35,
542
$211
,261
$38,
080$61
9,81
7
$68
3,40
2
$1,4
09,0
48
$1,4
48,1
40
2009 is prepared under canadian gaap, 2010 and 2011 are prepared under IFrs

14
unDerWrItIng loss
Underwriting loss is the loss from insurance operations. It includes net premiums earned and instalment service
charges less net claims and other expenses incurred.
net InVestMent IncoMe
Net investment income is comprised of interest income, dividends and distributions, the realized gain on sale of
available-for-sale financial assets, and other investment income and expenses.
2009
2009
2010
2010
2011
2011
2009 is prepared under canadian gaap, 2010 and 2011 are prepared under IFrs
2009 is prepared under canadian gaap, 2010 and 2011 are prepared under IFrs
(000s)
(000s)
$182,248
$232,436 $244,920
$(78,740)
$(49,745)
$(90,334)
p&c operatIons
15
2009 is prepared under canadian gaap, 2010 and 2011 are prepared under IFrs
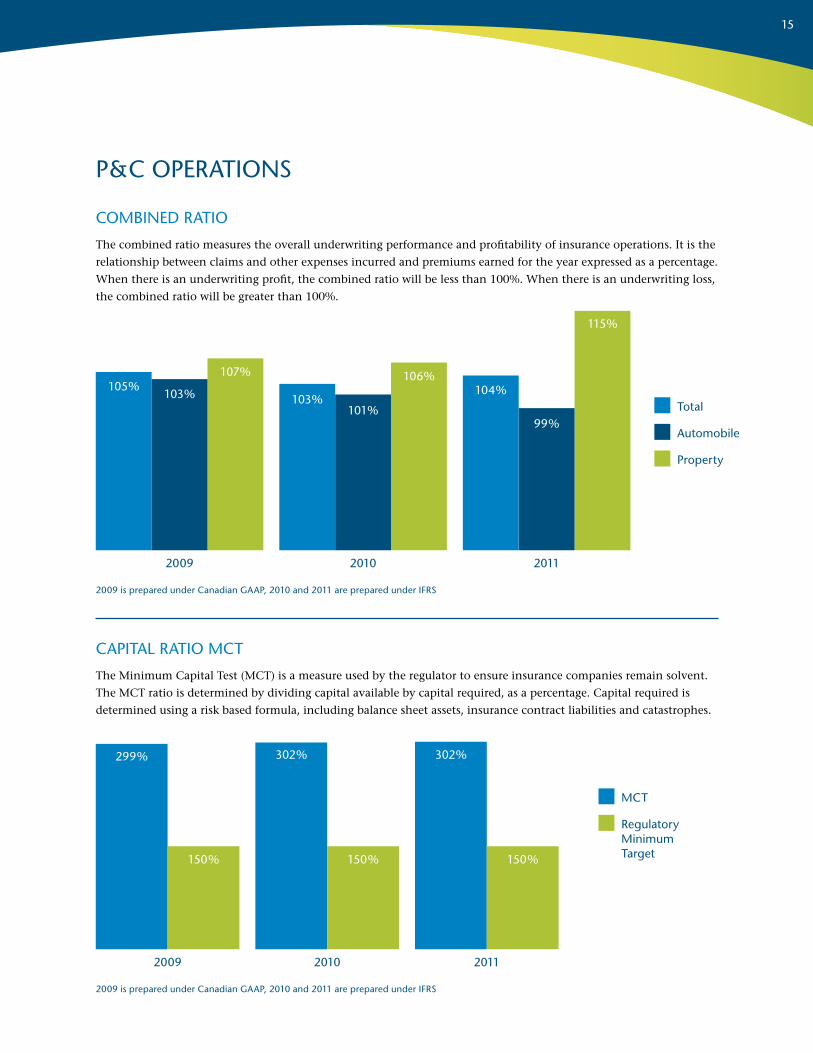
capItal ratIo Mct
The Minimum Capital Test (MCT) is a measure used by the regulator to ensure insurance companies remain solvent.
The MCT ratio is determined by dividing capital available by capital required, as a percentage. Capital required is
determined using a risk based formula, including balance sheet assets, insurance contract liabilities and catastrophes.
coMBIneD ratIo
The combined ratio measures the overall underwriting performance and profitability of insurance operations. It is the
relationship between claims and other expenses incurred and premiums earned for the year expressed as a percentage.
When there is an underwriting profit, the combined ratio will be less than 100%. When there is an underwriting loss,
the combined ratio will be greater than 100%.
2009 is prepared under canadian gaap, 2010 and 2011 are prepared under IFrs
2009
2009
2010
2010
2011
2011
150% 150% 150%
299% 302% 302%
Mct
regulatory Minimum target
total
automobile
property
105%103%
107%
103%101%
106%104%
99%
115%
p&c operatIons

16
Our life insurance operations are conducted by The Wawanesa Life Insurance Company. It is a Canadian life and health insurance company that has been in operation for over 50 years.
Wawanesa Life provides term, permanent and critical
illness insurance plus investment product options
including segregated funds to individuals through its
independent broker channel. Group life and health
insurance products are designed to service the needs
of employers, associations and unions by working
with group benefit brokers. Wawanesa Life maintains
regional sales offices across the country to support its
many broker and client relationships.
Key Facts
• Total assets of $830 million
• Individual life insurance volumes of $14 billion
insured through 65,000 polices
• Insures more than 24,000 employees through
group benefit plans
key FInancIal Measures
The following information and charts may not be
IFRS measurements, but are derived from elements
of Wawanesa Life’s financial statements (2011 and
2010 are prepared under IFRS, 2009 is prepared under
Canadian GAAP), and are consistent with financial
measures used in the life insurance industry.
lIFe operatIons proFIle
(000s)
2009 2010 2011
Individual
group
annuity
$37,668 $39,080$40,731
$23,486$26,967
$34,738
$27,402
$32,482 $33,907
net preMIuMs anD equIValents
Net premiums and equivalents are the sum of billed insurance premiums, contributions received for investment in
annuities or segregated funds, management fees earned on segregated fund balances and fee income earned from the
administration of group business where the policyholder retains the insurance risk.
2009 is prepared under canadian gaap, 2010 and 2011 are prepared under IFrs
17
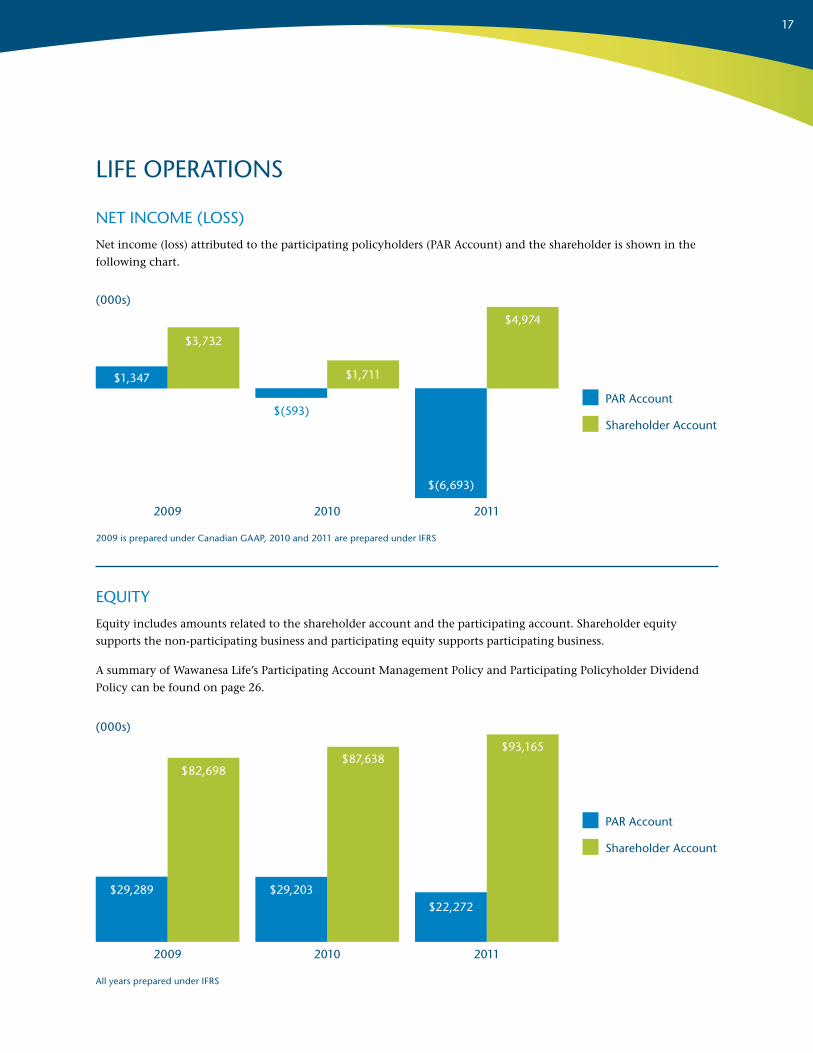
net IncoMe (loss)
Net income (loss) attributed to the participating policyholders (PAR Account) and the shareholder is shown in the
following chart.
(000s)
(000s)
2009
2009
2010
2010
2011
2011
par account
shareholder account
par account
shareholder account
$3,732
$1,347
$(6,693)
$4,974
$1,711
$(593)
equIty
Equity includes amounts related to the shareholder account and the participating account. Shareholder equity
supports the non-participating business and participating equity supports participating business.
A summary of Wawanesa Life’s Participating Account Management Policy and Participating Policyholder Dividend
Policy can be found on page 26.
$29,289
$82,698
$29,203
$87,638
$22,272
$93,165
lIFe operatIons
2009 is prepared under canadian gaap, 2010 and 2011 are prepared under IFrs
all years prepared under IFrs

18
total assets
Represents total assets managed by Wawanesa Life which include its general fund assets and policyholder
contributions to the segregated funds that are held separate and apart from the general fund assets.
(000s)
(000s)
2009
2009
2010
2010
2011
2011
general Fund assets
segregated Funds net assets
Bonds
stocks
other
$591,519
$139,896
$636,847
$167,842
$666,278
$163,636
InVestMents
Investments are managed in a conservative manner to provide steady, consistent investment income to support
the cash flow and liquidity needs of Wawanesa Life. The Board of Directors has approved the Investment Policy
Statement that sets out the guidelines followed by management to prudently manage these assets.
$436
,489
$59,
413
$38,
912
$70,
506
$34,
259
$73,
605
$30,
021
$476
,877
$519
,348
lIFe operatIons
all years prepared under IFrs
all years prepared under IFrs
19
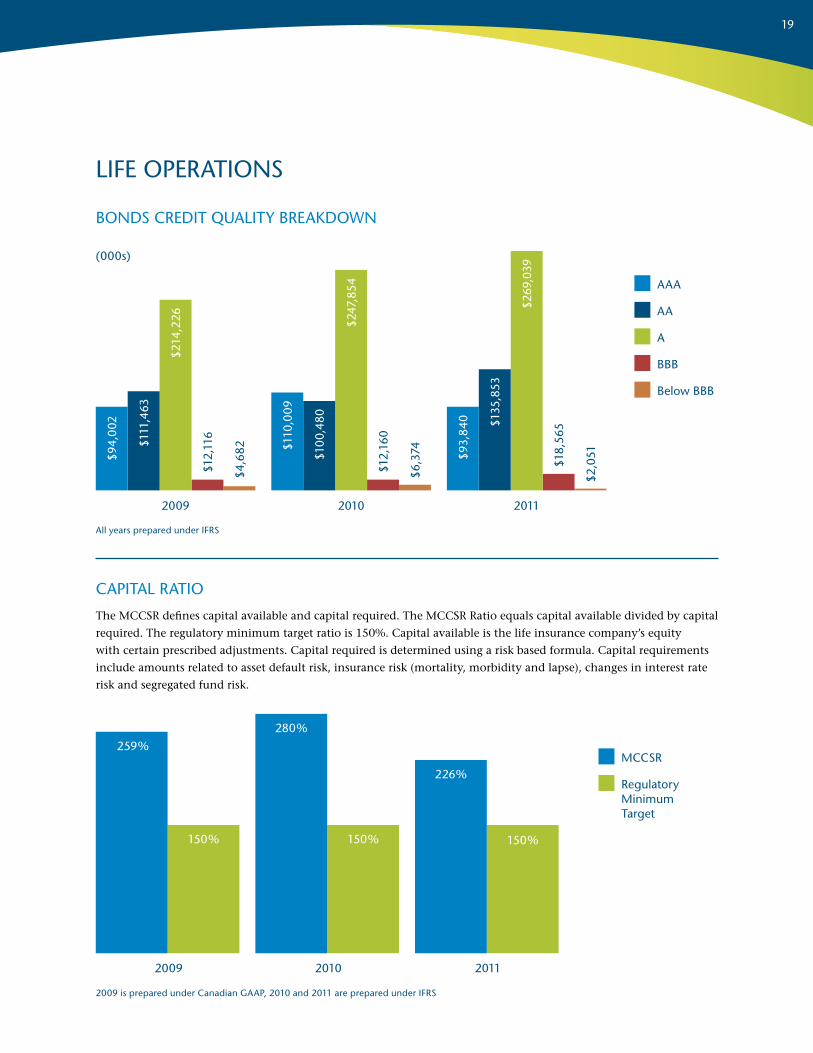
capItal ratIo
The MCCSR defines capital available and capital required. The MCCSR Ratio equals capital available divided by capital
required. The regulatory minimum target ratio is 150%. Capital available is the life insurance company’s equity
with certain prescribed adjustments. Capital required is determined using a risk based formula. Capital requirements
include amounts related to asset default risk, insurance risk (mortality, morbidity and lapse), changes in interest rate
risk and segregated fund risk.
BonDs creDIt qualIty BreakDoWn
aaa
aa
a
BBB
Below BBB
2009 2010 2011
$94,
002
$111
,463
$214
,226
$110
,009
$10
0,48
0
$247
,854
$93,
840 $1
35,8
53
$269
,039
$12,
116
$4,6
82
$12,
160
$6,
374
$18,
565
$2,0
51
2009 2010 2011
Mccsr
regulatory Minimum target
259%
150%
280%
150%
226%
150%
(000s)
lIFe operatIons
all years prepared under IFrs
2009 is prepared under canadian gaap, 2010 and 2011 are prepared under IFrs

20
February 21, 2012
to the shareholDer anD polIcyholDers oF the WaWanesa lIFe Insurance coMpany
The accompanying summary financial statements, which comprise the
summary balance sheets as at December 31, 2011 and 2010 and the
summary statements of operations for the years ended December 31,
2011 and 2010, are derived from the audited financial statements of
The Wawanesa Life Insurance Company for the years ended December 31,
2011 and 2010. We expressed an unmodified audit opinion on those
financial statements in our report dated February 21, 2012.
The summary financial statements do not contain all the disclosures
required by International Financial Reporting Standards. Reading
the summary financial statements, therefore, is not a substitute
for reading the audited financial statements of The Wawanesa Life
Insurance Company.
Management’s Responsibility for the Summary Financial Statements
Management is responsible for the preparation of a summary of the
audited financial statements in accordance with International Financial
Reporting Standards.
Auditor’s Responsibility
Our responsibility is to express an opinion on the summary financial
statements based on our procedures, which were conducted in accordance
with Canadian Auditing Standards (“CAS”) 810, “Engagements to Report
on Summary Financial Statements.”
Opinion
In our opinion, the summary financial statements derived from the
audited financial statements of The Wawanesa Life Insurance Company
for the years ended December 31, 2011 and 2010 are a fair summary of
those financial statements, in accordance with International Financial
Reporting Standards.
Chartered Accountants
Winnipeg, Manitoba
the WaWanesa lIFe Insurance coMpany
report oF the InDepenDent auDItor on the suMMary FInancIal stateMents
Incorporated July 7, 1960
Head Office
Wawanesa, Manitoba
Executive Office
400–200 Main Street
Winnipeg, Manitoba
oFFIcers anD ManageMent
Corporate
K. E. McCrea, CA, FLMI President and Chief Executive Officer
M. K. Nemeth, CA, FLMI, GBA Vice President and Chief Operating Officer
G. N. Bass, Q.C. Vice President, General Counsel and Secretary
I. R. MacDonald, FSA, FCIA Vice President and Actuary
C. R. Loeppky, BScCS Vice President, Information Services
T. L. Nelson, FLMI/M, CHRP, CIP Vice President, Human Resources
E. Elvebo, CA Manager, Corporate Reporting
P. M. Horncastle, CGA Controller
P. R. Mulaire, CMA, FCIP, CIA Manager, Internal Audit
K. J. Richtik, FSA, FCIA Manager, Actuarial Financial Reporting
Insurance Operations
G. G. Sadler, CLU, ChFC, CHS Director, Individual Sales and Marketing
M. M. Nolin, DDM, ALHC, ACS, AIAA Manager, Group Benefit Services
D. M. Smook Manager, National Group Sales and Marketing
D. I. Verwey Manager, Group Underwriting and Policy Administration
A. E. Waller, MBA, CFP, ChFC, CLU, FALU Manager, Individual Life Administration
Medical Director
Dr. R. B. Boyd, MD

21
February 21, 2012
to the shareholDer anD polIcyholDers oF the WaWanesa lIFe Insurance coMpany
I have valued the insurance contract liabilities of The Wawanesa Life
Insurance Company for its balance sheet at December 31, 2011 and
their change in the statement of operations for the year then ended
in accordance with accepted actuarial practice, including selection of
appropriate assumptions and methods.
In my opinion, the amount of insurance contract liabilities makes
appropriate provision for all policyholder obligations and the financial
statements fairly present the result of the valuation.
Ian R. MacDonald
Fellow, Canadian Institute of Actuaries
Winnipeg, Manitoba
the WaWanesa lIFe Insurance coMpany
appoInteD actuary’s reportregIonal oFFIces
Atlantic 1010 St. George Boulevard Moncton, New Brunswick
S. B. Brydges, CFP, CHS Regional Life Manager
Ontario 100–4110 Yonge Street Toronto, Ontario
B. I. Lang, RHU Regional Life Manager
R. J. Rowe, GBA Regional Group Manager
Western Manitoba 208–740 Rosser Avenue Brandon, Manitoba
G. L. C. Goymer, CFP, ChFC, CLU, CHS Regional Life Manager
Eastern Manitoba and NW Ontario 700–200 Main Street Winnipeg, Manitoba
J. A. Kien Regional Life Manager
T. A. McDowell Regional Group Manager
Saskatchewan 201–3501 8th Street East Saskatoon, Saskatchewan
205, 2631–28th Avenue Regina, Saskatchewan
G. F. M. Kurmey, FLMI Regional Life Marketing Representative
Northern Alberta 100, 8657–51st Avenue Edmonton, Alberta
L. P. J. Addison Regional Life Manager
S. Lambert Regional Group Manager
Southern Alberta 600, 708–11th Avenue S.W. Calgary, Alberta
B. A. Reid Galarnyk Regional Life Manager
British Columbia 310–1985 West Broadway Vancouver, British Columbia
S. F. Engmann Regional Life Manager
B. R. Wyne, MBA Regional Group Manager

22
As at December 31
2011 2010
(000s)
Assets
Cash and cash equivalents $ 30,281 $ 12,448
Investments 622,974 581,642
Other assets 13,023 42,757
General fund assets 666,278 636,847
Segregated funds net assets 163,636 167,842
Total assets $ 829,914 $ 804,689
Liabilities
Other liabilities $ 7,006 $ 6,188
Insurance contract liabilities 543,835 513,818
General fund liabilities 550,841 520,006
Segregated funds contract liabilities 163,636 167,842
Total liabilities 714,477 687,848
Equity 115,437 116,841
Total liabilities and equity $ 829,914 $ 804,689
the WaWanesa lIFe Insurance coMpany
suMMary Balance sheets
A complete set of audited financial statements are available at www.wawanesa.com
23
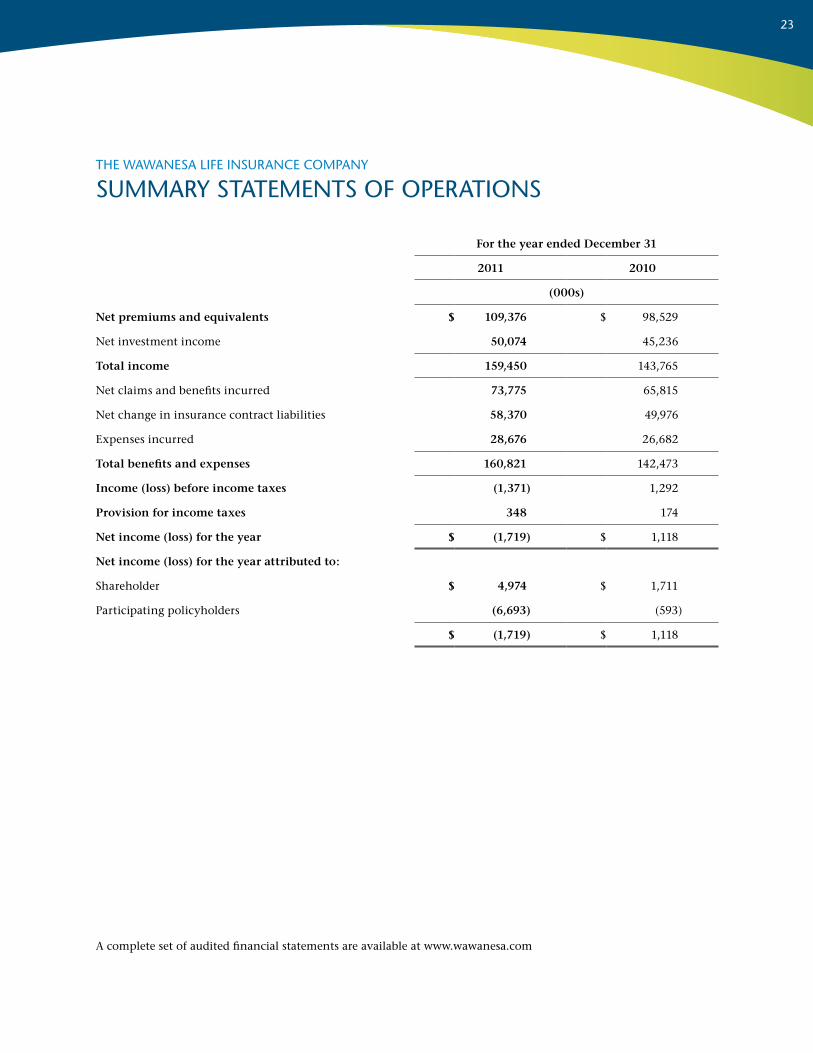
For the year ended December 31
2011 2010
(000s)
Net premiums and equivalents $ 109,376 $ 98,529
Net investment income 50,074 45,236
Total income 159,450 143,765
Net claims and benefits incurred 73,775 65,815
Net change in insurance contract liabilities 58,370 49,976
Expenses incurred 28,676 26,682
Total benefits and expenses 160,821 142,473
Income (loss) before income taxes (1,371) 1,292
Provision for income taxes 348 174
Net income (loss) for the year $ (1,719) $ 1,118
Net income (loss) for the year attributed to:
Shareholder $ 4,974 $ 1,711
Participating policyholders (6,693) (593)
$ (1,719) $ 1,118
the WaWanesa lIFe Insurance coMpany
suMMary stateMents oF operatIons
A complete set of audited financial statements are available at www.wawanesa.com

24
The Source of Earnings are attributable to one of the
following categories:
expecteD proFIt on InForce BusIness
This includes the release of the Provision for Adverse
Deviations (PFADs) plus the expected profits on
Segregated Funds. The release of the PFADs is the
profit arising on the inforce business if the expected
assumptions used in calculating the actuarial liabilities
are realized.
IMpact oF neW BusIness
This represents the overall loss during the first year
on new business. The PFADs in the actuarial liabilities
contribute to an overall initial loss on issuing new
business. These PFADs are anticipated to be released
into income in future years to the extent they are not
required to cover future adverse experience.
experIence gaIns anD losses
The experience gains result from items such as
investment returns, claims and expenses where the
actual experience during the year differs from the
expected experience assumed in the actuarial liabilities.
It also includes the amount the fee income generated
on Segregated Funds differs from expected.
ManageMent actIon anD changes In assuMptIons
This section includes specific management actions and
the impact of changes in assumptions used to calculate
actuarial liabilities.
earnIngs on surplus
This reflects the earnings on the surplus and capital of
the Company.
other
This represents all other sources of earnings not
included above.
the WaWanesa lIFe Insurance coMpany
source oF earnIngs stateMent
25
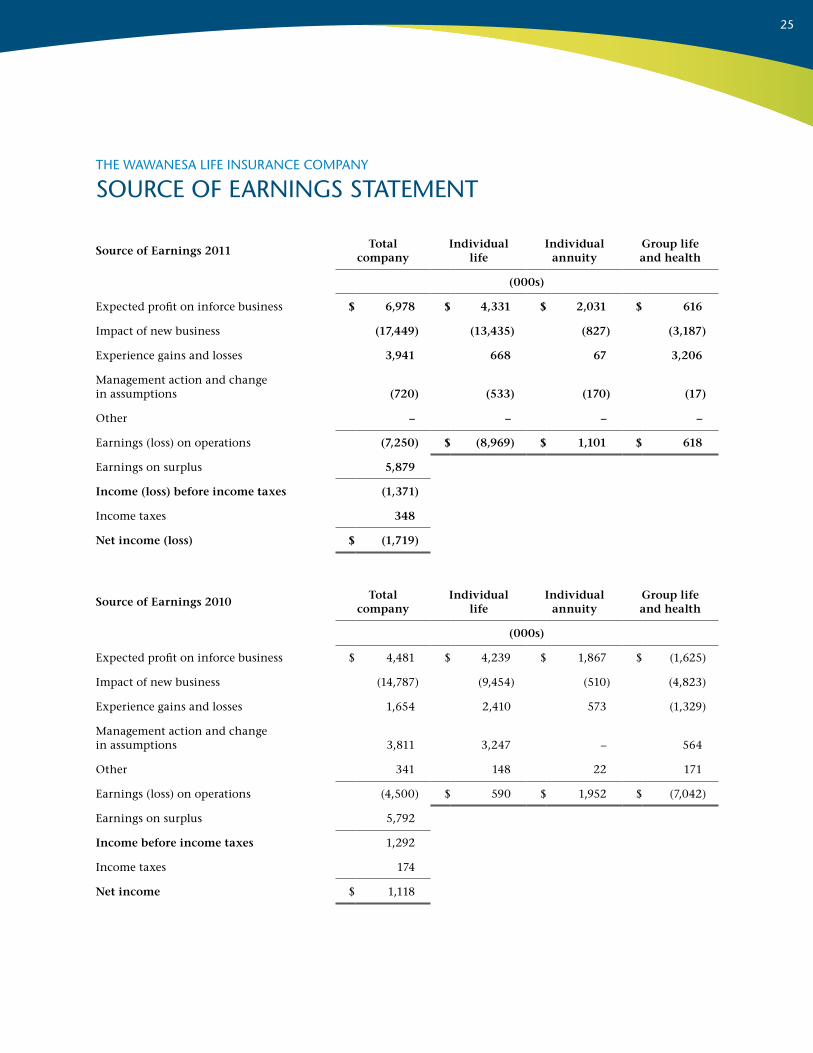
the WaWanesa lIFe Insurance coMpany
source oF earnIngs stateMent
Source of Earnings 2011Total
companyIndividual
lifeIndividual
annuityGroup life and health
(000s)
Expected profit on inforce business $ 6,978 $ 4,331 $ 2,031 $ 616
Impact of new business (17,449) (13,435) (827) (3,187)
Experience gains and losses 3,941 668 67 3,206
Management action and change in assumptions (720) (533) (170) (17)
Other – – – –
Earnings (loss) on operations (7,250) $ (8,969) $ 1,101 $ 618
Earnings on surplus 5,879
Income (loss) before income taxes (1,371)
Income taxes 348
Net income (loss) $ (1,719)
Source of Earnings 2010Total
companyIndividual
lifeIndividual
annuityGroup life and health
(000s)
Expected profit on inforce business $ 4,481 $ 4,239 $ 1,867 $ (1,625)
Impact of new business (14,787) (9,454) (510) (4,823)
Experience gains and losses 1,654 2,410 573 (1,329)
Management action and change in assumptions 3,811 3,247 – 564
Other 341 148 22 171
Earnings (loss) on operations (4,500) $ 590 $ 1,952 $ (7,042)
Earnings on surplus 5,792
Income before income taxes 1,292
Income taxes 174
Net income $ 1,118
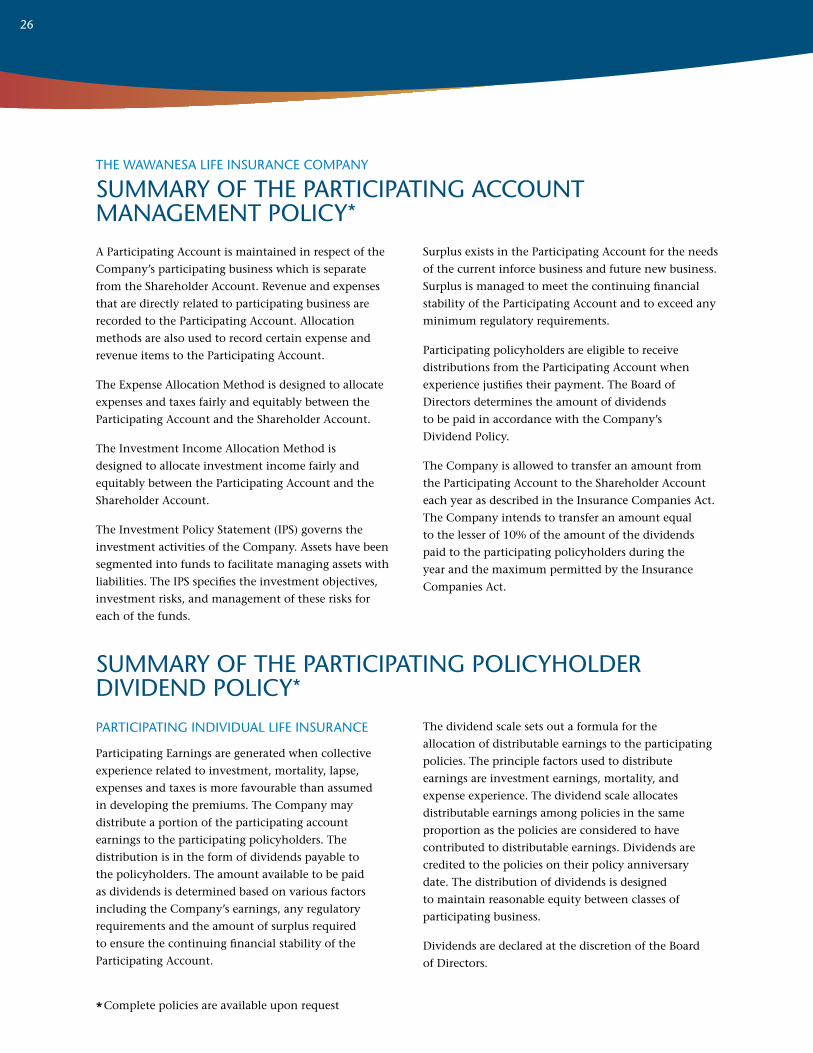
A Participating Account is maintained in respect of the
Company’s participating business which is separate
from the Shareholder Account. Revenue and expenses
that are directly related to participating business are
recorded to the Participating Account. Allocation
methods are also used to record certain expense and
revenue items to the Participating Account.
The Expense Allocation Method is designed to allocate
expenses and taxes fairly and equitably between the
Participating Account and the Shareholder Account.
The Investment Income Allocation Method is
designed to allocate investment income fairly and
equitably between the Participating Account and the
Shareholder Account.
The Investment Policy Statement (IPS) governs the
investment activities of the Company. Assets have been
segmented into funds to facilitate managing assets with
liabilities. The IPS specifies the investment objectives,
investment risks, and management of these risks for
each of the funds.
Surplus exists in the Participating Account for the needs
of the current inforce business and future new business.
Surplus is managed to meet the continuing financial
stability of the Participating Account and to exceed any
minimum regulatory requirements.
Participating policyholders are eligible to receive
distributions from the Participating Account when
experience justifies their payment. The Board of
Directors determines the amount of dividends
to be paid in accordance with the Company’s
Dividend Policy.
The Company is allowed to transfer an amount from
the Participating Account to the Shareholder Account
each year as described in the Insurance Companies Act.
The Company intends to transfer an amount equal
to the lesser of 10% of the amount of the dividends
paid to the participating policyholders during the
year and the maximum permitted by the Insurance
Companies Act.
partIcIpatIng InDIVIDual lIFe Insurance
Participating Earnings are generated when collective
experience related to investment, mortality, lapse,
expenses and taxes is more favourable than assumed
in developing the premiums. The Company may
distribute a portion of the participating account
earnings to the participating policyholders. The
distribution is in the form of dividends payable to
the policyholders. The amount available to be paid
as dividends is determined based on various factors
including the Company’s earnings, any regulatory
requirements and the amount of surplus required
to ensure the continuing financial stability of the
Participating Account.
The dividend scale sets out a formula for the
allocation of distributable earnings to the participating
policies. The principle factors used to distribute
earnings are investment earnings, mortality, and
expense experience. The dividend scale allocates
distributable earnings among policies in the same
proportion as the policies are considered to have
contributed to distributable earnings. Dividends are
credited to the policies on their policy anniversary
date. The distribution of dividends is designed
to maintain reasonable equity between classes of
participating business.
Dividends are declared at the discretion of the Board
of Directors.
the WaWanesa lIFe Insurance coMpany
suMMary oF the partIcIpatIng account ManageMent polIcy*
suMMary oF the partIcIpatIng polIcyholDer DIVIDenD polIcy*
*Complete policies are available upon request
26

27

28
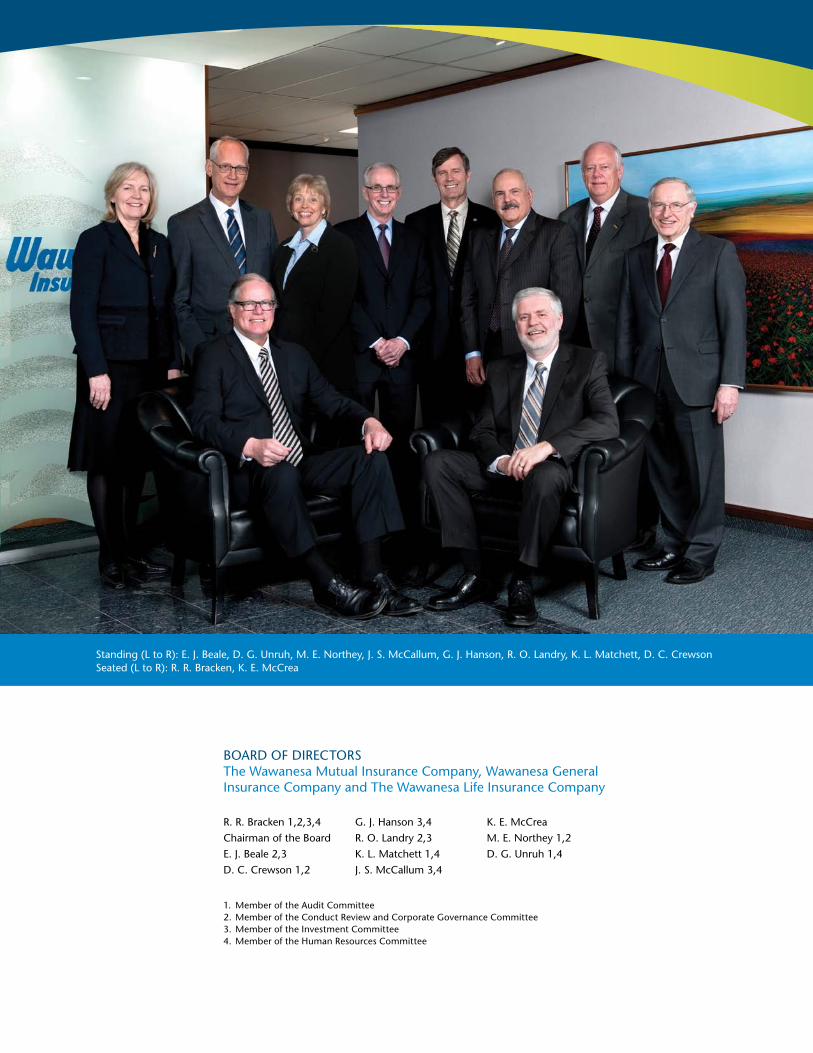
standing (l to r): e. J. Beale, D. g. unruh, M. e. northey, J. s. Mccallum, g. J. hanson, r. o. landry, k. l. Matchett, D. c. crewson seated (l to r): r. r. Bracken, k. e. Mccrea
BoarD oF DIrectors the Wawanesa Mutual Insurance company, Wawanesa general Insurance company and the Wawanesa life Insurance company
r. r. Bracken 1,2,3,4
chairman of the Board
e. J. Beale 2,3
D. c. crewson 1,2
g. J. hanson 3,4
r. o. landry 2,3
k. l. Matchett 1,4
J. s. Mccallum 3,4
k. e. Mccrea
M. e. northey 1,2
D. g. unruh 1,4
1. Member of the audit committee2. Member of the conduct review and corporate governance committee3. Member of the Investment committee4. Member of the human resources committee