waves of wars - robertdoolaard.com · about my work (see mundane astrology, second edition 1992,...
TRANSCRIPT

1
Robert D. Doolaard
Waves of Wars1500 - 2000
Published:
Astrology under Scrutiny, Astrological Journal, Foundation for theStudy of Cycles, Symbolon, L'Astrologue 153, Linguaggio Astrale139, Cycles Research Institute, Astrologos del Mundo
1993 (1.0) – 2004 (2.0)

WAVES OF WARS1700 – 2000
by Robert D. Doolaard
AbstractThis research aims to verify a proposed link between the worldwide outbreakof wars since 1700 and the Cyclic Index of Barbault. To make a clearerdistinction this has been supplemented by two sub-indexes.The three indexes created in this way are respectively called the Uranus,Saturn and Jupiter wave; each has its own rhythm, unique to the respectiveplanets after which they are named.A chart of 61 great wars is presented, complete with phase notes for each ofthese three waves. The result is the ‘Catastrophe Effect’ i.e. the worse thewar, the stronger the link with all three waves. The great wars between 1500 and 1700 have also been included assupplement to this research. Subsequently the Catastrophe Effect is onceagain illustrated by means of examples from history, commencing with thecollapse of the Assyrian Empire. In conclusion, the material is furtherexamined through a test proposed by Professor Suitbert Ertel. Also therelation of mundane astrology to historicism is discussed.
IntroductionThis research material was first published in 1993, in the AstrologicalJournal, in Symbolon and in the sceptical Dutch scientific magazineAstrology under Scrutiny. The latter submitted it to three referees. Theeditorial staff found it an interesting observation but could not agree with myconclusion and was of the opinion that it could be founded on coincidence.A deep silence followed and my work seems to have passed into oblivion inthe English-speaking world.
I began this research to provide quantitative proof for my planetary-cyclicalhistoriography, published in 1986, in Dutch, under the title Waves: PlanetaryInfluences on Culture 600 BC – 2000 AD. A summary of this book, in fourparts, was published in the Astrological Journal of Britain (Doolaard 1990-91). An English translation was then in preparation and was to be publishedby the Urania Trust, on the initiative of Charles Harvey, who was enthusiasticabout my work (see Mundane Astrology, second edition 1992, page 218, ref.55). Through his regrettable decease and other circumstances beyond mycontrol, this never materialised.
In 1993 I stated: “Now democracy is spreading, especially since theauthoritarian Communist regimes began to dissolve, we are able to harboursome hope, since history teaches that democracies are extremely less blood-thirsty than totalitarian regimes.” Since 2003 we realize that even moderndemocracies do not hesitate to start a war on the basis of fabricatedinformation, therefore putting aside the carefully constructed internationallegal order. In common with the First Gulf War this one also broke out at thestart of a descending phase of the Cyclic Index.
The following text is alike to that of 1993, only abbreviated when possible,with minor adjustments and brought up to date.Subsequently I include additional proof with relevant commentary.
Cycles = TimeOur division of time is related to the rotation of the Earth around its axis andto its orbit around the sun. It is only a small step further to extend this to allthe planets in our solar system. The characteristic feature is the circularmovement, the cycle.Just as a twenty-four hour period is divided into a day and night half, and ayear into a summer and a winter, so we are able to perceive a difference in thecycle of two planets, a waxing, outgoing half (from conjunction toopposition) and a waning, incoming half (from opposition to conjunction),

3
each with its unique character. The cyclic vision of time is very old, probably as old as human observation.During the Greek Classical Era, new life was breathed into this vision by e.g.Pythagoras, Heraclitus, Empedocles, Plato and Aristotle. The rediscovery ofcycles in astrology, with directions for practical application, is from morerecent date.The first publication about cycles of planetary pairs, within a psychosocialcontext, was from Th.J.J. Ram (1935). The inspiration was from his friendThierens (1933). The most important element consisted of the recognition ofa qualitative and dynamic contrast between the outgoing and incoming half. The first (really brilliant and inspired) article that I read (in 1963), fromAndré Barbault, described the succession of historical events in e.g. theSoviet Union as compared to the succession of aspects between Saturn andNeptune. Therefore cyclic but without any special qualitative differentiationbetween outgoing and incoming aspects. Later on he rediscovered Gouchon’sCyclic Index and fully demonstrated the possibilities of the Cyclic Index inhis L’Astrologie Mondiale (1979). Barbault told me later that he had metRam ("un charmant homme") but did not remember their topics of discussion.There have also been interesting publications in the English language aboutcycles, from Dane Rudyar (1971) and, of course, the historical, philosophicaland practical observations of Michael Baigent, Nicholas Campion andCharles Harvey in Mundane Astrology (1984). Of great importance is TheGreat Year from Campion (1994), an inventory of all concepts of time inwestern history.It is really thanks to a brainwave of the French astrologer Henri JosephGouchon, (Barbault 1973, 1979, Harvey 1984) and its rediscovery andpropagation by André Barbault, that the cyclic concept has become a seriousconsideration in astrological research.
The Cyclic IndexDuring the Second World War Gouchon as well as Barbault settled down tosolve a serious problem that had arisen. Not a single astrologer had been ableto foresee that approaching catastrophe (Harvey 1984). Gouchon thenconceived the idea of calculating the zodiacal distances (angular separation)of the 10 cycles made by the outer 5 planets (thus from Jupiter to Pluto) withone another. He then added up these 10 angular separations. He did this oncefor each year (on March 21), plotting the results on a graph. Throughconnecting these points with each other, an undulating line took form,showing the average movement of the combined cyclic phases of these 5outer planets. The wave pattern is always dominated by the fastest planet, inthis case Jupiter. When the line goes downwards Jupiter is moving towards itsconjunctions with the slower planets (incoming or downwards phase orwave). When the line rises, Jupiter is moving towards its oppositions(outgoing, or upwards phase). Gouchon called this "l'indice de concentrationdes planètes lentes", (Barbault 1973). It was soon evident to him that the Firstas well as the Second World War took place during the incoming, downwardphase of the Cyclic Index. On this basis he predicted that before 1950 therewould be no great war. In 1950 the Korean War broke out (Harvey 1984).Those astrologers (Barbault 1973, 1979, Harvey 1984), who have studied theCyclic Index in depth agree that it provides a good indication of the degreeof stability in international economic and political relations.Recent history provides ample illustrations. In the second half of the 70's,during the downward phase of the Cyclic Index, the enlightenment of theSixties came to a halt; the (world) economy gradually became bogged downby inflation, bankruptcy, and fast-rising unemployment. At the same timeinternational relations deteriorated following the Killing Fields of Cambodia,the fundamentalist revolution in Iran, the invasion of Russian troops inAfghanistan and the war between Iran and Iraq. It was a period of greatcynicism and defeatism. Only from 1983, as the Cyclic Index is rising, did theeconomy gradually improve. International tensions lessened as well,especially following the rise of Gorbachev and his efforts for reform (glasnostand perestroika). Having arrived at the wave crest of '89/'90 East European

communist dictatorships collapsed (predicted by Barbault in an articlepublished in 1955! (Barbault 1990), followed by the disintegration of theSoviet Union and the Civil War in Yugoslavia, whilst at the same time thepolitical situation (Persian Gulf War) worldwide worsened.During the following upward phase the economy was booming again and thestock markets reached an incredible peak primarily brought about by thetechnology funds (New Economy Boom). With the opposition of Jupiter tothe outer planets (to Pluto in 2000) the stock markets crashed and at theopposition of Saturn (to Pluto in 2001) an end came to the internationalpolitical stability with the attacks on the Twin Towers and the Pentagon.During the present downwards phase of the Cyclic Index (since 2003) theinternational situation looks grim.
The researchOur intention is to compare the Cyclic Index of the last three centuries to thewars occurring within that period.The hypothesis reads as follows: the upward phase of a period marks adominant optimism, relative stability, creativity and growth. The downwardphase corresponds to a period of involution, destruction, pessimism,confusion and relative chaos. While this is a somewhat simplifiedrepresentation of facts, it is adequate for this study. The question now is whether the outbreak of wars confirm this hypothesis,because if there is a correspondence then more, or more severe, wars breakout during the downwards than during the upwards phase of the Cyclic Index.
The wavesFirstly I wish to explain how the graph (Fig.1) evolved. I have included thecyclic indexes for Uranus and Saturn. The reason will become apparent later.All the (geocentric) calculations are made for March 21 of each year.The programme used for the position of the planets is Astrocalc from Collin Miles. All computations are done by hand and drawn in Corel Draw.Taking 2000 as an example, we begin with the cyclic index of Uranus. Toachieve this, firstly the distance (angle) is calculated between Pluto andNeptune, that is, 53 degrees. To this we add the angular separations ofUranus-Pluto and Uranus-Neptune, respectively 66 and 13 degrees, obtaininga total of 132 degrees. The graph begins at 100 degrees; a point is set forUranus at 132.To obtain the cyclic index of Saturn, the angular separations of Saturn-Pluto,Saturn-Neptune and Saturn-Uranus are added to 132.To acquire the cyclic index of Jupiter (i.e. Barbault's original Cyclic Index)the same procedure is followed, with these results:
1. Pluto-Neptune 53 degrees (angular separation) 2. Pluto-Uranus 66 - - 3. Neptune-Uranus 13 - -
---- +132 degrees = the cyclic Index of Uranus.
4. Saturn-Pluto 151 - 5. Saturn-Neptune 98 - 6. Saturn-Uranus 85 -
---- +466 degrees = the cyclic index of Saturn.
7. Jupiter-Pluto 144 - 8. Jupiter-Neptune 91 - 9. Jupiter-Uranus 78 - 10. Jupiter-Saturn 7 -
---- +786 degrees = the cyclic index of Jupiter.
5
These calculations are made for each of the 300 years. The points are set outon a graph. Because the term ‘cyclic index of Uranus’ etc. is rather amouthful, I will from now on use the terms Uranus wave, Saturn wave andJupiter wave.We can see on this graph how the Uranus wave drives the Saturn wave up andhow this in turn strengthens or weakens the peaks and lows of the Jupiterwave.
The WarsI possess two list of wars. The first one compiled by the French historian,Bouthoul (1976), Barbault kindly sent me. This list ran from 1740 to 1974.Then I took up contact with the Dutch Polemological Institute at GroningenUniversity and the Centre for Research of Social Conflict at LeidenUniversity. They provided all the necessary data.The list I am using: "Wars and War-Related Deaths, 1500-1990", is compiledby William Eckhardt, Research Director of the Lentz Peace ResearchLaboratory, published in "World Military and Social Expenditures 1991".For the period 1700-1991, 491 wars are listed, in each of which 1000 or moredeaths are recorded (military and civilian). In these wars about 135,000,000people lost their lives. Imagine, that is as many as the total population ofEurope in the middle of the 18th century, or as many as the presentpopulation of the British Isles, France and the Netherlands together. If we set the dates of the beginning of these wars alongside the waves, thenwe see the following:
Number of wars: 491, beginning during the Jupiter-phase: -241 + 250- - the Saturn-phase: -268 + 223
The numbers behind the minus and plus relate to the number of wars thatbroke out during the downward Jupiter wave (minus-phase), and respectivelyduring the upward Jupiter wave (plus-phase).The differences are not so great and fall within expectations of coincidence.Therefore there is no obvious correlation between the cyclic indexes ofJupiter and Saturn and the number of wars that break out. We now know this.In order to overcome this apparent impasse I decided to divide the wars intothree categories:
1. Small wars with between 1000 and 10,000 deaths number: 296 2. Wars with between 10,000 and 100,000 deaths - : 124 3. Great wars with more than 100,000 deaths - : 71
Number of small wars 296 Jupiter phase : - 137 + 159 - middle-size wars 124 - : - 60 + 64
- great wars 71 - : - 44 + 27
Here we can see that wars from the first two categories slightly more oftenbreak out during the outgoing, upward, phase than during the incoming,downwards phase. Here also the differences are not so great and fall withinexpectations of coincidence. Let us now consider the great wars.
The great warsThe plus signs and minus signs under the planets show the phase (- meansdownward and + means upward) in which the various waves are moving.Under Uranus there are two notations. The first one is for the phase withPluto, the second for the phase with Neptune.
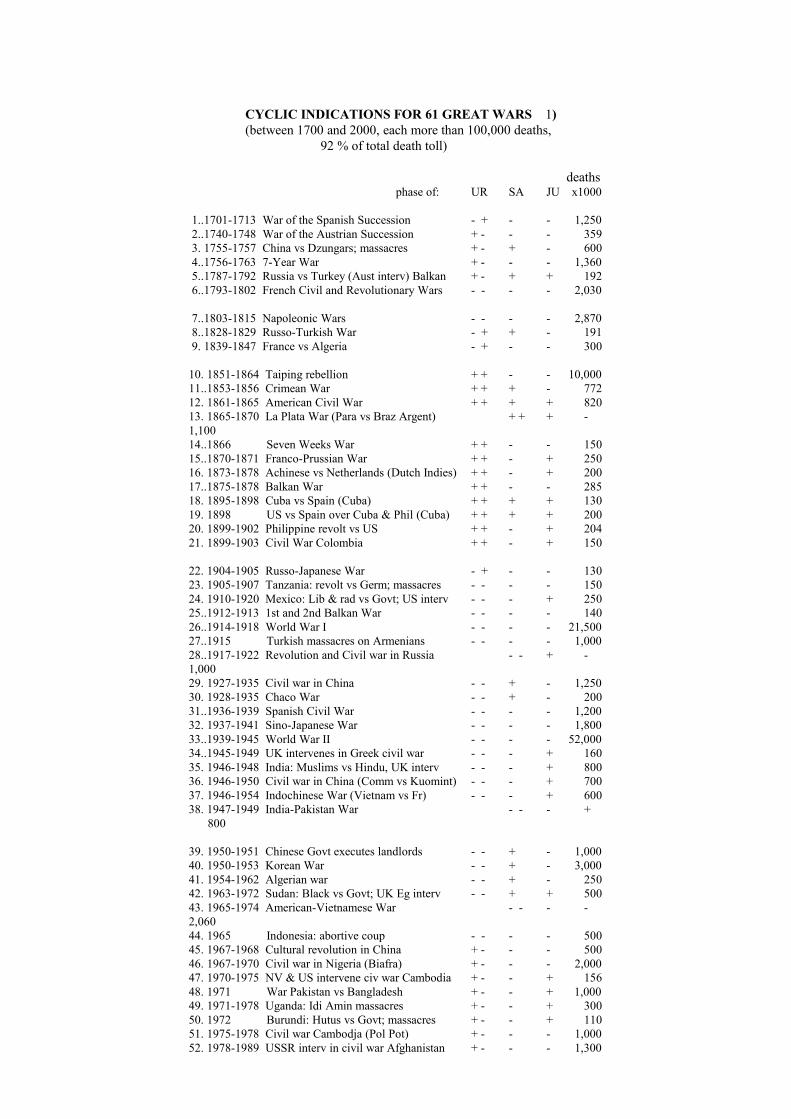
CYCLIC INDICATIONS FOR 61 GREAT WARS 1)(between 1700 and 2000, each more than 100,000 deaths,
92 % of total death toll)
deathsphase of: UR SA JU x1000
1..1701-1713 War of the Spanish Succession - + - - 1,250 2..1740-1748 War of the Austrian Succession + - - - 359 3. 1755-1757 China vs Dzungars; massacres + - + - 600 4..1756-1763 7-Year War + - - - 1,360 5..1787-1792 Russia vs Turkey (Aust interv) Balkan + - + + 192 6..1793-1802 French Civil and Revolutionary Wars - - - - 2,030
7..1803-1815 Napoleonic Wars - - - - 2,870 8..1828-1829 Russo-Turkish War - + + - 191 9. 1839-1847 France vs Algeria - + - - 300
10. 1851-1864 Taiping rebellion + + - - 10,00011..1853-1856 Crimean War + + + - 77212. 1861-1865 American Civil War + + + + 82013. 1865-1870 La Plata War (Para vs Braz Argent) + + + -1,10014..1866 Seven Weeks War + + - - 15015..1870-1871 Franco-Prussian War + + - + 25016. 1873-1878 Achinese vs Netherlands (Dutch Indies) + + - + 20017..1875-1878 Balkan War + + - - 28518. 1895-1898 Cuba vs Spain (Cuba) + + + + 13019. 1898 US vs Spain over Cuba & Phil (Cuba) + + + + 20020. 1899-1902 Philippine revolt vs US + + - + 20421. 1899-1903 Civil War Colombia + + - + 150
22. 1904-1905 Russo-Japanese War - + - - 13023. 1905-1907 Tanzania: revolt vs Germ; massacres - - - - 15024. 1910-1920 Mexico: Lib & rad vs Govt; US interv - - - + 25025..1912-1913 1st and 2nd Balkan War - - - - 14026..1914-1918 World War I - - - - 21,50027..1915 Turkish massacres on Armenians - - - - 1,00028..1917-1922 Revolution and Civil war in Russia - - + -1,00029. 1927-1935 Civil war in China - - + - 1,25030. 1928-1935 Chaco War - - + - 20031..1936-1939 Spanish Civil War - - - - 1,20032. 1937-1941 Sino-Japanese War - - - - 1,80033..1939-1945 World War II - - - - 52,00034..1945-1949 UK intervenes in Greek civil war - - - + 16035. 1946-1948 India: Muslims vs Hindu, UK interv - - - + 80036. 1946-1950 Civil war in China (Comm vs Kuomint) - - - + 70037. 1946-1954 Indochinese War (Vietnam vs Fr) - - - + 60038. 1947-1949 India-Pakistan War - - - +
800
39. 1950-1951 Chinese Govt executes landlords - - + - 1,00040. 1950-1953 Korean War - - + - 3,00041. 1954-1962 Algerian war - - + - 25042. 1963-1972 Sudan: Black vs Govt; UK Eg interv - - + + 50043. 1965-1974 American-Vietnamese War - - - -2,06044. 1965 Indonesia: abortive coup - - - - 50045. 1967-1968 Cultural revolution in China + - - - 50046. 1967-1970 Civil war in Nigeria (Biafra) + - - - 2,00047. 1970-1975 NV & US intervene civ war Cambodia + - - + 15648. 1971 War Pakistan vs Bangladesh + - - + 1,00049. 1971-1978 Uganda: Idi Amin massacres + - - + 30050. 1972 Burundi: Hutus vs Govt; massacres + - - + 11051. 1975-1978 Civil war Cambodja (Pol Pot) + - - - 1,00052. 1978-1989 USSR interv in civil war Afghanistan + - - - 1,300

7
53. 1980-1988 Iran-Irak War + - - - 50054. 1981-1987 Uganda: army vs people; massacres + - - - 30855. 1981-1990 Civil war Mozambique (famine) + - - - 1,05056. 1984-1990 Sudan: blacks vs Islamic law + - - + 50657. 1991 Persian Gulf War + - + - 20058. 1991-1992 Anarchy in Somalia + - + - 35059..1992-1999 Civil War former Yugoslavia + - + - 13060. 1994 Civil War Rwanda + + + - 80061. 1998-2000 Civil War in Congo + + + + 2,000
See end note 2 about ‘predominant’ and ‘half’.See end note 3 for the time span the waves are in the – or + phase.
In the 61 great wars listed above, the relationships are much clearer. 40 breakout during the descending and 21 during the ascending phase of the Jupiterwave. That is a ratio of 2:1. The same ratio applies to the Saturn wave. Also,during the simultaneous descending phase of the Jupiter and Saturn waves,wars break out 4 times more often (26 : 6) than in the reversed situation.However, if we compare the number of death felled in wars beginning in thedescending phase with those beginning in the ascending phase of the Jupiterwave, we arrive at a ratio 12:1. Since this group of great wars is responsiblefor 92 % of the total number of deaths in all wars of this period, I considerthat an extraordinary result.From this group 66 % (85.250) die in 9 % of the time (27 years) in warsbeginning when the Jupiter-, Saturn- and Uranus waves are all simultaneouslyon the descent, which is 27 times more than in periods when they are allrising.
no. of deaths inc.: outg: half: x 1000: inc.: outg.: ratio: - + 126,613 - +
Jupiter 40 21 116,585 10,028 12 : 1Saturn 41 20 111,928 14,685 7 : 1Uranus 23 14 24 95,160 17,061 5 : 1Predominant 38 13 10 115,752 7,318 15 : 1Jup.+Sat. 26 6 29 105,742 3,342 31 : 1Ju+Sa+Ur 11 4 85,250 3,150 27 : 1
9
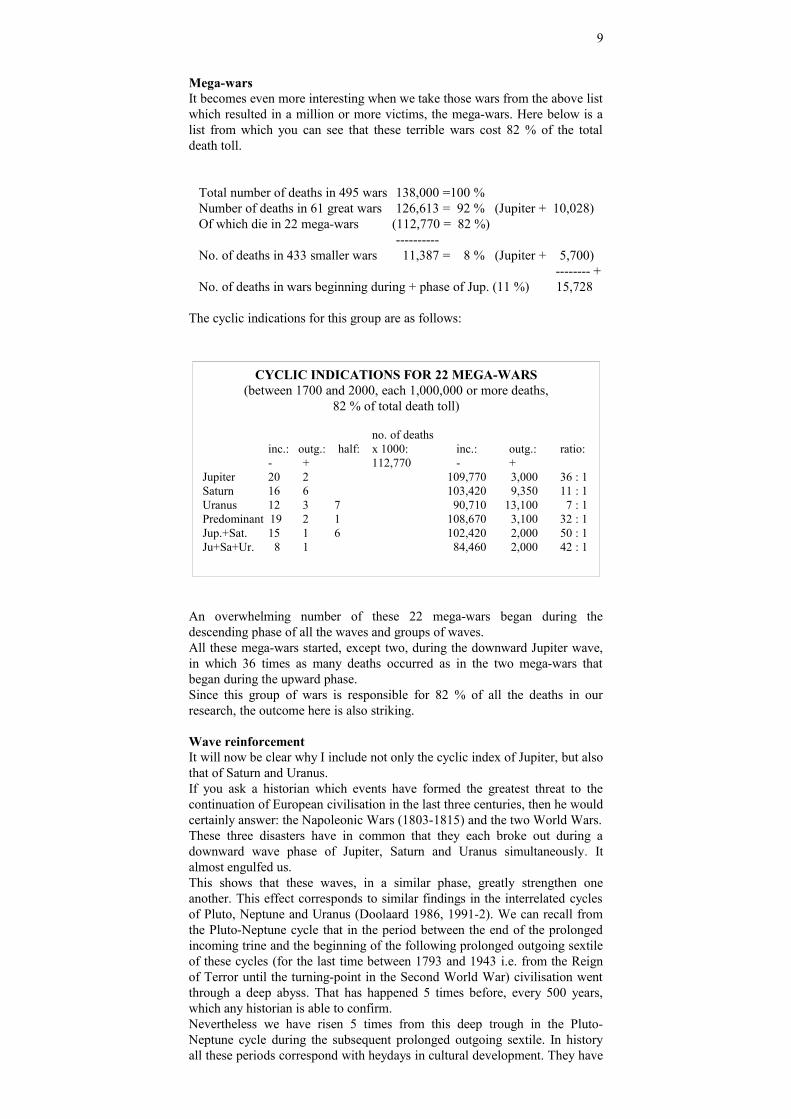
Mega-warsIt becomes even more interesting when we take those wars from the above listwhich resulted in a million or more victims, the mega-wars. Here below is alist from which you can see that these terrible wars cost 82 % of the totaldeath toll.
Total number of deaths in 495 wars 138,000 =100 % Number of deaths in 61 great wars 126,613 = 92 % (Jupiter + 10,028) Of which die in 22 mega-wars (112,770 = 82 %)
---------- No. of deaths in 433 smaller wars 11,387 = 8 % (Jupiter + 5,700)
-------- + No. of deaths in wars beginning during + phase of Jup. (11 %) 15,728
The cyclic indications for this group are as follows:
An overwhelming number of these 22 mega-wars began during thedescending phase of all the waves and groups of waves.All these mega-wars started, except two, during the downward Jupiter wave,in which 36 times as many deaths occurred as in the two mega-wars thatbegan during the upward phase.Since this group of wars is responsible for 82 % of all the deaths in ourresearch, the outcome here is also striking.
Wave reinforcementIt will now be clear why I include not only the cyclic index of Jupiter, but alsothat of Saturn and Uranus.If you ask a historian which events have formed the greatest threat to thecontinuation of European civilisation in the last three centuries, then he wouldcertainly answer: the Napoleonic Wars (1803-1815) and the two World Wars.These three disasters have in common that they each broke out during adownward wave phase of Jupiter, Saturn and Uranus simultaneously. Italmost engulfed us.This shows that these waves, in a similar phase, greatly strengthen oneanother. This effect corresponds to similar findings in the interrelated cyclesof Pluto, Neptune and Uranus (Doolaard 1986, 1991-2). We can recall fromthe Pluto-Neptune cycle that in the period between the end of the prolongedincoming trine and the beginning of the following prolonged outgoing sextileof these cycles (for the last time between 1793 and 1943 i.e. from the Reignof Terror until the turning-point in the Second World War) civilisation wentthrough a deep abyss. That has happened 5 times before, every 500 years,which any historian is able to confirm.Nevertheless we have risen 5 times from this deep trough in the Pluto-Neptune cycle during the subsequent prolonged outgoing sextile. In historyall these periods correspond with heydays in cultural development. They have
CYCLIC INDICATIONS FOR 22 MEGA-WARS(between 1700 and 2000, each 1,000,000 or more deaths,
82 % of total death toll)
no. of deaths inc.: outg.: half: x 1000: inc.: outg.: ratio: - + 112,770 - +
Jupiter 20 2 109,770 3,000 36 : 1Saturn 16 6 103,420 9,350 11 : 1Uranus 12 3 7 90,710 13,100 7 : 1Predominant 19 2 1 108,670 3,100 32 : 1Jup.+Sat. 15 1 6 102,420 2,000 50 : 1Ju+Sa+Ur. 8 1 84,460 2,000 42 : 1
all been endowed names with the predicate "classical" or "renaissance",beginning with the Golden Age of Pericles! (Doolaard, 1986, 1990-1, 1997).
The Catastrophe EffectTo return to our study, we can clearly see that the more terrible our wars are,the greater the tendency for them to break out during the descending phase ofthe three waves.
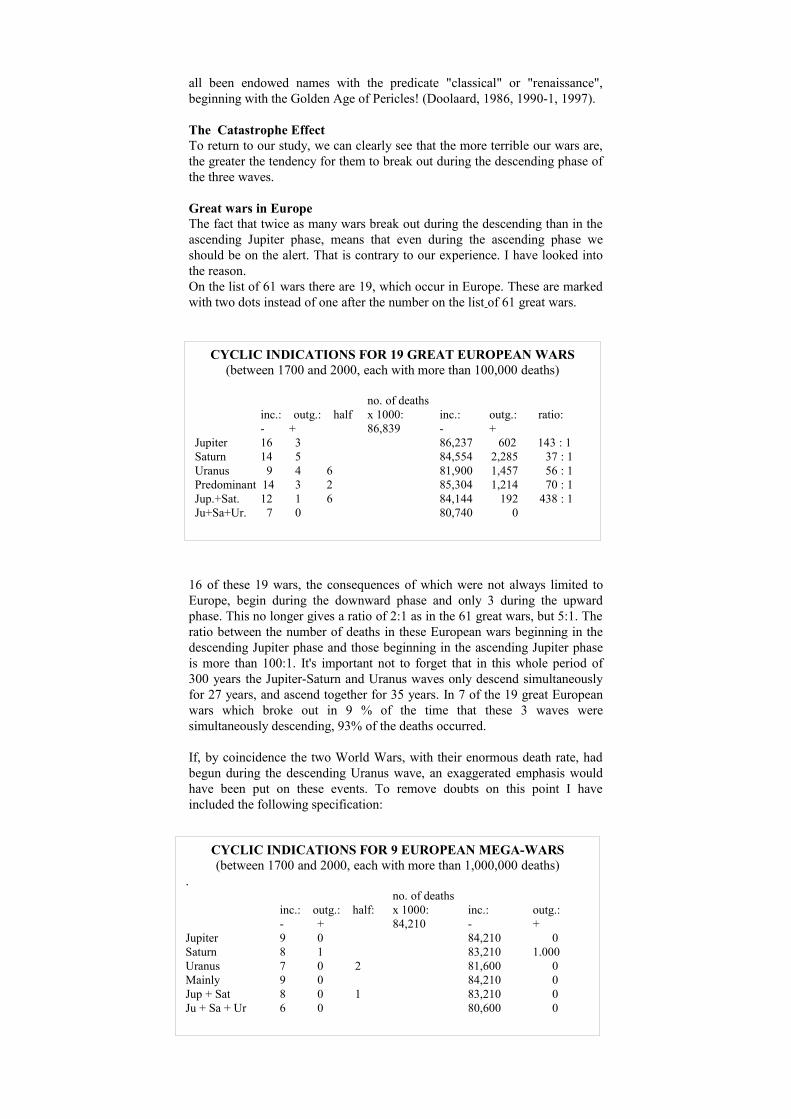
Great wars in EuropeThe fact that twice as many wars break out during the descending than in theascending Jupiter phase, means that even during the ascending phase weshould be on the alert. That is contrary to our experience. I have looked intothe reason.On the list of 61 wars there are 19, which occur in Europe. These are markedwith two dots instead of one after the number on the list of 61 great wars.
16 of these 19 wars, the consequences of which were not always limited toEurope, begin during the downward phase and only 3 during the upwardphase. This no longer gives a ratio of 2:1 as in the 61 great wars, but 5:1. Theratio between the number of deaths in these European wars beginning in thedescending Jupiter phase and those beginning in the ascending Jupiter phaseis more than 100:1. It's important not to forget that in this whole period of300 years the Jupiter-Saturn and Uranus waves only descend simultaneouslyfor 27 years, and ascend together for 35 years. In 7 of the 19 great Europeanwars which broke out in 9 % of the time that these 3 waves weresimultaneously descending, 93% of the deaths occurred.
If, by coincidence the two World Wars, with their enormous death rate, hadbegun during the descending Uranus wave, an exaggerated emphasis wouldhave been put on these events. To remove doubts on this point I haveincluded the following specification:
CYCLIC INDICATIONS FOR 9 EUROPEAN MEGA-WARS(between 1700 and 2000, each with more than 1,000,000 deaths)
.no. of deaths
inc.: outg.: half: x 1000: inc.: outg.:- + 84,210 - +
Jupiter 9 0 84,210 0Saturn 8 1 83,210 1.000Uranus 7 0 2 81,600 0Mainly 9 0 84,210 0Jup + Sat 8 0 1 83,210 0Ju + Sa + Ur 6 0 80,600 0
CYCLIC INDICATIONS FOR 19 GREAT EUROPEAN WARS(between 1700 and 2000, each with more than 100,000 deaths)
no. of deaths inc.: outg.: half x 1000: inc.: outg.: ratio:
- + 86,839 - +Jupiter 16 3 86,237 602 143 : 1Saturn 14 5 84,554 2,285 37 : 1Uranus 9 4 6 81,900 1,457 56 : 1Predominant 14 3 2 85,304 1,214 70 : 1Jup.+Sat. 12 1 6 84,144 192 438 : 1Ju+Sa+Ur. 7 0 80,740 0

11
We see here that the two World Wars form no exception. All the Europeanmega-wars show a clear relationship to the descending phase of all the wavesand groups of waves.
Conclusion
Having reviewed the foregoing material we can make the following notes:
1. Smaller wars can break out at any unwelcome moment, regardless of thecyclic index phase.
2. In contrast 89 % of the total number of victims falls in wars, which beginduring the downward Jupiter wave.
3. The main reason for this is that from the 22 mega-wars, responsible for 82% of the total death-cipher, 20 break out during the downward Jupiter wave,responsible for 97% of the losses in this group. 4. In these 22 mega-wars 96 % of the victims died in the 19 wars that brokeout during a prevalence of descending wave phases, and 75 % in warsbeginning when all three waves were on the descent, which was only during 9% of the time.
5. The worse the war, the more often it breaks out during the downward phaseof the cyclic indexes (Catastrophe Effect).
6. For an as yet unknown cause great wars in Europe break out relativelymore often during the descending Jupiter phase than elsewhere in the world.As many as 143 times so many deaths occur here in wars beginning duringthe downward Jupiter wave than in those beginning during the rising Jupiterwave. In fact 93 % of them die in those wars, which begin in the 27 years (9% of the time) in which the phase of these three waves are descending at thesame time.The group of 9 European mega-wars, in which 97 % of the deaths in all thegreat European wars occurred, reveal such a clear relationship to all thewaves and group of waves that, without doubt, this means that the (moving)positions of the outer planets are of great importance to our continent.
Hereby our hypothesis that the quality of our existence, as far as this isinfluenced by wars, improves during the rising and gets worse during thedeclining phase of the cyclic indexes, is tragically confirmed in an ample andextremely consistent way.
Final CommentaryFor most wars it is difficult to establish exactly how many victims have beenkilled. The estimated number of victims does, however, give an indication asto the seriousness of the conflict. The division of these wars into categories ofincreasing malignancy will not lead to any problem.All the background historical facts, which could also have been of value tothis study, have been excluded. For instance, we know that for the duration ofthe almost 3 centuries covered in this research, the world population hasmultiplied eight-fold. (McEvedy and Jones, 1980). The method of wagingwar has also dramatically changed in these three centuries. Whereas trained
professionals of a limited number still practiced the art of war in the 18thcentury, whole peoples' armies arose after the French Revolution. Throughthe Industrial Revolution these armed ranks were transformed into a war-machine, whose victims were counted in millions. In spite of this painfuldeflation of human dignity it did not seem advisable to me to adjust the
categories through, for example, increasing the threshold value for great warsof the 20th century.
Nevertheless, the results emerging from this study are clear. I find it movingand inspiring to know that we are so closely connected with the furthestreaches of our solar system.It is clear where our weakness lies: our culture is not attuned to an excess ofincoming planetary phases. If we see the outgoing and incoming half of acycle as a day and a night half, then we are obviously scared in the dark. Thatthis can lead to panic reactions is apparent from this research.(End 1993 text).
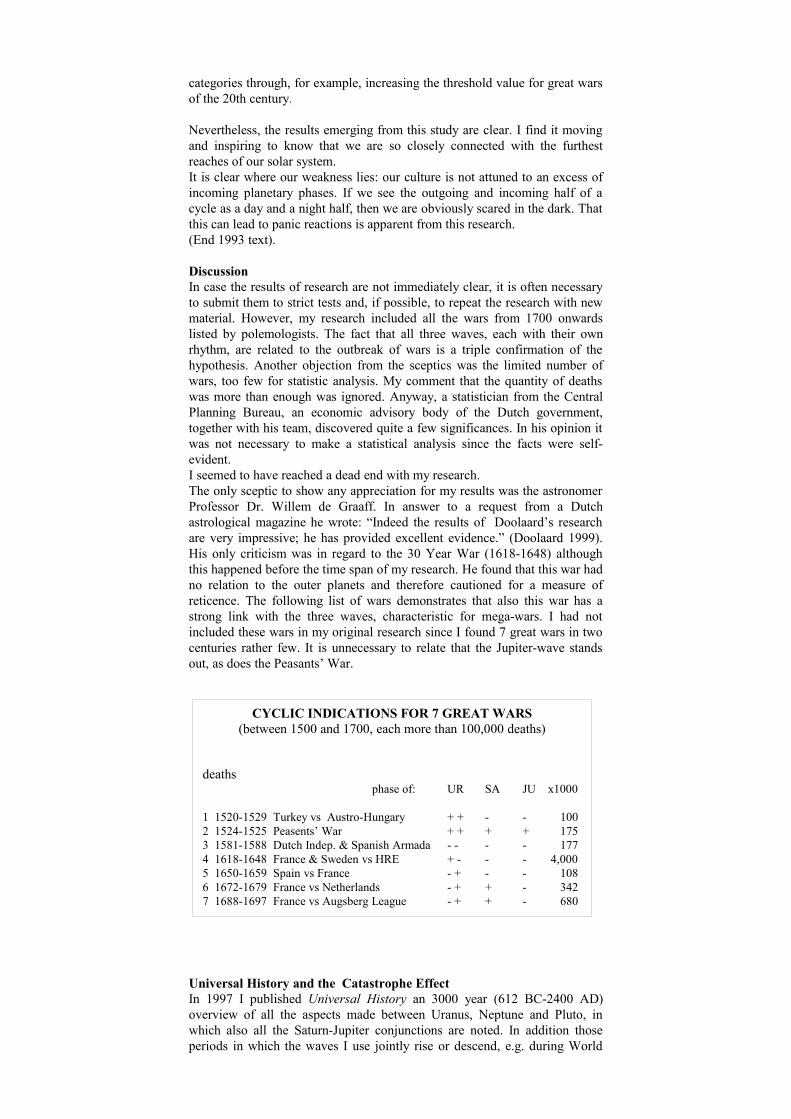
DiscussionIn case the results of research are not immediately clear, it is often necessaryto submit them to strict tests and, if possible, to repeat the research with newmaterial. However, my research included all the wars from 1700 onwardslisted by polemologists. The fact that all three waves, each with their ownrhythm, are related to the outbreak of wars is a triple confirmation of thehypothesis. Another objection from the sceptics was the limited number ofwars, too few for statistic analysis. My comment that the quantity of deathswas more than enough was ignored. Anyway, a statistician from the CentralPlanning Bureau, an economic advisory body of the Dutch government,together with his team, discovered quite a few significances. In his opinion itwas not necessary to make a statistical analysis since the facts were self-evident. I seemed to have reached a dead end with my research.The only sceptic to show any appreciation for my results was the astronomerProfessor Dr. Willem de Graaff. In answer to a request from a Dutchastrological magazine he wrote: “Indeed the results of Doolaard’s researchare very impressive; he has provided excellent evidence.” (Doolaard 1999).His only criticism was in regard to the 30 Year War (1618-1648) althoughthis happened before the time span of my research. He found that this war hadno relation to the outer planets and therefore cautioned for a measure ofreticence. The following list of wars demonstrates that also this war has astrong link with the three waves, characteristic for mega-wars. I had notincluded these wars in my original research since I found 7 great wars in twocenturies rather few. It is unnecessary to relate that the Jupiter-wave standsout, as does the Peasants’ War.
Universal History and the Catastrophe EffectIn 1997 I published Universal History an 3000 year (612 BC-2400 AD)overview of all the aspects made between Uranus, Neptune and Pluto, inwhich also all the Saturn-Jupiter conjunctions are noted. In addition thoseperiods in which the waves I use jointly rise or descend, e.g. during World
CYCLIC INDICATIONS FOR 7 GREAT WARS(between 1500 and 1700, each more than 100,000 deaths)
deathsphase of: UR SA JU x1000
1 1520-1529 Turkey vs Austro-Hungary + + - - 1002 1524-1525 Peasents’ War + + + + 1753 1581-1588 Dutch Indep. & Spanish Armada - - - - 1774 1618-1648 France & Sweden vs HRE + - - - 4,0005 1650-1659 Spain vs France - + - - 1086 1672-1679 France vs Netherlands - + + - 3427 1688-1697 France vs Augsberg League - + + - 680
13
War 1 and World War II, supplemented with the most important cultural andpolitical periodization and notes (280) for the period 620 BC to 2000 AD. Allthe cyclic data from my whole book are condensed on a scheme on one page,in colour, which is available on demand. If we solely consider the years in which all three waves descend, and forbrevity’s sake limit ourselves to those times that this happens around thePluto-Neptune conjunction (every 493 years), we see that twice whole erascollapse, as in the Fall of Nineveh (-612) that was totally wiped off the face ofthe earth, and the Fall of Rome (410), through which came an end to ClassicalCivilisation. The other periods also coincide to extremely dramatic periods,such as the period of prolonged civil wars in Rome from –133 to –30. Thefirst 55 years were completely dominated by an excess of descending wavephases, as in the same period a 1000 years later when Vikings, Hungariansand Saracens ravaged the occident. 500 Years later we find ourselves in thesecond half of the 100 Year War…
KeyIn 1999 I enjoyed an interesting correspondence with Professor Suitbert Ertel.He proposed testing my material by repeatedly allowing the wars to break outa year earlier and later and then to see what remained of their relation to thethree waves. Since the period is one of 300 years, this would mean I wouldhave to repeat my research 300 times. If a relationship was not rivalled orsurpassed then my conclusions would have to be taken serious. In fact it isclear that I can slide as much as I want but I cannot get the three mega-wars(World War I, World War II and the Napoleonic Wars) simultaneously in thepositions where all the waves descend, in other words, it is like a key whichonly fits the matching lock.
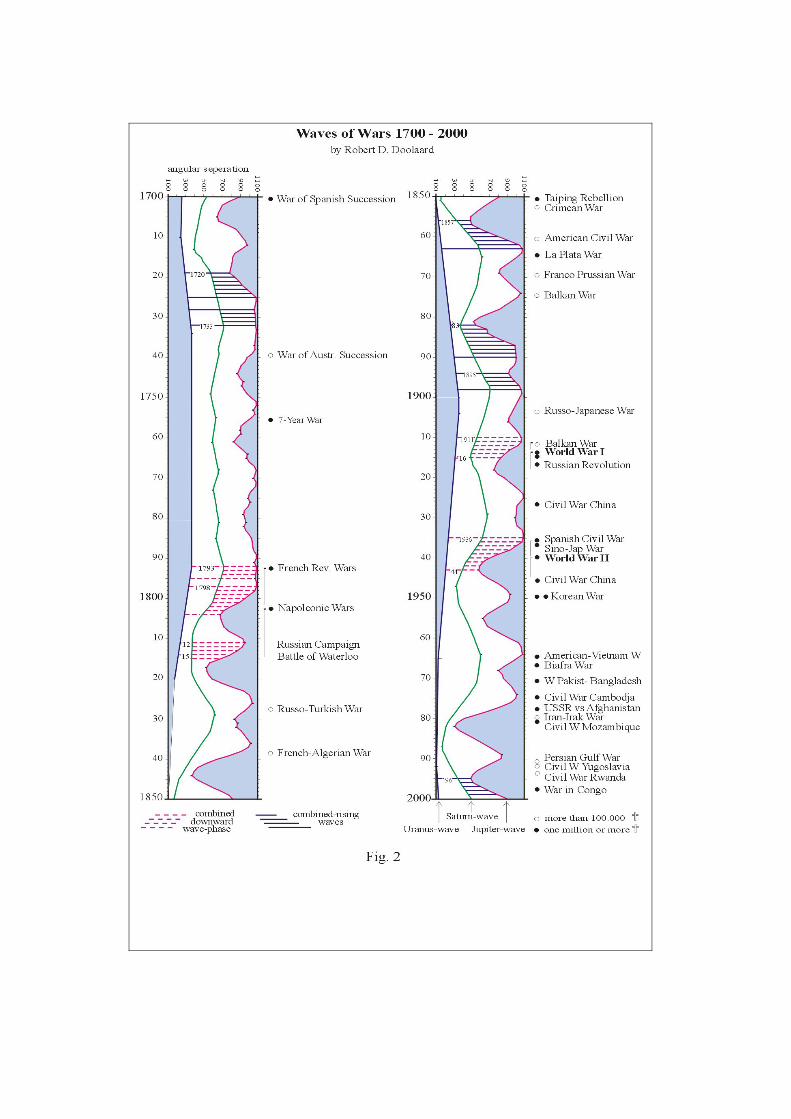
In response to Ertel’s proposal I made a graph which shows how many warsbreak out in relation to the diverse waves if I let them break out from 1 – 6years earlier and 1 – 6 years later (see fig. 2).The three graphs on the left side show how many wars break out during thedescending wave phase and those on the right how many wars begin duringthe rising phase. In the first graph the line positions under the number 0correspond to the real situation. You can see on the corresponding numberson the vertical axis that at that time 20 of the 22 mega-wars break out. If welet the wars break out 1½ year earlier then there are only 11, exactly what youwould expect were there no correlation. If we let the wars break out a yearlater then nothing changes. This is because wars usually last longer than 1year. After that the descent begins. After 4 years you arrive at the expectancyrate, from which can be concluded that wars on average last 4 years. In theactual situation all the waves are much above the expectancy rate. The reasonwhy the Jupiter wave peaks so sharply is that this is the most rapid wave of allthe various waves, and therefore functions as a trigger. The dark columns in the middle show the percentage of casualties in total, perwave. At 100% the columns would reach the top. The 3 graphs to the right show the same image but during the ascending wavephases. If there was no correspondence then all the waves would be round theposition of the line of expectancy rate. The vertical columns would also endin the vicinity. The contrast between the left and right graphs shows the extentto which the hypothesis is confirmed. This includes 82% of all war victimswho died in all the wars of the past 300 years. These graphs were inspired by the proposal of Suitbert Ertel, for which I
would like to express my thanks.

HistoricismOne of the most important reasons that scientists take a highly criticalposition towards my research is an objection to historicism, expressed by KarlPopper in The Open Society and its Enemies (1945) and in The Poverty ofHistoricism (1957). Campion’s The Great Year (1994) shows that in westerncivilisation, for thousands of years, historicism was rule rather than exceptionin western thought. Historicism assumes that the historical process operates according tounderlying laws. This has led to the growth of several authoritative systems ofthought which have had a disastrous influence on history. Nevertheless,mundane astrology, seen from a historic perspective the mother of allastrology, with André Barbault as the modern founder, has in my opinion lessto do with historicism than is evident at first sight, for two important reasons.

15
The first is that the relationships that are shown in this research cannot beseen as ‘underlying laws’ because laws tolerate no exceptions. The second is that the relation has been demonstrated, which is not the casewith historicist theories. Mundane Astrology, apparently a historicist heresy,has a special position. That does not diminish the fact that this study is an odeto classical philosophy and what there the consequences will be is hard toimagine.
PeaceLet us not forget there have been also periods of peace, as seen in Fig. 1 aswell as in the 3 graphs at the right of Fig. 2. From 1720 till 1734 we findourselves in the middle of the Rococo, a peaceful, natural and feminine style(Tansy, 1996). Also the last 2 decennia of the 19 th century are well known fortheir peace, prosperity and optimism. The second half of the 1990’s broughtthe further integration of Europe and the New Economy Boom.But the best has still to come: between 2025 and 2042, not only all the waveswill be ascending simultaneously, but also there we arrive in the second partof the prolonged sextile between PL and NE, accompanied by waxing sextilesand trines to UR (Doolaard 1997). These three ingredients of peace, culturalfertility and enlightenment will be active simultaneously. That neverhappened before (since 600 BC). If I could quantify peace, I would havewritten Waves of Peace instead.
Amsterdam, September 2004Endnotes
1. Under Great Wars I refer to those wars, which sadly result in more than100,000 victims, last no longer than 10 years and that cause per year at least25,000 deaths. Thus a war with 110,000 deaths in one year (No. 50) isincluded on the list, whilst the Northern War between Sweden and Russiafrom 1700-1721, with 382,000 victims, is nevertheless placed in the group ofmedium-sized wars, due to the annual norm. If we do not know in which yearsthe fighting was at its fiercest, it has little sense to compare it to the cyclicindex. For the group of 22 mega-wars, each with a million or more deaths, nolimitations have been set. This group has such a strong link with all threecyclical indexes, that it was unnecessary to determine a sub-group.I have two lists of wars that I have compared with each other in variouscomponents. No single list is absolutely perfect but that from WilliamEckhardt is most extensive. I had to correct a couple of data. Sometimes agroup of wars would be combined to a single war on one list, while noted onthe other as separate wars. Seemingly everyone does as they see fit, becausenone of the compilers is fully consequent in this. For instance, Eckhardtreduces the diverse French Revolutionary wars (No.6) and also the diverseNapoleonic Wars (No.7) into single conflicts. Bouthoul, on the other hand,notes each of these wars apart, perhaps because he's French. In other cases inwhich Eckhardt differentiates between wars, he unifies them e.g. no.28. Forthese two cases I have used Bouthoul's list because they clearly belong (like 6and 7) among the mega-wars when the death toll and impact are taken intoconsideration. I have also taken the two Balkan Wars, which took place insuccessive years, as one war (no.25) since, qua impact, they can clearly becounted among the great wars. I personally added the last four wars to the list(SIPRI and PIOOM-databank). Although some of these adjustments wereunavoidable and others desirable, they have little effect on the final result. Ihave mentioned them only for the sake of completeness. The war in the Congo forms a notable exception. For the past 500 years noother mega-war has broken out in a period of rising waves. It could be arguedthat this war started much earlier than 1998 because several dozen warlordshave been fighting each other since the civil war in Rwanda in 1994, and thefall of Mobutu. The battle for territory and raw materials continues. I haveincluded this war in my list mainly because of the immense number ofestimated deaths (1½ to 2½ million in 2 years).

2. I talk of predominance when three out of four positions are plus or minus.Only when both the Jupiter and the Saturn wave are in the same phase is thatphase predominant.Half means that there are two possibilities, like fifty-fifty, + - or - +.
3. The following table shows how many years the Jupiter, Saturn and Uranuswaves and group of waves are in the – or + phase for the period 1700-2000.
JU wave -149 +151SA wave -164 +136UR wave - 88 + 72JU+SA waves - 92 + 81JU+SA+UR waves - 27 + 35
References:
Barbault, André (1963) Wat wacht ons nog in de komende jaren? Astrologisch jaarboek 1963. Bruna & Zoon, Utrecht, the Netherlands.
- - (1965) La Crise Mondiale de 1965 Albin Michel, France. - - (1967) Les Astres et l'Histoire. J.J. Pauvert, France. - - (1973) Le Pronostic Experimental en Astrologie. Payot,
Paris. - - (1979) L'Astrologie Mondiale. Fayard, Paris. - - (1990) “Histoire d’une Prévision” L’astrologue Vol. 89,
Éditions Traditionelles, Paris. - - (2004) Introduction à l’astrologie mondiale, Éditions du
Rocher, France.Bouthoul, Gaston et Carrière, René (1976) Le Défi de la guerre. P.U.F.France.Baigent, Campion and Harvey (1984 and 1992) Mundane Astrology. TheAquarian Press, London.Campion, Nicholas (1994) The Great Year. Penguin Books Ltd., London.Carruth, Gorton (1993) The Encyclopaedia of World Facts and Dates. NewYork.Doolaard, Robert D. (1990-91) “The Pluto-Neptune cycles, the Power ofImagination” Astrological Journal. Vol. 33 No 5 and 6, Vol. 34 No 1 and 2.(An extract of Waves, Planetary Influences on Culture (600 BC - 2000 AD).Ankh-Hermes, Deventer 1986, in Dutch).Doolaard, Robert D. (1993) “Golven en Oorlogen 1700-1992”. SymbolonVol. 3. No. 4, pp 3-12. Hamaker, Amstelveen, the Netherlands. Astrologie inOnderzoek (Astrology under Scrutiny) Vol. 8, No 1, pp. 15-22. Heukelom,Amsterdam, the Netherlands.Doolaard, Robert D. (1993) “Waves and Wars 1700-1992”. AstrologicalJournal Vol. 35. No. 5, pp. 268-279.Doolaard, Robert D. (1999) Het Aristarchus van Samos effect, AstroFocusnr. 3, 1999, pp. 4-15, the Netherlands.Doolaard, Robert D. (1997) Universal History A chart of 3000 years with theNE, UR, SA and JU waves and aspects, related to political and culturalperiodization and events. Published and printed in colour by the author.Eckhardt, William (1991) “Wars and War Related Death 1500-1990” WorldMilitary and Social Expenditures 1991 Lenz Peace Research Laboratory.McEvedy, Colin and Jones, Richard (1980) Atlas of World Population History. Penguin Books Ltd., London.Miles, Collin, Astrocalc, England.Ram, Th.J.J. (1935) Psychologische Astrologie. Amersfoort, the Netherlands.Rudhyar, Dane: (1971) The Lunation Cycle. Shambhala.Tansy, R.G. and Kleiner, F.S. (1996) Gardner’s Art through the Ages. Harcourt Brace College Publihers, U.S.A.Thierens, A.E. (1933) Elementen der Practische Astrologie. the Netherlands.