wavelet coherence in complex systems -...
TRANSCRIPT

UFRN
COMPLEX
SYSTEMS
FOUNDATIONS AND
APPLICATIONS
Wavelet Coherence in Complex
Systems
Liacir S. Lucena

Work done in collaboration with
• Marcos Vinícius C. Henriques (UFERSA)
• Francisco Edcarlos A. Leite (UFERSA)
• Moacir L. Neto (PETROBRAS)
• Roberto S. Andrade (UFBA)
• José S. de Andrade Jr. (UFC)

Congratulations Constantino!

We want you a long life to continue to see you
playing the beautiful game of Physics

Constantino, the sower of Statistical Physics

A little bit of History
A tentative to create the International
Center for Complex Systems in Natal,
1995

A little bit of History - 2

Characteristics of Complex Systems
• Large Number of Elements
• Non-Linearity
• Fractality or Multifractality
• Singular Behavior
• Criticality

Data from Complex Systems
• Huge amount of Data
• Random
• Noisy
• Non-Stationary
• Scale Dependent Measurements
• Large fluctuations

Some Examples of Complex Systems
• Human Lung
• Formation of Sandstones
• Plasma Instabilities in the Ionosphere
• Biomedical Time Series
• Cultural Networks
• Linguistic Networks
• Petroleum Reservoirs
• Brazilian Economy

Challenges • How to treat, analyse and understand natural complex systems ?
• How to process and denoise non-stationary data ?
• How to decompose and study these data in different scales? • How to find the best representations to“uncover” hidden structures?
• How to get good images of these Complex Systems ?
• How to identify relevant patterns in the system, even if they are small and weak and are masked by a
strong noise?
• How find and match correlated parts and how to measure the correlations between these parts in a given Complex System ?
• To look for spectral techniques in which the representations of the systems are sparse
It is equivalent to find a needle in a hay stack !

Petroleum Reservoirs (A dificult problem that we revisit very often)
- Economic Relevance (Brasil makes a bet on it) - Sub-salt geological structures are more “complex”
- Standard Geostatistics methods (Krigging) give very
smoothed results, killing the heterogeneities and leading to wrong predictions
- The imaging of the subsurface geological structures by
conventional methods (ray tracing, stacking, migration, CRS, that means geometrical optics) show poor resolution, confusing and incomplete pictures or even images different from the reality

A “vida fácil” acabou (there is no free lunch anymore)
• To improve the quality of the sufsurface regions we have to solve the Complete Inverse Problem of the Wave Equation
• This problem is much more harder than the Imaging problem in Medicine
• The number of unknowns is much more bigger than the quantity of data and equatio
• If the medium is completely random there is no way to determine the solution.
• Any hope ? • Hint: To learn from the women

Learning from the women
• The “sixth sense”
• Large number of unknowns versus small amount of data
• The correlations betweeen the geological structures generate constraints that can regularize the problem
• New techniques: Compressive sensing, FWI, etc
• Need of large computers
• Anchoring simulations in real measurements (well logs)
• Relevance of the correlation measures between well logs for the determination of the interfaces between geological structures

Practical problems:
How to find and characterize petroleum reservoirs? How to get good images from the geological structures ? Are 2 petroleum occurences connected or not ? (do they belong to the
same reservoir?) How to measure the similarity between the geological strutures? How to improve the confidence degree in the analysis of correlations
between well logs between different wells and from different quantities in the same well ?

Motivation
• Petroleum Industry is full of Uncertainty and Risk.
• There are challenging problems (e.g. Sub-salt)
• The major richness of the petroleum companies is the detailed knowledge of the properties of the regions underground.
• In the Petroleum Exploration and Risk Analysis, the most valuable data is given by the well logs (very expansive costs and hard to obtain).
• Therefore we have to extract the maximum relevant information from the well logs using concepts from Statistical Physics and new mathematical tools.

Some facts
• The well logs record the vertical variability of the physical quantities, measured by sensors that move along the wells.
• This strong vertical variability, aparentemently of random nature, really shows statistical correlations that have been generated by the geological evolution and by physical processes during the diagenesis and the transformation of the rocks.

Some facts II
• Gravitational potencial simmetry generated in first approximation a tendency for horizontal continuity of the geological structures.
• There were however effects and factors that perturbated this tendency, producing failures and vertical displacements, heterogeneities, noise, etc.

What is the problem ?
• To analyse, with more confidence, the degree of similarity between regions whose properties are registered by well log segments, obtained in nearly located wells, to know if they have the same geological structure (for instance, if they are in the same reservoir or if they are not connected )

Uncertainty
Are the similar structures C and C’ connected ?
?
A
B
C
D
E
C’
P1
P2

Por que este problema é importante ?
• Este problema é de importância crucial em situações em que a visualização sísmica é difícil, tais como no “Pré-sal” e na plataforma continental em frente à costa do Rio Grande do Norte.
• Outra possível utilização será descobrir, com mais precisão, estruturas em reservatórios no mar (onde a informação é muito limitada) análogas às dos reservatórios em terra.

Localization of the wells 1BAS-68 e 1BAS-121
A real case

Localization of the wells

Distância entre os 2 poços
distância = 2,44 Km
1 BAS 68 1 BAS 121

Some Well Logs
• GR (intensidade de Raios Gama naturais)
• DT (perfil sônico ou vagarosidade das ondas de pressão). A vagarosidade DT em s/ft é convertida para uma velocidade VEL em m/s por
VEL = 304800 / DT
• ILD (resistividade medida por indução)
• NPHI (porosidade medida por neutrons térmicos)
• RHOB (densidade incluindo o espaço poroso prenchido com fluidos)

Some well logs from the well 1bas121

Some well logs from the well 1bas68

What are the proper tools ?
Natural choice
for Analysis &
Simulations
New spectral
representation
tools:
Wavelet based
Techniques
Curvelets, etc

Wavelet Transform

Wavelet Transfom
Idéia: To find the component of the
function a and position b
function to analyse
Wavelet

Example of Wavelet Transform
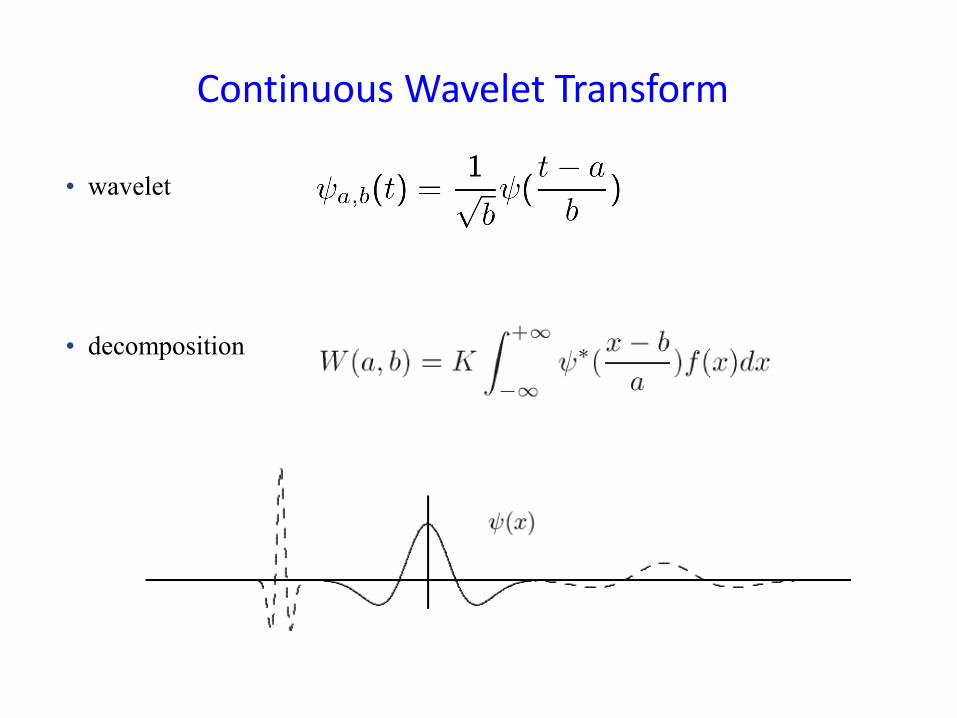
Continuous Wavelet Transform
• decomposition
• wavelet
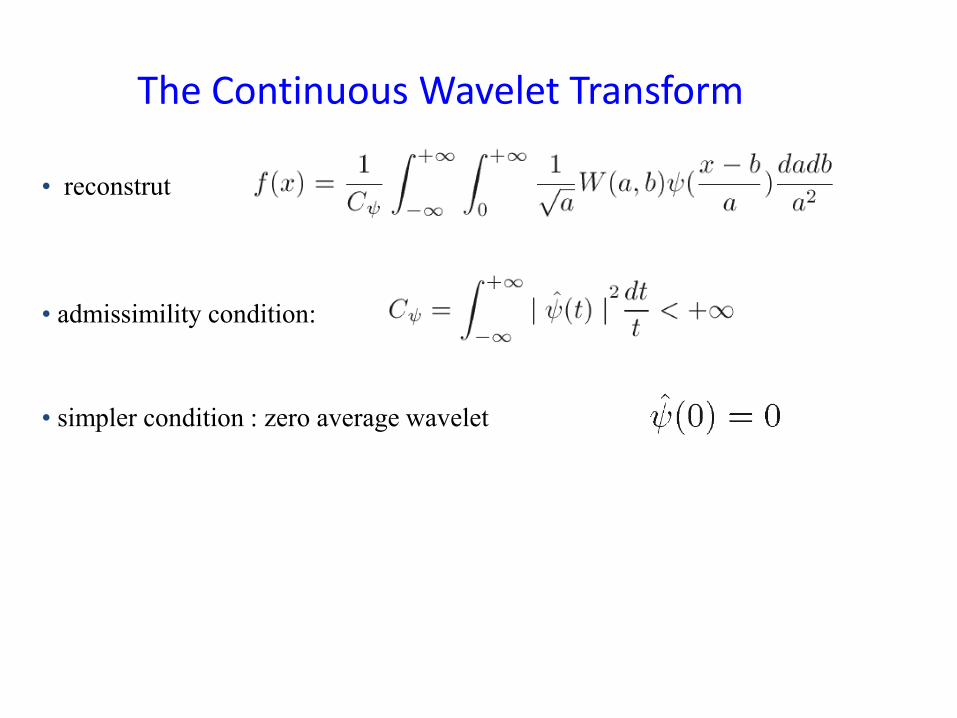
The Continuous Wavelet Transform
• reconstrut
• admissimility condition:
• simpler condition : zero average wavelet

Discrete Wavelet
Scaling function
coefficients
Wavelets
coefficients
Aproximation in
the J scale
Sum of details in
the j scales

Some Aplications of Wavelets in the Analysis of
Complex Systems • Wavelet Denoising Filters (Corso,
Kuhn, Lucena & Thomé, Physica A 318 (2003) 551-561)
• Wavelet Data Compression • Finite Resolution Entropy in Wavelet
Space (Tavares and Lucena, Physica A 2005)
• Models for Correlated Multifractal Hypersurfaces (Tavares and Lucena, PRE 67, 036702, 2003)
• Estimating Thermal Conductivities from Temperature Maps (Roux and Lucena, Inv. Probl. Science Enginnering, 2006)
• Evolution of Sandstone Structures (Hansen, Lucena and da Silva 2010)

Correlações Cruzadas entre Perfis de Poços no Espaço
da Wavelets
• Objetivo: Tentar analisar, com mais confiabilidade, trechos de dois perfis, obtidos em poços de petróleo relativamente próximos, para saber se pertencem à mesma estrutura geológica (por exemplo ao mesmo reservatório).

Standard windowed cross correlation between well logs
in different wells

Results in the standard windowed cross correlation
• Many correlation maxima
• The identification of similar structures is not univocal
• The results are not conclusive

Morlet Wavelet

Cross correlation in the Wavelet space
),(*),(),(, asWgasWfasXWT gf
1 2
,
, 1 2 1 2
( ( | ( , ) |))( , )
( | ( , ) | ) ( | ( , ) | )
f g
f g
S s XWT s aWTC s a
S s Wf s a S s Wg s a
WTCf,g gives really a measure of the COHERENCE between f and g !

“cross wavelet correlation” between the sonic well logs from 1 BAS 68 and 1 BAS 121 wells


Porque o método da correlação cruzada no espaço das
wavelets é mais confiável ?
• Permite computar, visualizar e comparar os coeficientes de correlação em intervalos variáveis de comprimentos de onda e em vizinhanças de larguras também variáveis ao redor de pontos em diferentes posições
• Possibilita verificar se existem correlações entre perfis, em que pontos, e em que escalas. Quando há uma coincidência total, a similaridade é perfeita.
• Serve como uma impressão digital espectral para identificar de uma forma abrangente as correlações ou similaridades entre estruturas geológicas.

Analogia
• O teste do DNA permite identificar com precisão dois indivíduos com características genéticas semelhantes. É uma correlação feita numa sequência de valores ou de códigos em 1 dimensão.
• O método da correlação cruzada no espaço das wavelets é
ainda mais preciso porque exige a coincidência em duas dimensões (escala e posição).
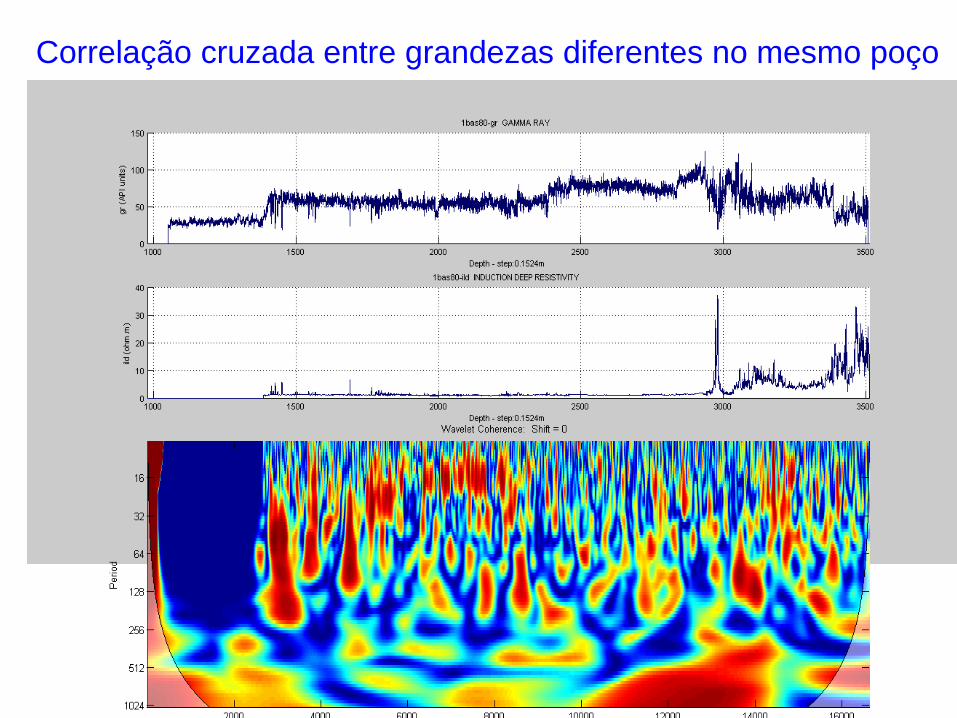
Correlação cruzada entre grandezas diferentes no mesmo poço


Conclusions
• The possibility of analysing simultaneously the correlations between well logs for different depths and different scales increases de degree of confiability in the identification that 2 distinct wellls pass trough the same oil reservoir.
• This method allows to improve the characterization of the geological structures.
• It makes possible a more criterious study of the horizontal continuity of the transitioninterfaces between the geological layers.
• Anallysing the wavelet, coherence between different physical quantities,
in the same well it is possible to predict the lithology around a given well and to discover subsurface regions compatible with the occurrence of hydrocarbons.

Forever young
Long Life to Constantino !

Thank You !


Representações espectrais e correlações em sistemas complexos
• Utilizamos representações espectrais para descrever e caracterizar sistemas complexos. Em particular analisamos esses sistemas em diferentes escalas do tempo e do espaço com o emprego da "Transformada Wavelet" e também em diferentes escalas angulares com a "transformada curvelet". Isto permite estudar correlações cruzadas simultaneamente em várias escalas e a mensuração mais precisa da similaridade entre sistemas complexos.


Desvantagem das Wavelets
• A transformada wavelet dá bons resultados em funções ou dados unidimensionais
• Quando aplicada a objetos bi e tridimensionais, a transformada wavelet não preserva os ângulos
• Há então necessidade de generalizar este conceito para incorporar o caráter direcional

Curvelets
Candès e Donoho 1999-2004
Nova transformação em pirâmide
• Multi-escala
• Multi-orientação
• Escalonamento parabólico (anisotropia)
largura comprimento 2

Curvelets
Podemos pensar nas Curvelets como obtidas através da aplicação de
dilatações, rotações e translações a uma função de forma específica

Curvelets: escala, localização e orientação
As curvelets são parametrizadas pela escala, posição e orientação
Escalonamento
parabólico
Rotação Translação

Enladrilhamento por curvelets

Curvelets em 2D
domínio t - x domínio f – k (Fourier)

Curvelets digitais


Reservatórios de Petróleo
• Heterogeneidades em todas as ecalas
• Comportamento Muito Complexo
P.R. King Physics World

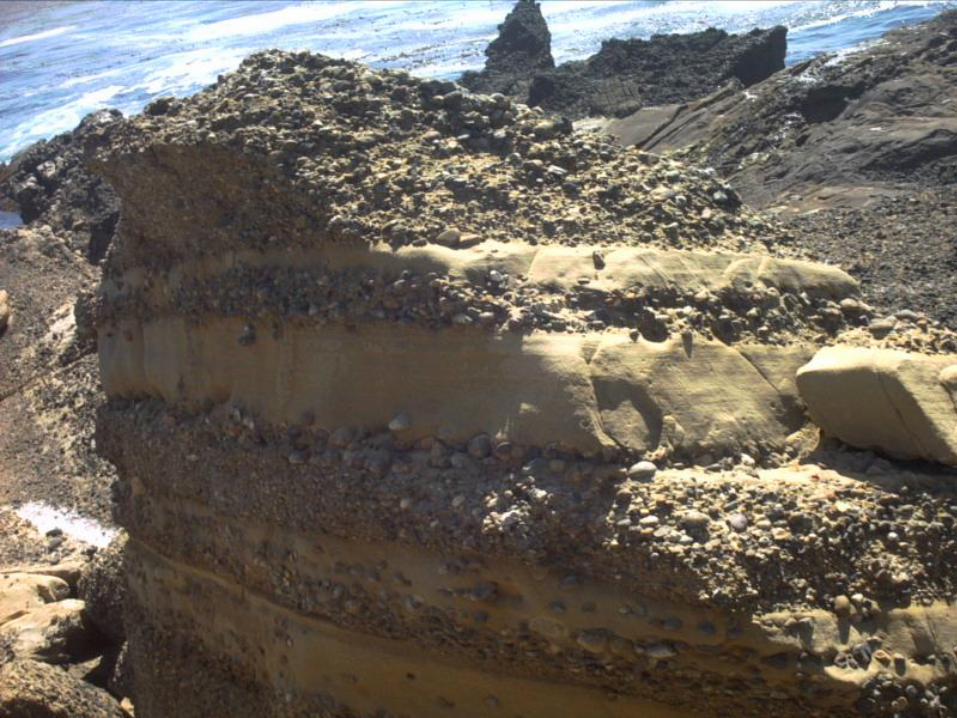


1cm
10m

Petroleum Exploration


Representações para dados sísmicos
Transformada Hipótese subjacente
FK (Fourier) Ondas planas
Radon (Linear / Parabólica) Eventos Lineares / Parabólicos
Wavelet Eventos puntuais (singularidades 1D)
Curvelet Eventos em curvas (singularidades 2D)
Propriedades da Transformada Curvelet
Multi-escala: ladrilhamento do domínio FK
em coroas diádicas
Multi-direcional: coroas subdivididas em
intervalos angulares; no de ângulos dobra em
cada escala
Anisotrópica: escalonamento parabólico
Decaimento rápido no espaço
Localização estrita no espaço de Fourier
“Frame” com redundância moderada


Como expandir uma função numa base wavelet discreta
Funções de escala
coeficientes
Wavelets
coeficientes
Aproximação na
escala J
Soma dos detalhes
nas escalas j

Correlação cruzada padrão entre perfis usando janelas
deslizantes

Resultados da correlação cruzada janelada
• Muitos máximos de correlação
• A identificação de estruturas análogas não é unívoca
• Os resultados não são conclusivos

Transformada em Ondaletas
,)(,),( ,, dxxffasWf asas
s
ax
sxas
1)(,

Ondaleta de Morlet

Um Paradoxo ?

Correlação cruzada no espaço das ondaletas
),(*),(),(, asWgasWfasXWT gf
1 2
,
, 1 2 1 2
( ( | ( , ) |))( , )
( | ( , ) | ) ( | ( , ) | )
f g
f g
S s XWT s aWTC s a
S s Wf s a S s Wg s a

“cross wavelet correlation” entre os perfis sônicos de 1 BAS 68 e 1 BAS 121


Porque o método da correlação cruzada no espaço das
wavelets é mais confiável ?
• Permite computar, visualizar e comparar os coeficientes de correlação em intervalos variáveis de comprimentos de onda e em vizinhanças de larguras também variáveis ao redor de pontos em diferentes posições
• Possibilita verificar se existem correlações entre perfis, em que pontos, e em que escalas. Quando há uma coincidência total, a similaridade é perfeita.
• Serve como uma impressão digital espectral para identificar de uma forma abrangente as correlações ou similaridades entre estruturas geológicas.

Analogia
• O teste do DNA permite identificar com precisão dois indivíduos com características genéticas semelhantes. É uma correlação feita numa sequência de valores ou de códigos em 1 dimensão.
• O método da correlação cruzada no espaço das wavelets é
ainda mais preciso porque exige a coincidência em duas dimensões (escala e posição).

Correlação cruzada entre grandezas diferentes no mesmo poço

Conclusão
• A possibilidade de se observar correlações entre perfis de poços, para diferentes profundidades e em diferentes escalas, simultaneamente, aumenta o grau de confiabilidade na identificação de que dois poços distintos atravessam o mesmo reservatório de petróleo
• Este método permite melhorar a caracterização de estruturas geológicas
• Possibilita ainda o estudo mais criterioso da continuidade horizontal das transições entre camadas geológicas


Wavelets Prós
• Operação automática de Destendenciamento
• Fundamentação Matemática forte
• Escalonamento (scaling) e Renormalização podem ser feitos numa maneira natural
• Podemos escolher diferentes bases
• Análise em Tempo e Freqüência
• A Transformada Wavelet Discreta é mais rápida que a de Fourier

Dados de Sistemas Complexos
• Não Estacionários
• Grandes Flutuações
• Aleatoriedade


Desafios
• Como tratar, analisar e entender os sistemas complexos ?
• Como processar e remover o ruído de dados não-estacionários ?
• Como decompor e estudar estes dados em diferentes escalas ?
• Como achar as melhores representações para “descobrir” estruturas escondidas?