wave data collection western samoa (outer)
TRANSCRIPT

WAVE DATA COLLECTIONWESTERN SAMOA (OUTER)
May 1990 - December 1991
S.F. Barstow and E. OlsenOceanographic Company of Norway A.S jOCEANOR}
January 1993 SOPAC Technical Report 157
This report was originally submitted to SOPAC by the OceanographicCompany of Norway AS (OCEANORI as OCEANOR Report DeN R-92092
Prepared fOf:South Pacific Applied Geoscience Commission (SO PAC)Coastal and Nearshore Program
W AWW" 1])AJI'A ([;(Q)IL,[,]E([;'!TII(Q)N[
~'JJ'JEJ]JfJ §A]OO(Q)A
MAW llm Q ill)!E([;IEOOIDJErn.llw)ll
OCEAN<) K/2~-I( vr«:SAM OAfeskj92.1 0 .26

Oceanographic Company of Norway ASAddress: Pir-Senteret, N-7Offi Trondheim, NorwayTelephone: +47-7-5250 SO, Telefax: +47-7·525033Telex: 55 499 ocea-n
RAPPORT/REPORTTittel/Title Rapport nr./Report no.
WAVE DATA COLLECTION, WESTERN SAMOA (OUTER), OCN R-92092MAY 1990 • DECEMBER 1991 .Oppdragsgiver/Client Prosjektnr./Project no.
Ministry 01 Foreign Affairs 28400
Tilgjengelighet/ AvailabilityKontaktperson/Client Reference: Mose Fua Restricted
Saksbehandler / Author Dato/Date3 November 1992
S.F. Barstow and E. OlsenISBN
Sammendrag/ Abstract
Since May 1990 waves have been recorded south of Savan. Western Samoa. in location 14°03.5'5.l72'15.0·W.
The measurements have been financed by NORAD. organized through NECOR and carried out bySOPAC. Techsec.
This report presents statistics for wave height, wave periods and wave energy for the year 1990. Specialevents such as tropical cyclones am long swell conditions are also presented.
.
Stikkond/Keywords ~~g~erskrift/0~edignature
sv~an:;;Department Manager
WavesEnergyOeeanography
OCEAN0R/28400{W _SAMONeskm.1 t .03

Page i
Contents
Introduction .
2 Measurement Programme 32.1 Overview of Measurement Sites 32.2 Instrumentation System 4
2.2.1 Datawell Waverider Buoy . . . . . . . . . . . . . . . . . . . . . . . . . . . . . . .. 4
3 Processing of Data . . . . . . . . . . . . . . . . . . . . . . . . . . . . . . . . . . . . . . . . . . . . . . .. 6.3.1 Data Processing within the Waverider Buoy . . . . . . . . . . . . . . . . . . . . . . . .. 6
3.1.1 Data Processlng . OCEANOR System 63.1.2 Data Processing . Datawell System. . . . . . . . . . . . . . . . . . . . . . . . .. 8
3.2 Communication with ARGOS. . . . . . . . . . . . . . . . . . . . . . . . . . . . . . . . . .. 143.3 Inhouse Data Processing. . . . . . . . . . . . . . . . . . . . . . . . . . . . . . . . . . . . . .. 14
3.3.1 Routine Handling Procedure 143.3.2 General............................................. 153.3.3 Procedure........................................... 15
4 Accumulated Wave Statistics. . . . . . . . . . . . . . . . . . . . . . . . . . . . . . . . . . . . . . . .. 174.1 Data Recovery. Average Conditions and Maximum Values 17
5 Wave Statistics for 1991 . . . . . . . . . . . . . . . . . . . . . . . . . . . . . . . . . . . . . . . . . . .. 215.1 Data Recovery, Average and Maximum Values 215.2 General Description of the Wave Conditions in the South Pacific during
1991 225.3 Events Effecting the Measurements (Log) 335.4 Special Events 34
5.4.1 Long Swells in January 1991 345.4.2 Energetic Swell; Iune 1991 345.4.3 Cyclone Val; Effects Seen at Funafuti; December 1991 34
6 Conclusions. . . . . . . . . . . . . . . . . . . . . . . . . . . . . . . . . . . . . . . . . . . . . . . . . . . .. 50
7 References. . . . . . . . . . . . . . . . . . . . . . . . . . . . . . . . . . . . . . . . . . . . . . . . . . . . .. 51
8 Project Reports 528.1 1990 Annual Reports 528.2 1991 Annual Reports . . . . . . . . . . . . . . . . . . . . . . . . . . . . . . . . . . . . 528.3 Other Reports 53
OCEANORI28.w<1!W _SAMOAleskfl2.10.26

Page jj
APPENDIX A ACCUMULATED WAVE STATISTICS FOR 1990 - 1991
APPENDIX B WAVE STATISTICS FOR 1991
OCEANORj28400/W _SAMOA/esk,l92.10.26

Page iii
List of Symbols
Wave Parameters
(Definitions. see section 3.1)
HmO(m) ¥ significant wave heightTp (,)- peak periodTm-IO (s) - energy wave periodTm02 (s) - mean wave periodhOI (kW/m) ~ total wave power fluxJT_60 (kW/m) - mean wave power over time (with records> 60 kW/m rejected)m, - spectral moments, m, = JS(f)fldfS(f) (m's) - wave spectrum as a function of frequency
Time
We note that unless specifically stated all times referred to in this report are UTC times (GMT).
Statistical Tables in Appendix A and B
DATA COVERAGE Percentage of good quality 3 hourly data samples within observationperiod
CUM PROB. Cumulative probability distributionMARG.PROB. Probability distributionAVERAGE Average value of one parameter (for each class of a second parameter)ST.DEV. Standard deviation of one parameter (for each class of a second
parameter)
OCEAN0R/28400/W _SAMOA/esk/92.IO.26

Page 1
1 Introduction
The wave power data collection programme in the South Pacific started in 1987. The work. has beenfinanced by the Royal Norwegian Ministry for Development Cooperation, NORAD and organizedthrough an agreement between the Norwegian Engineering Council on Oceanic Resources, NECOR,and the Norwegian Hydrotechnical Laboratory, NHL a member of the SINTEF Group. In 1990, theOceanographic Company of NOI'VIayA/S, OCEANOR, signed an agreement with NECOR and tookover NHL' s role in the project. The wave measurement programme provides technical support to theintergovernmental organization SOPAC (South Pacific Applied Geoscience Commission) through itsTechnical Secretariat (TechSec) in Suva, Fiji.
The wave measurement programme was proposed by NHL in 1985 as the most appropriatecontinuation of Norwegian NECOR organized assistance to the SOPAC region, following the one-yearstay at TechSec in 1984 by one of their oceanographers. After a visit to Norway by Cruz Matos ofTechSec, SOPAC endorsed the programme.
A TechSec technician, James Kamsoo, was trained in Norway in 1985. Regretfully he resigned fromSQPAC TechSec in January 1989. In 1986 the first two buoys were delivered. After considerable delaythe buoys were deployed in April 1987 at Tongatapu, Kingdom of Tonga, and in July 1987 atRarcronga, Cook Islands, by TechSec. In July 1989 a third wave buoy was delivered and deployed inWestern Samoa. Another two buoys were delivered in December 1989. One was deployed in Tonga.In 1990 two more buoys were delivered and deployed off Funafuti in the Tuvalu group and EfateIsland in the Vanuatu group (see Fig. 1.1). In June 1991 a Waverider buoy was also deployed southof Kadavu. Fiji.
While TechSec was responsible for deployment and servicing. NHL, and from 1990, OCEANOR, wasresponsible for procurement and for the data processing and analysis. The data are reported in separatesummary reports for each location and year. Data are presented as plots and statistical tables for eachyear and accumulated years.
As part of the agreement between NECOR and OCEANOR, an engineer from OCEANOR was in 1990assigned to SOPAC TechSec for 18 months. to take charge of the measurements and training withinthe wave programme.
OCEANeJR/2R..\IHl,w _SAMOA/eskJ92.10.26

Page 3
2 Measurement Programme
2.1 Overview of Measurement Sites
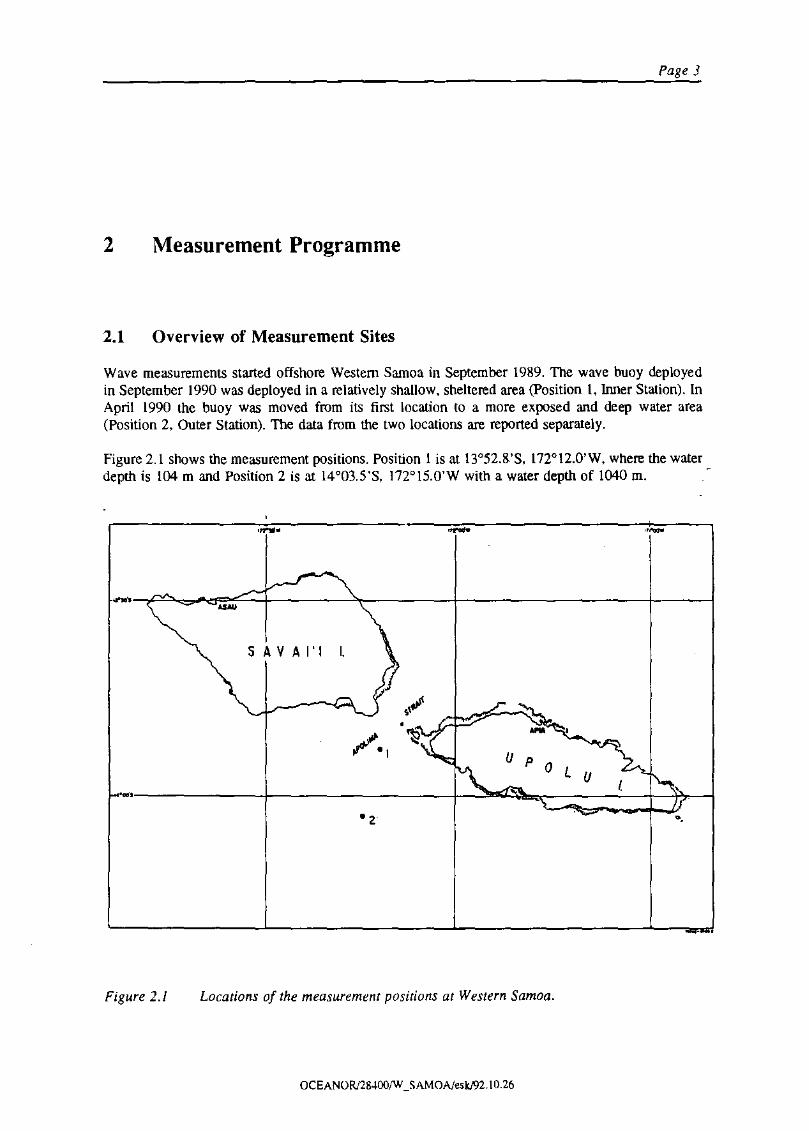
Wave measurements started offshore Western Samoa in September 1989. The wave buoy deployedin September 1990 was deployed in a relatively shallow, sheltered area (position I, Inner Station). InApril 1990 the buoy was moved from its first location to a more exposed and deep water area(Position 2, Outer Station). The data from the two locations are reported separately.
Figure 2.1 shows the measurement positions. Position 1 is at 13°52.8.'S, 172°12.0'W, where the waterdepth is 104 m and Position 2 is at 14°03.5'S, 172°15.0'W with a water depth of 1040 m.

Page 4
2.2 Instrumentation System
The instrumentation system consists of 3 main components:
a) Datawell wavertcer buoyb) Data processing in the Waverider buoyc) Satellite transmission via the Argos system.
2.2.1 DATAWELLWAVERIDER Buoy
The Waverider is a surface-following, spherical buoy with a diameter of 90 em used to measure waveheights.
The Waverider is manufactured by Datawell b.v. in the Netherlands. The buoy senses the verticalacceleration. This is twice integrated in the buoy in order to give a measure of the water surfaceelevation.
The Waverider accelerometer is mounted on a stabilized platform having a natural period of40 seconds and a critical damping of 0.8 for amplitudes larger than 2°. The resulting sensitivity to-horizontal accelerations is below 3%.
A brief summary of specifications given by the manufacturer is given below:
The amplitude and phase transfer functions of the Datawell Wavertder, resulting from the doubleintegration of acceleration to heave are shown in Fig. 2.2.
OCEAN0R!28-l.00/W _SAMOA/eskJ92.10.26


Page 6
3 Processing of Data
3.1 Data Processing within the Waverider Buoy
The wave buoy is equipped with the ARGOS system for satellite transmission. The buoy has nointernal logging of data. The data transmitted are computed from the raw wave measurement timeseries that are processed internally in the buoy. Two processing systems and three different outputformats have been used at different times. The first processing/output system was delivered byOCEANOR. The second processing system and second and third output formats were delivered byDatawell as an integrated part of the Waverider. In the following is given a detailed description of theon-board processing and contents of the Argos message for each configuration Table 3.I gives•..however, a quick reference to data availability.

In addition to the most recent data set. data sets from the previous and previous but one data cycle (T-3 and T-6 hours) are also transmitted to ensure 100% data recovery.
More details and technical specifications can be found in Kollstad and Carstens (1988).
3.1.2 DATA PROCESSING· DATAWELL SYSTEM
In the following. the parameters which are computed and transmitted to the ARGOS receiving stationfrom the Datawell system are described.
3.1.2.1 Standard Datawell ARGOS Message
Fourier transforms are made of 200 second periods of heave data. The first and the last 25 secondsof the 200 seconds data blocks are tapered (cosine tapering) to minimize leaking of energy to ot.herfrequencies. The spectral density is averaged over 8 consecutive 200 seconds data blocks which thusresults in spectral estimates with 16 degrees of freedom and a frequency resolution of 0.005 Hz. Thespectral density function is compressed for transmission to 28 8-bit nwnbers.
OCEAN0R/28400!W _SAMOA/eskJ92.10.26


Page 12
3.1.2.2 Revised Datawell ARGOS Message
The ARGOS message described in section 3.1.2.1 above does not allow for buffering of old data (i.e.transmission of the latest and previous messages). This is essential near the equator due to herealtively poor coverage of the ARGOS system in this error. As a result of this need for improved d.uarecovery, OCEANOR specified a new method of compressing the Waverider spectra allowing alsobuffering of the previous record (T~3 hours) to be carried out. This method is based on the dr.tacompression technique used by Datawell in their Directional Waverider buoy.
From inspection of Table 3.3 one can see that there are basically two wave spectra stored on the
ARGOS message together with the 4 wave parameters, ~. Trn-10, Tp and Tm02.
The most recent spectrum is transferred in bytes 18 ~ 32 of the 32 byte message whilst the previousspectrum (T-3 hrs) is stored in bytes 2 -18.
Every three hours one spectrum is calculated and updated for satellite transmission. Every satellitetransmission during the next three hours contains:
1. the latest updated spectral density function2. time elapse between updating and moment of transmission3. spectral density function which was updated three hours earlier.
For assembly of the message, the frequency range of the spectrum is divided into 13 bands, each
containing a certain fraction of the total variance. The square root of the total variance r;;;: is given
as an eight bit nwnber n, and is decoded from r;;;: '" 16(exp(n/64) - I) ern. Its range is 8.44 m.Knowing the total variance allows the wave spectrum to be computed in the 13 frequency bands fromthe variable band widths.
The frequency band widths are given as 6 bit numbers n; '" .04(exp(n/32)-I) Hz (BI up to 814).
Further. the spectral peak, Tp, mean wave period. Tm02, and energy period Tm-IO are given as eightbit numbers. with all wave period parameters retrieved by T '" 4OO/n.Time elapsed is a three bitnumber in byte 17. l:1T '" .5 n hours. Battery voltage is a three bit number in byte 17.V '" 7 + 2 nvolts.
OCEANORj28-l.00/W _SAMOA/esk./92.1O.26


Page 14
3.2 Communication with ARGOS
The ARGOS system offers capabilities for satellite based location of fixed and moving platforms, inaddition to the collection of environmental data.
ARGOS is the result of a cooperative venture between the Centre National d 'Etudes Spatiales (CNES.France). the National Aeronautics and Space Administration (NASA. USA) and the National Oceanicand Atmospheric Administration (NOAA. USA).
The ARGOS onboard package is carried by NOAA satellites. Two space craft in circular, polar orbits(altitude approximately 800 Ian). are operationally scheduled to provide the ARGOS system withcomplete global coverage.
User relations and technical and administrative management are handled by CLS/Service Argos inToulouse. France.
Each time the ARGOS Processing Center receives a telemetered data set. the computer determines theplatform location and processes the sensor data for the messages contained in the data set. The twosets of results (location and sensor data) are pooled. then stored on disk.
The disk file contains the most recent and significant message for each platform in the ARGO~system. It is therefore updated each time a new data set is processed. Data are transferred online everyday to OCEANOR's VAX computer for control.
The file also contains the complete set of consecutive messages generated by all platforms during thecurrent two-week period. Identical consecutive messages for any given platform in a single satellitepass are replaced by a single message, the last in the series. Each message is also assigned a valuecalled the compression index. stating the number of identical messages received consecutively. Themessages are sorted by platform number and in chronological order of satellite reception.
The data is fed into a data bank containing all the results for the current month and the three previousmonths. Updating is done twice a month. Data for each month are transferred to OCEANOR bymagnetic tape for in-house analysis.
The ARGOS system is documented in the "ARGOS User Manual" and the "Guide to the ARGOSSystem" issued by the ARGOS User Office.
3.3 Inhouse Data Processing
3.3.1 ROUfINE HANDLING PROCEDURE
The ARGOS data are handled in two modes:
I. Daily reception and processing for near real time data from the buoys. These data aretransmitted on data line from ARGOS to OCEANOR. To minimize the tete costs a stronglyreduced number of messages selected by ARGOS is transmitted (TXC format).
2. Monthly updating of the wave data base by processing all transmitted data since last month.These data are sent to OCEANOR on a monthly backup tape from ARGOS (DS format).
OCEAN0RJ28~OOfW _SAMOA/esk/92.10.26

Page 15
Except for the different ways of data distribution and different format of the raw ARGOS data. theinhouse data processing is exactly the same for the two runs.
3.3.2 GENERAL
The wave analysis is performed internally in the buoys. and the result is stored on a compressedARGOS message consisting of 32 bytes as described in section 3.1. The transmission rate by the PTf(Platform Transmitter Terminal) in the buoy is once per minute. However. the number of messagesdistributed by Service ARGOS is reduced by two factors:
1. The polar orbiting satellite is visible from the buoy at irregular intervals. If one divides theday into 3 hourly segments. the satellite will only on average be visible at least once during6 of these periods at the latitude of Tongatapu. Up to 8 hours of continuous lack of visibilitymay occur. With 30 minutes sampling rate in the buoy (I.e. wave data updated to the PT'Teach VI: hour) this effect gives maximum 25% data recovery out of all possible !h hourlyrecords, while 75% recovery can be attained if data is updated 3 hourly. Buffering of theprevious 3 hourly wave record (i.e. both the latest and the last but one data sets transmitted)increases the data coverage to 98%. The three different data transfer schemes used weredescribed in Section 3.1.
2. Service ARGOS reduces redundant information by extracting one message of each contiguousseries of equal PIT transmissions. limited to a period of up to IS minutes. The number ofmessages from ARGOS then becomes about 1500 and 500 per month with 30 and 180minutes sampling. respectively.
The inhouse data processing has two purposes which require slightly different data control procedures.One purpose is to monitor the function and position of the buoy, and the other is to establish the wavedata base with quality controlled wave data. It is an inherent problem that errors originating from thesatellite transmission may cloud the quality of the buoy data. This problem is solved by a carefulsetting of error criteria on the first automatic inhouse data control. The buoy function parameters(clock and battery) and the position are next checked. Finally, a manual check of the physical valuesis undertaken.
3.3.3 PROCEDURE
The data processing is performed as follows:
I. Import of raw ARGOS data
An import module standardises the raw data on the ORKAN file format for compact storageand simple data retrieval.
2. Selection of best sample
A selection module picks out the best set of wave parameters for each sampling period.
3. Bit unpacking
This routine unpacks the information in the ARGOS bitstream into separate computer words.
OCEANORj28.l.00jW _SAMOA/eskf)2.1O.26

Page /6
4. Data control and correction, including
position checkmissing data
- illegal valuesperiods of constant (flat) values,spikesmanual checkcorrection by linear interpolation to fill gaps (not carrted out on the data reportedhere)
The error criteria are set for each of the individual wave parameters that are measured.
5. Conversion to physical values.
6. Correction by:
- Removal of periods when the buoy is far out of position or on land.
The data are stored on the ORKAN data base, organized as one separate file for each measuring site. -Different buoy versions are handled by the data base. Results from each of the processing steps are-also stored on the ORKAN data base to simplify tracing of special events. .
OCEANORJ2R-IOOjW _SAMOA/esk,m.l0.26

Page 17
4 Accumulated Wave Statistics
In this section are presented wave statistics for Western Samoa from the start of measurement in May1990 to December 1991. A maximum of one measurement each third hour is included in the statistics.For periods where measurements are updated every half hour. the nearest measurement to eachsynoptic hour (0, 3. 6 .... UTe) is picked out. No interpolation is carried out to fill in gaps due. forexample, to poor coverage from the satellite.
4.1 Data Recovery, Average Conditions and Maximum Values
Full wave statistics are presented in Appendix A.
Included are the following:
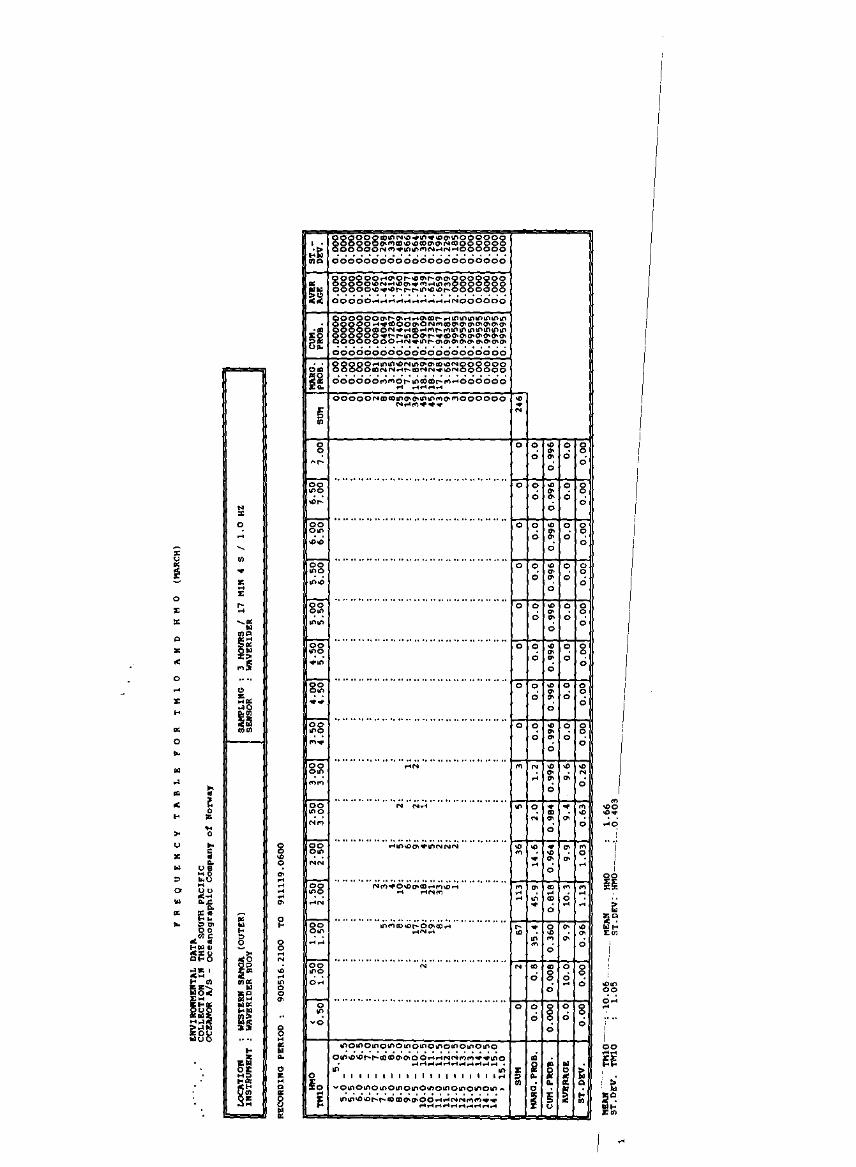
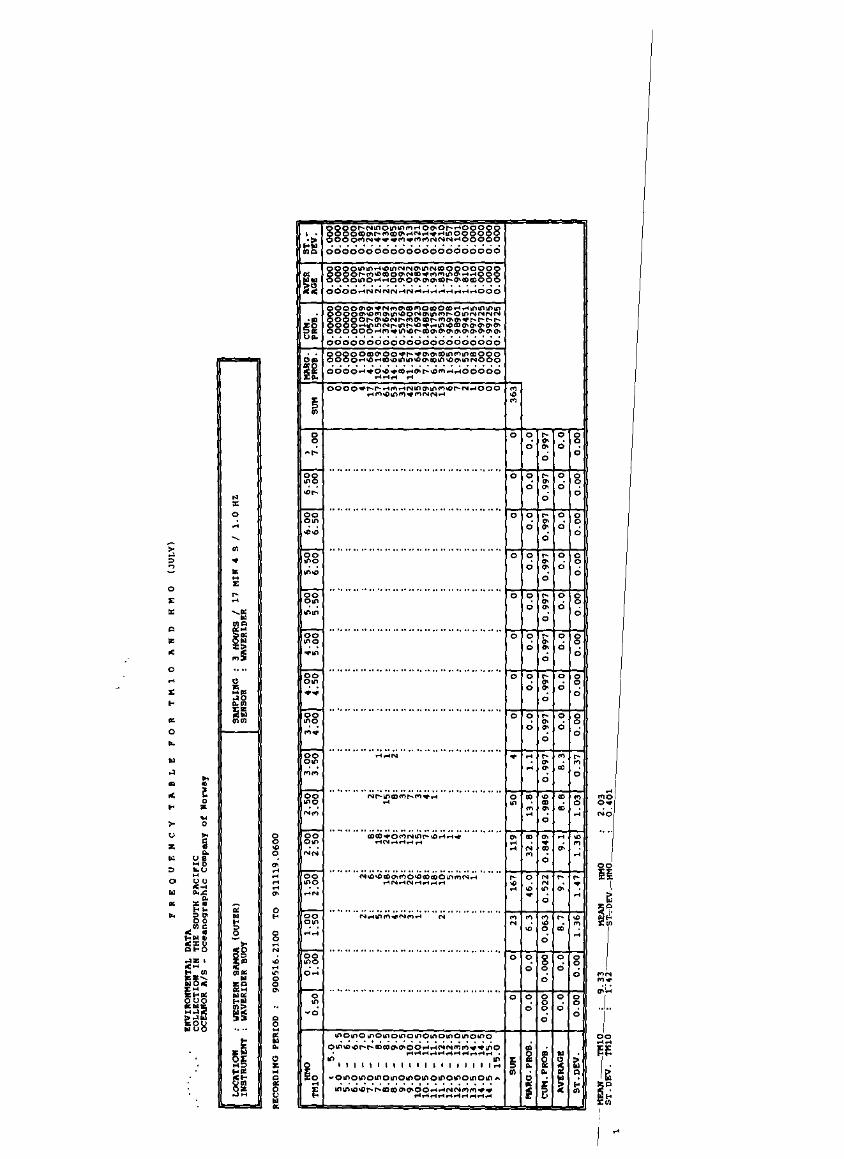
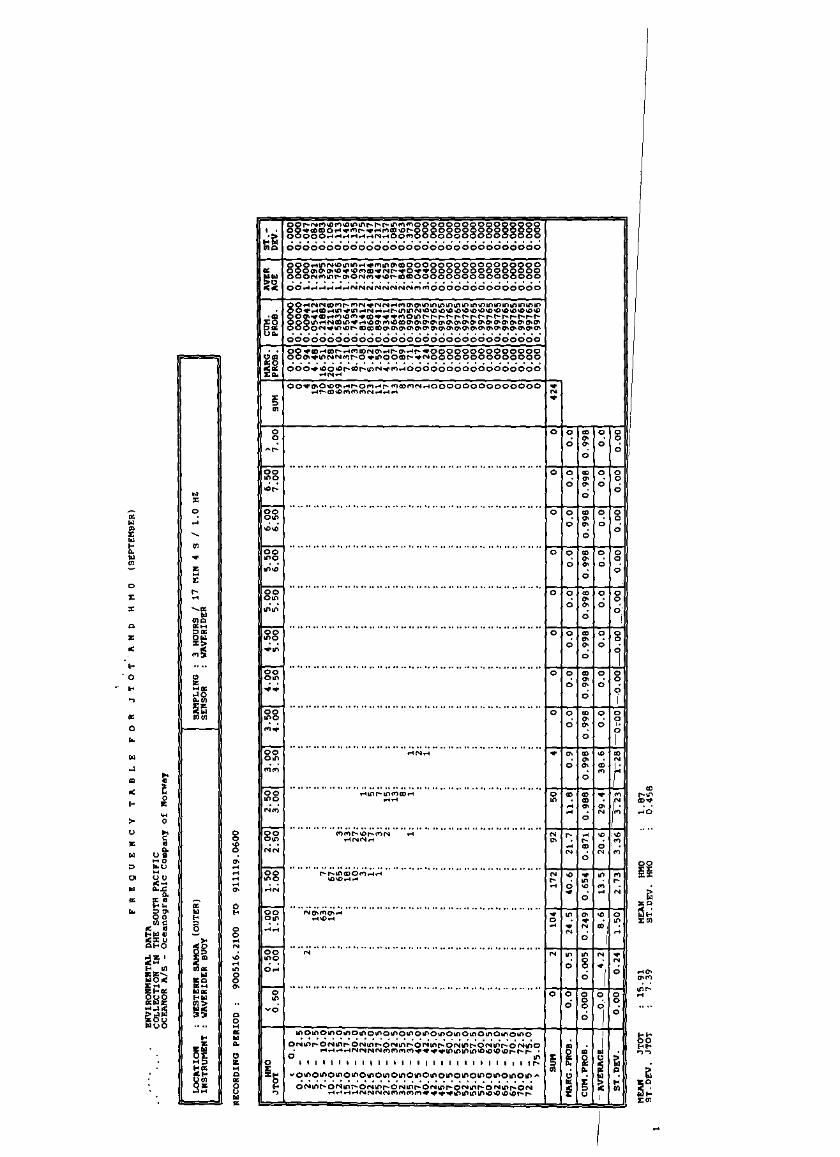
• Joint frequency of occurrence tables for HmO • Tm-If), HmO - Tp for all datacombined and monthly classes.
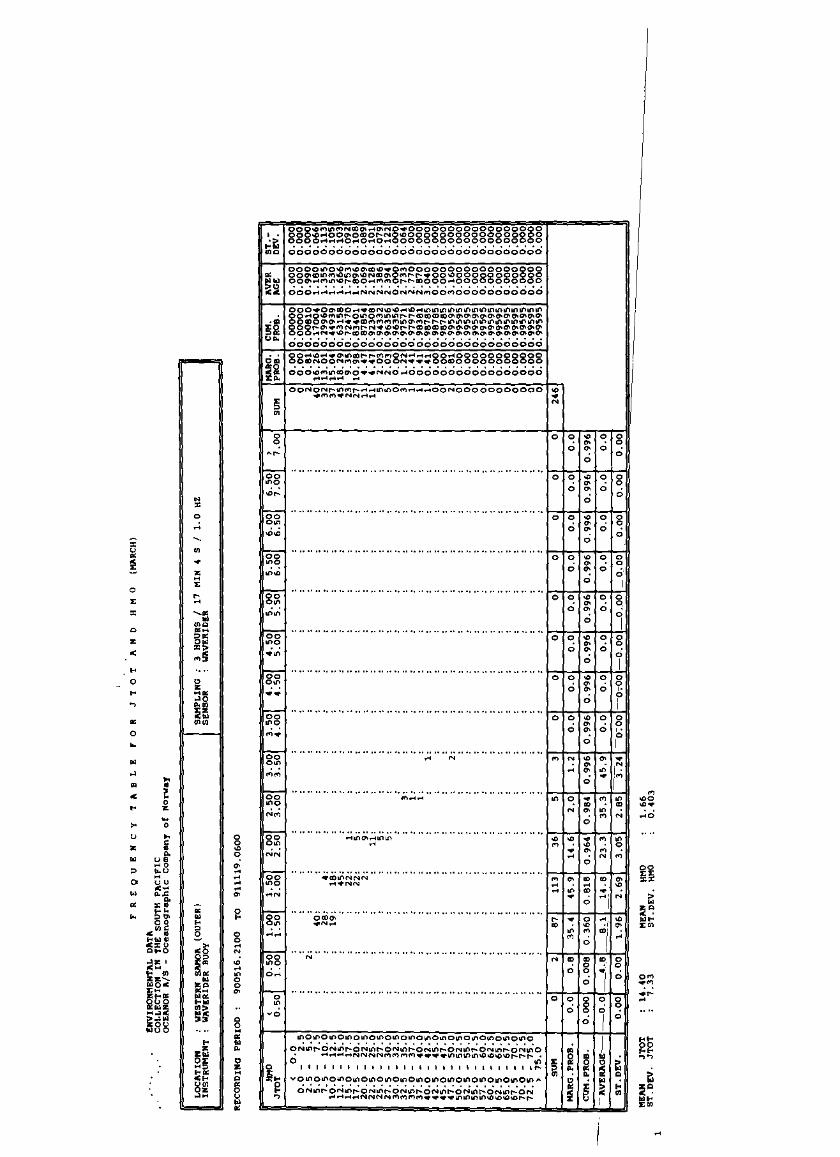
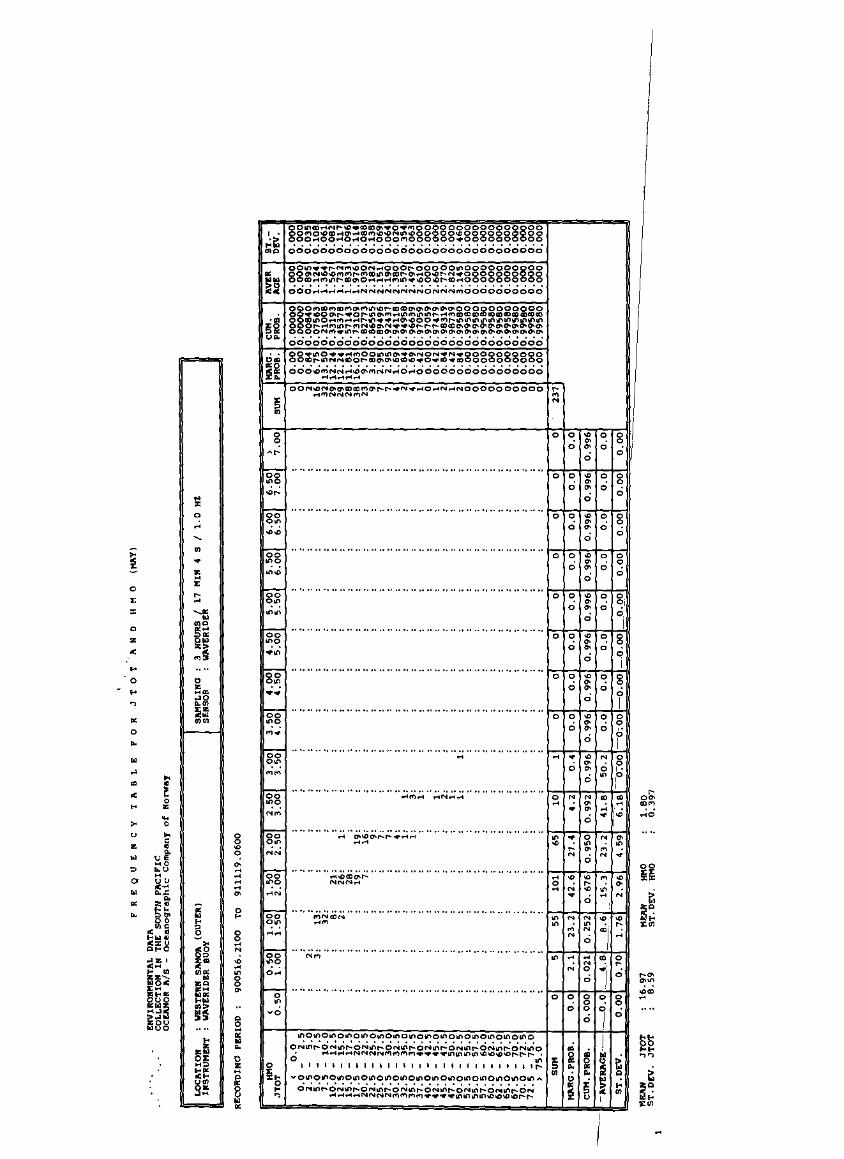
• Joint occurrence tables for HmO . JTOl(all data).
• Monthly frequency of occurrence table for Jr.sc-
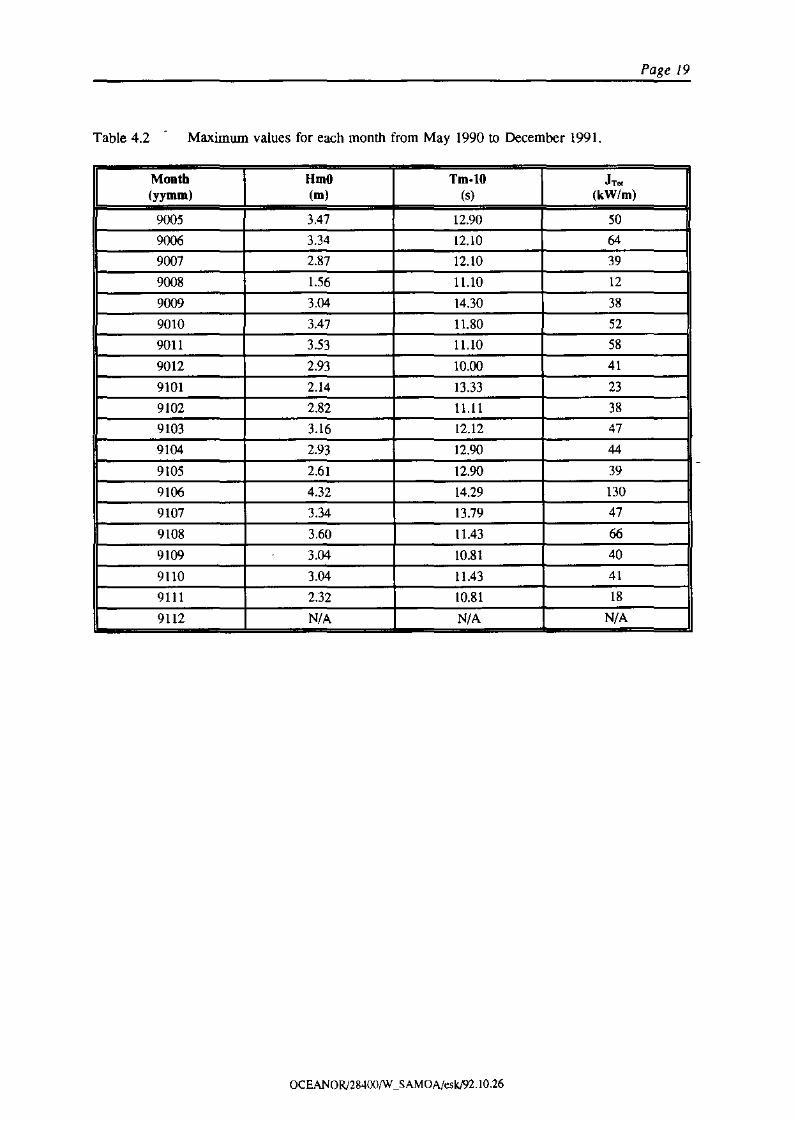
The data recovery and mean values of HmO. Tm-If) and JT..«Iare summarised in Table 4.1 for theentire measurement period and the highest measured values for HmO. Tm-H) and JTOIare given inTable 4.2 on a monthly basis again for the entire measurement period. In Table 4.3 are given theaverage wave power (JT..«I)for each month to give an indication of the inter-monthly variability inwave power.
OCEANOR/28-1.00!W _SAMOA/esk/92.\ 0 ,26


Page 21
5 Wave Statistics for 1991
In this chapter are presented summary wave statistics for Western Samoa for 1991 (section 5.1), anoverview of wave conditions in the South Pacific during 1991 (section 5.2), information on eventswhich affected the data recovery in 1991 (section 5.3) and a description of a number of special eventspicked out from the data collected in 1991 (section 5.4).
5.1 Data Recovery, Average and Maximum Values
Full wave statistics for 1991 are presented in Appendix B, including the following:
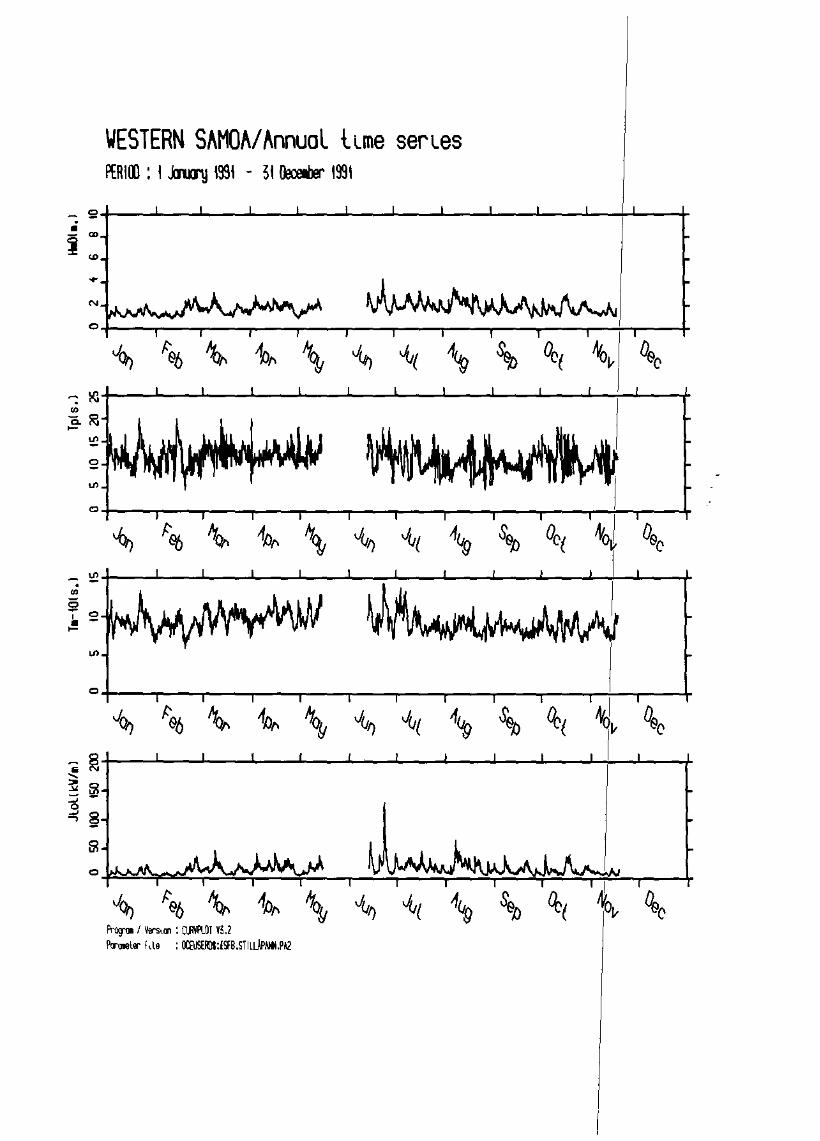
• Time series plots for HmO, Tp, Tm-tO and JTOI for each month in 1991.
• Joint frequency of occurrence tables for HmO - Tp and HmO - Tm-tO for the yearas a whole.
Data recovery and mean values are summarised in Table 5.1 for 1991 and the highest measured valuesfor HmO, Tm-tO and JTOI were shown in Table 4.3 on a monthly basis.
OCEANOR/2R.+Oll(W _SAMOA/esk/92, 10.26

Note: JT-60 is computed by averaging JTOI over the data class. rejecting high values of JT01(> 60 kW/m) which would otherwise significantly bias the average conditions.
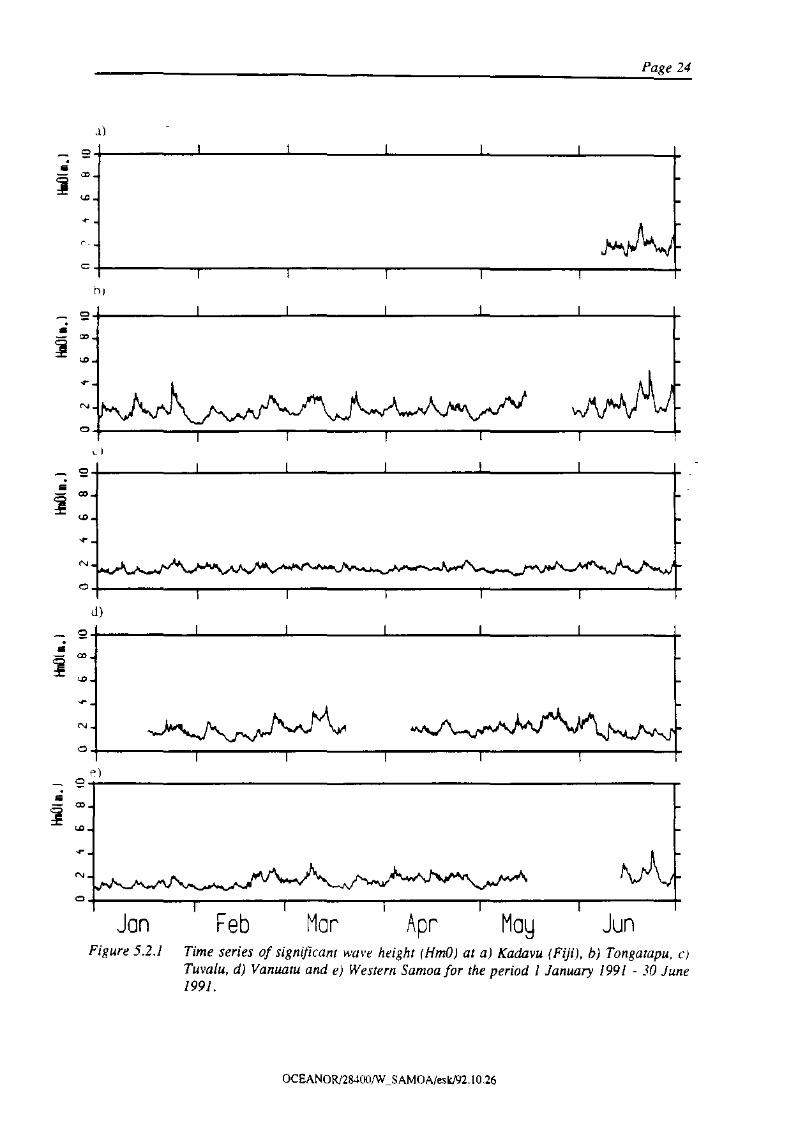
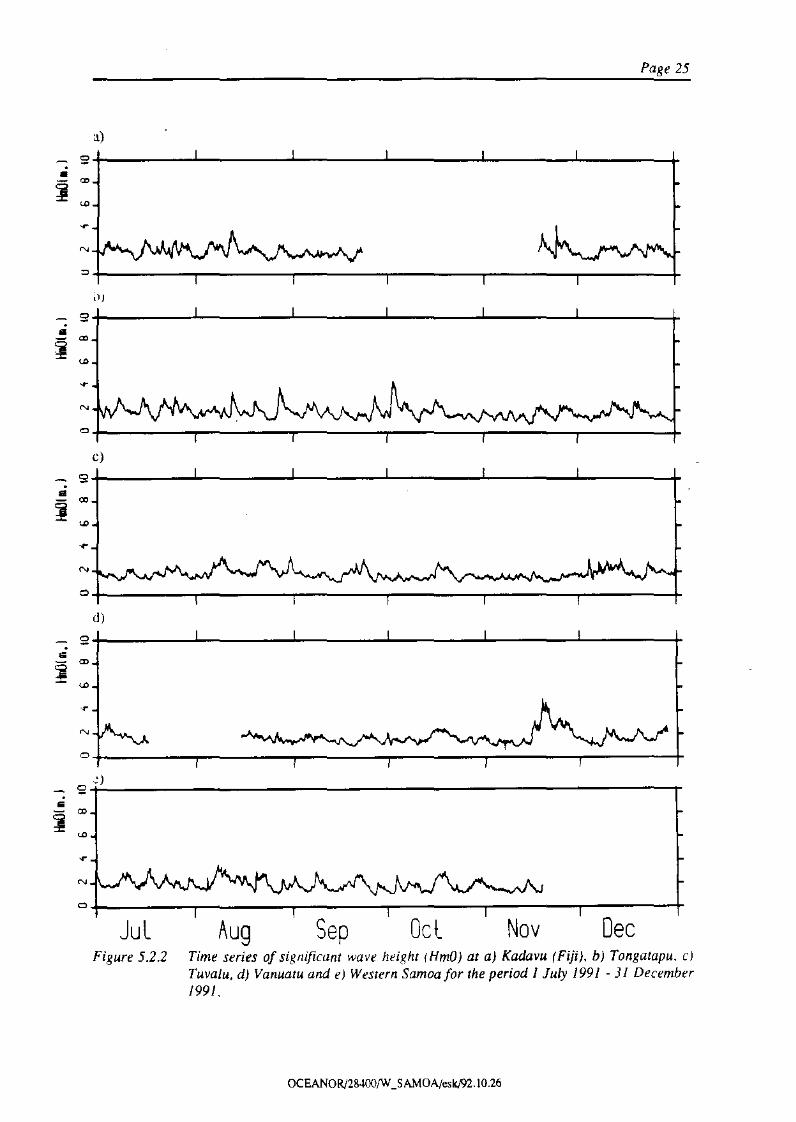
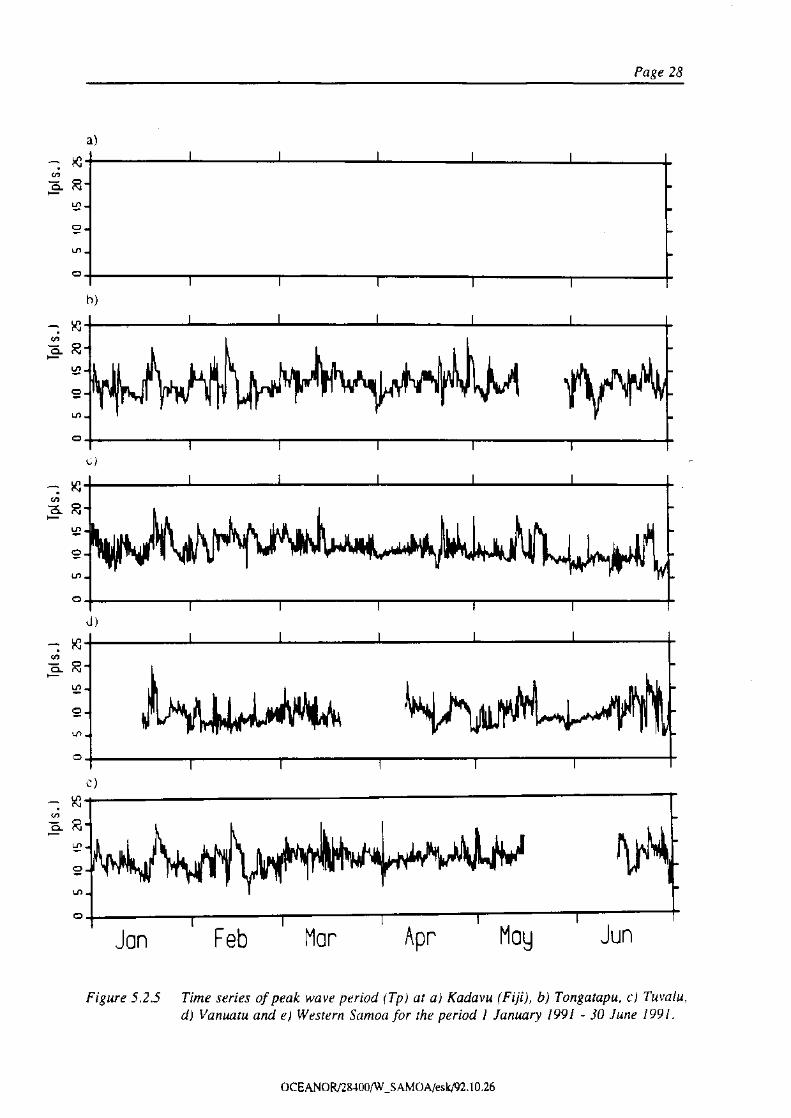
5.2 General Description of the Wave Conditions in the South Pacific during1991
Time series of significant wave height (HmO). wave energy period (Tm-Hi), peak period (Tp) andwave power (JToJ are shown in Figs. 5.2.1 - 5.2.8 for all stations operating in 1991 as part of theSOPAC measurement campaign.
The peak. period. Tp, gives a rough idea of the relative importance of wind sea and swell at thedifferent measurement stations. Wind sea and swell dominated seas can be roughly classified byTp < 10 sees. and Tp > 10 sees. except during storms which are relatively infrequent. We havecomputed the frequency distribution of peak period. Tp, for all stations except Fiji for 1991. Theseare presented in Fig. 5.2.9 for the year as a whole. for a summer period (September - March) and awinter period (April - August).
OCEANoR!2lWOO!W _ SAMOAjesk;'92.1O.26

Page 23
We can note-the following from these plots:
• Tongatapu and Western Samoa have similar swell dominated conditions throughoutthe year.
• Vanuatu experiences strongly wind sea dominated conditions which has no strongseasonality.
• Tuvalu has a fairly broad, almost bimodal distribution suggesting that wind sea andswell are equally important. There is, however, a relatively strong seasonality withwind sea conditions more frequent in winter (April - August).
1991 was fairly uneventful compared to 1990 at least as far as the collected data are concerned withno measurement of significant wave height exceeding 6 m. There were, however, a number of notablecyclones which affected the region late in the year, most notably Cyclone Val which devastatedWestern Samoa. Unfortunately the Samoa buoy was not deployed during the storm. Wave data were.however, available during Cyclone Tia which affected the Vanuatu group from 18th - 20th November.The buoy deployed off Efate island recorded up to 5 m significant wave height during that storm.
The highest waves of 1991 occurred, however, at Tongatapu on the 22nd June as the result of an_unusually powerful swell emanating from a powerful depression centred over North Island, NewZealand. Significant wave height over 4 m was also registered the day after at Western Samoa as aresult of the same swell event. Fiji, on the other hand. seems not to have been particularly affecteddespite good exposure to the south.
OCEANOR!28-100/W _SAMOA/esk/92.1O.26


Page 33
5.3 Events Effecting the Measurements (Log)
April 1990
On 11 April the wave buoy was shifted from its location south of Apolina (Position 1) to a locationt 1 nautical miles further south. New mooring and processor software were installed. Two days laterthe buoy came adrift.
On Tuesday 17 April Apia Observatory was notified about the drifting buoy. they organised with theFisheries Section to rescue the buoy.
On Friday 20 April the buoy was recovered and brought ashore by the fisheries vessel "TautiMatapaiapaia". The rubber cable and the safety line in the mooring had been cut just underneath thewave buoy, most likely with a knife.
May 1990
On 16 Maya new mooring and the same wave buoy were installed at the previous location.
JUly 1990
On 8th July the buoy came adrift again. This time it was rescued by the Police Patrol Vessel"Nafanua" on 17 July. The breakage was this time on the rope between the rubber cable and the sub-surface buoy.
August 1990
On 29 August a new mooring and the same wave buoy was re-installed in the previous location.
Through the rest of the year the buoy remained in position, and the data coverage was 100%.
March 1991
On 6 March the buoy and mooring was serviced. The batteries in the wavertccr was changed.
April - May 1991
On 30 April the wave buoy came adrift. It was rescued and brought ashore 16 May.
June 1991
The same buoy was again installed on 13 June in its previous location.
OCEAN0Rj28400!W _SAMOAjesk/92.\ 0 .26

Page 34
November - December 1991
For unknown reason the wave buoy started to measure and transmit unreliable data on 19 November.On 8 December the buoy came adrift and ended on the beach in a village on Savaii to December.
5.4 Special Events
5.4.1 LONG SWELLS IN JANUARY 1991
During the period 19th - 21st January 1992 long swells were detected at alI the stations operating atthat time. Peak period. Tp. reaches 20 sees. at various times at all stations (Fig. 5.4.1). This seems tohave been a result of swells arriving both out of the south and north at about the same time.Simultaneous wave spectra for the 19th - 21st January are presented for all stations in Fig. 5.4.2. Longperiod wave energy can be seen to increase at Tongatapu late on the 19th. the spectral peak at about0.05 Hz (20 secs.) increasing gradually over the next few hOUTS,dominating the wave spectrum afterabout 0600 UTe on the 20th. A secondary swell was also present peaking at about 0.07 Hz for thesame period. Long swell energy seems also to increase late on the 19th at Vanuatu. following a similarsequence as at Tongatapu. Similarly. a secondary swell is present at Vanuatu. Western Samoa begins-to see the swell somewhat later on the 20th. the swell first dominating the spectrum at about0300 UTC on the z lsr, with again a secondary swell present.
Finally, the Tuvalu Waverider starts recording long swells at about 0600 on the 20th. becomingdominant at about 0300 on the 21st. This swell has probably a different source as there is no timedelay between the swell arrival at Samoa and Tuvalu. The Tuvalu swell probably derives from apowerful storm (down to 950 hPa central pressure) which had been present over the previous days inthe North Atlantic.
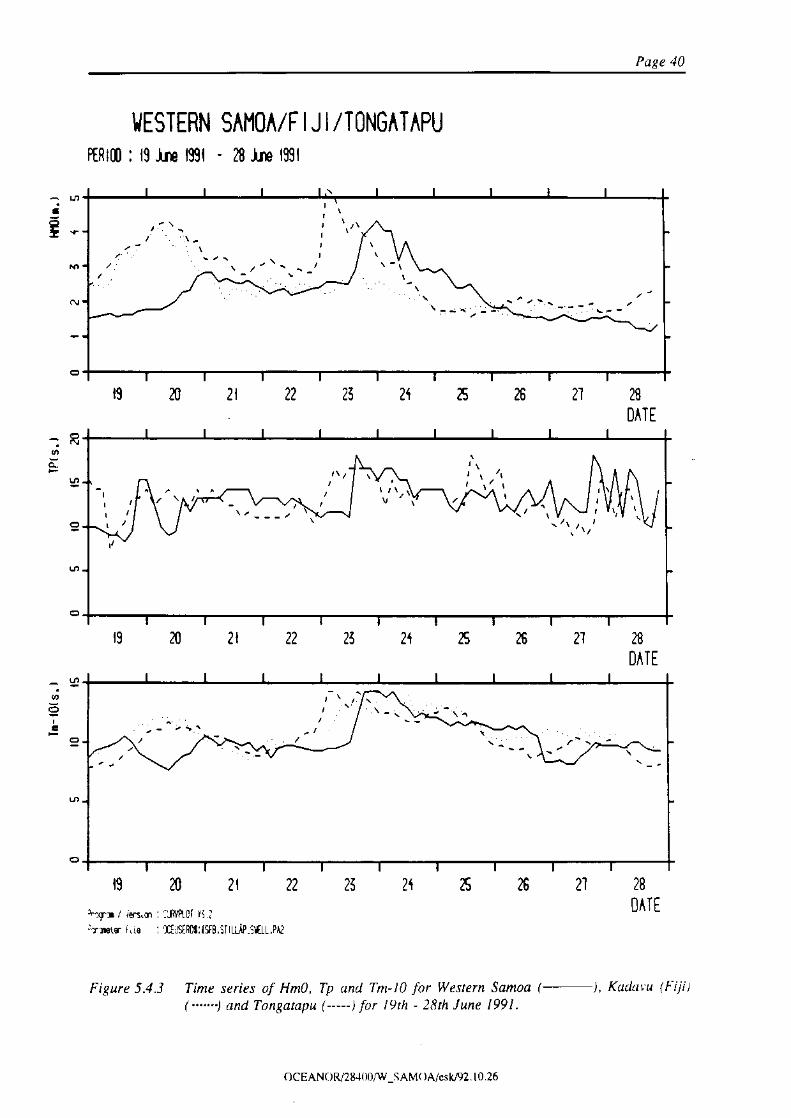
5.4.2 ENERGETIC SWELL; JUNE 1991
As noted earlier the highest waves recorded in 1991 were not a result of cyclone activity but rathera powerful swell originating from a powerful low centred over North Island, New Zealand on 23rdJune. Time series plots for wave parameters collected at Western Samoa, Fiji and Tongatapu are shownin Fig. 5.4.3. Weather charts are shown in Fig. 5.4.4. Two high wave events occurred in this period,the first on 20th as a result of a low to the north east of New Zealand. Significant wave heights of 4 -5 m were recorded at both Fiji and Tongatapu during this event. The swell event on the 23rd at
Tongatapu resulted in significant wave height exceeding 5 m and. somewhat later. 4 m was recordedat Western Samoa. Wave spectra near to the peak of the swell events at Tongatapu and WesternSamoa are presented in Fig. 5.4.5.
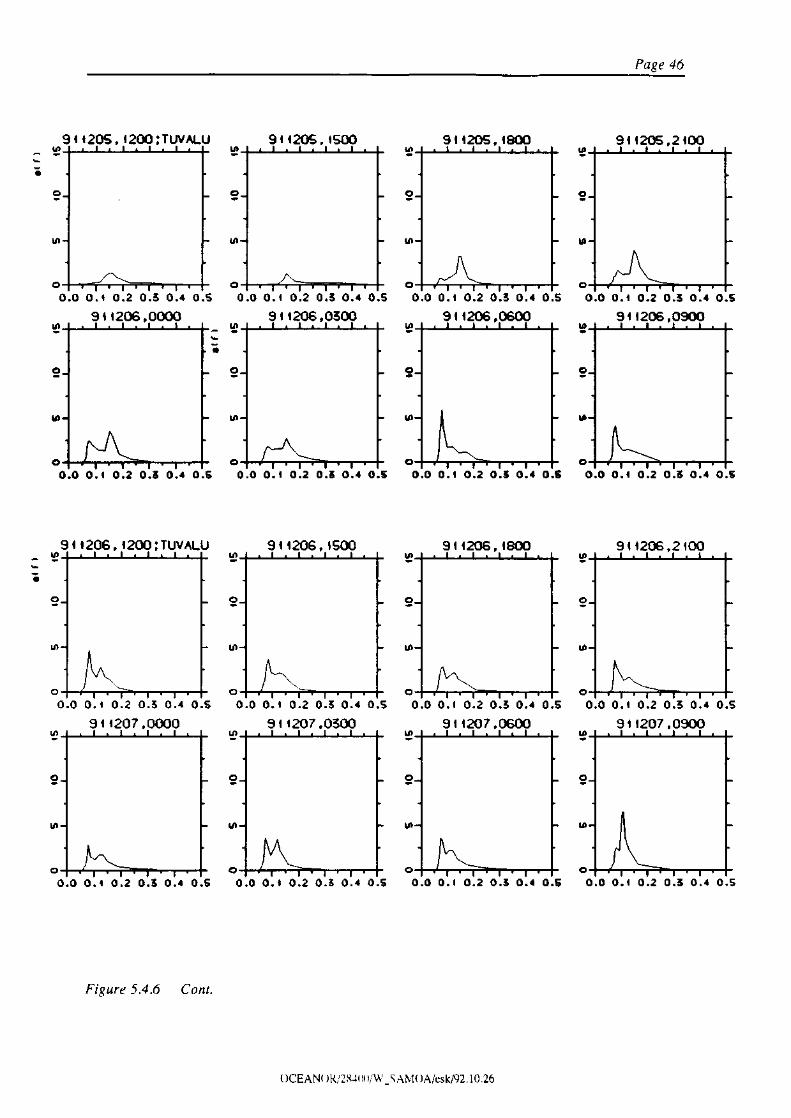
5.4.3 CYCLONE V AL; EFFECTS SEEN AT FUNAFUflj DECEMBER 1991
Cyclone Val devastated Western Samoa during several days in early December 1991. Unfortunately.no wave measurements are available from Samoa. However. the storm formed in the first couple ofdays of December to the south west of Funafuti and on the 4th - 5th December strong winds causedsome damage at Funafuti and several other atolls in the Tuvalu group. As the storm intensified as itapproached Samoa, the high seas moved out of the immediate storm area later to be detected as swellat Tuvalu. These features can be seen quite clearly from the series of wave spectra in Fig. 5.4.6. On
OCEAN0R/28400/W _SAMOA/esk/92.1O.27

Page 35
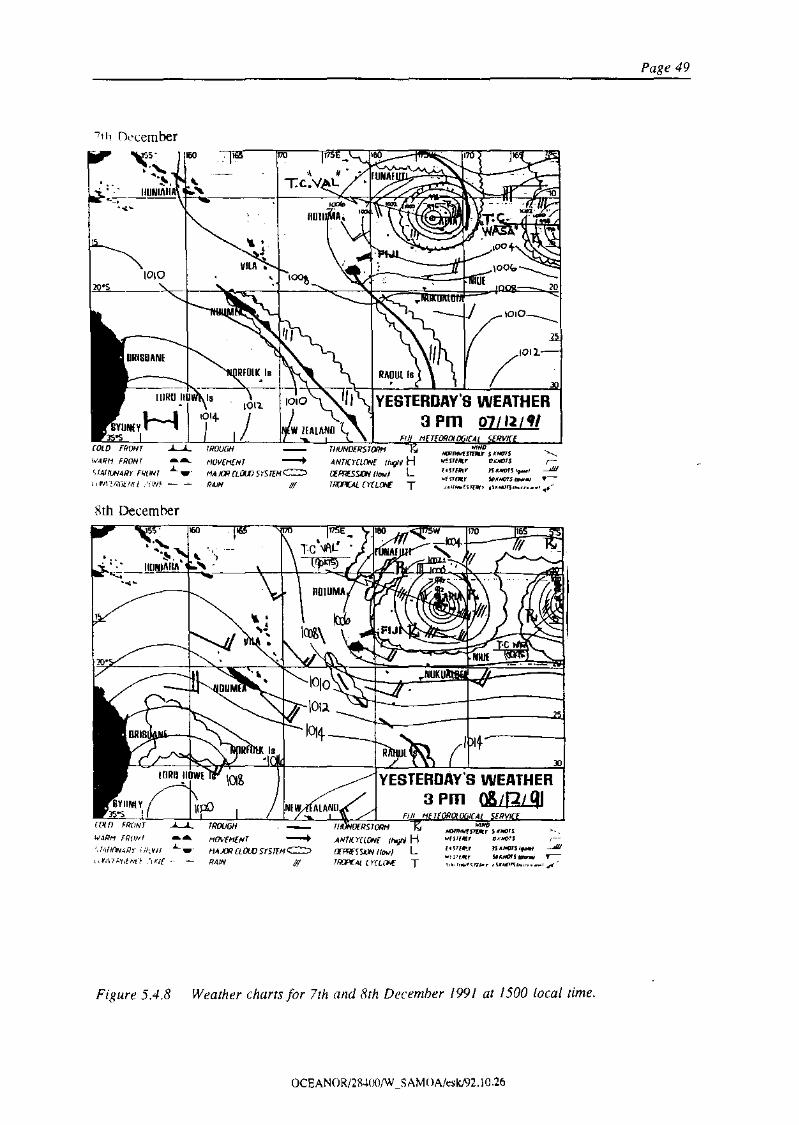
the 4th at 0900 UTC the local wind sea peaks in response to the local high winds. On the 5th at 1800UTC a fairly broad band swell centred at about 0.07 Hz starts to arrive from Val and continues to doso over the next few days. Wave spectra are generally double peaked as local winds remain relativelystrong. Weather cham for 5th - 8th December are shown in Figs. 5.4.7 and 5.4.8. Note that the meanwave power (JT.6cJ for December 1991 was the highest level since records began (Table 4.3) as a resultof the long duration of swell energy from Val.
OCEAN0R/28400f\V _SAMONeskl92.10.26


Page 50
6 Conclusions
Since the measurements started at the new location in May 1990, the highest measured wave occurredin June 1991. The significant wave height (HmO) reached 4.3 m with a period (Tm-lO) of 14.3 s anda corresponding wave energy of 130 kW/m.
So far, on average, the significant wave height (HmO) has been 1.8 m, with an average energy period(Tm-lO) of 9.1 s and an average wave power of 15.7 kW/m.
During the winter period (April - September) the average wave energy is 18.2 kW/m, and in thesummer (October - March) the average wave energy is 12.8 kW/m wave crest
The measurements will continue in 1992.
OCEANOR/28.l00/W _SAMOA/eskfn.IO.27

Page 51
7 References
ARGOS User Omce ARGOS User Manual.
ARGOS User Office: Guide to the ARGOS System.
Datawell User Manual, Datawell b.v., The Netherlands.
Kollstad, T. and Carstens, T. (1988): Waverider Processor and PIT-system Description. SINTEFReport No. STF60 A88088, Trondheim, Norway.
OCEAN( )R/2l1~lll)iW _SAM()A!esk/92, 10,26
Page 52
8 Project Reports
8.1 1990Annual Reports
Olsen, E., Barstow, S.F. and Selanger, K., 1991: Wave Data Collection, Tongarapu, Kingdom ofTonga. May 1987 - December 1990. OCEANOR Report No. OCN R-91068.
Olsen, E., Barstow, S.F. and Selanger. K., 1991: Wave Data Collection, Rarotonga, Cook Islands.July 1987 - January 1991. OCEANOR Report No. OCN R-91071.
Olsen, E., Barstow, S.F. and Setanger, K., 1991: Wave Data Collection, Western Samoa (Inner),September 1989 - April 1990. OCEANOR Report No. OCN R-91072.
Olsen, E., Barstow, S.F. and Selanger, K., 1991: Wave Data Collection, Funafuti, Tuvalu, May -December 1990. OCEANOR Repcrt No. OCN R-91075.
Olsen, E., Barstow, S.F. and Selanger, K., 1991: Wave Data Collection, Efute. Vanuatu. November-December 1990. OCEANOR Report No. OCN R-91076.
8.2 1991 Annual Reports
Below are listed the companion reports to the present report. containing annual and accumulated wavestatistics for each of the measurement stations in the SOPAC wave measurement programme:
Barstow, S.F. and Olsen, E., 1992: Wave Data Collection. Kadavu, Fiji. June . December 1991,OCEANOR Repcrt No. OCN R-92088.
Barstow, S.F. and Olsen, E•• 1992: Wave Data Collection. Bfute. Vanuatu, November 1990 -December 1991. OCEANOR Report No. OCN R-92089.
Barstow, S.F. and Olsen, E., 1992: Wave Data Collection. Tongatapu. Kingdom of tonga. May 1987- December 1991. OCEANOR Report No. OCN R-92090.
Barstow, S.F. and Olsen, E., 1992: Wave Data Collection. Funafuti, Tuvalu. May 1990 - December1991. OCEANOR Report No. OCN R-92091.
OCEANOR/28.l.00/W _SAtl.HJA/eskJ92, 10,27
Page 53
8.3 Other Reports
Barstow, S.F., 1992: Report of Visit to SOPAC Techsec as Progranune Officer in the Wave EnergyProgramme, 2nd March - 27th March 1992, OCEANOR Report No, OCN R-92068,
Barstow, S.F., 1990: Wave Data from the Datawell Waverider Buoys offshore Tonga, Rarotonga,Western Samoa and Tuvalu for January - September 1990, Technical Note to SOPAC.
Barstow, S.F. and Patiale, M., 1992: An Appraisal of the Visual Wave Observations at Funafuti,1984 - 1992, Technical Note.
Torsethaugen, K., 1990: Site Selection Study in the SOPAC Region, Nlfl, Report No. STF60F90078.
Tursethaugen, K., 1991: Calibration of Hindcast Data in the SOPAC Region, Nlfl, Report No. STF60F91004.
OCEANOR/28-l00!W _SAMOA/esk/92.10,26

APPENDIX A
Accumulated Wave Statistics for 1990-1991
Western Samoa

i
The following tables and plots are presented:
Joint frequency tables (accumulated for all years and 1991). Both monthly and annual plots arepresented.
Parameters: HmO - Tm-lOHmO - TpHmO - JTOl (Accumulated all years)JT-60 - Month (Accumulated all years)
Time series plots for all years for HmO,Tp, Tm-lO and JTot (when available).
!
Ii
,j
,i
OCEAN0R!28400fW _SAMOA/esk/92.1O.26


•-o•".c•••o••-••->u••c
°•••
s-N•-g•
, .';C.0gg~;~~§ggggggg~~~~~~~~~~~~~~g~~~OONNNOOOOOOOOOQOOOOOQOOOOOOOQOOO&8~~~~8ggggggggg8gggggggggggggggOO~~N~OOOOOOOOOOOOOOOOOOOOOOOOOO.•..•..•...•..B~gg::~~ggggggggggggggggggggggggggOO~NONOdooooooocioooooooooooooooo.NOO•.••.•O~OOOOOOOOOOOOOOOOOOOOOOOOOO ~..•~~ ~
co
_N
...... ,.., , ..'" ,.., " 'od'O+':N+'odg;rllo ~ 0 ci
o...... ~:.; .. " , "., .. '" , " f-o.'+'O'+'N.-!,•.-I,~;:IN g: ..•
oe••--foo- , , -, '" " '" '" " f.,o;f'o;f'N:-i'o;1'g;1I'
o :;; 0oc
••-- ..•,." " ., .. ,- " ".. - '" .. -, " "O'+'Oof'N"'."'.,.J!..• .•. :;; ..• ~
°.... "';';';;" .. -, , ,- , ,- .. " '" , '" f.::-f-o."'N"'."'.,.J!. -N • _
.; o
.. "':';0: •...................................................... , 1-::~,+,.;-t,;;-t'N.-!'~.-II..-••-- oi.... ,:.;,::~ f-o.'+,.",•.-I'.", •.-II
~ N ~ ~ ~ N.; 9..,:;,::~,:.;"" f,:-+.• r.,-1.i;1~ ~~~~~o • _-
.;
00.0-
'i'.. f:,I-;;+':+~1N~~~ ~ ~ ~ ~ ~Nor
.... ,:.;.00;.; ..............•.....•............................... f;;,+-=+:.-I-=+.-IJ~~ ~~~~~
~ ci ~oi•... "Iii ................•.......... , ..................•......... f-o.,+,.",•.-I,""'_.-IJ
~ ~~~~,~<;) 1
0
.;
...... a;;.; ro.'+'."'O;1'N"' •.-II~ ~ ~ ~ ~ ~o'
.;-'0••'.
••.... .;; r..;f,o;f";-!'N:-i,_:;-J
'" a ~ ~o·.;
••................................................................ f±:+.:+.±rlI
~ ~ ~ ~ N go g ~,.; 0
••--••
................................................................ fotoIfoto'jo1t
•••••••••••••••••••••••.••.•••.••.••.•••••••••.•••..••••••••••••0 : !~~o : 8 : s
010................................................................ f:,I-;;+':+'~o ~ g ~ ~
o I
••• N
••
•~o~o~o~o~o~o~o~o~o~o~o~o~o~o~ooO~~~"'~~••i~~~~~m~~~OO~~"'M~~~~~O~o ~~~~~~~~~~~~ E ~, I I I I , I I , I " I " I " I " I I I I , I , I,~ Ii: _
~o~o~o~o~o~o~o~o~o~o~o~o~o~o~o~~OO~~"''''~~••~~~~~~~=~~OO~~NN~~••~~~~~~~..•~~

I•"o
•..e
•••o••"••">u•••o•••
I, .,;t.0
02~~~~ogo2oo20000000200020022o028o~g~~~ogoggoggggggg~gggoggooggoOON~~~~ooooooooooooociooooooOOOOOg~g~=~g&gggggggggggggggggggggggOOONOO~OOOOOOOOOOOOOOOOOOOOOOOOO..•.•..•..•..•
gg:=~;;~~~~~~~~~~~~~~~~~~~~~~~~~0gN~~~~~~~~~~~~~~~~~~~~~~~~~~~~~o OOC~~~~~~~~~~~~~~~~~~~~~~~~~~~o ..•~~~~~~~~~~~~~~~~~~~~~~~~~~~~~00000000000000000000000000000000gg~~;~$&ggggggggggggggggggggggggOOOO~~~OOOOOOOOOOOOOOOOOOOOOOOOO.."' .....•oo~~o~cooooooooooooooooooooooooo•...•.•...•- •••
e.;". " " , .. " " .. " " -, .. '" "" "" -, .. 'ool>o+'_"'o;;-+og:ilo g: 0 0
o., ;.;,:.; -, , " , -, -, " , f:.;i,.o1'_.1l.;;-r·'oi.. ~..•oo
_.--00 '" , ,- "..r.o,j;o;+;~,j;o;+;;grll~~ O~Oo·~~ ~
= ................................................................f,,+.:;+.,..c~It> '" ••• ;1 ••.•~·.- co
••--.. ,- ";;' .. " .. " " - -, "" " .. ,- .. " ." .. " -, ,- r..;1'o"'."".""g"R.. ;. ..•
oo
= .. '"~~ ",:,;,:.;"" , , -, '" .. -, ,- - -, -, h~;1,.;1,~:;1l.;;-r.,.l1- .-••-- ................................................................r.kf:+.;;1N1N~"''''''' ~ ~ ~ ••••~·- -••• 0 i•... ,noli,;;. ,- ... , .... " .... -, ,......•.... ,..... -, .....•..- o
I.. ",c';:';;Vi,n ,- -, "" , , , ,- -, , .. r.;1-;;+",,,,+,,,"g; ~ :Q' ": $·.-- oI.... "';;.:l,r; ..•. " .. '" " -, '" .. " " -, .. r..;1'o,",.;c'.;;-'_",D
.• : ..•I'~....':';';;';;':';;";"-,..'"-, ".,..'" -, ,,';-;:+;;ir.+•.R..• ~": ~~~- .- .;
100.0- ..• '0
-. ................................................................f,,+.:;+.,..c,+,.11....~~~ ~ : E ~ :_ .;o.- .... ;;.;.,;;,;; "., .. ,_., -, ,- ,_., -, .. '" ., .. ".,;,.",_;,1,.;;-,.",0
......s .o o
••.... ;;.:;,:; " .. ,- " .. ,- r..;-I,.;1,"::1c.::"f~"'!
..~1.::... - ~ h.;1,.;1,.:rlC.;+ •.1!
o C; 0
o 1 0
••".
••
••........" f:±;+.,..c~••.•..•. '" g
o g ••o ,I 0.......... - corr.o;+'g;+'omg:il
000o I
.'~O~O~O~O~O~O~O~O~O~O~O~O~O~O~OOO~~NN~~.~~~~~~~wW~~'::O~~NN~~••~O. .. ,
o I I , , , I, , I , , , , , , , " , I , , I , " , • ,.~ ~
vO~O~O~O~O~O~O~O~O~O~O~O~O~O~O~AOO~~NN~~••~~ii~~iw~~oO~~NN~~.~....................


APPENDIX B
Wave Statistics for 1991
Western Samoa
The following plots and tables are presented:
a) Time series plots of HmO,Tp, Tm-lO and Jr« for each month.
b) Joint frequency of occurrence tables of
HmO - TpHmO - Tm-1OHmO - JTOI
OCEAN0R/28400fW _SAMOA/esk,!92.11.02


