wave 2 trends - giving tuesday · wave 2 trends. contents team ... the 2016 millennial impact...
TRANSCRIPT
WAVE 2 TRENDS
CONTENTS
TEAM
Glossary of Terms
The Millennial Impact Project
Methodology- Millennial Sample Demographic
Trends Worth Watching- Trend 1: Electing No One
- Trend 2: Neutral Ideology
- Trend 3: Social Issues
- Trend 4: Political Ideology
- Trend 5: Activism
- Trend 6: Personal Impact
- Trend 7: Trust in the Government
- Trend 8: Cause Engagement
- Trend 9: Social Media Cause Engagement
- Trend 10: Candidate Preference
- Trend 11: Voting
Trend Recap
Looking Ahead
Derrick Feldmann President
Amy Thayer, Ph.D. Director of Research
Melissa Wall Research Associate
Cindy Dashnaw Writer
Hannah Lushin Editor
Joey Ponce Art Director
1
2
47
99
10
11
12
14
16
17
19
21
22
23
26
27
Research by
Supported by
The Case Foundation and Achieve do not endorse or support any political candidates or entities affiliated with them.
THE 2016 MILLENNIAL IMPACT REPORT | 1
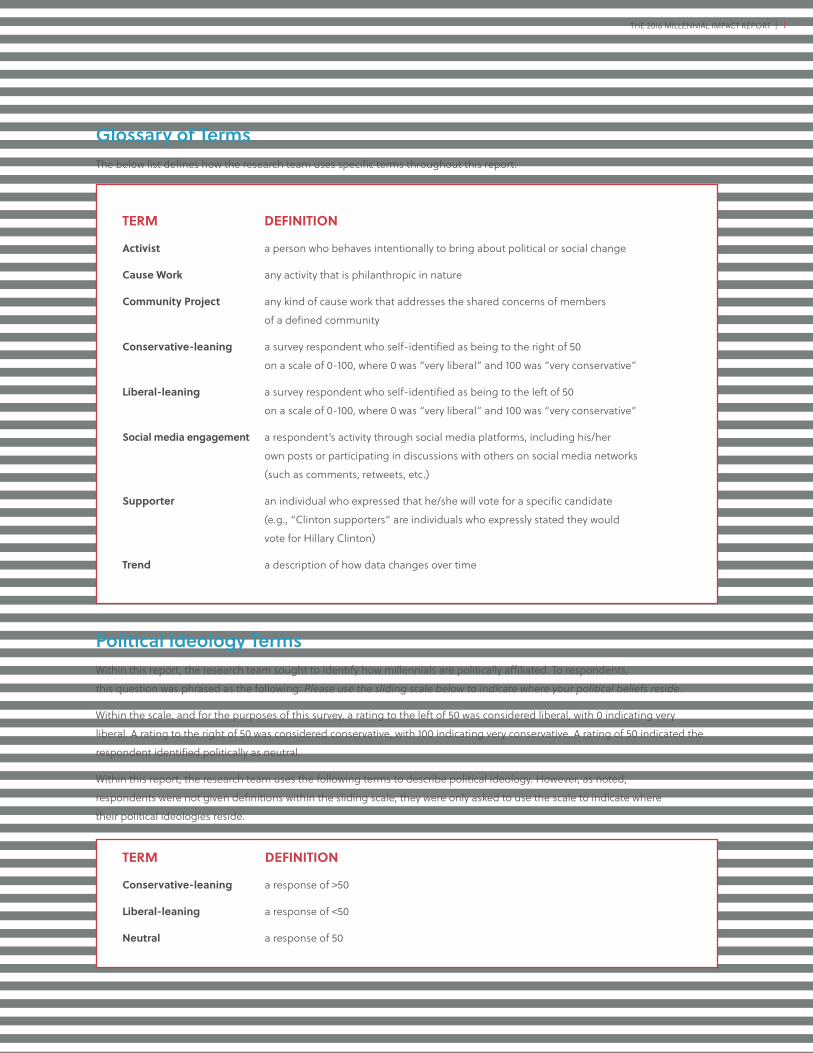
Glossary of TermsThe below list defines how the research team uses specific terms throughout this report.
TERM
Activist
Cause Work
Community Project
Conservative-leaning
Liberal-leaning
Social media engagement
Supporter
Trend
DEFINITION
a person who behaves intentionally to bring about political or social change
any activity that is philanthropic in nature
any kind of cause work that addresses the shared concerns of members
of a defined community
a survey respondent who self-identified as being to the right of 50
on a scale of 0-100, where 0 was “very liberal” and 100 was “very conservative”
a survey respondent who self-identified as being to the left of 50
on a scale of 0-100, where 0 was “very liberal” and 100 was “very conservative”
a respondent’s activity through social media platforms, including his/her
own posts or participating in discussions with others on social media networks
(such as comments, retweets, etc.)
an individual who expressed that he/she will vote for a specific candidate
(e.g., “Clinton supporters” are individuals who expressly stated they would
vote for Hillary Clinton)
a description of how data changes over time
Political Ideology TermsWithin this report, the research team sought to identify how millennials are politically affiliated. To respondents,
this question was phrased as the following: Please use the sliding scale below to indicate where your political beliefs reside.
Within the scale, and for the purposes of this survey, a rating to the left of 50 was considered liberal, with 0 indicating very
liberal. A rating to the right of 50 was considered conservative, with 100 indicating very conservative. A rating of 50 indicated the
respondent identified politically as neutral.
Within this report, the research team uses the following terms to describe political ideology. However, as noted,
respondents were not given definitions within the sliding scale; they were only asked to use the scale to indicate where
their political ideologies reside.
TERM
Conservative-leaning
Liberal-leaning
Neutral
DEFINITION
a response of >50
a response of <50
a response of 50
THE 2016 MILLENNIAL IMPACT REPORT | 2
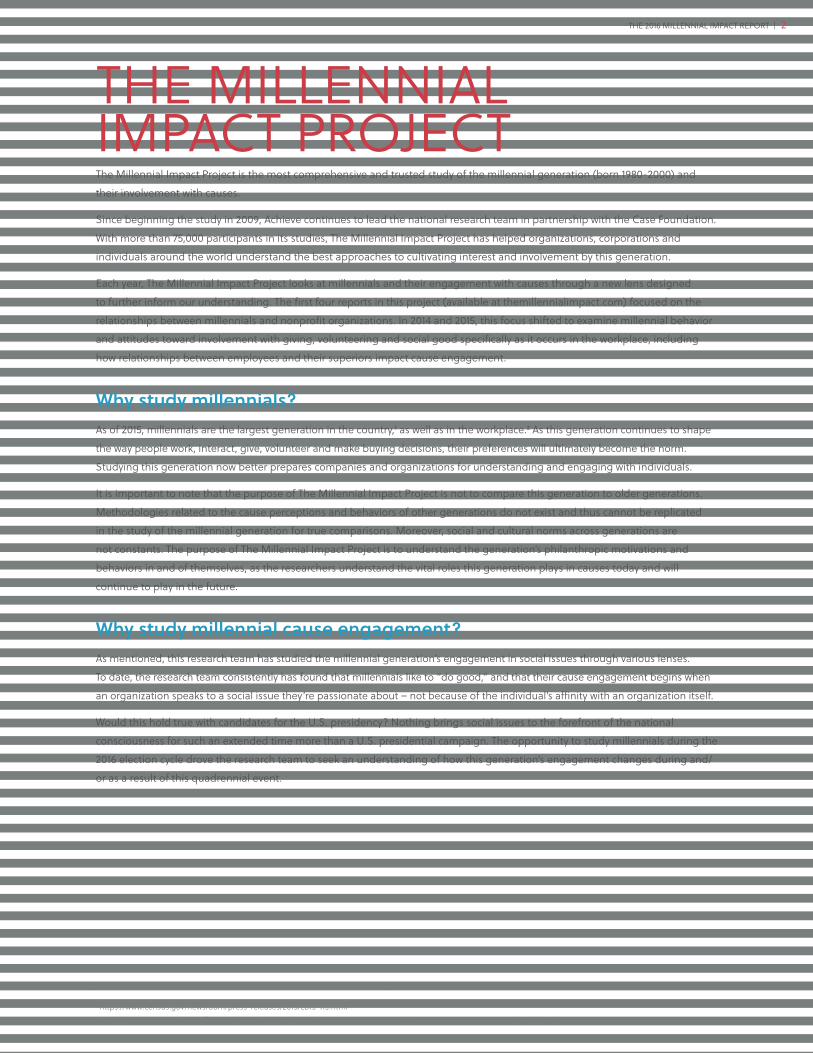
THE MILLENNIAL IMPACT PROJECTThe Millennial Impact Project is the most comprehensive and trusted study of the millennial generation (born 1980-2000) and
their involvement with causes.
Since beginning the study in 2009, Achieve continues to lead the national research team in partnership with the Case Foundation.
With more than 75,000 participants in its studies, The Millennial Impact Project has helped organizations, corporations and
individuals around the world understand the best approaches to cultivating interest and involvement by this generation.
Each year, The Millennial Impact Project looks at millennials and their engagement with causes through a new lens designed
to further inform our understanding. The first four reports in this project (available at themillennialimpact.com) focused on the
relationships between millennials and nonprofit organizations. In 2014 and 2015, this focus shifted to examine millennial behavior
and attitudes toward involvement with giving, volunteering and social good specifically as it occurs in the workplace, including
how relationships between employees and their superiors impact cause engagement.
Why study millennials? As of 2015, millennials are the largest generation in the country,1 as well as in the workplace.2 As this generation continues to shape
the way people work, interact, give, volunteer and make buying decisions, their preferences will ultimately become the norm.
Studying this generation now better prepares companies and organizations for understanding and engaging with individuals.
It is important to note that the purpose of The Millennial Impact Project is not to compare this generation to older generations.
Methodologies related to the cause perceptions and behaviors of other generations do not exist and thus cannot be replicated
in the study of the millennial generation for true comparisons. Moreover, social and cultural norms across generations are
not constants. The purpose of The Millennial Impact Project is to understand the generation’s philanthropic motivations and
behaviors in and of themselves, as the researchers understand the vital roles this generation plays in causes today and will
continue to play in the future.
Why study millennial cause engagement?As mentioned, this research team has studied the millennial generation’s engagement in social issues through various lenses.
To date, the research team consistently has found that millennials like to “do good,” and that their cause engagement begins when
an organization speaks to a social issue they’re passionate about – not because of the individual’s affinity with an organization itself.
Would this hold true with candidates for the U.S. presidency? Nothing brings social issues to the forefront of the national
consciousness for such an extended time more than a U.S. presidential campaign. The opportunity to study millennials during the
2016 election cycle drove the research team to seek an understanding of how this generation’s engagement changes during and/
or as a result of this quadrennial event.
1 https://www.census.gov/newsroom/press-releases/2015/cb15-113.html 2 http://www.pewresearch.org/fact-tank/2015/05/11/millennials-surpass-gen-xers-as-the-largest-generation-in-u-s-labor-force/
THE 2016 MILLENNIAL IMPACT REPORT | 3
THE 2016 MILLENNIAL IMPACT REPORTFew events in the United States make social issues and affiliated causes – including those who support and those who oppose
them – as public and popular as presidential election cycles.
Research repeatedly indicates millennials value cause engagement. With the changing landscape in the U.S. brought on by a
presidential election year, the Achieve research team wanted to understand how – or if – this generation’s philanthropic interests
and involvement change, as well.
The 2016 Millennial Impact Report investigates how millennials’ cause engagement behaviors may change during an election year,
and how these changes may be influenced by the emerging candidates for election or by important millennial demographics
such as their political ideology, geographical location, age, gender and race/ethnicity. This study also examines millennials’
interest and activation in specific causes that may be differentiated by their support of a particular political party.
HYPOTHESES By the end of this study (released pre- and post-Election Day 2016), the research team hypothesizes that millennials’ interests in social causes will change during the political season based on their individual political alignment, the final candidates chosen to represent those ideologies and the important causes associated with these candidates and ideologies. The team also hypothesizes that during this time, millennials’ cause-related engagement will increase on both social media platforms (online activism), as well as through cause participation such as volunteering, donating, signing petitions, etc. (activism) supporting their causes of interest.
Why does millennials’ behavior during an election cycle matter? It is likely that during an election year, causes and organizations that are politically aligned or part of a candidate’s agenda could
see an increase in participation from this generation. Conversely, millennial participation in a social cause could decrease during an
election year – whether at a local, state or federal level – if that cause isn’t aligned with a candidate’s political agenda or because it’s
out of the public spotlight.
As this study is ongoing, it would be unrealistic to propose that, in reading these initial trends, causes and organizations would be
able to truly apply these trends to the ways they engage this generation during the 2016 election cycle. However, understanding the
evolving millennial mindset in the current political landscape is critical to informing leaders and organizations that want to unleash
this generation’s ability to create change for many years to come.
In line with research conducted through The Millennial Impact Project and by common definition, millennials range in age from 16
to 36 (though this study was conducted only with respondents ages 18-36 to correspond with the voting age in the United States).
That means a portion of individuals within this generation are not yet of voting age but will be in the next two years, increasing this
generation’s political voice. As such, the trends detailed within this update will aid causes and organizations in their preparation for
the future, guiding them in planning efforts to best engage and motivate this generation for their social issue during an election
year. Causes that are aligned with popular political issues can use election cycles to their advantages, while causes without political
roots can better prepare to keep their audience engaged during the political season.
The entirety of this research study is seeking to answer questions such as: How does millennial engagement with causes trend during
an election cycle? What factors are associated with this engagement? What – if any – demographic factors are connected to those
trends? How can organizations motivate this generation to donate their time, money or skills to their causes during election years?
THE 2016 MILLENNIAL IMPACT REPORT | 4
METHODOLOGYIn an effort to recruit respondents who were representative of U.S. millennials between the ages of 18-36, the research team used
a proportional quota sample (based on U.S. Census Bureau millennial cohort data for gender, race and geographic region) for
this investigation.* While some monthly sample demographics may vary in comparison to other investigations of this generation,
the final sample in this study will yield characteristics indicative of the millennial population.
Researchers drew a sample matching these demographics from Lightspeed GMI online opt-in panel. The sample in this release
of trends consists of 350 unique and unrepeated millennial respondents surveyed each month from March to May (Wave 1)
and from June to August (Wave 2); therefore, the total sample of millennial respondents for Wave 1 is n= 1,050 and for Wave 2
is n= 1,050 – meaning the total sample of millennial respondents whose data were collected and analyzed for this release
of the 2016 study is n= 2,100.
Following the dissemination and collection of Wave 3 surveys (September to November), the final sample included in the
completed research study, including repeated (monthly) cross-sectional surveys combined (March to November), will be n= 3,150.
Although 350 unique respondents are surveyed at monthly intervals, with 1,050 unique respondents included in each of the three
waves, at the conclusion of this investigation, the research will yield 3,150 responses to the same series of questions observed
monthly. Monthly surveying of representative nonprobability samples of millennials allows for generalized estimations to be
drawn about the larger population of millennials. More specifically, this strategy increases the likelihood that trends may be
applied to the general millennial population when they are repeatedly obtained from different nonprobability samples over time.
Additionally, this design permits the detection and monitoring of both acute and chronic attitudinal and behavioral changes
throughout the political season of a presidential election year. The full and final dataset will also allow for data segmentation,
which is useful for providing insight into specific respondent characteristics. The combination of immediate and longitudinal data
collection provides for a unique and comprehensive examination of millennials’ interest in causes and politics in real time as well
as trends that emerge over time.
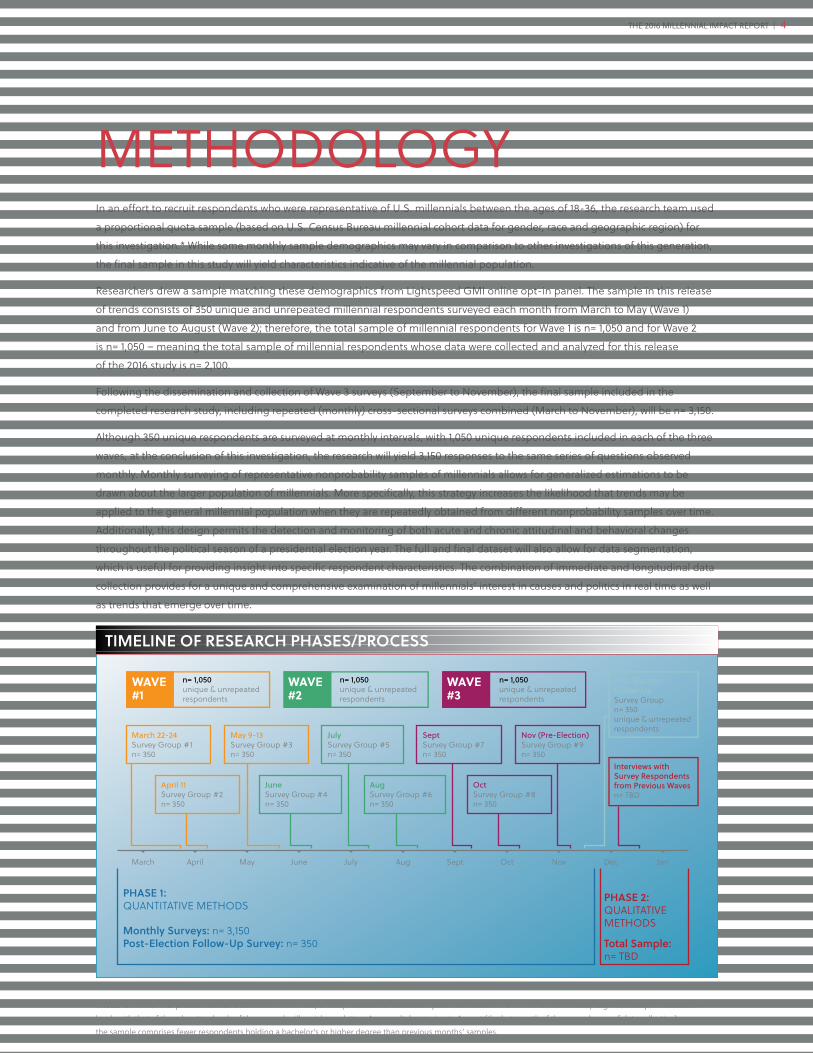
TIMELINE OF RESEARCH PHASES/PROCESS
PHASE 1: QUANTITATIVE METHODS
Monthly Surveys: n= 3,150Post-Election Follow-Up Survey: n= 350 Total Sample:
n= TBD
March
March 22-24Survey Group #1n= 350
April May June July Aug Sept Oct Nov Dec Jan
PHASE 2: QUALITATIVE METHODS
WAVE #1
WAVE #2
WAVE #3
n= 1,050 unique & unrepeated respondents
n= 1,050 unique & unrepeated respondents
n= 1,050 unique & unrepeated respondents
May 9-13Survey Group #3n= 350
April 11Survey Group #2n= 350
SeptSurvey Group #7n= 350
Nov (Pre-Election)Survey Group #9n= 350
Post-Election Follow-UpSurvey Groupn= 350unique & unrepeated respondents
Interviews withSurvey Respondentsfrom Previous Wavesn= TBD
OctSurvey Group #8n= 350
JuneSurvey Group #4n= 350
JulySurvey Group #5n= 350
AugSurvey Group #6n= 350
*Note: Once the final presidential candidates were identified, a newly established education quota was created in an effort to more closely align this sample’s education levels with that of the education levels of the general millennial population. As a result, beginning in August (the last month of the second wave of data collection), the sample comprises fewer respondents holding a bachelor’s or higher degree than previous months’ samples.
THE 2016 MILLENNIAL IMPACT REPORT | 5
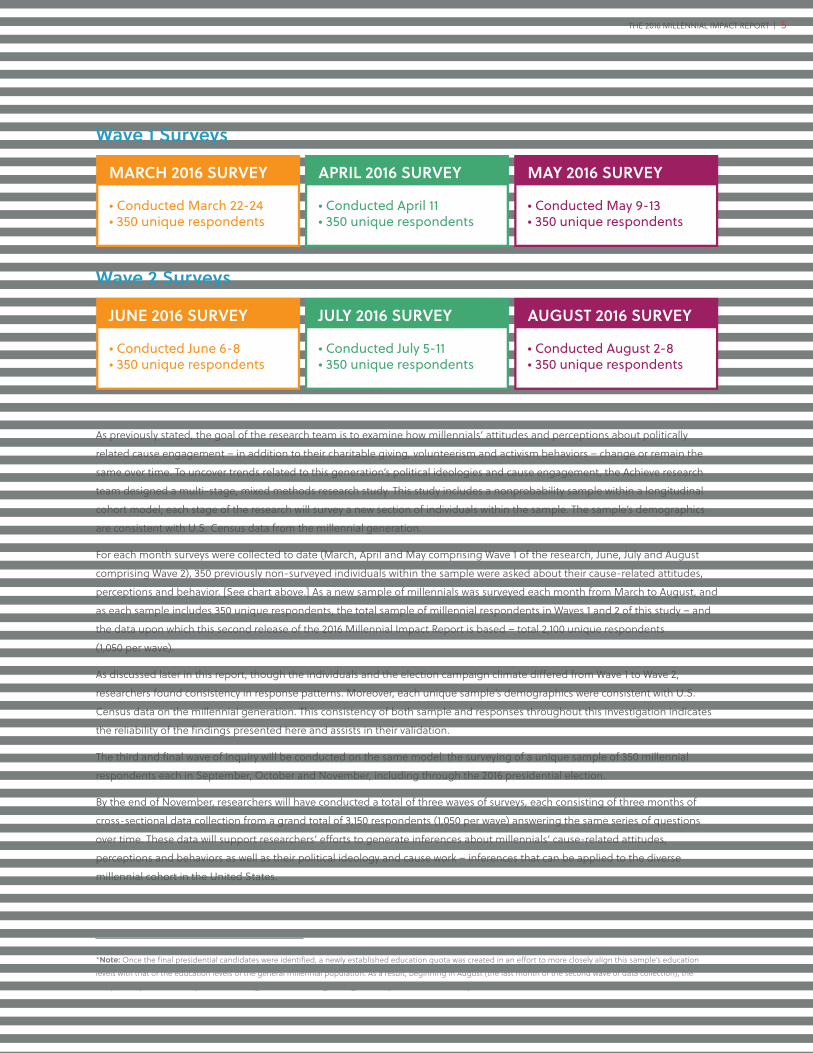
MARCH 2016 SURVEY APRIL 2016 SURVEY MAY 2016 SURVEY
• Conducted March 22-24• 350 unique respondents
• Conducted April 11• 350 unique respondents
• Conducted May 9-13• 350 unique respondents
JUNE 2016 SURVEY JULY 2016 SURVEY AUGUST 2016 SURVEY
• Conducted June 6-8• 350 unique respondents
• Conducted July 5-11• 350 unique respondents
• Conducted August 2-8• 350 unique respondents
Wave 1 Surveys
Wave 2 Surveys
*Note: Once the final presidential candidates were identified, a newly established education quota was created in an effort to more closely align this sample’s education levels with that of the education levels of the general millennial population. As a result, beginning in August (the last month of the second wave of data collection), the sample comprises fewer respondents holding a bachelor’s or higher degree than previous months’ samples.
As previously stated, the goal of the research team is to examine how millennials’ attitudes and perceptions about politically
related cause engagement – in addition to their charitable giving, volunteerism and activism behaviors – change or remain the
same over time. To uncover trends related to this generation’s political ideologies and cause engagement, the Achieve research
team designed a multi-stage, mixed methods research study. This study includes a nonprobability sample within a longitudinal
cohort model; each stage of the research will survey a new section of individuals within the sample. The sample’s demographics
are consistent with U.S. Census data from the millennial generation.
For each month surveys were collected to date (March, April and May comprising Wave 1 of the research, June, July and August
comprising Wave 2), 350 previously non-surveyed individuals within the sample were asked about their cause-related attitudes,
perceptions and behavior. [See chart above.] As a new sample of millennials was surveyed each month from March to August, and
as each sample includes 350 unique respondents, the total sample of millennial respondents in Waves 1 and 2 of this study – and
the data upon which this second release of the 2016 Millennial Impact Report is based – total 2,100 unique respondents
(1,050 per wave).
As discussed later in this report, though the individuals and the election campaign climate differed from Wave 1 to Wave 2,
researchers found consistency in response patterns. Moreover, each unique sample’s demographics were consistent with U.S.
Census data on the millennial generation. This consistency of both sample and responses throughout this investigation indicates
the reliability of the findings presented here and assists in their validation.
The third and final wave of inquiry will be conducted on the same model: the surveying of a unique sample of 350 millennial
respondents each in September, October and November, including through the 2016 presidential election.
By the end of November, researchers will have conducted a total of three waves of surveys, each consisting of three months of
cross-sectional data collection from a grand total of 3,150 respondents (1,050 per wave) answering the same series of questions
over time. These data will support researchers’ efforts to generate inferences about millennials’ cause-related attitudes,
perceptions and behaviors as well as their political ideology and cause work – inferences that can be applied to the diverse
millennial cohort in the United States.

THE 2016 MILLENNIAL IMPACT REPORT | 6
Following the end of Wave 3 of this study (i.e., monthly surveys of 350 unique respondents in September, October and
November), the research team will complete the final phase of the study by surveying a new group of 350 millennial respondents
following the presidential election in November. The goal of this inquiry is to capture data associated with millennials’ cause-
related attitudes, perceptions and behaviors, as well as political actions such as activities on Election Day, voting and their
candidate selection. Finally, the research team will conduct in-depth, personal, qualitative interviews with a sub-sample of survey
respondents to expand on and validate survey responses.
The following trends have emerged through the collection of two waves of survey response data: Wave 1, March through May,
and Wave 2, June through August. As noted, some trends are new developments that arose from Wave 2 response data, while
other trends were recognized in both waves. The culmination of these inquiries, anticipated to be complete by the end of 2016
(quantitative) and early 2017 (qualitative), will provide a comprehensive view of millennial cause engagement during a presidential
election year.
Note: Once the final presidential candidates were identified, a newly established education quota was created in an effort to more closely align this sample’s education levels with that of the education levels of the general millennial population. As a result, beginning in August (the last month of the second wave of data collection), the sample comprises fewer respondents holding a bachelor’s or higher degree than previous months’ samples
THE 2016 MILLENNIAL IMPACT REPORT | 7
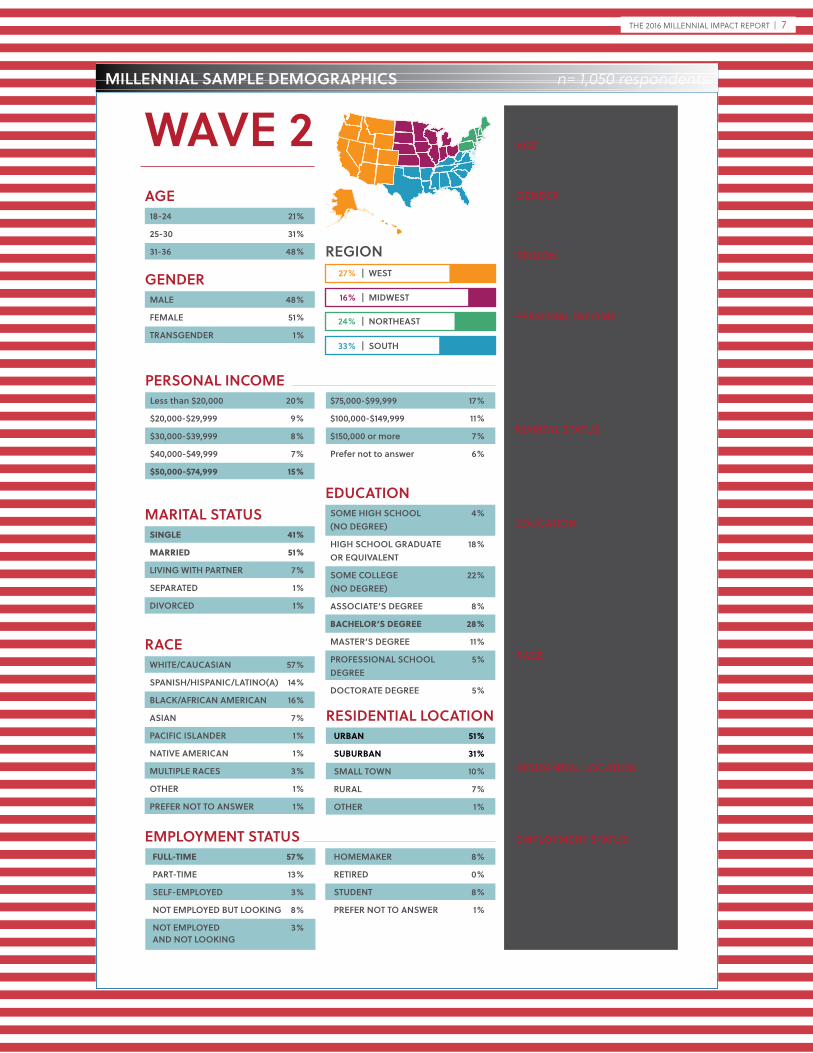
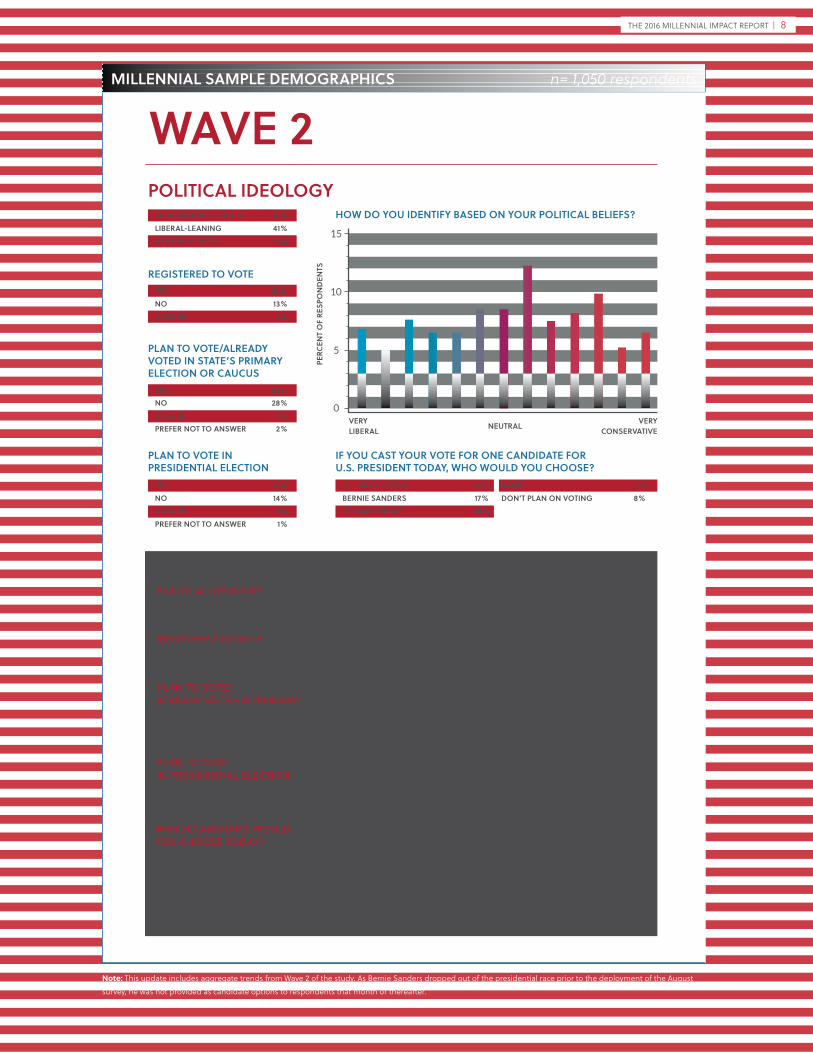
MILLENNIAL SAMPLE DEMOGRAPHICS n= 1,050 respondents
GENDER
REGION
MALE
FEMALE
TRANSGENDER
48%
51%
1%
AGE18-24
25-30
31-36
AGE18-2425-3031-36
26%34%39%
GENDERMaleFemaleTransgenderPrefer not to answer
50%49%
1%<1%
REGIONWestMidwestNortheastSouth
23%18%22%37%
PERSONAL INCOMELess than $20,000$20,000-$29,000$30,000-$39,000$40,000-$49,000$50,000-$74,999$75,000-$99,999$100,000-$149,999$150,000 or morePrefer not to answer
19%10%10%8%
17%14%10%6%5%
MARITAL STATUSSingle, never marriedMarriedLiving with partnerSeparatedDivorcedWidowedPrefer not to answer
40%48%10%<1%
1%<1%<1%
EDUCATIONSome high school(no degree)High school graduateor equivalentSome college (no degree)Associate’s degreeBachelor’s degreeMaster’s degreeProfessional school degreeDoctorate degree
3%
16%
21%8%
32%11%6%3%
RACEWhite/CaucasianSpanish/Hispanic/Latino(a)Black/African AmericanAsianPacific IslanderNative AmericanMultiple RacesOtherPrefer not to answer
67%12%10%8%
<1%1%3%
<1%<1%
RESIDENTIAL LOCATIONUrbanSuburbanSmall townRuralOther
45%35%12%8%
<1%
EMPLOYMENT STATUSFull-timePart-timeSelf-employedNot employed but lookingNot employed, not lookingHomemakerRetiredStudentPrefer not to answer
55%11%4%7%2%9%
<1%11%1%
21%
31%
48%
MARITAL STATUSSINGLE
MARRIED
LIVING WITH PARTNER
SEPARATED
DIVORCED
41%
51%
7%
1%
1%
EDUCATION
WAVE 2 WAVE 1
SOME HIGH SCHOOL (NO DEGREE)
HIGH SCHOOL GRADUATE OR EQUIVALENT
SOME COLLEGE (NO DEGREE)
ASSOCIATE’S DEGREE
BACHELOR’S DEGREE
MASTER’S DEGREE
PROFESSIONAL SCHOOL DEGREE
DOCTORATE DEGREE
4%
18%
22%
8%
28%
11%
5%
5%
EMPLOYMENT STATUSFULL-TIME
PART-TIME
SELF-EMPLOYED
NOT EMPLOYED BUT LOOKING
NOT EMPLOYED AND NOT LOOKING
57%
13%
3%
8%
3%
PERSONAL INCOMELess than $20,000
$20,000-$29,999
$30,000-$39,999
$40,000-$49,999
$50,000-$74,999
20%
9%
8%
7%
15%
RACEWHITE/CAUCASIAN
SPANISH/HISPANIC/LATINO(A)
BLACK/AFRICAN AMERICAN
ASIAN
PACIFIC ISLANDER
NATIVE AMERICAN
MULTIPLE RACES
OTHER
PREFER NOT TO ANSWER
57%
14%
16%
7%
1%
1%
3%
1%
1%
RESIDENTIAL LOCATION
URBAN
SUBURBAN
SMALL TOWN
RURAL
OTHER
51%
31%
10%
7%
1%
| WEST27%
| MIDWEST16%
| NORTHEAST24%
| SOUTH33%
HOMEMAKER
RETIRED
STUDENT
PREFER NOT TO ANSWER
8%
0%
8%
1%
$75,000-$99,999
$100,000-$149,999
$150,000 or more
Prefer not to answer
17%
11%
7%
6%
THE 2016 MILLENNIAL IMPACT REPORT | 8
REGISTERED TO VOTEYESNOUNSURE
84%13%3%
CONSERVATIVE-LEANINGLIBERAL-LEANINGNEUTRAL/OTHER
50%41%9%
IF YOU CAST YOUR VOTE FOR ONE CANDIDATE FORU.S. PRESIDENT TODAY, WHO WOULD YOU CHOOSE?
HOW DO YOU IDENTIFY BASED ON YOUR POLITICAL BELIEFS?
HILLARY CLINTONBERNIE SANDERSDONALD TRUMP
45%17%18%
NONEDON’T PLAN ON VOTING
12%8%
PLAN TO VOTE/ALREADY VOTED IN STATE’S PRIMARY ELECTION OR CAUCUS
YESNOUNSUREPREFER NOT TO ANSWER
63%28%
7%2%
PLAN TO VOTE INPRESIDENTIAL ELECTION
YESNOUNSUREPREFER NOT TO ANSWER
76%14%9%1%
POLITICAL IDEOLOGY
VERYCONSERVATIVE
PERC
ENT
OF
RESP
ON
DEN
TS
15
0
5
10
VERY LIBERAL NEUTRAL
HOW DO YOU IDENTIFY BASED ON YOUR POLITICAL BELIEFS?
VERYCONSERVATIVE
PERC
ENT
OF
RESP
ON
DEN
TS
15
0
5
10
VERY LIBERAL NEUTRAL
MILLENNIAL SAMPLE DEMOGRAPHICS n= 1,050 respondents
WAVE 2
POLITICAL IDEOLOGYLiberalNeutralConservative
26%34%39%
REGISTERED TO VOTEYesNoUnsure
50%49%
1%
PLAN TO VOTE/ALREADY VOTED IN PRIMARYYesNoUnsurePrefer Not to Answer
23%18%22%37%
PLAN TO VOTEIN PRESIDENTIAL ELECTIONLiberalNeutralConservative
26%34%39%
WHICH CANDIDATE WOULDYOU CHOOSE TODAY?Hillary ClintonTed CruzJohn KasichBernie SandersDonald TrumpNoneDon’t plan on voting
31%8%5%
27%16%7%6%
WAVE 1
Note: This update includes aggregate trends from Wave 2 of the study. As Bernie Sanders dropped out of the presidential race prior to the deployment of the August survey, he was not provided as candidate options to respondents that month or thereafter.
THE 2016 MILLENNIAL IMPACT REPORT | 9
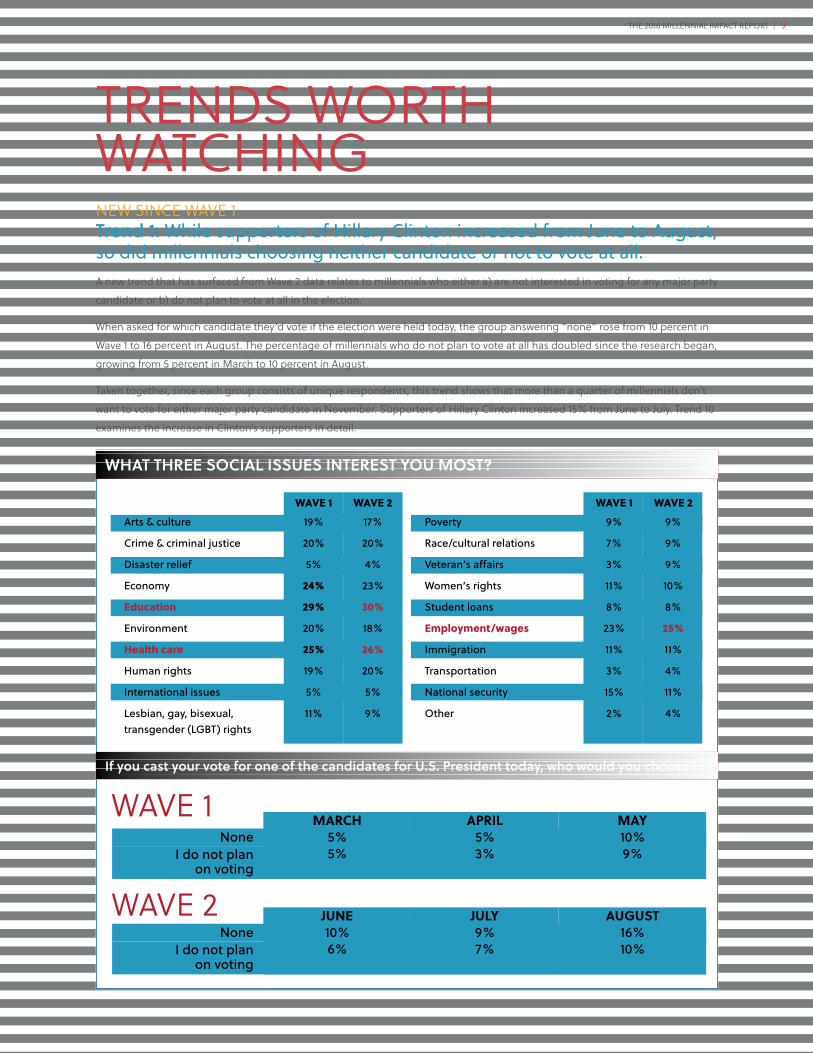
TRENDS WORTH WATCHING NEW SINCE WAVE 1 Trend 1: While supporters of Hillary Clinton increased from June to August, so did millennials choosing neither candidate or not to vote at all.A new trend that has surfaced from Wave 2 data relates to millennials who either a) are not interested in voting for any major party
candidate or b) do not plan to vote at all in the election.
When asked for which candidate they’d vote if the election were held today, the group answering “none” rose from 10 percent in
Wave 1 to 16 percent in August. The percentage of millennials who do not plan to vote at all has doubled since the research began,
growing from 5 percent in March to 10 percent in August.
Taken together, since each group consists of unique respondents, this trend shows that more than a quarter of millennials don’t
want to vote for either major party candidate in November. Supporters of Hillary Clinton increased 15% from June to July. Trend 10
examines the increase in Clinton’s supporters in detail.
WHAT THREE SOCIAL ISSUES INTEREST YOU MOST?
Arts & culture
Crime & criminal justice
Disaster relief
Economy
Education
Environment
Health care
Human rights
International issues
Lesbian, gay, bisexual, transgender (LGBT) rights
19%
20%
5%
24%
29%
20%
25%
19%
5%
11%
17%
20%
4%
23%
30%
18%
26%
20%
5%
9%
9%
9%
9%
10%
8%
25%
11%
4%
11%
4%
Poverty
Race/cultural relations
Veteran’s affairs
Women’s rights
Student loans
Employment/wages
Immigration
Transportation
National security
Other
9%
7%
3%
11%
8%
23%
11%
3%
15%
2%
WAVE 1 WAVE 2 WAVE 1 WAVE 2
NoneI do not plan
on voting
MARCH5%5%
MAY10%9%
If you cast your vote for one of the candidates for U.S. President today, who would you choose?
APRIL5%3%
WAVE 1
NoneI do not plan
on voting
JUNE10%6%
AUGUST16%10%
JULY9%7%
WAVE 2
THE 2016 MILLENNIAL IMPACT REPORT | 10
QUESTIONS TO CONSIDER
Will the groups of “none” and “do not plan to vote” continue to increase at the same rate or faster than support of the two major party candidates?
Are millennials turned off by the candidates, or are they simply returning to typical numbers of millennial voter turnout?
NEW SINCE WAVE 1 Trend 2: Millennials who self-identify as having a “neutral” political ideology increased from Wave 1 to Wave 2.In each monthly survey, the research team sought to determine how millennials define or categorize their own political affiliations.
The survey asked respondents to place themselves on a sliding scale from “very liberal” to “very conservative.” Any rating to the
left of 50 was “liberal” (with 0 “very liberal”), and any rating to the right of 50 was “conservative” (with 100 “very conservative”).
A rating of 50 indicated the respondent self-identified as holding a politically neutral ideology.
With Wave 2, the research team has begun to report on those considering themselves “neutral” because of the growth in this
category. Note that comparisons to Wave 1 will not be available.
Researchers compared Wave 2 data to responses from the liberal- and conservative-leaning sides of the scale and found that
the “neutral” millennials appear to be disinterested voters. Civic participation by these respondents is much lower than by
all other groups.
In other words, it appears that when a millennial respondent indicates his or her political ideology is “neutral,” it is not meant to
indicate that their ideology falls within a middle ground between conservative-
and liberal-leaning – but instead to indicate they are not interested in staking a claim in or acting on behalf of either
conservative or liberal groups.
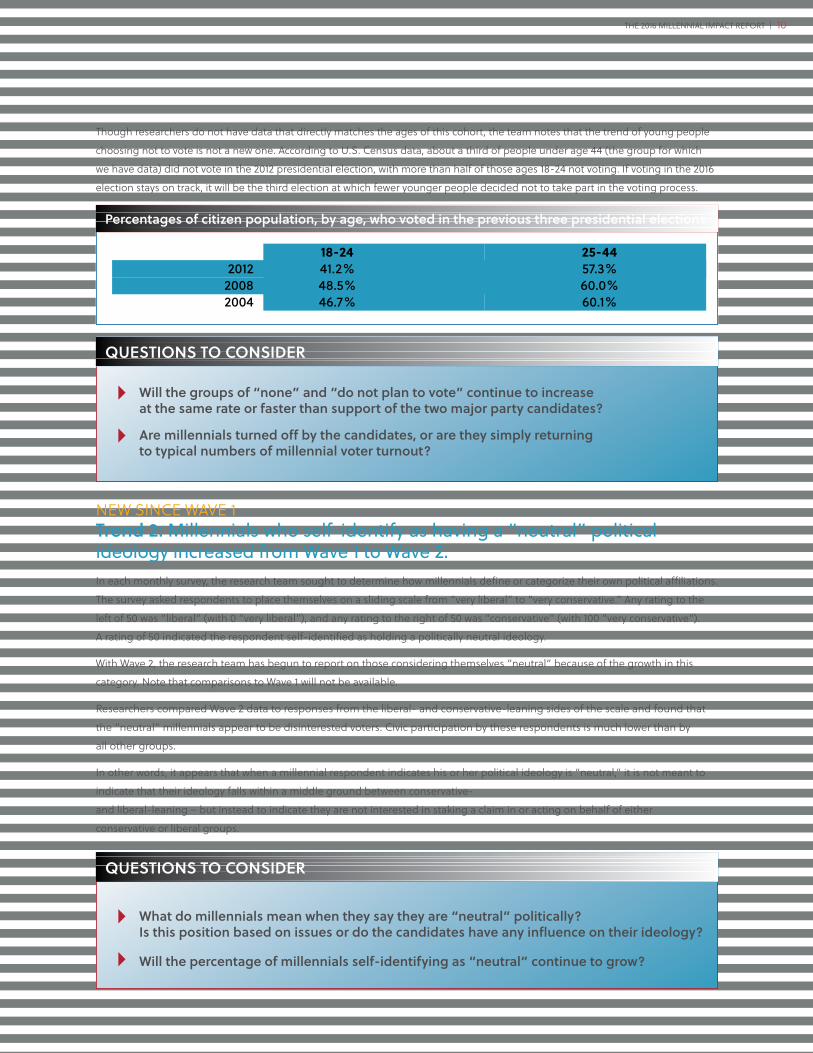
201220082004
18-2441.2%48.5%46.7%
Percentages of citizen population, by age, who voted in the previous three presidential elections
25-4457.3%60.0%60.1%
Though researchers do not have data that directly matches the ages of this cohort, the team notes that the trend of young people
choosing not to vote is not a new one. According to U.S. Census data, about a third of people under age 44 (the group for which
we have data) did not vote in the 2012 presidential election, with more than half of those ages 18-24 not voting. If voting in the 2016
election stays on track, it will be the third election at which fewer younger people decided not to take part in the voting process.
QUESTIONS TO CONSIDER
What do millennials mean when they say they are “neutral” politically? Is this position based on issues or do the candidates have any influence on their ideology?
Will the percentage of millennials self-identifying as “neutral” continue to grow?
THE 2016 MILLENNIAL IMPACT REPORT | 11
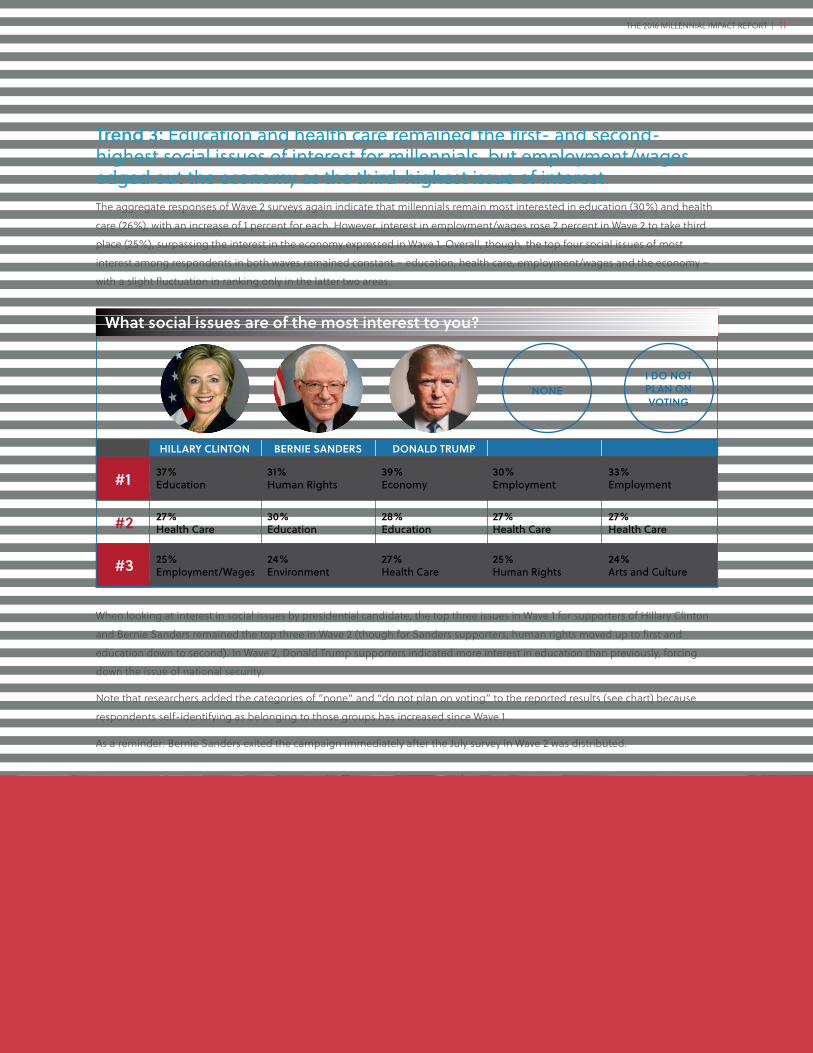
#1
#3
#2
HILLARY CLINTON BERNIE SANDERS DONALD TRUMP
NONEI DO NOTPLAN ONVOTING
37%Education
27%Health Care
25%Employment/Wages
31%Human Rights
30%Education
24%Environment
39%Economy
28%Education
27%Health Care
30%Employment
27%Health Care
25%Human Rights
33%Employment
27%Health Care
24%Arts and Culture
What social issues are of the most interest to you?
Trend 3: Education and health care remained the first- and second-highest social issues of interest for millennials, but employment/wages edged out the economy as the third-highest issue of interest.The aggregate responses of Wave 2 surveys again indicate that millennials remain most interested in education (30%) and health
care (26%), with an increase of 1 percent for each. However, interest in employment/wages rose 2 percent in Wave 2 to take third
place (25%), surpassing the interest in the economy expressed in Wave 1. Overall, though, the top four social issues of most
interest among respondents in both waves remained constant – education, health care, employment/wages and the economy –
with a slight fluctuation in ranking only in the latter two areas.
When looking at interest in social issues by presidential candidate, the top three issues in Wave 1 for supporters of Hillary Clinton
and Bernie Sanders remained the top three in Wave 2 (though for Sanders supporters, human rights moved up to first and
education down to second). In Wave 2, Donald Trump supporters indicated more interest in education than previously, forcing
down the issue of national security.
Note that researchers added the categories of “none” and “do not plan on voting” to the reported results (see chart) because
respondents self-identifying as belonging to those groups has increased since Wave 1.
As a reminder: Bernie Sanders exited the campaign immediately after the July survey in Wave 2 was distributed.
THE 2016 MILLENNIAL IMPACT REPORT | 12
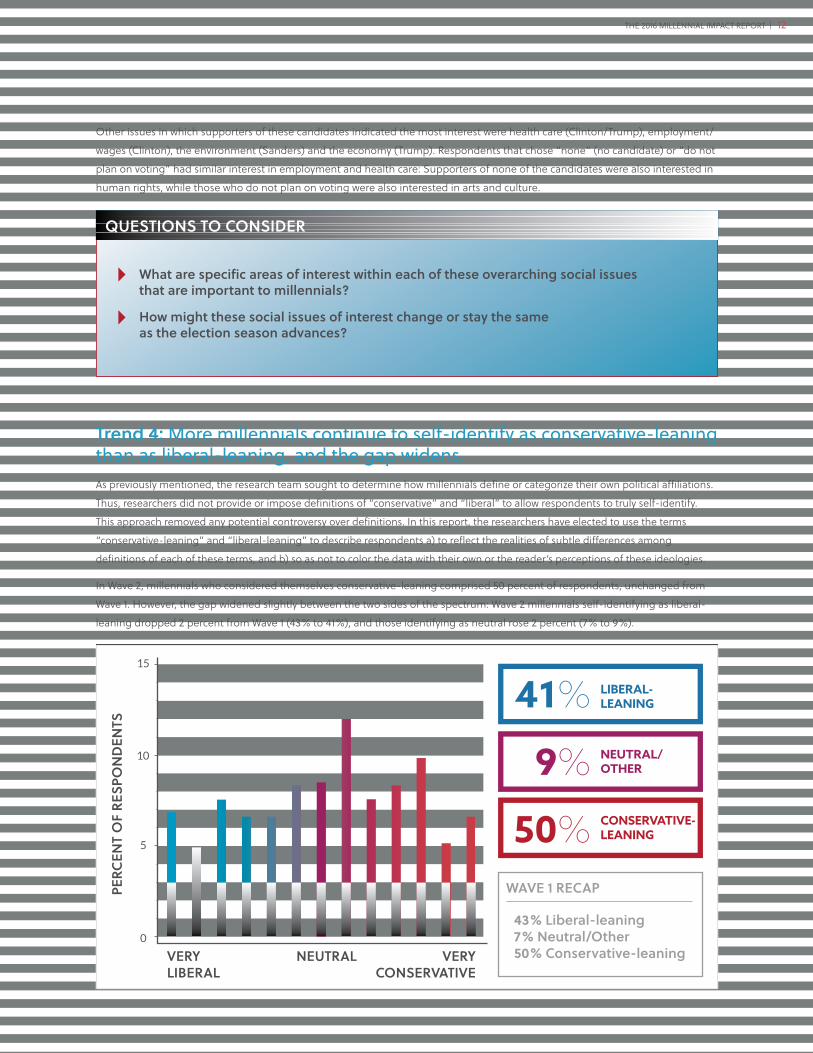
Trend 4: More millennials continue to self-identify as conservative-leaning than as liberal-leaning, and the gap widens.As previously mentioned, the research team sought to determine how millennials define or categorize their own political affiliations.
Thus, researchers did not provide or impose definitions of “conservative” and “liberal” to allow respondents to truly self-identify.
This approach removed any potential controversy over definitions. In this report, the researchers have elected to use the terms
“conservative-leaning” and “liberal-leaning” to describe respondents a) to reflect the realities of subtle differences among
definitions of each of these terms, and b) so as not to color the data with their own or the reader’s perceptions of these ideologies.
In Wave 2, millennials who considered themselves conservative-leaning comprised 50 percent of respondents, unchanged from
Wave 1. However, the gap widened slightly between the two sides of the spectrum: Wave 2 millennials self-identifying as liberal-
leaning dropped 2 percent from Wave 1 (43% to 41%), and those identifying as neutral rose 2 percent (7% to 9%).
VERYCONSERVATIVE
PERC
ENT
OF
RESP
ON
DEN
TS
15
0
5
10
VERY LIBERAL
NEUTRAL
50% CONSERVATIVE-LEANING
41% LIBERAL-LEANING
WAVE 1 RECAP
43% Liberal-leaning7% Neutral/Other50% Conservative-leaning
9% NEUTRAL/OTHER
QUESTIONS TO CONSIDER
What are specific areas of interest within each of these overarching social issues that are important to millennials?
How might these social issues of interest change or stay the same as the election season advances?
Other issues in which supporters of these candidates indicated the most interest were health care (Clinton/Trump), employment/
wages (Clinton), the environment (Sanders) and the economy (Trump). Respondents that chose “none” (no candidate) or “do not
plan on voting” had similar interest in employment and health care: Supporters of none of the candidates were also interested in
human rights, while those who do not plan on voting were also interested in arts and culture.
THE 2016 MILLENNIAL IMPACT REPORT | 13
Very Conservative
PERC
ENT
OF
RESP
ON
DEN
TS
15
0
5
10
Very Liberal
MalesFemales
Neutral
20
18-24
Liberal-leaning
Conservative-leaning
Neutral
Liberal-leaning
Conservative-leaning
Neutral
25-30 31-26
41% 46% 38%
46% 47% 54%
13% 7% 8%
South West Midwest
41% 43% 39%
49% 49% 53%
10% 8% 8%
Northeast
42%
51%
7%
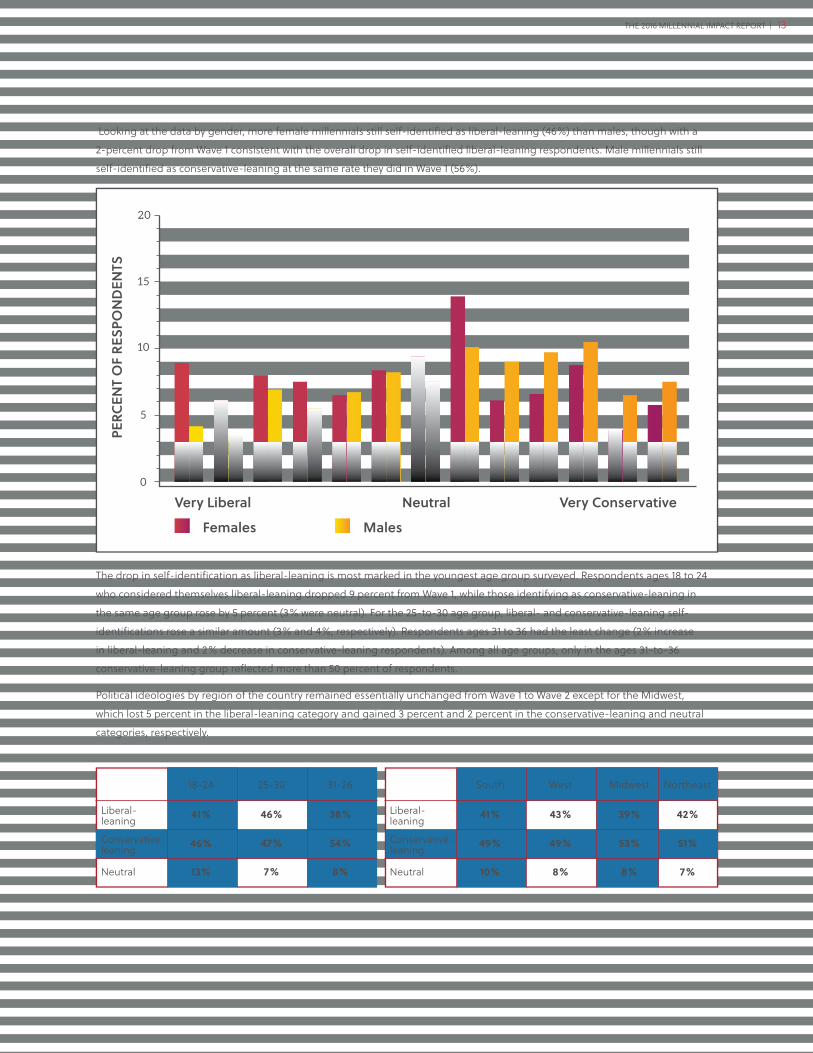
Looking at the data by gender, more female millennials still self-identified as liberal-leaning (46%) than males, though with a
2-percent drop from Wave 1 consistent with the overall drop in self-identified liberal-leaning respondents. Male millennials still
self-identified as conservative-leaning at the same rate they did in Wave 1 (56%).
The drop in self-identification as liberal-leaning is most marked in the youngest age group surveyed. Respondents ages 18 to 24
who considered themselves liberal-leaning dropped 9 percent from Wave 1, while those identifying as conservative-leaning in
the same age group rose by 5 percent (3% were neutral). For the 25-to-30 age group, liberal- and conservative-leaning self-
identifications rose a similar amount (3% and 4%, respectively). Respondents ages 31 to 36 had the least change (2% increase
in liberal-leaning and 2% decrease in conservative-leaning respondents). Among all age groups, only in the ages 31-to-36
conservative-leaning group reflected more than 50 percent of respondents.
Political ideologies by region of the country remained essentially unchanged from Wave 1 to Wave 2 except for the Midwest,
which lost 5 percent in the liberal-leaning category and gained 3 percent and 2 percent in the conservative-leaning and neutral
categories, respectively.
THE 2016 MILLENNIAL IMPACT REPORT | 14
While survey data revealed changes in how millennials see themselves ideologically, it doesn’t identify the reasons for the
changes. However, the research team will use this evidence to inform the qualitative methods portion of the study.
QUESTIONS TO CONSIDER
How do millennials define conservative and liberal, and with what values (e.g., fiscally, socially, etc.) of each of these ideologies do they most align?
How will the percentages of millennial respondents aligned with each ideology change (or remain the same) as the election season advances?
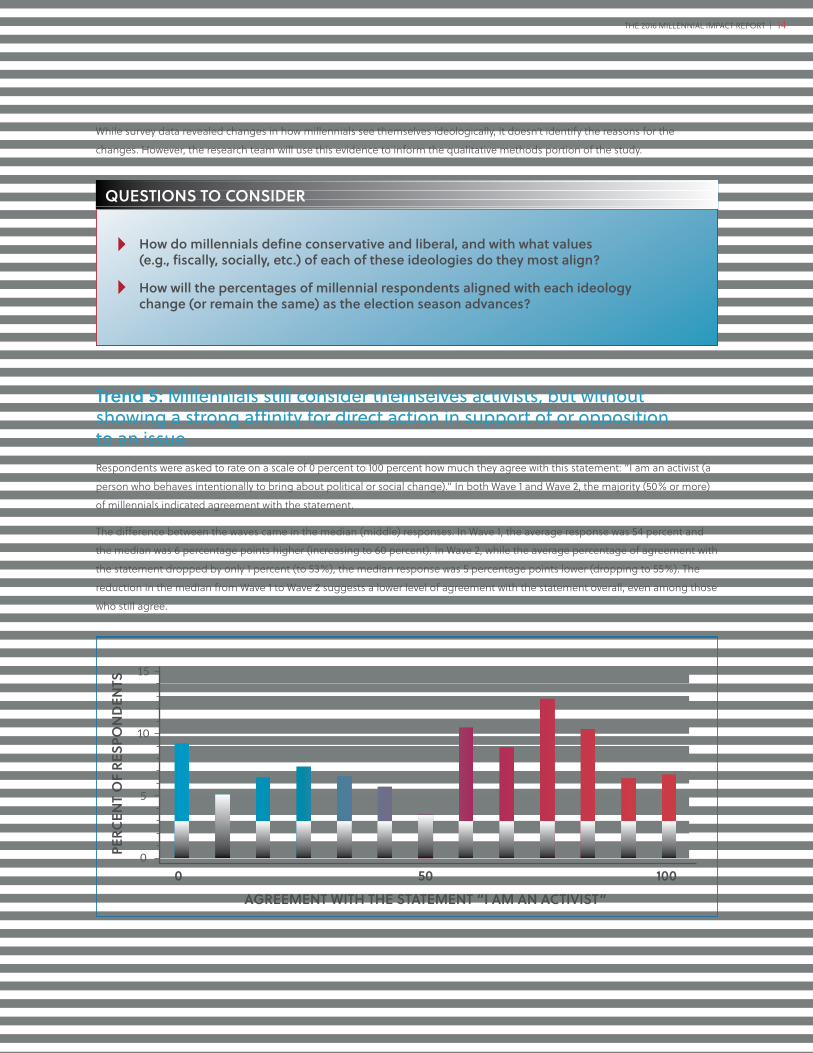
Trend 5: Millennials still consider themselves activists, but without showing a strong affinity for direct action in support of or opposition to an issue.Respondents were asked to rate on a scale of 0 percent to 100 percent how much they agree with this statement: “I am an activist (a
person who behaves intentionally to bring about political or social change).” In both Wave 1 and Wave 2, the majority (50% or more)
of millennials indicated agreement with the statement.
The difference between the waves came in the median (middle) responses. In Wave 1, the average response was 54 percent and
the median was 6 percentage points higher (increasing to 60 percent). In Wave 2, while the average percentage of agreement with
the statement dropped by only 1 percent (to 53%), the median response was 5 percentage points lower (dropping to 55%). The
reduction in the median from Wave 1 to Wave 2 suggests a lower level of agreement with the statement overall, even among those
who still agree.
100
PERC
ENT
OF
RESP
ON
DEN
TS
AGREEMENT WITH THE STATEMENT “I AM AN ACTIVIST”
15
0
5
10
0 50
THE 2016 MILLENNIAL IMPACT REPORT | 15
100
PERC
ENT
OF
RESP
ON
DEN
TS
AGREEMENT WITH THE STATEMENT “I AM AN ACTIVIST”
15
0
5
10
0
MalesFemales
50
20
10 20 30 40 50 60 70 80 90 100
NEUTRAL
LIBERAL
MEDIAN AVERAGE
CONSERVATIVE
10 20 30 40 50 60 70 80 90 100
NEUTRAL
LIBERAL
MEDIAN AVERAGE
CONSERVATIVE
44%
55%
65%58%
50%
43%
32%
53%
65%50%
34%
WAV
E 1
58%
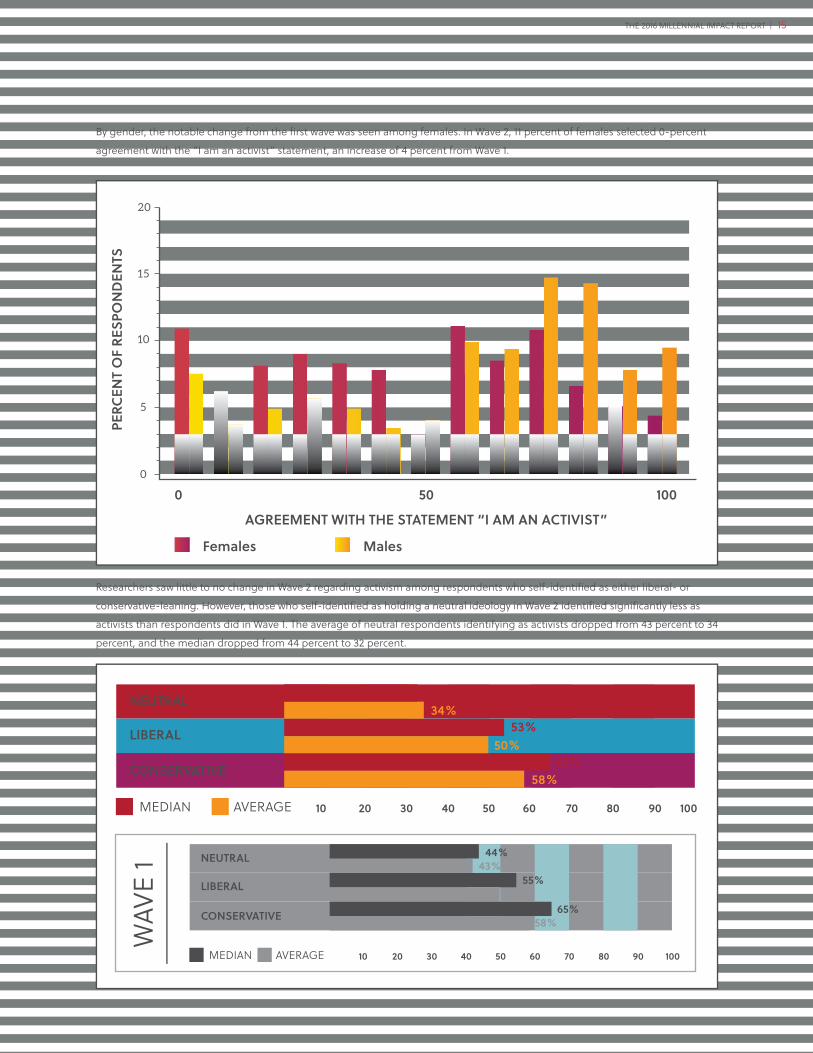
By gender, the notable change from the first wave was seen among females. In Wave 2, 11 percent of females selected 0-percent
agreement with the “I am an activist” statement, an increase of 4 percent from Wave 1.
Researchers saw little to no change in Wave 2 regarding activism among respondents who self-identified as either liberal- or
conservative-leaning. However, those who self-identified as holding a neutral ideology in Wave 2 identified significantly less as
activists than respondents did in Wave 1. The average of neutral respondents identifying as activists dropped from 43 percent to 34
percent, and the median dropped from 44 percent to 32 percent.
THE 2016 MILLENNIAL IMPACT REPORT | 16
QUESTIONS TO CONSIDER
What specific characteristics are included in millennials’ understanding of activism?
How do millennials who only “somewhat” consider themselves activists understand how they are able to create change?
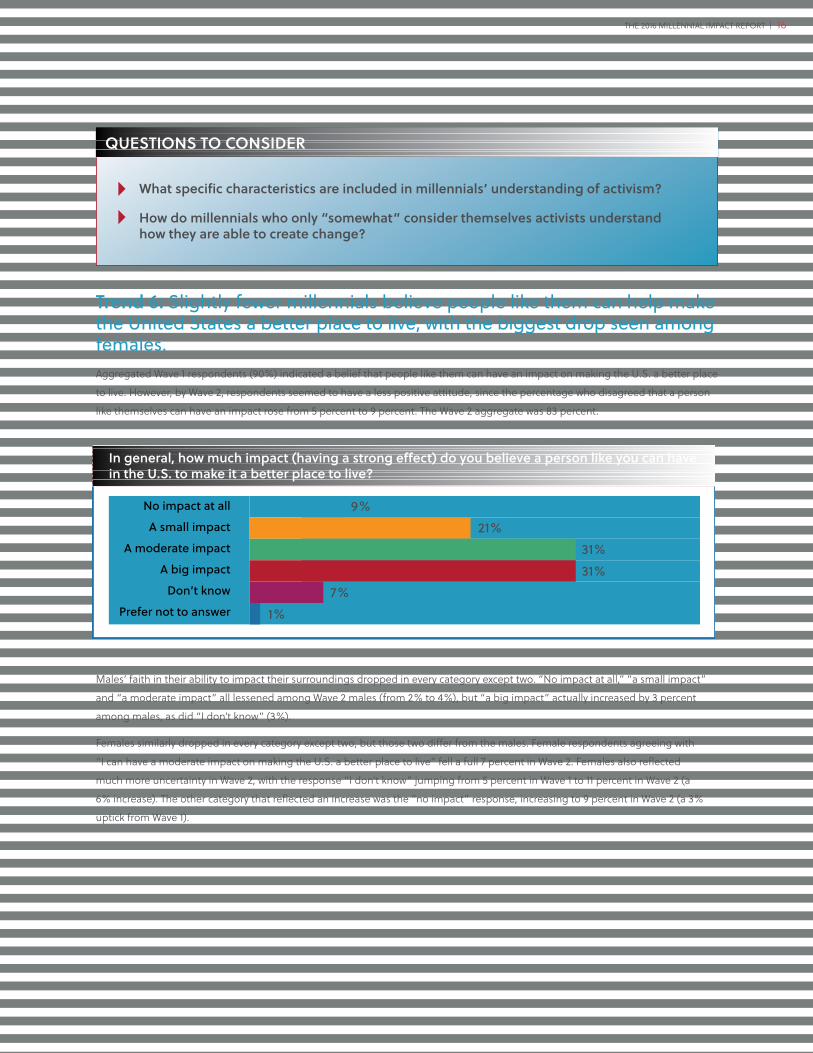
Trend 6: Slightly fewer millennials believe people like them can help make the United States a better place to live, with the biggest drop seen among females.Aggregated Wave 1 respondents (90%) indicated a belief that people like them can have an impact on making the U.S. a better place
to live. However, by Wave 2, respondents seemed to have a less positive attitude, since the percentage who disagreed that a person
like themselves can have an impact rose from 5 percent to 9 percent. The Wave 2 aggregate was 83 percent.
In general, how much impact (having a strong effect) do you believe a person like you can have in the U.S. to make it a be�er place to live?
No impact at all
A small impact
A moderate impact
A big impact
Don’t know
Prefer not to answer
9%21%
31%31%
7%1%
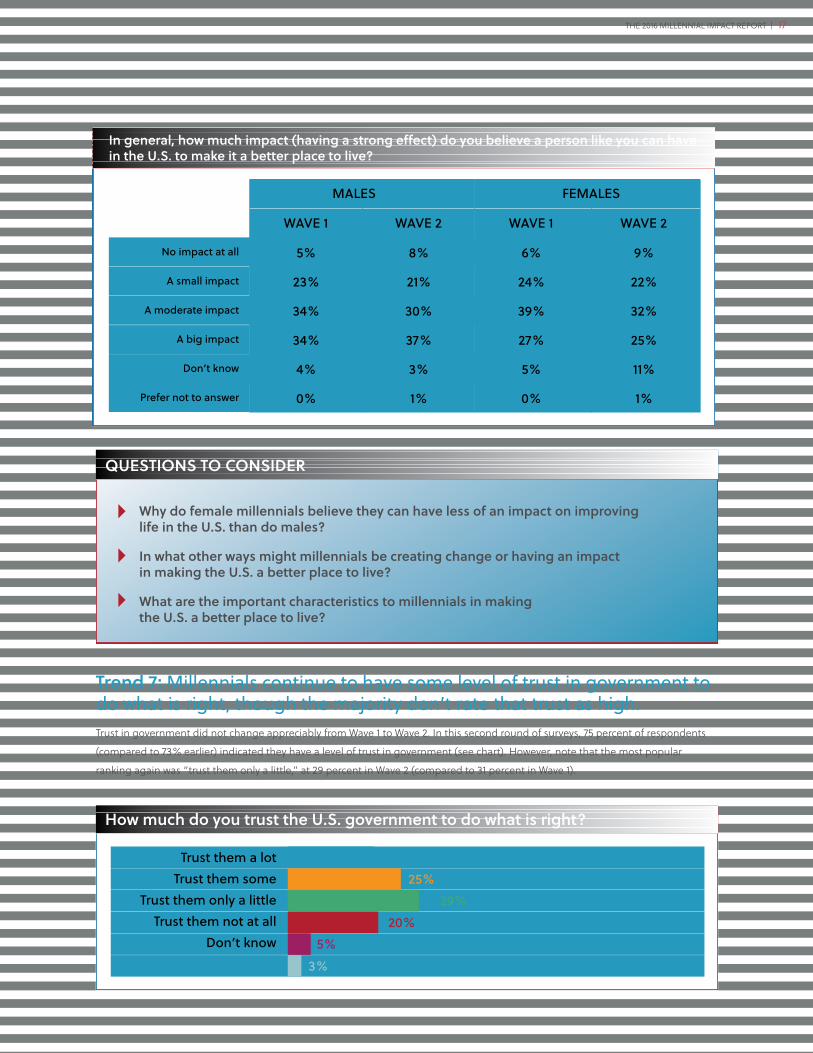
Males’ faith in their ability to impact their surroundings dropped in every category except two. “No impact at all,” “a small impact”
and “a moderate impact” all lessened among Wave 2 males (from 2% to 4%), but “a big impact” actually increased by 3 percent
among males, as did “I don’t know” (3%).
Females similarly dropped in every category except two, but those two differ from the males. Female respondents agreeing with
“I can have a moderate impact on making the U.S. a better place to live” fell a full 7 percent in Wave 2. Females also reflected
much more uncertainty in Wave 2, with the response “I don’t know” jumping from 5 percent in Wave 1 to 11 percent in Wave 2 (a
6% increase). The other category that reflected an increase was the “no impact” response, increasing to 9 percent in Wave 2 (a 3%
uptick from Wave 1).
THE 2016 MILLENNIAL IMPACT REPORT | 17
In general, how much impact (having a strong effect) do you believe a person like you can have in the U.S. to make it a be�er place to live?
No impact at all
A small impact
A moderate impact
A big impact
Don’t know
Prefer not to answer
MALES FEMALES
WAVE 1
5%
23%
34%
34%
4%
0%
WAVE 2
8%
21%
30%
37%
3%
1%
WAVE 1
6%
24%
39%
27%
5%
0%
WAVE 2
9%
22%
32%
25%
11%
1%
QUESTIONS TO CONSIDER
Why do female millennials believe they can have less of an impact on improving life in the U.S. than do males?
In what other ways might millennials be creating change or having an impactin making the U.S. a be�er place to live?
What are the important characteristics to millennials in makingthe U.S. a be�er place to live?
Trend 7: Millennials continue to have some level of trust in government to do what is right, though the majority don’t rate that trust as high.Trust in government did not change appreciably from Wave 1 to Wave 2. In this second round of surveys, 75 percent of respondents
(compared to 73% earlier) indicated they have a level of trust in government (see chart). However, note that the most popular
ranking again was “trust them only a little,” at 29 percent in Wave 2 (compared to 31 percent in Wave 1).
How much do you trust the U.S. government to do what is right?
Trust them a lotTrust them some
Trust them only a li�leTrust them not at all
Don’t knowPrefer not to answer
19%25%
29%20%
5%3%
THE 2016 MILLENNIAL IMPACT REPORT | 18
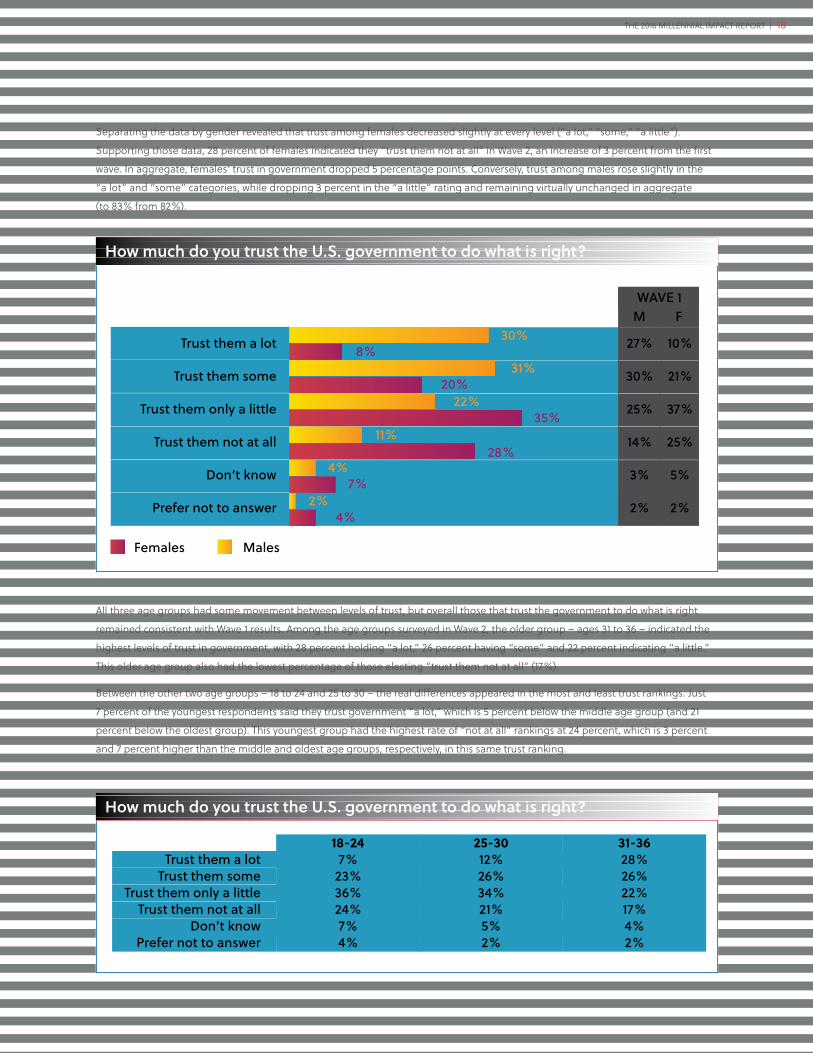
Separating the data by gender revealed that trust among females decreased slightly at every level (“a lot,” “some,” “a little”).
Supporting those data, 28 percent of females indicated they “trust them not at all” in Wave 2, an increase of 3 percent from the first
wave. In aggregate, females’ trust in government dropped 5 percentage points. Conversely, trust among males rose slightly in the
“a lot” and “some” categories, while dropping 3 percent in the “a little” rating and remaining virtually unchanged in aggregate
(to 83% from 82%).
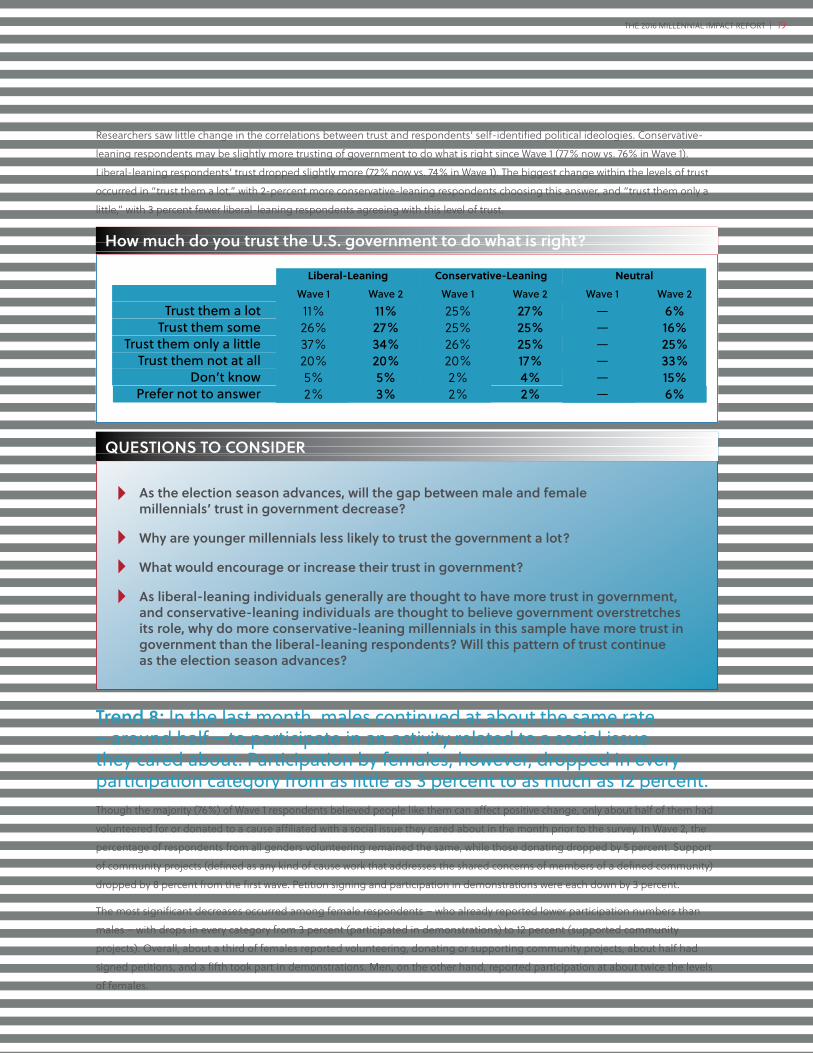
All three age groups had some movement between levels of trust, but overall those that trust the government to do what is right
remained consistent with Wave 1 results. Among the age groups surveyed in Wave 2, the older group – ages 31 to 36 – indicated the
highest levels of trust in government, with 28 percent holding “a lot,” 26 percent having “some” and 22 percent indicating “a little.”
This older age group also had the lowest percentage of those electing “trust them not at all” (17%).
Between the other two age groups – 18 to 24 and 25 to 30 – the real differences appeared in the most and least trust rankings. Just
7 percent of the youngest respondents said they trust government “a lot,” which is 5 percent below the middle age group (and 21
percent below the oldest group). This youngest group had the highest rate of “not at all” rankings at 24 percent, which is 3 percent
and 7 percent higher than the middle and oldest age groups, respectively, in this same trust ranking.
How much do you trust the U.S. government to do what is right?
Trust them a lotTrust them some
Trust them only a li�leTrust them not at all
Don’t knowPrefer not to answer
18-247%
23%36%24%7%4%
31-3628%26%22%17%4%2%
25-3012%26%34%21%5%2%
How much do you trust the U.S. government to do what is right?
Trust them a lot
Trust them some
Trust them only a li�le
Trust them not at all
Don’t know
Prefer not to answer
10%
21%
37%
25%
5%
2%
27%
30%
25%
14%
3%
2%
WAVE 1M F
30%8%
31%20%
22%35%
11%28%
4%7%
2%4%
Females Males
THE 2016 MILLENNIAL IMPACT REPORT | 19
Researchers saw little change in the correlations between trust and respondents’ self-identified political ideologies. Conservative-
leaning respondents may be slightly more trusting of government to do what is right since Wave 1 (77% now vs. 76% in Wave 1).
Liberal-leaning respondents’ trust dropped slightly more (72% now vs. 74% in Wave 1). The biggest change within the levels of trust
occurred in “trust them a lot,” with 2-percent more conservative-leaning respondents choosing this answer, and “trust them only a
little,” with 3 percent fewer liberal-leaning respondents agreeing with this level of trust.
How much do you trust the U.S. government to do what is right?
Trust them a lotTrust them some
Trust them only a li�leTrust them not at all
Don’t knowPrefer not to answer
Liberal-Leaning NeutralConservative-LeaningWave 111%26%37%20%5%2%
Wave 211%27%34%20%5%3%
Wave 125%25%26%20%2%2%
Wave 227%25%25%17%4%2%
Wave 1——————
Wave 26%16%25%33%15%6%
QUESTIONS TO CONSIDER
As the election season advances, will the gap between male and female millennials’ trust in government decrease?
Why are younger millennials less likely to trust the government a lot?
What would encourage or increase their trust in government?
As liberal-leaning individuals generally are thought to have more trust in government, and conservative-leaning individuals are thought to believe government overstretches its role, why do more conservative-leaning millennials in this sample have more trust in government than the liberal-leaning respondents? Will this pa�ern of trust continue as the election season advances?
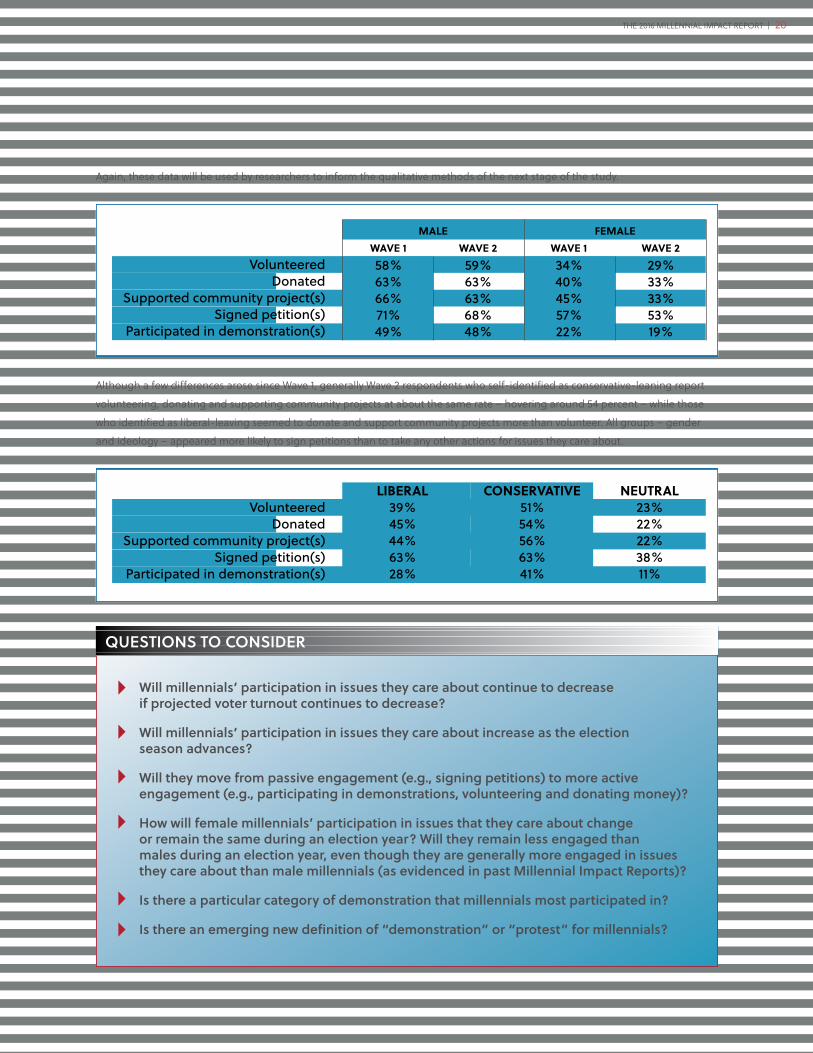
Trend 8: In the last month, males continued at about the same rate – around half – to participate in an activity related to a social issue they cared about. Participation by females, however, dropped in every participation category from as little as 3 percent to as much as 12 percent.Though the majority (76%) of Wave 1 respondents believed people like them can affect positive change, only about half of them had
volunteered for or donated to a cause affiliated with a social issue they cared about in the month prior to the survey. In Wave 2, the
percentage of respondents from all genders volunteering remained the same, while those donating dropped by 5 percent. Support
of community projects (defined as any kind of cause work that addresses the shared concerns of members of a defined community)
dropped by 8 percent from the first wave. Petition signing and participation in demonstrations were each down by 3 percent.
The most significant decreases occurred among female respondents – who already reported lower participation numbers than
males – with drops in every category from 3 percent (participated in demonstrations) to 12 percent (supported community
projects). Overall, about a third of females reported volunteering, donating or supporting community projects, about half had
signed petitions, and a fifth took part in demonstrations. Men, on the other hand, reported participation at about twice the levels
of females.
THE 2016 MILLENNIAL IMPACT REPORT | 20
MALE FEMALE
VolunteeredDonated
Supported community project(s)Signed petition(s)
Participated in demonstration(s)
WAVE 158%63%66%71%49%
WAVE 259%63%63%68%48%
WAVE 134%40%45%57%22%
WAVE 229%33%33%53%19%
VolunteeredDonated
Supported community project(s)Signed petition(s)
Participated in demonstration(s)
LIBERAL39%45%44%63%28%
CONSERVATIVE51%54%56%63%41%
NEUTRAL23%22%22%38%11%
QUESTIONS TO CONSIDER
Will millennials’ participation in issues they care about continue to decrease if projected voter turnout continues to decrease?
Will millennials’ participation in issues they care about increase as the election season advances?
Will they move from passive engagement (e.g., signing petitions) to more activeengagement (e.g., participating in demonstrations, volunteering and donating money)?
How will female millennials’ participation in issues that they care about changeor remain the same during an election year? Will they remain less engaged thanmales during an election year, even though they are generally more engaged in issues they care about than male millennials (as evidenced in past Millennial Impact Reports)?
Is there a particular category of demonstration that millennials most participated in?
Is there an emerging new definition of “demonstration” or “protest” for millennials?
Although a few differences arose since Wave 1, generally Wave 2 respondents who self-identified as conservative-leaning report
volunteering, donating and supporting community projects at about the same rate – hovering around 54 percent – while those
who identified as liberal-leaving seemed to donate and support community projects more than volunteer. All groups – gender
and ideology – appeared more likely to sign petitions than to take any other actions for issues they care about.
Again, these data will be used by researchers to inform the qualitative methods of the next stage of the study.
THE 2016 MILLENNIAL IMPACT REPORT | 21
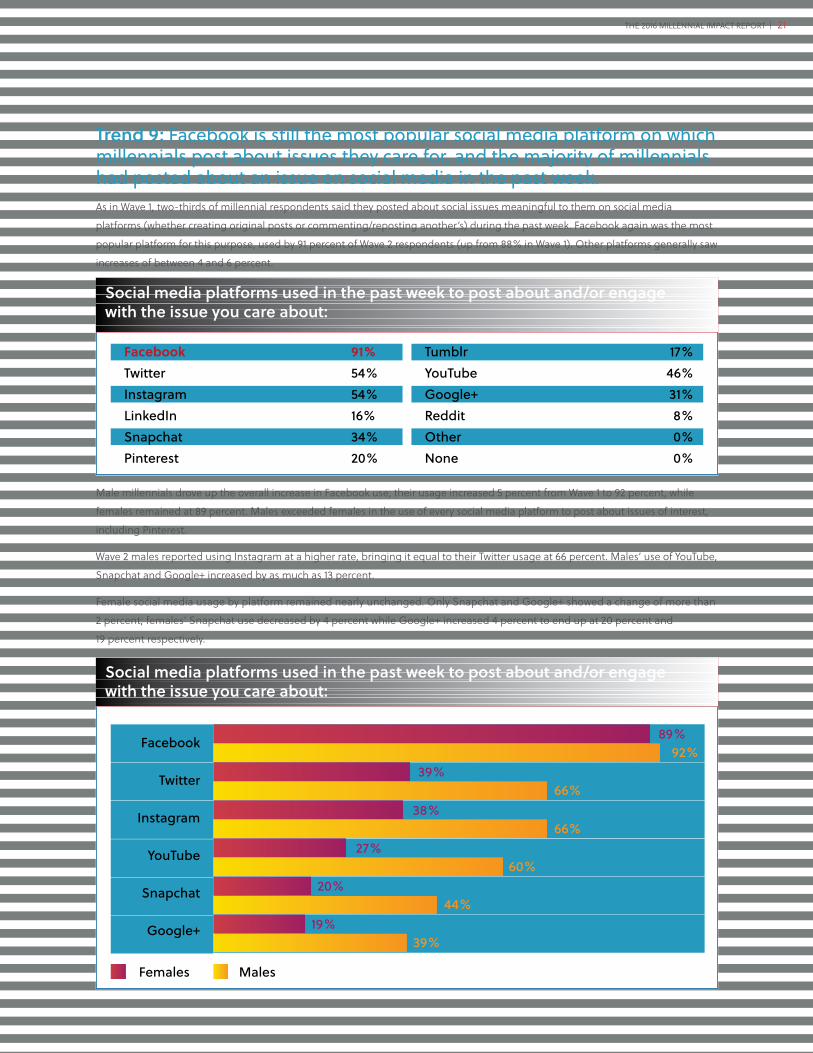
Trend 9: Facebook is still the most popular social media platform on which millennials post about issues they care for, and the majority of millennials had posted about an issue on social media in the past week.As in Wave 1, two-thirds of millennial respondents said they posted about social issues meaningful to them on social media
platforms (whether creating original posts or commenting/reposting another’s) during the past week. Facebook again was the most
popular platform for this purpose, used by 91 percent of Wave 2 respondents (up from 88% in Wave 1). Other platforms generally saw
increases of between 4 and 6 percent.
Social media platforms used in the past week to post about and/or engage with the issue you care about:
FacebookTwi�erInstagramLinkedInSnapchatPinterest
91%54%54%16%34%20%
TumblrYouTubeGoogle+RedditOtherNone
17%46%31%8%0%0%
Male millennials drove up the overall increase in Facebook use; their usage increased 5 percent from Wave 1 to 92 percent, while
females remained at 89 percent. Males exceeded females in the use of every social media platform to post about issues of interest,
including Pinterest.
Wave 2 males reported using Instagram at a higher rate, bringing it equal to their Twitter usage at 66 percent. Males’ use of YouTube,
Snapchat and Google+ increased by as much as 13 percent.
Female social media usage by platform remained nearly unchanged. Only Snapchat and Google+ showed a change of more than
2 percent; females’ Snapchat use decreased by 4 percent while Google+ increased 4 percent to end up at 20 percent and
19 percent respectively.
Social media platforms used in the past week to post about and/or engage with the issue you care about:
Twi�er
YouTube
Snapchat
Google+
MalesFemales
89%92%
39%66%
38%66%
27%60%
20%44%
19%39%
THE 2016 MILLENNIAL IMPACT REPORT | 22
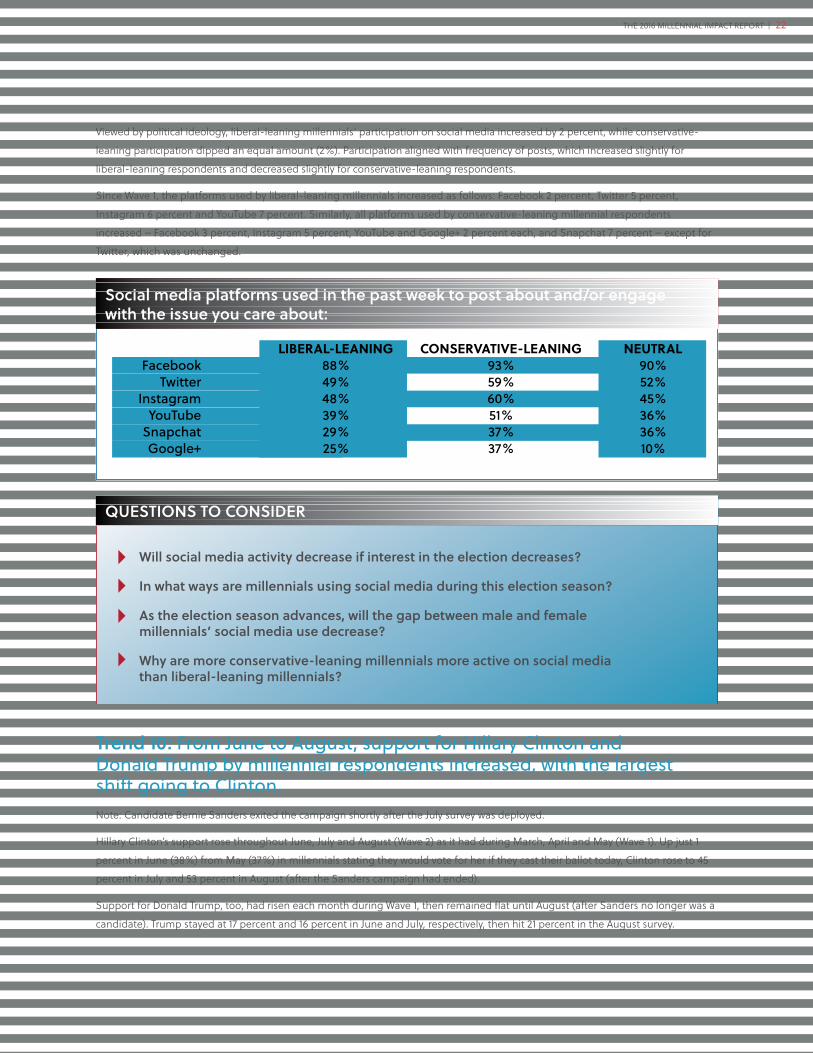
Viewed by political ideology, liberal-leaning millennials’ participation on social media increased by 2 percent, while conservative-
leaning participation dipped an equal amount (2%). Participation aligned with frequency of posts, which increased slightly for
liberal-leaning respondents and decreased slightly for conservative-leaning respondents.
Since Wave 1, the platforms used by liberal-leaning millennials increased as follows: Facebook 2 percent, Twitter 5 percent,
Instagram 6 percent and YouTube 7 percent. Similarly, all platforms used by conservative-leaning millennial respondents
increased – Facebook 3 percent, Instagram 5 percent, YouTube and Google+ 2 percent each, and Snapchat 7 percent – except for
Twitter, which was unchanged.
FacebookTwi�er
InstagramYouTube
SnapchatGoogle+
LIBERAL-LEANING88%49%48%39%29%25%
CONSERVATIVE-LEANING93%59%60%51%37%37%
NEUTRAL90%52%45%36%36%10%
Social media platforms used in the past week to post about and/or engage with the issue you care about:
QUESTIONS TO CONSIDER
Will social media activity decrease if interest in the election decreases?
In what ways are millennials using social media during this election season?
As the election season advances, will the gap between male and femalemillennials’ social media use decrease?
Why are more conservative-leaning millennials more active on social mediathan liberal-leaning millennials?
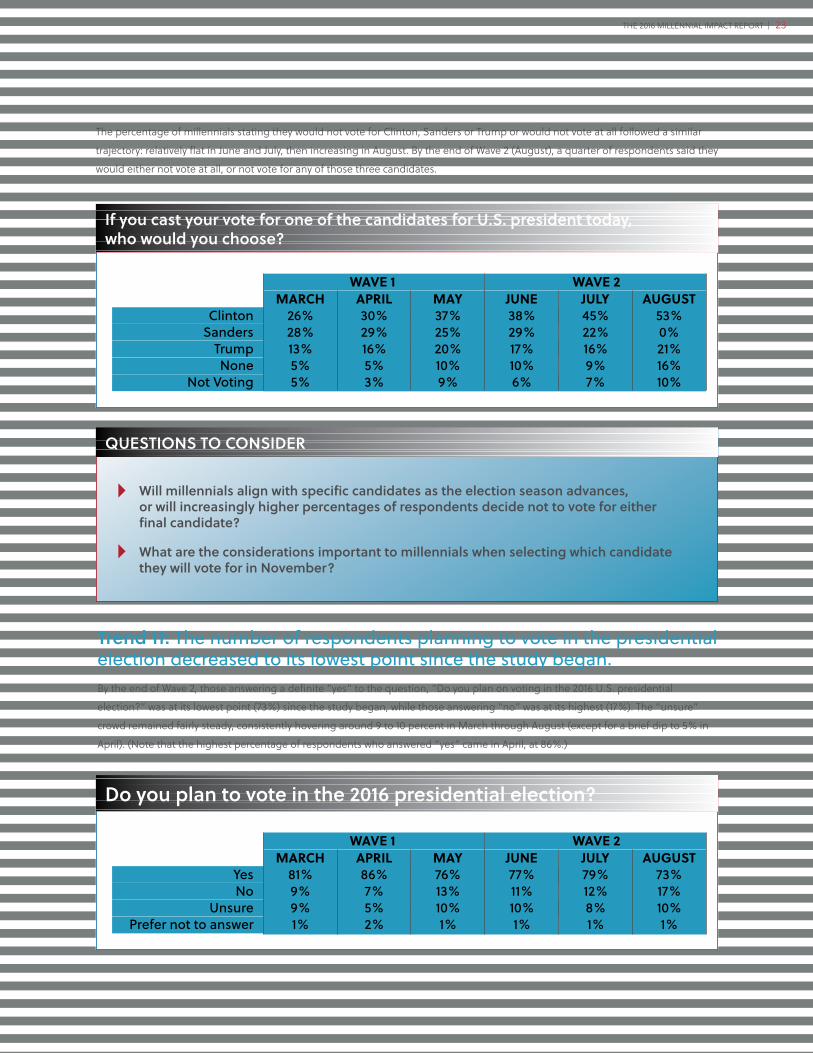
Trend 10: From June to August, support for Hillary Clinton and Donald Trump by millennial respondents increased, with the largest shift going to Clinton.Note: Candidate Bernie Sanders exited the campaign shortly after the July survey was deployed.
Hillary Clinton’s support rose throughout June, July and August (Wave 2) as it had during March, April and May (Wave 1). Up just 1
percent in June (38%) from May (37%) in millennials stating they would vote for her if they cast their ballot today, Clinton rose to 45
percent in July and 53 percent in August (after the Sanders campaign had ended).
Support for Donald Trump, too, had risen each month during Wave 1, then remained flat until August (after Sanders no longer was a
candidate). Trump stayed at 17 percent and 16 percent in June and July, respectively, then hit 21 percent in the August survey.
THE 2016 MILLENNIAL IMPACT REPORT | 23
ClintonSanders
TrumpNone
Not Voting
MARCH26%28%13%5%5%
MAY37%25%20%10%9%
AUGUST53%0%21%16%10%
If you cast your vote for one of the candidates for U.S. president today, who would you choose?
APRIL30%29%16%5%3%
JUNE38%29%17%10%6%
JULY45%22%16%9%7%
WAVE 1 WAVE 2
QUESTIONS TO CONSIDER
Will millennials align with specific candidates as the election season advances, or will increasingly higher percentages of respondents decide not to vote for either final candidate?
What are the considerations important to millennials when selecting which candidate they will vote for in November?
The percentage of millennials stating they would not vote for Clinton, Sanders or Trump or would not vote at all followed a similar
trajectory: relatively flat in June and July, then increasing in August. By the end of Wave 2 (August), a quarter of respondents said they
would either not vote at all, or not vote for any of those three candidates.
YesNo
UnsurePrefer not to answer
MARCH81%9%9%1%
MAY76%13%10%1%
AUGUST73%17%10%1%
Do you plan to vote in the 2016 presidential election?
APRIL86%7%5%2%
JUNE77%11%10%1%
JULY79%12%8%1%
WAVE 1 WAVE 2
Trend 11: The number of respondents planning to vote in the presidential election decreased to its lowest point since the study began.By the end of Wave 2, those answering a definite “yes” to the question, “Do you plan on voting in the 2016 U.S. presidential
election?” was at its lowest point (73%) since the study began, while those answering “no” was at its highest (17%). The “unsure”
crowd remained fairly steady, consistently hovering around 9 to 10 percent in March through August (except for a brief dip to 5% in
April). (Note that the highest percentage of respondents who answered “yes” came in April, at 86%.)
THE 2016 MILLENNIAL IMPACT REPORT | 24
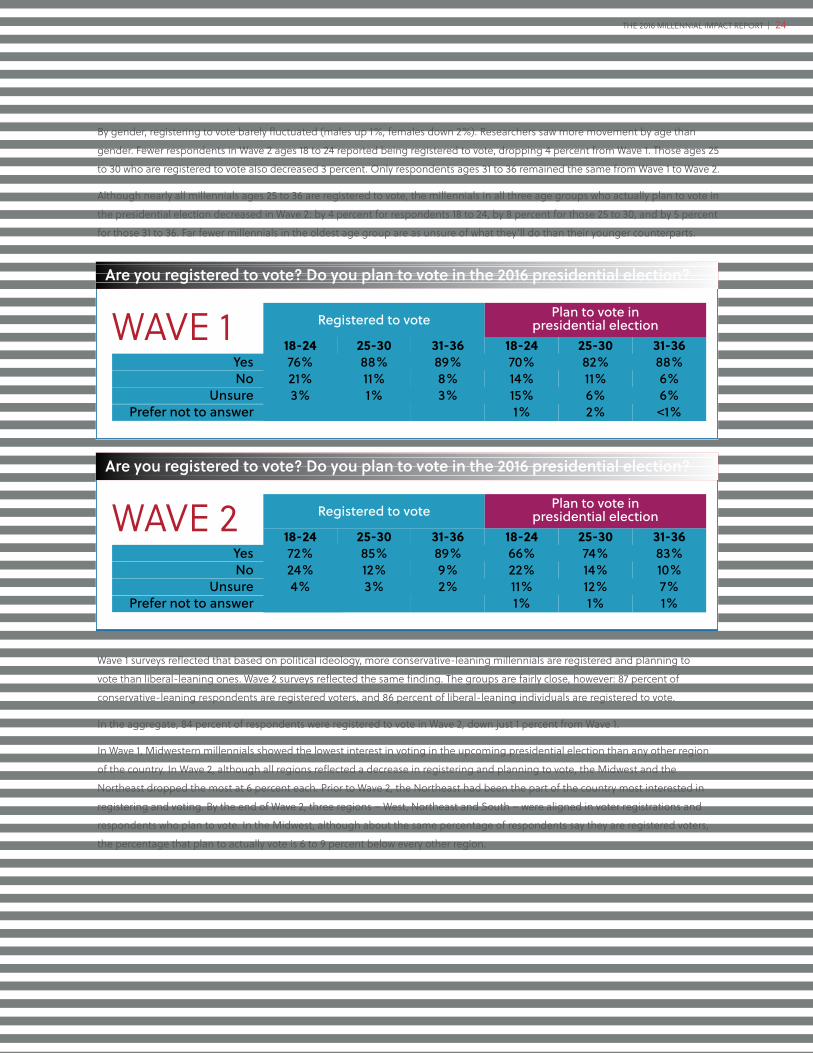
By gender, registering to vote barely fluctuated (males up 1%, females down 2%). Researchers saw more movement by age than
gender. Fewer respondents in Wave 2 ages 18 to 24 reported being registered to vote, dropping 4 percent from Wave 1. Those ages 25
to 30 who are registered to vote also decreased 3 percent. Only respondents ages 31 to 36 remained the same from Wave 1 to Wave 2.
Although nearly all millennials ages 25 to 36 are registered to vote, the millennials in all three age groups who actually plan to vote in
the presidential election decreased in Wave 2: by 4 percent for respondents 18 to 24, by 8 percent for those 25 to 30, and by 5 percent
for those 31 to 36. Far fewer millennials in the oldest age group are as unsure of what they’ll do than their younger counterparts.
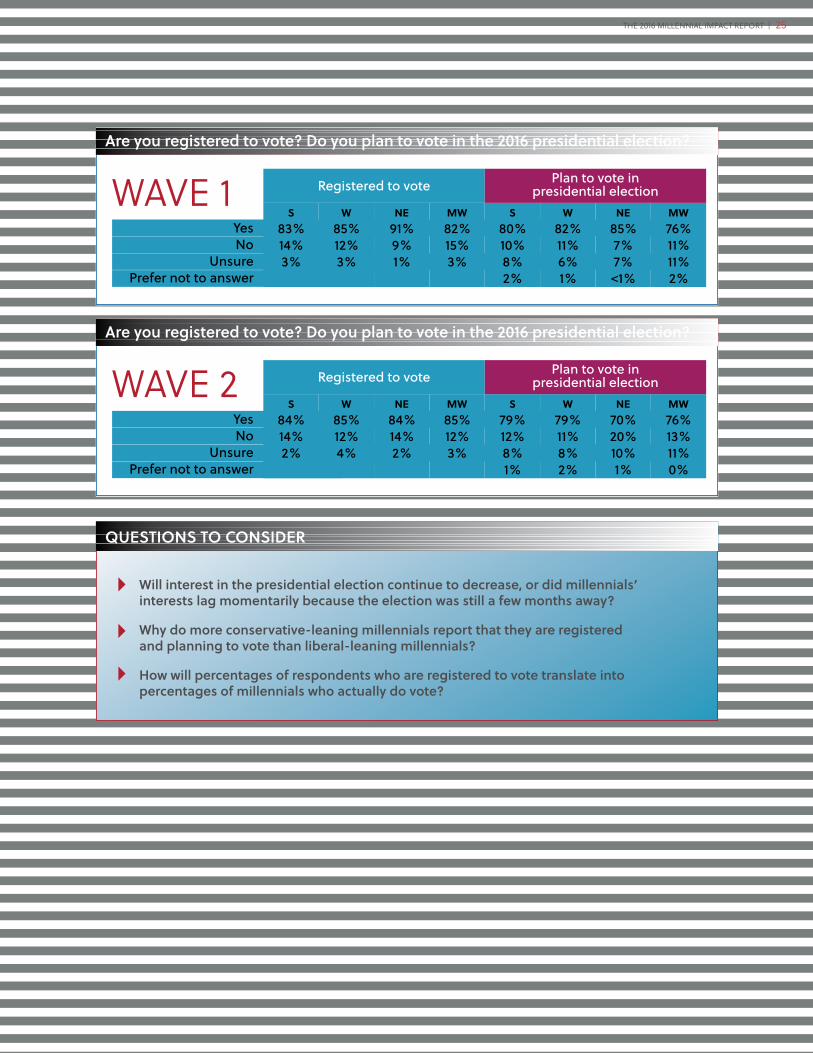
Wave 1 surveys reflected that based on political ideology, more conservative-leaning millennials are registered and planning to
vote than liberal-leaning ones. Wave 2 surveys reflected the same finding. The groups are fairly close, however: 87 percent of
conservative-leaning respondents are registered voters, and 86 percent of liberal-leaning individuals are registered to vote.
In the aggregate, 84 percent of respondents were registered to vote in Wave 2, down just 1 percent from Wave 1.
In Wave 1, Midwestern millennials showed the lowest interest in voting in the upcoming presidential election than any other region
of the country. In Wave 2, although all regions reflected a decrease in registering and planning to vote, the Midwest and the
Northeast dropped the most at 6 percent each. Prior to Wave 2, the Northeast had been the part of the country most interested in
registering and voting. By the end of Wave 2, three regions – West, Northeast and South – were aligned in voter registrations and
respondents who plan to vote. In the Midwest, although about the same percentage of respondents say they are registered voters,
the percentage that plan to actually vote is 6 to 9 percent below every other region.
YesNo
UnsurePrefer not to answer
18-2476%21%3%
Are you registered to vote? Do you plan to vote in the 2016 presidential election?
25-3088%11%1%
31-3689%8%3%
18-2470%14%15%1%
25-3082%11%6%2%
31-3688%6%6%<1%
Registered to vote Plan to vote in presidential electionWAVE 1
YesNo
UnsurePrefer not to answer
18-2472%24%4%
Are you registered to vote? Do you plan to vote in the 2016 presidential election?
25-3085%12%3%
31-3689%9%2%
18-2466%22%11%1%
25-3074%14%12%1%
31-3683%10%7%1%
Registered to vote Plan to vote in presidential electionWAVE 2
THE 2016 MILLENNIAL IMPACT REPORT | 25
YesNo
UnsurePrefer not to answer
S83%14%3%
W85%12%3%
NE91%9%1%
MW82%15%3%
S80%10%8%2%
W82%11%6%1%
NE85%7%7%<1%
MW76%11%11%2%
Are you registered to vote? Do you plan to vote in the 2016 presidential election?
Registered to vote Plan to vote in presidential electionWAVE 1
YesNo
UnsurePrefer not to answer
S84%14%2%
W85%12%4%
NE84%14%2%
MW85%12%3%
S79%12%8%1%
W79%11%8%2%
NE70%20%10%1%
MW76%13%11%0%
Are you registered to vote? Do you plan to vote in the 2016 presidential election?
Registered to vote Plan to vote in presidential electionWAVE 2
QUESTIONS TO CONSIDER
Will interest in the presidential election continue to decrease, or did millennials’ interests lag momentarily because the election was still a few months away?
Why do more conservative-leaning millennials report that they are registeredand planning to vote than liberal-leaning millennials?
How will percentages of respondents who are registered to vote translate intopercentages of millennials who actually do vote?
THE 2016 MILLENNIAL IMPACT REPORT | 26
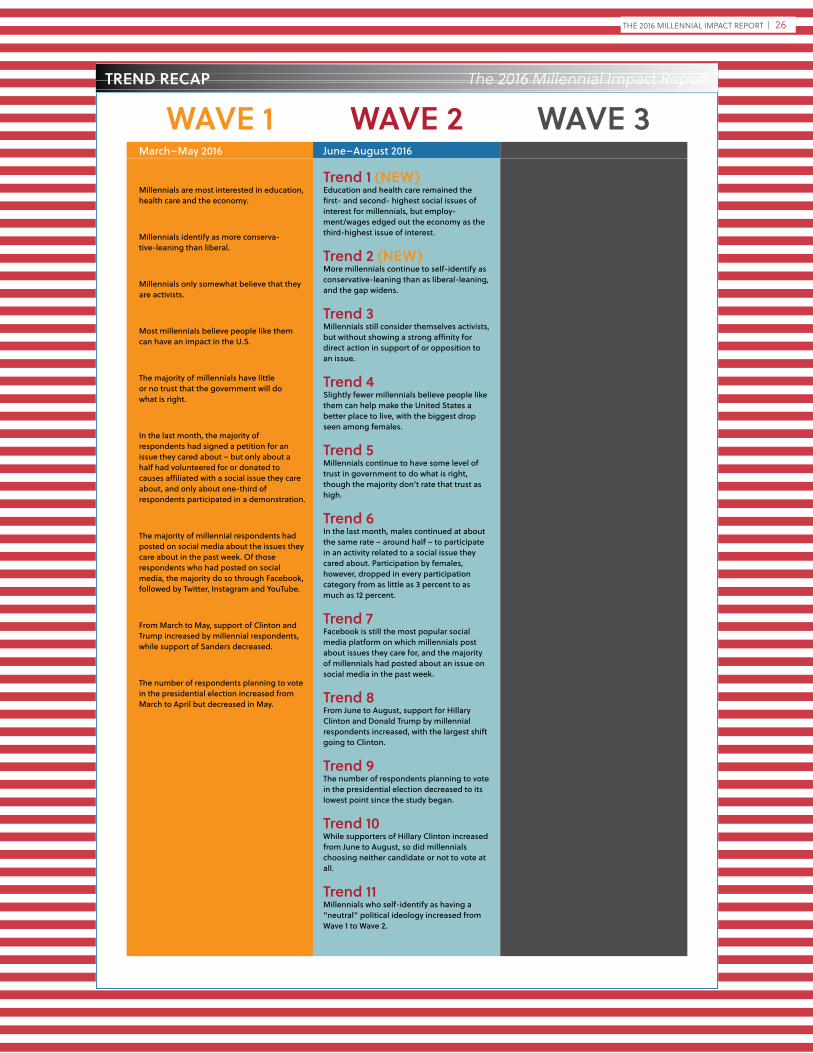
TREND RECAP The 2016 Millennial Impact Report
WAVE 1 WAVE 2 WAVE 3Trend 1Millennials are most interested in education, health care and the economy.
Trend 2Millennials identify as more conserva-tive-leaning than liberal.
Trend 3Millennials only somewhat believe that they are activists.
Trend 4Most millennials believe people like them can have an impact in the U.S.
Trend 5The majority of millennials have li�le or no trust that the government will do what is right.
Trend 6In the last month, the majority of respondents had signed a petition for an issue they cared about – but only about a half had volunteered for or donated to causes affiliated with a social issue they care about, and only about one-third of respondents participated in a demonstration.
Trend 7The majority of millennial respondents had posted on social media about the issues they care about in the past week. Of those respondents who had posted on social media, the majority do so through Facebook, followed by Twi�er, Instagram and YouTube.
Trend 8From March to May, support of Clinton and Trump increased by millennial respondents, while support of Sanders decreased.
Trend 9The number of respondents planning to vote in the presidential election increased from March to April but decreased in May.
Trend 1 (NEW)Education and health care remained the first- and second- highest social issues of interest for millennials, but employ-ment/wages edged out the economy as the third-highest issue of interest.
Trend 2 (NEW)More millennials continue to self-identify as conservative-leaning than as liberal-leaning, and the gap widens.
Trend 3Millennials still consider themselves activists, but without showing a strong affinity for direct action in support of or opposition to an issue.
Trend 4Slightly fewer millennials believe people like them can help make the United States a be�er place to live, with the biggest drop seen among females.
Trend 5Millennials continue to have some level of trust in government to do what is right, though the majority don’t rate that trust as high.
Trend 6In the last month, males continued at about the same rate – around half – to participate in an activity related to a social issue they cared about. Participation by females, however, dropped in every participation category from as li�le as 3 percent to as much as 12 percent.
Trend 7Facebook is still the most popular social media platform on which millennials post about issues they care for, and the majority of millennials had posted about an issue on social media in the past week.
Trend 8From June to August, support for Hillary Clinton and Donald Trump by millennial respondents increased, with the largest shi� going to Clinton.
Trend 9The number of respondents planning to vote in the presidential election decreased to its lowest point since the study began.
Trend 10While supporters of Hillary Clinton increased from June to August, so did millennials choosing neither candidate or not to vote at all.
Trend 11Millennials who self-identify as having a “neutral” political ideology increased from Wave 1 to Wave 2.
Coming Nov. 2016
March–May 2016 June–August 2016

THE 2016 MILLENNIAL IMPACT REPORT | 27
LOOKING AHEADThis year’s presidential election campaign has provoked unprecedented interest across the country, and many unpredictable
events have elicited sometimes unexpected responses and activities among the citizens of the United States. As revealed by the
trends in this report (and others), some of those responses and activities have challenged conventional wisdom about millennials.
The research team notes again that this report provides only trends from two waves of survey data. The research is ongoing; as such,
this report cannot yet answer the research questions posed definitively.
As this study continues to unfold and patterns emerge, the Achieve research team will be paying particular attention to each of these
trends and attempting to answer questions they have engendered, particularly in the qualitative phase of data collection.
Future interviews with survey respondents will allow for more in-depth understanding of and greater context for these findings, both
of which are critical in drawing overall conclusions about millennials’ cause engagement behaviors during an election year.
Keep up with Achieve’s study on millennials and their engagement with causes and politics during a presidential election year
throughout 2016 at themillennialimpact.com, and look for the full results and findings of the study after Election Day.
WAVE 2 TRENDS
Research by
The Millennial Impact Projectthemillennialimpact.com
Supported by