watts water technologies, inc. annual report 2007
TRANSCRIPT
Innovative water solutions
Watts Water Technologies, Inc.
Annual Report 2007
3207 Watts Water techlology AR 009ƒ 2/28/08 2:26 PM Page 2
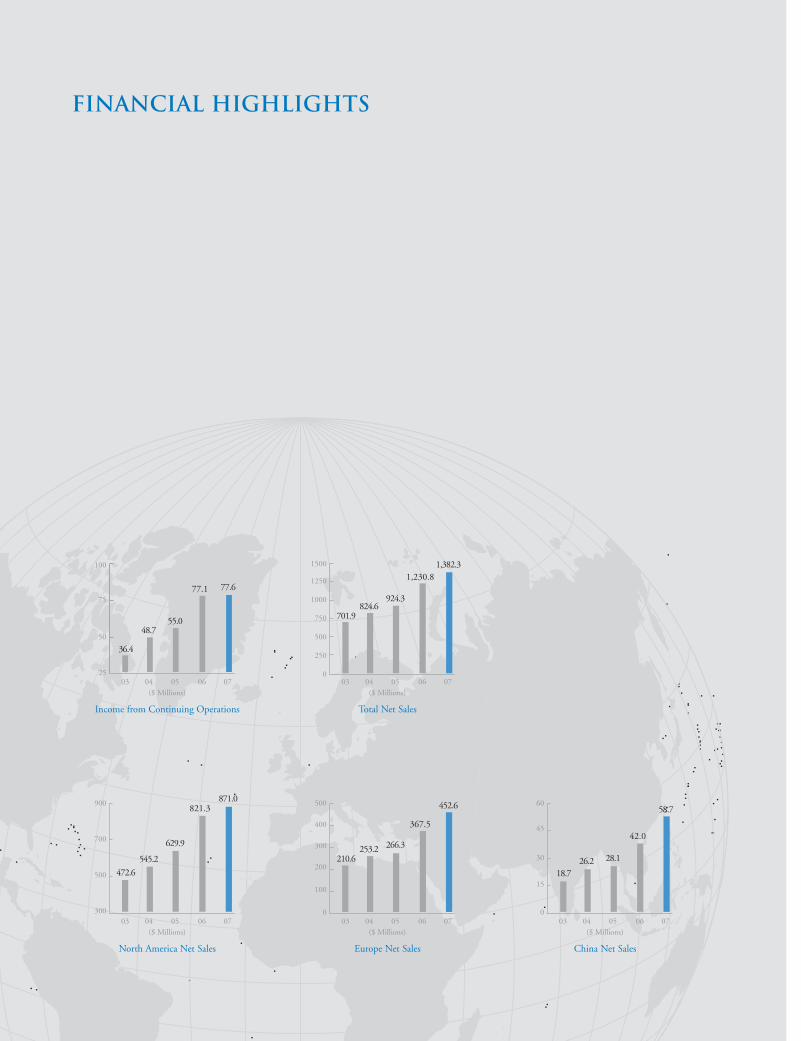
Financial highlights
36.4
03
Income from Continuing Operations
($ Millions)04 05 06 07
100
75
50
25
48.755.0
77.1 77.6
701.9
03
Total Net Sales
($ Millions)04 05 06 07
1500
1250
1000
750
500
250
0
824.6924.3
1,230.81,382.3
472.6
03
North America Net Sales
($ Millions)04 05 06 07
900
700
500
300
545.2
629.9
821.3871.0
210.6
03
Europe Net Sales
($ Millions)04 05 06 07
500
400
300
200
100
0
253.2 266.3
367.5
452.6
18.7
03
China Net Sales
($ Millions)04 05 06 07
60
45
30
15
0
26.2 28.1
42.0
58.7
Executive OfficersPatrick S. O'KeefeChief Executive Officer, President and Director
William C. McCartneyChief Financial Officer and Treasurer
J. Dennis CawteGroup Managing Director, Europe
Ernest E. ElliottExecutive Vice President of Marketing
Michael P. FlandersExecutive Vice President of Manufacturing Operations,North America and Asia
Josh C. FuPresident, Asia
Gregory J. MichaudExecutive Vice President of Human Resources
Taylor K. RobinsonExecutive Vice President of Supply Chain Management
Lester J. TaufenGeneral Counsel, Vice President of Legal Affairsand Secretary
Douglas T. WhiteGroup Vice President
DirectorsRobert L. AyersDirector
Richard J. CathcartDirector
Timothy P. HorneDirector
Ralph E. Jackson, Jr.Director
Kenneth J. McAvoyDirector
John K. McGillicuddyDirector
Gordon W. MoranNon-Executive Chairman of the Board and Director
Daniel J. Murphy, IIIDirector
Patrick S. O'KeefeChief Executive Officer, President and Director
CorporateInformationExecutive Offices815 Chestnut StreetNorth Andover, MA 01845-6098Tel. 978-688-1811 Fax. 978-688-2976
Registrar and Transfer AgentWells Fargo Bank, N.A.161 N. Concord ExchangeSouth St. Paul, MN 55075(800) 468-9716
CounselWilmerHale60 State StreetBoston, MA 02109
AuditorsKPMG LLP99 High StreetBoston, MA 02110
Stock ListingNew York Stock Exchange Ticker Symbol: WTS
Forward Looking Statements
This Annual Report contains “forward-looking” statements within the meaning of the Private Securities Litigation Reform Act of 1995. All statements that relate to
prospective events or developments are forward-looking statements. Also, words such as “believe,” “anticipate,” “plan,” “expect,” “will” and similar expressions
identify forward-looking statements. We cannot assure investors that our assumptions and expectations will prove to have been correct. There are a number of
important factors that could cause our actual results to differ materially from those indicated or implied by forward-looking statements. These factors include, but are not
limited to, those set forth in the section entitled “Risk Factors” in our Annual Report on Form 10-K for the year ended December 31, 2007 included in this Annual Report.
Except as required by law, we undertake no obligation to update or revise any forward-looking statements, whether as a result of new information, future events or otherwise.
For additional information on Watts Water Technologies, Inc., visit our web site at www.wattswater.com
481087.COVER.qx6 3/11/08 1:51 PM Page 2

Water is Essential for Life on Earth,
Watts is Essential for Water.
At Watts Water Technologies, Inc., our mission is to provide innovative products
that ensure the delivery of clean and safe water in a controlled and resource-conscious
manner to people around the world. We are carrying out this global mission by
working closely with engineers and plumbing code officials to update plumbing
codes thus ensuring that water is used safely in homes and buildings, and by working
to develop products designed specifically for use with renewable energies such as
solar and geothermal. In addition, we are working with the government in China
on large-scale water infrastructure projects to efficiently deliver water to residents
in this rapidly developing country.
Watts is uniquely positioned in the water industry. Our extensive product lines
range from large backflow prevention devices utilized in commercial applications
and municipal water delivery systems to under-sink water shutoff valves used in
your home. Our products address multiple markets including commercial and
residential construction, foodservice, fire protection, irrigation and waterworks.
Our disciplined acquisition strategy has fueled our growth by adding new
manufacturing and distribution capabilities, providing new technologies and
creating access to new markets. Finally, Watts’ 7,800 worldwide associates
carry out our mission daily. We believe these attributes set Watts apart and
will lead to our continued growth and success.
Our objective is
to increase value
by expanding
into new markets,
continuously
developing new
products for
existing markets,
making key
acquisitions and
reducing manu-
facturing costs.
WATTS WATER TECHNOLOGIES, INC. ANNUAL REPORT 2007 1
481087.P 3/12/08 11:09 PM Page 1

FocusedWatts Water Technologies, Inc. designs and manufactures valves and related products
that promote the comfort and safety of people and the quality, conservation and
control of water used in commercial, residential, industrial and municipal applications.
ccoommffoorrttWe sell a full range of engineered hydronic radiant heating and electric floor warming systems that enhance the lives of our customers.
qquuaalliittyyWe offer a broad range of reverse osmosis waterpurification systems andbackflow preventiondevices that protect and improve the qualityof drinking water.
SSaaffeettyyWe provide an extensiveline of hot water mixingvalves and heating safety units that deliver water safely to end users.
CCoonnsseerrvvaattiioonnWe manufacture a broadrange of water pressurereducing valves and conditioning equipmentthat promote the conservation of water.
CCoonnttrroollWe offer one of the most extensive lines of flow control valves,modules and accessoriesin the world.
Koike pipe hole cutter at Mueller Steam Specialty facility
St. Pauls, North Carolina
481087.P 08/03/14 2:06 PM Page 2
WATTS WATER TECHNOLOGIES, INC. ANNUAL REPORT 2007 3
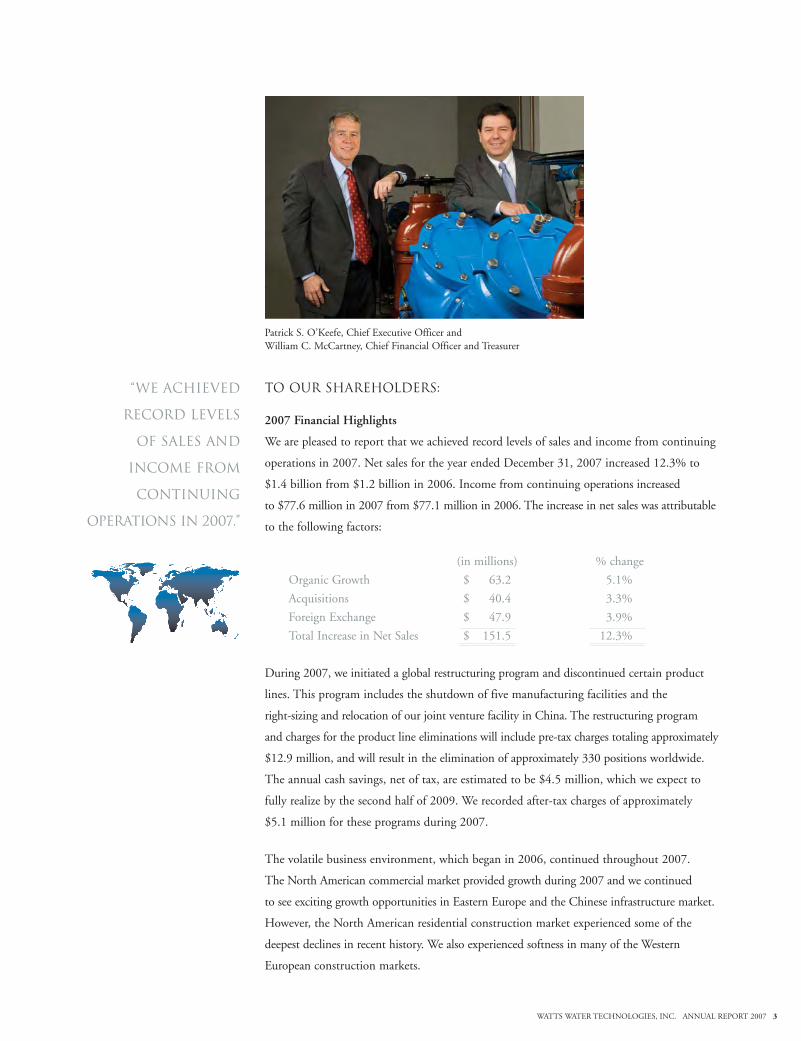
To our Shareholders:
2007 Financial Highlights
We are pleased to report that we achieved record levels of sales and income from continuing
operations in 2007. Net sales for the year ended December 31, 2007 increased 12.3% to
$1.4 billion from $1.2 billion in 2006. Income from continuing operations increased
to $77.6 million in 2007 from $77.1 million in 2006. The increase in net sales was attributable
to the following factors:
(in millions) % change
Organic Growth $ 63.2 5.1%
Acquisitions $ 40.4 3.3%
Foreign Exchange $ 47.9 3.9%
Total Increase in Net Sales $ 151.5 12.3%
During 2007, we initiated a global restructuring program and discontinued certain product
lines. This program includes the shutdown of five manufacturing facilities and the
right-sizing and relocation of our joint venture facility in China. The restructuring program
and charges for the product line eliminations will include pre-tax charges totaling approximately
$12.9 million, and will result in the elimination of approximately 330 positions worldwide.
The annual cash savings, net of tax, are estimated to be $4.5 million, which we expect to
fully realize by the second half of 2009. We recorded after-tax charges of approximately
$5.1 million for these programs during 2007.
The volatile business environment, which began in 2006, continued throughout 2007.
The North American commercial market provided growth during 2007 and we continued
to see exciting growth opportunities in Eastern Europe and the Chinese infrastructure market.
However, the North American residential construction market experienced some of the
deepest declines in recent history. We also experienced softness in many of the Western
European construction markets.
“we achieved
record levels
of sales and
income from
continuing
operations in 2007.”
Patrick S. O’Keefe, Chief Executive Officer and William C. McCartney, Chief Financial Officer and Treasurer
481087.P 3/12/08 11:12 PM Page 3

Watts continuously provides products to meet our customers’ needs.
Our team of design engineers and state of the art manufacturing and testing
facilities give Watts a distinct advantage in the marketplace.
innovativewater solutions
Powers thermostatic shower valve 3D computer
rendered CAD model
481087.P 3/11/08 2:06 PM Page 4
“We have introduced many new products that are
quickly gaining market acceptance.”
Despite this mixed environment we believe we are well positioned for continued growth and
we are optimistic as we look toward the future. We believe the diversity of our business model
is one of our key attributes. A significant percentage of our revenue comes from replacing the
installed base of many of our products. The vast majority of our revenue is generated from
products that are required to be installed by plumbing and building codes. We have thousands of
customers worldwide and our top ten customers accounted for only 22% of our revenue in 2007.
Our financial condition remains strong. At December 31, 2007 we had $290.3 million in
cash with a net debt to capital employed ratio of 13.5%. Please refer to page 41 of the
enclosed Annual Report on Form 10-K for a reconciliation of net debt to capital employed
to the nearest GAAP measures.
2007 was a year of many accomplishments. During 2007, we successfully implemented
a new North American enterprise resource planning system, which should enable us to
improve our working capital management, as well as our levels of customer service.
We have strengthened our management team in many areas and added more expertise to assist
us in managing our global supply chain as well as our international manufacturing operations.
We also welcomed Richard J. Cathcart as a member of our Board of Directors during 2007.
Mr. Cathcart has a distinguished career working in global manufacturing companies, which
address both residential and commercial water use, as well as building controls.
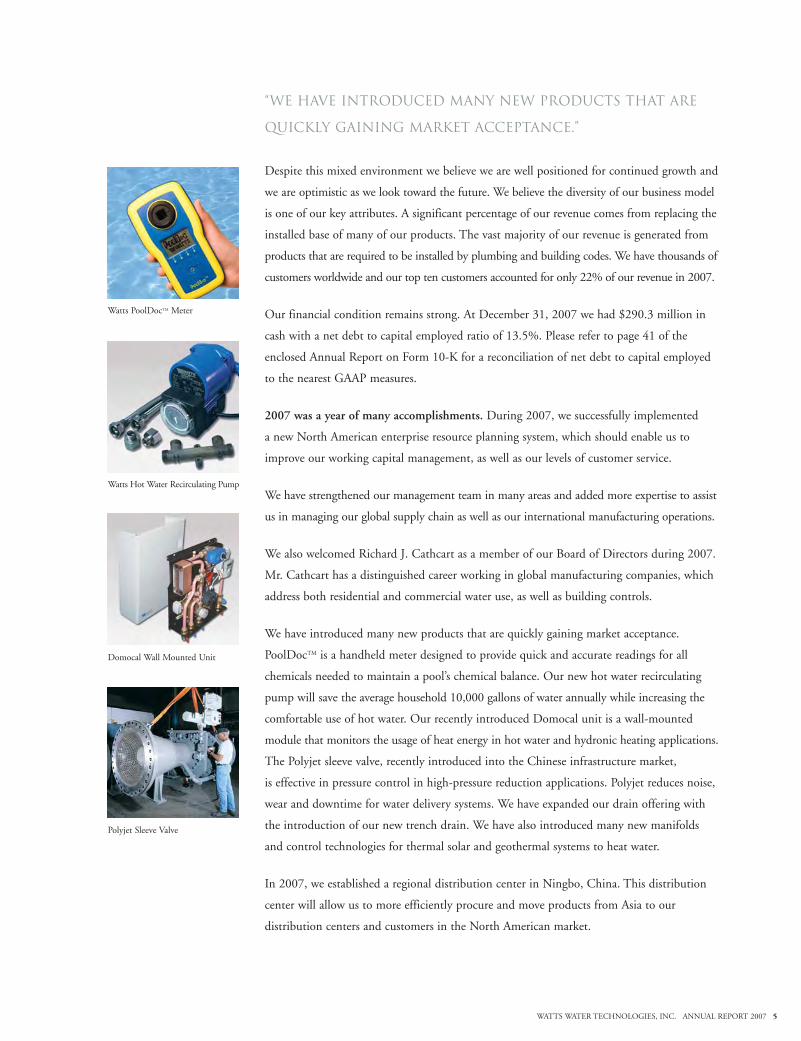
We have introduced many new products that are quickly gaining market acceptance.
PoolDocTM is a handheld meter designed to provide quick and accurate readings for all
chemicals needed to maintain a pool’s chemical balance. Our new hot water recirculating
pump will save the average household 10,000 gallons of water annually while increasing the
comfortable use of hot water. Our recently introduced Domocal unit is a wall-mounted
module that monitors the usage of heat energy in hot water and hydronic heating applications.
The Polyjet sleeve valve, recently introduced into the Chinese infrastructure market,
is effective in pressure control in high-pressure reduction applications. Polyjet reduces noise,
wear and downtime for water delivery systems. We have expanded our drain offering with
the introduction of our new trench drain. We have also introduced many new manifolds
and control technologies for thermal solar and geothermal systems to heat water.
In 2007, we established a regional distribution center in Ningbo, China. This distribution
center will allow us to more efficiently procure and move products from Asia to our
distribution centers and customers in the North American market.
WATTS WATER TECHNOLOGIES, INC. ANNUAL REPORT 2007 5
Watts PoolDocTM Meter
Watts Hot Water Recirculating Pump
Domocal Wall Mounted Unit
Polyjet Sleeve Valve
481087.P 3/12/08 11:13 PM Page 5

Watts has a proven track record of acquiring companies that fit into our
overall business strategy. These companies enhance our product offerings,
broaden our distribution capabilities and open new markets for our products.
DisciplinedAcquisition Strategy
Large diameter butterfly valve assembly line
Watts Valve (Changsha) Co., Ltd., Changsha, China
481087.P 3/12/08 11:13 PM Page 6
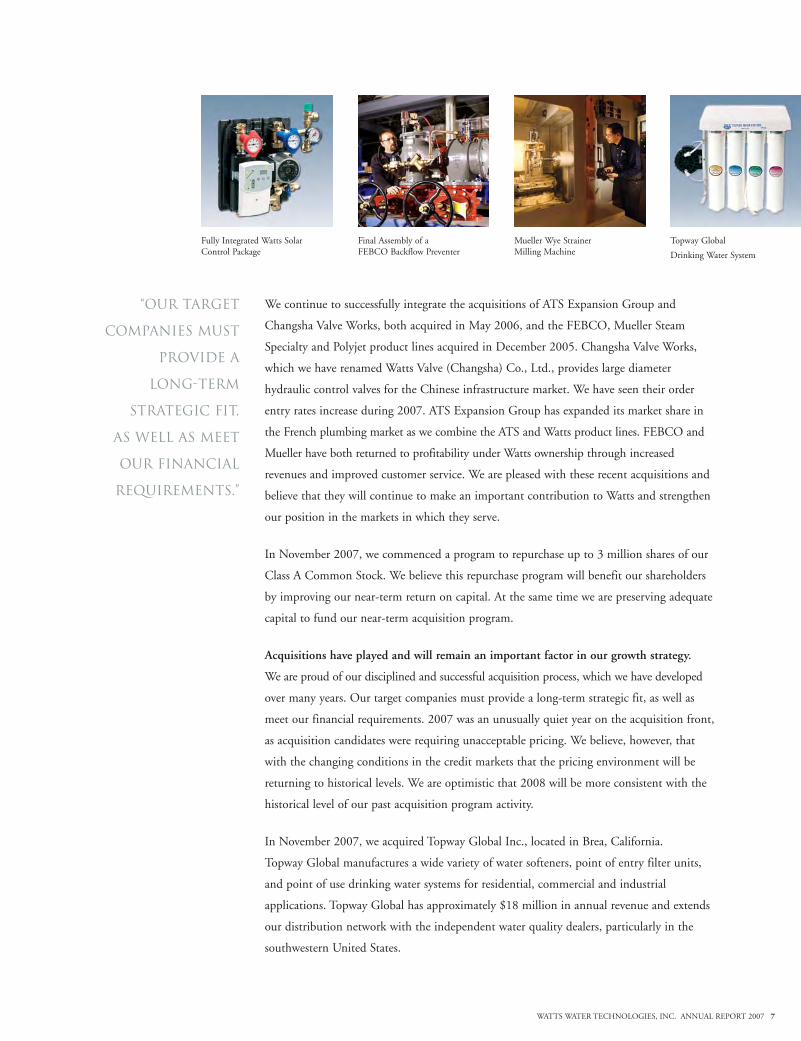
We continue to successfully integrate the acquisitions of ATS Expansion Group and
Changsha Valve Works, both acquired in May 2006, and the FEBCO, Mueller Steam
Specialty and Polyjet product lines acquired in December 2005. Changsha Valve Works,
which we have renamed Watts Valve (Changsha) Co., Ltd., provides large diameter
hydraulic control valves for the Chinese infrastructure market. We have seen their order
entry rates increase during 2007. ATS Expansion Group has expanded its market share in
the French plumbing market as we combine the ATS and Watts product lines. FEBCO and
Mueller have both returned to profitability under Watts ownership through increased
revenues and improved customer service. We are pleased with these recent acquisitions and
believe that they will continue to make an important contribution to Watts and strengthen
our position in the markets in which they serve.
In November 2007, we commenced a program to repurchase up to 3 million shares of our
Class A Common Stock. We believe this repurchase program will benefit our shareholders
by improving our near-term return on capital. At the same time we are preserving adequate
capital to fund our near-term acquisition program.
Acquisitions have played and will remain an important factor in our growth strategy.
We are proud of our disciplined and successful acquisition process, which we have developed
over many years. Our target companies must provide a long-term strategic fit, as well as
meet our financial requirements. 2007 was an unusually quiet year on the acquisition front,
as acquisition candidates were requiring unacceptable pricing. We believe, however, that
with the changing conditions in the credit markets that the pricing environment will be
returning to historical levels. We are optimistic that 2008 will be more consistent with the
historical level of our past acquisition program activity.
In November 2007, we acquired Topway Global Inc., located in Brea, California.
Topway Global manufactures a wide variety of water softeners, point of entry filter units,
and point of use drinking water systems for residential, commercial and industrial
applications. Topway Global has approximately $18 million in annual revenue and extends
our distribution network with the independent water quality dealers, particularly in the
southwestern United States.
WATTS WATER TECHNOLOGIES, INC. ANNUAL REPORT 2007 7
“Our target
companies must
provide a
long-term
strategic fit,
as well as meet
our financial
requirements.”
Fully Integrated Watts SolarControl Package
Mueller Wye Strainer Milling Machine
Topway Global
Drinking Water System
Final Assembly of a FEBCO Backflow Preventer
481087.P 3/12/08 11:14 PM Page 7

Watts is active around the world including developing products for
renewable energy sources in Europe, manufacturing products for the water
infrastructure market in Asia and providing new engineered products
for North America. We are active in many markets and have over 130 years
of experience from which to draw.
Well-positioned
Pudong New Area
Shanghai, China
481087.P 3/12/08 11:14 PM Page 8
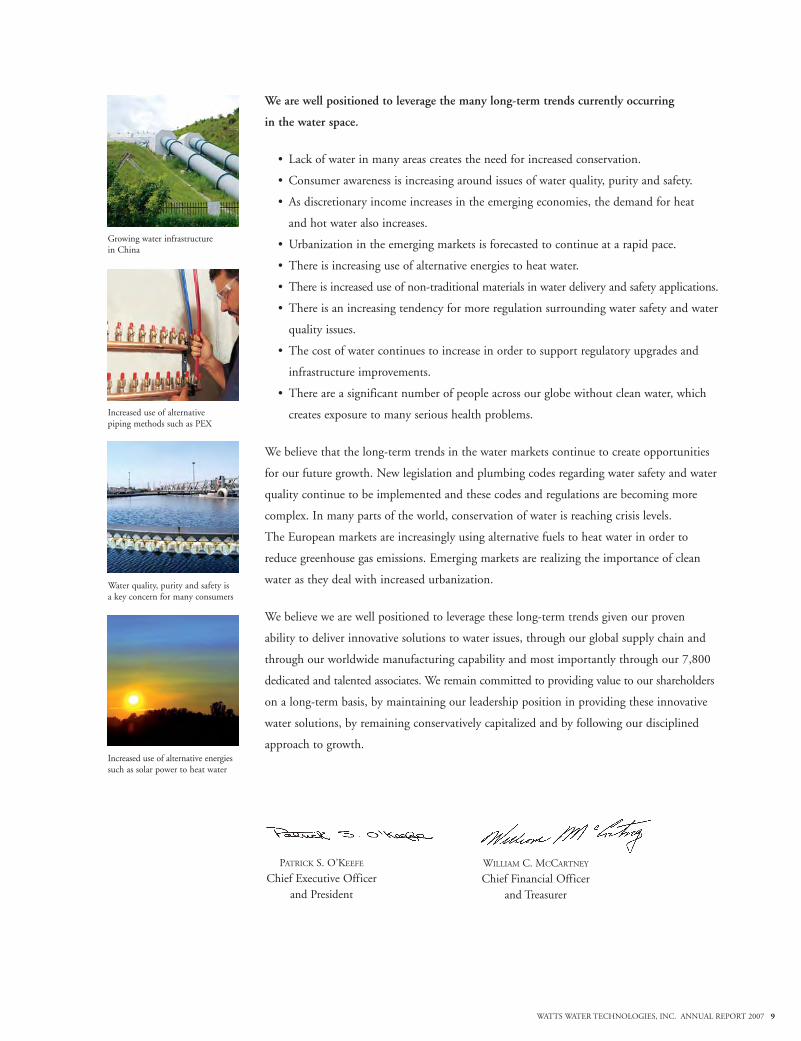
We are well positioned to leverage the many long-term trends currently occurring
in the water space.
• Lack of water in many areas creates the need for increased conservation.
• Consumer awareness is increasing around issues of water quality, purity and safety.
• As discretionary income increases in the emerging economies, the demand for heat
and hot water also increases.
• Urbanization in the emerging markets is forecasted to continue at a rapid pace.
• There is increasing use of alternative energies to heat water.
• There is increased use of non-traditional materials in water delivery and safety applications.
• There is an increasing tendency for more regulation surrounding water safety and water
quality issues.
• The cost of water continues to increase in order to support regulatory upgrades and
infrastructure improvements.
• There are a significant number of people across our globe without clean water, which
creates exposure to many serious health problems.
We believe that the long-term trends in the water markets continue to create opportunities
for our future growth. New legislation and plumbing codes regarding water safety and water
quality continue to be implemented and these codes and regulations are becoming more
complex. In many parts of the world, conservation of water is reaching crisis levels.
The European markets are increasingly using alternative fuels to heat water in order to
reduce greenhouse gas emissions. Emerging markets are realizing the importance of clean
water as they deal with increased urbanization.
We believe we are well positioned to leverage these long-term trends given our proven
ability to deliver innovative solutions to water issues, through our global supply chain and
through our worldwide manufacturing capability and most importantly through our 7,800
dedicated and talented associates. We remain committed to providing value to our shareholders
on a long-term basis, by maintaining our leadership position in providing these innovative
water solutions, by remaining conservatively capitalized and by following our disciplined
approach to growth.
WATTS WATER TECHNOLOGIES, INC. ANNUAL REPORT 2007 9
WILLIAM C. MCCARTNEY
Chief Financial Officer and Treasurer
PATRICK S. O’KEEFE
Chief Executive Officer and President
Growing water infrastructure in China
Increased use of alternative piping methods such as PEX
Water quality, purity and safety isa key concern for many consumers
Increased use of alternative energiessuch as solar power to heat water
481087.P 3/12/08 11:15 PM Page 9
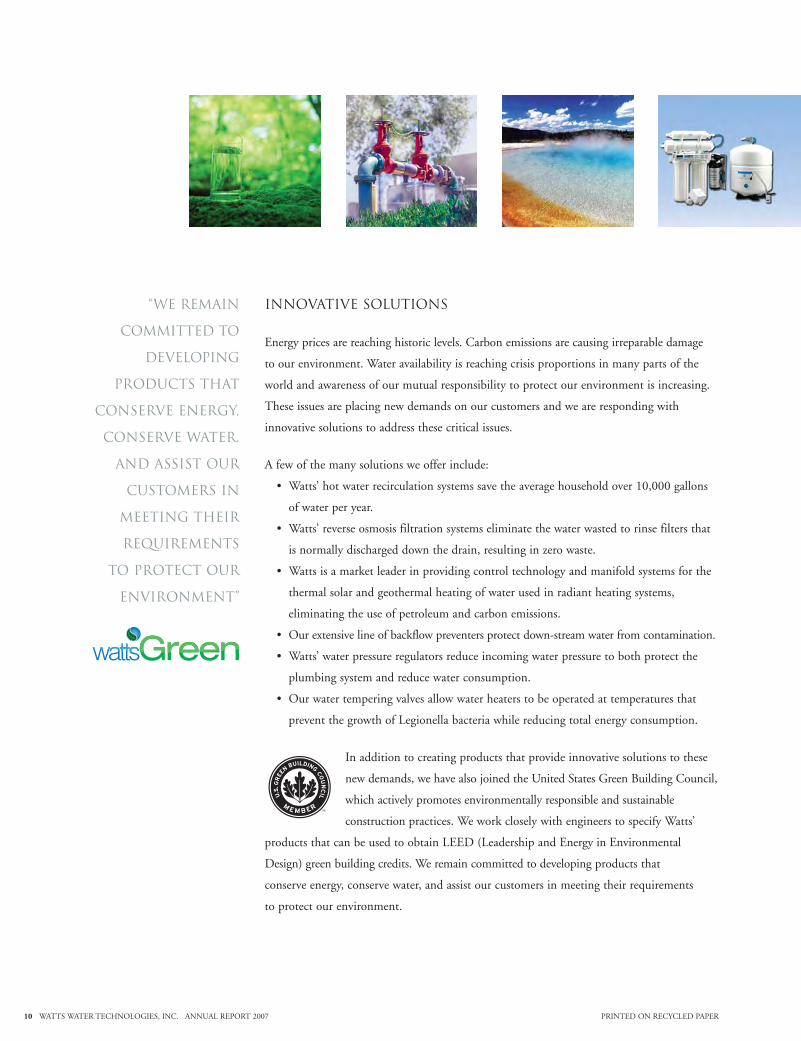
innovative solutions
Energy prices are reaching historic levels. Carbon emissions are causing irreparable damage
to our environment. Water availability is reaching crisis proportions in many parts of the
world and awareness of our mutual responsibility to protect our environment is increasing.
These issues are placing new demands on our customers and we are responding with
innovative solutions to address these critical issues.
A few of the many solutions we offer include:
• Watts’ hot water recirculation systems save the average household over 10,000 gallons
of water per year.
• Watts’ reverse osmosis filtration systems eliminate the water wasted to rinse filters that
is normally discharged down the drain, resulting in zero waste.
• Watts is a market leader in providing control technology and manifold systems for the
thermal solar and geothermal heating of water used in radiant heating systems,
eliminating the use of petroleum and carbon emissions.
• Our extensive line of backflow preventers protect down-stream water from contamination.
• Watts’ water pressure regulators reduce incoming water pressure to both protect the
• plumbing system and reduce water consumption.
• Our water tempering valves allow water heaters to be operated at temperatures that
• prevent the growth of Legionella bacteria while reducing total energy consumption.
In addition to creating products that provide innovative solutions to these
new demands, we have also joined the United States Green Building Council,
which actively promotes environmentally responsible and sustainable
construction practices. We work closely with engineers to specify Watts’
products that can be used to obtain LEED (Leadership and Energy in Environmental
Design) green building credits. We remain committed to developing products that
conserve energy, conserve water, and assist our customers in meeting their requirements
to protect our environment.
10 WATTS WATER TECHNOLOGIES, INC. ANNUAL REPORT 2007
“We remain
committed to
developing
products that
conserve energy,
conserve water,
and assist our
customers in
meeting their
requirements
to protect our
environment”
PRINTED ON RECYCLED PAPER
481087.P 08/03/14 2:07 PM Page 10
UNITED STATESSECURITIES AND EXCHANGE COMMISSION
Washington, D.C. 20549
FORM 10-K� ANNUAL REPORT PURSUANT TO SECTION 13 OR 15(d) OF THE
SECURITIES EXCHANGE ACT OF 1934For the fiscal year ended December 31, 2007
Or
� TRANSITION REPORT PURSUANT TO SECTION 13 OR 15(d) OF THESECURITIES EXCHANGE ACT OF 1934
Commission file number 001-11499
WATTS WATER TECHNOLOGIES, INC.(Exact name of registrant as specified in its charter)
Delaware 04-2916536(State or Other Jurisdiction of (I.R.S. EmployerIncorporation or Organization) Identification No.)
815 Chestnut Street, North Andover, MA 01845(Address of Principal Executive Offices) (Zip Code)
Registrant’s telephone number, including area code: (978) 688-1811
Securities registered pursuant to Section 12(b) of the Act:
Title of Each Class Name of Each Exchange on Which Registered
Class A Common Stock, par value $0.10 per share New York Stock Exchange
Securities registered pursuant to Section 12(g) of the Act: None
Indicate by check mark if the registrant is a well-known seasoned issuer, as defined in Rule 405 of the SecuritiesAct. Yes � No �
Indicate by check mark if the registrant is not required to file reports pursuant to Section 13 or Section 15(d) of the ExchangeAct. Yes � No �
Indicate by check mark whether the registrant (1) has filed all reports required to be filed by Section 13 or 15(d) of the SecuritiesExchange Act of 1934 during the preceding 12 months (or for such shorter period that the registrant was required to file such reports),and (2) has been subject to such filing requirements for the past 90 days. Yes � No �
Indicate by check mark if disclosure of delinquent filers pursuant to Item 405 of Regulation S-K is not contained herein, and willnot be contained, to the best of registrant’s knowledge, in definitive proxy or information statements incorporated by reference inPart III of this Form 10-K or any amendment to this Form 10-K. �
Indicate by check mark whether the registrant is a large accelerated filer, an accelerated filer, a non-accelerated filer, or a smallerreporting company. See the definitions of ‘‘large accelerated filer,’’ ‘‘accelerated filer’’ and ‘‘smaller reporting company’’ in Rule 12b-2 ofthe Exchange Act. (Check one):
Large accelerated filer � Accelerated filer �
Non-accelerated filer � Smaller reporting company �
(Do not check if a smaller reporting company)
Indicate by check mark whether the registrant is a shell company (as defined in Rule 12b-2 of the Exchange Act). Yes � No �
As of June 29, 2007, the aggregate market value of the registrant’s common stock held by non-affiliates of the registrant wasapproximately $1,170,291,367 based on the closing sale price as reported on the New York Stock Exchange.
Indicate the number of shares outstanding of each of the issuer’s classes of common stock, as of the latest practicable date.
Class Outstanding at February 22, 2008
Class A Common Stock, $0.10 par value per share 29,272,927 sharesClass B Common Stock, $0.10 par value per share 7,293,880 shares
DOCUMENTS INCOPORATED BY REFERENCE
Portions of the Registrant’s Proxy Statement for its Annual Meeting of Stockholders to be held on May 14, 2008, are incorporatedby reference into Part III of this Annual Report on Form 10-K.
PART I
Item 1. BUSINESS.
This annual report on Form 10-K contains statements which are not historical facts and are consideredforward-looking within the meaning of the Private Securities Litigation Reform Act of 1995. These forward-looking statements contain projections of our future results of operations or our financial position or stateother forward-looking information. In some cases you can identify these statements by forward-lookingwords such as ‘‘anticipate,’’ ‘‘believe,’’ ‘‘could,’’ ‘‘estimate,’’ ‘‘expect,’’ ‘‘intend,’’ ‘‘may,’’ ‘‘should,’’ ‘‘will’’ and‘‘would’’ or similar words. You should not rely on forward-looking statements, because they involve knownand unknown risks, uncertainties and other factors, some of which are beyond our control. These risks,uncertainties and other factors may cause our actual results, performance or achievements to differmaterially from the anticipated future results, performance or achievements expressed or implied by theforward-looking statements. Some of the factors that might cause these differences are described underItem 1A—‘‘Risk Factors.’’ You should carefully review all of these factors, and you should be aware thatthere may be other factors that could cause these differences. These forward-looking statements were basedon information, plans and estimates at the date of this report, and, except as required by law, we undertakeno obligation to update any forward-looking statements to reflect changes in underlying assumptions orfactors, new information, future events or other changes.
In this annual report on Form 10-K, references to ‘‘the Company,’’ ‘‘Watts,’’ ‘‘we,’’ ‘‘us’’ or ‘‘our’’refer to Watts Water Technologies, Inc. and its consolidated subsidiaries.
Overview
Watts Regulator Co. was founded by Joseph E. Watts in 1874 in Lawrence, Massachusetts. WattsRegulator Co. started as a small machine shop supplying parts to the New England textile mills of the19th century and grew into a global manufacturer of products and systems focused on the control,conservation and quality of water and the comfort and safety of the people using it. Watts WaterTechnologies, Inc. was incorporated in Delaware in 1985 and became the parent Company of WattsRegulator Co.
Our ‘‘Water by Watts’’ strategy is to be the leading provider of water quality, water conservation,water safety and water flow control products for the residential and commercial markets in NorthAmerica and Europe with an emerging presence in China. Our primary objective is to grow earnings byincreasing sales within existing markets, expanding into new markets, leveraging our distributionchannels and customer base, making selected acquisitions, reducing manufacturing costs and advocatingfor the development and enforcement of industry standards.
We intend to continue to introduce products in existing markets by enhancing our preferredbrands, developing new complementary products, promoting plumbing code development to drive salesof safety and water quality products and continually improving merchandising in both the do-it-yourself(DIY) and wholesale distribution channels. We continually target selected new product and geographicmarkets based on growth potential, including our ability to leverage our existing distribution channels.Additionally, we continually leverage our distribution channels through the introduction of newproducts, as well as the integration of products of our acquired companies.
We intend to continue to generate growth by targeting selected acquisitions, both in our coremarkets as well as new complementary markets. We have completed 31 acquisitions since divesting ourindustrial and oil and gas business in 1999, including one acquisition in 2007 and five acquisitions in2006. Our acquisition strategy focuses on businesses that manufacture preferred brand name productsthat address our themes of water quality, water safety, water conservation, water flow control andrelated complementary markets. We target businesses that will provide us with one or more of thefollowing: an entry into new markets, an increase in shelf space with existing customers, strong brandnames, a new or improved technology or an expansion of the breadth of our Water by Watts offering.
2
We are committed to reducing our manufacturing costs through a combination of expandingmanufacturing in lower-cost countries and consolidating our diverse manufacturing operations in NorthAmerica and Europe. We have acquired a number of manufacturing facilities in lower-cost regions suchas China, Bulgaria and Tunisia. In 2007, we announced a global restructuring plan to reduce ourmanufacturing footprint in order to reduce our costs and to realize additional operating efficiencies.
Our products are sold to wholesale distributors, major DIY chains and original equipmentmanufacturers (OEMs). Most of our sales are for products that have been approved under regulatorystandards incorporated into state and municipal plumbing, heating, building and fire protection codes inNorth America and Europe. We have consistently advocated the development and enforcement ofplumbing codes and are committed to providing products to meet these standards, particularly forsafety and control valve products. These codes serve as a competitive barrier to entry by requiring thatproducts sold in select states meet stringent criteria.
Additionally, a majority of our manufacturing facilities are ISO 9000, 9001 or 9002 certified by theInternational Organization for Standardization.
Our business is reported in three geographic segments: North America, Europe and China. Thecontributions of each segment to net sales, operating income and the presentation of certain otherfinancial information by segment are reported in Note 17 of the Notes to Consolidated FinancialStatements and in Management’s Discussion and Analysis included elsewhere in this report.
Recent Acquisitions
On November 9, 2007, we acquired the assets and business of Topway Global Inc. (Topway)located in Brea, California for approximately $18.4 million, of which $0.3 million of transaction costsremain to be paid. The preliminary allocations for goodwill and intangible assets are approximately$7.6 million and $8.2 million, respectively. The amount recorded as intangible assets is primarily forcustomer relationships with an estimated useful life of 10 years and trade names with indefinite lives.Topway manufactures a wide variety of water softeners, point of entry filter units, and point of usedrinking water systems for residential, commercial and industrial applications. The purchase priceallocation for Topway is preliminary pending the final determination of the fair values of certainassumed assets and liabilities.
On August 14, 2006, we acquired 100% of the outstanding stock of Black Teknigas, Limited(Teknigas) located in St. Neots, United Kingdom for approximately $8.7 million, which is net of cashacquired of approximately $0.3 million. The allocations for goodwill and intangible assets areapproximately $3.6 million and $4.5 million, respectively. The amount recorded as intangible assets isprimarily for technology and customer relationships that have estimated useful lives ranging from 6 to9 years and trade names with indefinite lives. Teknigas designs, develops and manufactures a range ofgas control products and systems for combustion, industrial, medical, laboratory and specialty gas.
On June 7, 2006, we acquired 100% of the outstanding stock of Kim Olofsson Safe CorporationAB (KimSafe) located in Almhult, Sweden for approximately $5.8 million, which is net of cash acquiredof approximately $2.9 million. The allocations for goodwill and intangible assets are approximately$1.2 million and $4.1 million, respectively. The amount recorded as intangible assets is primarily forcustomer relationships that have estimated useful lives of 5 years and trade names with indefinite lives.KimSafe manufactures electronic controls for heat pump, solar and pellet heaters, which provide theability to heat water using renewable energy.
On June 2, 2006, we acquired the assets and business of Calflex Manufacturing, Inc. (Calflex)located in Vernon, California and the stock of Ningo Best Metal & Plastic Manufacturing, Ltd(Ningbo) located in Ningbo, China for an aggregate of approximately $6.3 million. The allocation forintangible assets is approximately $2.1 million. The amount recorded as intangible assets is primarily forcustomer relationships that have estimated useful lives of 12 years and trade names with indefinitelives. Calflex and Ningbo distribute and manufacture water connectors.
3
On May 19, 2006, we acquired 100% of the outstanding stock of ATS Expansion Group (ATS)located in Sorgues, Grenoble and Hautvillers, France for approximately $62.1 million, which is net ofcash acquired of approximately $5.7 million plus assumed debt of approximately $14.1 million. Theallocations for goodwill and intangible assets are approximately $33.6 million and $25.6 million,respectively. The amount recorded as intangible assets is primarily for customer relationships withestimated useful lives of 6 years, patents with estimated useful lives from 6 to 12 years and trade nameswith indefinite lives. ATS’ products include a broad range of fittings, valves and manifolds for water,gas and heating applications and stainless steel flexible hoses.
On April 26, 2006, we acquired the assets and business of Changsha Valve Works (Changsha)located in Changsha, China for approximately $9.2 million. The allocations for goodwill and intangibleassets are approximately $5.7 million and $3.7 million, respectively. The amount recorded as intangibleassets is primarily for non-compete agreements that have estimated useful lives of 10 years andcustomer order backlog with an estimated useful life of 1 year. Changsha is a leading manufacturer oflarge diameter hydraulic-actuated butterfly valves for thermo-power and hydro-power plants, waterdistribution projects and water works projects in China.
Products
We believe that we have the broadest range of products in terms of design distinction, size andconfiguration in a majority of our principal product lines. In 2007, water quality products accounted forapproximately 18% of our total sales. Our principal product lines include:
• water quality products, including backflow preventers and check valves for preventing reverseflow within water lines and fire protection systems and point-of-use water filtration and reverseosmosis systems for both commercial and residential applications;
• a wide range of water pressure regulators for both commercial and residential applications;
• water supply and drainage products for commercial and residential applications;
• temperature and pressure relief valves for water heaters, boilers and associated systems;
• thermostatic mixing valves for tempering water in commercial and residential applications;
• systems for under-floor radiant applications and hydraulic pump groups for gas boilermanufacturers and renewable energy applications, including solar and heat pump controlpackages;
• flexible stainless steel connectors for natural and liquid propane gas in commercial food serviceand residential applications; and
• large diameter butterfly valves for use in China’s water infrastructure.
Customers and Markets
We sell our products to plumbing, heating and mechanical wholesale distributors, major DIYchains and OEMs.
Wholesalers. Approximately 65% of our sales in both 2007 and 2006 were to wholesaledistributors for both commercial and residential applications. We rely on commissioned manufacturers’representatives, some of which maintain a consigned inventory of our products, to market our productlines.
DIY. Approximately 15% and 16% of our sales in 2007 and 2006, respectively, were to DIYcustomers. Our DIY customers demand less technical products, but are highly receptive to innovativedesigns and new product ideas.
4
OEMs. Approximately 20% and 19% of our sales in 2007 and 2006, respectively, were toOEMs. In North America, our typical OEM customers are water heater manufacturers, equipmentmanufacturers needing flow control devices and water systems manufacturers needing backflowpreventers. Our sales to OEMs in Europe are primarily to boiler manufacturers and radiant systemsmanufacturers. Our sales to OEMs in China are primarily to boiler and bath manufacturers, whichinclude manufacturers of faucet and shower products.
In 2007, no customer accounted for more than 10% of our total net sales. Our top ten customersaccounted for approximately $304.3 million, or 22%, of our total net sales in 2007 and $282.3 million,or 23%, of our total net sales in 2006. Thousands of other customers constituted the remaining 78% ofour net sales in 2007 and 77% of our net sales in 2006.
Marketing and Sales
We rely primarily on commissioned manufacturers’ representatives, some of which maintain aconsigned inventory of our products. These representatives sell primarily to plumbing and heatingwholesalers or service DIY store locations in North America. We also sell products for the residentialconstruction and home repair and remodeling industries through DIY plumbing retailers, nationalcatalog distribution companies, hardware stores, building material outlets and retail home center chainsand through plumbing and heating wholesalers. In addition, we sell products directly to certain largeOEMs and private label accounts.
Manufacturing
We have integrated and automated manufacturing capabilities, including bronze foundries,machining, plastic injection molding and assembly operations. Our foundry operations include metalpouring systems, automatic core making, yellow brass forging and brass and bronze die-castings. Ourmachining operations feature computer-controlled machine tools, high-speed chucking machines withrobotics and automatic screw machines for machining bronze, brass and steel components. We haveinvested heavily in recent years to expand our manufacturing base and to ensure the availability of themost efficient and productive equipment. We are committed to maintaining our manufacturingequipment at a level consistent with current technology in order to maintain high levels of quality andmanufacturing efficiencies.
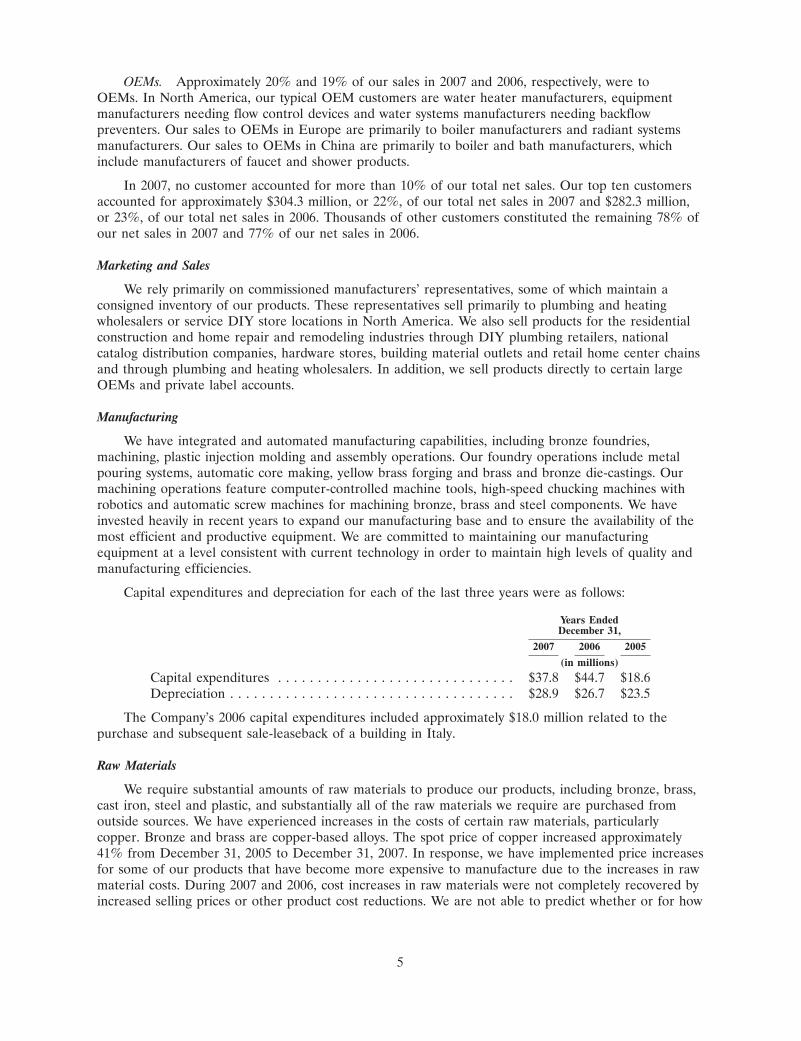
Capital expenditures and depreciation for each of the last three years were as follows:
Years EndedDecember 31,
2007 2006 2005
(in millions)
Capital expenditures . . . . . . . . . . . . . . . . . . . . . . . . . . . . . . $37.8 $44.7 $18.6Depreciation . . . . . . . . . . . . . . . . . . . . . . . . . . . . . . . . . . . . $28.9 $26.7 $23.5
The Company’s 2006 capital expenditures included approximately $18.0 million related to thepurchase and subsequent sale-leaseback of a building in Italy.
Raw Materials
We require substantial amounts of raw materials to produce our products, including bronze, brass,cast iron, steel and plastic, and substantially all of the raw materials we require are purchased fromoutside sources. We have experienced increases in the costs of certain raw materials, particularlycopper. Bronze and brass are copper-based alloys. The spot price of copper increased approximately41% from December 31, 2005 to December 31, 2007. In response, we have implemented price increasesfor some of our products that have become more expensive to manufacture due to the increases in rawmaterial costs. During 2007 and 2006, cost increases in raw materials were not completely recovered byincreased selling prices or other product cost reductions. We are not able to predict whether or for how
5
long these cost increases will continue. If these cost increases continue and we are not able to reduceor eliminate the effect of the cost increases by reducing production costs or implementing priceincreases, our profit margins could decrease.
Code Compliance
Products representing a majority of our sales are subject to regulatory standards and codeenforcement which typically require that these products meet stringent performance criteria. Standardsare established by such industry test and certification organizations as the American Society ofMechanical Engineers (A.S.M.E.), the Canadian Standards Association (C.S.A.), the American Societyof Sanitary Engineers (A.S.S.E.), the University of Southern California Foundation for Cross-Connection Control (USC FCC), the International Association of Plumbing and Mechanical Officials(I.A.P.M.O.), Factory Mutual (F.M.), the National Sanitation Foundation (N.S.F.) and UnderwritersLaboratory (U.L.). Many of these standards are incorporated into state and municipal plumbing andheating, building and fire protection codes.
National regulatory standards in Europe vary by country. The major standards and/or guidelineswhich our products must meet are AFNOR (France), DVGW (Germany), UNI/ICIN (Italy), KIWA(Netherlands), SVGW (Switzerland), SITAC (Sweden) and WRAS (United Kingdom). Further, thereare local regulatory standards requiring compliance as well.
Together with our commissioned manufacturers’ representatives, we have consistently advocated forthe development and enforcement of plumbing codes. We maintain stringent quality control and testingprocedures at each of our manufacturing facilities in order to manufacture products in compliance withcode requirements.
We believe that product-testing capability and investment in plant and equipment is needed tomanufacture products in compliance with code requirements. Additionally, a majority of ourmanufacturing facilities are ISO 9000, 9001 or 9002 certified by the International Organization forStandardization.
Product Development and Engineering
We maintain our own product development staff, design teams, and testing laboratories in NorthAmerica, Europe and China that continuously work to enhance our existing products and develop newproducts. We maintain sophisticated product development and testing laboratories. Research anddevelopment costs included in selling, general, and administrative expense amounted to $15.1 million,$12.7 million and $11.6 million for the years ended December 31, 2007, 2006 and 2005, respectively.
Competition
The domestic and international markets for water safety and flow control devices are intenselycompetitive and require us to compete against some companies possessing greater financial, marketingand other resources than ours. Due to the breadth of our product offerings, the number and identitiesof our competitors vary by product line and market. We consider brand preference, engineeringspecifications, plumbing code requirements, price, technological expertise, delivery times and breadth ofproduct offerings to be the primary competitive factors. We believe that new product development andproduct engineering are also important to success in the water industry and that our position in theindustry is attributable in part to our ability to develop new and innovative products quickly and toadapt and enhance existing products. We continue to develop new and innovative products to enhancemarket position and are continuing to implement manufacturing and design programs to reduce costs.We cannot be certain that our efforts to develop new products will be successful or that our customerswill accept our new products. Although we own certain patents and trademarks that we consider to beof importance, we do not believe that our business and competitiveness as a whole are dependent onany one of our patents or trademarks or on patent or trademark protection generally.
6
Backlog
Backlog was approximately $119.1 million at February 15, 2008 and also was approximately$114.0 million at February 16, 2007. We do not believe that our backlog at any point in time isindicative of future operating results.
Employees
As of December 31, 2007, our wholly-owned and majority-owned domestic and foreign operationsemployed approximately 7,800 people. None of our employees in North America or China are coveredby collective bargaining agreements. In some European countries our employees are subject totraditional national collective bargaining agreements. We believe that our employee relations are good.
Available Information
We maintain a website with the address www.wattswater.com. The information contained on ourwebsite is not included as a part of, or incorporated by reference into, this Annual Report onForm 10-K. Other than an investor’s own internet access charges, we make available free of chargethrough our website our Annual Report on Form 10-K, quarterly reports on Form 10-Q and currentreports on Form 8-K, and amendments to these reports, as soon as reasonably practicable after wehave electronically filed such material with, or furnished such material to, the Securities and ExchangeCommission.
Certifications
Our Chief Executive Officer and Chief Financial Officer have provided the certifications requiredby rule 13a-14(a) under the Securities Exchange Act of 1934, copies of which are filed as exhibits tothis Annual Report on Form 10-K. In addition, an annual chief executive officer certification wassubmitted by our chief executive officer to the New York Stock Exchange on May 9, 2007 inaccordance with the New York Stock Exchange listing requirements.
7
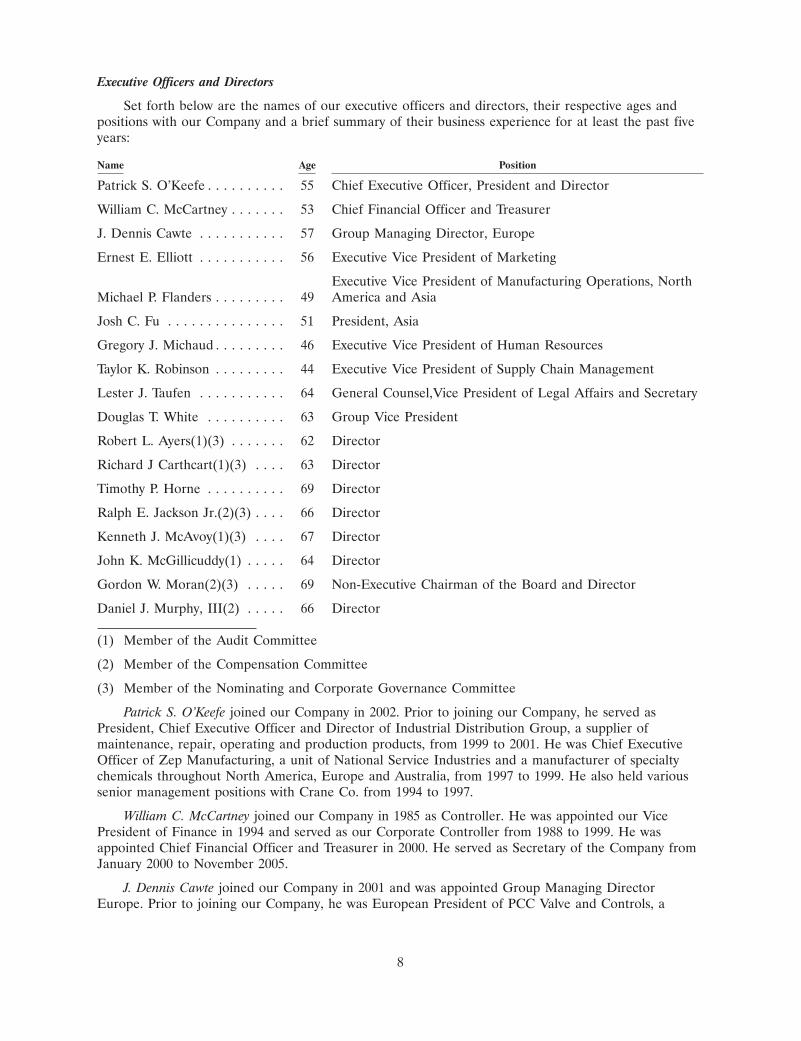
Executive Officers and Directors
Set forth below are the names of our executive officers and directors, their respective ages andpositions with our Company and a brief summary of their business experience for at least the past fiveyears:
Name Age Position
Patrick S. O’Keefe . . . . . . . . . . 55 Chief Executive Officer, President and Director
William C. McCartney . . . . . . . 53 Chief Financial Officer and Treasurer
J. Dennis Cawte . . . . . . . . . . . 57 Group Managing Director, Europe
Ernest E. Elliott . . . . . . . . . . . 56 Executive Vice President of Marketing
Executive Vice President of Manufacturing Operations, NorthMichael P. Flanders . . . . . . . . . 49 America and Asia
Josh C. Fu . . . . . . . . . . . . . . . 51 President, Asia
Gregory J. Michaud . . . . . . . . . 46 Executive Vice President of Human Resources
Taylor K. Robinson . . . . . . . . . 44 Executive Vice President of Supply Chain Management
Lester J. Taufen . . . . . . . . . . . 64 General Counsel,Vice President of Legal Affairs and Secretary
Douglas T. White . . . . . . . . . . 63 Group Vice President
Robert L. Ayers(1)(3) . . . . . . . 62 Director
Richard J Carthcart(1)(3) . . . . 63 Director
Timothy P. Horne . . . . . . . . . . 69 Director
Ralph E. Jackson Jr.(2)(3) . . . . 66 Director
Kenneth J. McAvoy(1)(3) . . . . 67 Director
John K. McGillicuddy(1) . . . . . 64 Director
Gordon W. Moran(2)(3) . . . . . 69 Non-Executive Chairman of the Board and Director
Daniel J. Murphy, III(2) . . . . . 66 Director
(1) Member of the Audit Committee
(2) Member of the Compensation Committee
(3) Member of the Nominating and Corporate Governance Committee
Patrick S. O’Keefe joined our Company in 2002. Prior to joining our Company, he served asPresident, Chief Executive Officer and Director of Industrial Distribution Group, a supplier ofmaintenance, repair, operating and production products, from 1999 to 2001. He was Chief ExecutiveOfficer of Zep Manufacturing, a unit of National Service Industries and a manufacturer of specialtychemicals throughout North America, Europe and Australia, from 1997 to 1999. He also held varioussenior management positions with Crane Co. from 1994 to 1997.
William C. McCartney joined our Company in 1985 as Controller. He was appointed our VicePresident of Finance in 1994 and served as our Corporate Controller from 1988 to 1999. He wasappointed Chief Financial Officer and Treasurer in 2000. He served as Secretary of the Company fromJanuary 2000 to November 2005.
J. Dennis Cawte joined our Company in 2001 and was appointed Group Managing DirectorEurope. Prior to joining our Company, he was European President of PCC Valve and Controls, a
8
division of Precision Castparts Corp., a manufacturer of components and castings to the aeronauticalindustry, from 1999 to 2001. He had also worked for approximately 20 years for Keystone ValveInternational, a manufacturer and distributor of industrial valves, where his most recent position wasthe Managing Director Northern Europe, Middle East, Africa and India.
Ernest E. Elliott joined our Company in 1986 and has served in a variety of sales and marketingroles. He was appointed Vice President of Sales in 1991, served as Executive Vice President ofWholesale Sales and Marketing from 1996 to March 2003, Executive Vice President of WholesaleMarketing from March 2003 to February 2006 and as Executive Vice President of Marketing sinceFebruary 2006. Mr. Elliott temporarily assumed responsibilities of our former Chief Operating Officerand President of North American and Asian Operations in September 2007. Prior to joining ourCompany, he was Vice President of BTR Inc.’s Valve Group, a diversified manufacturer of industrialand commercial valve products.
Michael P. Flanders joined our Company in October 2007 as Executive Vice President ofManufacturing Operations, North America and Asia. From August 2005 to July 2007, he served asPresident and Chief Operating Officer of Aavid Thermalloy, LLC, an international manufacturingcompany providing thermal management solutions to the computer and electronics industries. FromJuly 2003 to April 2005, he was Vice President and General Manager of Waukesha BearingsCorporation, a manufacturer of hydrodynamic and active magnetic bearings and a subsidiary of DoverCorporation. From November 1998 to July 2003, he was General Manager of the LCN Division ofIngersoll-Rand Company Limited, which manufactured mechanical and electronic door controlproducts.
Josh C. Fu joined our Company in January 2008 as President, Asia. From January 2007 toDecember 2007, he served as President and Chief Executive Officer of ReradiantInternational Co. Ltd., a consulting firm focused on the energy and industrial goods industries. FromAugust 2004 to December 2006, he served as President of the China operations of FlowserveCorporation, a global manufacturer of flow control equipment, including valves, pumps, and seals.From July 2003 to August 2004, he was Executive Vice President, Product Development andMerchandise Sourcing for Intercon Merchandise Sourcing, an importer of consumer goods from China.From 2000 to 2003, he held various senior management positions with the China operations of BPp.l.c., a worldwide petroleum and petrochemicals company.
Gregory J. Michaud joined our Company in April 2006 as Executive Vice President of HumanResources. Prior to joining our Company, he served as Vice President, Human Resources of theCompact Equipment division of Ingersoll-Rand Company Limited, a diversified industrial company,from June 2003 through March 2006. He served as Vice President, Human Resources of theProductivity Solutions division of Ingersoll-Rand from January 2003 to June 2003 and as Director,Human Resources & Corporate Organizational Planning of Ingersoll-Rand from June 2000 toDecember 2002.
Taylor K. Robinson joined our Company in September 2007 as Executive Vice President of SupplyChain Management. From January 2007 to August 2007, he owned and operated a consulting companynamed Global Supply Chain Solutions, which provided advice to international clients to improve theirglobal supply chain methods and operations. From February 2004 to April 2006, he was ChiefProcurement Officer for H.J. Heinz Company, an international manufacturer and marketer ofprocessed foods. From January 1999 to January 2004, he served in various positions for HoneywellInternational Inc., a diversified technology and manufacturing company, including Global Supply ChainDirector, Aviation Aftermarket Services, Director of Global Sourcing, Aerospace Electronic Systemsand Corporate Director of Global Commodity Management—Electronics.
Lester J. Taufen joined our Company in 1999 as Associate Corporate Counsel. He was appointedGeneral Counsel, Vice President of Legal Affairs and Assistant Secretary in January 2000. He wasappointed Secretary in November 2005. Prior to joining our Company, he was employed for 13 years atElf Atochem North America, a chemical manufacturing company, serving as Senior Counsel.
9
Douglas T. White joined our Company in 2001 as Group Vice President. Prior to joining ourCompany he was employed by Honeywell International, Inc., a diversified technology andmanufacturing company, as Vice President of Marketing—Consumer Products Group from 1998 to2001.
Robert L. Ayers has served as a director of our Company since October 2006. He was Senior VicePresident of ITT Industries and President of ITT Industries’ Fluid Technology from October 1999 untilSeptember 2005. Mr. Ayers continued to be employed by ITT Industries from September 2005 until hisretirement in September 2006, during which time he focused on special projects for the company.Mr. Ayers originally joined ITT Industries in 1998 as President of ITT Industries’ Industrial PumpGroup. Before joining ITT Industries, he was President of Sulzer Industrial USA and Chief ExecutiveOfficer of Sulzer Bingham, a pump manufacturer. He is a director of T-3 Energy Services, Inc.
Richard J. Cathcart has served as a director of our Company since October 2007. He was ViceChairman and a member of the Board of Directors of Pentair, Inc. from February 2005 until hisretirement in September 2007. Pentair is a diversified manufacturing company consisting of twooperating segments: Water Technologies and Technical Products. He was appointed President and ChiefOperating Officer of Pentair’s Water Technologies Group in January 2001 and served in that capacityuntil his appointment as Vice Chairman in February 2005. He began his career at Pentair in March1995 as Executive Vice President, Corporate Development, where he identified water as a strategic areaof growth. In February 1996, he was named Executive Vice President and President of Pentair’s WaterTechnologies Group. Prior to joining Pentair, he held several management and business developmentpositions during his 20-year career with Honeywell International Inc. He is a director of Fluidra S.A.
Timothy P. Horne has served as a director of our Company since 1962. He became an employee ofour Company in 1959 and served as our President from 1976 to 1978, from 1994 to 1997 and from 1999to 2002. He served as our Chief Executive Officer from 1978 to 2002, and he served as Chairman ofour Board of Directors from 1986 to 2002. He retired as an employee of our Company onDecember 31, 2002. Since his retirement, he has continued to serve our Company as a consultant.
Ralph E. Jackson, Jr. has served as a director of our Company since 2004. He worked for CooperIndustries, Inc., a manufacturer of electrical products, from 1985 until his retirement in December2003. Prior to joining Cooper Industries, he worked for the Bussmann and Air Comfort divisions ofMcGraw-Edison from 1976 until McGraw-Edison was acquired by Cooper Industries in 1985. Whilewith Cooper Industries, he served as Chief Operating Officer from 2000 to December 2003, ExecutiveVice President, Electrical Operations from 1992 to 2000, and President, Bussmann Division from thetime McGraw-Edison was acquired by Cooper Industries to 1992. He served as a member of the Boardof Directors of Cooper Industries from 2000 to December 2003.
Kenneth J. McAvoy has served as a director of our Company since 1994. He was Controller of ourCompany from 1981 to 1985 and Chief Financial Officer and Treasurer from 1986 to 1999. He alsoserved as Vice President of Finance from 1984 to 1994; Executive Vice President of EuropeanOperations from 1994 to 1996; and Secretary from 1985 to 1999. He retired from our Company onDecember 31, 1999.
John K. McGillicuddy has served as a director of our Company since 2003. He was employed byKPMG LLP, a public accounting firm, from 1965 until his retirement in 2000. He was elected into thePartnership at KPMG LLP in June 1975 where he served as Audit Partner, SEC Reviewing Partner,Partner-in-Charge of Professional Practice, Partner-in-Charge of College Recruiting andPartner-in-Charge of Staff Scheduling. He is a director of Brooks Automation, Inc.
Gordon W. Moran has served as a director of our Company since 1990. He has been the Chairmanof Hollingsworth & Vose Company, a paper manufacturer, since 1997, and served as its President andChief Executive Officer from 1983 to 1998.
Daniel J. Murphy, III has served as a director of our Company since 1986. He has been theChairman of Northmark Bank, a commercial bank he founded, since 1987. Prior to forming Northmark
10
Bank in 1987, he was a Managing Director of Knightsbridge Partners, a venture capital firm, fromJanuary to August 1987, and President and a director of Arltru Bancorporation, a bank holdingcompany, and its wholly-owned subsidiary, Arlington Trust Company, from 1980 to 1986.
Product Liability, Environmental and Other Litigation Matters
We are subject to a variety of potential liabilities connected with our business operations, includingpotential liabilities and expenses associated with possible product defects or failures and compliancewith environmental laws. We maintain product liability and other insurance coverage, which we believeto be generally in accordance with industry practices. Nonetheless, such insurance coverage may not beadequate to protect us fully against substantial damage claims.
Contingencies
James Jones Litigation
On June 25, 1997, Nora Armenta (the Relator) filed a civil action in the California Superior Courtfor Los Angeles County (the Armenta case) against James Jones Company (James Jones), Mueller Co.,Tyco International (U.S.), and the Company. We formerly owned James Jones. The Relator filed underthe qui tam provision of the California state False Claims Act, Cal. Govt. Code § 12650 et seq.(California False Claims Act) and generally alleged that James Jones and the other defendants violatedthis statute by delivering some ‘‘defective’’ or ‘‘non-conforming’’ waterworks parts to thirty-fourmunicipal water systems in the State of California. The Relator filed a First Amended Complaint inNovember 1998 and a Second Amended Complaint in December 2000, which brought the total numberof plaintiffs to 161. To date, 11 of the named cities have intervened, and attempts by four other namedcities to intervene have been denied.
In June 2002, the trial court excluded 47 cities from this December 2000 total of 161, but thisexclusion was reversed by an August 30, 2006 California Court of Appeal ruling that is now final. ThisAugust 30, 2006 Court of Appeal ruling also reversed dismissals of Tyco International and Mueller Co.,and this allowed the Relator to make a successful motion that removed the Armenta Case litigationfrom Judge Lichtman’s court to the court of Judge Chaney, another complex litigation judge.
One of the allegations in the Second Amended Complaint and the Complaints-in-Intervention isthat purchased non-conforming James Jones waterworks parts may leach into public drinking waterelevated amounts of lead that may create a public health risk because they were made out of ‘81bronze alloy (UNS No. C8440) and contain more lead than the specified and advertised ‘85 bronzealloy (UNS No. C83600). This contention is based on the average difference of about 2% lead contentbetween ‘81 bronze (6% to 8% lead) and ‘85 bronze (4% to 6% lead) and the assumption that thiswould mean increased consumable lead in public drinking water that could cause a public healthconcern. We believe the evidence and discovery available to date indicates that this is not the case.
In addition, ‘81 bronze is used extensively in municipal and home plumbing systems and isapproved by municipal, local and national codes. The Federal Environmental Protection Agency alsodefines metal for pipe fittings with no more than 8% lead as ‘‘lead free’’ under Section 1417 of theFederal Safe Drinking Water Act.
In this case, the Relator seeks three times an unspecified amount of actual damages and allegesthat the municipalities have suffered hundreds of millions of dollars in damages. She also seeks civilpenalties of $10,000 for each false claim and alleges that defendants are responsible for tens ofthousands of false claims. Finally, the Relator requests an award of costs of this action, includingattorneys’ fees.
In December 1998, the Los Angeles Department of Water and Power (LADWP) intervened in thiscase and filed a complaint. We settled with the city of Los Angeles, by far the most significant city, for$7.3 million plus attorneys’ fees. Co-defendants contributed $2.0 million toward this settlement.
11
In August 2003, an additional settlement payment was made for $13.0 million ($11.0 million fromus and $2.0 million from James Jones), which settled the claims of the three Phase I cities (SantaMonica, San Francisco and East Bay Municipal Utility District) chosen by the Relator as having thestrongest claims to be tried first. This settlement payment included the Relator’s statutory share, andthe claims of these three cities have been dismissed. In addition to this $13.0 million payment, we areobligated to pay the Relator’s attorney’s fees.
After the Phase I settlement, the Court permitted the defendants to select five additional cities toserve as the plaintiffs in a second trial phase of the case. Contra Costa, Corona, Santa Ana, Santa Cruzand Vallejo were chosen. The Company and James Jones then reached an agreement to settle theclaims of the City of Santa Ana for a total of $45,000, an amount which approximates Santa Ana’spurchases of James Jones products during the relevant period. The Santa Ana settlement was approvedby the Court and then completed.
On June 22, 2005, the Court dismissed the claims of the remaining Phase II cities (Contra Costa,Corona, Santa Cruz and Vallejo). The Court ruled that the Relator and these cities were required toshow that the cities had received out of spec parts which were related to specific invoices and that thisshowing had not been made. Although each city’s claim is unique, this ruling is significant for theclaims of the remaining cities, and the Relator appealed. On June 29, 2007, the appellate courtdismissed this appeal. However, this judgment can be appealed again at the conclusion of the entirecase. The trial court has scheduled a trial on March 17, 2009 for six Phase III cities with three cities tobe selected by each side. Litigation is inherently uncertain, and we are unable to predict the outcomeof this case.
On September 15, 2004, the Relator’s attorneys filed a new common law fraud lawsuit in theCalifornia Superior Court for the City of Banning and forty-six other cities and water districts againstJames Jones, Watts and Mueller Co. based on the same transactions alleged in the Armenta case.About forty-two of the plaintiffs in this new lawsuit are also plaintiffs in the Armenta case. The statuteof limitations threshold issue is in the process of being resolved for these plaintiffs. Litigation isinherently uncertain, and we are unable to predict the outcome of this case.
We have a reserve of approximately $28.0 million with respect to the James Jones Litigation in ourconsolidated balance sheet as of December 31, 2007. We believe, on the basis of all availableinformation, that this reserve is adequate to cover the probable and reasonably estimable lossesresulting from the Armenta case and the insurance coverage litigation with Zurich American InsuranceCompany (Zurich) discussed below. We are currently unable to make an estimate of the range of anyadditional losses.
On February 14, 2001, after our insurers had denied coverage for the claims in the Armenta case,we filed a complaint for coverage against our insurers in the California Superior Court (the coveragecase). James Jones filed a similar complaint, the cases were consolidated, and the trial court madesummary adjudication rulings that Zurich must pay all reasonable defense costs incurred by us andJames Jones in the Armenta case since April 23, 1998 as well as such defense costs in the future untilthe end of the Armenta case. In August 2004, the California Court of Appeal affirmed these rulings,and, on December 1, 2004, the California Supreme Court denied Zurich’s appeal of this decision. Thisdenial permanently established Zurich’s obligation to pay Armenta defense costs for both us(approximately $16.6 million plus future costs) and James Jones (which we estimate to be $17.0 millionplus future costs), and Zurich is currently making payments of incurred Armenta defense costs.However, as noted below, Zurich asserts that the defense costs paid by it are subject to reimbursement.
On November 22, 2002, the trial court entered a summary adjudication order that Zurich mustindemnify and pay us and James Jones for amounts paid to settle with the City of Los Angeles.Zurich’s attempt to obtain appellate review of this order was denied, but Zurich will still be able toappeal this order at the end of the coverage case. On August 6, 2004, the trial court made anothersummary adjudication ruling that Zurich must indemnify and pay us and James Jones for the$13.0 million paid to settle the claims of the Phase I cities described above. Zurich’s attempt to obtain
12
appellate review of this ruling was denied on December 3, 2004 by the California Court of Appeal, butZurich will still be able to appeal this order at the end of the coverage case. Zurich has now made allof the payments required by these indemnity orders.
On February 8, 2006, Zurich filed a motion to set aside as void the November 22, 2002 andAugust 6, 2004 summary adjudication indemnity payment orders. After this motion was denied, Zurich’sappeal was also denied and the California Supreme Court denied Zurich’s petition for review. We arecurrently unable to predict the finality of these indemnity payment orders since Zurich can also appealthem at the end of the coverage case. We have recorded reimbursed indemnity settlement amounts (butnot reimbursed defense costs) as a liability pending court resolution of the indemnification matter as itrelates to Zurich.
Zurich has asserted that all amounts (which we estimate to be $56.0 million for both defense costsand indemnity amounts paid for settlements) paid by it to us and James Jones are subject toreimbursement under Deductible Agreements related to the insurance policies between Zurich andWatts. If Zurich were to prevail on this argument, James Jones would have a possible indemnity claimagainst us for its exposure from the Armenta case. We believe the Armenta case should be viewed asone occurrence and the deductible amount should be $0.5 million per occurrence.
These reimbursement claims are subject to arbitration under the Watts/Zurich DeductibleAgreements. Zurich claims its reimbursement right for defense costs paid arises under six DeductibleAgreements, and we contend that only two Deductible Agreements apply. We further contend that afinal decision in California supports our position on the number of Deductible Agreements that shouldapply to defense costs. On January 31, 2006, the federal district court in Chicago, Illinois determinedthat there are disputes under all Deductible Agreements in effect during the period in which Zurichissued primary policies and that the arbitrator could decide which agreements would controlreimbursement claims. We appealed this ruling. On October 20, 2006, the United States Court ofAppeals for the Seventh Circuit affirmed that an arbitration panel could decide which deductibleagreements between Zurich and us would control Zurich’s reimbursement claim for defense costs paidin the James Jones case. As a result of this development, we recorded a pre-tax charge of $5.0 millionto discontinued operations in 2006.
Based on management’s assessment, we do not believe that the ultimate outcome of the JamesJones Litigation will have a material adverse effect on our liquidity, financial condition or results ofoperations. While this assessment is based on all available information, litigation is inherently uncertain,the actual liability to us to resolve this litigation fully cannot be predicted with any certainty and thereexists a reasonable possibility that we may ultimately incur losses in the James Jones Litigation inexcess of the amount accrued. We intend to continue to contest vigorously all aspects of the JamesJones Litigation.
Environmental Remediation
We have been named as a potentially responsible party (PRP) with respect to a limited number ofidentified contaminated sites. The levels of contamination vary significantly from site to site as do therelated levels of remediation efforts. Environmental liabilities are recorded based on the most probablecost, if known, or on the estimated minimum cost of remediation. We accrue estimated environmentalliabilities based on assumptions, which are subject to a number of factors and uncertainties.Circumstances which can affect the reliability and precision of these estimates include identification ofadditional sites, environmental regulations, level of cleanup required, technologies available, numberand financial condition of other contributors to remediation and the time period over whichremediation may occur. We recognize changes in estimates as new remediation requirements aredefined or as new information becomes available. At December 31, 2007, we have a reserve ofapproximately $1.4 million (environmental accrual), which we estimate will likely be paid forenvironmental remediation liabilities over the next five to ten years. Based on the facts currently knownto us, we do not believe that the ultimate outcome of these matters will have a material adverse effecton our liquidity, financial condition or results of operations. Some of our environmental matters areinherently uncertain and there exists a possibility that we may ultimately incur losses from thesematters in excess of the amount accrued. However, we cannot currently estimate the amount of anysuch additional losses.
13
Asbestos Litigation
We are defending approximately 100 cases filed primarily, but not exclusively, in Mississippi andNew Jersey state courts alleging injury or death as a result of exposure to asbestos. These filingstypically name multiple defendants and are filed on behalf of many plaintiffs. They do not identify anyparticular Watts products as a source of asbestos exposure. To date, we have been dismissed from eachcase when the scheduled trial date comes near or when discovery fails to yield any evidence ofexposure to any of our products. Based on the facts currently known to us, we do not believe that theultimate outcome of these claims will have a material adverse effect on our liquidity, financial conditionor results of operations.
Other Litigation
Other lawsuits and proceedings or claims, arising from the ordinary course of operations, are alsopending or threatened against us. Based on the facts currently known to us, we do not believe that theultimate outcome of these other litigation matters will have a material adverse effect on our liquidity,financial condition or results of operations.
Item 1A. RISK FACTORS.
We face intense competition and, if we are not able to respond to competition in our markets, our revenuesmay decrease.
Competitive pressures in our markets could adversely affect our competitive position, leading to apossible loss of market share or a decrease in prices, either of which could result in decreased revenuesand profits. We encounter intense competition in all areas of our business. Additionally, customers forour products are attempting to reduce the number of vendors from which they purchase in order toreduce the size and diversity of their inventories and their transaction costs. To remain competitive, wewill need to invest continually in manufacturing, marketing, customer service and support and ourdistribution networks. We may not have sufficient resources to continue to make such investments andwe may be unable to maintain our competitive position. In addition, we anticipate that we may have toreduce the prices of some of our products to stay competitive, potentially resulting in a reduction in theprofit margin for, and inventory valuation of, these products. Some of our competitors are based inforeign countries and have cost structures and prices in foreign currencies. Accordingly, currencyfluctuations could cause our U.S. dollar-priced products to be less competitive than our competitors’products which are priced in other currencies.
Reductions or interruptions in the supply of raw materials and increases in the costs of raw materials couldreduce our profit margins and adversely affect our ability to meet our customer delivery commitments.
We require substantial amounts of raw materials, including bronze, brass, cast iron, steel andplastic and substantially all of the raw materials we require are purchased from outside sources. Theavailability and costs of raw materials may be subject to curtailment or change due to, among otherthings, new laws or regulations, suppliers’ allocations to other purchasers, interruptions in productionby suppliers and changes in exchange rates and worldwide price and demand levels. We typically do notenter into long-term supply agreements. Our inability to obtain adequate supplies of raw materials forour products at favorable costs, or at all, could have a material adverse effect on our business, financialcondition or results of operations by decreasing our profit margins and by hindering our ability todeliver products to our customers on a timely basis. During 2006 and continuing through 2007, thecosts of many of these raw materials were at the highest levels that they have been in many years. Wemay continue to experience further cost increases of these materials. In 2006 and 2007, cost increasesin raw materials were not completely recovered by increased selling prices or other product costreductions. If we are not able to reduce or eliminate the effect of these cost increases through loweringother costs of production or successfully implementing price increases to our customers, such costincreases from our vendors could continue to have a negative effect on our financial results.Additionally, we continue to purchase increased levels of finished product from international sources. If
14
there is an interruption in delivering these finished products to our domestic warehouses, this couldhave a negative effect on our financial results.
Down economic cycles, particularly reduced levels of residential and non-residential starts and remodeling,could have an adverse effect on our revenues and operating results.
We have experienced and expect to continue to experience fluctuations in revenues and operatingresults due to economic and business cycles. The businesses of most of our customers, particularlyplumbing and heating wholesalers and home improvement retailers, are cyclical. Therefore, the level ofour business activity has been cyclical, fluctuating with economic cycles. We also believe our level ofbusiness activity is influenced by residential and non-residential starts and renovation and remodeling,which are, in turn, heavily influenced by interest rates, consumer debt levels, changes in disposableincome, employment growth and consumer confidence. The current conditions in the housing and debtmarkets have caused a reduction in residential and non-residential starts and renovation andremodeling. If these conditions continue or worsen in the future, our revenues and profits coulddecrease and could result in a material adverse effect on our financial condition and results ofoperations.
Implementation of our acquisition strategy may not be successful, which could affect our ability to increaseour revenues or our profitability.
One of our strategies is to increase our revenues and profitability and expand our markets throughacquisitions that will provide us with complementary water-related products and increase market sharefor our existing product lines. We cannot be certain that we will be able to identify, acquire orprofitably manage additional companies or successfully integrate such additional companies withoutsubstantial costs, delays or other problems. Also, companies acquired recently and in the future maynot achieve revenues, profitability or cash flows that justify our investment in them. We expect to spendsignificant time and effort in expanding our existing businesses and identifying, completing andintegrating acquisitions. We have faced increasing competition for acquisition candidates which haveresulted in significant increases in the purchase prices of many acquisition candidates. This competition,and the resulting purchase price increases, may limit the number of acquisition opportunities availableto us, possibly leading to a decrease in the rate of growth of our revenues and profitability. In addition,acquisitions may involve a number of special risks, including, but not limited to:
• inadequate internal controls over financial reporting and our ability to bring such controls intocompliance with the requirements of Section 404 of the Sarbanes-Oxley Act of 2002 in a timelymanner;
• adverse short-term effects on our reported operating results;
• diversion of management’s attention;
• investigations of, or challenges to, acquisitions by competition authorities;
• loss of key personnel at acquired companies; and
• unanticipated management or operational problems or legal liabilities.
We are subject to risks related to product defects, which could result in product recalls and could subject us towarranty claims in excess of our warranty provisions or which are greater than anticipated due to theunenforceability of liability limitations.
We maintain strict quality controls and procedures, including the testing of raw materials andsafety testing of selected finished products. However, we cannot be certain that our testing will reveallatent defects in our products or the materials from which they are made, which may not becomeapparent until after the products have been sold into the market. We also cannot be certain that oursuppliers will always eliminate latent defects in products we purchase from them. Accordingly, there isa risk that product defects will occur, which could require a product recall. Product recalls can be
15
expensive to implement and, if a product recall occurs during the product’s warranty period, we may berequired to replace the defective product. In addition, a product recall may damage our relationshipwith our customers and we may lose market share with our customers. Our insurance policies may notcover the costs of a product recall.
Our standard warranties contain limits on damages and exclusions of liability for consequentialdamages and for misuse, improper installation, alteration, accident or mishandling while in thepossession of someone other than us. We may incur additional operating expenses if our warrantyprovision does not reflect the actual cost of resolving issues related to defects in our products. If theseadditional expenses are significant, it could adversely affect our business, financial condition and resultsof operations.
We face risks from product liability and other lawsuits, which may adversely affect our business.
We have been and expect to continue to be subject to various product liability claims or otherlawsuits, including, among others, that our products include inadequate or improper instructions for useor installation, or inadequate warnings concerning the effects of the failure of our products. In theevent that we do not have adequate insurance or contractual indemnification, damages from theseclaims would have to be paid from our assets and could have a material adverse effect on our results ofoperations, liquidity and financial condition. We, like other manufacturers and distributors of productsdesigned to control and regulate fluids and gases, face an inherent risk of exposure to product liabilityclaims and other lawsuits in the event that the use of our products results in personal injury, propertydamage or business interruption to our customers. Although we maintain strict quality controls andprocedures, including the testing of raw materials and safety testing of selected finished products, wecannot be certain that our products will be completely free from defect. In addition, in certain cases,we rely on third-party manufacturers for our products or components of our products. Although wehave product liability and general insurance coverage, we cannot be certain that this insurance coveragewill continue to be available to us at a reasonable cost, or, if available, will be adequate to cover anysuch liabilities. For more information, see ‘‘Item 1. Business—Product Liability, Environmental andOther Litigation Matters.’’
Economic and other risks associated with international sales and operations could adversely affect ourbusiness and future operating results.
Since we sell and manufacture our products worldwide, our business is subject to risks associatedwith doing business internationally. Our business and future operating results could be harmed by avariety of factors, including:
• trade protection measures and import or export licensing requirements, which could increase ourcosts of doing business internationally;
• potentially negative consequences from changes in tax laws, which could have an adverse impacton our profits;
• difficulty in staffing and managing widespread operations, which could reduce our productivity;
• costs of compliance with differing labor regulations, especially in connection with restructuringour overseas operations;
• natural disasters and public health emergencies;
• laws of some foreign countries, which may not protect our intellectual property rights to thesame extent as the laws of the United States; and
• unexpected changes in regulatory requirements, which may be costly and require time toimplement.
16
Fluctuations in foreign exchange rates could materially affect our reported results.
We are exposed to fluctuations in foreign currencies, as a portion of our sales and certain portionsof our costs, assets and liabilities are denominated in currencies other than U.S. dollars. Approximately41.7% of our sales during the year ended December 31, 2007 were from sales outside of the U.S.compared to 38.0% for the year ended December 31, 2006. For the years ended December 31, 2007and 2006, the appreciation of the euro against the U.S. dollar had a positive impact on sales ofapproximately $34.1 million and $7.1 million, respectively. Additionally, our Canadian operationsrequire significant amounts of U.S. purchases for their operations. Instead of buying or manufacturingdomestically, we currently have a favorable cost structure for goods we source from our joint venture,our wholly-owned subsidiaries in China and our outside vendors. In 2005, China revalued its currencyhigher against the U.S. dollar and stated it would no longer tie the yuan to a fixed rate against the U.S.currency. The yuan was valued at 7.3 and 7.8 at December 31, 2007 and 2006, respectively. China alsostated it will peg the yuan against numerous currencies, although it will keep the yuan in a tight bandrather than letting it trade freely. The spot rate of the euro, Canadian dollar and yuan increased invalue from December 31, 2006 to December 31, 2007 by approximately 12%, 16% and 6% respectively,against the U.S. dollar. If our share of revenue and purchases in non-dollar denominated currenciescontinues to increase in future periods, exchange rate fluctuations will likely have a greater impact onour results of operations and financial condition.
There are risks in expanding our manufacturing operations and acquiring companies in China.
As part of our strategy, we have shifted a portion of our manufacturing operations to China toreduce our production costs and to sell products into the Chinese market. This shift has subjected agreater portion of our operations to the risks of doing business in China. In addition, we haveincreased our participation in the Chinese water and power infrastructure markets with our acquisitionof Changsha Valve Works. Changsha sells exclusively into the domestic Chinese marketplace. Theincreased production levels in China require increased levels of working capital and manufacturingequipment. If we are unable to quickly train these new employees we may experience product qualityissues. The Chinese central and local government authorities have a higher degree of control over ourbusinesses in China than is customary in many of the countries in which we operate, and this makes theprocess of obtaining necessary regulatory approval in China inherently unpredictable. For instance, asannounced in 2006, the local Chinese authorities in Tianjin, China informed us that property occupiedby our TWT joint venture will be taken over by eminent domain by the end of the second quarter of2008, and we have incurred significant costs in connection with the relocation of our operations there.In addition, the protection accorded our proprietary technology and know-how under the Chinese legalsystem is not as strong as in the United States and, as a result, we may lose valuable trade secrets andcompetitive advantage.
If we cannot continue operating our manufacturing facilities at current or higher utilization levels, our resultsof operations could be adversely affected.
The equipment and management systems necessary for the operation of our manufacturingfacilities may break down, perform poorly or fail, resulting in fluctuations in our ability to manufactureour products and to achieve manufacturing efficiencies. We operate a number of manufacturingfacilities, all of which are subject to this risk, and such fluctuations at any of these facilities could causean increase in our production costs and a corresponding decrease in our profitability. We also have avertically-integrated manufacturing process. Each segment is dependent upon the prior process and anybreakdown in one segment will adversely affect all later components. Fluctuations in our productionprocess may affect our ability to deliver products to our customers on a timely basis. Our inability tomeet our delivery obligations could result in a loss of our customers and negatively affect our business,financial condition and results of operations.
In addition, we have an ongoing manufacturing restructuring program to reduce our manufacturingcosts. If our planned manufacturing plant consolidations in the United States and Europe and our plant
17
relocations in China are not successful, our results of operations and financial condition could bematerially adversely affected.
If we experience delays in introducing new products or if our existing or new products do not achieve ormaintain market acceptance and regulatory approvals, our revenues and our profitability may decrease.
Our failure to develop new and innovative products or to custom design existing products couldresult in the loss of existing customers to competitors or the inability to attract new business, either ofwhich may adversely affect our revenues. Our industry is characterized by:
• intense competition;
• changes in specifications required by our customers, plumbing codes and/or regulatory agencies;
• technically complex products; and
• constant improvement to existing products and introductions of new products.
We believe our future success will depend, in part, on our ability to anticipate or adapt to thesefactors and to offer, on a timely basis, products that meet customer demands and the requirements ofplumbing codes and/or regulatory agencies. The development of new or enhanced products is acomplex and uncertain process requiring the anticipation of technological and market trends. We mayexperience design, manufacturing, marketing or other difficulties, such as an inability to attract asufficient number of experienced engineers, that could delay or prevent our development, introduction,approval or marketing of new products or enhancements and result in unexpected expenses. Suchdifficulties could cause us to lose business from our customers and could adversely affect ourcompetitive position; in addition, added expenses could decrease the profitability associated with thoseproducts that do not gain market acceptance.
Environmental compliance costs and liabilities could increase our expenses or reduce our profitability.
Our operations and properties are subject to extensive and increasingly stringent laws andregulations relating to environmental protection, including laws and regulations governing air emissions,water discharges, waste management and disposal and workplace safety. Such laws and regulations canimpose substantial fines and sanctions for violations and require the installation of costly pollutioncontrol equipment or operational changes to limit pollution emissions and/or decrease the likelihood ofaccidental hazardous substance releases. We could be required to halt one or more portions of ouroperations until a violation is cured. We could also be liable for the costs of property damage orpersonal injury to others. Although we attempt to operate in compliance with these environmental laws,we may not succeed in this effort at all times. The costs of curing violations or resolving enforcementactions that might be initiated by government authorities could be substantial.
Under certain environmental laws, the current and past owners or operators of real property maybe liable for the costs of cleaning up contamination, even if they did not know of or were notresponsible for such contamination. These laws also impose liability on any person who arranges for thedisposal or treatment of hazardous waste at any site. We have been named as a potentially responsibleparty or are otherwise conducting remedial activities with respect to a limited number of identifiedcontaminated sites, including sites we currently own or operate. There can be no assurances that ourownership and operation of real property and our disposal of waste will not lead to other liabilitiesunder these laws.
We have incurred, and expect to continue to incur, costs relating to environmental matters. Inaddition, new laws and regulations, stricter enforcement of existing laws and regulations, the discoveryof previously unknown contamination or the imposition of new clean-up requirements could require usto incur additional costs or become the basis for new or increased liabilities that could be significant.Environmental litigation, enforcement and compliance are inherently uncertain and we may experiencesignificant costs in connection with environmental matters. For more information, see ‘‘Item 1.Business—Product Liability, Environmental and Other Litigation Matters.’’
18
Third parties may infringe our intellectual property and we may expend resources enforcing our rights orsuffer competitive injury.
We rely on a combination of patents, copyrights, trademarks, trade secrets, confidentialityprovisions and licensing arrangements to establish and protect our proprietary rights. We may berequired to spend resources to monitor and police our intellectual property rights. If we fail tosuccessfully enforce our intellectual property rights, our competitive position could suffer, which couldharm our operating results. We have been limited from selling products from time-to-time because ofexisting patents.
The requirements of Financial Accounting Standards Board Statement No. 142, ‘‘Goodwill and OtherIntangible Assets’’ (FAS 142) may result in a write-off of all or a portion of our goodwill and non-amortizableintangible assets, which would negatively affect our operating results and financial condition.
As of December 31, 2007, we recorded goodwill and non-amortizable intangible assets of$385.8 million and $52.2 million, respectively. If we are required to take an impairment charge to ourgoodwill or intangible assets in connection with the requirements of FAS 142, our operating results maydecrease and our financial condition may be harmed. Under FAS 142, goodwill and identifiableintangible assets that have indefinite useful lives are no longer amortized. In lieu of amortization, weare required to perform an annual impairment review of both goodwill and non-amortizable intangibleassets. We concluded that no impairment existed at October 28, 2007, the time of our latest annualreview. We perform our annual test for indications of goodwill and non-amortizable intangible assetsimpairment in the fourth quarter of our fiscal year or sooner if indicators of impairment exist.
The loss of a major customer could have an adverse effect on our results of operations.
Our largest customer, The Home Depot Inc. and its wholly-owned subsidiaries, accounted forapproximately $100.2 million, or 7%, of our total net sales for the year ended December 31, 2007 and$122.7 million, or 10%, of our total net sales for year ended December 31, 2006. Our customersgenerally are not obligated to purchase any minimum volume of products from us and are able toterminate their relationships with us at any time. In addition, increases in the prices of our productscould result in a reduction in orders for our products from Home Depot and other customers. Asignificant reduction in orders from, or change in terms of contracts with, Home Depot or othersignificant customers could have a material adverse effect on our future results of operations.
Certain indebtedness may limit our ability to pay dividends, incur additional debt and make acquisitions andother investments.
Our revolving credit facility and other senior indebtedness contain operational and financialcovenants that restrict our ability to make distributions to stockholders, incur additional debt and makeacquisitions and other investments unless we satisfy certain financial tests and comply with variousfinancial ratios. If we do not maintain compliance with these covenants, our creditors could declare adefault under our revolving credit facility or senior notes and our indebtedness could be declaredimmediately due and payable. Our ability to comply with the provisions of our indebtedness may beaffected by changes in economic or business conditions beyond our control.
Investments in auction rate certificates are subject to risks which may cause losses and affect the liquidity ofthese investments.
At December 31, 2007, we had $39.0 million in investment securities. We have historically investedthese amounts in auction rate certificates whose underlying investments are AAA rated municipalbonds. Our auction rate certificates are bought and sold at auction with reset dates of up to 35 days.Through February 25, 2008, we liquidated approximately $22.0 million of our auction rate certificates atpar value and invested the proceeds into money market accounts. At February 25, 2008, we heldapproximately $17.0 million of auction rate certificates whose underlying investments are AAA ratedmunicipal bonds.
19
We have no current indications that the securities we hold may be impaired. However, volatility inthe credit markets could affect our ability to liquidate these investments or cause the fair value of thesecurities to be impaired. If liquidity of the securities becomes prohibitive, we may be forced to holdthe securities until maturity or until conditions improve, which could be as long as 33 years. Subsequentto December 31, 2007 through February 25, 2008, we experienced failed auctions on $6.6 million of ourauction rate certificates. We do not have a present need to access these funds for operational purposes.The amounts associated with failed auctions will not be accessible until a successful auction occurs, abuyer is found outside of the auction process or the underlying securities have matured. As a result, wehave classified the $17.0 million of auction rate certificates held as of February 25, 2008 as long-termassets in the our December 31, 2007 consolidated balance sheet. If the fair value of the securitiesdeteriorates, we would be required to adjust the carrying value of the securities. The market risksassociated with our auction rate certificates could adversely affect our results of operations, liquidityand financial condition.
One of our stockholders can exercise substantial influence over our Company.
As of February 1, 2008, Timothy P. Horne, a member of our board of directors, beneficially ownedapproximately 19.6% of our outstanding shares of Class A Common Stock (assuming conversion of allshares of Class B Common Stock beneficially owned by Mr. Horne into Class A Common Stock) andapproximately 99.0% of our outstanding shares of Class B Common Stock, which representsapproximately 70.4% of the total outstanding voting power. As long as Mr. Horne controls sharesrepresenting at least a majority of the total voting power of our outstanding stock, Mr. Horne will beable to unilaterally determine the outcome of most stockholder votes, and other stockholders will notbe able to affect the outcome of any such votes.
Conversion and sale of a significant number of shares of our Class B Common Stock could adversely affectthe market price of our Class A Common Stock.
As of February 1, 2008, there were outstanding 29,680,122 shares of our Class A Common Stockand 7,293,880 shares of our Class B Common Stock. Shares of our Class B Common Stock may beconverted into Class A Common Stock at any time on a one for one basis. Under the terms of aregistration rights agreement with respect to outstanding shares of our Class B Common Stock, theholders of our Class B Common Stock have rights with respect to the registration of the underlyingClass A Common Stock. Under these registration rights, the holders of Class B Common Stock mayrequire, on up to two occasions, that we register their shares for public resale. If we are eligible to useForm S-3 or a similar short-form registration statement, the holders of Class B Common Stock mayrequire that we register their shares for public resale up to two times per year. If we elect to registerany shares of Class A Common Stock for any public offering, the holders of Class B Common Stockare entitled to include shares of Class A Common Stock into which such shares of Class B CommonStock may be converted in such registration. However, we may reduce the number of shares proposedto be registered in view of market conditions. We will pay all expenses in connection with anyregistration, other than underwriting discounts and commissions. If all of the available registered sharesare sold into the public market the trading price of our Class A Common Stock could decline.
Our Class A Common Stock has insignificant voting power.
Our Class B Common Stock entitles its holders to ten votes for each share and our Class ACommon Stock entitles its holders to one vote per share. As of February 1, 2008, our Class B CommonStock constituted 19.7% of our total outstanding common stock and 71.1% of the total outstandingvoting power and thus is able to exercise a controlling influence over our business.
Item 1B. UNRESOLVED STAFF COMMENTS.
None.
20
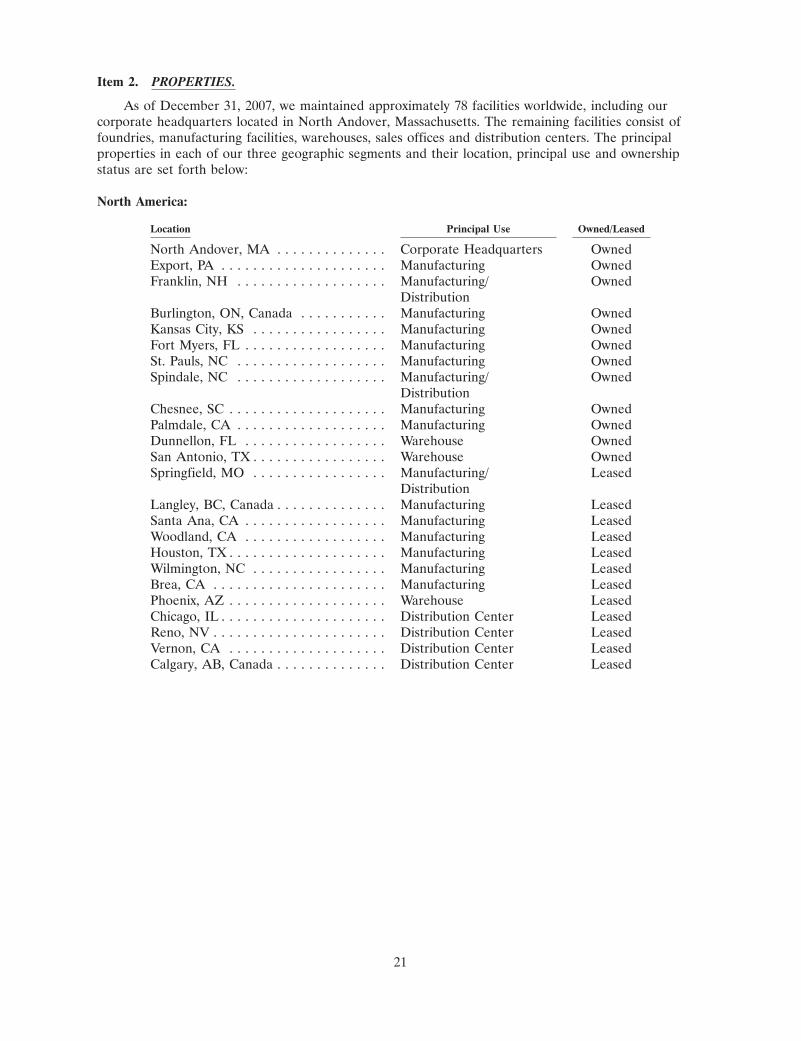
Item 2. PROPERTIES.
As of December 31, 2007, we maintained approximately 78 facilities worldwide, including ourcorporate headquarters located in North Andover, Massachusetts. The remaining facilities consist offoundries, manufacturing facilities, warehouses, sales offices and distribution centers. The principalproperties in each of our three geographic segments and their location, principal use and ownershipstatus are set forth below:
North America:
Location Principal Use Owned/Leased
North Andover, MA . . . . . . . . . . . . . . Corporate Headquarters OwnedExport, PA . . . . . . . . . . . . . . . . . . . . . Manufacturing OwnedFranklin, NH . . . . . . . . . . . . . . . . . . . Manufacturing/ Owned
DistributionBurlington, ON, Canada . . . . . . . . . . . Manufacturing OwnedKansas City, KS . . . . . . . . . . . . . . . . . Manufacturing OwnedFort Myers, FL . . . . . . . . . . . . . . . . . . Manufacturing OwnedSt. Pauls, NC . . . . . . . . . . . . . . . . . . . Manufacturing OwnedSpindale, NC . . . . . . . . . . . . . . . . . . . Manufacturing/ Owned
DistributionChesnee, SC . . . . . . . . . . . . . . . . . . . . Manufacturing OwnedPalmdale, CA . . . . . . . . . . . . . . . . . . . Manufacturing OwnedDunnellon, FL . . . . . . . . . . . . . . . . . . Warehouse OwnedSan Antonio, TX . . . . . . . . . . . . . . . . . Warehouse OwnedSpringfield, MO . . . . . . . . . . . . . . . . . Manufacturing/ Leased
DistributionLangley, BC, Canada . . . . . . . . . . . . . . Manufacturing LeasedSanta Ana, CA . . . . . . . . . . . . . . . . . . Manufacturing LeasedWoodland, CA . . . . . . . . . . . . . . . . . . Manufacturing LeasedHouston, TX . . . . . . . . . . . . . . . . . . . . Manufacturing LeasedWilmington, NC . . . . . . . . . . . . . . . . . Manufacturing LeasedBrea, CA . . . . . . . . . . . . . . . . . . . . . . Manufacturing LeasedPhoenix, AZ . . . . . . . . . . . . . . . . . . . . Warehouse LeasedChicago, IL . . . . . . . . . . . . . . . . . . . . . Distribution Center LeasedReno, NV . . . . . . . . . . . . . . . . . . . . . . Distribution Center LeasedVernon, CA . . . . . . . . . . . . . . . . . . . . Distribution Center LeasedCalgary, AB, Canada . . . . . . . . . . . . . . Distribution Center Leased
21
Europe:
Location Principal Use Owned/Leased
Eerbeek, Netherlands . . . . . . . . . . . . . European Headquarters/ OwnedManufacturing
Biassono, Italy . . . . . . . . . . . . . . . . . . . Manufacturing OwnedBrescia, Italy . . . . . . . . . . . . . . . . . . . . Manufacturing OwnedLandau, Germany . . . . . . . . . . . . . . . . Manufacturing OwnedFresseneville, France . . . . . . . . . . . . . . Manufacturing OwnedHautvillers, France . . . . . . . . . . . . . . . Manufacturing OwnedPlovdiv, Bulgaria . . . . . . . . . . . . . . . . . Manufacturing OwnedAmmanford, United Kingdom . . . . . . . Manufacturing OwnedRosieres, France . . . . . . . . . . . . . . . . . Manufacturing LeasedMonastir, Tunisia . . . . . . . . . . . . . . . . . Manufacturing LeasedGardolo, Italy . . . . . . . . . . . . . . . . . . . Manufacturing LeasedSorgues, France . . . . . . . . . . . . . . . . . . Manufacturing LeasedGrenoble, France . . . . . . . . . . . . . . . . Manufacturing Leased
China:
Location Principal Use Owned/Leased
Tianjin Tanggu District, THMT, China . Manufacturing OwnedTaizhou, Yuhuan, China . . . . . . . . . . . . Manufacturing OwnedHunan, Changsha, China . . . . . . . . . . . Manufacturing OwnedNingbo, Beilun, China . . . . . . . . . . . . . Manufacturing OwnedTianjin Tanggu District, China . . . . . . . Manufacturing LeasedNingbo, Beilun Port, China . . . . . . . . . Distribution Center Leased
Certain of our facilities are subject to mortgages and collateral assignments under loan agreementswith long-term lenders. In general, we believe that our properties, including machinery, tools andequipment, are in good condition, well maintained and adequate and suitable for their intended uses.We believe that our manufacturing facilities are currently operating at a level that our managementconsiders normal capacity, except for our plants in St. Pauls, North Carolina, Langley, BC, Canada andGardolo, Italy, which are under-utilized. Management believes capacity utilization will continue toincrease in 2008 at these plants, subject to unexpected changes in our sales volume.
Item 3. LEGAL PROCEEDINGS.
We are from time to time involved in various legal and administrative procedures. See Part I,Item 1, ‘‘Business—Product Liability, Environmental and Other Litigation Matters,’’ which isincorporated herein by reference
Item 4. SUBMISSION OF MATTERS TO A VOTE OF SECURITY HOLDERS.
There were no matters submitted during the fourth quarter of the fiscal year covered by thisAnnual Report to a vote of security holders through solicitation of proxies or otherwise.
22
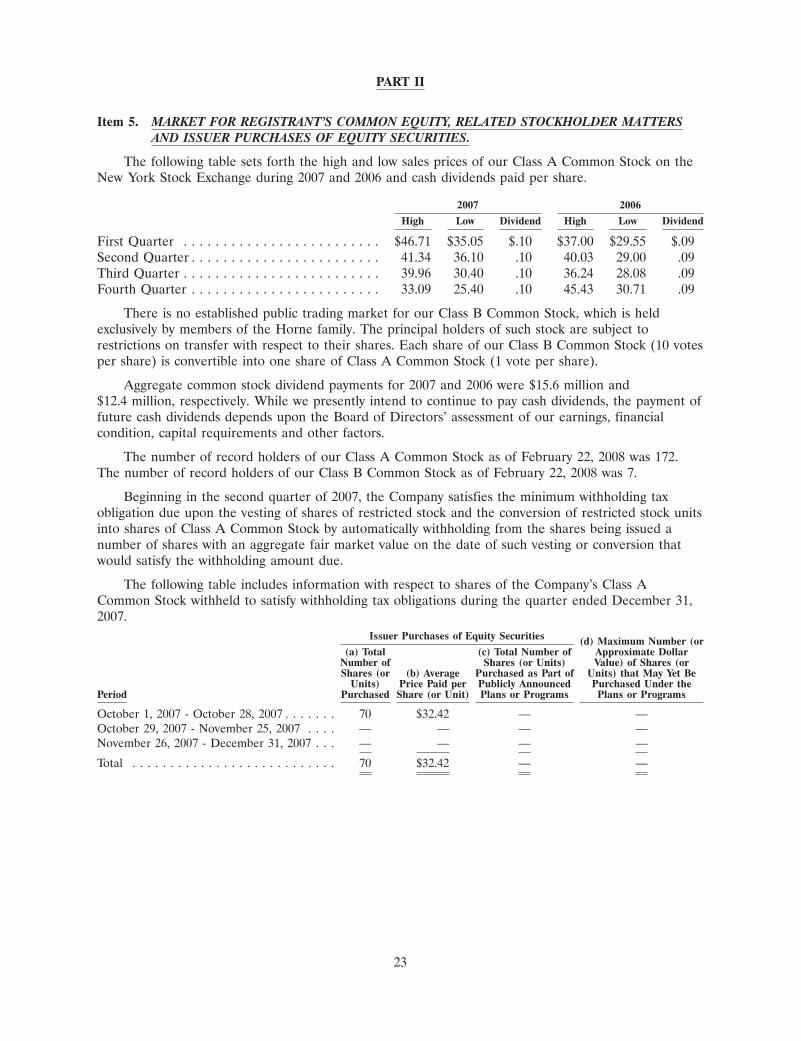
PART II
Item 5. MARKET FOR REGISTRANT’S COMMON EQUITY, RELATED STOCKHOLDER MATTERSAND ISSUER PURCHASES OF EQUITY SECURITIES.
The following table sets forth the high and low sales prices of our Class A Common Stock on theNew York Stock Exchange during 2007 and 2006 and cash dividends paid per share.
2007 2006
High Low Dividend High Low Dividend
First Quarter . . . . . . . . . . . . . . . . . . . . . . . . . $46.71 $35.05 $.10 $37.00 $29.55 $.09Second Quarter . . . . . . . . . . . . . . . . . . . . . . . . 41.34 36.10 .10 40.03 29.00 .09Third Quarter . . . . . . . . . . . . . . . . . . . . . . . . . 39.96 30.40 .10 36.24 28.08 .09Fourth Quarter . . . . . . . . . . . . . . . . . . . . . . . . 33.09 25.40 .10 45.43 30.71 .09
There is no established public trading market for our Class B Common Stock, which is heldexclusively by members of the Horne family. The principal holders of such stock are subject torestrictions on transfer with respect to their shares. Each share of our Class B Common Stock (10 votesper share) is convertible into one share of Class A Common Stock (1 vote per share).
Aggregate common stock dividend payments for 2007 and 2006 were $15.6 million and$12.4 million, respectively. While we presently intend to continue to pay cash dividends, the payment offuture cash dividends depends upon the Board of Directors’ assessment of our earnings, financialcondition, capital requirements and other factors.
The number of record holders of our Class A Common Stock as of February 22, 2008 was 172.The number of record holders of our Class B Common Stock as of February 22, 2008 was 7.
Beginning in the second quarter of 2007, the Company satisfies the minimum withholding taxobligation due upon the vesting of shares of restricted stock and the conversion of restricted stock unitsinto shares of Class A Common Stock by automatically withholding from the shares being issued anumber of shares with an aggregate fair market value on the date of such vesting or conversion thatwould satisfy the withholding amount due.
The following table includes information with respect to shares of the Company’s Class ACommon Stock withheld to satisfy withholding tax obligations during the quarter ended December 31,2007.
Issuer Purchases of Equity Securities (d) Maximum Number (or(a) Total (c) Total Number of Approximate Dollar
Number of Shares (or Units) Value) of Shares (orShares (or (b) Average Purchased as Part of Units) that May Yet Be
Units) Price Paid per Publicly Announced Purchased Under thePeriod Purchased Share (or Unit) Plans or Programs Plans or Programs
October 1, 2007 - October 28, 2007 . . . . . . . 70 $32.42 — —October 29, 2007 - November 25, 2007 . . . . — — — —November 26, 2007 - December 31, 2007 . . . — — — —
Total . . . . . . . . . . . . . . . . . . . . . . . . . . . 70 $32.42 — —
23
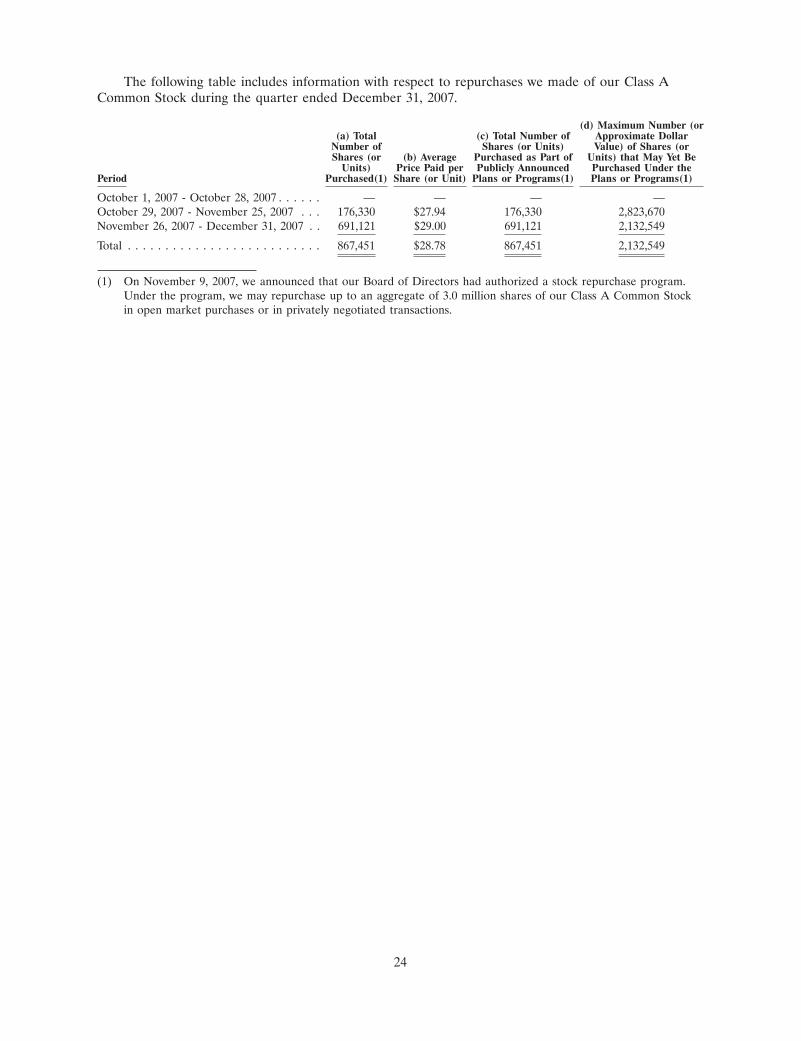
The following table includes information with respect to repurchases we made of our Class ACommon Stock during the quarter ended December 31, 2007.
(d) Maximum Number (or(a) Total (c) Total Number of Approximate Dollar
Number of Shares (or Units) Value) of Shares (orShares (or (b) Average Purchased as Part of Units) that May Yet Be
Units) Price Paid per Publicly Announced Purchased Under thePeriod Purchased(1) Share (or Unit) Plans or Programs(1) Plans or Programs(1)
October 1, 2007 - October 28, 2007 . . . . . . — — — —October 29, 2007 - November 25, 2007 . . . 176,330 $27.94 176,330 2,823,670November 26, 2007 - December 31, 2007 . . 691,121 $29.00 691,121 2,132,549
Total . . . . . . . . . . . . . . . . . . . . . . . . . . 867,451 $28.78 867,451 2,132,549
(1) On November 9, 2007, we announced that our Board of Directors had authorized a stock repurchase program.Under the program, we may repurchase up to an aggregate of 3.0 million shares of our Class A Common Stockin open market purchases or in privately negotiated transactions.
24
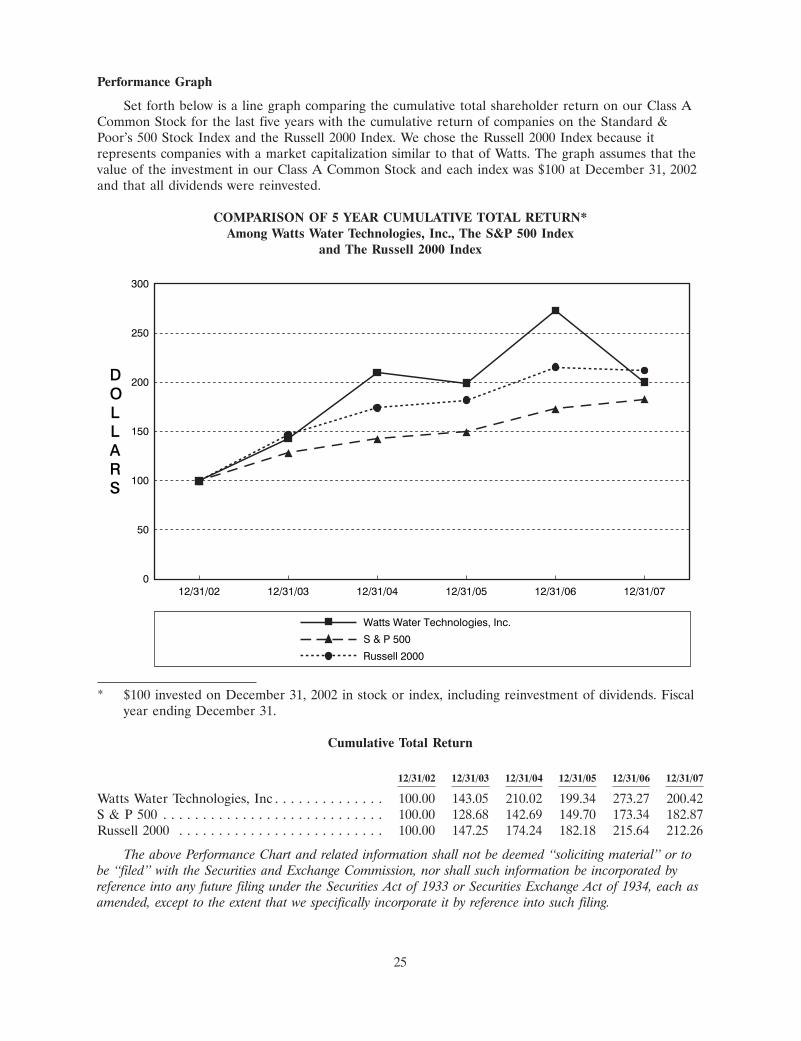
22FEB200813321213
Performance Graph
Set forth below is a line graph comparing the cumulative total shareholder return on our Class ACommon Stock for the last five years with the cumulative return of companies on the Standard &Poor’s 500 Stock Index and the Russell 2000 Index. We chose the Russell 2000 Index because itrepresents companies with a market capitalization similar to that of Watts. The graph assumes that thevalue of the investment in our Class A Common Stock and each index was $100 at December 31, 2002and that all dividends were reinvested.
COMPARISON OF 5 YEAR CUMULATIVE TOTAL RETURN*Among Watts Water Technologies, Inc., The S&P 500 Index
and The Russell 2000 Index
0
50
100
150
200
250
300
DOLLARS
12/31/02 12/31/03 12/31/04 12/31/05 12/31/06 12/31/07
S & P 500
Watts Water Technologies, Inc.
Russell 2000
* $100 invested on December 31, 2002 in stock or index, including reinvestment of dividends. Fiscalyear ending December 31.
Cumulative Total Return
12/31/02 12/31/03 12/31/04 12/31/05 12/31/06 12/31/07
Watts Water Technologies, Inc . . . . . . . . . . . . . . 100.00 143.05 210.02 199.34 273.27 200.42S & P 500 . . . . . . . . . . . . . . . . . . . . . . . . . . . . 100.00 128.68 142.69 149.70 173.34 182.87Russell 2000 . . . . . . . . . . . . . . . . . . . . . . . . . . 100.00 147.25 174.24 182.18 215.64 212.26
The above Performance Chart and related information shall not be deemed ‘‘soliciting material’’ or tobe ‘‘filed’’ with the Securities and Exchange Commission, nor shall such information be incorporated byreference into any future filing under the Securities Act of 1933 or Securities Exchange Act of 1934, each asamended, except to the extent that we specifically incorporate it by reference into such filing.
25
Item 6. SELECTED FINANCIAL DATA.
The selected financial data set forth below should be read in conjunction with our consolidatedfinancial statements, related Notes thereto and ‘‘Management’s Discussion and Analysis of FinancialCondition and Results of Operations’’ included herein.
FIVE-YEAR FINANCIAL SUMMARY
(Amounts in millions, except per share and cash dividend information)
Year Ended Year Ended Year Ended Year Ended Year Ended12/31/07(1)(7) 12/31/06(2)(7) 12/31/05(3)(4)(7) 12/31/04(5)(6)(7) 12/31/03(7)(8)
Statement of operations data:Net sales . . . . . . . . . . . . . . . . . . . . . $1,382.3 $1,230.8 $ 924.3 $824.6 $701.9Income from continuing operations . . 77.6 77.1 55.0 48.7 36.4Loss from discontinued operations,
net of taxes . . . . . . . . . . . . . . . . . . (.2) (3.4) (.4) (1.9) (3.1)Net income . . . . . . . . . . . . . . . . . . . 77.4 73.7 54.6 46.8 33.4Income per share from continuing
operations—diluted . . . . . . . . . . . . 1.99 2.29 1.67 1.49 1.32Loss per share from discontinued
operations—diluted . . . . . . . . . . . . (.01) (.10) (.01) (.06) (.11)Net income per share—diluted . . . . . 1.99 2.19 1.66 1.43 1.21Cash dividends declared per common
share . . . . . . . . . . . . . . . . . . . . . . $ .40 $ .36 $ .32 $ .28 $ .25Balance Sheet Data (at year end):Total assets . . . . . . . . . . . . . . . . . . . . $1,729.3 $1,660.9 $1,101.0 $922.7 $840.9Long-term debt, net of current
portion . . . . . . . . . . . . . . . . . . . . . $ 432.2 $ 441.7 $ 293.4 $180.6 $179.1
(1) For the year ended December 31, 2007, net income includes the following net pre-tax costs: changein estimate of workers compensation costs of $2.9 million, severance and product linediscontinuance costs in North America of $0.4 million and $3.1 million, respectively; accelerateddepreciation and asset write-downs, product line discontinuance costs and severance costs in Chinaof $2.9 million, $0.7 million and $0.4 million, respectively, and minority interest income of$0.9 million. The after-tax cost of these items was $6.9 million.
(2) For the year ended December 31, 2006, net income includes the following net pre-tax gain: gain onsales of buildings of $8.2 million, restructuring costs consisting primarily of European severance of$2.2 million and amortization of $0.4 million, other costs consisting of accelerated depreciation andseverance in our Chinese joint venture of $4.7 million and minority interest income of $1.5 million.The after-tax gain of these items was $1.5 million.
(3) For the year ended December 31, 2005, net income includes the following pre-tax costs:restructuring of $0.7 million and other costs consisting of accelerated depreciation and asset write-downs of $1.8 million. The after-tax cost of these items was $1.6 million.
(4) For the year ended December 31, 2005, net income includes a net after-tax charge of $0.9 millionfor a selling, general and administrative expense charge of $1.5 million related to a contingentearn-out agreement.
(5) For the year ended December 31, 2004, net income includes a net after-tax charge of $2.3 millionfor certain accrued expense adjustments, which are included in selling, general and administrativeexpense after-tax charges of $3.5 million related to a contingent earn-out agreement and$0.7 million for various accrual adjustments and $0.5 million recorded as an income tax benefit.
26
(6) For the year ended December 31, 2004, net income includes the following pre-tax costs:restructuring of $0.1 million and other costs consisting of accelerated depreciation of $2.9 million.The after-tax cost of these items was $1.8 million.
(7) In December 2004, we decided to divest our interest in our minority-owned subsidiary, JamecoInternational, LLC (Jameco LLC). We recorded in discontinued operation a net of tax impairmentcharge of $0.7 million for the year ended December 31, 2004. Also included in discontinuedoperations is the net of tax operating results of Jameco LLC of $0.1 million of loss and$0.1 million of income for the year ended December 31, 2004 and 2003, respectively. In September1996, we divested our Municipal Water Group of businesses, which included Henry Pratt, JamesJones Company and Edward Barber and Company Ltd. Costs and expenses related to theMunicipal Water Group, for 2007, 2006, 2005, 2004 and 2003 relate to legal and settlement costsassociated with the James Jones Litigation. The loss, net of taxes, consists of $0.2 million,$3.4 million, $0.4 million, $1.1 million and $3.1 million for the years ended December 31, 2007,2006, 2005, 2004 and 2003, respectively.
(8) For the year ended December 31, 2003, net income includes the following pre-tax costs:restructuring of $0.4 million; other costs consist of: inventory and other asset write-downs andaccelerated depreciation of $0.5 million; and $0.8 million of other related charges. The after-taxcost of these items was $1.1 million.
27
Item 7. MANAGEMENT’S DISCUSSION AND ANALYSIS OF FINANCIAL CONDITION ANDRESULTS OF OPERATIONS.
Overview
We are a leading supplier of products for use in the water quality, water safety, water flow controland water conservation markets in both North America and Europe with an emerging presence inChina. For over 130 years, we have designed and manufactured products that promote the comfort andsafety of people and the quality and conservation of water used in commercial and residentialapplications. We earn revenue and income almost exclusively from the sale of our products. Ourprincipal product lines include:
• water quality products, including backflow preventers and check valves for preventing reverseflow within water lines and fire protection systems and point-of-use water filtration and reverseosmosis systems for both commercial and residential applications;
• a wide range of water pressure regulators for both commercial and residential applications;
• water supply and drainage products for commercial and residential applications;
• temperature and pressure relief valves for water heaters, boilers and associated systems;
• thermostatic mixing valves for tempering water in commercial and residential applications;
• systems for under-floor radiant applications and hydraulic pump groups for gas boilermanufacturers and renewable energy applications, including solar and heat pump controlpackages;
• flexible stainless steel connectors for natural and liquid propane gas in commercial food serviceand residential applications; and
• large diameter butterfly valves for use in China’s water infrastructure.
Our business is reported in three geographic segments, North America, Europe and China. Wedistribute our products through three primary distribution channels, wholesale, do-it-yourself (DIY) andoriginal equipment manufacturers (OEMs). Interest rates have an indirect effect on the demand for ourproducts due to the effect such rates have on the number of new residential and commercialconstruction starts and remodeling projects. All three of these activities have an impact on our levels ofsales and earnings. An additional factor that has had an effect on our sales is fluctuation in foreigncurrencies, as a portion of our sales and certain portions of our costs, assets and liabilities aredenominated in currencies other than the U.S. dollar.
We believe that the factors relating to our future growth include our ability to continue to makeselective acquisitions, both in our core markets as well as in new complementary markets, regulatoryrequirements relating to the quality and conservation of water, increased demand for clean water withcontinued enforcement of plumbing and building codes and a healthy economic environment. We havecompleted 31 acquisitions since divesting our industrial and oil and gas business in 1999. Ouracquisition strategy focuses on businesses that manufacture preferred brand name products that addressour themes of water quality, water conservation, water safety and water flow control and relatedcomplementary markets. We target businesses that will provide us with one or more of the following:an entry into new markets, an increase in shelf space with existing customers, a new or improvedtechnology or an expansion of the breadth of our water quality, water conservation, water safety andwater flow control products for the residential and commercial markets. In 2007 and 2006, sales fromacquisitions contributed approximately 3.9% and 20.9%, to our total sales growth over the prior year.
Products representing a majority of our sales are subject to regulatory standards and codeenforcement, which typically require that these products meet stringent performance criteria. Togetherwith our commissioned manufacturers’ representatives, we have consistently advocated for thedevelopment and enforcement of such plumbing codes. We are focused on maintaining stringent quality
28
control and testing procedures at each of our manufacturing facilities in order to manufacture productsin compliance with code requirements and take advantage of the resulting demand for compliantproducts. We believe that the product development, product testing capability and investment in plantand equipment needed to manufacture products in compliance with code requirements, represent abarrier to entry for competitors. We believe there is an increasing demand among consumers forproducts to ensure water quality, which creates growth opportunities for our products.
We require substantial amounts of raw materials to produce our products, including bronze, brass,cast iron, steel and plastic, and substantially all of the raw materials we require are purchased fromoutside sources. We have experienced increases in the costs of certain raw materials, particularlycopper. Bronze and brass are copper-based alloys. The spot price of copper increased approximately41% from December 31, 2005 to December 31, 2007.
A risk we face is our ability to deal effectively with increases in raw material costs. We manage thisrisk by monitoring related market prices, working with our suppliers to achieve the maximum level ofstability in their costs and related pricing, seeking alternative supply sources when necessary,implementing cost reduction programs and passing increases in costs to our customers. Additionallyfrom time to time we may use commodity futures contracts on a limited basis to manage this risk. Weare not able to predict whether or for how long these cost increases will continue. If these costincreases continue and we are not able to reduce or eliminate the effect of the cost increases byreducing production costs or implementing price increases, our profit margins could decrease.
Another risk we face in all areas of our business is competition. We consider brand preference,engineering specifications, code requirements, price, technological expertise, delivery times and breadthof product offerings to be the primary competitive factors. As mentioned previously, we believe that theproduct development, product testing capability and investment in plant and equipment needed tomanufacture products in compliance with code requirements, represent a barrier to entry forcompetitors. We are committed to maintaining our capital equipment at a level consistent with currenttechnologies, and thus we spent approximately $37.8 million in 2007 and $44.7 million in 2006(including approximately $18.0 million related to the purchase and subsequent sale-leaseback of abuilding in Italy).
Recent Developments
On February 5, 2008, we declared a quarterly dividend of eleven cents ($0.11) per share on eachoutstanding share of Class A Common Stock and Class B Common Stock. This is an increase of $0.01per share compared to the dividend paid for the comparable period last year.
On December 3, 2007, we entered into an Equity Transfer Agreement (the ‘‘Agreement’’) with ourjoint venture partners to purchase the remaining 40% of the outstanding ownership interest in TianjinTanggu Watts Valve Company Limited (‘‘TWT’’) that we did not already own. The purchase price willbe approximately $5.2 million, payable after certain closing conditions are met, including the approvalof the Agreement by the local Chinese authorities, which we expect will occur by the end of the secondquarter of 2008. We expect to record approximately $3.7 million in goodwill for this acquisition.
As part of this Agreement, the joint venture partners are obligated to reimburse approximately$2.0 million to TWT at the closing for relocation costs including lost land use rights. These costs werepreviously guaranteed by the joint venture partners as part of the original joint venture contract. TWTlost the future use of these land use rights when the local Chinese government decreed that the landwhere TWT’s facility is located would be taken over by eminent domain. Since 2006, TWT hasaccelerated the amortization of the land use rights assets to coincide with the expected move. FurtherTWT has incurred and will incur relocation costs to move its operations. TWT had not previouslyrecorded a receivable for this reimbursement amount, as collectibility of the amount under the originaljoint venture contract was not certain. The $2.0 million reimbursement will be recorded when theAgreement is finalized as an equity infusion by the joint venture partners. The cost to move TWT’soperations was included in the restructuring program announced in October 2007.
29
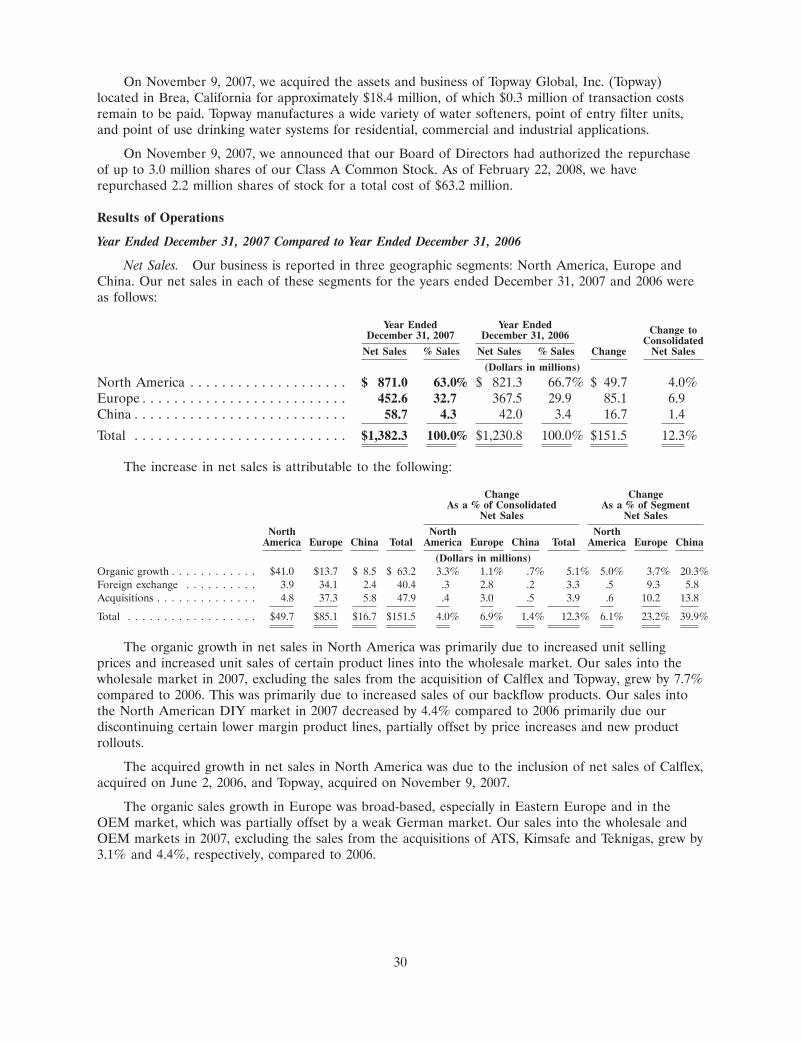
On November 9, 2007, we acquired the assets and business of Topway Global, Inc. (Topway)located in Brea, California for approximately $18.4 million, of which $0.3 million of transaction costsremain to be paid. Topway manufactures a wide variety of water softeners, point of entry filter units,and point of use drinking water systems for residential, commercial and industrial applications.
On November 9, 2007, we announced that our Board of Directors had authorized the repurchaseof up to 3.0 million shares of our Class A Common Stock. As of February 22, 2008, we haverepurchased 2.2 million shares of stock for a total cost of $63.2 million.
Results of Operations
Year Ended December 31, 2007 Compared to Year Ended December 31, 2006
Net Sales. Our business is reported in three geographic segments: North America, Europe andChina. Our net sales in each of these segments for the years ended December 31, 2007 and 2006 wereas follows:
Year Ended Year Ended Change toDecember 31, 2007 December 31, 2006 ConsolidatedNet Sales % Sales Net Sales % Sales Change Net Sales
(Dollars in millions)
North America . . . . . . . . . . . . . . . . . . . . $ 871.0 63.0% $ 821.3 66.7% $ 49.7 4.0%Europe . . . . . . . . . . . . . . . . . . . . . . . . . . 452.6 32.7 367.5 29.9 85.1 6.9China . . . . . . . . . . . . . . . . . . . . . . . . . . . 58.7 4.3 42.0 3.4 16.7 1.4
Total . . . . . . . . . . . . . . . . . . . . . . . . . . . $1,382.3 100.0% $1,230.8 100.0% $151.5 12.3%
The increase in net sales is attributable to the following:
Change ChangeAs a % of Consolidated As a % of Segment
Net Sales Net Sales
North North NorthAmerica Europe China Total America Europe China Total America Europe China
(Dollars in millions)Organic growth . . . . . . . . . . . . $41.0 $13.7 $ 8.5 $ 63.2 3.3% 1.1% .7% 5.1% 5.0% 3.7% 20.3%Foreign exchange . . . . . . . . . . 3.9 34.1 2.4 40.4 .3 2.8 .2 3.3 .5 9.3 5.8Acquisitions . . . . . . . . . . . . . . 4.8 37.3 5.8 47.9 .4 3.0 .5 3.9 .6 10.2 13.8
Total . . . . . . . . . . . . . . . . . . $49.7 $85.1 $16.7 $151.5 4.0% 6.9% 1.4% 12.3% 6.1% 23.2% 39.9%
The organic growth in net sales in North America was primarily due to increased unit sellingprices and increased unit sales of certain product lines into the wholesale market. Our sales into thewholesale market in 2007, excluding the sales from the acquisition of Calflex and Topway, grew by 7.7%compared to 2006. This was primarily due to increased sales of our backflow products. Our sales intothe North American DIY market in 2007 decreased by 4.4% compared to 2006 primarily due ourdiscontinuing certain lower margin product lines, partially offset by price increases and new productrollouts.
The acquired growth in net sales in North America was due to the inclusion of net sales of Calflex,acquired on June 2, 2006, and Topway, acquired on November 9, 2007.
The organic sales growth in Europe was broad-based, especially in Eastern Europe and in theOEM market, which was partially offset by a weak German market. Our sales into the wholesale andOEM markets in 2007, excluding the sales from the acquisitions of ATS, Kimsafe and Teknigas, grew by3.1% and 4.4%, respectively, compared to 2006.
30
The acquired growth in net sales in Europe was due to the inclusion of the net sales of ATS,acquired on May 19, 2006, Kimsafe, acquired on June 7, 2006, and Teknigas, acquired on August 14,2006.
The organic sales growth in China was primarily due to increased export sales to Europe,increased sales into the domestic Chinese markets and the elimination of the one-month reporting lagin two of our Chinese entities.
The acquired growth in net sales in China was due to the inclusion of net sales of Changsha,acquired on April 26, 2006.
The increases in net sales due to foreign exchange in North America, Europe and China wereprimarily due to the appreciation of the Canadian dollar, euro and yuan, respectively, against the U.S.dollar. We cannot predict whether these currencies will continue to appreciate against the U.S. dollar infuture periods or whether future foreign exchange rate fluctuations will have a positive or negativeimpact on our net sales.
Gross Profit. Gross profit and gross profit as a percent of net sales (gross margin) for 2007 and2006 were as follows:
Year EndedDecember 31, Point
2007 2006 Change
(dollars in millions)
Gross profit . . . . . . . . . . . . . . . . . . . . . . . . . . . . . . . . $461.6 $425.0Gross margin . . . . . . . . . . . . . . . . . . . . . . . . . . . . . . . 33.4% 34.5% (1.1%)
Gross margin decreased in 2007 compared to 2006 primarily due to increased material costs, thewrite-off of inventory related to the discontinuance of certain product lines and an increase in ourworkers compensation reserve primarily due to a change in estimate. The North American margin for2007 was affected by a charge related to our discontinuance of certain product lines and for costincreases for copper-based alloys and stainless steel products, which exceeded realized sales priceincreases for most of the year. The European margin remained relatively flat primarily due to highermargins contributed by price increases that were offset by increased material costs and a shift in salesto lower margin products primarily in the OEM market. Our China segment’s gross margin decreasedprimarily due to higher material costs, underutilized capacity in certain locations primarily due to therelocation of our joint venture facility, a charge related to our discontinuance of certain product lines,value added tax increases and a shift in product mix.
In 2007, we undertook a review of certain product lines and our overall manufacturing capacity.Based on that review, we initiated a global restructuring program that was approved by our Board ofDirectors on October 30, 2007. We also discontinued certain product lines. This program is expected toinclude the shutdown of five manufacturing facilities and the rightsizing of a sixth facility, including therelocation of our joint venture facility in China that was previously disclosed. The restructuringprogram and charges for certain product line discontinuances will include pre-tax charges totalingapproximately $12.9 million. Charges are primarily for severance ($4.3 million), relocation costs($2.8 million) and other asset write-downs and expected net losses on asset disposals ($2.0 million) andwill result in the elimination of approximately 330 positions worldwide. The pre-tax charge in 2007 of$4.3 million relates primarily to product line discontinuances ($3.8 million). Total net after-tax chargesfor this program are expected to be approximately $9.4 million ($4.4 million non-cash), with costs beingincurred through early 2010. We expect to spend approximately $13.4 million in capital expenditures toconsolidate operations and will fund approximately $8.0 million of this amount through proceeds fromthe sale of buildings and other assets being disposed of as part of the restructuring program. Annualcash savings, net of tax, are estimated to be $4.5 million, which will be fully realized by the second halfof 2009.
31
The following table presents the total estimated pre-tax charges to be incurred for the globalrestructuring program and product line discontinuances initiated in 2007 by our reportable segments:
Reportable Segment (in millions)
North America . . . . . . . . . . . . . . . . . . . . . . . . . . . . . $ 5.7Europe . . . . . . . . . . . . . . . . . . . . . . . . . . . . . . . . . . 3.9China . . . . . . . . . . . . . . . . . . . . . . . . . . . . . . . . . . . . 3.3
Total . . . . . . . . . . . . . . . . . . . . . . . . . . . . . . . . . . . . $12.9
Selling, General and Administrative Expenses. Selling, general and administrative expenses, orSG&A expenses, for 2007 increased $32.5 million, or 10.8%, compared to 2006. The increase in SG&Aexpenses is attributable to the following:
(in millions) % Change
Organic growth . . . . . . . . . . . . . . . . . . . . . . . . . . . . . . . . . . $13.1 4.4%Foreign exchange . . . . . . . . . . . . . . . . . . . . . . . . . . . . . . . . . 7.9 2.6Acquisitions . . . . . . . . . . . . . . . . . . . . . . . . . . . . . . . . . . . . 11.5 3.8
Total . . . . . . . . . . . . . . . . . . . . . . . . . . . . . . . . . . . . . . . . . . $32.5 10.8%
The organic increase in SG&A expenses was primarily due to increased product liability costs,increased stock-based compensation costs and increased variable selling expenses due to increased salesvolumes partially offset by decreased incentive compensation costs. The increase in SG&A expensesfrom foreign exchange was primarily due to the appreciation of the euro, Canadian dollar and the yuanagainst the U.S. dollar. The increase in SG&A expenses from acquisitions was due to the inclusion ofChangsha, ATS, Calflex, Ningbo, Kimsafe, Teknigas and Topway. Total SG&A expenses, as a percentageof sales, was 24.1% in 2007 compared to 24.4% 2006.
Restructuring and Other (Income) Charges. In 2007, we recorded $3.2 million for asset write-downs, accelerated depreciation and severance in North America and China. In 2006, we recordedincome of $5.7 million primarily due to a gain of approximately $8.2 million related to the sale of twobuildings in Italy partially offset by a charge of $2.5 million primarily for severance costs related to ourEuropean restructuring programs.
Operating Income. Operating income by geographic segment for 2007 and 2006 was as follows:
% Change toYears Ended ConsolidatedDecember 31, December 31, Operating
2007 2006 Change Income
(Dollars in millions)
North America . . . . . . . . . . . . . . . . $ 93.3 $ 98.5 $(5.2) (4.0)%Europe . . . . . . . . . . . . . . . . . . . . . 53.6 50.0 3.6 2.8China . . . . . . . . . . . . . . . . . . . . . . 7.9 7.2 .7 .5Corporate . . . . . . . . . . . . . . . . . . . (29.1) (25.2) (3.9) (3.0)
Total . . . . . . . . . . . . . . . . . . . . . . . $125.7 $130.5 $(4.8) (3.7)%
32
The change in operating income is attributable to the following:
Change ChangeAs a % of Consolidated As a % of Segment
Operating Income Operating Income
North North NorthAmerica Europe China Corp. Total America Europe China Corp. Total America Europe China Corp.
(Dollars in millions)Organic growth . . . $(1.3) $ .9 $(1.5) $(3.9) $(5.8) (1.0)% .7% (1.3)%(3.0)% (4.6)% (1.4)% 1.8% (20.8)%(15.5)%Foreign exchange . . .9 4.0 .4 — 5.3 .7 3.1 .3 — 4.1 .9 8.0 5.5 —Acquisitions . . . . . . (1.3) 4.8 .8 — 4.3 (1.0) 3.6 .7 — 3.3 (1.3) 9.6 11.1 —Restructuring/other . (3.5) (6.1) 1.0 — (8.6) (2.7) (4.6) .8 — (6.5) (3.5) (12.2) 13.9 —
Total . . . . . . . . . . $(5.2) $ 3.6 $ .7 $(3.9) $(4.8) (4.0)% 2.8% .5% (3.0)% (3.7)% (5.3)% 7.2% 9.7% (15.5)%
The decrease in organic operating income in North America was primarily due to increasedmaterial costs partially offset by unit price increases, a net increase in our workers compensationreserve primarily due to a change in estimate and increased product liability costs, partially offset bydecreased incentive compensation costs. In 2007, we recorded a charge of $3.1 million related to ourdiscontinuance of certain product lines and $0.4 million for primarily for severance costs related to ourglobal restructuring program.
The acquired decrease is primarily due to the amortization of certain costs associated with theacquisition of Topway.
Europe’s organic growth in operating income is due to our ability to leverage SG&A expenses,increased selling prices partially offset by increased material costs and a shift in sales to lower marginproducts primarily in the OEM market. In 2007, we did not record any costs associated withrestructuring compared to a gain of $6.0 million for the same period in 2006. We recorded a gain of$8.2 million for the building sales in Italy partially offset by $2.2 million of primarily severance costs.
The acquired growth in Europe is due to the inclusion of the operating income from ATS, Kimsafeand Teknigas.
The decrease in organic operating income in China was primarily attributable to decreasedproduction levels at our wholly owned manufacturing plants. The acquired growth in China was due tothe inclusion of the operating income of Changsha and Ningbo. In 2007, we recorded $3.3 million forasset write-downs, accelerated depreciation and severance related to our global restructuring programand $0.7 million related to our discontinuance of certain product lines. The elimination of a one-monthreporting lag in two of our Chinese entities did not have a material impact on China’s operatingincome.
The decrease in organic operating income in Corporate was primarily attributable to increasedstock-based compensation costs and legal costs, partially offset by decreased incentive compensationcosts.
The net increase in operating income from foreign exchange was primarily due to the appreciationof the euro, Canadian dollar and yuan against the U.S. dollar. We cannot predict whether thesecurrencies will continue to appreciate against the U.S. dollar in future periods or whether futureforeign exchange rate fluctuations will have a positive or negative impact on our operating income.
Interest Income. Interest income increased $9.5 million, or 190.0%, in 2007 compared to 2006,primarily due to the investment of the net proceeds of approximately $219.0 million from the publicoffering of 5.75 million shares of our Class A Common Stock in November 2006.
Interest Expense. Interest expense increased $4.8 million, or 21.7%, in 2007 compared to 2006,primarily due to our April 27, 2006 issuance of $225.0 million 5.85% senior notes due in 2016 and anincrease in the average variable rates charged on the revolving credit facility partially offset bydecreased debt levels for acquisitions.
33
Effective July 1, 2005, we entered into an interest rate swap for a notional amount of A25.0 millionoutstanding on our revolving credit facility. We swapped an adjustable rate of three month EURIBORplus 0.6% for a fixed rate of 3.02%. We recorded a reduction to interest expense of approximately$0.7 million to recognize the fair value of the swap for 2006. The swap was terminated on October 3,2006.
Other (Income) Expense. Other (income) expense increased $3.2 million, or 355.6% in 2007compared to 2006, primarily due to currency movements and losses on forward currency contracts.Foreign currency losses were recorded in Europe, Canada and China in 2007, whereas foreign currencygains were recorded in 2006.
Minority interest. Minority interest increased $1.0 million, or 55.6%, for 2007 compared to 2006,primarily due to the credit recorded for the 40% liability of our joint venture partner’s share in therecording of the $2.4 million TWT restructuring costs.
Income Taxes. Our effective tax rate for continuing operations decreased to 31.8% in 2007 from33.6% in 2006. The decrease is primarily due to a one-time benefit associated with a refund ofwithholding taxes in Italy and in 2006 the recording of higher taxes on the sale of two buildings. Thisdecrease is partially offset by the recording of a $3.2 million valuation allowance on the deferred taxassets of our 60% owned Chinese joint venture.
Income From Continuing Operations. Income from continuing operations in 2007 increased$0.5 million, or 0.6%, to $77.6 million, or $1.99 per common share, from $77.1 million, or $2.29 percommon share, for 2006, in each case, on a diluted basis. Income from continuing operations for 2007includes a tax refund of $1.9 million, or $0.05 per common share. Income from continuing operationsfor 2007 and 2006 included costs, net of tax, from our restructuring plan and product linediscontinuances of $5.1 million, or $0.13 per common share, and included income, net of tax, of$1.5 million, or $0.04 per share, respectively. In 2006, the gains on the sales of our buildings in Italyresulted in an after-tax gain of $5.1 million, or $0.15 per share. The appreciation of the euro, Chineseyuan and Canadian dollar against the U.S. dollar resulted in a positive impact on income fromcontinuing operations of $0.09 per common share for 2007 compared to the comparable period lastyear. We cannot predict whether the euro, Canadian dollar or yuan will appreciate or depreciateagainst the U.S. dollar in future periods or whether future foreign exchange rate fluctuations will havea positive or negative impact on our net income.
Additionally, in November 2006, the Company completed a public offering of 5.75 million sharesof Class A Common Stock and received net proceeds of approximately $219.0 million. The interestearned on the net proceeds provided approximately $7.1 million in after-tax income in 2007. Theissuance of an additional 5.75 million shares had a dilutive impact on earnings per share of $0.11 pershare in 2007, after considering the interest income from the net proceeds.
Loss From Discontinued Operations. Loss from discontinued operations in 2007 and 2006 was$0.2 million, or $0.01 per common share, and $3.4 million, or $0.10 per common share, on a dilutedbasis for the comparable period. The losses for 2007 and 2006 were primarily attributable to increaseddeductible costs in 2006 and legal fees associated with the James Jones Litigation, as described inPart I, Item 1, ‘‘Business-Product Liability, Environmental and Other Litigation Matters.’’ The 2007 losswas partially offset by reserve adjustments.
34
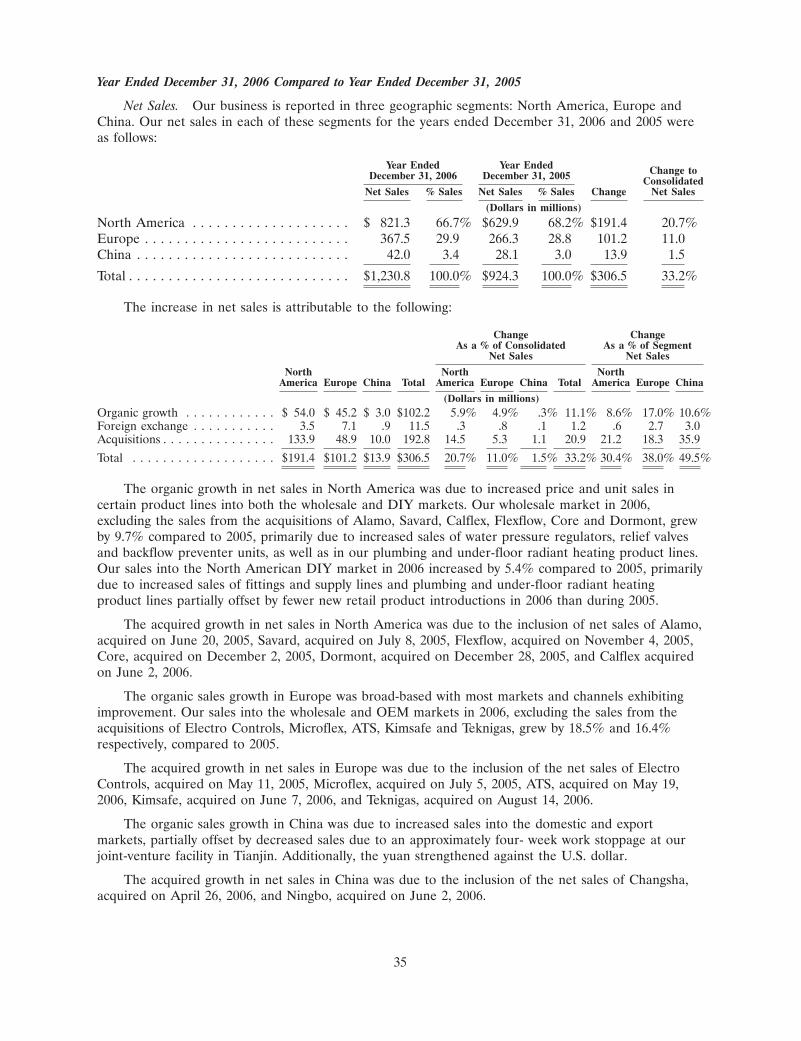
Year Ended December 31, 2006 Compared to Year Ended December 31, 2005
Net Sales. Our business is reported in three geographic segments: North America, Europe andChina. Our net sales in each of these segments for the years ended December 31, 2006 and 2005 wereas follows:
Year Ended Year Ended Change toDecember 31, 2006 December 31, 2005 ConsolidatedNet Sales % Sales Net Sales % Sales Change Net Sales
(Dollars in millions)
North America . . . . . . . . . . . . . . . . . . . . $ 821.3 66.7% $629.9 68.2% $191.4 20.7%Europe . . . . . . . . . . . . . . . . . . . . . . . . . . 367.5 29.9 266.3 28.8 101.2 11.0China . . . . . . . . . . . . . . . . . . . . . . . . . . . 42.0 3.4 28.1 3.0 13.9 1.5
Total . . . . . . . . . . . . . . . . . . . . . . . . . . . . $1,230.8 100.0% $924.3 100.0% $306.5 33.2%
The increase in net sales is attributable to the following:
Change ChangeAs a % of Consolidated As a % of Segment
Net Sales Net Sales
North North NorthAmerica Europe China Total America Europe China Total America Europe China
(Dollars in millions)Organic growth . . . . . . . . . . . . $ 54.0 $ 45.2 $ 3.0 $102.2 5.9% 4.9% .3% 11.1% 8.6% 17.0% 10.6%Foreign exchange . . . . . . . . . . . 3.5 7.1 .9 11.5 .3 .8 .1 1.2 .6 2.7 3.0Acquisitions . . . . . . . . . . . . . . . 133.9 48.9 10.0 192.8 14.5 5.3 1.1 20.9 21.2 18.3 35.9
Total . . . . . . . . . . . . . . . . . . . $191.4 $101.2 $13.9 $306.5 20.7% 11.0% 1.5% 33.2% 30.4% 38.0% 49.5%
The organic growth in net sales in North America was due to increased price and unit sales incertain product lines into both the wholesale and DIY markets. Our wholesale market in 2006,excluding the sales from the acquisitions of Alamo, Savard, Calflex, Flexflow, Core and Dormont, grewby 9.7% compared to 2005, primarily due to increased sales of water pressure regulators, relief valvesand backflow preventer units, as well as in our plumbing and under-floor radiant heating product lines.Our sales into the North American DIY market in 2006 increased by 5.4% compared to 2005, primarilydue to increased sales of fittings and supply lines and plumbing and under-floor radiant heatingproduct lines partially offset by fewer new retail product introductions in 2006 than during 2005.
The acquired growth in net sales in North America was due to the inclusion of net sales of Alamo,acquired on June 20, 2005, Savard, acquired on July 8, 2005, Flexflow, acquired on November 4, 2005,Core, acquired on December 2, 2005, Dormont, acquired on December 28, 2005, and Calflex acquiredon June 2, 2006.
The organic sales growth in Europe was broad-based with most markets and channels exhibitingimprovement. Our sales into the wholesale and OEM markets in 2006, excluding the sales from theacquisitions of Electro Controls, Microflex, ATS, Kimsafe and Teknigas, grew by 18.5% and 16.4%respectively, compared to 2005.
The acquired growth in net sales in Europe was due to the inclusion of the net sales of ElectroControls, acquired on May 11, 2005, Microflex, acquired on July 5, 2005, ATS, acquired on May 19,2006, Kimsafe, acquired on June 7, 2006, and Teknigas, acquired on August 14, 2006.
The organic sales growth in China was due to increased sales into the domestic and exportmarkets, partially offset by decreased sales due to an approximately four- week work stoppage at ourjoint-venture facility in Tianjin. Additionally, the yuan strengthened against the U.S. dollar.
The acquired growth in net sales in China was due to the inclusion of the net sales of Changsha,acquired on April 26, 2006, and Ningbo, acquired on June 2, 2006.
35
The increases in net sales due to foreign exchange in North America, Europe and China wereprimarily due to the appreciation of the Canadian dollar, euro and yuan, respectively, against the U.S.dollar.
Gross Profit. Gross profit and gross margin for 2006 and 2005 were as follows:
Year EndedDecember 31, Point
2006 2005 Change
(dollars in millions)
Gross profit . . . . . . . . . . . . . . . . . . . . . . . . . . . . . . . . . $425.0 $324.7Gross margin . . . . . . . . . . . . . . . . . . . . . . . . . . . . . . . . 34.5% 35.1% (.6%)
Gross margin for 2006 decreased slightly from 2005. Raw materials cost increases have beenpredominantly offset by increased sales prices with the exception of the North American retail marketand certain markets in Europe. In particular, price increases have been difficult to pass along tocustomers in Germany. Margins have also been negatively affected by sales of lower margin productssold by Core and by European acquisition costs. North American gross margin percentage decreaseswere partially offset by a favorable sales mix toward higher margin wholesale sales.
Margins were also negatively affected in 2006 by increased charges related to our manufacturingrestructuring efforts. We recorded $4.7 million to cost of sales for primarily severance costs in 2006 ascompared to $1.8 million in 2005 for accelerated depreciation and other costs.
Selling, General and Administrative Expenses. Selling, general and administrative expenses, orSG&A expenses, for 2006 increased $70.8 million, or 30.8%, compared to 2005. The increase in SG&Aexpenses is attributable to the following:
(in millions) % Change
Organic growth . . . . . . . . . . . . . . . . . . . . . . . . . . . . . . . . . . $24.6 10.7%Foreign exchange . . . . . . . . . . . . . . . . . . . . . . . . . . . . . . . . . 2.1 .9Acquisitions . . . . . . . . . . . . . . . . . . . . . . . . . . . . . . . . . . . . 44.1 19.2
Total . . . . . . . . . . . . . . . . . . . . . . . . . . . . . . . . . . . . . . . . . . $70.8 30.8%
The organic increase in SG&A expenses was primarily due to increased variable selling expensesdue to increased sales volumes, increased insurance costs, increased compensation costs and corporateadministration costs including costs incurred for compliance with FAS 123R, partially offset by lowercosts for complying with Section 404 of the Sarbanes-Oxley Act of 2002 (SOX) and lower earn-outcosts related to a prior acquisition. The increase in SG&A expenses from foreign exchange wasprimarily due to the appreciation of the euro, Canadian dollar and yuan against the U.S. dollar. Theincrease in SG&A expenses from acquisitions was due to the inclusion of Electro Controls, Alamo,Microflex, Savard, Flexflow, Core, Dormont, Changsha, ATS, Calflex, Ningbo, Kimsafe and Teknigas.
Restructuring and Other (Income) Charges. Restructuring and other (income) charges for 2006decreased $6.4 million primarily due to a gain of approximately $8.2 million related to the sale of twobuildings in Italy partially offset by a charge of $2.5 million primarily for severance costs related to ourEuropean restructuring plans. During 2005, we recorded $0.7 million primarily for severance costsrelated to our European restructuring plans.
36
Operating Income. Operating income by geographic segment for 2006 and 2005 was as follows:
% Change toYears Ended ConsolidatedDecember 31, December 31, Operating
2006 2005 Change Income
(Dollars in millions)
North America . . . . . . . . . . . . . . . . . . . . . . . . . . . . . $ 98.5 $ 79.1 $19.4 20.6%Europe . . . . . . . . . . . . . . . . . . . . . . . . . . . . . . . . . . . 50.0 31.5 18.5 19.5China . . . . . . . . . . . . . . . . . . . . . . . . . . . . . . . . . . . . 7.2 3.5 3.7 3.8Corporate . . . . . . . . . . . . . . . . . . . . . . . . . . . . . . . . . (25.2) (19.5) (5.7) (5.9)
Total . . . . . . . . . . . . . . . . . . . . . . . . . . . . . . . . . . . . . $130.5 $ 94.6 $35.9 38.0%
The change in operating income is attributable to the following:
Change ChangeAs a % of Consolidated As a % of Segment
Operating Income Operating Income
North North NorthAmerica Europe China Corp. Total America Europe China Corp. Total America Europe China Corp.
(Dollars in millions)Organic growth . . . . . $ 6.4 $ 7.5 $ 6.8 $(5.7) $15.0 6.9% 7.8% 7.1% (5.9)% 15.9% 8.2% 23.4% 189.4% (28.5)%Foreign exchange . . . . .8 .9 .3 — 2.0 .8 1.0 .3 — 2.1 1.0 3.0 8.3 —Acquisitions . . . . . . . 11.2 2.5 1.7 — 15.4 11.8 2.7 1.8 — 16.3 14.1 8.1 47.9 —Restructuring/other . . . 1.0 7.6 (5.1) — 3.5 1.1 8.0 (5.4) — 3.7 1.3 24.0 (143.1) —
Total . . . . . . . . . . . . $19.4 $18.5 $ 3.7 $(5.7) $35.9 20.6% 19.5% 3.8% (5.9)% 38.0% 24.6% 58.5% 102.5% (28.5)%
The organic growth in North America was primarily due to our increased gross profit from priceincreases and a favorable sales mix towards the wholesale market, benefits resulting from ourcompleted manufacturing restructuring projects and product outsourcing, partially offset by increasednet SG&A expense and inventory write-downs. In 2006, we did not record any costs associated with ourmanufacturing restructuring plan compared to costs of $1.0 million for 2005. The acquired growth wasdue to the inclusion of operating income from Alamo, Savard, Flexflow, Core, Dormont and Calflex.
The organic growth in Europe was primarily due to increased gross profit from price and unitincreases in the wholesale and OEM markets and benefits resulting from our completed manufacturingrestructuring projects, partially offset by increased net SG&A expense. In 2006, we recorded a net gainof $6.0 million associated with our manufacturing restructuring plan compared to a charge of$1.5 million for 2005. We recorded a gain of $8.2 million for the building sales in Italy partially offsetby $2.2 million primarily for severance costs. The acquired growth in Europe was due to the inclusionof the operating income from Electro Controls, Microflex, ATS, Kimsafe and Teknigas.
The increase in organic growth in China was attributable to sales volume increase, favorablematerial purchases and improved manufacturing efficiencies associated with our wholly ownedmanufacturing plants, partially offset by increased net SG&A expense. The acquired growth in Chinawas due to the inclusion of the operating income from Changsha and Ningbo. In 2006, we recorded$5.1 million of severance and accelerated depreciation costs associated with the planned move of ourChinese joint venture facility. We did not record any costs associated with our manufacturingrestructuring plan in 2005.
The decrease in organic operating income in Corporate was primarily attributable to incrementaladministration charges for variable compensation including costs incurred for compliance withFAS 123R, increased audit costs and increased pension costs, partially offset by lower costs incurred forSOX compliance.
The net increase in operating income from foreign exchange was primarily due to the appreciationof the euro, Canadian dollar and yuan against the U.S. dollar.
37
Interest Income. Interest income increased $3.8 million, or 307.0%, for 2006 compared to 2005,primarily due to the investment of the residual proceeds from the private placement of $225.0 million5.85% senior notes in April 2006 and the net proceeds from the public offering of 5.75 million sharesof our Class A Common Stock in November 2006.
Interest Expense. Interest expense increased $11.7 million, or 113.9%, for 2006 compared to 2005,primarily due to interest expense associated with our $225.0 million 5.85% senior notes, increased debtlevels for acquisitions made in 2005 and 2006, and an increase in the average variable rates charged onthe revolving credit facility.
Effective July 1, 2005, we entered into an interest rate swap for a notional amount of A25.0 millionoutstanding on our revolving credit facility. We swapped an adjustable rate of three month EURIBORplus 0.6% for a fixed rate of 3.02%. We recorded a reduction to interest expense of approximately$0.7 million to recognize the fair value of the swap for 2006. The swap was terminated on October 3,2006.
Other (Income) Expense. Other (income) expense increased $0.2 million, or 27.6%, for 2006compared to 2005, primarily due to the gains on settlements of officers’ life insurance policies.
Minority interest. Minority interest increased $2.1 million, or 622.3%, for 2006 compared to 2005,primarily due to the credit recorded for the 40% liability of our joint venture partner’s share in therecording of the $5.1 million manufacturing restructuring costs.
Income Taxes. Our effective tax rate for continuing operations decreased to 33.6% in 2006 from35.9% in 2005. The decrease is primarily due to higher earnings in our European and China segments.The shift in the mix of earnings to these segments causes our rate to decrease as these segments havelower effective tax rates than our worldwide average. The effect of the European earnings mix ispartially offset by a higher effective tax from the gain on the sales of our Italian facilities. We were ableto claim tax credits based on qualified fixed asset purchases in China that helped reduce the worldwiderate.
Income From Continuing Operations. Income from continuing operations for 2006 increased$22.1 million, or 40.1%, to $77.1 million, or $2.29 per common share, from $55.0 million, or $1.67 percommon share, for 2005, in each case, on a diluted basis. Income from continuing operations for 2006and 2005 includes income, net of tax, for our restructuring plan of $1.5 million, or $0.04 per share, andcosts of $1.6 million, or ($0.05) per share, respectively. The gains on the sales of our buildings in Italyresulted in an after-tax gain of $5.1 million, or $0.15 per share. The appreciation of the Canadiandollar, euro and Chinese yuan against the U.S. dollar resulted in a positive impact on income fromcontinuing operations of $1.3 million, or $0.04 per share, for 2006 compared to 2005.
Loss From Discontinued Operations We recorded a charge, net of tax, to discontinued operationsfor 2006 and 2005 of $3.4 million, or ($0.10) per common share, and $0.4 million, or ($0.01) percommon share, respectively, in each case, on a diluted basis. In the third quarter of 2006, we recordeda pre-tax charge of $5.0 million due to a recent federal appellate court decision which affirmed that anarbitration panel could decide which deductible agreements between Watts and Zurich AmericanInsurance Company (Zurich) would control Zurich’s reimbursement claim for defense costs paid in theJames Jones case. Other charges were primarily attributable to legal fees associated with the JamesJones litigation, as described in Part I, Item 1. ‘‘Business-Product Liability, Environmental and OtherLitigation Matters.’’
Liquidity and Capital Resources
We generated $91.7 million of cash from continuing operations in 2007. We experienced increasesin inventory in North America and China. The increases were primarily due to increased raw materialcosts. There was also a decrease in accounts payable, accrued expenses and other liabilities, primarily inEurope and North America. In Europe, accounts payable declined in 2007 due to a decline in
38
inventory. In North America, payments for cash compensation increased in 2007. Also, cash paymentsto cover income tax obligations were greater during 2007. Accounts receivable decreased in all threesegments.
We used $87.4 million of net cash for investing activities in 2007. We invested $37.8 million incapital equipment as part of our ongoing commitment to improve our manufacturing capabilities. Weinvested $27.5 million in investment grade auction rate securities. We used $18.1 million to fund theacquisitions of Topway. We paid $4.5 million for additional acquisition costs related to prior yearsacquisitions. We expect to invest approximately $35.0 in capital equipment in 2008.
Recent distress in the markets has had an adverse impact on market activities including, amongother things, volatility in security prices, diminished liquidity, rating downgrades of certain investmentsand declining valuations of others. We have assessed the implications of these factors on our currentbusiness and determined that there has not been a significant impact to our financial position, resultsof operations or liquidity during 2007.
We used $66.5 million of net cash from financing activities in 2007. This was primarily due topayments of debt, payments for our stock repurchase program and dividend payments, partially offsetby increased borrowings under our line of credit and tax benefits from the exercise of stock awards.
In April 2006, we amended our revolving credit facility with a syndicate of banks to provide formulti-currency unsecured borrowings and stand-by letters of credit of up to $350.0 million and toextend the maturity date through April 2011. The revolving credit facility is being used to support ouracquisition program, working capital requirements and for general corporate purposes.
Outstanding indebtedness under the revolving credit facility bears interest at a rate determined bythe type of loan plus an applicable margin determined by our debt rating, depending on the applicablebase rate and our bond rating. For 2007 the average interest rate under the revolving credit facility foreuro-based borrowings was approximately 4.6%. There were no U.S. dollar borrowings at December 31,2007. The revolving credit facility includes operational and financial covenants customary for facilitiesof this type, including, among others, restrictions on additional indebtedness, liens and investments andmaintenance of certain leverage ratios. As of December 31, 2007, we were in compliance with allcovenants related to the revolving credit facility, had $234.4 million of unused and potentially availablecredit under the revolving credit facility and had $81.8 million of euro-based borrowings outstandingand $33.8 million for stand-by letters of credit outstanding on our revolving credit facility.
We generated $0.1 million of net cash from discontinued operations in 2007. We paidapproximately $0.5 million for defense costs and approximately $0.5 million for other legal costs weincurred in the James Jones Litigation. We also received $1.0 million for indemnity payments.
Working capital (defined as current assets less current liabilities) as of December 31, 2007 was$667.0 million compared to $653.0 million as of December 31, 2006. This increase was primarily due toan increase in inventories and lower accounts payable, partially offset by an increase in accruedexpenses. Cash and cash equivalents decreased to $290.3 million as of December 31, 2007 compared to$343.0 million as of December 31, 2006 primarily due to cash used to repurchase stock, fund capitalexpenditures and investments. The ratio of current assets to current liabilities was 3.3 to 1 as ofDecember 31, 2007 compared to 3.2 to 1 as of December 31, 2006.
We generated $83.0 million of cash from continuing operations for 2006. We experienced anincrease in inventory and accounts receivable in North America, Europe and China. The increase inaccounts receivable of $17.0 million was primarily due to increased sales volume and selling prices. Theincrease in inventory of $37.3 million was primarily due to increased cost of raw materials and plannedincreases in European safety stocks. The increase in inventory and accounts receivable was partiallyoffset by increased accounts payable, accrued expenses and other liabilities of $29.5 million.
We used $119.2 million of net cash for investing activities in 2006. We used $91.1 million to fundthe acquisitions of Changsha, ATS, Calflex and Ningbo, Kimsafe and Teknigas, $1.9 million in
39
additional costs related to 2005 acquisitions and $0.4 million to complete the planned increase of ourownership in Stern. We invested $11.8 million in investment grade auction rate securities and$44.7 million in capital equipment. Capital expenditures consisted of approximately $26.7 million formanufacturing machinery and equipment and approximately $18.0 million for the purchase of land anda building and for infrastructure improvements for a site in Italy. We subsequently entered into asale-leaseback transaction with respect to the building. We received proceeds of $31.9 million, whichprimarily included $16.0 million related to the sale-leaseback in Italy and $13.4 million from the salesof two facilities in northern Italy. We also received proceeds from two buildings held for sale, totalingapproximately $2.5 million during 2006.
We generated $331.3 million of net cash from financing activities for 2006. On November 21, 2006,we completed a public offering of 5.75 million shares of newly issued Class A Common Stock at $40.00per share. Net proceeds were approximately $218.6 million after taking into account underwritingdiscounts and expenses associated with the transaction. Additionally, we generated cash through thecompletion of our $225.0 million private placement of 5.85% notes in April 2006, increased borrowingsunder our line of credit for use in Europe and proceeds from the exercise of stock options, partiallyoffset by payments of debt, dividend payments and debt issue costs.
We generated $0.9 million of net cash by operations from discontinued operations in 2006. We alsoreceived approximately $2.8 million in cash for reimbursement of defense costs related to the JamesJones Litigation. During 2006, we paid approximately $0.6 million for defense costs and approximately$0.5 million for indemnity costs we incurred in the James Jones Litigation.
We generated $53.1 million of cash from continuing operations in 2005. We experienced anincrease in accounts receivable in North America, Europe and China totaling $16.5 million. Thisincrease is primarily due to increased sales volume. Additionally, we experienced an increase ininventories in North America, Europe and China totaling $20.3 million. A portion of the overallincrease in inventory is due to the increased costs of raw materials. The increase in inventory inEurope is primarily due to increased finished goods to support the delivery requirements of OEMcustomers in Europe and an increase in safety stocks during restructuring. North American and Chinainventories increased primarily due to the incremental volume of products being sourced from ourextended China supply chain. The increase in inventory and accounts receivable was partially offset byincreased accounts payable of approximately $14.3 million.
We used $183.2 million of net cash for investing activities in 2005. We used $191.4 million to fundthe acquisitions of Dormont, Core, Flexflow, Savard, Microflex, Alamo, Electro Controls, HF and SeaTech. We also invested $18.6 million in capital equipment. We generated $26.6 million by the sale ofinvestment securities.
We generated $111.7 million of net cash from financing activities in 2005 primarily from increasedborrowings in the U.S. and Europe for acquisitions and proceeds from the exercise of stock options,offset by dividend payments and payments of debt. We paid $3.8 million of debt owed to the formershareholders of Hunter Innovations.
We used $1.1 million of net cash for discontinued operations in 2005. We received approximately$0.5 million in cash as a settlement payment for indemnification costs we incurred in the James Jonescase. An offsetting liability has been recorded at December 31, 2005 because of the possibility that wemight have to reimburse the insurance company if it is ultimately successful with a future appeal. Wealso received approximately $2.1 million in cash for reimbursement of defense costs related to theJames Jones case. During 2005, we paid approximately $2.5 million for defense costs, $0.6 million forlegal costs and approximately $1.0 million for indemnity costs we incurred in the James Jones case.
We had free cash flow of $54.5 million (a non-GAAP financial measure defined as net cashprovided by continuing operations minus capital expenditures plus proceeds from sale of assets) duringthe year ended December 31, 2007 versus free cash flow of $70.2 million in 2006. This decrease in 2007compared to 2006 was primarily due to the proceeds from the sale of property, plant and equipment in
40
2006 partially offset by growth in cash generated by operations. Our net debt to capitalization ratio(defined as short and long-term interest-bearing liabilities less cash and cash equivalents as apercentage of the sum of short and long term interest-bearing liabilities less cash and cash equivalentsplus total stockholders’ equity) increased to 13.5% for 2007 from 11.4% for 2006. The increase resultedfrom an increase in net debt, partially offset by an increase in stockholders’ equity.
We had free cash flow of $70.2 million during the year ended December 31, 2006 versus free cashflow of $35.2 million in 2005. This increase in 2006 compared to 2005 was primarily due to growth incash generated by operations, less net capital expenditures.
We believe free cash flow to be an appropriate supplemental measure of our operatingperformance because it provides investors with a measure of our ability to generate cash, to repay debtand to fund acquisitions. We may not be comparable to other companies that may define free cash flowdifferently. Free cash flow does not represent cash generated from operating activities in accordancewith GAAP. Therefore it should not be considered an alternative to net cash provided by operations asan indication of our performance. Free cash flow should also not be considered an alternative to netcash provided by operations as defined by GAAP.
A reconciliation of net cash provided by continuing operations to free cash flow is provided below:
Years Ended December 31,
2007 2006 2005
(in millions)
Net cash provided by continuing operations . . . . . . . . . . . . $ 91.7 $ 83.0 $ 53.1Less: additions to property, plant, and equipment . . . . . . . (37.8) (44.7) (18.6)Plus: proceeds from the sale of property, plant, and
equipment . . . . . . . . . . . . . . . . . . . . . . . . . . . . . . . . . . .6 31.9 .7
Free cash flow . . . . . . . . . . . . . . . . . . . . . . . . . . . . . . . . . $ 54.5 $ 70.2 $ 35.2
Our net debt to capitalization ratio is also a non-GAAP financial measure used by management.Management believes it to be an appropriate supplemental measure because it helps investorsunderstand our ability to meet our financing needs and as a basis to evaluate our financial structure.Our computation may not be comparable to other companies that may define net debt to capitalizationdifferently.
A reconciliation of long-term debt (including current portion) to net debt and our net debt tocapitalization ratio is provided below:
December 31,
2007 2006
(in millions)
Current portion of long-term debt . . . . . . . . . . . . . . . . . . . . . . . $ 1.3 $ 7.5Plus: long-term debt, net of current portion . . . . . . . . . . . . . . . . 432.2 441.7Less: cash and cash equivalents . . . . . . . . . . . . . . . . . . . . . . . . . (290.3) (343.0)
Net debt . . . . . . . . . . . . . . . . . . . . . . . . . . . . . . . . . . . . . . . . . . $ 143.2 $ 106.2
41
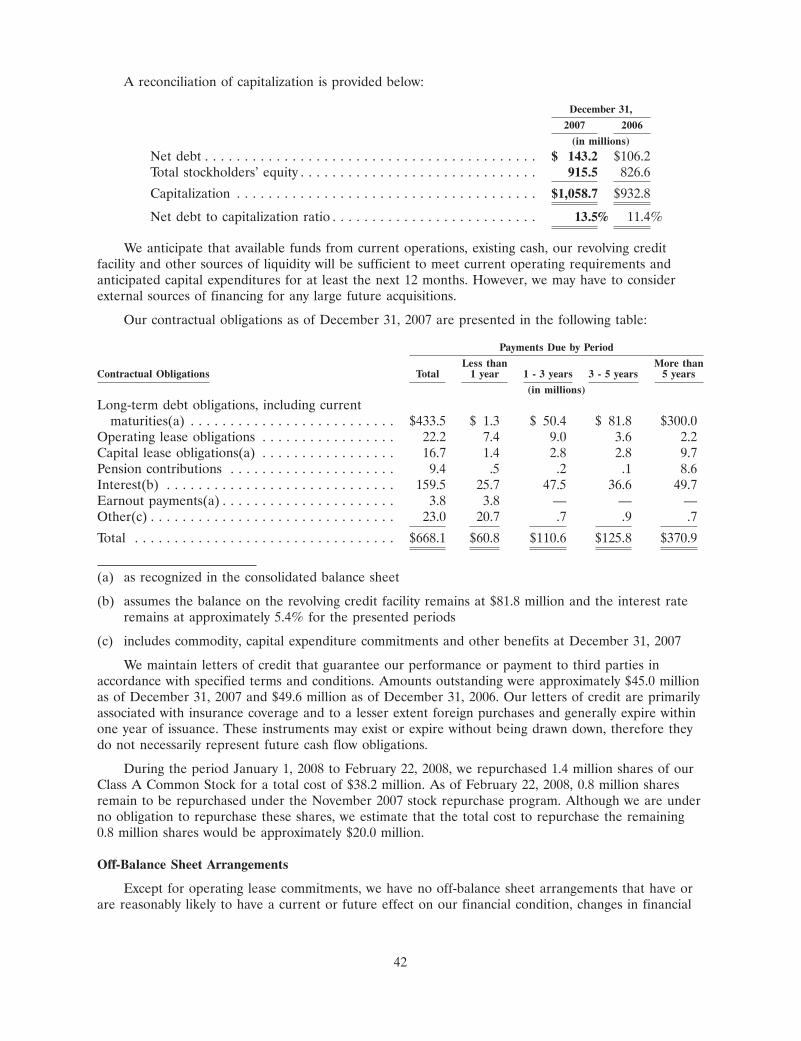
A reconciliation of capitalization is provided below:
December 31,
2007 2006
(in millions)
Net debt . . . . . . . . . . . . . . . . . . . . . . . . . . . . . . . . . . . . . . . . . . $ 143.2 $106.2Total stockholders’ equity . . . . . . . . . . . . . . . . . . . . . . . . . . . . . . 915.5 826.6
Capitalization . . . . . . . . . . . . . . . . . . . . . . . . . . . . . . . . . . . . . . $1,058.7 $932.8
Net debt to capitalization ratio . . . . . . . . . . . . . . . . . . . . . . . . . . 13.5% 11.4%
We anticipate that available funds from current operations, existing cash, our revolving creditfacility and other sources of liquidity will be sufficient to meet current operating requirements andanticipated capital expenditures for at least the next 12 months. However, we may have to considerexternal sources of financing for any large future acquisitions.
Our contractual obligations as of December 31, 2007 are presented in the following table:
Payments Due by Period
Less than More thanContractual Obligations Total 1 year 1 - 3 years 3 - 5 years 5 years
(in millions)
Long-term debt obligations, including currentmaturities(a) . . . . . . . . . . . . . . . . . . . . . . . . . . $433.5 $ 1.3 $ 50.4 $ 81.8 $300.0
Operating lease obligations . . . . . . . . . . . . . . . . . 22.2 7.4 9.0 3.6 2.2Capital lease obligations(a) . . . . . . . . . . . . . . . . . 16.7 1.4 2.8 2.8 9.7Pension contributions . . . . . . . . . . . . . . . . . . . . . 9.4 .5 .2 .1 8.6Interest(b) . . . . . . . . . . . . . . . . . . . . . . . . . . . . . 159.5 25.7 47.5 36.6 49.7Earnout payments(a) . . . . . . . . . . . . . . . . . . . . . . 3.8 3.8 — — —Other(c) . . . . . . . . . . . . . . . . . . . . . . . . . . . . . . . 23.0 20.7 .7 .9 .7
Total . . . . . . . . . . . . . . . . . . . . . . . . . . . . . . . . . $668.1 $60.8 $110.6 $125.8 $370.9
(a) as recognized in the consolidated balance sheet
(b) assumes the balance on the revolving credit facility remains at $81.8 million and the interest rateremains at approximately 5.4% for the presented periods
(c) includes commodity, capital expenditure commitments and other benefits at December 31, 2007
We maintain letters of credit that guarantee our performance or payment to third parties inaccordance with specified terms and conditions. Amounts outstanding were approximately $45.0 millionas of December 31, 2007 and $49.6 million as of December 31, 2006. Our letters of credit are primarilyassociated with insurance coverage and to a lesser extent foreign purchases and generally expire withinone year of issuance. These instruments may exist or expire without being drawn down, therefore theydo not necessarily represent future cash flow obligations.
During the period January 1, 2008 to February 22, 2008, we repurchased 1.4 million shares of ourClass A Common Stock for a total cost of $38.2 million. As of February 22, 2008, 0.8 million sharesremain to be repurchased under the November 2007 stock repurchase program. Although we are underno obligation to repurchase these shares, we estimate that the total cost to repurchase the remaining0.8 million shares would be approximately $20.0 million.
Off-Balance Sheet Arrangements
Except for operating lease commitments, we have no off-balance sheet arrangements that have orare reasonably likely to have a current or future effect on our financial condition, changes in financial
42
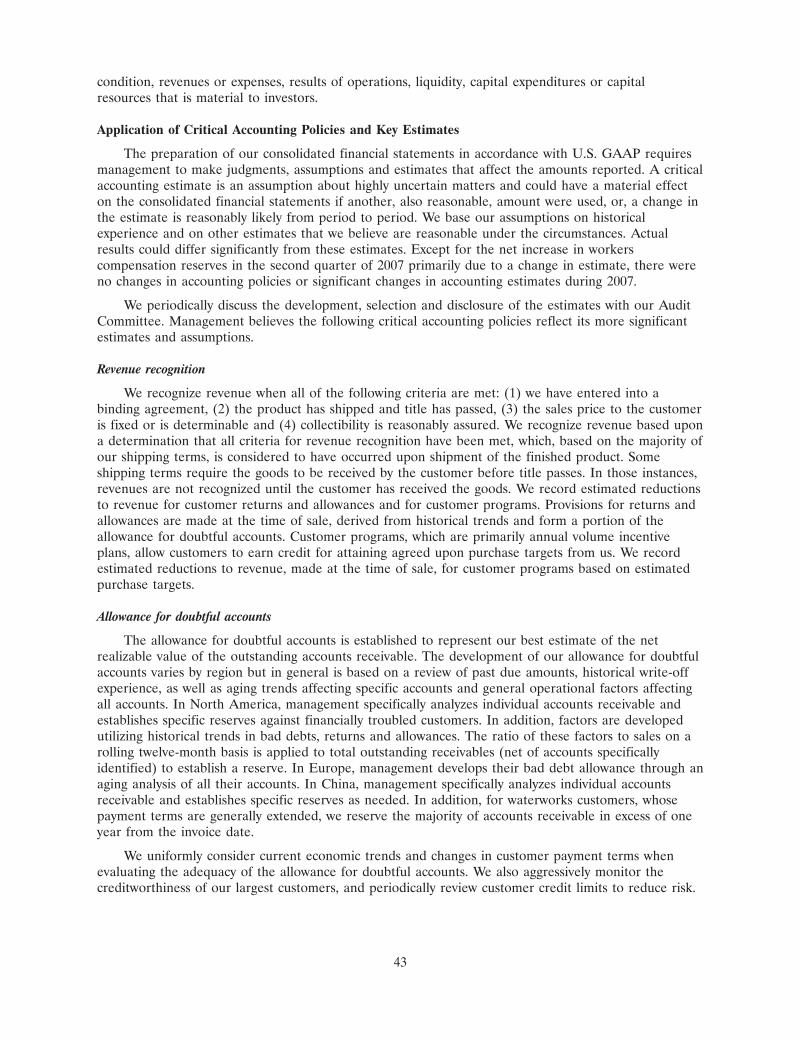
condition, revenues or expenses, results of operations, liquidity, capital expenditures or capitalresources that is material to investors.
Application of Critical Accounting Policies and Key Estimates
The preparation of our consolidated financial statements in accordance with U.S. GAAP requiresmanagement to make judgments, assumptions and estimates that affect the amounts reported. A criticalaccounting estimate is an assumption about highly uncertain matters and could have a material effecton the consolidated financial statements if another, also reasonable, amount were used, or, a change inthe estimate is reasonably likely from period to period. We base our assumptions on historicalexperience and on other estimates that we believe are reasonable under the circumstances. Actualresults could differ significantly from these estimates. Except for the net increase in workerscompensation reserves in the second quarter of 2007 primarily due to a change in estimate, there wereno changes in accounting policies or significant changes in accounting estimates during 2007.
We periodically discuss the development, selection and disclosure of the estimates with our AuditCommittee. Management believes the following critical accounting policies reflect its more significantestimates and assumptions.
Revenue recognition
We recognize revenue when all of the following criteria are met: (1) we have entered into abinding agreement, (2) the product has shipped and title has passed, (3) the sales price to the customeris fixed or is determinable and (4) collectibility is reasonably assured. We recognize revenue based upona determination that all criteria for revenue recognition have been met, which, based on the majority ofour shipping terms, is considered to have occurred upon shipment of the finished product. Someshipping terms require the goods to be received by the customer before title passes. In those instances,revenues are not recognized until the customer has received the goods. We record estimated reductionsto revenue for customer returns and allowances and for customer programs. Provisions for returns andallowances are made at the time of sale, derived from historical trends and form a portion of theallowance for doubtful accounts. Customer programs, which are primarily annual volume incentiveplans, allow customers to earn credit for attaining agreed upon purchase targets from us. We recordestimated reductions to revenue, made at the time of sale, for customer programs based on estimatedpurchase targets.
Allowance for doubtful accounts
The allowance for doubtful accounts is established to represent our best estimate of the netrealizable value of the outstanding accounts receivable. The development of our allowance for doubtfulaccounts varies by region but in general is based on a review of past due amounts, historical write-offexperience, as well as aging trends affecting specific accounts and general operational factors affectingall accounts. In North America, management specifically analyzes individual accounts receivable andestablishes specific reserves against financially troubled customers. In addition, factors are developedutilizing historical trends in bad debts, returns and allowances. The ratio of these factors to sales on arolling twelve-month basis is applied to total outstanding receivables (net of accounts specificallyidentified) to establish a reserve. In Europe, management develops their bad debt allowance through anaging analysis of all their accounts. In China, management specifically analyzes individual accountsreceivable and establishes specific reserves as needed. In addition, for waterworks customers, whosepayment terms are generally extended, we reserve the majority of accounts receivable in excess of oneyear from the invoice date.
We uniformly consider current economic trends and changes in customer payment terms whenevaluating the adequacy of the allowance for doubtful accounts. We also aggressively monitor thecreditworthiness of our largest customers, and periodically review customer credit limits to reduce risk.
43
If circumstances relating to specific customers change or unanticipated changes occur in the generalbusiness environment, our estimates of the recoverability of receivables could be further adjusted.
Inventory valuation
Inventories are stated at the lower of cost or market with costs determined primarily on a first-infirst-out basis. We utilize both specific product identification and historical product demand as the basisfor determining our excess or obsolete inventory reserve. We identify all inventories that exceed a rangeof one to four years in sales. This is determined by comparing the current inventory balance againstunit sales for the trailing twelve months. New products added to inventory within the past twelvemonths are excluded from this analysis. A portion of our products contain recoverable materials,therefore the excess and obsolete reserve is established net of any recoverable amounts. Changes inmarket conditions, lower than expected customer demand or changes in technology or features couldresult in additional obsolete inventory that is not saleable and could require additional inventoryreserve provisions.
In certain countries, additional inventory reserves are maintained for potential shrinkageexperienced in the manufacturing process. The reserve is established based on the prior year’s inventorylosses adjusted for any change in the gross inventory balance.
Goodwill and other intangibles
Goodwill and intangible assets with indefinite lives are tested annually for impairment inaccordance with the provisions of Financial Accounting Standards Board Statement No. 142 ‘‘Goodwilland Other Intangible Assets’’ (FAS 142). We use our judgment in assessing whether assets may havebecome impaired between annual impairment tests. We concluded that no impairment existed atOctober 28, 2007, the time of our latest annual review. We perform our annual test for indicators ofgoodwill and non-amortizable intangible assets impairment in the fourth quarter of our fiscal year orsooner if indicators of impairment exist.
Intangible assets such as purchased technology are generally recorded in connection with abusiness acquisition. Values assigned to intangible assets are determined by an independent valuationfirm based on estimates and judgments regarding expectations of the success and life cycle of productsand technology acquired.
Since the adoption of FAS 142 our valuations have been greater than the carrying value of ourgoodwill and intangibles. While we believe that our estimates of future cash flows are reasonable,different assumptions regarding such factors as future sales volume, selling price changes, material costchanges, cost savings programs and capital expenditures could significantly affect our valuations. Otherchanges that may affect our valuations include, but are not limited to product acceptances andregulatory approval. If actual product acceptance differs significantly from the estimates, we may berequired to record an impairment charge to write down the assets to their realizable value. A severedecline in market value could result in an unexpected impairment charge to goodwill, which could havea material impact on the results of operations and financial position.
Product liability and workers’ compensation costs
Because of retention requirements associated with our insurance policies, we are generallyself-insured for potential product liability claims and for workers’ compensation costs associated withworkplace accidents. For product liability cases in the U.S., management estimates expected settlementcosts by utilizing loss reports provided by our third-party administrators as well as developing internalhistorical trend factors based on our specific claims experience. Management utilizes the internal trendfactors that reflect final expected settlement costs. In other countries, we maintain insurance coveragewith relatively high deductible payments, as product liability claims tend to be smaller than thoseexperienced in the U.S. Changes in the nature of claims or the actual settlement amounts could affect
44
the adequacy of this estimate and require changes to the provisions. Because the liability is an estimate,the ultimate liability may be more or less than reported.
Workers’ compensation liabilities in the U.S. are recognized for claims incurred (including claimsincurred but not reported) and for changes in the status of individual case reserves. At the time aworkers’ compensation claim is filed, a liability is estimated to settle the claim. The liability forworkers’ compensation claims is determined based on management’s estimates of the nature andseverity of the claims and based on analysis provided by third party administrators and by various statestatutes and reserve requirements. We have developed our own trend factors based on our specificclaims experience. In other countries where workers’ compensation costs are applicable, we maintaininsurance coverage with limited deductible payments. Because the liability is an estimate, the ultimateliability may be more or less than reported.
We determine the trend factors for product liability and workers’ compensation liabilities based onconsultation with outside actuaries.
We maintain excess liability insurance with outside insurance carriers to minimize our risks relatedto catastrophic claims in excess of all self-insured positions. Any material change in the aforementionedfactors could have an adverse impact on our operating results.
Legal contingencies
We are a defendant in numerous legal matters including those involving environmental law andproduct liability as discussed further in Part I, Item 1, ‘‘Business—Product Liability, Environmental andOther Litigation Matters.’’ As required by Financial Accounting Standards Board Statement No. 5‘‘Accounting for Contingencies’’ (FAS 5), we determine whether an estimated loss from a losscontingency should be accrued by assessing whether a loss is deemed probable and the loss amount canbe reasonably estimated, net of any applicable insurance proceeds. Estimates of potential outcomes ofthese contingencies are developed in consultation with outside counsel. While this assessment is basedupon all available information, litigation is inherently uncertain and the actual liability to fully resolvethis litigation cannot be predicted with any assurance of accuracy. Final settlement of these matterscould possibly result in significant effects on our results of operations, cash flows and financial position.
Pension benefits
We account for our pension plans in accordance with Financial Accounting Standards BoardStatement No. 87 ‘‘Employers Accounting for Pensions’’ (FAS 87) and Financial Accounting StandardsBoard Statement No. 158, ‘‘Employers’ Accounting for Defined Benefit Pension and OtherPostretirement Plans—an amendment of FASB Statements No. 87, 88, 106, and 132(R),’’ (FAS 158). Inapplying FAS 87 and FAS 158, assumptions are made regarding the valuation of benefit obligations andthe performance of plan assets. The primary assumptions are as follows:
• Weighted average discount rate—this rate is used to estimate the current value of futurebenefits. This rate is adjusted based on movement in long-term interest rates.
• Expected long-term rate of return on assets—this rate is used to estimate future growth ininvestments and investment earnings. The expected return is based upon a combination ofhistorical market performance and anticipated future returns for a portfolio reflecting the mix ofequity, debt and other investments indicative of our plan assets.
• Rates of increase in compensation levels—this rate is used to estimate projected annual payincreases, which are used to determine the wage base used to project employees’ pensionbenefits at retirement.
We determine these assumptions based on consultation with outside actuaries and investmentadvisors. Any variance in these assumptions could have a significant impact on future recognizedpension costs, assets and liabilities.
45
Income taxes
We estimate and use our expected annual effective income tax rates to accrue income taxes.Effective tax rates are determined based on budgeted earnings before taxes, including our best estimateof permanent items that will affect the effective rate for the year. Management periodically reviewsthese rates with outside tax advisors and changes are made if material variances from expectations areidentified.
We recognize deferred taxes for the expected future consequences of events that have beenreflected in the consolidated financial statements in accordance with the rules of Financial AccountingStandards Board Statement No. 109 ‘‘Accounting for Income Taxes’’ (FAS 109). Under FAS 109,deferred tax assets and liabilities are determined based on differences between the book values and taxbases of particular assets and liabilities, using tax rates in effect for the years in which the differencesare expected to reverse. A valuation allowance is provided to offset any net deferred tax assets if, basedupon the available evidence, it is more likely than not that some or all of the deferred tax assets willnot be realized. We consider estimated future taxable income and ongoing prudent tax planningstrategies in assessing the need for a valuation allowance.
On January 1, 2007, we adopted the provisions of Financial Accounting Standards Board (FASB)Interpretation No. 48, ‘‘Accounting for Uncertainty in Income Taxes’’ (FIN 48). The purpose of FIN 48is to increase the comparability in financial reporting of income taxes. FIN 48 requires that in order fora tax benefit to be booked in the income statement, the item in question must meet themore-likely-than-not (greater than 50% likelihood of being sustained upon examination by the taxingauthorities) threshold. The adoption of FIN 48 did not have a material effect on our financialstatements. No cumulative effect was booked through beginning retained earnings.
As of the adoption date, we had gross unrecognized tax benefits of approximately $4.8 million, ofwhich, approximately $4.2 million, if recognized, would affect the effective tax rate. The differencebetween the amount of unrecognized tax benefits and the amount that would affect the effective taxrate consists of the federal tax benefit of state income tax items. During 2007, we reduced ourunrecognized tax benefits by approximately $0.6 million for a tax issue in Italy. As a result of theconclusion of state income tax audits, it is reasonably possible that the total amount of unrecognizedtax benefits will change in the next twelve months. We estimate that it is reasonably possible thatapproximately $0.5 million of the currently remaining unrecognized tax benefit may be recognized bythe end of 2008 as a result of the conclusion of the audits. Notwithstanding, we do not expect anyfurther significant changes in the amounts of unrecognized tax benefits within the next twelve months.
As of December 31, 2007, we had gross unrecognized tax benefits of approximately $3.7 million, ofwhich approximately $3.2 million, if recognized, would affect the effective tax rate. The differencebetween the amount of unrecognized tax benefits and the amount that would impact the effective taxrate consists of the federal tax benefit of state income tax items.
New Accounting Standards
In December 2007, the FASB issued Financial Accounting Standards Board Statement (FAS)No. 141 (R),’’ Business Combinations,’’ (FAS 141R), which requires most identifiable assets, liabilities,non-controlling interests, and goodwill acquired in a business combination to be recorded at ‘‘full fairvalue.’’ Under FAS 141R, all business combinations will be accounted for under the acquisition method.Significant changes, among others, from current guidance resulting from FAS 141R includes therequirement that contingent assets and liabilities and contingent consideration shall be recorded atestimated fair value as of the acquisition date, with any subsequent changes in fair value charged orcredited to earnings. Further, acquisition-related costs will be expensed rather than treated as part ofthe acquisition. FAS 141R is effective for periods beginning on or after December 15, 2008. We expectthe adoption of FAS 141R will increase costs charged to operations.
46
In December 2007, the FASB issued FAS No. 160, ‘‘Non-controlling Interests in ConsolidatedFinancial Statements, an amendment of ARB NO. 151,’’ (FAS 160), which requires non-controllinginterests (previously referred to as minority interest) to be treated as a separate component of equity,not as a liability as is current practice. FAS 160 applies to non-controlling interests and transactionswith non-controlling interest holders in consolidated financial statements. FAS 160 is effective forperiods beginning on or after December 15, 2008. We are currently evaluating the effect that FAS 160will have on our consolidated financial statements.
In February 2007, the FASB issued FAS No. 159, ‘‘The Fair Value Option for Financial Assets andFinancial Liabilities—including an Amendment to FAS No. 115,’’ (FAS 159), which permits entities tochoose to measure many financial instruments and certain other items at fair value. FAS 159 is effectivefor financial statements issued for fiscal years beginning after November 15, 2007 and interim periodswithin those fiscal years. Earlier application is encouraged. We do not expect to measure our financialinstruments at fair value and therefore we do not expect the adoption of FAS 159 to have a materialimpact on our consolidated financial statements.
In September 2006, the Securities and Exchange Commission issued Staff Accounting BulletinNo. 108, ‘‘Considering the Effects of Prior Year Misstatements When Quantifying Misstatements inCurrent Year Financial Statements’’ (SAB 108), which provides interpretive guidance on how theeffects of the carryover or reversal of prior year misstatements should be considered in quantifying acurrent year misstatement. SAB 108 is effective for fiscal years ending after November 15, 2006. Theimpact of SAB 108 was not material to our consolidated financial statements.
In September 2006, the FASB issued FAS No. 158, ‘‘Employers’ Accounting for Defined BenefitPension and Other Postretirement Plans—an amendment of FASB Statements No. 87, 88, 106, and132(R)’’ (FAS 158), which requires an employer to: (a) recognize in its statement of financial positionan asset for a plan’s overfunded status or a liability for a plan’s underfunded status; (b) measure aplan’s assets and its obligations that determine its funded status as of the end of the employer’s fiscalyear; and (c) recognize changes in the funded status of a defined benefit postretirement plan in theyear in which the changes occur. Those changes are reported in other comprehensive income. Therequirement to recognize the funded status of a benefit plan and the disclosure requirements areeffective as of the end of the fiscal year ending after December 15, 2006 for companies with publiclytraded equity securities. The requirement to measure plan assets and benefit obligations as of the dateof the employer’s fiscal year-end statement of financial position is effective for fiscal years ending afterDecember 15, 2008, although earlier adoption is permitted. As a result of the requirement to recognizethe funded status of our benefit plans as of December 31, 2006, we recorded an increase in ourpension liability of approximately $8.3 million, a decrease of approximately $1.3 million in other assets:other, net and a decrease in accumulated other comprehensive income of approximately $5.8 million,net of tax. We have early-adopted the measurement date provisions of FAS 158 effective January 1,2007. Our pension plans previously used a September 30 measurement date. All plans are nowmeasured as of December 31, consistent with our fiscal year end. The non-cash effect of the adoptionof the measurement date provisions of FAS 158 was not material and there was no effect on our resultsof operations.
In September 2006, the FASB issued FAS No. 157, ‘‘Fair Value Measurements’’ (FAS 157), whichdefines fair value, establishes a framework for measuring fair value in generally accepted accountingprinciples and expands disclosures about fair value measurements. For financial assets and liabilities,FAS 157 is effective for financial statements issued for fiscal years beginning after November 15, 2007and interim periods within those fiscal years. For non-financial assets and liabilities, FAS 157 iseffective for financial statements issued for fiscal years beginning after November 15, 2008 and interimperiods within those fiscal years. Earlier application is encouraged provided that the reporting companyhas not yet issued financial statements for that fiscal year, including financial statements for an interimperiod within that fiscal year. We do not expect the adoption of FAS 157 will have a material impact onour consolidated financial statements.
47
In July 2006, the FASB issued Financial Interpretation No. 48, ‘‘Accounting for Uncertainty inIncome Taxes’’ (FIN 48), which clarifies the accounting for uncertainty in income taxes recognized inthe financial statements in accordance with SFAS No. 109, ‘‘Accounting for Income Taxes.’’ FIN 48provides that a tax benefit from an uncertain tax position may be recognized when it is more likelythan not that the position will be sustained upon examination, based on the technical merits. Thisinterpretation also provides guidance on measurement, de-recognition, classification, interest andpenalties, accounting in interim periods, disclosure and transition. We adopted the provisions of FIN 48as of January 1, 2007 and the impact was not material to our consolidated financial statements.
In March 2006, the FASB issued FAS No. 156, ‘‘Accounting for Servicing of Financial Assets—anamendment of FASB Statement No. 140’’ (FAS 156). FAS 156 amends FAS Statement No. 140,‘‘Accounting for Transfers and Servicing of Financial Assets and Extinguishments of Liabilities,’’ withrespect to the accounting for separately recognized servicing assets and servicing liabilities. FAS 156addresses the recognition and measurement of separately recognized servicing assets and liabilities andprovides an approach to simplify efforts to obtain hedge-like (offset) accounting. We adopted FAS 156as of January 1, 2007 and the impact was not material to our consolidated financial statements.
In February 2006, the FASB issued FAS No. 155, ‘‘Accounting for Certain Hybrid FinancialInstruments—an amendment of FASB Statements No. 133 and 140’’ (FAS 155). FAS 155 amendsFAS 133, ‘‘Accounting for Derivatives and Hedging Activities,’’ and FAS 140, ‘‘Accounting for Transfersand Servicing of Financial Assets and Extinguishments of Liabilities,’’ and allows an entity to remeasureat fair value a hybrid financial instrument that contains an embedded derivative that otherwise wouldrequire bifurcation from the host, if the holder irrevocably elects to account for the whole instrumenton a fair value basis. Subsequent changes in the fair value of the instrument would be recognized inearnings. We adopted FAS 155 as of January 1, 2007 and the impact was not material to ourconsolidated financial statements.
In May 2005, the FASB issued FAS No. 154, ‘‘Accounting Changes and Error CorrectionReplacement of APB Opinion No. 20 and FASB Statement No. 3’’ (FAS 154). FAS 154 replaces APBOpinion No. 20, ‘‘Accounting Changes’’ (APB 20), and FASB Statement No. 3, ‘‘Reporting AccountingChanges in Interim Financial Statements,’’ and changes the requirements for the accounting for andreporting of a change in accounting principle. APB 20 previously required that most voluntary changesin accounting principle be recognized by including in net income of the period of the change thecumulative effect of changing to the new accounting principle. FAS 154 requires retrospectiveapplication to prior periods’ financial statements of changes in accounting principle. FAS 154 definesretrospective application as the application of a different accounting principle to prior accountingperiods as if that principle had always been used. FAS 154 also requires that a change in depreciation,amortization, or depletion method for long-lived, non-financial assets be accounted for as a change inaccounting estimate affected by a change in accounting principle. The impact of FAS 154 was notmaterial to our consolidated financial statements.
In December 2004, the FASB issued FAS No. 153, ‘‘Exchanges of Nonmonetary Assets, anamendment of APB Opinion No. 29, Accounting for Nonmonetary Transactions’’ (FAS 153). Theamendments made by FAS 153 are based on the principle that exchanges of nonmonetary assets shouldbe measured based on the fair value of the assets exchanged. Further, the amendments eliminate thenarrow exception for nonmonetary exchanges of similar productive assets and replace it with a broaderexception for exchanges of nonmonetary assets that do not have commercial substance. Previously,Opinion No. 29 required that the accounting for an exchange of a productive asset for a similarproductive asset or an equivalent interest in the same or similar productive asset should be based onthe recorded amount of the asset relinquished. The statement is effective for nonmonetary assetexchanges occurring in fiscal periods beginning after June 15, 2005. Earlier application is permitted fornonmonetary asset exchanges occurring in fiscal periods beginning after the date of issuance. Theimpact of FAS 153 was not material to our consolidated financial statements.
48
In November 2004, the FASB issued FAS No. 151, ‘‘Inventory Costs’’ (FAS 151). FAS 151 amendsthe guidance in Accounting Research Bulletin No. 43, Chapter 4, ‘‘Inventory Pricing,’’ to clarify theaccounting for inventory costs. The provisions of this statement are effective for fiscal years beginningafter June 15, 2005. The impact of FAS 151 was not material to our consolidated financial statements.
Item 7A. QUANTITATIVE AND QUALITATIVE DISCLOSURES ABOUT MARKET RISK.
We use derivative financial instruments primarily to reduce exposure to adverse fluctuations inforeign exchange rates, interest rates and costs of certain raw materials used in the manufacturingprocess. We do not enter into derivative financial instruments for trading purposes. As a matter ofpolicy, all derivative positions are used to reduce risk by hedging underlying economic exposure. Thederivatives we use are instruments with liquid markets.
Our consolidated earnings, which are reported in United States dollars, are subject to translationrisks due to changes in foreign currency exchange rates. This risk is concentrated in the exchange ratebetween the U.S. dollar and the euro; the U.S. dollar and the Canadian dollar; and the U.S. dollar andthe Chinese yuan.
Our foreign subsidiaries transact most business, including certain intercompany transactions, inforeign currencies. Such transactions are principally purchases or sales of materials and aredenominated in European currencies or the U.S. or Canadian dollar. We use foreign currency forwardexchange contracts to manage the risk related to intercompany purchases that occur during the courseof a year and certain open foreign currency denominated commitments to sell products to third parties.For 2007, the amounts recorded in other income for the change in the fair value of such contracts wasimmaterial.
We have historically had a low exposure on the cost of our debt to changes in interest rates.Information about our long-term debt including principal amounts and related interest rates appears innote 11 of notes to consolidated financial statements in our Annual Report on Form 10-K for the yearended December 31, 2007.
We purchase significant amounts of bronze ingot, brass rod, cast iron, steel and plastic, which areutilized in manufacturing our many product lines. Our operating results can be adversely affected bychanges in commodity prices if we are unable to pass on related price increases to our customers. Wemanage this risk by monitoring related market prices, working with our suppliers to achieve themaximum level of stability in their costs and related pricing, seeking alternative supply sources whennecessary and passing increases in commodity costs to our customers, to the maximum extent possible,when they occur.
Item 8. FINANCIAL STATEMENTS AND SUPPLEMENTARY DATA.
The financial statements listed in section (a) (1) of ‘‘Part IV, Item 15. Exhibits and FinancialStatement Schedules’’ of this annual report are incorporated herein by reference.
Item 9. CHANGES IN AND DISAGREEMENTS WITH ACCOUNTANTS ON ACCOUNTING ANDFINANCIAL DISCLOSURE.
None.
Item 9A. CONTROLS AND PROCEDURES.
As required by Rule 13a-15(b) under the Securities Exchange Act of 1934, as of the end of theperiod covered by this report, we carried out an evaluation under the supervision and with theparticipation of our management, including our Chief Executive Officer and Chief Financial Officer, ofthe effectiveness of our disclosure controls and procedures. In designing and evaluating our disclosurecontrols and procedures, we recognize that any controls and procedures, no matter how well designedand operated, can provide only reasonable assurance of achieving the desired control objectives, and
49
our management necessarily applies its judgment in evaluating and implementing possible controls andprocedures. The effectiveness of our disclosure controls and procedures is also necessarily limited bythe staff and other resources available to us and the geographic diversity of our operations. Based uponthat evaluation, the Chief Executive Officer and Chief Financial Officer concluded that, as of the endof the period covered by this report, our disclosure controls and procedures were effective, in that theyprovide reasonable assurance that information required to be disclosed by us in the reports we file orsubmit under the Exchange Act is recorded, processed, summarized and reported within the timeperiods specified in the Securities and Exchange Commission’s rules and forms and are designed toensure that information required to be disclosed by us in the reports that we file or submit under theExchange Act are accumulated and communicated to our management, including our Chief ExecutiveOfficer and Chief Financial Officer, as appropriate to allow timely decisions regarding requireddisclosure. There was no change in our internal control over financial reporting that occurred duringthe quarter ended December 31, 2007, that has materially affected, or is reasonably likely to materiallyaffect, our internal control over financial reporting. In connection with these rules, we will continue toreview and document our disclosure controls and procedures, including our internal control overfinancial reporting, and may from time to time make changes aimed at enhancing their effectivenessand to ensure that our systems evolve with our business.
50
Management’s Annual Report on Internal Control Over Financial Reporting
Management of the Company is responsible for establishing and maintaining adequate internalcontrol over financial reporting as defined in Rules 13a-15(f) and 15d-15(f) under the SecuritiesExchange Act of 1934. The Company’s internal control over financial reporting is designed to providereasonable assurance regarding the reliability of financial reporting and the preparation of financialstatements for external purposes in accordance with generally accepted accounting principles. TheCompany’s internal control over financial reporting includes those policies and procedures that:
(i) pertain to the maintenance of records that, in reasonable detail, accurately and fairly reflectthe transactions and dispositions of the assets of the Company;
(ii) provide reasonable assurance that transactions are recorded as necessary to permitpreparation of financial statements in accordance with generally accepted accountingprinciples, and that receipts and expenditures of the Company are being made only inaccordance with authorizations of management and directors of the Company; and
(iii) provide reasonable assurance regarding prevention or timely detection of unauthorizedacquisition, use or disposition of the Company’s assets that could have a material effect on thefinancial statements.
Because of its inherent limitations, internal control over financial reporting may not prevent ordetect misstatements. Also, projections of any evaluation of effectiveness to future periods are subjectto the risk that controls may become inadequate because of changes in conditions, or that the degreeof compliance with the policies or procedures may deteriorate.
Management, including our Chief Executive Officer and Chief Financial Officer, assessed theeffectiveness of the Company’s internal control over financial reporting as of December 31, 2007. Inmaking this assessment, management used the criteria set forth by the Committee of SponsoringOrganizations of the Treadway Commission (COSO) in Internal Control—Integrated Framework.
Based on our assessment and those criteria, management believes that the Company maintainedeffective internal control over financial reporting as of December 31, 2007.
The audited consolidated financial statements of the Company include the results of TopwayGlobal Inc., which the Company acquired on November 9, 2007, but management’s assessment doesnot include an assessment of the internal control over financial reporting of this entity.
The independent registered public accounting firm that audited the Company’s consolidatedfinancial statements included elsewhere in this Annual Report on Form 10-K has issued an attestationreport on the Company’s internal control over financial reporting. That report appears immediatelyfollowing this report.
51
Report of Independent Registered Public Accounting Firm
The Board of Directors and StockholdersWatts Water Technologies, Inc.:
We have audited Watts Water Technologies, Inc.’s internal control over financial reporting as ofDecember 31, 2007, based on criteria established in Internal Control—Integrated Framework issued bythe Committee of Sponsoring Organizations of the Treadway Commission (COSO). Watts WaterTechnologies, Inc.’s management is responsible for maintaining effective internal control over financialreporting, included in the accompanying Management’s Annual Report on Internal Control Over FinancialReporting. Our responsibility is to express an opinion on the Company’s internal control over financialreporting based on our audit.
We conducted our audit in accordance with the standards of the Public Company AccountingOversight Board (United States). Those standards require that we plan and perform the audit to obtainreasonable assurance about whether effective internal control over financial reporting was maintainedin all material respects. Our audit included obtaining an understanding of internal control overfinancial reporting, assessing the risk that a material weakness exists, and testing and evaluating thedesign and operating effectiveness of internal control based on the assessed risk. Our audit alsoincluded performing such other procedures as we considered necessary in the circumstances. We believethat our audit provides a reasonable basis for our opinion.
A company’s internal control over financial reporting is a process designed to provide reasonableassurance regarding the reliability of financial reporting and the preparation of financial statements forexternal purposes in accordance with generally accepted accounting principles. A company’s internalcontrol over financial reporting includes those policies and procedures that (1) pertain to themaintenance of records that, in reasonable detail, accurately and fairly reflect the transactions anddispositions of the assets of the company; (2) provide reasonable assurance that transactions arerecorded as necessary to permit preparation of financial statements in accordance with generallyaccepted accounting principles, and that receipts and expenditures of the company are being made onlyin accordance with authorizations of management and directors of the company; and (3) providereasonable assurance regarding prevention or timely detection of unauthorized acquisition, use, ordisposition of the company’s assets that could have a material effect on the financial statements.
Because of its inherent limitations, internal control over financial reporting may not prevent ordetect misstatements. Also, projections of any evaluation of effectiveness to future periods are subjectto the risk that controls may become inadequate because of changes in conditions, or that the degreeof compliance with the policies or procedures may deteriorate.
In our opinion, Watts Water Technologies, Inc. maintained, in all material respects, effectiveinternal control over financial reporting as of December 31, 2007, based criteria established in InternalControl—Integrated Framework issued by the Committee of Sponsoring Organizations of the TreadwayCommission (COSO).
Watts Water Technologies, Inc. acquired Topway Global Inc. during 2007 (the 2007 acquisition).Management excluded from its assessment of internal control over financial reporting, the 2007acquisition representing consolidated total assets of $19 million and consolidated revenues of $2 millionincluded in the consolidated financial statements of Watts Water Technologies, Inc. as of and for theyear ended December 31, 2007. Our audit of internal control over financial reporting of Watts WaterTechnologies, Inc. also excluded an evaluation of the internal control over financial reporting of the2007 acquisition.
We also have audited, in accordance with the standards of the Public Company AccountingOversight Board (United States), the consolidated balance sheets of Watts Water Technologies, Inc. asof December 31, 2007 and 2006, and the related consolidated statements of operations, stockholders’equity, and cash flows for each of the years in the three-year period ended December 31, 2007, and the
52
related financial statement schedule, and our report dated February 29, 2008 expressed an unqualifiedopinion on those consolidated financial statements and financial statement schedule.
Boston, MassachusettsFebruary 29, 2008
Item 9B. OTHER INFORMATION.
None.
53
PART III
Item 10. DIRECTORS, EXECUTIVE OFFICERS AND CORPORATE GOVERNANCE.
Information with respect to the executive officers of the Company is set forth in Part I, Item 1 ofthis Report under the caption ‘‘Executive Officers and Directors’’ and is incorporated herein byreference. The information provided under the captions ‘‘Information as to Nominees for Director,’’‘‘Corporate Governance,’’ and ‘‘Section 16(a) Beneficial Ownership Reporting Compliance’’ in ourdefinitive Proxy Statement for our 2008 Annual Meeting of Stockholders to be held on May 14, 2008 isincorporated herein by reference.
We have adopted a Code of Business Conduct and Ethics applicable to all officers, employees andBoard members. The Code of Business Conduct and Ethics is posted in the Investor Relations sectionof our website, www.wattswater.com. We will provide you with a print copy of our Code of BusinessConduct and Ethics free of charge on written request to Lester J. Taufen, Secretary, Watts WaterTechnologies, Inc., 815 Chestnut Street, North Andover, MA 01845. Any amendments to, or waivers of,the Code of Business Conduct and Ethics which apply to our chief executive officer, chief financialofficer, corporate controller or any person performing similar functions will be disclosed on our websitepromptly following the date of such amendment or waiver.
Item 11. EXECUTIVE COMPENSATION.
The information provided under the captions ‘‘Director Compensation,’’ ‘‘Corporate Governance,’’‘‘Compensation Discussion and Analysis,’’ ‘‘Executive Compensation,’’ ‘‘Compensation CommitteeInterlocks and Insider Participation,’’ and ‘‘Compensation Committee Report’’ in our definitive ProxyStatement for our 2008 Annual Meeting of Stockholders to be held on May 14, 2008 is incorporatedherein by reference.
The ‘‘Compensation Committee Report’’ contained in our Proxy Statement shall not be deemed‘‘soliciting material’’ or ‘‘filed’’ with the Securities and Exchange Commission or otherwise subject tothe liabilities of Section 18 of the Securities Exchange Act of 1934, nor shall it be deemed incorporatedby reference in any filings under the Securities Act of 1933 or the Exchange Act, except to the extentwe specifically request that such information be treated as soliciting material or specifically incorporatesuch information by reference into a document filed under the Securities Act or Exchange Act.
Item 12. SECURITY OWNERSHIP OF CERTAIN BENEFICIAL OWNERS AND MANAGEMENT ANDRELATED STOCKHOLDER MATTERS.
The information appearing under the caption ‘‘Principal Stockholders’’ in the Registrant’s ProxyStatement relating to the Annual Meeting of Stockholders to be held on May 14, 2008 is incorporatedherein by reference.
Securities Authorized for Issuance Under Equity Compensation Plans
The following table provides information as of December 31, 2007, about the shares of Class ACommon Stock that may be issued upon the exercise of stock options issued under the Company’s 2004Stock Incentive Plan, 1991 Directors’ Non-Qualified Stock Option Plan, 1996 Stock Option Plan and2003 Non-Employee Directors’ Stock Option Plan and the settlement of restricted stock units granted
54
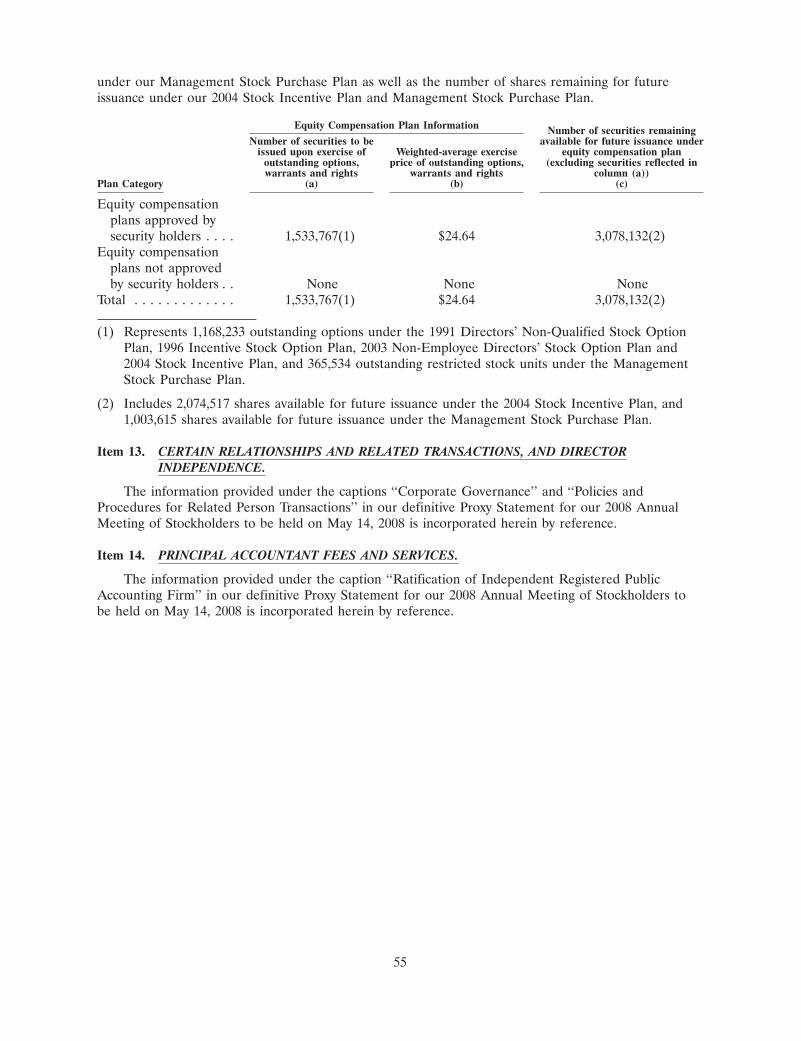
under our Management Stock Purchase Plan as well as the number of shares remaining for futureissuance under our 2004 Stock Incentive Plan and Management Stock Purchase Plan.
Equity Compensation Plan Information Number of securities remainingNumber of securities to be available for future issuance under
issued upon exercise of Weighted-average exercise equity compensation planoutstanding options, price of outstanding options, (excluding securities reflected inwarrants and rights warrants and rights column (a))
Plan Category (a) (b) (c)
Equity compensationplans approved bysecurity holders . . . . 1,533,767(1) $24.64 3,078,132(2)
Equity compensationplans not approvedby security holders . . None None None
Total . . . . . . . . . . . . . 1,533,767(1) $24.64 3,078,132(2)
(1) Represents 1,168,233 outstanding options under the 1991 Directors’ Non-Qualified Stock OptionPlan, 1996 Incentive Stock Option Plan, 2003 Non-Employee Directors’ Stock Option Plan and2004 Stock Incentive Plan, and 365,534 outstanding restricted stock units under the ManagementStock Purchase Plan.
(2) Includes 2,074,517 shares available for future issuance under the 2004 Stock Incentive Plan, and1,003,615 shares available for future issuance under the Management Stock Purchase Plan.
Item 13. CERTAIN RELATIONSHIPS AND RELATED TRANSACTIONS, AND DIRECTORINDEPENDENCE.
The information provided under the captions ‘‘Corporate Governance’’ and ‘‘Policies andProcedures for Related Person Transactions’’ in our definitive Proxy Statement for our 2008 AnnualMeeting of Stockholders to be held on May 14, 2008 is incorporated herein by reference.
Item 14. PRINCIPAL ACCOUNTANT FEES AND SERVICES.
The information provided under the caption ‘‘Ratification of Independent Registered PublicAccounting Firm’’ in our definitive Proxy Statement for our 2008 Annual Meeting of Stockholders tobe held on May 14, 2008 is incorporated herein by reference.
55
PART IV
Item 15. EXHIBITS AND FINANCIAL STATEMENT SCHEDULES.
(a)(1) Financial Statements
The following financial statements are included in a separate section of this Report commencingon the page numbers specified below:
Report of Independent Registered Public Accounting Firm . . . . . . . . . . . . 59Consolidated Statements of Operations for the years ended December 31,
2007, 2006 and 2005 . . . . . . . . . . . . . . . . . . . . . . . . . . . . . . . . . . . . . . 60Consolidated Balance Sheets as of December 31, 2007 and 2006 . . . . . . . . 61Consolidated Statements of Stockholders’ Equity for the years ended
December 31, 2007, 2006 and 2005 . . . . . . . . . . . . . . . . . . . . . . . . . . . 62Consolidated Statements of Cash Flows for the years ended December 31,
2007, 2006 and 2005 . . . . . . . . . . . . . . . . . . . . . . . . . . . . . . . . . . . . . . 63Notes to Consolidated Financial Statements . . . . . . . . . . . . . . . . . . . . . . . 64 - 101
(a)(2) Schedules
Schedule II—Valuation and Qualifying Accounts for the years endedDecember 31, 2007, 2006 and 2005 . . . . . . . . . . . . . . . . . . . . . . . . . . . . 102
All other required schedules for which provision is made in the applicable accounting regulationsof the Securities and Exchange Commission are included in the Notes to the Consolidated FinancialStatements.
(a)(3) Exhibits
The exhibits listed in the Exhibit Index immediately preceding the exhibits are filed as part of thisAnnual Report on Form 10-K.
56
SIGNATURES
Pursuant to the requirements of Section 13 or 15(d) of the Securities Exchange Act of 1934, theregistrant has duly caused this report to be signed on its behalf by the undersigned, thereunto dulyauthorized.
WATTS WATER TECHNOLOGIES, INC.
By: /S/ PATRICK S. O’KEEFE
Patrick S. O’KeefeChief Executive OfficerPresident and Director
DATED: February 29, 2008
Pursuant to the requirements of the Securities Exchange Act of 1934, this report has been signedbelow by the following persons on behalf of the registrant and in the capacities and on the datesindicated.
Signature Title Date
/S/ PATRICK S. O’KEEFE Chief Executive Officer, February 29, 2008President and DirectorPatrick S. O’Keefe
Chief Financial Officer and Treasurer/S/ WILLIAM C. MCCARTNEY(Principal Financial and Accounting February 29, 2008
William C. McCartney Officer)
/S/ TIMOTHY P. HORNEDirector February 29, 2008
Timothy P. Horne
/S/ ROBERT L. AYERSDirector February 29, 2008
Robert L. Ayers
/S/ RICHARD J. CATHCARTDirector February 29, 2008
Richard J. Cathcart.
/S/ RALPH E. JACKSON, JR.Director February 29, 2008
Ralph E. Jackson, Jr.
/S/ KENNETH J. MCAVOYDirector February 29, 2008
Kenneth J. McAvoy
57
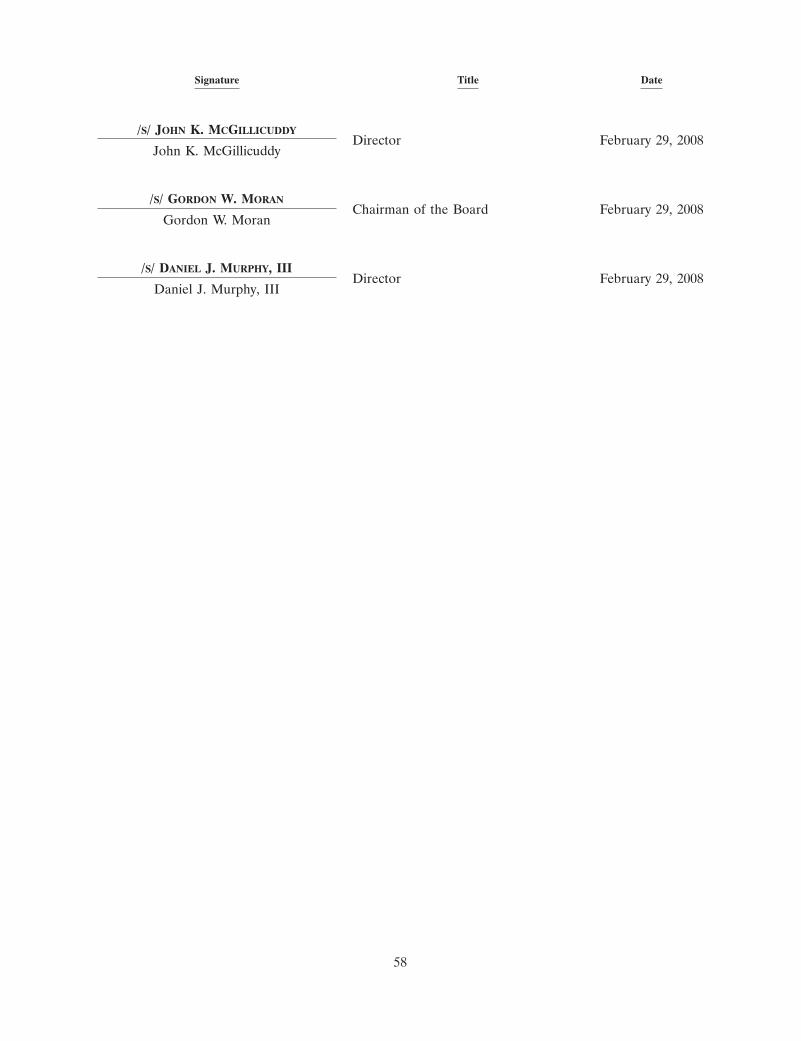
Signature Title Date
/S/ JOHN K. MCGILLICUDDYDirector February 29, 2008
John K. McGillicuddy
/S/ GORDON W. MORANChairman of the Board February 29, 2008
Gordon W. Moran
/S/ DANIEL J. MURPHY, IIIDirector February 29, 2008
Daniel J. Murphy, III
58
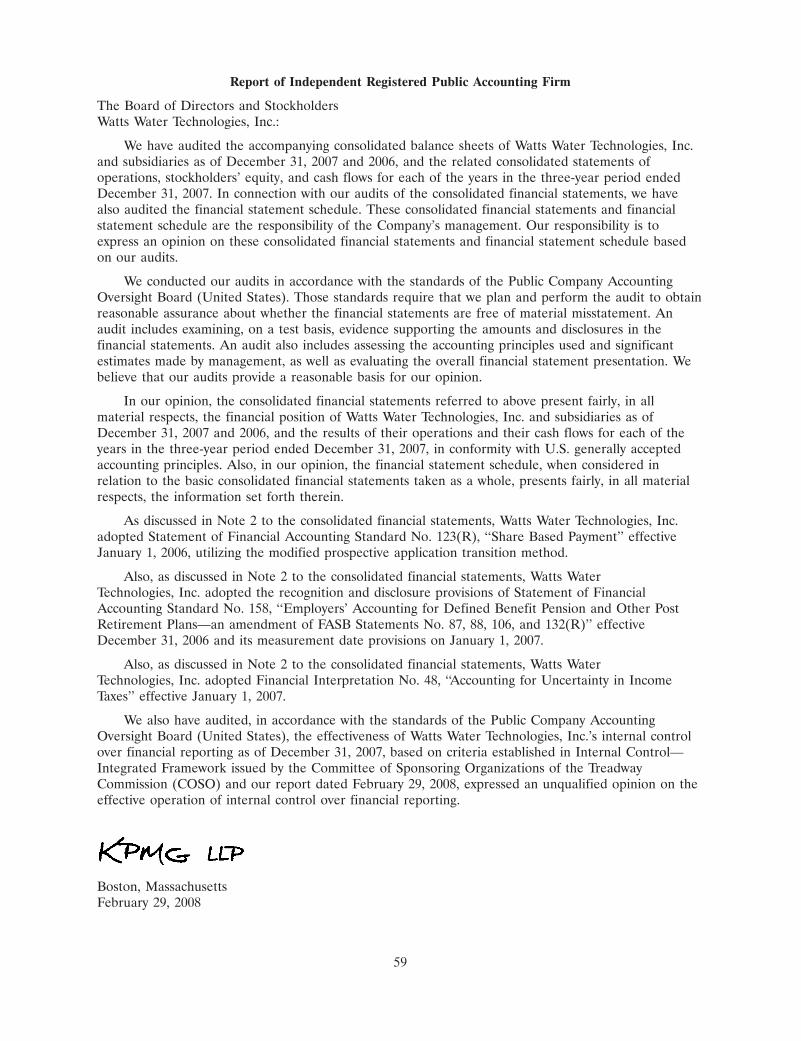
Report of Independent Registered Public Accounting Firm
The Board of Directors and StockholdersWatts Water Technologies, Inc.:
We have audited the accompanying consolidated balance sheets of Watts Water Technologies, Inc.and subsidiaries as of December 31, 2007 and 2006, and the related consolidated statements ofoperations, stockholders’ equity, and cash flows for each of the years in the three-year period endedDecember 31, 2007. In connection with our audits of the consolidated financial statements, we havealso audited the financial statement schedule. These consolidated financial statements and financialstatement schedule are the responsibility of the Company’s management. Our responsibility is toexpress an opinion on these consolidated financial statements and financial statement schedule basedon our audits.
We conducted our audits in accordance with the standards of the Public Company AccountingOversight Board (United States). Those standards require that we plan and perform the audit to obtainreasonable assurance about whether the financial statements are free of material misstatement. Anaudit includes examining, on a test basis, evidence supporting the amounts and disclosures in thefinancial statements. An audit also includes assessing the accounting principles used and significantestimates made by management, as well as evaluating the overall financial statement presentation. Webelieve that our audits provide a reasonable basis for our opinion.
In our opinion, the consolidated financial statements referred to above present fairly, in allmaterial respects, the financial position of Watts Water Technologies, Inc. and subsidiaries as ofDecember 31, 2007 and 2006, and the results of their operations and their cash flows for each of theyears in the three-year period ended December 31, 2007, in conformity with U.S. generally acceptedaccounting principles. Also, in our opinion, the financial statement schedule, when considered inrelation to the basic consolidated financial statements taken as a whole, presents fairly, in all materialrespects, the information set forth therein.
As discussed in Note 2 to the consolidated financial statements, Watts Water Technologies, Inc.adopted Statement of Financial Accounting Standard No. 123(R), ‘‘Share Based Payment’’ effectiveJanuary 1, 2006, utilizing the modified prospective application transition method.
Also, as discussed in Note 2 to the consolidated financial statements, Watts WaterTechnologies, Inc. adopted the recognition and disclosure provisions of Statement of FinancialAccounting Standard No. 158, ‘‘Employers’ Accounting for Defined Benefit Pension and Other PostRetirement Plans—an amendment of FASB Statements No. 87, 88, 106, and 132(R)’’ effectiveDecember 31, 2006 and its measurement date provisions on January 1, 2007.
Also, as discussed in Note 2 to the consolidated financial statements, Watts WaterTechnologies, Inc. adopted Financial Interpretation No. 48, ‘‘Accounting for Uncertainty in IncomeTaxes’’ effective January 1, 2007.
We also have audited, in accordance with the standards of the Public Company AccountingOversight Board (United States), the effectiveness of Watts Water Technologies, Inc.’s internal controlover financial reporting as of December 31, 2007, based on criteria established in Internal Control—Integrated Framework issued by the Committee of Sponsoring Organizations of the TreadwayCommission (COSO) and our report dated February 29, 2008, expressed an unqualified opinion on theeffective operation of internal control over financial reporting.
Boston, MassachusettsFebruary 29, 2008
59
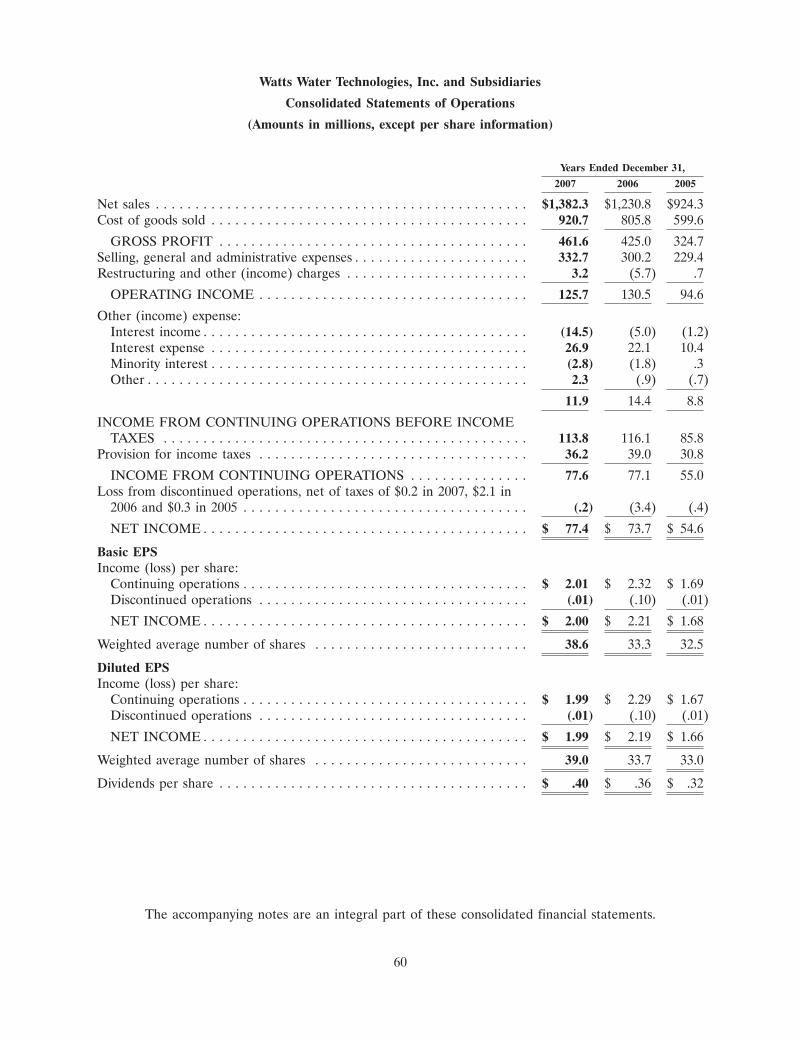
Watts Water Technologies, Inc. and Subsidiaries
Consolidated Statements of Operations
(Amounts in millions, except per share information)
Years Ended December 31,
2007 2006 2005
Net sales . . . . . . . . . . . . . . . . . . . . . . . . . . . . . . . . . . . . . . . . . . . . . . . $1,382.3 $1,230.8 $924.3Cost of goods sold . . . . . . . . . . . . . . . . . . . . . . . . . . . . . . . . . . . . . . . . 920.7 805.8 599.6
GROSS PROFIT . . . . . . . . . . . . . . . . . . . . . . . . . . . . . . . . . . . . . . . 461.6 425.0 324.7Selling, general and administrative expenses . . . . . . . . . . . . . . . . . . . . . . 332.7 300.2 229.4Restructuring and other (income) charges . . . . . . . . . . . . . . . . . . . . . . . 3.2 (5.7) .7
OPERATING INCOME . . . . . . . . . . . . . . . . . . . . . . . . . . . . . . . . . . 125.7 130.5 94.6
Other (income) expense:Interest income . . . . . . . . . . . . . . . . . . . . . . . . . . . . . . . . . . . . . . . . . (14.5) (5.0) (1.2)Interest expense . . . . . . . . . . . . . . . . . . . . . . . . . . . . . . . . . . . . . . . . 26.9 22.1 10.4Minority interest . . . . . . . . . . . . . . . . . . . . . . . . . . . . . . . . . . . . . . . . (2.8) (1.8) .3Other . . . . . . . . . . . . . . . . . . . . . . . . . . . . . . . . . . . . . . . . . . . . . . . . 2.3 (.9) (.7)
11.9 14.4 8.8
INCOME FROM CONTINUING OPERATIONS BEFORE INCOMETAXES . . . . . . . . . . . . . . . . . . . . . . . . . . . . . . . . . . . . . . . . . . . . . . 113.8 116.1 85.8
Provision for income taxes . . . . . . . . . . . . . . . . . . . . . . . . . . . . . . . . . . 36.2 39.0 30.8
INCOME FROM CONTINUING OPERATIONS . . . . . . . . . . . . . . . 77.6 77.1 55.0Loss from discontinued operations, net of taxes of $0.2 in 2007, $2.1 in
2006 and $0.3 in 2005 . . . . . . . . . . . . . . . . . . . . . . . . . . . . . . . . . . . . (.2) (3.4) (.4)
NET INCOME . . . . . . . . . . . . . . . . . . . . . . . . . . . . . . . . . . . . . . . . . $ 77.4 $ 73.7 $ 54.6
Basic EPSIncome (loss) per share:
Continuing operations . . . . . . . . . . . . . . . . . . . . . . . . . . . . . . . . . . . . $ 2.01 $ 2.32 $ 1.69Discontinued operations . . . . . . . . . . . . . . . . . . . . . . . . . . . . . . . . . . (.01) (.10) (.01)
NET INCOME . . . . . . . . . . . . . . . . . . . . . . . . . . . . . . . . . . . . . . . . . $ 2.00 $ 2.21 $ 1.68
Weighted average number of shares . . . . . . . . . . . . . . . . . . . . . . . . . . . 38.6 33.3 32.5
Diluted EPSIncome (loss) per share:
Continuing operations . . . . . . . . . . . . . . . . . . . . . . . . . . . . . . . . . . . . $ 1.99 $ 2.29 $ 1.67Discontinued operations . . . . . . . . . . . . . . . . . . . . . . . . . . . . . . . . . . (.01) (.10) (.01)
NET INCOME . . . . . . . . . . . . . . . . . . . . . . . . . . . . . . . . . . . . . . . . . $ 1.99 $ 2.19 $ 1.66
Weighted average number of shares . . . . . . . . . . . . . . . . . . . . . . . . . . . 39.0 33.7 33.0
Dividends per share . . . . . . . . . . . . . . . . . . . . . . . . . . . . . . . . . . . . . . . $ .40 $ .36 $ .32
The accompanying notes are an integral part of these consolidated financial statements.
60
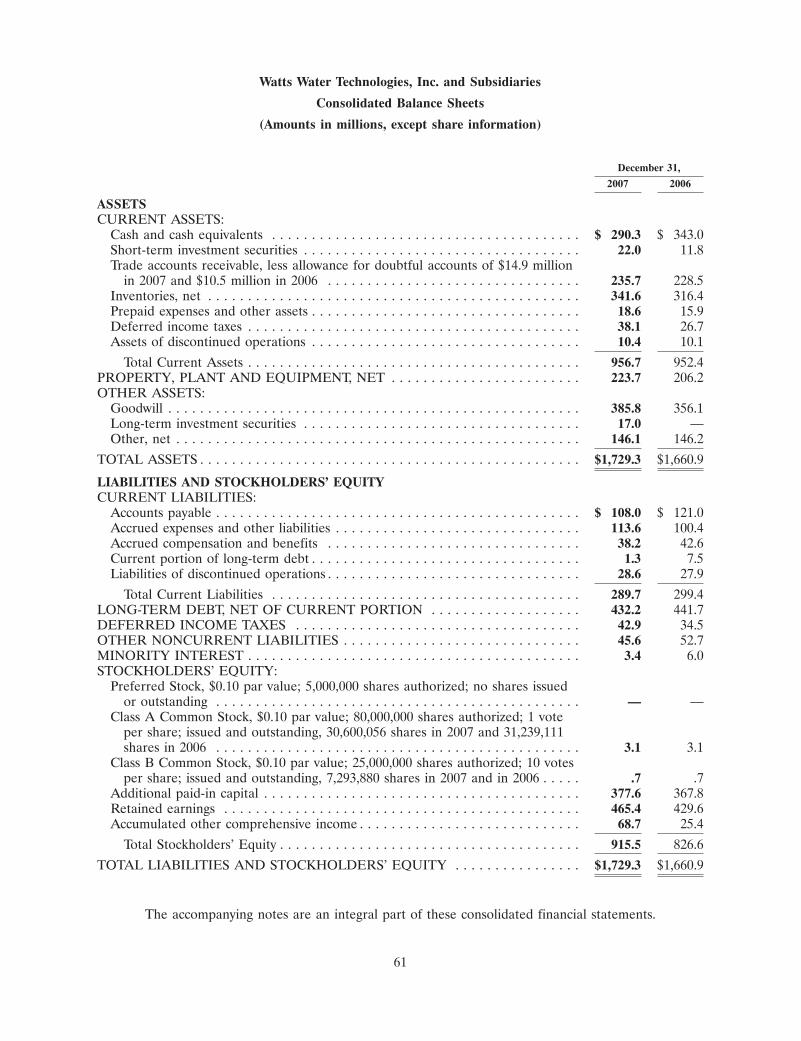
Watts Water Technologies, Inc. and Subsidiaries
Consolidated Balance Sheets
(Amounts in millions, except share information)
December 31,
2007 2006
ASSETSCURRENT ASSETS:
Cash and cash equivalents . . . . . . . . . . . . . . . . . . . . . . . . . . . . . . . . . . . . . . . $ 290.3 $ 343.0Short-term investment securities . . . . . . . . . . . . . . . . . . . . . . . . . . . . . . . . . . . 22.0 11.8Trade accounts receivable, less allowance for doubtful accounts of $14.9 million
in 2007 and $10.5 million in 2006 . . . . . . . . . . . . . . . . . . . . . . . . . . . . . . . . 235.7 228.5Inventories, net . . . . . . . . . . . . . . . . . . . . . . . . . . . . . . . . . . . . . . . . . . . . . . . 341.6 316.4Prepaid expenses and other assets . . . . . . . . . . . . . . . . . . . . . . . . . . . . . . . . . . 18.6 15.9Deferred income taxes . . . . . . . . . . . . . . . . . . . . . . . . . . . . . . . . . . . . . . . . . . 38.1 26.7Assets of discontinued operations . . . . . . . . . . . . . . . . . . . . . . . . . . . . . . . . . . 10.4 10.1
Total Current Assets . . . . . . . . . . . . . . . . . . . . . . . . . . . . . . . . . . . . . . . . . . 956.7 952.4PROPERTY, PLANT AND EQUIPMENT, NET . . . . . . . . . . . . . . . . . . . . . . . . 223.7 206.2OTHER ASSETS:
Goodwill . . . . . . . . . . . . . . . . . . . . . . . . . . . . . . . . . . . . . . . . . . . . . . . . . . . . 385.8 356.1Long-term investment securities . . . . . . . . . . . . . . . . . . . . . . . . . . . . . . . . . . . 17.0 —Other, net . . . . . . . . . . . . . . . . . . . . . . . . . . . . . . . . . . . . . . . . . . . . . . . . . . . 146.1 146.2
TOTAL ASSETS . . . . . . . . . . . . . . . . . . . . . . . . . . . . . . . . . . . . . . . . . . . . . . . . $1,729.3 $1,660.9
LIABILITIES AND STOCKHOLDERS’ EQUITYCURRENT LIABILITIES:
Accounts payable . . . . . . . . . . . . . . . . . . . . . . . . . . . . . . . . . . . . . . . . . . . . . . $ 108.0 $ 121.0Accrued expenses and other liabilities . . . . . . . . . . . . . . . . . . . . . . . . . . . . . . . 113.6 100.4Accrued compensation and benefits . . . . . . . . . . . . . . . . . . . . . . . . . . . . . . . . 38.2 42.6Current portion of long-term debt . . . . . . . . . . . . . . . . . . . . . . . . . . . . . . . . . . 1.3 7.5Liabilities of discontinued operations . . . . . . . . . . . . . . . . . . . . . . . . . . . . . . . . 28.6 27.9
Total Current Liabilities . . . . . . . . . . . . . . . . . . . . . . . . . . . . . . . . . . . . . . . 289.7 299.4LONG-TERM DEBT, NET OF CURRENT PORTION . . . . . . . . . . . . . . . . . . . 432.2 441.7DEFERRED INCOME TAXES . . . . . . . . . . . . . . . . . . . . . . . . . . . . . . . . . . . . 42.9 34.5OTHER NONCURRENT LIABILITIES . . . . . . . . . . . . . . . . . . . . . . . . . . . . . . 45.6 52.7MINORITY INTEREST . . . . . . . . . . . . . . . . . . . . . . . . . . . . . . . . . . . . . . . . . . 3.4 6.0STOCKHOLDERS’ EQUITY:
Preferred Stock, $0.10 par value; 5,000,000 shares authorized; no shares issuedor outstanding . . . . . . . . . . . . . . . . . . . . . . . . . . . . . . . . . . . . . . . . . . . . . . — —
Class A Common Stock, $0.10 par value; 80,000,000 shares authorized; 1 voteper share; issued and outstanding, 30,600,056 shares in 2007 and 31,239,111shares in 2006 . . . . . . . . . . . . . . . . . . . . . . . . . . . . . . . . . . . . . . . . . . . . . . 3.1 3.1
Class B Common Stock, $0.10 par value; 25,000,000 shares authorized; 10 votesper share; issued and outstanding, 7,293,880 shares in 2007 and in 2006 . . . . . .7 .7
Additional paid-in capital . . . . . . . . . . . . . . . . . . . . . . . . . . . . . . . . . . . . . . . . 377.6 367.8Retained earnings . . . . . . . . . . . . . . . . . . . . . . . . . . . . . . . . . . . . . . . . . . . . . 465.4 429.6Accumulated other comprehensive income . . . . . . . . . . . . . . . . . . . . . . . . . . . . 68.7 25.4
Total Stockholders’ Equity . . . . . . . . . . . . . . . . . . . . . . . . . . . . . . . . . . . . . . 915.5 826.6
TOTAL LIABILITIES AND STOCKHOLDERS’ EQUITY . . . . . . . . . . . . . . . . $1,729.3 $1,660.9
The accompanying notes are an integral part of these consolidated financial statements.
61
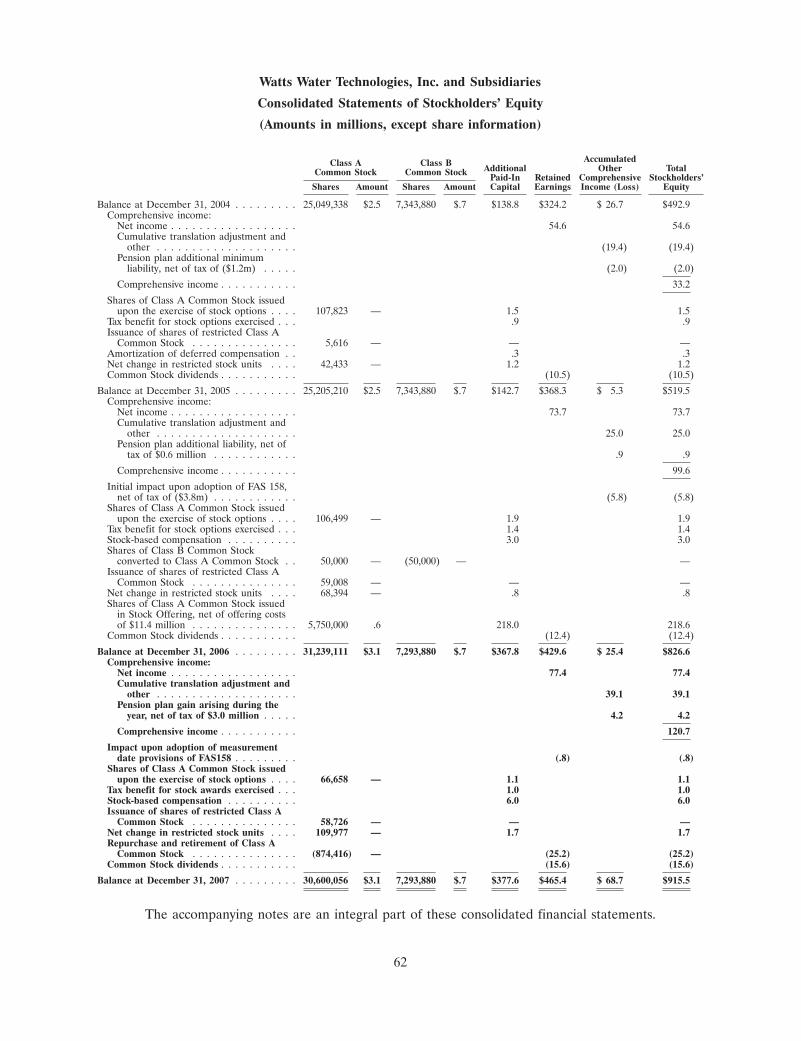
Watts Water Technologies, Inc. and Subsidiaries
Consolidated Statements of Stockholders’ Equity
(Amounts in millions, except share information)
AccumulatedClass A Class B Additional Other TotalCommon Stock Common Stock Paid-In Retained Comprehensive Stockholders’Shares Amount Shares Amount Capital Earnings Income (Loss) Equity
Balance at December 31, 2004 . . . . . . . . . 25,049,338 $2.5 7,343,880 $.7 $138.8 $324.2 $ 26.7 $492.9Comprehensive income:
Net income . . . . . . . . . . . . . . . . . . 54.6 54.6Cumulative translation adjustment and
other . . . . . . . . . . . . . . . . . . . . (19.4) (19.4)Pension plan additional minimum
liability, net of tax of ($1.2m) . . . . . (2.0) (2.0)
Comprehensive income . . . . . . . . . . . 33.2
Shares of Class A Common Stock issuedupon the exercise of stock options . . . . 107,823 — 1.5 1.5
Tax benefit for stock options exercised . . . .9 .9Issuance of shares of restricted Class A
Common Stock . . . . . . . . . . . . . . . 5,616 — — —Amortization of deferred compensation . . .3 .3Net change in restricted stock units . . . . 42,433 — 1.2 1.2Common Stock dividends . . . . . . . . . . . (10.5) (10.5)
Balance at December 31, 2005 . . . . . . . . . 25,205,210 $2.5 7,343,880 $.7 $142.7 $368.3 $ 5.3 $519.5Comprehensive income:
Net income . . . . . . . . . . . . . . . . . . 73.7 73.7Cumulative translation adjustment and
other . . . . . . . . . . . . . . . . . . . . 25.0 25.0Pension plan additional liability, net of
tax of $0.6 million . . . . . . . . . . . . .9 .9
Comprehensive income . . . . . . . . . . . 99.6
Initial impact upon adoption of FAS 158,net of tax of ($3.8m) . . . . . . . . . . . . (5.8) (5.8)
Shares of Class A Common Stock issuedupon the exercise of stock options . . . . 106,499 — 1.9 1.9
Tax benefit for stock options exercised . . . 1.4 1.4Stock-based compensation . . . . . . . . . . 3.0 3.0Shares of Class B Common Stock
converted to Class A Common Stock . . 50,000 — (50,000) — —Issuance of shares of restricted Class A
Common Stock . . . . . . . . . . . . . . . 59,008 — — —Net change in restricted stock units . . . . 68,394 — .8 .8Shares of Class A Common Stock issued
in Stock Offering, net of offering costsof $11.4 million . . . . . . . . . . . . . . . 5,750,000 .6 218.0 218.6
Common Stock dividends . . . . . . . . . . . (12.4) (12.4)
Balance at December 31, 2006 . . . . . . . . . 31,239,111 $3.1 7,293,880 $.7 $367.8 $429.6 $ 25.4 $826.6Comprehensive income:
Net income . . . . . . . . . . . . . . . . . . 77.4 77.4Cumulative translation adjustment and
other . . . . . . . . . . . . . . . . . . . . 39.1 39.1Pension plan gain arising during the
year, net of tax of $3.0 million . . . . . 4.2 4.2
Comprehensive income . . . . . . . . . . . 120.7
Impact upon adoption of measurementdate provisions of FAS158 . . . . . . . . . (.8) (.8)
Shares of Class A Common Stock issuedupon the exercise of stock options . . . . 66,658 — 1.1 1.1
Tax benefit for stock awards exercised . . . 1.0 1.0Stock-based compensation . . . . . . . . . . 6.0 6.0Issuance of shares of restricted Class A
Common Stock . . . . . . . . . . . . . . . 58,726 — — —Net change in restricted stock units . . . . 109,977 — 1.7 1.7Repurchase and retirement of Class A
Common Stock . . . . . . . . . . . . . . . (874,416) — (25.2) (25.2)Common Stock dividends . . . . . . . . . . . (15.6) (15.6)
Balance at December 31, 2007 . . . . . . . . . 30,600,056 $3.1 7,293,880 $.7 $377.6 $465.4 $ 68.7 $915.5
The accompanying notes are an integral part of these consolidated financial statements.
62
Watts Water Technologies, Inc. and Subsidiaries
Consolidated Statements of Cash Flows
(Amounts in millions)
Years Ended December 31,
2007 2006 2005
OPERATING ACTIVITIESNet income . . . . . . . . . . . . . . . . . . . . . . . . . . . . . . . . . . . . . . . . . . . . . . . . . . . . $ 77.4 $ 73.7 $ 54.6Less: loss from discontinued operations . . . . . . . . . . . . . . . . . . . . . . . . . . . . . . . . . (.2) (3.4) (.4)
Income from continuing operations . . . . . . . . . . . . . . . . . . . . . . . . . . . . . . . . . . . . 77.6 77.1 55.0Adjustments to reconcile income from continuing operations to net cash provided by
continuing operating activities:Depreciation . . . . . . . . . . . . . . . . . . . . . . . . . . . . . . . . . . . . . . . . . . . . . . . . 28.9 26.7 23.5Amortization . . . . . . . . . . . . . . . . . . . . . . . . . . . . . . . . . . . . . . . . . . . . . . . . 10.5 8.6 2.6(Gain) loss on disposal and impairment of property, plant and equipment and other . 2.0 (8.3) .6Stock-based compensation . . . . . . . . . . . . . . . . . . . . . . . . . . . . . . . . . . . . . . . 6.0 3.0 —Deferred income tax benefit . . . . . . . . . . . . . . . . . . . . . . . . . . . . . . . . . . . . . . (8.2) (2.1) (1.3)Changes in operating assets and liabilities, net of effects from business acquisitions
and divestures:Accounts receivable . . . . . . . . . . . . . . . . . . . . . . . . . . . . . . . . . . . . . . . . . . 6.5 (17.0) (16.5)Inventories . . . . . . . . . . . . . . . . . . . . . . . . . . . . . . . . . . . . . . . . . . . . . . . . (8.1) (37.3) (20.3)Prepaid expenses and other assets . . . . . . . . . . . . . . . . . . . . . . . . . . . . . . . . (1.2) 2.0 (4.1)Accounts payable, accrued expenses and other liabilities . . . . . . . . . . . . . . . . . . (22.3) 30.3 13.6
Net cash provided by continuing operations . . . . . . . . . . . . . . . . . . . . . . . . . . . . . 91.7 83.0 53.1
INVESTING ACTIVITIESAdditions to property, plant and equipment . . . . . . . . . . . . . . . . . . . . . . . . . . . . . . (37.8) (44.7) (18.6)Proceeds from the sale of property, plant and equipment . . . . . . . . . . . . . . . . . . . . . . .6 31.9 .7Investments in securities . . . . . . . . . . . . . . . . . . . . . . . . . . . . . . . . . . . . . . . . . . . (27.5) (11.8) —Proceeds from sale of securities . . . . . . . . . . . . . . . . . . . . . . . . . . . . . . . . . . . . . . .4 — 26.6Increase in other assets . . . . . . . . . . . . . . . . . . . . . . . . . . . . . . . . . . . . . . . . . . . . (.5) (1.2) (.5)Business acquisitions, net of cash acquired . . . . . . . . . . . . . . . . . . . . . . . . . . . . . . . (22.6) (93.4) (191.4)
Net cash used in investing activities . . . . . . . . . . . . . . . . . . . . . . . . . . . . . . . . . . (87.4) (119.2) (183.2)
FINANCING ACTIVITIESProceeds from long-term debt . . . . . . . . . . . . . . . . . . . . . . . . . . . . . . . . . . . . . . . . 43.8 356.6 161.5Payments of long-term debt . . . . . . . . . . . . . . . . . . . . . . . . . . . . . . . . . . . . . . . . . (71.5) (228.3) (42.0)Payment of capital leases . . . . . . . . . . . . . . . . . . . . . . . . . . . . . . . . . . . . . . . . . . . (1.7) (4.1) —Proceeds from share transactions under employee stock plans . . . . . . . . . . . . . . . . . . . 1.1 1.9 1.8Tax benefit of stock awards exercised . . . . . . . . . . . . . . . . . . . . . . . . . . . . . . . . . . . 1.0 1.4 .9Debt issue costs . . . . . . . . . . . . . . . . . . . . . . . . . . . . . . . . . . . . . . . . . . . . . . . . . — (2.4) —Proceeds from stock offering, net . . . . . . . . . . . . . . . . . . . . . . . . . . . . . . . . . . . . . — 218.6 —Payments to repurchase common stock . . . . . . . . . . . . . . . . . . . . . . . . . . . . . . . . . . (23.6) — —Dividends . . . . . . . . . . . . . . . . . . . . . . . . . . . . . . . . . . . . . . . . . . . . . . . . . . . . . (15.6) (12.4) (10.5)
Net cash provided by (used in) financing activities . . . . . . . . . . . . . . . . . . . . . . . . . (66.5) 331.3 111.7
Effect of exchange rate changes on cash and cash equivalents . . . . . . . . . . . . . . . . . . . . 9.4 1.2 (.6)Net cash provided by (used in) operating activities of discontinued operations . . . . . . . . . .1 .9 (1.1)
INCREASE (DECREASE) IN CASH AND CASH EQUIVALENTS . . . . . . . . . . . . . . . (52.7) 297.2 (20.1)Cash and cash equivalents at beginning of year . . . . . . . . . . . . . . . . . . . . . . . . . . . . . . 343.0 45.8 65.9
CASH AND CASH EQUIVALENTS AT END OF YEAR . . . . . . . . . . . . . . . . . . . . . . $290.3 $ 343.0 $ 45.8
NON CASH INVESTING AND FINANCING ACTIVITIESFair value of assets acquired and liabilities assumed from the acquisition of businesses . . . . $ 3.8 $ 4.0 $ —
Acquisitions of property, plant and equipment under capital lease . . . . . . . . . . . . . . . . . $ 1.4 $ 16.0 $ —
Issuance of stock under management stock purchase plan . . . . . . . . . . . . . . . . . . . . . . . $ 1.7 $ .8 $ 1.2
Liability for shares repurchased . . . . . . . . . . . . . . . . . . . . . . . . . . . . . . . . . . . . . . . . $ 1.4 $ — $ —
Retirement of variable rate demand bonds with cash collateral . . . . . . . . . . . . . . . . . . . . $ — $ (8.9) $ 8.9
CASH PAID FOR:Interest . . . . . . . . . . . . . . . . . . . . . . . . . . . . . . . . . . . . . . . . . . . . . . . . . . . . . . $ 27.1 $ 21.7 $ 9.5
Taxes . . . . . . . . . . . . . . . . . . . . . . . . . . . . . . . . . . . . . . . . . . . . . . . . . . . . . . . . $ 48.0 $ 35.3 $ 30.7
The accompanying notes are an integral part of these consolidated financial statements.
63
Watts Water Technologies, Inc. and Subsidiaries
Notes to Consolidated Financial Statements
(1) Description of Business
Watts Water Technologies, Inc. (the Company) designs, manufactures and sells an extensive line ofwater safety and flow control products primarily for the water quality, water safety, water flow controland water conservation markets located predominantly in North America, Europe, and China.
(2) Accounting Policies
Principles of Consolidation
The consolidated financial statements include the accounts of the Company and its majority andwholly owned subsidiaries. Upon consolidation, all significant intercompany accounts and transactionsare eliminated.
Cash Equivalents
Cash equivalents consist of highly liquid investments with maturities of three months or less at thedate of original issuance.
Investment Securities
Investment securities at December 31, 2007 and 2006 consisted of auction rate certificates whoseunderlying investments were in AAA rated municipal bonds. The certificates are bought and sold atauction with reset dates of up to 35 days. The certificates were purchased at par value, whichapproximates market value at December 31, 2007 and 2006. The Company classifies its debt securitiesas available for sale.
Available-for-sale securities are recorded at fair value. Unrealized holding gains and losses, net ofthe related tax effect, on available-for-sale securities are excluded from earnings and are reported as aseparate component of other comprehensive income until realized. Realized gains and losses from thesale of available-for-sale securities are determined on a specific-identification basis.
A decline in the market value of any available-for-sale security below cost that is deemed to beother-than-temporary results in a reduction in carrying amount to fair value. The impairment is chargedto earnings and a new cost basis for the security is established. To determine whether an impairment isother-than-temporary, the Company considers whether it has the ability and intent to hold theinvestment until a market price recovery and considers whether evidence indicating the cost of theinvestment is recoverable outweighs evidence to the contrary. Evidence considered in this assessmentincludes the reasons for the impairment, the severity and duration of the impairment, changes in valuesubsequent to year-end, and forecasted performance of the investee.
Premiums and discounts are amortized or accreted over the life of the related available-for-salesecurity as an adjustment to yield using the effective-interest method. Dividend and interest income arerecognized when earned.
Allowance for Doubtful Accounts
Allowance for doubtful accounts includes reserves for bad debts and sales returns and allowances.The Company analyzes the aging of accounts receivable, individual accounts receivable, historical baddebts, concentration of receivables by customer, customer credit worthiness, current economic trendsand changes in customer payment terms. The Company specifically analyzes individual accountsreceivable and establishes specific reserves against financially troubled customers. In addition, factors
64
Watts Water Technologies, Inc. and Subsidiaries
Notes to Consolidated Financial Statements (Continued)
(2) Accounting Policies (Continued)
are developed in certain regions utilizing historical trends of sales and returns and allowances to derivea reserve for returns and allowances.
Concentration of Credit
The Company sells products to a diversified customer base and, therefore, has no significantconcentrations of credit risk, except that approximately 10.0% and 10.7% of the Company’s total salesin 2006 and 2005, respectively, were to one customer. These sales were transacted within the NorthAmerica geographic segment. In 2007, no one customer accounted for 10.0% or more of theCompany’s total sales.
Inventories
Inventories are stated at the lower of cost (using primarily the first-in, first-out method) or market.Market value is determined by replacement cost or net realizable value. Historical experience is used asthe basis for determining the reserve for excess or obsolete inventories.
Goodwill and Other Intangible Assets
Goodwill is recorded when the consideration paid for acquisitions exceeds the fair value of nettangible and intangible assets acquired. Goodwill and other intangible assets with indefinite useful livesare not amortized, but rather are tested annually for impairment. The test was performed as ofOctober 28, 2007.
Impairment of Goodwill and Long-Lived Assets
Goodwill and intangible assets with indefinite lives are tested annually for impairment inaccordance with the provisions of Financial Accounting Standards Board Statement No. 142 ‘‘Goodwilland Other Intangible Assets’’ (FAS 142). The Company’s impairment review is based on a discountedcash flow approach at the reporting unit level that requires management judgment with respect torevenue and expense growth rates, changes in working capital and the selection and use of anappropriate discount rate. The Company uses its judgment in assessing whether assets may havebecome impaired between annual impairment tests. Indicators such as unexpected adverse businessconditions, economic factors, unanticipated technological change or competitive activities, loss of keypersonnel and acts by governments and courts, may signal that an asset has become impaired.
Intangible assets with estimable lives and other long-lived assets are reviewed for impairmentwhenever events or changes in circumstances indicate that the carrying amount of an asset or assetgroup may not be recoverable in accordance with Financial Accounting Standards Board StatementNo. 144, ‘‘Accounting for the Impairment or Disposal of Long-Lived Assets’’ (FAS 144). Recoverabilityof intangible assets with estimable lives and other long-lived assets is measured by a comparison of thecarrying amount of an asset or asset group to future net undiscounted pretax cash flows expected to begenerated by the asset or asset group. If these comparisons indicate that an asset is not recoverable, theimpairment loss recognized is the amount by which the carrying amount of the asset or asset groupexceeds the related estimated fair value. Estimated fair value is based on either discounted futurepretax operating cash flows or appraised values, depending on the nature of the asset. The Companydetermines the discount rate for this analysis based on the expected internal rate of return for therelated business and does not allocate interest charges to the asset or asset group being measured.Judgment is required to estimate future operating cash flows.
65
Watts Water Technologies, Inc. and Subsidiaries
Notes to Consolidated Financial Statements (Continued)
(2) Accounting Policies (Continued)
The changes in the carrying amount of goodwill are as follows:
NorthAmerica Europe China Total
(in millions)
Carrying amount at December 31, 2005 . . . . . . . . . . . . . . . . . . . . . $193.6 $ 97.4 $ 5.6 $296.6Goodwill acquired during the period . . . . . . . . . . . . . . . . . . . . . . . — 37.2 3.4 40.6Adjustments to goodwill during the period . . . . . . . . . . . . . . . . . . . 5.3 — — 5.3Effect of change in exchange rates used for translation . . . . . . . . . . — 13.3 .3 13.6
Carrying amount at December 31, 2006 . . . . . . . . . . . . . . . . . . . . . $198.9 $147.9 $ 9.3 $356.1Goodwill acquired during the period . . . . . . . . . . . . . . . . . . . . . . . 7.6 — — 7.6Adjustments to goodwill during the period . . . . . . . . . . . . . . . . . . . 3.8 1.1 2.4 7.3Effect of change in exchange rates used for translation . . . . . . . . . . .7 13.4 .7 14.8
Carrying amount at December 31, 2007 . . . . . . . . . . . . . . . . . . . . . $211.0 $162.4 $12.4 $385.8
The adjustments to North American goodwill during the year ended December 31, 2007 relate toan accrual of approximately $3.8 million in earn-out provisions. The adjustment to European goodwillduring the year ended December 31, 2007 includes the finalization of the ATS Expansion Grouppurchase price allocation. ATS Expansion Group was acquired in May 2006. The adjustment to Chinagoodwill during the year ended December 31, 2007 includes the finalization of the Changsha ValveWorks purchase price allocation. Changsha Valve Works was acquired in April 2006.
The adjustments to North American goodwill during the year ended December 31, 2006 relate toan accrual of approximately $4.0 million in earn-out provisions and in 2006 includes the finalization ofthe Dormont Manufacturing Company and Core Industries Inc. purchase price allocations. DormontManufacturing Company and Core Industries Inc. were acquired in December 2005.
Other intangible assets include the following and are presented in ‘‘Other Assets: Other, net’’, inthe Consolidated Balance Sheets:
December 31,
2007 2006
Gross GrossCarrying Accumulated Carrying AccumulatedAmount Amortization Amount Amortization
(in millions)
Patents . . . . . . . . . . . . . . . . . . . . . . . . . . . . . . . . . . . . . $ 13.8 $ (6.1) $ 13.2 $ (5.3)Customer relationships . . . . . . . . . . . . . . . . . . . . . . . . . . 70.0 (14.3) 65.3 (7.5)Technology . . . . . . . . . . . . . . . . . . . . . . . . . . . . . . . . . . 7.5 (2.3) 7.5 (1.2)Other . . . . . . . . . . . . . . . . . . . . . . . . . . . . . . . . . . . . . . 19.0 (5.8) 15.3 (4.0)
Total amortizable intangible assets . . . . . . . . . . . . . . . . 110.3 (28.5) 101.3 (18.0)
Intangible assets not subject to amortization . . . . . . . . . . 52.2 — 50.5 —
Total . . . . . . . . . . . . . . . . . . . . . . . . . . . . . . . . . . . . . $162.5 $(28.5) $151.8 $(18.0)
Aggregate amortization expense for amortized other intangible assets for the years endedDecember 31, 2007, 2006 and 2005 was $10.5 million, $8.6 million and $2.6 million, respectively.Additionally, future amortization expense on amortizable intangible assets approximates $9.3 million for2008, $9.0 million for 2009, $8.9 million for 2010, $8.3 million for 2011 and $6.9 million for 2012.
66
Watts Water Technologies, Inc. and Subsidiaries
Notes to Consolidated Financial Statements (Continued)
(2) Accounting Policies (Continued)
Amortization expense is provided on a straight-line basis over the estimated useful lives of theintangible assets. The weighted-average remaining life of total amortizable intangible assets is10.8 years. Patents, customer relationships, technology and other amortizable intangibles have weighted-average remaining lives of 9.2 years, 9.4 years, 6.4 years and 19.2 years, respectively. Intangible assetsnot subject to amortization primarily include trademarks and unpatented technology.
Property, Plant and Equipment
Property, plant and equipment are recorded at cost. Depreciation is provided on a straight-linebasis over the estimated useful lives of the assets, which range from 10 to 40 years for buildings andimprovements and 3 to 15 years for machinery and equipment.
Taxes, Other than Income Taxes
Taxes assessed by governmental authorities on sale transactions are recorded on a net basis andexcluded from sales, in the Company’s consolidated statements of operations.
Income Taxes
Income taxes are accounted for under the asset and liability method. Deferred tax assets andliabilities are recognized for the future tax consequences attributable to differences between thefinancial statement carrying amounts of existing assets and liabilities and their respective tax bases andoperating loss and tax credit carry forwards. Deferred tax assets and liabilities are measured usingenacted tax rates expected to apply to taxable income in the years in which those temporary differencesare expected to be recovered or settled. The effect on deferred tax assets and liabilities of a change intax rates is recognized in income in the period that includes the enactment date.
On January 1, 2007, the Company adopted the provisions of Financial Accounting Standards BoardInterpretation No. 48, ‘‘Accounting for Uncertainty in Income Taxes’’ (FIN 48). The purpose of FIN 48is to increase the comparability in financial reporting of income taxes. FIN 48 requires that in order fora tax benefit to be booked in the income statement, the item in question must meet themore-likely-than-not (greater than 50% likelihood of being sustained upon examination by the taxingauthorities) threshold. The adoption of FIN 48 did not have a material effect on the Company’sfinancial statements. No cumulative effect was booked through beginning retained earnings.
As of the adoption date, the Company had gross unrecognized tax benefits of approximately$4.8 million, of which approximately $4.2 million, if recognized, would affect the effective tax rate. Thedifference between the amount of unrecognized tax benefits and the amount that would impact theeffective tax rate consists of the federal tax benefit of state income tax items. During 2007, theCompany reduced its unrecognized tax benefits by approximately $0.6 million for a tax issue in Italy. Asa result of the conclusion of state income tax audits, it is reasonably possible that the total amount ofunrecognized tax benefits will change in the next twelve months. The Company estimates that it isreasonably possible that approximately $0.5 million of the currently remaining unrecognized tax benefitmay be recognized by the end of 2008 as a result of the conclusion of the state income tax audits.Notwithstanding, the Company does not expect any further significant changes in the amounts ofunrecognized tax benefits within the next twelve months.
As of December 31, 2007, the Company had gross unrecognized tax benefits of approximately$3.7 million, of which approximately $3.2 million, if recognized, would affect the effective tax rate. Thedifference between the amount of unrecognized tax benefits and the amount that would impact the
67
Watts Water Technologies, Inc. and Subsidiaries
Notes to Consolidated Financial Statements (Continued)
(2) Accounting Policies (Continued)
effective tax rate consists of the federal tax benefit of state income tax items. A reconciliation of thebeginning and ending amount of unrecognized tax benefits and a separate analysis of accrued interestrelated to the unrecognized tax benefits is as follows:
(in millions)
Balance as of January 1, 2007 . . . . . . . . . . . . . . . . . . . . . . . . . . . . . . . $ 4.8Increases related to prior year tax provisions . . . . . . . . . . . . . . . . . . . . . 1.1Decreases related to prior year tax provisions . . . . . . . . . . . . . . . . . . . . (1.6)Increases related to current year tax positions . . . . . . . . . . . . . . . . . . . . .2Settlements . . . . . . . . . . . . . . . . . . . . . . . . . . . . . . . . . . . . . . . . . . . . . (.8)
Balance as of December 31, 2007 . . . . . . . . . . . . . . . . . . . . . . . . . . . . . $ 3.7
Accrued interest related to unrecognized tax benefits:
(in millions)
Balance as of January 1, 2007 . . . . . . . . . . . . . . . . . . . . . . . . . . . . . . . $ .6Increases . . . . . . . . . . . . . . . . . . . . . . . . . . . . . . . . . . . . . . . . . . . . . . .4Decreases . . . . . . . . . . . . . . . . . . . . . . . . . . . . . . . . . . . . . . . . . . . . . . —
Balance as of December 31, 2007 . . . . . . . . . . . . . . . . . . . . . . . . . . . . . $1.0
The Company was under audit by the Internal Revenue Service for the 2003 and 2004 tax years.The audit was completed in February 2008 and resulted in no significant adjustments. The Companyconducts business in a variety of locations throughout the world resulting in tax filings in numerousdomestic and foreign jurisdictions. The Company is subject to tax examinations regularly as part of thenormal course of business. The Company’s major jurisdictions are the U.S., Canada, China,Netherlands, U.K., Germany, Italy and France. With few exceptions the Company is no longer subjectto U.S. federal, state and local, or non-U.S. income tax examinations for years before 2002.
The Company accounts for interest and penalties related to uncertain tax positions as a componentof income tax expense.
Several tax years remain subject to examination by major jurisdictions. Years that remain open toexamination with respect to U.S. federal taxes are 2005-2006. The Company is currently under audit bythe Commonwealth of Massachusetts for 2001-2003. Upon conclusion of that audit, 2004-2006 willremain open. Years that remain open to examination in Canada are 2003-2006. Years that remain opento examination for major European countries include the United Kingdom 2002-2006, Germany2005-2006, Italy 2002-2006, France 2005-2006 and the Netherlands 2002-2006.
Foreign Currency Translation
The financial statements of subsidiaries located outside the United States generally are measuredusing the local currency as the functional currency. Balance sheet accounts, including goodwill, offoreign subsidiaries are translated into United States dollars at year-end exchange rates. Income andexpense items are translated at weighted average exchange rates for each period. Net translation gainsor losses are included in other comprehensive income, a separate component of stockholders’ equity.The Company does not provide for U.S. income taxes on foreign currency translation adjustments since
68
Watts Water Technologies, Inc. and Subsidiaries
Notes to Consolidated Financial Statements (Continued)
(2) Accounting Policies (Continued)
it does not provide for such taxes on undistributed earnings of foreign subsidiaries. Gains and lossesfrom foreign currency transactions of these subsidiaries are included in net earnings.
Stock-Based Compensation
Effective January 1, 2006, the Company adopted Financial Accounting Standards Board StatementNo. 123R, ‘‘Share-Based Payment’’ (FAS 123R) utilizing the ‘‘modified prospective’’ method asdescribed in FAS 123R. Under the ‘‘modified prospective’’ method, compensation cost is recognized forall share-based payments granted after the effective date and for all unvested awards granted prior tothe effective date. In accordance with FAS 123R, prior period amounts were not restated. FAS 123Ralso requires the excess tax benefits associated with these share-based payments to be classified asfinancing activities in the Statements of Consolidated Cash Flows, rather than as operating cash flowsas required under previous regulations.
At December 31, 2007, the Company had three stock-based compensation plans with totalunrecognized compensation costs related to unvested stock-based compensation arrangements ofapproximately $9.5 million and a total weighted average remaining term of 2.3 years. For 2007 and2006, the Company recognized compensation costs related to stock-based programs of approximately$6.0 million and $3.0 million, respectively, in selling, general and administrative expenses. TheCompany recorded approximately $0.7 million and $0.4 million of tax benefit during 2007 and 2006,respectively, for the compensation expense relating to its stock options. For 2007 and 2006, theCompany recorded approximately $1.3 million and $0.6 million, respectively, of tax benefit for its otherstock-based plans. For 2007 and 2006, the recognition of total stock-based compensation expenseimpacted both basic net income per common share and diluted net income per common share by $0.10and $0.06, respectively.
Prior to the effective date, the stock-based compensation plans were accounted for underAccounting Principles Board Opinion (APB) No. 25, ‘‘Accounting for Stock Issued to Employees,’’ andrelated interpretations. Pro-forma information regarding the impact of total stock-based compensationon net income and income per share for prior periods is required by FAS 123R.
Such pro-forma information, determined as if the Company had accounted for its employee stockoptions and restricted stock units (RSUs) under the fair value method to measure stock-basedcompensation as required under the disclosure provisions of Financial Accounting Standards BoardStatement No. 123, ‘‘Accounting for Stock-Based Compensation’’ (FAS 123) as amended by FinancialAccounting Standards Board Statement No. 148 ‘‘Accounting for Stock-Based Compensation Transition
69
Watts Water Technologies, Inc. and Subsidiaries
Notes to Consolidated Financial Statements (Continued)
(2) Accounting Policies (Continued)
and Disclosure’’ (FAS 148) during 2005, is illustrated in the following tables (Amounts in millions,except per share information):
Year EndedDecember 31,
2005
Net income, as reported . . . . . . . . . . . . . . . . . . . . . . . . . . . . . . . . . . . $54.6Add: Stock-based employee compensation expense from the
Management Stock Purchase Plan included in reported net income,net of tax . . . . . . . . . . . . . . . . . . . . . . . . . . . . . . . . . . . . . . . . . . . . .5
Deduct: Stock-based employee expense determined under the fair valuemethod, net of tax:Restricted stock units (Management Stock Purchase Plan) . . . . . . . . . (.6)Employee stock options . . . . . . . . . . . . . . . . . . . . . . . . . . . . . . . . . . (1.1)
Pro forma net income . . . . . . . . . . . . . . . . . . . . . . . . . . . . . . . . . . . . . $53.4
Earnings per share:Basic—as reported . . . . . . . . . . . . . . . . . . . . . . . . . . . . . . . . . . . . . $1.68Basic—pro forma . . . . . . . . . . . . . . . . . . . . . . . . . . . . . . . . . . . . . . $1.64Diluted—as reported . . . . . . . . . . . . . . . . . . . . . . . . . . . . . . . . . . . . $1.66Diluted—pro forma . . . . . . . . . . . . . . . . . . . . . . . . . . . . . . . . . . . . $1.62
Net Income Per Common Share
Basic net income per common share is calculated by dividing net income by the weighted averagenumber of common shares outstanding. The calculation of diluted income per share assumes theconversion of all dilutive securities (see Note 13).
Net income and number of shares used to compute net income per share, basic and assuming fulldilution, are reconciled below:
Years Ended December 31,
2007 2006 2005
Per Per PerNet Share Net Share Net Share
Income Shares Amount Income Shares Amount Income Shares Amount
(Amounts in millions, except per share information)Basic EPS . . . . . . . . . . . . . . . . . . . . . . . . . $77.4 38.6 $2.00 $73.7 33.3 $2.21 $54.6 32.5 $1.68Dilutive securities principally common stock
options . . . . . . . . . . . . . . . . . . . . . . . . . — .4 (.01) — .4 (.02) — .5 (.02)
Diluted EPS . . . . . . . . . . . . . . . . . . . . . . . $77.4 39.0 $1.99 $73.7 33.7 $2.19 $54.6 33.0 $1.66
The computation of diluted net income per share for the year ended December 31, 2007 excludesthe effect of the potential exercise of options to purchase approximately 0.5 million shares, because theexercise price of the option was greater than the average market price of the Class A Common Stock,as the effect would have been anti-dilutive.
During the period January 1, 2008 to February 22, 2008, the Company repurchased approximately1.4 million shares of its Class A Common Stock.
70
Watts Water Technologies, Inc. and Subsidiaries
Notes to Consolidated Financial Statements (Continued)
(2) Accounting Policies (Continued)
Derivative Financial Instruments
In the normal course of business, the Company manages risks associated with commodity prices,foreign exchange rates and interest rates through a variety of strategies, including the use of hedgingtransactions, executed in accordance with the Company’s policies. The Company’s hedging transactionsinclude, but are not limited to, the use of various derivative financial and commodity instruments. As amatter of policy, the Company does not use derivative instruments unless there is an underlyingexposure. Any change in value of the derivative instruments would be substantially offset by anopposite change in the value of the underlying hedged items. The Company does not use derivativeinstruments for trading or speculative purposes.
Using qualifying criteria defined in Financial Accounting Standards Board Statement No. 133,‘‘Accounting for Derivative Instruments and Hedging Activities’’ (FAS 133), derivative instruments aredesignated and accounted for as either a hedge of a recognized asset or liability (fair value hedge) or ahedge of a forecasted transaction (cash flow hedge). For a fair value hedge, both the effective andineffective portions of the change in fair value of the derivative instrument, along with an adjustment tothe carrying amount of the hedged item for fair value changes attributable to the hedged risk, arerecognized in earnings. For a cash flow hedge, changes in the fair value of the derivative instrumentthat are highly effective are deferred in accumulated other comprehensive income or loss until theunderlying hedged item is recognized in earnings.
If a fair value or cash flow hedge were to cease to qualify for hedge accounting or be terminated,it would continue to be carried on the balance sheet at fair value until settled, but hedge accountingwould be discontinued prospectively. If a forecasted transaction was no longer probable of occurring,amounts previously deferred in accumulated other comprehensive income would be recognizedimmediately in earnings. On occasion, the Company may enter into a derivative instrument that doesnot qualify for hedge accounting because it is entered into to offset changes in the fair value of anunderlying transaction which is required to be recognized in earnings (natural hedge). Theseinstruments are reflected in the Consolidated Balance Sheets at fair value with changes in fair valuerecognized in earnings.
Certain forecasted transactions, primarily intercompany sales between the United States andCanada, and assets are exposed to foreign currency risk. The Company monitors its foreign currencyexposures on an ongoing basis to maximize the overall effectiveness of its foreign currency hedgepositions. During 2007 and 2006, the Company used foreign currency forward contracts as a means ofhedging exposure to foreign currency risks. The Company’s foreign currency forwards did not qualify asa cash flow hedge under the criteria of FAS 133.
Portions of the Company’s outstanding debt are exposed to interest rate risks. The Companymonitors its interest rate exposures on an ongoing basis to maximize the overall effectiveness of itsinterest rates. During 2006, the Company used an interest rate swap as a means of hedging exposure tointerest rate risks (see Note 11). The Company’s interest rate swap did not qualify as a cash flow hedgeunder the criteria of FAS 133.
Shipping and Handling
Shipping and handling costs included in selling, general and administrative expense amounted to$39.1 million, $37.3 million and $28.1 million for the years ended December 31, 2007, 2006 and 2005,respectively.
71
Watts Water Technologies, Inc. and Subsidiaries
Notes to Consolidated Financial Statements (Continued)
(2) Accounting Policies (Continued)
Research and Development
Research and development costs included in selling, general, and administrative expense amountedto $15.1 million, $12.7 million and $11.6 million for the years ended December 31, 2007, 2006 and2005, respectively.
Revenue Recognition
The Company recognizes revenue when all of the following criteria have been met: the Companyhas entered into a binding agreement, the product has been shipped and title passes, the sales price tothe customer is fixed or is determinable, and collectability is reasonably assured. Provisions forestimated returns and allowances are made at the time of sale, and are recorded as a reduction of salesand included in the allowance for doubtful accounts in the Consolidated Balance Sheets. The Companyrecords provisions for sales incentives (primarily volume rebates), as an adjustment to net sales inaccordance with the Financial Accounting Standards Board’s Emerging Issues Task Force (EITF) Issue00-14, ‘‘Accounting for Certain Sales Incentives’’ (EITF 00-14) and EITF Issue No 01-9, ‘‘Accountingfor Consideration Given by a Vendor to a Customer or a Reseller of the Vendor’s Products’’.
Basis of Presentation
Certain amounts for 2006 and 2005 have been reclassified to permit comparison with the 2007presentation.
Estimates
The preparation of financial statements in conformity with accounting principles generally acceptedin the United States requires management to make estimates and assumptions that affect the reportedamounts of assets and liabilities and disclosure of contingent assets and liabilities at the date of thefinancial statements and the reported amounts of revenues and expenses during the reporting period.Actual results could differ from those estimates.
New Accounting Standards
In December 2007, the Financial Accounting Standards Board (FASB) issued Financial AccountingStandards Board Statement (FAS) No. 141 (R), ‘‘Business Combinations,’’ (FAS 141R), which requiresmost identifiable assets, liabilities, non-controlling interests, and goodwill acquired in a businesscombination to be recorded at ‘‘full fair value.’’ Under FAS 141R, all business combinations will beaccounted for under the acquisition method. Significant changes, among others, from current guidanceresulting from FAS 141R includes the requirement that contingent assets and liabilities and contingentconsideration shall be recorded at estimated fair value as of the acquisition date, with any subsequentchanges in fair value charged or credited to earnings. Further, acquisition-related costs will be expensedrather than treated as part of the acquisition. FAS 141R is effective for periods beginning on or afterDecember 15, 2008. The Company expects the adoption of FAS 141R will increase costs charged to itsoperations.
In December 2007, the FASB issued FAS No. 160, ‘‘Non-controlling Interests in ConsolidatedFinancial Statements, an amendment of ARB NO. 151,’’ (FAS 160), which requires non-controllinginterests (previously referred to as minority interest) to be treated as a separate component of equity,not as a liability as is current practice. FAS 160 applies to non-controlling interests and transactionswith non-controlling interest holders in consolidated financial statements. FAS 160 is effective for
72
Watts Water Technologies, Inc. and Subsidiaries
Notes to Consolidated Financial Statements (Continued)
(2) Accounting Policies (Continued)
periods beginning on or after December 15, 2008. The Company is currently evaluating the effect thatFAS 160 will have on its consolidated financial statements.
In February 2007, the FASB issued FAS No. 159, ‘‘The Fair Value Option for Financial Assets andFinancial Liabilities—including an Amendment to FAS No. 115,’’ (FAS 159), which permits entities tochoose to measure many financial instruments and certain other items at fair value. FAS 159 is effectivefor financial statements issued for fiscal years beginning after November 15, 2007 and interim periodswithin those fiscal years. Earlier application is encouraged. The Company does not expect to measureits financial instruments at fair value and therefore does not expect the adoption of FAS 159 to have amaterial impact on its consolidated financial statements.
In September 2006, the FASB issued FAS No. 157, ‘‘Fair Value Measurements’’ (FAS 157), whichdefines fair value, establishes a framework for measuring fair value in generally accepted accountingprinciples and expands disclosures about fair value measurements. For financial assets and liabilities,FAS 157 is effective for financial statements issued for fiscal years beginning after November 15, 2007and interim periods within those fiscal years. For nonfinancial assets and liabilities, FAS 157 is effectivefor financial statements issued for fiscal years beginning after November 15, 2008 and interim periodswithin those fiscal years. Earlier application is encouraged provided that the reporting company has notyet issued financial statements for that fiscal year, including financial statements for an interim periodwithin that fiscal year. The Company does not expect the adoption of FAS 157 will have a materialimpact on its consolidated financial statements.
In September 2006, the Securities and Exchange Commission issued Staff Accounting BulletinNo. 108, ‘‘Considering the Effects of Prior Year Misstatements When Quantifying Misstatements inCurrent Year Financial Statements’’ (SAB 108), which provides interpretive guidance on how theeffects of the carryover or reversal of prior year misstatements should be considered in quantifying acurrent year misstatement. SAB 108 is effective for fiscal years ending after November 15, 2006. TheCompany adopted the provisions of SAB 108 for fiscal year 2006 and the impact of SAB 108 was notmaterial to its consolidated financial statements.
In September 2006, the FASB issued FAS No. 158, ‘‘Employers’ Accounting for Defined BenefitPension and Other Postretirement Plans—an amendment of FASB Statements No. 87, 88, 106, and132(R),’’ (FAS 158), which requires an employer to: (a) recognize in its statement of financial positionan asset for a plan’s overfunded status or a liability for a plan’s underfunded status; (b) measure aplan’s assets and its obligations that determine its funded status as of the end of the employer’s fiscalyear; and (c) recognize changes in the funded status of a defined benefit postretirement plan in theyear in which the changes occur. Those changes are reported in other comprehensive income. Therequirement to recognize the funded status of a benefit plan and the disclosure requirements areeffective as of the end of the fiscal year ending after December 15, 2006 for companies with publiclytraded equity securities. The requirement to measure plan assets and benefit obligations as of the dateof the employer’s fiscal year-end statement of financial position is effective for fiscal years ending afterDecember 15, 2008, although earlier adoption is permitted. As a result of the requirement to recognizethe funded status of the Company benefit plans as of December 31, 2006, the Company recorded anincrease in its pension liability of approximately $8.3 million, a decrease of approximately $1.3 millionin other assets: other, net and a decrease in accumulated other comprehensive income of approximately$5.8 million, net of tax. The Company has early-adopted the measurement date provisions of FAS 158effective January 1, 2007. The Company’s pension plans previously used a September 30 measurementdate. All plans are now measured as of December 31, consistent with the Company’s fiscal year end.
73
Watts Water Technologies, Inc. and Subsidiaries
Notes to Consolidated Financial Statements (Continued)
(2) Accounting Policies (Continued)
The non-cash effect of the adoption of the measurement date provisions of FAS 158 was not materialand there was no effect on the Company’s results of operations.
In July 2006, the FASB issued Financial Interpretation No. 48, ‘‘Accounting for Uncertainty inIncome Taxes,’’ (FIN 48), which clarifies the accounting for uncertainty in income taxes recognized inthe financial statements in accordance with SFAS No. 109, ‘‘Accounting for Income Taxes.’’ FIN 48provides that a tax benefit from an uncertain tax position may be recognized when it is more likelythan not that the position will be sustained upon examination, based on the technical merits. Thisinterpretation also provides guidance on measurement, de-recognition, classification, interest andpenalties, accounting in interim periods, disclosure and transition. FIN 48 was effective for fiscal yearsbeginning after December 15, 2006. The Company adopted the provisions of FIN 48 for fiscal year2007 and the impact was not material to its consolidated financial statements.
In March 2006, the FASB issued FAS No. 156 ‘‘Accounting for Servicing of Financial Assets—anamendment of FASB Statement No. 140,’’ (FAS 156). FAS 156 amends FAS Statement No.140,‘‘Accounting for Transfers and Servicing of Financial Assets and Extinguishments of Liabilities,’’ withrespect to the accounting for separately recognized servicing assets and servicing liabilities. FAS 156addresses the recognition and measurement of separately recognized servicing assets and liabilities andprovides an approach to simplify efforts to obtain hedge-like (offset) accounting. The Companyadopted the provisions of FAS 156 for fiscal year 2007 and the impact was not material to itsconsolidated financial statements.
In February 2006, the FASB issued FAS No. 155 ‘‘Accounting for Certain Hybrid FinancialInstruments—an amendment of FASB Statements No. 133 and 140’’ (FAS 155). FAS 155 amendsFAS 133, ‘‘Accounting for Derivatives and Hedging Activities,’’ and FAS 140, ‘‘Accounting for Transfersand Servicing of Financial Assets and Extinguishments of Liabilities,’’ and allows an entity to remeasureat fair value a hybrid financial instrument that contains an embedded derivative that otherwise wouldrequire bifurcation from the host, if the holder irrevocably elects to account for the whole instrumenton a fair value basis. Subsequent changes in the fair value of the instrument would be recognized inearnings. The Company adopted the provisions of FAS 155 for fiscal year 2007 and the impact was notmaterial to its consolidated financial statements.
In May 2005, the FASB issued FAS No. 154, ‘‘Accounting Changes and Error CorrectionReplacement of APB Opinion No. 20 and FASB Statement No. 3’’ (FAS 154). FAS 154 replaces APBOpinion No. 20, ‘‘Accounting Changes’’ (APB 20), and FASB Statement No. 3, ‘‘Reporting AccountingChanges in Interim Financial Statements,’’ and changes the requirements for the accounting for andreporting of a change in accounting principle. APB 20 previously required that most voluntary changesin accounting principles be recognized by including in net income of the period of the change thecumulative effect of changing to the new accounting principle. FAS 154 requires retrospectiveapplication to prior periods’ financial statements of changes in accounting principle. FAS 154 definesretrospective application as the application of a different accounting principle to prior accountingperiods as if that principle had always been used. FAS 154 also requires that a change in depreciation,amortization, or depletion method for long-lived, non-financial assets be accounted for as a change inaccounting estimate affected by a change in accounting principle. The impact was not material to itsconsolidated financial statements.
In December 2004, the FASB issued FAS No. 153, ‘‘Exchanges of Nonmonetary Assets, anamendment of APB Opinion No. 29, Accounting for Nonmonetary Transactions’’ (FAS 153). Theamendments made by FAS 153 are based on the principle that exchanges of nonmonetary assets should
74
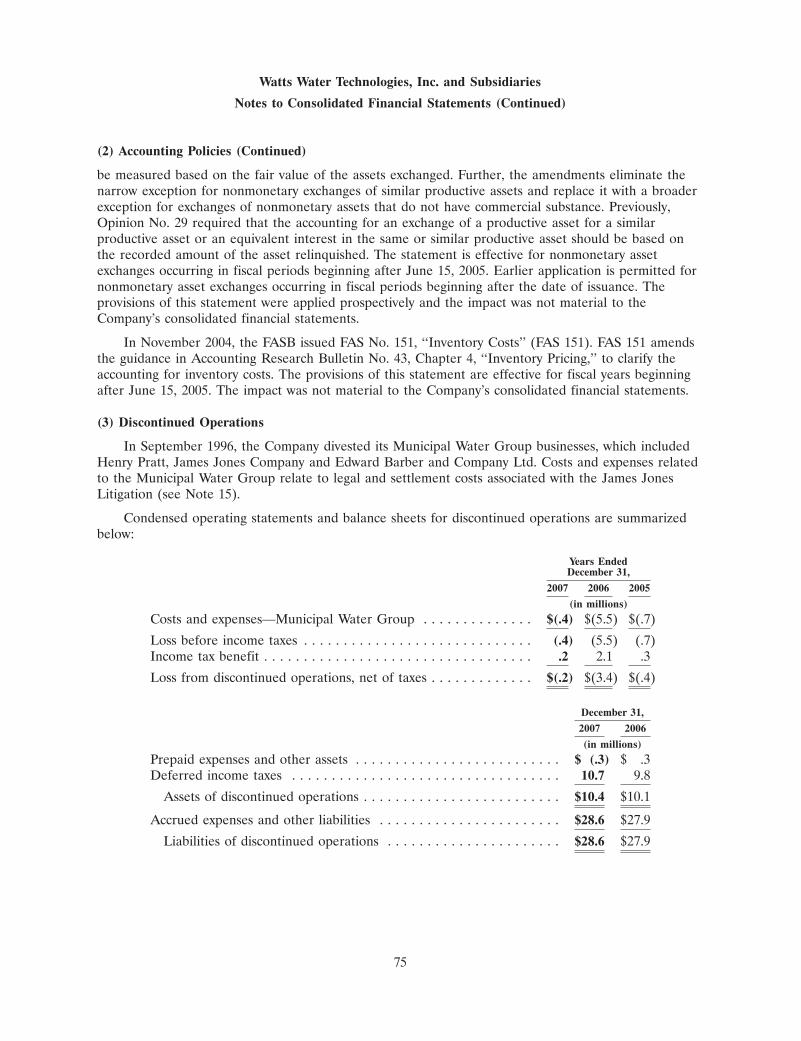
Watts Water Technologies, Inc. and Subsidiaries
Notes to Consolidated Financial Statements (Continued)
(2) Accounting Policies (Continued)
be measured based on the fair value of the assets exchanged. Further, the amendments eliminate thenarrow exception for nonmonetary exchanges of similar productive assets and replace it with a broaderexception for exchanges of nonmonetary assets that do not have commercial substance. Previously,Opinion No. 29 required that the accounting for an exchange of a productive asset for a similarproductive asset or an equivalent interest in the same or similar productive asset should be based onthe recorded amount of the asset relinquished. The statement is effective for nonmonetary assetexchanges occurring in fiscal periods beginning after June 15, 2005. Earlier application is permitted fornonmonetary asset exchanges occurring in fiscal periods beginning after the date of issuance. Theprovisions of this statement were applied prospectively and the impact was not material to theCompany’s consolidated financial statements.
In November 2004, the FASB issued FAS No. 151, ‘‘Inventory Costs’’ (FAS 151). FAS 151 amendsthe guidance in Accounting Research Bulletin No. 43, Chapter 4, ‘‘Inventory Pricing,’’ to clarify theaccounting for inventory costs. The provisions of this statement are effective for fiscal years beginningafter June 15, 2005. The impact was not material to the Company’s consolidated financial statements.
(3) Discontinued Operations
In September 1996, the Company divested its Municipal Water Group businesses, which includedHenry Pratt, James Jones Company and Edward Barber and Company Ltd. Costs and expenses relatedto the Municipal Water Group relate to legal and settlement costs associated with the James JonesLitigation (see Note 15).
Condensed operating statements and balance sheets for discontinued operations are summarizedbelow:
Years EndedDecember 31,
2007 2006 2005
(in millions)
Costs and expenses—Municipal Water Group . . . . . . . . . . . . . . $(.4) $(5.5) $(.7)
Loss before income taxes . . . . . . . . . . . . . . . . . . . . . . . . . . . . . (.4) (5.5) (.7)Income tax benefit . . . . . . . . . . . . . . . . . . . . . . . . . . . . . . . . . . .2 2.1 .3
Loss from discontinued operations, net of taxes . . . . . . . . . . . . . $(.2) $(3.4) $(.4)
December 31,
2007 2006
(in millions)
Prepaid expenses and other assets . . . . . . . . . . . . . . . . . . . . . . . . . . $ (.3) $ .3Deferred income taxes . . . . . . . . . . . . . . . . . . . . . . . . . . . . . . . . . . 10.7 9.8
Assets of discontinued operations . . . . . . . . . . . . . . . . . . . . . . . . . $10.4 $10.1
Accrued expenses and other liabilities . . . . . . . . . . . . . . . . . . . . . . . $28.6 $27.9
Liabilities of discontinued operations . . . . . . . . . . . . . . . . . . . . . . $28.6 $27.9
75
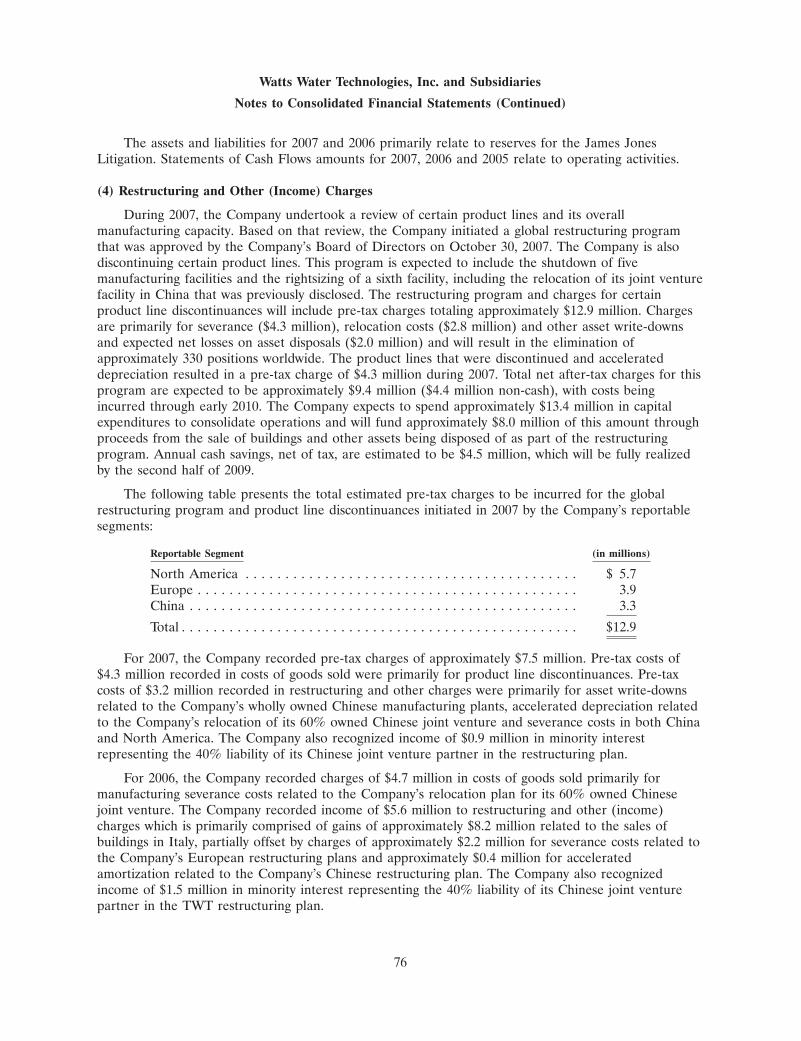
Watts Water Technologies, Inc. and Subsidiaries
Notes to Consolidated Financial Statements (Continued)
The assets and liabilities for 2007 and 2006 primarily relate to reserves for the James JonesLitigation. Statements of Cash Flows amounts for 2007, 2006 and 2005 relate to operating activities.
(4) Restructuring and Other (Income) Charges
During 2007, the Company undertook a review of certain product lines and its overallmanufacturing capacity. Based on that review, the Company initiated a global restructuring programthat was approved by the Company’s Board of Directors on October 30, 2007. The Company is alsodiscontinuing certain product lines. This program is expected to include the shutdown of fivemanufacturing facilities and the rightsizing of a sixth facility, including the relocation of its joint venturefacility in China that was previously disclosed. The restructuring program and charges for certainproduct line discontinuances will include pre-tax charges totaling approximately $12.9 million. Chargesare primarily for severance ($4.3 million), relocation costs ($2.8 million) and other asset write-downsand expected net losses on asset disposals ($2.0 million) and will result in the elimination ofapproximately 330 positions worldwide. The product lines that were discontinued and accelerateddepreciation resulted in a pre-tax charge of $4.3 million during 2007. Total net after-tax charges for thisprogram are expected to be approximately $9.4 million ($4.4 million non-cash), with costs beingincurred through early 2010. The Company expects to spend approximately $13.4 million in capitalexpenditures to consolidate operations and will fund approximately $8.0 million of this amount throughproceeds from the sale of buildings and other assets being disposed of as part of the restructuringprogram. Annual cash savings, net of tax, are estimated to be $4.5 million, which will be fully realizedby the second half of 2009.
The following table presents the total estimated pre-tax charges to be incurred for the globalrestructuring program and product line discontinuances initiated in 2007 by the Company’s reportablesegments:
Reportable Segment (in millions)
North America . . . . . . . . . . . . . . . . . . . . . . . . . . . . . . . . . . . . . . . . . . $ 5.7Europe . . . . . . . . . . . . . . . . . . . . . . . . . . . . . . . . . . . . . . . . . . . . . . . . 3.9China . . . . . . . . . . . . . . . . . . . . . . . . . . . . . . . . . . . . . . . . . . . . . . . . . 3.3
Total . . . . . . . . . . . . . . . . . . . . . . . . . . . . . . . . . . . . . . . . . . . . . . . . . . $12.9
For 2007, the Company recorded pre-tax charges of approximately $7.5 million. Pre-tax costs of$4.3 million recorded in costs of goods sold were primarily for product line discontinuances. Pre-taxcosts of $3.2 million recorded in restructuring and other charges were primarily for asset write-downsrelated to the Company’s wholly owned Chinese manufacturing plants, accelerated depreciation relatedto the Company’s relocation of its 60% owned Chinese joint venture and severance costs in both Chinaand North America. The Company also recognized income of $0.9 million in minority interestrepresenting the 40% liability of its Chinese joint venture partner in the restructuring plan.
For 2006, the Company recorded charges of $4.7 million in costs of goods sold primarily formanufacturing severance costs related to the Company’s relocation plan for its 60% owned Chinesejoint venture. The Company recorded income of $5.6 million to restructuring and other (income)charges which is primarily comprised of gains of approximately $8.2 million related to the sales ofbuildings in Italy, partially offset by charges of approximately $2.2 million for severance costs related tothe Company’s European restructuring plans and approximately $0.4 million for acceleratedamortization related to the Company’s Chinese restructuring plan. The Company also recognizedincome of $1.5 million in minority interest representing the 40% liability of its Chinese joint venturepartner in the TWT restructuring plan.
76
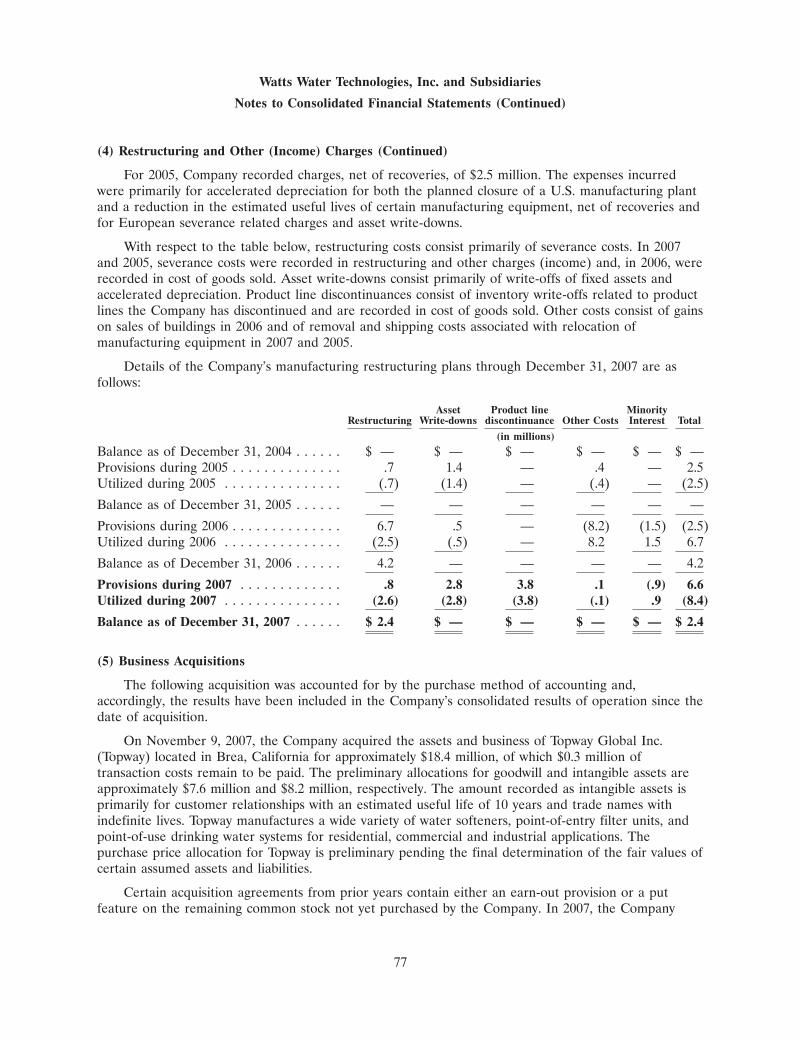
Watts Water Technologies, Inc. and Subsidiaries
Notes to Consolidated Financial Statements (Continued)
(4) Restructuring and Other (Income) Charges (Continued)
For 2005, Company recorded charges, net of recoveries, of $2.5 million. The expenses incurredwere primarily for accelerated depreciation for both the planned closure of a U.S. manufacturing plantand a reduction in the estimated useful lives of certain manufacturing equipment, net of recoveries andfor European severance related charges and asset write-downs.
With respect to the table below, restructuring costs consist primarily of severance costs. In 2007and 2005, severance costs were recorded in restructuring and other charges (income) and, in 2006, wererecorded in cost of goods sold. Asset write-downs consist primarily of write-offs of fixed assets andaccelerated depreciation. Product line discontinuances consist of inventory write-offs related to productlines the Company has discontinued and are recorded in cost of goods sold. Other costs consist of gainson sales of buildings in 2006 and of removal and shipping costs associated with relocation ofmanufacturing equipment in 2007 and 2005.
Details of the Company’s manufacturing restructuring plans through December 31, 2007 are asfollows:
Asset Product line MinorityRestructuring Write-downs discontinuance Other Costs Interest Total
(in millions)
Balance as of December 31, 2004 . . . . . . $ — $ — $ — $ — $ — $ —Provisions during 2005 . . . . . . . . . . . . . . .7 1.4 — .4 — 2.5Utilized during 2005 . . . . . . . . . . . . . . . (.7) (1.4) — (.4) — (2.5)
Balance as of December 31, 2005 . . . . . . — — — — — —
Provisions during 2006 . . . . . . . . . . . . . . 6.7 .5 — (8.2) (1.5) (2.5)Utilized during 2006 . . . . . . . . . . . . . . . (2.5) (.5) — 8.2 1.5 6.7
Balance as of December 31, 2006 . . . . . . 4.2 — — — — 4.2
Provisions during 2007 . . . . . . . . . . . . . .8 2.8 3.8 .1 (.9) 6.6Utilized during 2007 . . . . . . . . . . . . . . . (2.6) (2.8) (3.8) (.1) .9 (8.4)
Balance as of December 31, 2007 . . . . . . $ 2.4 $ — $ — $ — $ — $ 2.4
(5) Business Acquisitions
The following acquisition was accounted for by the purchase method of accounting and,accordingly, the results have been included in the Company’s consolidated results of operation since thedate of acquisition.
On November 9, 2007, the Company acquired the assets and business of Topway Global Inc.(Topway) located in Brea, California for approximately $18.4 million, of which $0.3 million oftransaction costs remain to be paid. The preliminary allocations for goodwill and intangible assets areapproximately $7.6 million and $8.2 million, respectively. The amount recorded as intangible assets isprimarily for customer relationships with an estimated useful life of 10 years and trade names withindefinite lives. Topway manufactures a wide variety of water softeners, point-of-entry filter units, andpoint-of-use drinking water systems for residential, commercial and industrial applications. Thepurchase price allocation for Topway is preliminary pending the final determination of the fair values ofcertain assumed assets and liabilities.
Certain acquisition agreements from prior years contain either an earn-out provision or a putfeature on the remaining common stock not yet purchased by the Company. In 2007, the Company
77
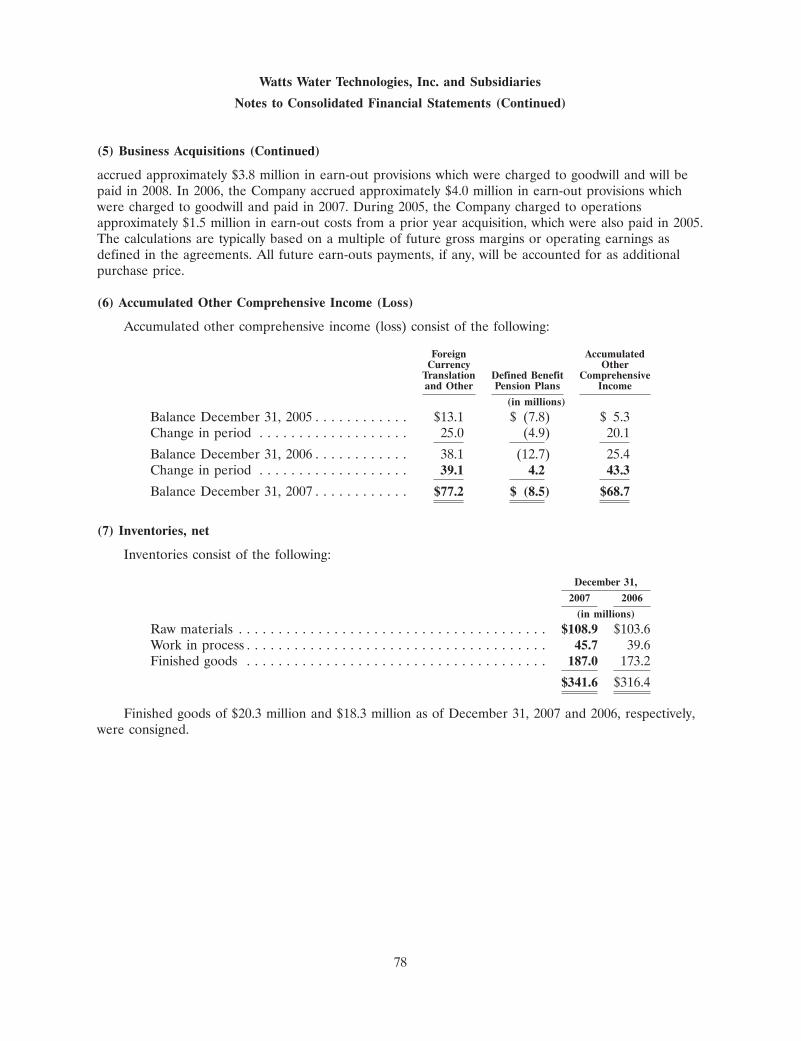
Watts Water Technologies, Inc. and Subsidiaries
Notes to Consolidated Financial Statements (Continued)
(5) Business Acquisitions (Continued)
accrued approximately $3.8 million in earn-out provisions which were charged to goodwill and will bepaid in 2008. In 2006, the Company accrued approximately $4.0 million in earn-out provisions whichwere charged to goodwill and paid in 2007. During 2005, the Company charged to operationsapproximately $1.5 million in earn-out costs from a prior year acquisition, which were also paid in 2005.The calculations are typically based on a multiple of future gross margins or operating earnings asdefined in the agreements. All future earn-outs payments, if any, will be accounted for as additionalpurchase price.
(6) Accumulated Other Comprehensive Income (Loss)
Accumulated other comprehensive income (loss) consist of the following:
Foreign AccumulatedCurrency Other
Translation Defined Benefit Comprehensiveand Other Pension Plans Income
(in millions)
Balance December 31, 2005 . . . . . . . . . . . . $13.1 $ (7.8) $ 5.3Change in period . . . . . . . . . . . . . . . . . . . 25.0 (4.9) 20.1
Balance December 31, 2006 . . . . . . . . . . . . 38.1 (12.7) 25.4Change in period . . . . . . . . . . . . . . . . . . . 39.1 4.2 43.3
Balance December 31, 2007 . . . . . . . . . . . . $77.2 $ (8.5) $68.7
(7) Inventories, net
Inventories consist of the following:
December 31,
2007 2006
(in millions)
Raw materials . . . . . . . . . . . . . . . . . . . . . . . . . . . . . . . . . . . . . . . $108.9 $103.6Work in process . . . . . . . . . . . . . . . . . . . . . . . . . . . . . . . . . . . . . . 45.7 39.6Finished goods . . . . . . . . . . . . . . . . . . . . . . . . . . . . . . . . . . . . . . 187.0 173.2
$341.6 $316.4
Finished goods of $20.3 million and $18.3 million as of December 31, 2007 and 2006, respectively,were consigned.
78
Watts Water Technologies, Inc. and Subsidiaries
Notes to Consolidated Financial Statements (Continued)
(8) Property, Plant and Equipment
Property, plant and equipment consists of the following:
December 31,
2007 2006
(in millions)
Land . . . . . . . . . . . . . . . . . . . . . . . . . . . . . . . . . . . . . . . . . . . . $ 13.7 $ 12.5Buildings and improvements . . . . . . . . . . . . . . . . . . . . . . . . . . . 132.6 124.3Machinery and equipment . . . . . . . . . . . . . . . . . . . . . . . . . . . . . 270.5 247.4Construction in progress . . . . . . . . . . . . . . . . . . . . . . . . . . . . . . 20.6 7.7
437.4 391.9Accumulated depreciation . . . . . . . . . . . . . . . . . . . . . . . . . . . . . (213.7) (185.7)
$ 223.7 $ 206.2
(9) Income Taxes
The significant components of the Company’s deferred income tax liabilities and assets are asfollows:
December 31,
2007 2006
(in millions)
Deferred income tax liabilities:Excess tax over book depreciation . . . . . . . . . . . . . . . . . . . . . . . . $15.3 $16.0Intangibles . . . . . . . . . . . . . . . . . . . . . . . . . . . . . . . . . . . . . . . . . 23.5 18.8Other . . . . . . . . . . . . . . . . . . . . . . . . . . . . . . . . . . . . . . . . . . . . . 12.4 11.1
Total deferred tax liabilities . . . . . . . . . . . . . . . . . . . . . . . . . . . . 51.2 45.9Deferred income tax assets:
Accrued expenses . . . . . . . . . . . . . . . . . . . . . . . . . . . . . . . . . . . . 22.0 17.0Net operating loss carry-forward . . . . . . . . . . . . . . . . . . . . . . . . . . 3.2 3.4Inventory reserves . . . . . . . . . . . . . . . . . . . . . . . . . . . . . . . . . . . . 13.7 8.0Other . . . . . . . . . . . . . . . . . . . . . . . . . . . . . . . . . . . . . . . . . . . . . 10.7 9.7
Total deferred tax assets . . . . . . . . . . . . . . . . . . . . . . . . . . . . . . 49.6 38.1Less: valuation allowance . . . . . . . . . . . . . . . . . . . . . . . . . . . . . . . . (3.2) —
Net deferred tax assets . . . . . . . . . . . . . . . . . . . . . . . . . . . . . . . . . 46.4 38.1
Net deferred tax liabilities . . . . . . . . . . . . . . . . . . . . . . . . . . . . . . $(4.8) $(7.8)
The provision for income taxes from continuing operations is based on the following pre-taxincome:
Years Ended December 31,
2007 2006 2005
(in millions)
Domestic . . . . . . . . . . . . . . . . . . . . . . . . . . . . . . . . . . . . . $ 47.6 $ 49.6 $46.4Foreign . . . . . . . . . . . . . . . . . . . . . . . . . . . . . . . . . . . . . . 66.2 66.5 39.4
$113.8 $116.1 $85.8
79
Watts Water Technologies, Inc. and Subsidiaries
Notes to Consolidated Financial Statements (Continued)
(9) Income Taxes (Continued)
The provision for income taxes from continuing operations consists of the following:
Years EndedDecember 31,
2007 2006 2005
(in millions)
Current tax expense:Federal . . . . . . . . . . . . . . . . . . . . . . . . . . . . . . . . . . . . . . $19.2 $18.0 $15.2Foreign . . . . . . . . . . . . . . . . . . . . . . . . . . . . . . . . . . . . . . 20.4 20.5 14.0State . . . . . . . . . . . . . . . . . . . . . . . . . . . . . . . . . . . . . . . . 4.8 4.1 3.5
44.4 42.6 32.7
Deferred tax expense (benefit):Federal . . . . . . . . . . . . . . . . . . . . . . . . . . . . . . . . . . . . . . (5.7) (1.7) (1.0)Foreign . . . . . . . . . . . . . . . . . . . . . . . . . . . . . . . . . . . . . . (1.2) (1.5) (.7)State . . . . . . . . . . . . . . . . . . . . . . . . . . . . . . . . . . . . . . . . (1.3) (.4) (.2)
(8.2) (3.6) (1.9)
$36.2 $39.0 $30.8
Actual income taxes reported from continuing operations are different than would have beencomputed by applying the federal statutory tax rate to income from continuing operations beforeincome taxes. The reasons for this difference are as follows:
Years EndedDecember 31,
2007 2006 2005
(in millions)
Computed expected federal income expense . . . . . . . . . . . . . $39.8 $40.6 $30.0State income taxes, net of federal tax benefit . . . . . . . . . . . . 2.3 2.4 2.1Foreign tax rate differential . . . . . . . . . . . . . . . . . . . . . . . . . (7.2) (4.4) (.5)Valuation allowance . . . . . . . . . . . . . . . . . . . . . . . . . . . . . . . 3.2 — —Other, net . . . . . . . . . . . . . . . . . . . . . . . . . . . . . . . . . . . . . . (1.9) .4 (.8)
$36.2 $39.0 $30.8
At December 31, 2007, the Company has foreign net operating loss carry forwards of $16.9 millionfor income tax purposes. All of the net operating losses are foreign losses. $7.0 million of the losses canbe carried forward indefinitely and $4.8 million of the losses expires in 2013 and $5.1 million of thelosses expire in 2016. The net operating losses consist of $5.5 million related to German operations,$1.5 million to Austrian operations, $5.1 million to Netherlands operations and $4.8 million related toChinese operations.
The Company has a valuation allowance of $3.2 million related to its deferred tax assets at itsChinese joint venture.
The Company believes that it is more likely than not that it will be able to recover the netdeferred tax assets.
Undistributed earnings of the Company’s foreign subsidiaries amounted to approximately$251.6 million, $168.9 million and $163.1 million at December 31, 2007, 2006 and 2005, respectively.
80
Watts Water Technologies, Inc. and Subsidiaries
Notes to Consolidated Financial Statements (Continued)
(9) Income Taxes (Continued)
Those earnings are considered to be indefinitely reinvested and, accordingly, no provision for U.S.federal and state income taxes has been recorded thereon. Upon distribution of those earnings, in theform of dividends or otherwise, the Company will be subject to withholding taxes payable to the variousforeign countries. Determination of the amount of U.S. income tax liability that would be incurred isnot practicable because of the complexities associated with its hypothetical calculation; however,unrecognized foreign tax credits would be available to reduce some portion of any U.S. income taxliability. Withholding taxes of approximately $5.4 million would be payable upon remittance of allpreviously unremitted earnings at December 31, 2007.
(10) Accrued Expenses and Other Liabilities
Accrued expenses and other liabilities consist of the following:
December 31,
2007 2006
(in millions)
Commissions and sales incentives payable . . . . . . . . . . . . . . . . . . . $ 42.6 $ 37.0Accrued insurance . . . . . . . . . . . . . . . . . . . . . . . . . . . . . . . . . . . . 26.1 15.0Other . . . . . . . . . . . . . . . . . . . . . . . . . . . . . . . . . . . . . . . . . . . . . 38.5 39.3Income taxes payable . . . . . . . . . . . . . . . . . . . . . . . . . . . . . . . . . . 6.4 9.1
$113.6 $100.4
(11) Financing Arrangements
Long-term debt consists of the following:
December 31,
2007 2006
(in millions)
5.85% notes due April 2016 . . . . . . . . . . . . . . . . . . . . . . . . . . . . . $225.0 $225.04.87% notes due May 2010 . . . . . . . . . . . . . . . . . . . . . . . . . . . . . . 50.0 50.05.47% notes due May 2013 . . . . . . . . . . . . . . . . . . . . . . . . . . . . . . 75.0 75.0$350.0 million Revolving Credit Facility maturing in April 2011.
Eurocurrency rate loans interest accruing at LIBOR or EuroLIBOR plus an applicable percentage (Euro LIBOR at 4.7%and 3.6% at December 31, 2007 and 2006, respectively) AtDecember 31, 2007, $81.8 million was for euro based borrowingsand there were no outstanding U.S. borrowings. AtDecember 31, 2006, $91.1 million were for euro basedborrowings and there were no outstanding U.S. borrowings . . . . . 81.8 91.1
Other—consists primarily of European borrowings (at interest ratesranging from 3.3% to 8.5%) . . . . . . . . . . . . . . . . . . . . . . . . . . . 1.7 8.1
433.5 449.2Less Current Maturities . . . . . . . . . . . . . . . . . . . . . . . . . . . . . . . . 1.3 7.5
$432.2 $441.7
81
Watts Water Technologies, Inc. and Subsidiaries
Notes to Consolidated Financial Statements (Continued)
(11) Financing Arrangements (Continued)
Principal payments during each of the next five years and thereafter are due as follows (inmillions): 2008—$1.3; 2009—$0.2; 2010—$50.2; 2011—$81.8; 2012—$0 and thereafter—$300.0.
The Company maintains letters of credit that guarantee its performance or payment to thirdparties in accordance with specified terms and conditions. Amounts outstanding were approximately$45.0 million as of December 31, 2007 and $49.6 million as of December 31, 2006. The Company’sletters of credit are primarily associated with insurance coverage and to a lesser extent foreignpurchases. The Company’s letters of credit generally expire within one year of issuance and are drawndown against the revolving credit facility. These instruments may exist or expire without being drawndown. Therefore, they do not necessarily represent future cash flow obligations.
On April 27, 2006, the Company completed a private placement of $225.0 million of 5.85% seniorunsecured notes due April 2016 (the 2006 Note Purchase Agreement). The 2006 Note PurchaseAgreement includes operational and financial covenants, with which the Company is required tocomply, including, among others, maintenance of certain financial ratios and restrictions on additionalindebtedness, liens and dispositions. Events of default under the 2006 Note Purchase Agreementinclude failure to comply with its financial and operational covenants, as well as bankruptcy and otherinsolvency events. The Company may, at its option, upon notice to the noteholders, prepay at any timeall or part of the Notes in an amount not less than $1 million by paying the principal amount plus amake-whole amount, which is dependent upon the yield of respective U.S. Treasury Securities. TheCompany used the net proceeds from the private placement to repay $147.0 million outstanding underits revolving credit facility. The balance of the net proceeds will be used to finance future acquisitionsand for general corporate purposes. As of December 31, 2007, the Company was in compliance with allcovenants related to the 2006 Note Purchase Agreement. The payment of interest on the seniorunsecured notes is due semi-annually on April 30th and October 30th of each year. Additionally, theCompany amended its 2003 Note Purchase Agreement to reflect the existence of the subsidiaryguarantors and to substantially conform certain provisions of the 2003 Note Purchase Agreement to the2006 Note Purchase Agreement.
On April 27, 2006, the Company amended and restated its unsecured revolving credit facility witha syndicate of banks (as amended, the revolving credit facility). The revolving credit facility provides formulti-currency unsecured borrowings and stand-by letters of credit of up to $350.0 million and expiresin April 2011. Borrowings outstanding under the revolving credit facility bear interest at a fluctuatingrate per annum equal to an applicable percentage equal to (i) in the case of Eurocurrency rate loans,the British Bankers Association LIBOR rate plus an applicable percentage of 0.625%, which isdetermined by reference to the Company’s consolidated leverage ratio and debt rating, or (ii) in thecase of base rate loans and swing line loans, the higher of (a) the federal funds rate plus 0.5% and(b) the rate of interest in effect for such day as announced by Bank of America, N.A. as its ‘‘primerate.’’ For 2007, the average interest rate under the revolving credit facility for euro-based borrowingswas approximately 4.6%. The revolving credit facility includes operational and financial covenantscustomary for facilities of this type, including, among others, restrictions on additional indebtedness,liens and investments and maintenance of certain leverage ratios. As of December 31, 2007, theCompany was in compliance with all covenants related to the revolving credit facility; had$234.4 million of unused and potentially available credit under the revolving credit facility; had no U.Sdollar denominated debt and $81.8 million of euro-based borrowings outstanding on its revolving creditfacility; and had $33.8 million for stand-by letters of credit outstanding on its revolving credit facility.
At the closing of the Dormont acquisition, Dormont had long-term debt outstanding of$8.9 million in the form of two series of taxable variable rate demand bonds (1998 Series with
82
Watts Water Technologies, Inc. and Subsidiaries
Notes to Consolidated Financial Statements (Continued)
(11) Financing Arrangements (Continued)
$1.5 million outstanding and the 2000 Series with $7.4 million outstanding) which, due to the provisionsof the trust agreements, could only be redeemed at dates subsequent to the closing. Each of thesebonds was secured by a letter of credit from a bank, which maintained a security interest in the assetsof Dormont. As a condition of the purchase and to gain the bank’s consent to the sale of Dormont tothe Company, Dormont’s former owners were required to establish a cash collateral account for thebonds in an amount equal to the potential obligation of Dormont to the bank under the letter of creditreimbursement agreements. The entire obligation under the bonds approximates $9.1 million, whichrepresents the $8.9 million in bond principal plus interest and related fees. At closing, a portion of theDormont purchase price was placed in a cash collateral account as a guarantee of payment. TheCompany recorded this escrow deposit in prepaid expenses and other assets at December 31, 2005. The1998 series bonds were repaid in full on January 17, 2006 and the 2000 series bonds were repaid in fullon February 1, 2006 by the former owners using the cash collateral account.
Effective July 1, 2005, the Company entered into a three-year interest rate swap with a counterparty for a notional amount of A25.0 million, which was outstanding under the revolving credit facility.The Company swapped three-month EURIBOR plus 0.6% for a fixed rate of 3.02%. The change in thefair value of the swap during 2006 approximated $0.7 million and was recorded as a reduction ofinterest expense in 2006. The swap was terminated on October 3, 2006.
On May 15, 2003, the Company completed a private placement of $125.0 million of seniorunsecured notes consisting of $50.0 million principal amount of 4.87% senior notes due 2010 and$75.0 million principal amount of 5.47% senior notes due 2013. The payment of interest on the seniorunsecured notes is due semi-annually on May 15th and November 15th of each year. The seniorunsecured notes were issued by Watts Water Technologies, Inc. and are pari passu with the revolvingcredit facility, which is at the subsidiary level. The senior unsecured notes allow the Company to have(i) debt senior to the notes in an amount up to $150.0 million plus 5% of stockholders’ equity and(ii) debt pari passu or junior to the senior unsecured notes to the extent the Company maintainscompliance with a 2.00 to 1.00 fixed charge coverage ratio. The notes include a prepayment provisionwhich might require a make-whole payment to the note holders. Such payment is dependent upon thelevel of the respective treasuries. The notes include other customary terms and conditions, includingevents of default.
(12) Common Stock
The Class A Common Stock and Class B Common Stock have equal dividend and liquidationrights. Each share of the Company’s Class A Common Stock is entitled to one vote on all matterssubmitted to stockholders and each share of Class B Common Stock is entitled to ten votes on all suchmatters. Shares of Class B Common Stock are convertible into shares of Class A Common Stock, on aone-to-one basis, at the option of the holder. As of December 31, 2007, the Company has reserved atotal of 4,611,899 of Class A Common Stock for issuance under its stock-based compensation plans and7,293,880 shares for conversion of Class B Common Stock to Class A Common Stock.
In February 2007, the Company’s Board of Directors adopted an amendment, which wassubsequently approved by the Company’s stockholders, to increase the number shares of Class ACommon Stock available to be granted under the Company’s Management Stock Purchase Plan from1,000,000 shares to 2,000,000 shares.
83
Watts Water Technologies, Inc. and Subsidiaries
Notes to Consolidated Financial Statements (Continued)
(12) Common Stock (Continued)
In November 2007, the Company announced that its Board of Directors had authorized arepurchase of up to 3,000,000 shares of its Class A Common Stock. As of December 31, 2007, theCompany had repurchased 867,451 shares of stock for a total cost of $25.0 million.
(13) Stock-Based Compensation
The Company maintains three stock incentive plans under which key employees and outsidedirectors have been granted incentive stock options (ISOs) and nonqualified stock options (NSOs) topurchase the Company’s Class A Common Stock. Only one plan, the 2004 Stock Incentive Plan, iscurrently available for the grant of new equity awards. Stock options granted under prior plans becameexercisable over a five-year period at the rate of 20% per year and expire ten years after the date ofgrant. Under the 2004 Stock Incentive Plan, options become exercisable over a four-year period at therate of 25% per year and expire ten years after the grant date. ISOs and NSOs granted under the plansmay have exercise prices of not less than 100% and 50% of the fair market value of the Class ACommon Stock on the date of grant, respectively. The Company’s current practice is to grant alloptions at fair market value on the grant date. At December 31, 2007, 3,078,132 shares of Class ACommon Stock were authorized for future grants of new equity awards under the Company’s stockincentive plans.
The Company also grants shares of restricted stock to key employees and non-employee membersof the Company’s Board of Directors under the 2004 Stock Incentive Plan, which vest eitherimmediately or over a three-year period at the rate of one-third per year. The restricted stock awardsare amortized to expense on a straight-line basis over the vesting period.
The Company also has a Management Stock Purchase Plan that allows for the granting ofrestricted stock units (RSUs) to key employees. On an annual basis, key employees may elect to receivea portion of their annual incentive compensation in RSUs instead of cash. Each RSU provides the keyemployee with the right to purchase a share of Class A Common Stock at 67% of the fair market valueon the date of grant. RSUs vest annually over a three-year period from the grant date. An aggregate of2,000,000 shares of Class A Common Stock may be issued under the Management Stock Purchase Plan.
2004 Stock Incentive Plan
At December 31, 2007, total unrecognized compensation cost related to the unvested stock optionswas approximately $4.4 million with a total weighted average remaining term of 2.6 years. For 2007 and2006, the Company recognized compensation cost of $2.7 million and $1.4 million, respectively, inselling, general and administrative expenses.
84
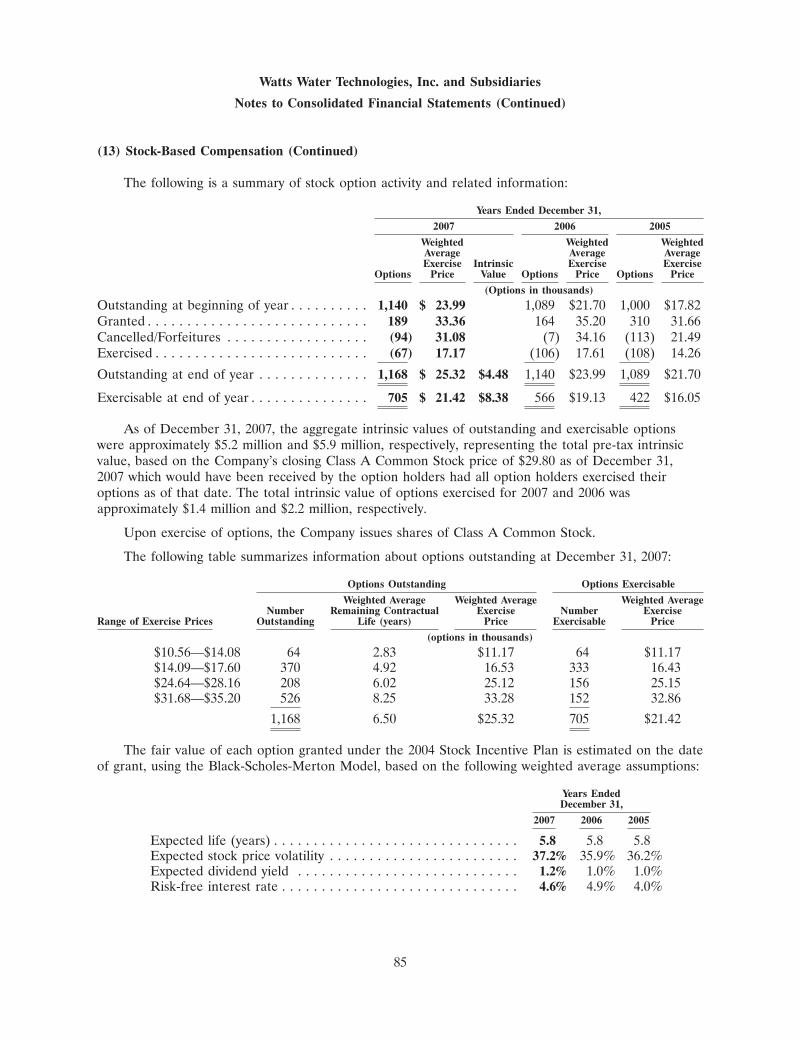
Watts Water Technologies, Inc. and Subsidiaries
Notes to Consolidated Financial Statements (Continued)
(13) Stock-Based Compensation (Continued)
The following is a summary of stock option activity and related information:
Years Ended December 31,
2007 2006 2005
Weighted Weighted WeightedAverage Average AverageExercise Intrinsic Exercise Exercise
Options Price Value Options Price Options Price
(Options in thousands)
Outstanding at beginning of year . . . . . . . . . . 1,140 $ 23.99 1,089 $21.70 1,000 $17.82Granted . . . . . . . . . . . . . . . . . . . . . . . . . . . . 189 33.36 164 35.20 310 31.66Cancelled/Forfeitures . . . . . . . . . . . . . . . . . . (94) 31.08 (7) 34.16 (113) 21.49Exercised . . . . . . . . . . . . . . . . . . . . . . . . . . . (67) 17.17 (106) 17.61 (108) 14.26
Outstanding at end of year . . . . . . . . . . . . . . 1,168 $ 25.32 $4.48 1,140 $23.99 1,089 $21.70
Exercisable at end of year . . . . . . . . . . . . . . . 705 $ 21.42 $8.38 566 $19.13 422 $16.05
As of December 31, 2007, the aggregate intrinsic values of outstanding and exercisable optionswere approximately $5.2 million and $5.9 million, respectively, representing the total pre-tax intrinsicvalue, based on the Company’s closing Class A Common Stock price of $29.80 as of December 31,2007 which would have been received by the option holders had all option holders exercised theiroptions as of that date. The total intrinsic value of options exercised for 2007 and 2006 wasapproximately $1.4 million and $2.2 million, respectively.
Upon exercise of options, the Company issues shares of Class A Common Stock.
The following table summarizes information about options outstanding at December 31, 2007:
Options Outstanding Options Exercisable
Weighted Average Weighted Average Weighted AverageNumber Remaining Contractual Exercise Number Exercise
Range of Exercise Prices Outstanding Life (years) Price Exercisable Price
(options in thousands)
$10.56—$14.08 64 2.83 $11.17 64 $11.17$14.09—$17.60 370 4.92 16.53 333 16.43$24.64—$28.16 208 6.02 25.12 156 25.15$31.68—$35.20 526 8.25 33.28 152 32.86
1,168 6.50 $25.32 705 $21.42
The fair value of each option granted under the 2004 Stock Incentive Plan is estimated on the dateof grant, using the Black-Scholes-Merton Model, based on the following weighted average assumptions:
Years EndedDecember 31,
2007 2006 2005
Expected life (years) . . . . . . . . . . . . . . . . . . . . . . . . . . . . . . . 5.8 5.8 5.8Expected stock price volatility . . . . . . . . . . . . . . . . . . . . . . . . 37.2% 35.9% 36.2%Expected dividend yield . . . . . . . . . . . . . . . . . . . . . . . . . . . . 1.2% 1.0% 1.0%Risk-free interest rate . . . . . . . . . . . . . . . . . . . . . . . . . . . . . . 4.6% 4.9% 4.0%
85
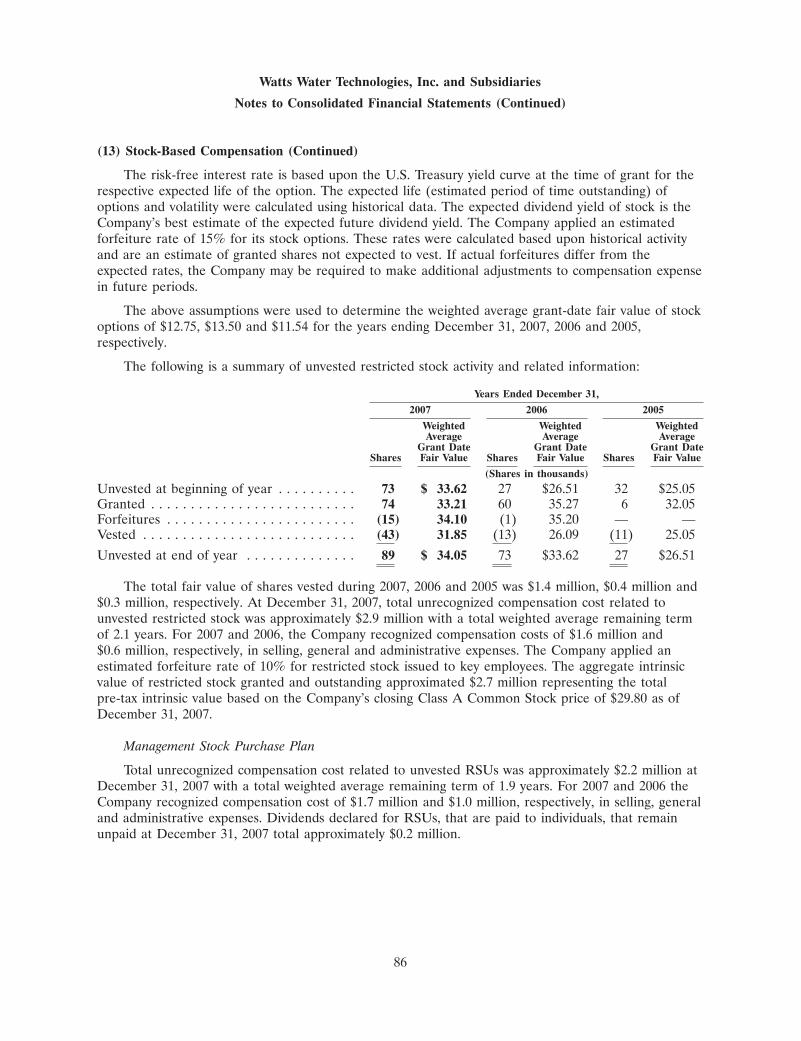
Watts Water Technologies, Inc. and Subsidiaries
Notes to Consolidated Financial Statements (Continued)
(13) Stock-Based Compensation (Continued)
The risk-free interest rate is based upon the U.S. Treasury yield curve at the time of grant for therespective expected life of the option. The expected life (estimated period of time outstanding) ofoptions and volatility were calculated using historical data. The expected dividend yield of stock is theCompany’s best estimate of the expected future dividend yield. The Company applied an estimatedforfeiture rate of 15% for its stock options. These rates were calculated based upon historical activityand are an estimate of granted shares not expected to vest. If actual forfeitures differ from theexpected rates, the Company may be required to make additional adjustments to compensation expensein future periods.
The above assumptions were used to determine the weighted average grant-date fair value of stockoptions of $12.75, $13.50 and $11.54 for the years ending December 31, 2007, 2006 and 2005,respectively.
The following is a summary of unvested restricted stock activity and related information:
Years Ended December 31,
2007 2006 2005
Weighted Weighted WeightedAverage Average Average
Grant Date Grant Date Grant DateShares Fair Value Shares Fair Value Shares Fair Value
(Shares in thousands)
Unvested at beginning of year . . . . . . . . . . 73 $ 33.62 27 $26.51 32 $25.05Granted . . . . . . . . . . . . . . . . . . . . . . . . . . 74 33.21 60 35.27 6 32.05Forfeitures . . . . . . . . . . . . . . . . . . . . . . . . (15) 34.10 (1) 35.20 — —Vested . . . . . . . . . . . . . . . . . . . . . . . . . . . (43) 31.85 (13) 26.09 (11) 25.05
Unvested at end of year . . . . . . . . . . . . . . 89 $ 34.05 73 $33.62 27 $26.51
The total fair value of shares vested during 2007, 2006 and 2005 was $1.4 million, $0.4 million and$0.3 million, respectively. At December 31, 2007, total unrecognized compensation cost related tounvested restricted stock was approximately $2.9 million with a total weighted average remaining termof 2.1 years. For 2007 and 2006, the Company recognized compensation costs of $1.6 million and$0.6 million, respectively, in selling, general and administrative expenses. The Company applied anestimated forfeiture rate of 10% for restricted stock issued to key employees. The aggregate intrinsicvalue of restricted stock granted and outstanding approximated $2.7 million representing the totalpre-tax intrinsic value based on the Company’s closing Class A Common Stock price of $29.80 as ofDecember 31, 2007.
Management Stock Purchase Plan
Total unrecognized compensation cost related to unvested RSUs was approximately $2.2 million atDecember 31, 2007 with a total weighted average remaining term of 1.9 years. For 2007 and 2006 theCompany recognized compensation cost of $1.7 million and $1.0 million, respectively, in selling, generaland administrative expenses. Dividends declared for RSUs, that are paid to individuals, that remainunpaid at December 31, 2007 total approximately $0.2 million.
86
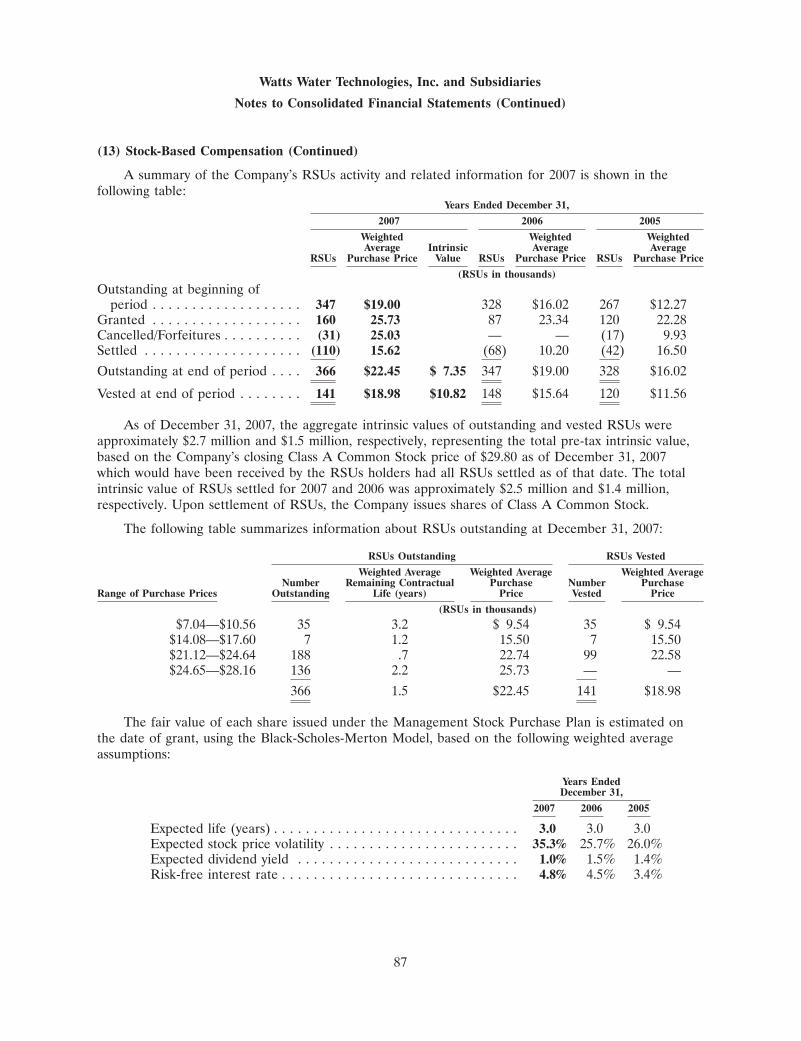
Watts Water Technologies, Inc. and Subsidiaries
Notes to Consolidated Financial Statements (Continued)
(13) Stock-Based Compensation (Continued)
A summary of the Company’s RSUs activity and related information for 2007 is shown in thefollowing table:
Years Ended December 31,
2007 2006 2005
Weighted Weighted WeightedAverage Intrinsic Average Average
RSUs Purchase Price Value RSUs Purchase Price RSUs Purchase Price
(RSUs in thousands)
Outstanding at beginning ofperiod . . . . . . . . . . . . . . . . . . . 347 $19.00 328 $16.02 267 $12.27
Granted . . . . . . . . . . . . . . . . . . . 160 25.73 87 23.34 120 22.28Cancelled/Forfeitures . . . . . . . . . . (31) 25.03 — — (17) 9.93Settled . . . . . . . . . . . . . . . . . . . . (110) 15.62 (68) 10.20 (42) 16.50
Outstanding at end of period . . . . 366 $22.45 $ 7.35 347 $19.00 328 $16.02
Vested at end of period . . . . . . . . 141 $18.98 $10.82 148 $15.64 120 $11.56
As of December 31, 2007, the aggregate intrinsic values of outstanding and vested RSUs wereapproximately $2.7 million and $1.5 million, respectively, representing the total pre-tax intrinsic value,based on the Company’s closing Class A Common Stock price of $29.80 as of December 31, 2007which would have been received by the RSUs holders had all RSUs settled as of that date. The totalintrinsic value of RSUs settled for 2007 and 2006 was approximately $2.5 million and $1.4 million,respectively. Upon settlement of RSUs, the Company issues shares of Class A Common Stock.
The following table summarizes information about RSUs outstanding at December 31, 2007:
RSUs Outstanding RSUs Vested
Weighted Average Weighted Average Weighted AverageNumber Remaining Contractual Purchase Number Purchase
Range of Purchase Prices Outstanding Life (years) Price Vested Price
(RSUs in thousands)
$7.04—$10.56 35 3.2 $ 9.54 35 $ 9.54$14.08—$17.60 7 1.2 15.50 7 15.50$21.12—$24.64 188 .7 22.74 99 22.58$24.65—$28.16 136 2.2 25.73 — —
366 1.5 $22.45 141 $18.98
The fair value of each share issued under the Management Stock Purchase Plan is estimated onthe date of grant, using the Black-Scholes-Merton Model, based on the following weighted averageassumptions:
Years EndedDecember 31,
2007 2006 2005
Expected life (years) . . . . . . . . . . . . . . . . . . . . . . . . . . . . . . . 3.0 3.0 3.0Expected stock price volatility . . . . . . . . . . . . . . . . . . . . . . . . 35.3% 25.7% 26.0%Expected dividend yield . . . . . . . . . . . . . . . . . . . . . . . . . . . . 1.0% 1.5% 1.4%Risk-free interest rate . . . . . . . . . . . . . . . . . . . . . . . . . . . . . . 4.8% 4.5% 3.4%
87
Watts Water Technologies, Inc. and Subsidiaries
Notes to Consolidated Financial Statements (Continued)
(13) Stock-Based Compensation (Continued)
The risk-free interest rate is based upon the U.S. Treasury yield curve at the time of grant for therespective expected life of the RSU’s. The expected life (estimated period of time outstanding) ofRSU’s and volatility were calculated using historical data. The expected dividend yield of stock is theCompany’s best estimate of the expected future dividend yield. The Company applied an estimatedforfeiture rate of 10% for its RSUs. These rates were calculated based upon historical activity and arean estimate of granted shares not expected to vest. If actual forfeitures differ from the expected rates,the Company may be required to make additional adjustments to compensation expense in futureperiods.
The above assumptions were used to determine the weighted average grant-date fair value ofRSUs granted of $16.79, $13.60 and $12.41 during 2007, 2006 and 2005, respectively.
The Company distributed dividends of $0.40 per share for 2007, $0.36 per share for 2006 and $0.32per share for 2005 on the Company’s Class A Common Stock and Class B Common Stock.
(14) Employee Benefit Plans
The Company sponsors funded and unfunded non-contributing defined benefit pension plans thattogether cover substantially all of its domestic employees. Benefits are based primarily on years ofservice and employees’ compensation. The funding policy of the Company for these plans is tocontribute an annual amount that does not exceed the maximum amount that can be deducted forfederal income tax purposes. Beginning in 2007, the Company uses a December 31 measurement datefor its plans. Prior to 2007, the Company used a September 30 measurement date for its plans.
88
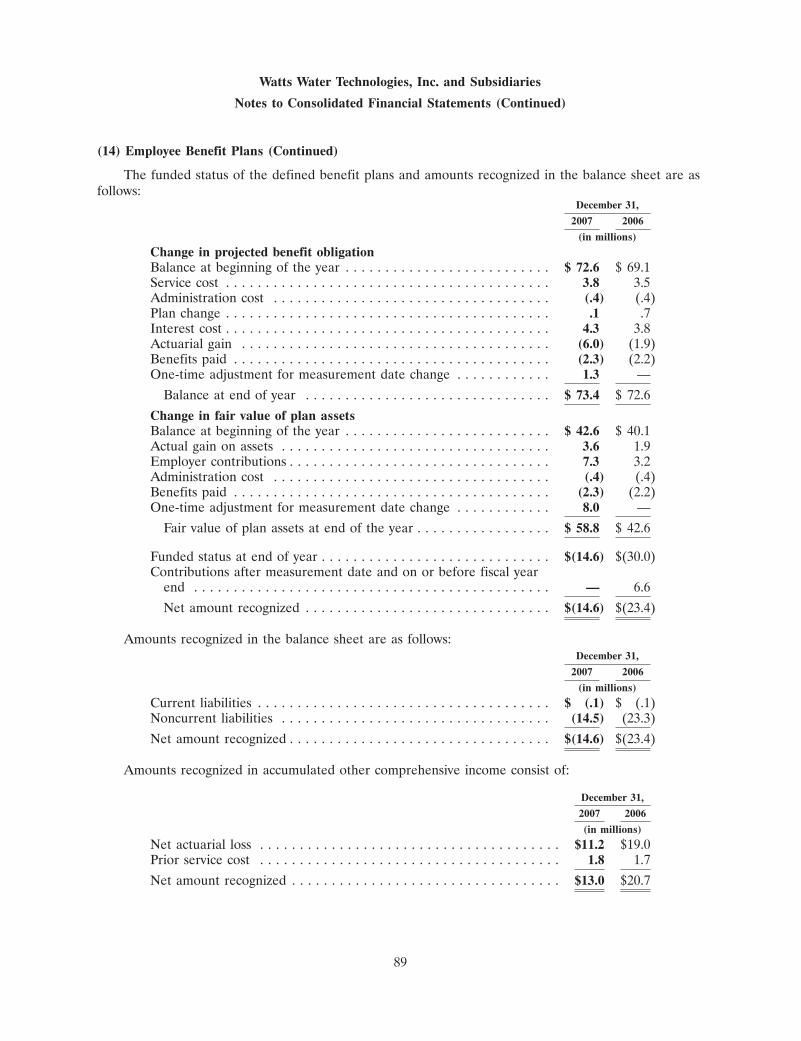
Watts Water Technologies, Inc. and Subsidiaries
Notes to Consolidated Financial Statements (Continued)
(14) Employee Benefit Plans (Continued)
The funded status of the defined benefit plans and amounts recognized in the balance sheet are asfollows:
December 31,
2007 2006
(in millions)
Change in projected benefit obligationBalance at beginning of the year . . . . . . . . . . . . . . . . . . . . . . . . . . $ 72.6 $ 69.1Service cost . . . . . . . . . . . . . . . . . . . . . . . . . . . . . . . . . . . . . . . . . 3.8 3.5Administration cost . . . . . . . . . . . . . . . . . . . . . . . . . . . . . . . . . . . (.4) (.4)Plan change . . . . . . . . . . . . . . . . . . . . . . . . . . . . . . . . . . . . . . . . . .1 .7Interest cost . . . . . . . . . . . . . . . . . . . . . . . . . . . . . . . . . . . . . . . . . 4.3 3.8Actuarial gain . . . . . . . . . . . . . . . . . . . . . . . . . . . . . . . . . . . . . . . (6.0) (1.9)Benefits paid . . . . . . . . . . . . . . . . . . . . . . . . . . . . . . . . . . . . . . . . (2.3) (2.2)One-time adjustment for measurement date change . . . . . . . . . . . . 1.3 —
Balance at end of year . . . . . . . . . . . . . . . . . . . . . . . . . . . . . . . $ 73.4 $ 72.6
Change in fair value of plan assetsBalance at beginning of the year . . . . . . . . . . . . . . . . . . . . . . . . . . $ 42.6 $ 40.1Actual gain on assets . . . . . . . . . . . . . . . . . . . . . . . . . . . . . . . . . . 3.6 1.9Employer contributions . . . . . . . . . . . . . . . . . . . . . . . . . . . . . . . . . 7.3 3.2Administration cost . . . . . . . . . . . . . . . . . . . . . . . . . . . . . . . . . . . (.4) (.4)Benefits paid . . . . . . . . . . . . . . . . . . . . . . . . . . . . . . . . . . . . . . . . (2.3) (2.2)One-time adjustment for measurement date change . . . . . . . . . . . . 8.0 —
Fair value of plan assets at end of the year . . . . . . . . . . . . . . . . . $ 58.8 $ 42.6
Funded status at end of year . . . . . . . . . . . . . . . . . . . . . . . . . . . . . $(14.6) $(30.0)Contributions after measurement date and on or before fiscal year
end . . . . . . . . . . . . . . . . . . . . . . . . . . . . . . . . . . . . . . . . . . . . . — 6.6
Net amount recognized . . . . . . . . . . . . . . . . . . . . . . . . . . . . . . . $(14.6) $(23.4)
Amounts recognized in the balance sheet are as follows:December 31,
2007 2006
(in millions)
Current liabilities . . . . . . . . . . . . . . . . . . . . . . . . . . . . . . . . . . . . . $ (.1) $ (.1)Noncurrent liabilities . . . . . . . . . . . . . . . . . . . . . . . . . . . . . . . . . . (14.5) (23.3)
Net amount recognized . . . . . . . . . . . . . . . . . . . . . . . . . . . . . . . . . $(14.6) $(23.4)
Amounts recognized in accumulated other comprehensive income consist of:
December 31,
2007 2006
(in millions)
Net actuarial loss . . . . . . . . . . . . . . . . . . . . . . . . . . . . . . . . . . . . . . $11.2 $19.0Prior service cost . . . . . . . . . . . . . . . . . . . . . . . . . . . . . . . . . . . . . . 1.8 1.7
Net amount recognized . . . . . . . . . . . . . . . . . . . . . . . . . . . . . . . . . . $13.0 $20.7
89
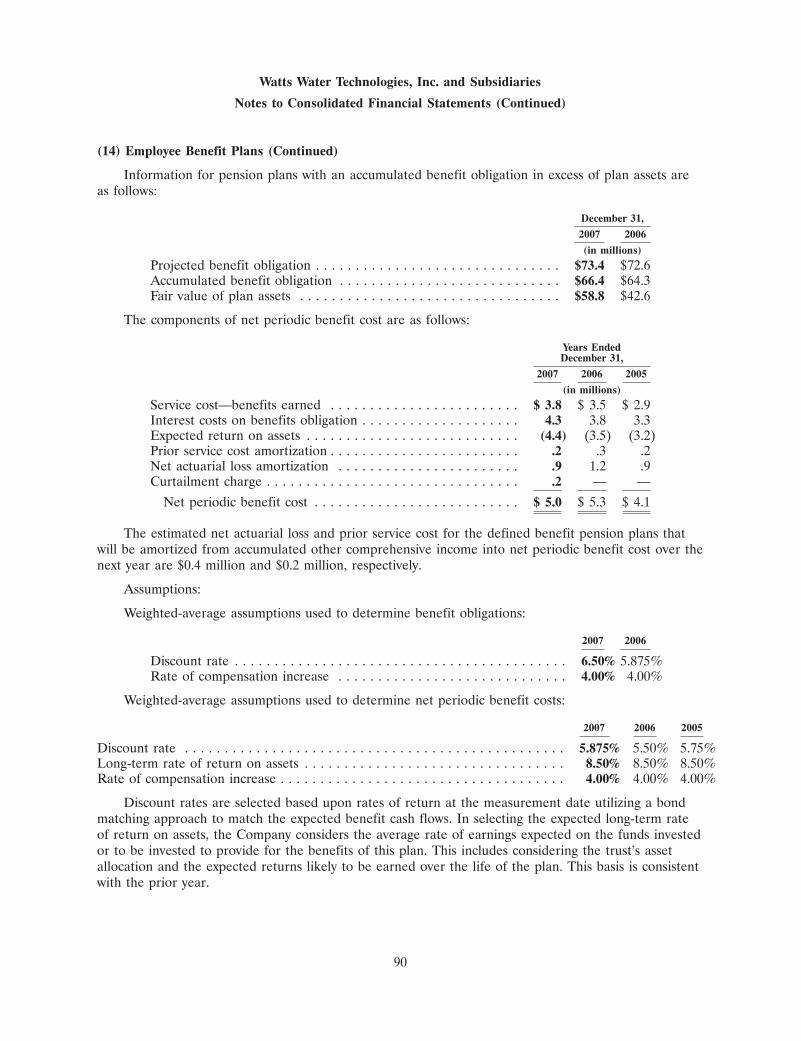
Watts Water Technologies, Inc. and Subsidiaries
Notes to Consolidated Financial Statements (Continued)
(14) Employee Benefit Plans (Continued)
Information for pension plans with an accumulated benefit obligation in excess of plan assets areas follows:
December 31,
2007 2006
(in millions)
Projected benefit obligation . . . . . . . . . . . . . . . . . . . . . . . . . . . . . . . $73.4 $72.6Accumulated benefit obligation . . . . . . . . . . . . . . . . . . . . . . . . . . . . $66.4 $64.3Fair value of plan assets . . . . . . . . . . . . . . . . . . . . . . . . . . . . . . . . . $58.8 $42.6
The components of net periodic benefit cost are as follows:
Years EndedDecember 31,
2007 2006 2005
(in millions)
Service cost—benefits earned . . . . . . . . . . . . . . . . . . . . . . . . $ 3.8 $ 3.5 $ 2.9Interest costs on benefits obligation . . . . . . . . . . . . . . . . . . . . 4.3 3.8 3.3Expected return on assets . . . . . . . . . . . . . . . . . . . . . . . . . . . (4.4) (3.5) (3.2)Prior service cost amortization . . . . . . . . . . . . . . . . . . . . . . . . .2 .3 .2Net actuarial loss amortization . . . . . . . . . . . . . . . . . . . . . . . .9 1.2 .9Curtailment charge . . . . . . . . . . . . . . . . . . . . . . . . . . . . . . . . .2 — —
Net periodic benefit cost . . . . . . . . . . . . . . . . . . . . . . . . . . $ 5.0 $ 5.3 $ 4.1
The estimated net actuarial loss and prior service cost for the defined benefit pension plans thatwill be amortized from accumulated other comprehensive income into net periodic benefit cost over thenext year are $0.4 million and $0.2 million, respectively.
Assumptions:
Weighted-average assumptions used to determine benefit obligations:
2007 2006
Discount rate . . . . . . . . . . . . . . . . . . . . . . . . . . . . . . . . . . . . . . . . . . 6.50% 5.875%Rate of compensation increase . . . . . . . . . . . . . . . . . . . . . . . . . . . . . 4.00% 4.00%
Weighted-average assumptions used to determine net periodic benefit costs:
2007 2006 2005
Discount rate . . . . . . . . . . . . . . . . . . . . . . . . . . . . . . . . . . . . . . . . . . . . . . . . 5.875% 5.50% 5.75%Long-term rate of return on assets . . . . . . . . . . . . . . . . . . . . . . . . . . . . . . . . . 8.50% 8.50% 8.50%Rate of compensation increase . . . . . . . . . . . . . . . . . . . . . . . . . . . . . . . . . . . . 4.00% 4.00% 4.00%
Discount rates are selected based upon rates of return at the measurement date utilizing a bondmatching approach to match the expected benefit cash flows. In selecting the expected long-term rateof return on assets, the Company considers the average rate of earnings expected on the funds investedor to be invested to provide for the benefits of this plan. This includes considering the trust’s assetallocation and the expected returns likely to be earned over the life of the plan. This basis is consistentwith the prior year.
90
Watts Water Technologies, Inc. and Subsidiaries
Notes to Consolidated Financial Statements (Continued)
(14) Employee Benefit Plans (Continued)
Plan assets:
The weighted average asset allocations by asset category is as follows:
Asset Category 2007 2006
Equity securities . . . . . . . . . . . . . . . . . . . . . . . . . . . . . . . . . . . . . . 64.9% 64.4%Debt securities . . . . . . . . . . . . . . . . . . . . . . . . . . . . . . . . . . . . . . . 29.8 30.0Other . . . . . . . . . . . . . . . . . . . . . . . . . . . . . . . . . . . . . . . . . . . . . . 5.3 5.6
Total . . . . . . . . . . . . . . . . . . . . . . . . . . . . . . . . . . . . . . . . . . . . . . 100.0% 100.0%
The Company’s written Retirement Plan Investment Policy sets forth the investment policy,objectives and constraints of the Watts Water Technologies, Inc. Pension Plan. This Retirement PlanInvestment Policy, set forth by the Pension Plan Committee, defines general investment principles anddirects investment management policy, addressing preservation of capital, risk aversion and adherenceto investment discipline. Investment managers are to make a reasonable effort to control risk and areevaluated quarterly against commonly accepted benchmarks to ensure that the risk assumed iscommensurate with the given investment style and objectives.
The portfolio is designed to achieve a balanced return of current income and modest growth ofcapital, while achieving returns in excess of the rate of inflation over the investment horizon in order topreserve purchasing power of Plan assets. All Plan assets are required to be invested in liquidsecurities. Derivative investments will not be allowed.
Prohibited investments include, but are not limited to the following: commodities and futurescontracts, private placements, options, limited partnerships, venture-capital investments, real estateproperties, interest-only (IO), principal-only (PO), and residual tranche CMOs, and Watts WaterTechnologies, Inc. stock.
Prohibited transactions include, but are not limited to the following: short selling and margintransactions.
Allowable assets include: cash equivalents, fixed income securities, equity securities, mutual funds,and GICs.
Specific guidelines regarding allocation of assets are as follows: equities shall comprise between25% and 75% of the total portfolio, while fixed income shall comprise between 30% and 65%.Investment performance is monitored on a regular basis and investments are re-allocated to stay withinspecific guidelines. An equity/fixed income allocation of 55%/45% is preferred. The securities of anyone company or government agency should not exceed 10% of the total fund, and no more than 20%of the total fund should be invested in any one industry. Individual treasury securities may represent50% of the total fund, while the total allocation to treasury bonds and notes may represent up to 100%of the Plan’s aggregate bond position.
91
Watts Water Technologies, Inc. and Subsidiaries
Notes to Consolidated Financial Statements (Continued)
(14) Employee Benefit Plans (Continued)
Cash flows:
The information related to the Company’s pension funds cash flow is as follows:
December 31,
2007 2006
(in millions)
Employer Contributions . . . . . . . . . . . . . . . . . . . . . . . . . . . . . . . . . . $7.3 $9.8Benefit Payments . . . . . . . . . . . . . . . . . . . . . . . . . . . . . . . . . . . . . . . $2.3 $2.2
No contributions are expected to be made in 2008.
Expected benefit payments to be paid by the pension plans are as follows:
(in millions)
During fiscal year ending December 31, 2008 . . . . . . . . . . . . . . . . . . . . $ 2.6During fiscal year ending December 31, 2009 . . . . . . . . . . . . . . . . . . . . $ 2.8During fiscal year ending December 31, 2010 . . . . . . . . . . . . . . . . . . . . $ 3.0During fiscal year ending December 31, 2011 . . . . . . . . . . . . . . . . . . . . $ 3.2During fiscal year ending December 31, 2012 . . . . . . . . . . . . . . . . . . . . $ 3.5During fiscal year ending December 31, 2013 through December 31,
2017 . . . . . . . . . . . . . . . . . . . . . . . . . . . . . . . . . . . . . . . . . . . . . . . . $24.0
Additionally, substantially all of the Company’s domestic employees are eligible to participate incertain 401(k) savings plans. Under these plans, the Company matches a specified percentage ofemployee contributions, subject to certain limitations. The Company’s match contributions (included inselling, general and administrative expense) for the years ended December 31, 2007, 2006, and 2005were $0.6 million, $0.6 million, and $0.4 million, respectively. Charges for European pension plansapproximated $3.0 million, $1.9 million and $2.0 million for the years ended December 31, 2007, 2006,and 2005, respectively. These costs relate to plans administered by certain European subsidiaries, withbenefits calculated according to government requirements and paid out to employees upon retirementor change of employment.
The Company entered into a Supplemental Compensation Agreement (the Agreement) withTimothy P. Horne on September 1, 1996. Per the Agreement, upon ceasing to be an employee of theCompany, Mr. Horne must make himself available, as requested by the Board, to work a minimum of300 but not more than 500 hours per year as a consultant in return for certain annual compensation aslong as he is physically able to do so. If Mr. Horne complies with the consulting provisions of theagreement above, he shall receive supplemental compensation on an annual basis of $400,000 per year,subject to cost of living increases each year, in exchange for the services performed, as long as he isphysically able to do so. In the event of physical disability, subsequent to commencing consultingservices for the Company, Mr. Horne will continue to receive $400,000 annually. The payment forconsulting services provided by Mr. Horne will be expensed as incurred by the Company. Mr. Horneretired effective December 31, 2002, and therefore the Supplemental Compensation period began onJanuary 1, 2003. In accordance with Financial Accounting Standards Board Statement No. 106,‘‘Employers Accounting for Post Retirement Benefits Other Than Pensions’’, the Company will accruefor the future post-retirement disability benefits over the period from January 1, 2003, to the time inwhich Mr. Horne becomes physically unable to perform his consulting services (the period in which thedisability benefits are earned).
92
Watts Water Technologies, Inc. and Subsidiaries
Notes to Consolidated Financial Statements (Continued)
(15) Contingencies and Environmental Remediation
James Jones Litigation
On June 25, 1997, Nora Armenta (the Relator) filed a civil action in the California Superior Courtfor Los Angeles County (the Armenta case) against James Jones Company (James Jones), Mueller Co.,Tyco International (U.S.), and the Company. The Company formerly owned James Jones. The Relatorfiled under the qui tam provision of the California state False Claims Act, Cal. Govt. Code § 12650 etseq. (California False Claims Act) and generally alleged that James Jones and the other defendantsviolated this statute by delivering some ‘‘defective’’ or ‘‘non-conforming’’ waterworks parts to thirty-fourmunicipal water systems in the State of California. The Relator filed a First Amended Complaint inNovember 1998 and a Second Amended Complaint in December 2000, which brought the total numberof plaintiffs to 161. To date, 11 of the named cities have intervened and attempts by four other namedcities to intervene have been denied.
In June 2002, the trial court excluded 47 cities from this December 2000 total of 161, but thisexclusion was reversed by an August 30, 2006 California Court of Appeal ruling that is now final. ThisAugust 30, 2006, Court of Appeal ruling also reversed dismissals of Tyco International and Mueller Co.and this allowed the Relator to make a successful motion that removed the Armenta Case litigationfrom Judge Lichtman’s court to the court of Judge Chaney, another complex litigation judge.
One of the allegations in the Second Amended Complaint and the Complaints-in-Intervention isthat purchased non-conforming James Jones waterworks parts may leach into public drinking waterelevated amounts of lead that may create a public health risk because they were made out of ‘81bronze alloy (UNS No. C8440) and contain more lead than the specified and advertised ‘85 bronzealloy (UNS No. C83600). This contention is based on the average difference of about 2% lead contentbetween ‘81 bronze (6% to 8% lead) and ‘85 bronze (4%to 6% lead) and the assumption that thiswould mean increased consumable lead in public drinking water that could cause a public healthconcern. The Company believes the evidence and discovery available to date indicates that this is notthe case.
In addition, ‘81 bronze is used extensively in municipal and home plumbing systems and isapproved by municipal, local and national codes. The Federal Environmental Protection Agency alsodefines metal for pipe fittings with no more than 8% lead as ‘‘lead free’’ under Section 1417 of theFederal Safe Drinking Water Act.
In this case, the Relator seeks three times an unspecified amount of actual damages and allegesthat the municipalities have suffered hundreds of millions of dollars in damages. She also seeks civilpenalties of $10,000 for each false claim and alleges that defendants are responsible for tens ofthousands of false claims. Finally, the Relator requests an award of costs of this action, includingattorneys’ fees.
In December 1998, the Los Angeles Department of Water and Power (LADWP) intervened in thiscase and filed a complaint. The Company settled with the city of Los Angeles, by far the mostsignificant city, for $7.3 million plus attorneys’ fees. Co-defendants contributed $2.0 million toward thissettlement.
In August 2003, an additional settlement payment was made for $13.0 million ($11.0 million fromthe Company and $2.0 million from James Jones), which settled the claims of the three Phase I cities(Santa Monica, San Francisco and East Bay Municipal Utility District) chosen by the Relator as havingthe strongest claims to be tried first. This settlement payment included the Relator’s statutory share,
93
Watts Water Technologies, Inc. and Subsidiaries
Notes to Consolidated Financial Statements (Continued)
(15) Contingencies and Environmental Remediation (Continued)
and the claims of these three cities have been dismissed. In addition to this $13.0 million payment, theCompany is obligated to pay the Relator’s attorney’s fees.
After the Phase I settlement, the Court permitted the defendants to select five additional cities toserve as the plaintiffs in a second trial phase of the case. Contra Costa, Corona, Santa Ana, Santa Cruzand Vallejo were chosen. The Company and James Jones then reached an agreement to settle theclaims of the City of Santa Ana for a total of $45,000, an amount which approximates Santa Ana’spurchases of James Jones products during the relevant period. The Santa Ana settlement was approvedby the Court and then completed.
On June 22, 2005, the Court dismissed the claims of the remaining Phase II cities (Contra Costa,Corona, Santa Cruz and Vallejo). The Court ruled that the Relator and these cities were required toshow that the cities had received out of spec parts which were related to specific invoices and that thisshowing had not been made. Although each city’s claim is unique, this ruling is significant for theclaims of the remaining cities, and the Relator appealed. However, this judgment can be appealedagain at the conclusion of the entire case. The trial court has scheduled a trial on March 17, 2009 forsix Phase III cities with three cities to be selected by each side. Litigation is inherently uncertain, andthe Company is unable to predict the outcome of this case.
On September 15, 2004, the Relator’s attorneys filed a new common law fraud lawsuit in theCalifornia Superior Court for the City of Banning and forty-six other cities and water districts againstJames Jones, Watts and Mueller Co. based on the same transactions alleged in the Armenta case.About forty-two of the plaintiffs in this new lawsuit are also plaintiffs in the Armenta case. The statuteof limitations threshold issue is in the process of being resolved for these plaintiffs. Litigation isinherently uncertain, and the Company is unable to predict the outcome of this case.
The Company has a reserve of approximately $28.0 million with respect to the James JonesLitigation in our consolidated balance sheet as of December 31, 2007. The Company believes, on thebasis of all available information, that this reserve is adequate to cover the probable and reasonablyestimable losses resulting from the Armenta case and the insurance coverage litigation with ZurichAmerican Insurance Company (Zurich) discussed below. The Company is currently unable to make anestimate of the range of any additional losses.
On February 14, 2001, after the Company’s insurers had denied coverage for the claims in theArmenta case, it filed a complaint for coverage against its insurers in the California Superior Court(the coverage case). James Jones filed a similar complaint, the cases were consolidated, and the trialcourt made summary adjudication rulings that Zurich must pay all reasonable defense costs incurred bythe Company and James Jones in the Armenta case since April 23, 1998 as well as such defense costsin the future until the end of the Armenta case. In August 2004, the California Court of Appealaffirmed these rulings, and, on December 1, 2004, the California Supreme Court denied Zurich’sappeal of this decision. This denial permanently established Zurich’s obligation to pay Armenta defensecosts for both the Company (approximately $16.6 million plus future costs) and James Jones (which theCompany estimates to be $17.0 million plus future costs), and Zurich is currently making payments ofincurred Armenta defense costs. However, as noted below, Zurich asserts that the defense costs paid byit are subject to reimbursement.
On November 22, 2002, the trial court entered a summary adjudication order that Zurich mustindemnify and pay the Company and James Jones for amounts paid to settle with the City of LosAngeles. Zurich’s attempt to obtain appellate review of this order was denied, but Zurich will still beable to appeal this order at the end of the coverage case. On August 6, 2004, the trial court made
94
Watts Water Technologies, Inc. and Subsidiaries
Notes to Consolidated Financial Statements (Continued)
(15) Contingencies and Environmental Remediation (Continued)
another summary adjudication ruling that Zurich must indemnify and pay us and James Jones for the$13.0 million paid to settle the claims of the Phase I cities described above. Zurich’s attempt to obtainappellate review of this ruling was denied on December 3, 2004 by the California Court of Appeal, butZurich will still be able to appeal this order at the end of the coverage case. Zurich has now made allof the payments required by these indemnity orders.
On February 8, 2006, Zurich filed a motion to set aside as void the November 22, 2002 andAugust 6, 2004 summary adjudication indemnity payment orders. After this motion was denied, Zurich’sappeal was also denied and the California Supreme Court denied Zurich’s petition for review. TheCompany is currently unable to predict the finality of these indemnity payment orders since Zurich canalso appeal them at the end of the coverage case. The Company has recorded reimbursed indemnitysettlement amounts (but not reimbursed defense costs) as a liability pending court resolution of theindemnification matter as it relates to Zurich.
Zurich has asserted that all amounts (which the Company estimates to be $56.0 million for bothdefense costs and indemnity amounts paid for settlements) paid by it to the Company and James Jonesare subject to reimbursement under Deductible Agreements related to the insurance policies betweenZurich and Watts. If Zurich were to prevail on this argument, James Jones would have a possibleindemnity claim against the Company for its exposure from the Armenta case. The Company believesthe Armenta case should be viewed as one occurrence and the deductible amount should be$0.5 million per occurrence.
These reimbursement claims are subject to arbitration under the Watts/Zurich DeductibleAgreements. Zurich claims its reimbursement right for defense costs paid arises under six DeductibleAgreements, and the Company contend that only two Deductible Agreements apply. The Companyfurther contend that a final decision in California supports our position on the number of DeductibleAgreements that should apply to defense costs. On January 31, 2006, the federal district court inChicago, Illinois determined that there are disputes under all Deductible Agreements in effect duringthe period in which Zurich issued primary policies and that the arbitrator could decide whichagreements would control reimbursement claims. The Company appealed this ruling. On October 20,2006, the United States Court of Appeals for the Seventh Circuit affirmed that an arbitration panelcould decide which deductible agreements between Zurich and the Company would control Zurich’sreimbursement claim for defense costs paid in the James Jones case. As a result of this development,the Company recorded a pre-tax charge of $5.0 million to discontinued operations in 2006.
Based on management’s assessment, the Company does not believe that the ultimate outcome ofthe James Jones Litigation will have a material adverse effect on its liquidity, financial condition orresults of operations. While this assessment is based on all available information, litigation is inherentlyuncertain, the actual liability to the Company to resolve this litigation fully cannot be predicted withany certainty and there exists a reasonable possibility that the Company may ultimately incur losses inthe James Jones Litigation in excess of the amount accrued. The Company intends to continue tocontest vigorously all aspects of the James Jones Litigation.
Environmental Remediation
The Company has been named as a potentially responsible party (PRP) with respect to a limitednumber of identified contaminated sites. The levels of contamination vary significantly from site to siteas do the related levels of remediation efforts. Environmental liabilities are recorded based on the mostprobable cost, if known, or on the estimated minimum cost of remediation. The Company accrues
95
Watts Water Technologies, Inc. and Subsidiaries
Notes to Consolidated Financial Statements (Continued)
(15) Contingencies and Environmental Remediation (Continued)
estimated environmental liabilities based on assumptions, which are subject to a number of factors anduncertainties. Circumstances which can affect the reliability and precision of these estimates includeidentification of additional sites, environmental regulations, level of cleanup required, technologiesavailable, number and financial condition of other contributors to remediation and the time period overwhich remediation may occur. The Company recognizes changes in estimates as new remediationrequirements are defined or as new information becomes available. At December 31, 2007, theCompany has a reserve of approximately $1.4 million (environmental accrual), which it estimates willlikely be paid for environmental remediation liabilities over the next five to ten years. Based on thefacts currently known to it, the Company does not believe that the ultimate outcome of these matterswill have a material adverse effect on its liquidity, financial condition or results of operations. Some ofits environmental matters are inherently uncertain and there exists a possibility that it may ultimatelyincur losses from these matters in excess of the amount accrued. However, the Company cannotcurrently estimate the amount of any such additional losses.
Asbestos Litigation
The Company is defending approximately 100 cases filed primarily, but not exclusively, inMississippi and New Jersey state courts alleging injury or death as a result of exposure to asbestos.These filings typically name multiple defendants and are filed on behalf of many plaintiffs. They do notidentify any particular Watts products as a source of asbestos exposure. To date, the Company has beendismissed from each case when the scheduled trial date comes near or when discovery fails to yield anyevidence of exposure to any of its products. Based on the facts currently known to it, the Companydoes not believe that the ultimate outcome of these claims will have a material adverse effect on itsliquidity, financial condition or results of operations.
Other Litigation
Other lawsuits and proceedings or claims, arising from the ordinary course of operations, are alsopending or threatened against the Company. Based on the facts currently known to it, the Companydoes not believe that the ultimate outcome of these other litigation matters will have a material adverseeffect on its liquidity, financial condition or results of operations.
(16) Financial Instruments
Fair Value
The carrying amounts of cash and cash equivalents, investment securities, trade receivables andtrade payables approximate fair value because of the short maturity of these financial instruments.
The fair value of the Company’s 4.87% senior notes due 2010, 5.47% senior notes due 2013 and5.85% senior notes due 2016 is based on quoted market prices. The fair value of the Company’svariable rate debt approximates its carrying value. The carrying amount and the estimated fair marketvalue of the Company’s long-term debt, including the current portion, are as follows:
December 31,
2007 2006
(in millions)
Carrying amount . . . . . . . . . . . . . . . . . . . . . . . . . . . . . . . . . . . . . $433.5 $449.2Estimated fair value . . . . . . . . . . . . . . . . . . . . . . . . . . . . . . . . . . . $424.9 $447.5
96
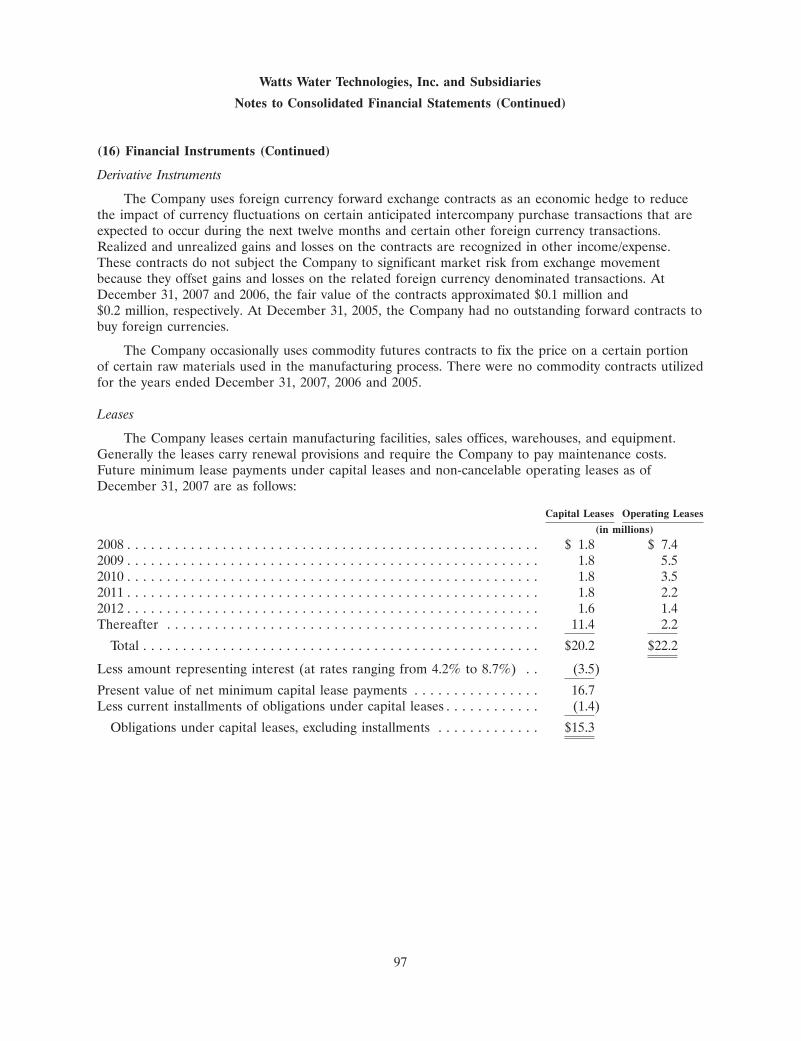
Watts Water Technologies, Inc. and Subsidiaries
Notes to Consolidated Financial Statements (Continued)
(16) Financial Instruments (Continued)
Derivative Instruments
The Company uses foreign currency forward exchange contracts as an economic hedge to reducethe impact of currency fluctuations on certain anticipated intercompany purchase transactions that areexpected to occur during the next twelve months and certain other foreign currency transactions.Realized and unrealized gains and losses on the contracts are recognized in other income/expense.These contracts do not subject the Company to significant market risk from exchange movementbecause they offset gains and losses on the related foreign currency denominated transactions. AtDecember 31, 2007 and 2006, the fair value of the contracts approximated $0.1 million and$0.2 million, respectively. At December 31, 2005, the Company had no outstanding forward contracts tobuy foreign currencies.
The Company occasionally uses commodity futures contracts to fix the price on a certain portionof certain raw materials used in the manufacturing process. There were no commodity contracts utilizedfor the years ended December 31, 2007, 2006 and 2005.
Leases
The Company leases certain manufacturing facilities, sales offices, warehouses, and equipment.Generally the leases carry renewal provisions and require the Company to pay maintenance costs.Future minimum lease payments under capital leases and non-cancelable operating leases as ofDecember 31, 2007 are as follows:
Capital Leases Operating Leases
(in millions)
2008 . . . . . . . . . . . . . . . . . . . . . . . . . . . . . . . . . . . . . . . . . . . . . . . . . . . . $ 1.8 $ 7.42009 . . . . . . . . . . . . . . . . . . . . . . . . . . . . . . . . . . . . . . . . . . . . . . . . . . . . 1.8 5.52010 . . . . . . . . . . . . . . . . . . . . . . . . . . . . . . . . . . . . . . . . . . . . . . . . . . . . 1.8 3.52011 . . . . . . . . . . . . . . . . . . . . . . . . . . . . . . . . . . . . . . . . . . . . . . . . . . . . 1.8 2.22012 . . . . . . . . . . . . . . . . . . . . . . . . . . . . . . . . . . . . . . . . . . . . . . . . . . . . 1.6 1.4Thereafter . . . . . . . . . . . . . . . . . . . . . . . . . . . . . . . . . . . . . . . . . . . . . . . 11.4 2.2
Total . . . . . . . . . . . . . . . . . . . . . . . . . . . . . . . . . . . . . . . . . . . . . . . . . . $20.2 $22.2
Less amount representing interest (at rates ranging from 4.2% to 8.7%) . . (3.5)
Present value of net minimum capital lease payments . . . . . . . . . . . . . . . . 16.7Less current installments of obligations under capital leases . . . . . . . . . . . . (1.4)
Obligations under capital leases, excluding installments . . . . . . . . . . . . . $15.3
97
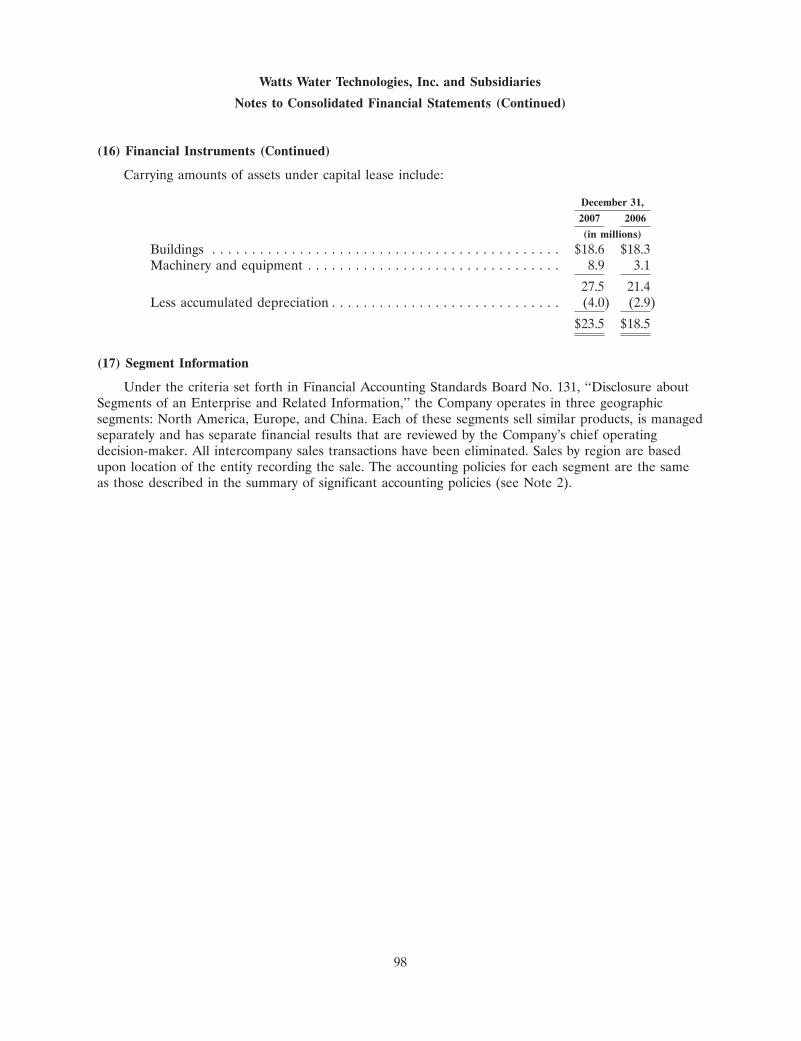
Watts Water Technologies, Inc. and Subsidiaries
Notes to Consolidated Financial Statements (Continued)
(16) Financial Instruments (Continued)
Carrying amounts of assets under capital lease include:
December 31,
2007 2006
(in millions)
Buildings . . . . . . . . . . . . . . . . . . . . . . . . . . . . . . . . . . . . . . . . . . . . $18.6 $18.3Machinery and equipment . . . . . . . . . . . . . . . . . . . . . . . . . . . . . . . . 8.9 3.1
27.5 21.4Less accumulated depreciation . . . . . . . . . . . . . . . . . . . . . . . . . . . . . (4.0) (2.9)
$23.5 $18.5
(17) Segment Information
Under the criteria set forth in Financial Accounting Standards Board No. 131, ‘‘Disclosure aboutSegments of an Enterprise and Related Information,’’ the Company operates in three geographicsegments: North America, Europe, and China. Each of these segments sell similar products, is managedseparately and has separate financial results that are reviewed by the Company’s chief operatingdecision-maker. All intercompany sales transactions have been eliminated. Sales by region are basedupon location of the entity recording the sale. The accounting policies for each segment are the sameas those described in the summary of significant accounting policies (see Note 2).
98
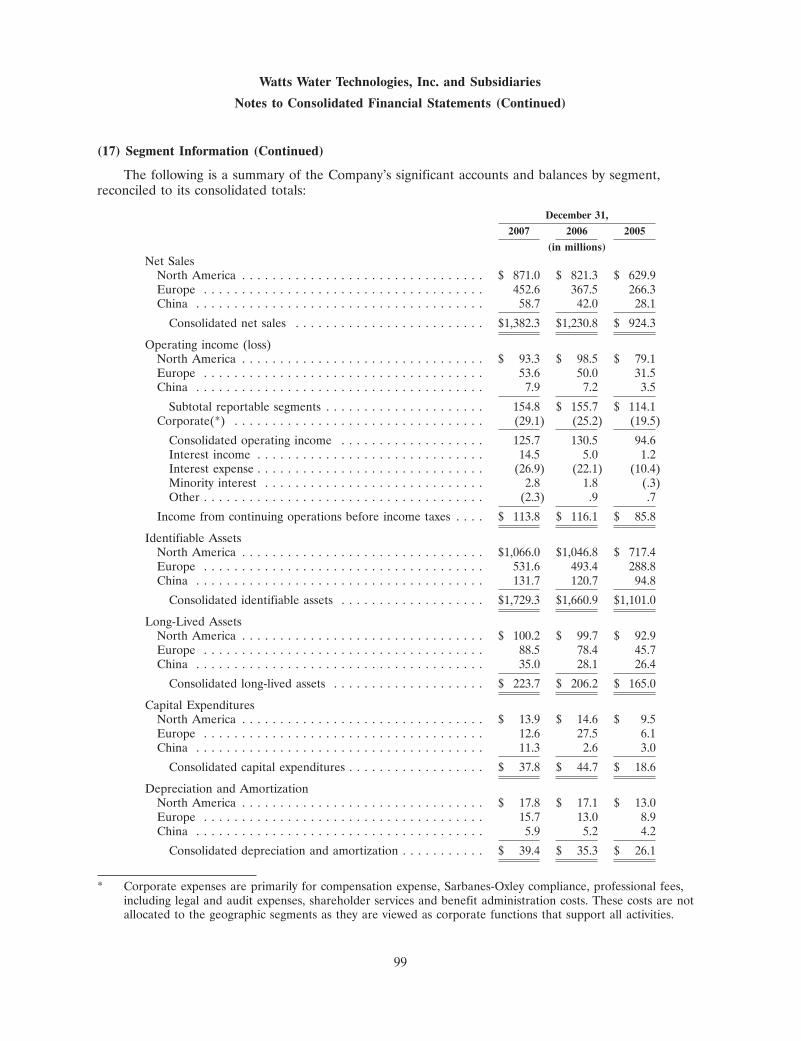
Watts Water Technologies, Inc. and Subsidiaries
Notes to Consolidated Financial Statements (Continued)
(17) Segment Information (Continued)
The following is a summary of the Company’s significant accounts and balances by segment,reconciled to its consolidated totals:
December 31,
2007 2006 2005
(in millions)Net Sales
North America . . . . . . . . . . . . . . . . . . . . . . . . . . . . . . . . $ 871.0 $ 821.3 $ 629.9Europe . . . . . . . . . . . . . . . . . . . . . . . . . . . . . . . . . . . . . 452.6 367.5 266.3China . . . . . . . . . . . . . . . . . . . . . . . . . . . . . . . . . . . . . . 58.7 42.0 28.1
Consolidated net sales . . . . . . . . . . . . . . . . . . . . . . . . . $1,382.3 $1,230.8 $ 924.3
Operating income (loss)North America . . . . . . . . . . . . . . . . . . . . . . . . . . . . . . . . $ 93.3 $ 98.5 $ 79.1Europe . . . . . . . . . . . . . . . . . . . . . . . . . . . . . . . . . . . . . 53.6 50.0 31.5China . . . . . . . . . . . . . . . . . . . . . . . . . . . . . . . . . . . . . . 7.9 7.2 3.5
Subtotal reportable segments . . . . . . . . . . . . . . . . . . . . . 154.8 $ 155.7 $ 114.1Corporate(*) . . . . . . . . . . . . . . . . . . . . . . . . . . . . . . . . . (29.1) (25.2) (19.5)
Consolidated operating income . . . . . . . . . . . . . . . . . . . 125.7 130.5 94.6Interest income . . . . . . . . . . . . . . . . . . . . . . . . . . . . . . 14.5 5.0 1.2Interest expense . . . . . . . . . . . . . . . . . . . . . . . . . . . . . . (26.9) (22.1) (10.4)Minority interest . . . . . . . . . . . . . . . . . . . . . . . . . . . . . 2.8 1.8 (.3)Other . . . . . . . . . . . . . . . . . . . . . . . . . . . . . . . . . . . . . (2.3) .9 .7
Income from continuing operations before income taxes . . . . $ 113.8 $ 116.1 $ 85.8
Identifiable AssetsNorth America . . . . . . . . . . . . . . . . . . . . . . . . . . . . . . . . $1,066.0 $1,046.8 $ 717.4Europe . . . . . . . . . . . . . . . . . . . . . . . . . . . . . . . . . . . . . 531.6 493.4 288.8China . . . . . . . . . . . . . . . . . . . . . . . . . . . . . . . . . . . . . . 131.7 120.7 94.8
Consolidated identifiable assets . . . . . . . . . . . . . . . . . . . $1,729.3 $1,660.9 $1,101.0
Long-Lived AssetsNorth America . . . . . . . . . . . . . . . . . . . . . . . . . . . . . . . . $ 100.2 $ 99.7 $ 92.9Europe . . . . . . . . . . . . . . . . . . . . . . . . . . . . . . . . . . . . . 88.5 78.4 45.7China . . . . . . . . . . . . . . . . . . . . . . . . . . . . . . . . . . . . . . 35.0 28.1 26.4
Consolidated long-lived assets . . . . . . . . . . . . . . . . . . . . $ 223.7 $ 206.2 $ 165.0
Capital ExpendituresNorth America . . . . . . . . . . . . . . . . . . . . . . . . . . . . . . . . $ 13.9 $ 14.6 $ 9.5Europe . . . . . . . . . . . . . . . . . . . . . . . . . . . . . . . . . . . . . 12.6 27.5 6.1China . . . . . . . . . . . . . . . . . . . . . . . . . . . . . . . . . . . . . . 11.3 2.6 3.0
Consolidated capital expenditures . . . . . . . . . . . . . . . . . . $ 37.8 $ 44.7 $ 18.6
Depreciation and AmortizationNorth America . . . . . . . . . . . . . . . . . . . . . . . . . . . . . . . . $ 17.8 $ 17.1 $ 13.0Europe . . . . . . . . . . . . . . . . . . . . . . . . . . . . . . . . . . . . . 15.7 13.0 8.9China . . . . . . . . . . . . . . . . . . . . . . . . . . . . . . . . . . . . . . 5.9 5.2 4.2
Consolidated depreciation and amortization . . . . . . . . . . . $ 39.4 $ 35.3 $ 26.1
* Corporate expenses are primarily for compensation expense, Sarbanes-Oxley compliance, professional fees,including legal and audit expenses, shareholder services and benefit administration costs. These costs are notallocated to the geographic segments as they are viewed as corporate functions that support all activities.
99
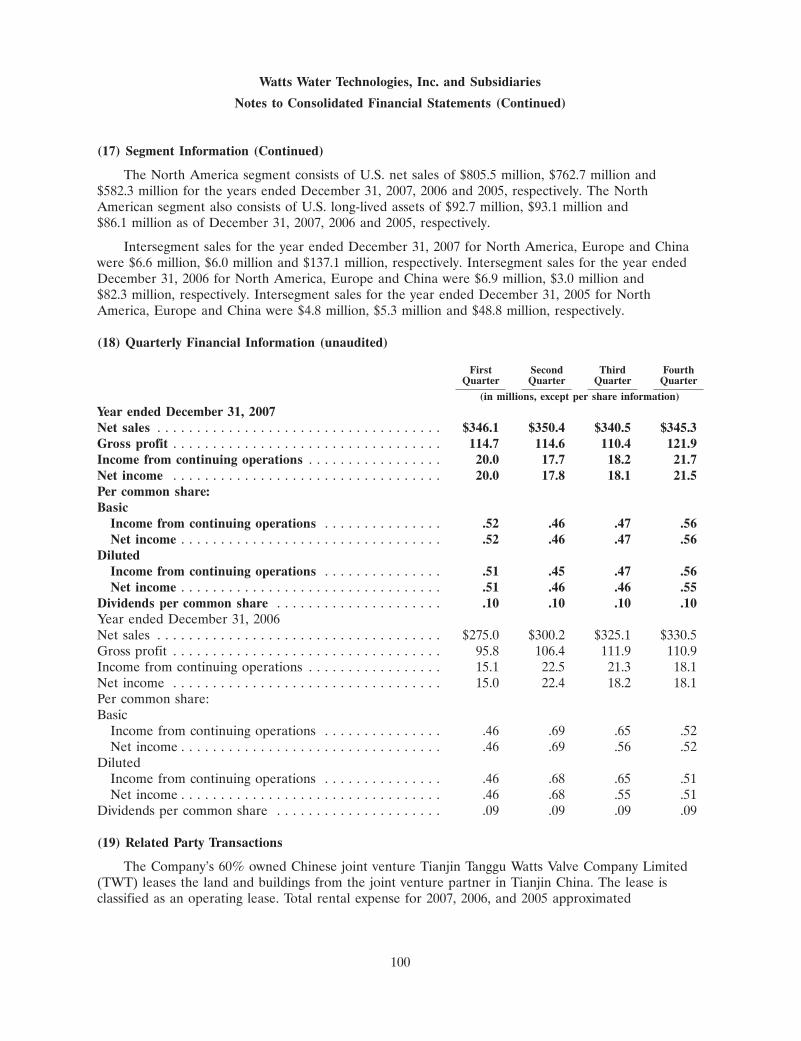
Watts Water Technologies, Inc. and Subsidiaries
Notes to Consolidated Financial Statements (Continued)
(17) Segment Information (Continued)
The North America segment consists of U.S. net sales of $805.5 million, $762.7 million and$582.3 million for the years ended December 31, 2007, 2006 and 2005, respectively. The NorthAmerican segment also consists of U.S. long-lived assets of $92.7 million, $93.1 million and$86.1 million as of December 31, 2007, 2006 and 2005, respectively.
Intersegment sales for the year ended December 31, 2007 for North America, Europe and Chinawere $6.6 million, $6.0 million and $137.1 million, respectively. Intersegment sales for the year endedDecember 31, 2006 for North America, Europe and China were $6.9 million, $3.0 million and$82.3 million, respectively. Intersegment sales for the year ended December 31, 2005 for NorthAmerica, Europe and China were $4.8 million, $5.3 million and $48.8 million, respectively.
(18) Quarterly Financial Information (unaudited)
First Second Third FourthQuarter Quarter Quarter Quarter
(in millions, except per share information)
Year ended December 31, 2007Net sales . . . . . . . . . . . . . . . . . . . . . . . . . . . . . . . . . . . . $346.1 $350.4 $340.5 $345.3Gross profit . . . . . . . . . . . . . . . . . . . . . . . . . . . . . . . . . . 114.7 114.6 110.4 121.9Income from continuing operations . . . . . . . . . . . . . . . . . 20.0 17.7 18.2 21.7Net income . . . . . . . . . . . . . . . . . . . . . . . . . . . . . . . . . . 20.0 17.8 18.1 21.5Per common share:Basic
Income from continuing operations . . . . . . . . . . . . . . . .52 .46 .47 .56Net income . . . . . . . . . . . . . . . . . . . . . . . . . . . . . . . . . .52 .46 .47 .56
DilutedIncome from continuing operations . . . . . . . . . . . . . . . .51 .45 .47 .56Net income . . . . . . . . . . . . . . . . . . . . . . . . . . . . . . . . . .51 .46 .46 .55
Dividends per common share . . . . . . . . . . . . . . . . . . . . . .10 .10 .10 .10Year ended December 31, 2006Net sales . . . . . . . . . . . . . . . . . . . . . . . . . . . . . . . . . . . . $275.0 $300.2 $325.1 $330.5Gross profit . . . . . . . . . . . . . . . . . . . . . . . . . . . . . . . . . . 95.8 106.4 111.9 110.9Income from continuing operations . . . . . . . . . . . . . . . . . 15.1 22.5 21.3 18.1Net income . . . . . . . . . . . . . . . . . . . . . . . . . . . . . . . . . . 15.0 22.4 18.2 18.1Per common share:Basic
Income from continuing operations . . . . . . . . . . . . . . . .46 .69 .65 .52Net income . . . . . . . . . . . . . . . . . . . . . . . . . . . . . . . . . .46 .69 .56 .52
DilutedIncome from continuing operations . . . . . . . . . . . . . . . .46 .68 .65 .51Net income . . . . . . . . . . . . . . . . . . . . . . . . . . . . . . . . . .46 .68 .55 .51
Dividends per common share . . . . . . . . . . . . . . . . . . . . . .09 .09 .09 .09
(19) Related Party Transactions
The Company’s 60% owned Chinese joint venture Tianjin Tanggu Watts Valve Company Limited(TWT) leases the land and buildings from the joint venture partner in Tianjin China. The lease isclassified as an operating lease. Total rental expense for 2007, 2006, and 2005 approximated
100
Watts Water Technologies, Inc. and Subsidiaries
Notes to Consolidated Financial Statements (Continued)
(19) Related Party Transactions (Continued)
$0.3 million. During 2006, the local Chinese government informed the Company that the propertyleased by TWT would be taken over by eminent domain by the end of the second quarter of 2008. TheCompany has therefore established a plan to relocate and rationalize those operations (see note 4).
On December 3, 2007, the Company entered into an Equity Transfer Agreement (the Agreement)with its joint venture partners to purchase the remaining 40% of the outstanding ownership interest inTWT that it did not already own. The purchase price will be approximately $5.2 million, payable aftercertain closing conditions are met, including the approval of the Agreement by the local Chineseauthorities, which the Company expects will occur by the end of the second quarter of 2008. TheCompany expects to record approximately $3.7 million in goodwill for this acquisition.
(20) Subsequent Events
On February 5, 2008, the Company declared a quarterly dividend of eleven cents ($0.11) per shareon each outstanding share of Class A Common Stock and Class B Common Stock. This is an increaseof $0.01 per share compared to the dividend paid for the comparable period last year.
From January 1, 2008 through February 25, 2008, the Company liquidated approximately$22.0 million of the Company’s auction rate certificates at par value and invested the proceeds intomoney market accounts. At February 25, 2008, the Company held approximately $17.0 million ofauction rate certificates whose underlying investments are AAA rated municipal bonds. The Companyhas no current indications that the securities its holds may be impaired. However, volatility in the creditmarkets could impact the Company’s ability to liquidate these investments or cause the fair value of thesecurities to be impaired. If liquidity of the securities becomes prohibitive, the Company may be forcedto hold the securities until maturity or until conditions improve which could be as long as 33 years.Subsequent to December 31, 2007 through February 25, 2008, the Company experienced failed auctionson $6.6 million of its auction rate certificates. The Company does not have a present need to accessthese funds for operational purposes. The amounts associated with failed auctions will not be accessibleuntil a successful auction occurs, a buyer is found outside of the auction process or the underlyingsecurities have matured. As a result, the Company has classified the $17.0 million of auction ratecertificates held as of February 25, 2008 as long-term assets in the Company’s December 31, 2007consolidated balance sheet.
101
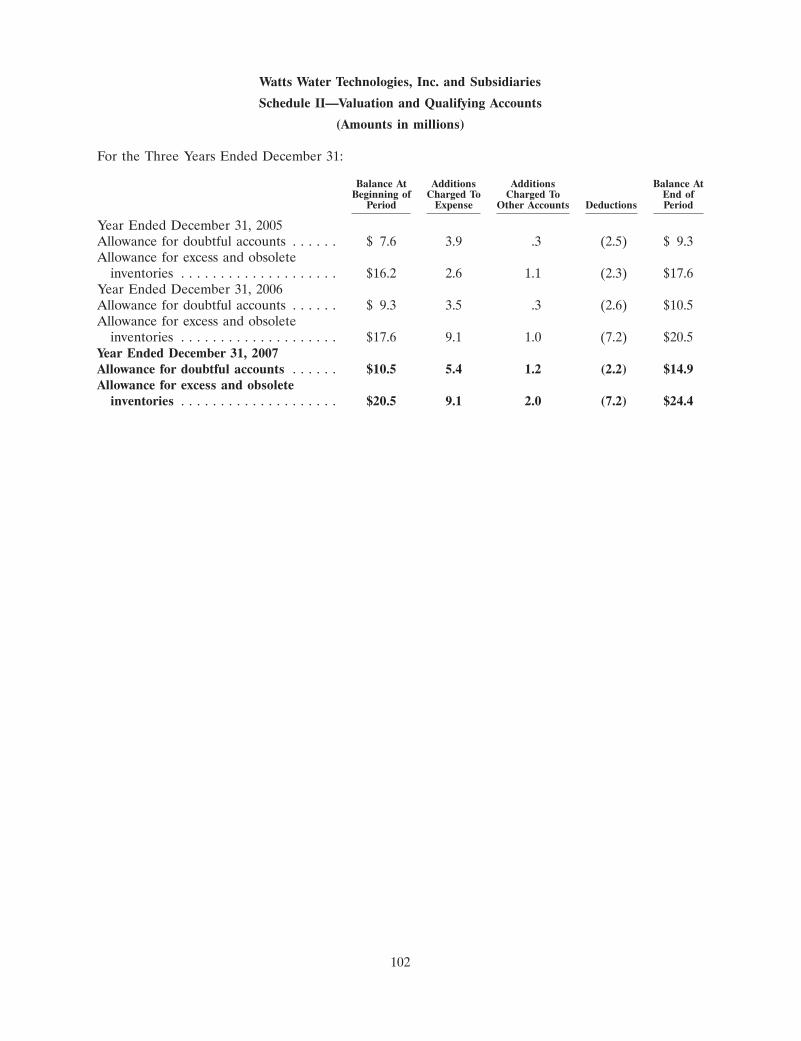
Watts Water Technologies, Inc. and Subsidiaries
Schedule II—Valuation and Qualifying Accounts
(Amounts in millions)
For the Three Years Ended December 31:
Balance At Additions Additions Balance AtBeginning of Charged To Charged To End of
Period Expense Other Accounts Deductions Period
Year Ended December 31, 2005Allowance for doubtful accounts . . . . . . $ 7.6 3.9 .3 (2.5) $ 9.3Allowance for excess and obsolete
inventories . . . . . . . . . . . . . . . . . . . . $16.2 2.6 1.1 (2.3) $17.6Year Ended December 31, 2006Allowance for doubtful accounts . . . . . . $ 9.3 3.5 .3 (2.6) $10.5Allowance for excess and obsolete
inventories . . . . . . . . . . . . . . . . . . . . $17.6 9.1 1.0 (7.2) $20.5Year Ended December 31, 2007Allowance for doubtful accounts . . . . . . $10.5 5.4 1.2 (2.2) $14.9Allowance for excess and obsolete
inventories . . . . . . . . . . . . . . . . . . . . $20.5 9.1 2.0 (7.2) $24.4
102
EXHIBIT INDEX
Exhibit No. Description
3.1 Restated Certificate of Incorporation, as amended (14)3.2 Amended and Restated By-Laws, as amended (1)9.1 The Amended and Restated George B. Horne Voting Trust Agreement—1997 dated as of
September 14, 1999 (15)10.1* Supplemental Compensation Agreement effective as of September 1, 1996 between the
Registrant and Timothy P. Horne (9), Amendment No. 1, dated July 25, 2000 (16), andAmendment No. 2 dated October 23, 2002 (3)
10.2* Form of Indemnification Agreement between the Registrant and certain directors andofficers of the Registrant (18)
10.3* 1996 Stock Option Plan, dated October 15, 1996 (10), and First Amendment datedFebruary 28, 2003 (3)
10.4* Watts Water Technologies, Inc. Pension Plan (amended and restated effective as ofJanuary 1, 2006) and First Amendment effective as of January 1, 2008
10.5 Registration Rights Agreement dated July 25, 1986 (5)10.6* Executive Incentive Bonus Plan, as amended and restated (8)10.7 Amended and Restated Stock Restriction Agreement dated October 30, 1991 (2), and
Amendment dated August 26, 1997 (12)10.8* Watts Industries, Inc. 1991 Non-Employee Directors’ Nonqualified Stock Option Plan (6),
and Amendment No. 1 (9)10.9* Watts Industries, Inc. 2003 Non-Employee Directors’ Stock Option Plan (3)10.10 Letter of Credit issued by Fleet National Bank (as successor to BankBoston, N.A.) for the
benefit of Zurich-American Insurance Company dated June 25, 1999, as amendedJanuary 22, 2001 (17)
10.11* Watts Water Technologies, Inc. Management Stock Purchase Plan (Amended and Restatedas of January 1, 2005), as amended (20)
10.12 Stock Purchase Agreement dated as of June 19, 1996 by and among Mueller Co., TycoValves Limited, Watts Investment Company, Tyco International Ltd. and the Registrant(11)
10.13 Note Purchase Agreement dated as of May 15, 2003 between the Registrant and thePurchasers named in Schedule A thereto relating to the Registrant’s $50,000,000 4.87%Senior Notes, Series A, due May 15, 2010 and $75,000,000 5.47% Senior Notes, Series B,due May 15, 2013 (7)
10.14 Form of 4.87% Senior Note due May 15, 2010 (7)10.15 Form of 5.47% Senior Note due May 15, 2013 (7)10.16* Watts Water Technologies, Inc. 2004 Stock Incentive Plan, as amended (20)10.17* Non-Employee Director Compensation Arrangements (1)10.18* Watts Water Technologies, Inc. Supplemental Employees Retirement Plan as Amended and
Restated Effective May 4, 2004, First Amendment effective March 1, 2005 and SecondAmendment effective January 1, 2008
10.19* Form of Incentive Stock Option Agreement under the Watts Water Technologies, Inc. 2004Stock Incentive Plan (19)
10.20* Form of Non-Qualified Stock Option Agreement under the Watts Water Technologies, Inc.2004 Stock Incentive Plan (20)
10.21* Form of Restricted Stock Award Agreement for Employees under the Watts WaterTechnologies, Inc. 2004 Stock Incentive Plan (Incremental Vesting) (20)
10.22* Form of Restricted Stock Award Agreement for Employees under the Watts WaterTechnologies, Inc. 2004 Stock Incentive Plan (Cliff Vesting) (19)
10.23* Form of Restricted Stock Award Agreement for Non-Employee Directors under the WattsWater Technologies, Inc. 2004 Stock Incentive Plan (19)
10.24 Note Purchase Agreement, dated as of April 27, 2006, between the Registrant and thePurchasers named in Schedule A thereto relating to the Registrant’s $225,000,000 5.85%Senior Notes due April 30, 2016 (4)
10.25 Form of 5.85% Senior Note due April 30, 2016 (4)
Exhibit No. Description
10.26 Subsidiary Guaranty, dated as of April 27, 2006, in connection with the Registrant’s 5.85%Senior Notes due April 30, 2016 executed by the subsidiary guarantors party thereto,including the form of Joinder to Subsidiary Guaranty (4)
10.27 First Amendment, dated as of April 27, 2006, to Note Purchase Agreement dated as ofMay 15, 2003 among the Registrant and the purchasers named therein (4)
10.28 Amended and Restated Credit Agreement, dated as of April 27, 2006, among theRegistrant, certain subsidiaries of the Registrant as Borrowers, Bank of America, N.A., asAdministrative Agent, Swing Line Lender and L/C Issuer and the other lenders referredto therein (4)
10.29 Amended and Restated Guaranty, dated as of April 27, 2006, by the Registrant, theSubsidiaries of the Registrant set forth therein and Watts Industries Europe B.V., in favorof Bank of America, N.A. (4)
10.30* Resignation Agreement dated October 16, 2007 between the Registrant and William D.Martino (18)
11 Statement Regarding Computation of Earnings per Common Share (13)21 Subsidiaries23 Consent of KPMG LLP31.1 Certification of Principal Executive Officer pursuant to Rule 13a-14(a) or Rule 15d-14(a) of
the Securities Exchange Act of 1934, as amended31.2 Certification of Principal Financial Officer pursuant to Rule 13a-14(a) or Rule 15d-14(a) of
the Securities Exchange Act of 1934, as amended32.1 Certification of Principal Executive Officer Pursuant to 18 U.S.C. Section 135032.2 Certification of Principal Financial Officer Pursuant to 18 U.S.C. Section 1350
(1) Incorporated by reference to the Registrant’s Current Report on Form 8-K dated February 5, 2007(File No. 001-11499).
(2) Incorporated by reference to the Registrant’s Current Report on Form 8-K dated November 14,1991 (File No. 001-11499).
(3) Incorporated by reference to the Registrant’s Annual Report on Form 10-K for the year endedDecember 31, 2002 (File No. 001-11499).
(4) Incorporated by reference to the Registrant’s Current Report on Form 8-K dated April 27, 2006(File No. 001-11499).
(5) Incorporated by reference to the Registrant’s Form S-1 (No. 33-6515) as part of the SecondAmendment to such Form S-1 dated August 21, 1986.
(6) Incorporated by reference to Amendment No. 1 to the Registrant’s Annual Report on Form 10-Kfor year ended June 30, 1992 (File No. 001-11499).
(7) Incorporated by reference to the Registrant’s Current Report on Form 8-K dated May 15, 2003(File No. 001-11499).
(8) Incorporated by reference to the Registrant’s Current Report on Form 8-K dated February 8, 2005(File No. 001-11499).
(9) Incorporated by reference to the Registrant’s Annual Report on Form 10-K for year endedJune 30, 1996 (File No. 001-11499).
(10) Incorporated by reference to the Registrant’s Form S-8 (No. 333-32685) dated August 1, 1997.
(11) Incorporated by reference to the Registrant’s Current Report on Form 8-K dated September 4,1996 (File No. 001- 11499).
(12) Incorporated by reference to the Registrant’s Annual Report on Form 10-K for year endedJune 30, 1997(File No. 001- 11499).
(13) Incorporated by reference to notes to Consolidated Financial Statements, Note 2 of this Report.
(14) Incorporated by reference to the Registrant’s Quarterly Report on Form 10-Q for the quarterended July 3, 2005 (File No. 001-11499).
(15) Incorporated by reference to the Registrant’s Annual Report on Form 10-K for year endedJune 30, 1999 (File No. 001-11499).
(16) Incorporated by reference to the Registrant’s Quarterly Report on Form 10-Q for quarter endedSeptember 30, 2000 (File No. 001-11499).
(17) Incorporated by reference to the Registrant’s Annual Report on Form 10-K for the year endedDecember 31, 2003 (File No. 001-11499).
(18) Incorporated by reference to the Registrant’s Quarterly Report on Form 10-Q for the quarterended September 30, 2007 (File No. 001-11499).
(19) Incorporated by reference to the Registrant’s Quarterly Report on Form 10-Q for the quarterended September 26, 2004 (File No. 001-11499).
(20) Incorporated by reference to the Registrant’s Quarterly Report on Form 10-Q for the quarterended July 1, 2007 (File No. 001-11499).
* Management contract or compensatory plan or arrangement.

(This page has been left blank intentionally.)

(This page has been left blank intentionally.)

(This page has been left blank intentionally.)
Financial highlights
36.4
03
Income from Continuing Operations
($ Millions)04 05 06 07
100
75
50
25
48.755.0
77.1 77.6
701.9
03
Total Net Sales
($ Millions)04 05 06 07
1500
1250
1000
750
500
250
0
824.6924.3
1,230.81,382.3
472.6
03
North America Net Sales
($ Millions)04 05 06 07
900
700
500
300
545.2
629.9
821.3871.0
210.6
03
Europe Net Sales
($ Millions)04 05 06 07
500
400
300
200
100
0
253.2 266.3
367.5
452.6
18.7
03
China Net Sales
($ Millions)04 05 06 07
60
45
30
15
0
26.2 28.1
42.0
58.7
Executive OfficersPatrick S. O'KeefeChief Executive Officer, President and Director
William C. McCartneyChief Financial Officer and Treasurer
J. Dennis CawteGroup Managing Director, Europe
Ernest E. ElliottExecutive Vice President of Marketing
Michael P. FlandersExecutive Vice President of Manufacturing Operations,North America and Asia
Josh C. FuPresident, Asia
Gregory J. MichaudExecutive Vice President of Human Resources
Taylor K. RobinsonExecutive Vice President of Supply Chain Management
Lester J. TaufenGeneral Counsel, Vice President of Legal Affairsand Secretary
Douglas T. WhiteGroup Vice President
DirectorsRobert L. AyersDirector
Richard J. CathcartDirector
Timothy P. HorneDirector
Ralph E. Jackson, Jr.Director
Kenneth J. McAvoyDirector
John K. McGillicuddyDirector
Gordon W. MoranNon-Executive Chairman of the Board and Director
Daniel J. Murphy, IIIDirector
Patrick S. O'KeefeChief Executive Officer, President and Director
CorporateInformationExecutive Offices815 Chestnut StreetNorth Andover, MA 01845-6098Tel. 978-688-1811 Fax. 978-688-2976
Registrar and Transfer AgentWells Fargo Bank, N.A.161 N. Concord ExchangeSouth St. Paul, MN 55075(800) 468-9716
CounselWilmerHale60 State StreetBoston, MA 02109
AuditorsKPMG LLP99 High StreetBoston, MA 02110
Stock ListingNew York Stock Exchange Ticker Symbol: WTS
Forward Looking Statements
This Annual Report contains “forward-looking” statements within the meaning of the Private Securities Litigation Reform Act of 1995. All statements that relate to
prospective events or developments are forward-looking statements. Also, words such as “believe,” “anticipate,” “plan,” “expect,” “will” and similar expressions
identify forward-looking statements. We cannot assure investors that our assumptions and expectations will prove to have been correct. There are a number of
important factors that could cause our actual results to differ materially from those indicated or implied by forward-looking statements. These factors include, but are not
limited to, those set forth in the section entitled “Risk Factors” in our Annual Report on Form 10-K for the year ended December 31, 2007 included in this Annual Report.
Except as required by law, we undertake no obligation to update or revise any forward-looking statements, whether as a result of new information, future events or otherwise.
For additional information on Watts Water Technologies, Inc., visit our web site at www.wattswater.com
481087.COVER.qx6 3/11/08 1:51 PM Page 2

NYSE
WTS
NYSE
WTS
®
LISTED©watts water technologies, inc. 2008 | wattswater.comAnnual Report 0810
INNOVATIVE WATER SOLUTIONS
watts water technologies, Inc.
annual report 2007
481087.COVER.qx6 3/12/08 6:37 PM Page 1