waterway 365 - kth
TRANSCRIPT

WATERWAY 365 System Analysis of Challenges in Increased Urban Mobility
by Utilization of the Water Ways
Ivan SteniusI, Karl GarmeI, Susanna Hall KihlII and Magnus BurmanIII
IKTH Centre for Naval Architecture IIVattenbussen AB IIIKTH Lightweight Structures

ii
TRITA-AVE 2014-13 ISSN 1651-7660 ISBN 978-91-7595-161-4

iii
Abstract
Effective transport solutions for goods and people are crucial for the economic development of a region or city. In major cities worldwide there is a lack of capacity in the road and rail network resulting in high costs, only in Stockholm the cost of the overall shortcomings of commuting has been estimated to 6.3 billion SEK annually. The current trend is further increased congestions in major existing commut-ing routes (roads, rail networks and metro networks).
In coastal cities like Stockholm, Gothenburg or Copenhagen however, there are inland waterways that would enable shorter and faster commuting routes if efficient land-sea based transportation systems are implemented. In addition the waterway constitutes an opportunity to create new city space, add transport capacity, offer new communication paths, change the transport flow and level off the pres-sure on the present transport system.
The waterways and parts of the road network are existing infrastructure resources that may be used to contribute to more sustainable travel patterns, reduce congestion on main commuting corridors, in-crease capacity and the traffic system's resilience through new travel relationships, travel patterns and synergies with bicycle and city logistics.
The aim of this work is to identify the most relevant research topics and key performance parameters for personal transport and city logistics systems on the waterways in urban environments for year-round service. The long-term goal is to identify transport systems and technical solutions for the wa-terways that can be scaled and adapted to urban environments around the world and that complement the land-based transport systems in order to achieve an over-all sustainable urban mobility.
This work focuses on a systems engineering perspective and includes identification of system bounda-ries and interfaces to other public transport, infrastructure nodes, system service and maintenance and measurement of sustainability and service improvement targets. The aim is to develop a base for a system that can be scaled and adapted to urban environments around the world - like how road or rail-based mass transit systems today are built up from more or less standard units, not to design a public transport solution for a specific city, route or line. The focus is on realistic solutions that are both achievable from a cost perspective and attractive to passengers during 365 days a year. New concepts, ranging from small single person commuters up to large public transport systems, are to be explored and evaluated and key technical challenges identified and targeted.
The research initiative Waterway 365 was initiated by The Royal Institute of Technology (KTH) and Vattenbussen AB with support from the Swedish Maritime Administration (Proj. no: 15041-0).

iv

v
Table of Contents
1 Introduction ............................................................................................................... 7
2 Mission Description .................................................................................................. 8
2.1 Problem Description ............................................................................................ 8
2.2 Opportunity ......................................................................................................... 8
2.3 Mission Statement ............................................................................................... 9
2.4 Legacy Statement ................................................................................................. 9
3 System Stakeholders and Sacred Expectations ...................................................... 12
3.1 Context Diagram ................................................................................................ 13
3.2 Active Stakeholders and their Expectations ..................................................... 14
3.3 Passive Stakeholders and their Expectations ................................................... 17
3.4 Sacred Expectations .......................................................................................... 19
4 Key Performance drivers ........................................................................................ 20
5 Concept Development ............................................................................................. 21
5.1 Concepts ............................................................................................................. 21
5.2 Concept branch A – Mass Transit Concepts ..................................................... 21
5.3 Concept Branch B – Infrastructure Concepts ................................................... 31
5.4 Concept Branch C – Individual Waterborne Transport Concepts ................... 34
6 Operational Scenarios ............................................................................................. 36
6.1 Scenario #1: Tanto to Waldemarsudde ............................................................. 36
6.2 Scenario #2: Ekerö (Bergsvägen) to central Stockholm (Mosebacke) ............. 37
6.3 Scenario #3: Nacka - Karlaplan ........................................................................ 39
6.4 Use Case Sequence Diagrams ........................................................................... 40
7 Concept Evaluation ................................................................................................. 42
7.1 QFD .................................................................................................................... 42
7.2 Pugh-Chart ......................................................................................................... 42
8 Conclusions - Relevant Research Questions and Key Technical Performance Measures ........................................................................................................................ 46
References ..................................................................................................................... 49

vi

7
1 Introduction
The aim of this work is to, through a systems engineering process, identify the most relevant research topics and key performance parameters for personal transport and city logistics systems for year-round service on the waterways in urban environments. The long-term goal is to develop transport systems on the waterways that can be scaled and adapted to urban environments around the world and that complement the land-based transport systems in order to achieve an over-all more sustainable urban mobility.
With sustainability we mean, throughout this report, environmental, social and economic. The scope of this project does not allow for an in depth analysis of all the different aspects of sustainability and hence the environmental aspects are evaluated more quantitatively while the social and economic as-pects are treated more qualitatively. Nor does the report make any difference in terms of where the benefits arise, whether it is in the business sector, the public sector or for the travellers. These are however important aspects that need to be analysed in future studies.
With the great challenges we face today and in the near future in developing new and much more effi-cient means of transport, it is an absolute necessity to address the transport problem in a holistic way with wide system boundaries. With urban mobility in focus, this project hence embraces land-based systems as well as the waterways. The scope becomes very wide and it is important to approach the work in a systematic way to maintain traceability and transparency in the results and conclusions.
The systems engineering process includes stakeholder analysis, identification of performance parame-ters, definition of sacred expectations and concept analysis to enable an objective evaluation towards sustainability and traffic improvement goals of alternative solutions and their respective technical- as well as business- and social challenges. The work includes identification of system boundaries and interfaces to other public transport means, infrastructure nodes and system services and maintenance.
This project is part of the KTH (Department of Vehicle and Aeronautics) work on inland waterways. It is a highly multi-disciplinary project, and in this initial phase where subprojects are identified at dif-ferent levels of TRL (technology readiness level) - research, demonstration, design or investigations – an additional important part of the work is to identify collaborative organizations and agencies.
8
2 Mission Description
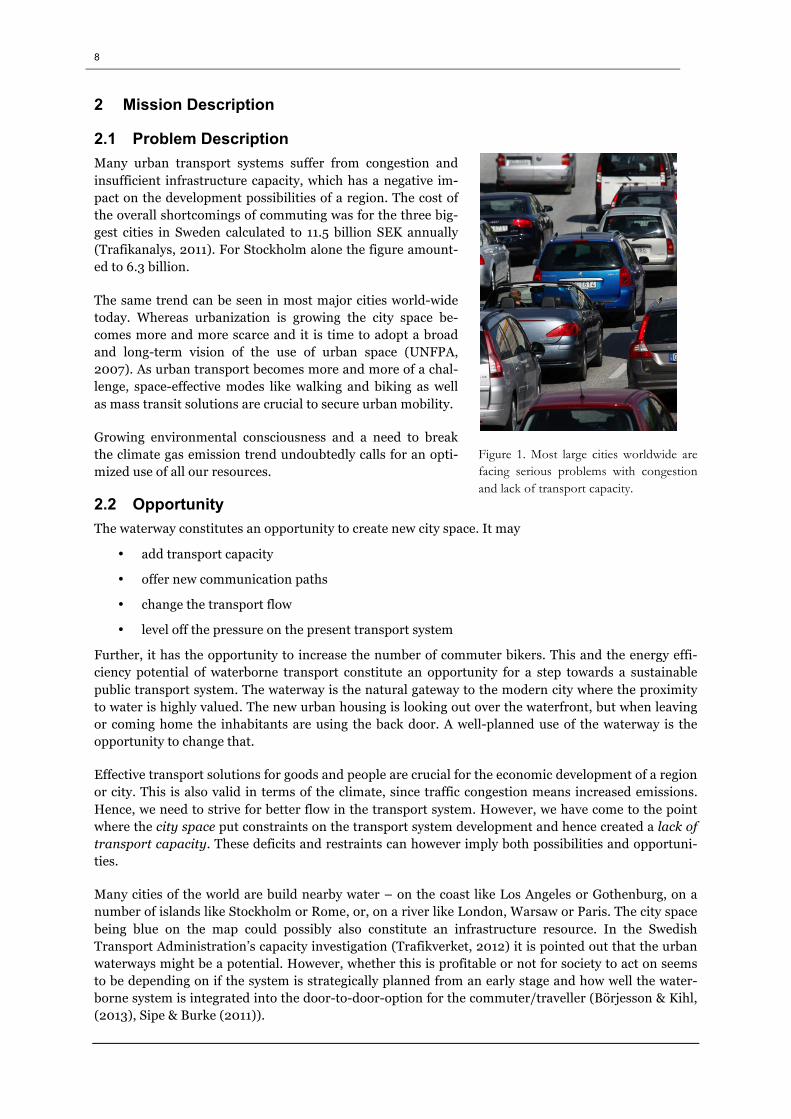
2.1 Problem Description Many urban transport systems suffer from congestion and insufficient infrastructure capacity, which has a negative im-pact on the development possibilities of a region. The cost of the overall shortcomings of commuting was for the three big-gest cities in Sweden calculated to 11.5 billion SEK annually (Trafikanalys, 2011). For Stockholm alone the figure amount-ed to 6.3 billion.
The same trend can be seen in most major cities world-wide today. Whereas urbanization is growing the city space be-comes more and more scarce and it is time to adopt a broad and long-term vision of the use of urban space (UNFPA, 2007). As urban transport becomes more and more of a chal-lenge, space-effective modes like walking and biking as well as mass transit solutions are crucial to secure urban mobility.
Growing environmental consciousness and a need to break the climate gas emission trend undoubtedly calls for an opti-mized use of all our resources.
2.2 Opportunity The waterway constitutes an opportunity to create new city space. It may
• add transport capacity
• offer new communication paths
• change the transport flow
• level off the pressure on the present transport system
Further, it has the opportunity to increase the number of commuter bikers. This and the energy effi-ciency potential of waterborne transport constitute an opportunity for a step towards a sustainable public transport system. The waterway is the natural gateway to the modern city where the proximity to water is highly valued. The new urban housing is looking out over the waterfront, but when leaving or coming home the inhabitants are using the back door. A well-planned use of the waterway is the opportunity to change that.
Effective transport solutions for goods and people are crucial for the economic development of a region or city. This is also valid in terms of the climate, since traffic congestion means increased emissions. Hence, we need to strive for better flow in the transport system. However, we have come to the point where the city space put constraints on the transport system development and hence created a lack of transport capacity. These deficits and restraints can however imply both possibilities and opportuni-ties.
Many cities of the world are build nearby water – on the coast like Los Angeles or Gothenburg, on a number of islands like Stockholm or Rome, or, on a river like London, Warsaw or Paris. The city space being blue on the map could possibly also constitute an infrastructure resource. In the Swedish Transport Administration’s capacity investigation (Trafikverket, 2012) it is pointed out that the urban waterways might be a potential. However, whether this is profitable or not for society to act on seems to be depending on if the system is strategically planned from an early stage and how well the water-borne system is integrated into the door-to-door-option for the commuter/traveller (Börjesson & Kihl, (2013), Sipe & Burke (2011)).
Figure 1. Most large cities worldwide are facing serious problems with congestion and lack of transport capacity.

9
Generally the waterways are not considered in the urban development planning. But if the waterways were to be considered in a strategically planned way, this could stimulate the economic development for the region (Camay et al., 2012). The waterways could be used in many different ways, e.g. people, goods, city logistic solution or for enhancing the cruising range for bikers or bicycle messengers, see for instance the study for the Stockholm region SL(2011). The expression “across is always closer than around” is valid for passengers whether they travel by foot, by bike or by car and can contribute to decreasing the overall number of passenger kilometres.
The main reason for the renaissance of the bicycles as an urban transportation solution is probably in fact the lack of city space. No wonder, since it is 90 % more space effective to travel by bike than by car in terms of road space (CyCity 2012). Besides being able to support bicycle cruising range, urban wa-terways actually constitute a kind of new city space that so far have not been calculated within this urban planning context. The road space needed for supporting the waterways is the ones securing con-nectivity, which might not be the ones lacking capacity.
Another relevant urban challenge in many cities is lack of housing. A good supply of housings is im-portant not only for the individual but also for the development of the society as a whole. Lack of hous-ing effects everything from childbearing to increased sustentation burden and the overall appeal of a region. Taking Stockholm as an example an addition of approximately 300 000 housings (out of which 260 000 newly produced) is required in order to meet the need derived from the regional development plan, RUFS 2010 (Häggroth, 2011). By using the waterways, housing areas that earlier have proved to lack sufficient accessibility could be exploited and provided with waterborne public transportation.
2.3 Mission Statement The goal of this project is to illustrate how urban waterways can be used in order to add sustainable transport capacity to congested cities or regions and to identify relevant research questions and tech-nical key issues (show stoppers) in making use of the waterways as an infrastructure during all 365 days a year.
2.4 Legacy Statement
2.4.1 History Public Transport in Sweden has a long history. Already in the 19th century the public travelled by steamboats. Later on the traffic was developed and the larger cities got trams, which were at first drawn by horses and later on electrified. After that came the combustion engine being installed in bus-es and taxis. The government’s interest in public transportation grew during the 20th century and by the end of 1970’s the public transport market was shattered between different companies with their many variants of taxes and ticketing systems. By that time the parliament decided to appoint a respon-sible authority in each county, who should decide about traffic supply and taxes.
2.4.2 Legislation In January 2012, a new public transport legislation (Prop 2009/10:200) was introduced in Sweden, which six months later was extended to include the waterways (Prop 2011/12:76). Through this new law local and regional public transport markets are opened for private initiatives, which provides an opportunity for a (possibly) better supply of public transport that both commuters and society would benefit from. Besides this, the intention of the new law is to, at least partly, shift the financial burden from society to the private sector/commuters and to enable a shift from the private car commuting to more space effective travel solution such as mass transit. In the wake of the new law the organizational structure around public transport has been altered. So far, however, an evaluation of the public transport reform (Trafikanalys, 2013a) proves a limited interest from the business sector for operating commercial mass transit under the circumstances of today.

10
2.4.3 Market share Less than 0.7 % of the total Swedish public transport travelling is waterborne (Trafikanalys, 2013b). Of course there is not water everywhere, but the longest coast line in Europe and many of the bigger cities near water seem to hide a potential. Our modern society uses waterborne transport mainly for accessi-bility to islands (i.e. more rural areas), not for connectivity reasons in the middle of high-density cities or regions. However, as the city space becomes scarcer in parallel to increased congestion, the water-ways become interesting once again (UITP, 2013).
2.4.4 Fleet Local tradition is strong and the waterways is often accused of only having little capacity to offer, which however, does not seem to be supported by facts. The Swedish passenger fleet is out of date and old, heading towards an average age of 50 years. If the waterways should be able to add additional sustainable transport capacity investments in new and optimized vessels is a necessity.
Figure 2. Average age of member vessels year 2013 (in total 350 vessels), Statistics from Skärgårdsredarna (Swedish trade organization for shipping companies with passenger ferries with up to 500 passengers in national traffic) 2013.
2.4.5 Ice On latitudes with temperatures below zero the use of waterborne transportation are at times restricted due to the presence of ice. If a vessel is to operate in icy conditions special design considerations apply which generally result in a more heavy solution. This will then lead to increased fuel consumption and thereby increased operating costs and environmental footprint year around. An alternative is to fully utilise lightweight craft design principles and then simply refrain from operating during winter condi-tions. This may result in insufficient use of capital investments and impose a risk that such attractive public transport only is available during times with open waters. However, innovative technical solu-tions and/or adaptation of the vessel operational profile during icy conditions might provide new al-ternatives to the two options described above.

11
2.4.6 The public transport industry Analysing Swedish public transport it is relevant to acknowledge the work being performed from 2008 and onwards by the actors within the public transport sector – Partnersamverkan för en fördubblad kollektivtrafik. This has been a joint collaboration aiming at a doubled public transport share ap-proaching a higher attractiveness of the public transport as a whole. The work within the industry has illuminated relevant perspectives valid for all types of mass transit and jointly discussed how to make the best out of the new legislation (see Partnersamverkan för en fördubblad kollektivtrafik (2012)). Further they have identified questions that need to be further investigated (K2 & Svensk Kollektivtraf-ik, 2013).
2.4.7 The commuter/traveller When working with these questions, it is essential to realize that the commuter has the veto power on how to travel - if he/she should take the car, walk, bike, use public transportation or a combination of these options. Therefore research with wider system boundaries is needed in order to spread some light on possible sustainable solutions (K2 & Svensk Kollektivtrafik, 2013).
Commuters and travellers generally try to minimize their travel time. Thus longer commuting distanc-es normally requires higher speed. This is, however, not necessarily the case if the travel and/or wait-ing time is perceived as being valuable and/or productive. Commuters/travellers seem to be more in-fluenced by the total travel time from door-to-door rather than the travel time on-board a vessel in itself. Hence, optimized intermodality and higher frequency gives the opportunity to lower the water-way speed without compromising with appeal (Kamen & Barry, 2007 & 2011). Less number of changes during the trip, a perceived flow and a perception that the trip is a shortcut seems generally to be at-tractive to the travellers.
Changing the commuters’ behaviour is another crucial challenge, SL(2011a). Addressing the difficulty in changing travel patterns it is also important to raise the importance of enabling the use of the wa-terways 365 days a year, otherwise forcing the ferry commuters over to other public transport during winter conditions (SMHI, 2009). A timing that also coincides with a higher mass transit demand (SL, 2012).

12
3 System Stakeholders and Sacred Expectations
This section provides an overview of the most relevant stakeholders (individuals or systems) for a wa-ter-based urban transport system according to the list below. From this overview, the stakeholder ex-pectations and key performance parameters and the sacred expectations are derived.
Commuters/travellers: • Actual users of the system • Other commuters or travellers indirectly influenced by the lifting effects of the system on the
transport system as a whole
ICT systems: • Trip-planners & booking apps/systems • Ticketing systems • Check-in and notification systems • GPS-satellites & mobile data networks • AIS-system
Marketing and sales Connecting transport systems and stakeholders behind them (e.g. rental bike systems, shut-tle buses, other buses, trains, subways, trams, taxis, private cars, car pools etc):
• Public transport systems and planners such as RKTM in Sweden (regional public transport au-thorities)
• Private transport systems and planners of the same • Operators • Vehicle owners • Infrastructure owners / road keepers – counties/municipalities /road authorities/land owners
(road systems, bike lanes etc) • Infrastructure maintenance organizations
Intermodal stakeholders:
• Property owners – for parking & transit areas commuter parking, connection points, as well as depot and maintenance areas
• Municipalities (in Sweden the counties/municipalities have the power to decide how the land should be used and developed, and are in charge of permits, layout plans and local plans).
• Operators of transit areas • Land-sea transition systems (zones/ramps) • Port & harbour administration (e.g. Port of Stockholm)
Waterway stakeholders:
• Infrastructure maintenance organizations • Ferry operators • Ship designers • Ship developers • Manufacturers & sub-contractors • Search and Rescue organisations
Investors:
• Public transport authorities • Ship owners • Crowds e.g. users

13
Governmental authorities: • National Transport and Maritime Administrations (Trafikverket, Sjöfartsverket) • Regulatory and supervisory authorities (such as Transportstyrelsen, Länsstyrelser i.e. county
administrative boards, ship classification organizations, etc) Politicians
• National • Regional • Local (municipality level)
3.1 Context Diagram There are a large number of stakeholders in a door-to-door public transport system. The stakeholders are here divided into active and passive stakeholders, where active means an active participation in the systems when it is in use, and passive stakeholders means that the stakeholder is affected by the sys-tem or influences the system somehow (by for example imposing constraints). The context diagram (figure 4) gives an overview of the system interactions with active and passive stakeholders. The sys-tem boundaries are defined by the arrows going in/out from the waterway-365 system box. The wa-terway-365 system constitutes the waterway transport services in terms of ships/ferries and land-water transition nodes.
Figure 3. Context diagram.
14
3.2 Active Stakeholders and their Expectations Active stakeholders are identified as those individuals or systems that will interact with the completed system once it is in service. Table 1 provides a list of active stakeholders for the system and their expec-tations for a system that addresses the mission statement. Each stakeholder expectation is classified as either a capability (functional) or characteristic (non-functional). A brief description of each active stakeholder’s interaction with the system is presented below.
• Commuters/travellers – End users of the system. Their interaction with the system con-cerns all steps throughout the whole system, from information and ticketing, to travel options, connectivity, changing points, comfort on board etc. from door-to-door.
• Marketing and sales personnel – Inform commuters that the travel option is available. • Trip planners and booking apps – Inform commuters that the travel option is available
and ensure space on board. • Ticketing systems – Charge the commuters and ensure correct flow of money. • Check-in systems – Empower the commuters/travellers to use their time in a valuable and
effective way. • RKTM – regional public transport authority – Management of public transport systems.
(RKTM may be both active and passive. Active when involved in the everyday management of the system and passive when planning and otherwise managing the public transport systems, e.g. Trafiknämnden, SLL 2012 & 2013).
• Other connecting transport systems – Private businesses e.g. rental or pool systems for cars or bicycles, private shuttle systems etc. Present alternative connecting transport.
• Infrastructure maintenance (e.g. roads, rails, ) – Ensuring that connecting transport op-erates as expected.
• Operators of connecting transport – Ensure connectivity to the system. • Operators of transit points – Makes the commuters’ waiting time valuable and comforta-
ble. • Maintenance of land-sea interface – Ensuring effective and convenient embarkation and
debarkation. • Ferry operators – Carry and move travellers over water. • Maintenance of the waterway infrastructure – Enable sustainable waterborne trans-
portation 365 days a year.
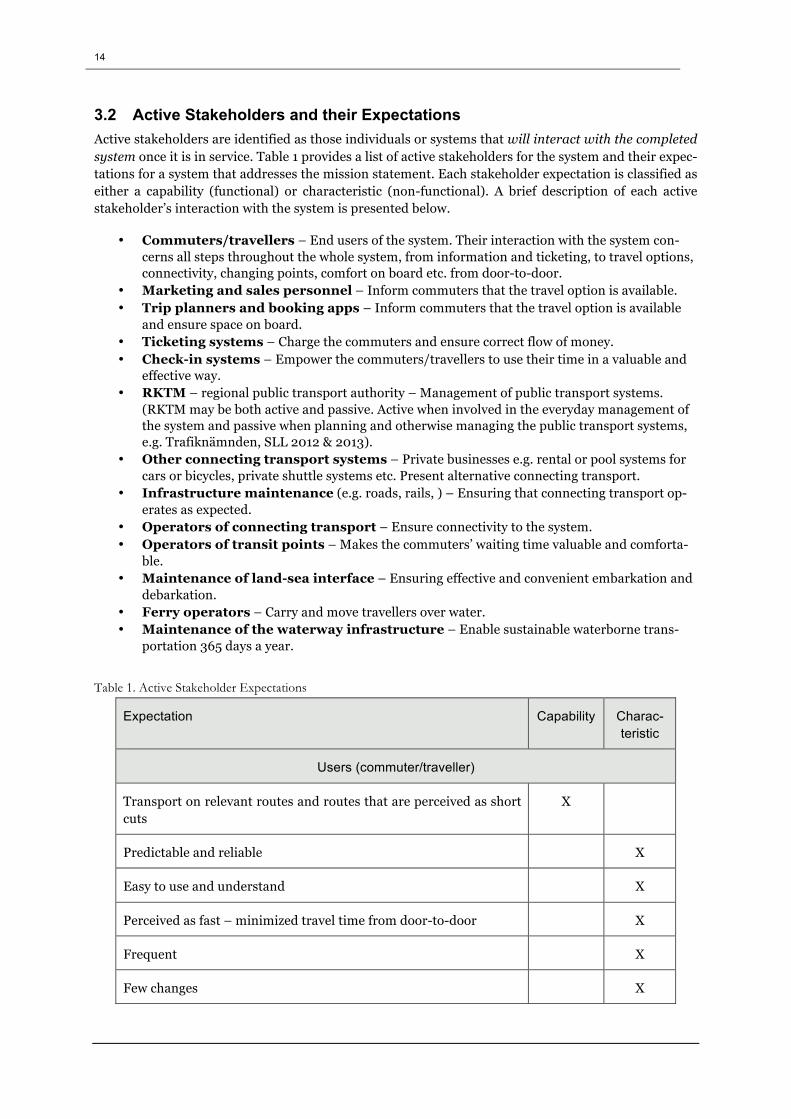
Table 1. Active Stakeholder Expectations
Expectation Capability Charac-teristic
Users (commuter/traveller)
Transport on relevant routes and routes that are perceived as short cuts
X
Predictable and reliable X
Easy to use and understand X
Perceived as fast – minimized travel time from door-to-door X
Frequent X
Few changes X
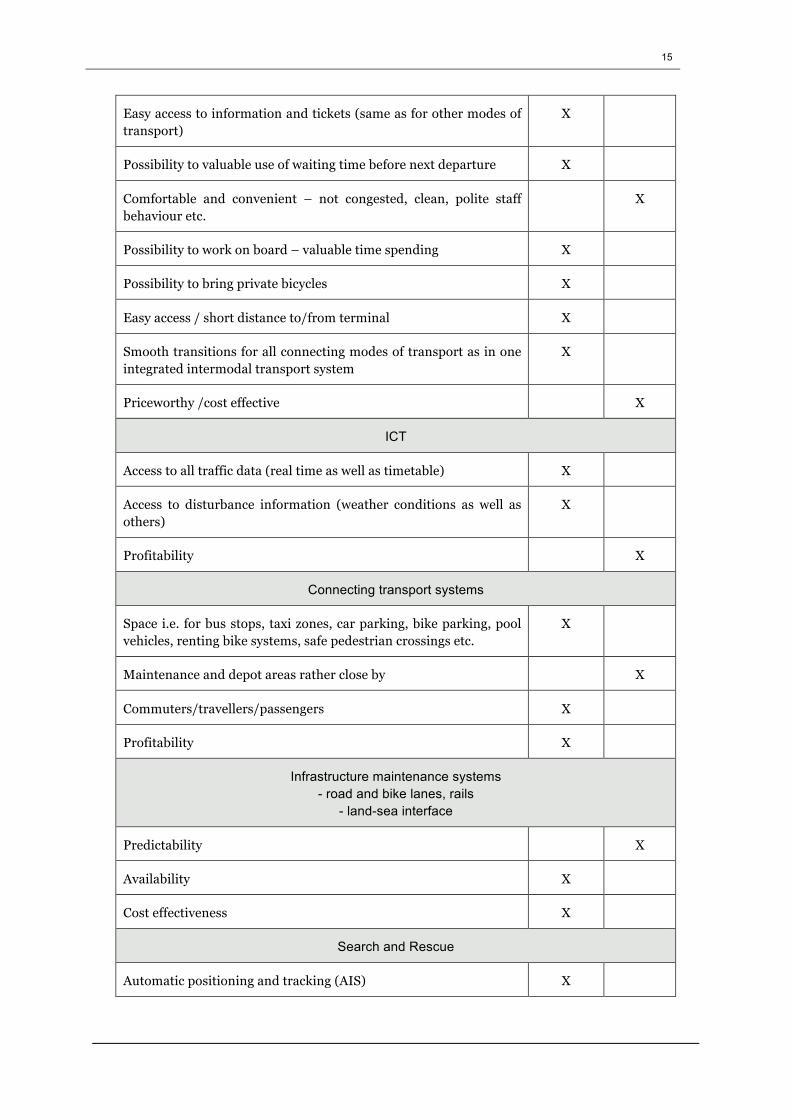
15
Easy access to information and tickets (same as for other modes of transport)
X
Possibility to valuable use of waiting time before next departure X
Comfortable and convenient – not congested, clean, polite staff behaviour etc.
X
Possibility to work on board – valuable time spending X
Possibility to bring private bicycles X
Easy access / short distance to/from terminal X
Smooth transitions for all connecting modes of transport as in one integrated intermodal transport system
X
Priceworthy /cost effective X
ICT
Access to all traffic data (real time as well as timetable) X
Access to disturbance information (weather conditions as well as others)
X
Profitability X
Connecting transport systems
Space i.e. for bus stops, taxi zones, car parking, bike parking, pool vehicles, renting bike systems, safe pedestrian crossings etc.
X
Maintenance and depot areas rather close by X
Commuters/travellers/passengers X
Profitability X
Infrastructure maintenance systems - road and bike lanes, rails
- land-sea interface
Predictability X
Availability X
Cost effectiveness X
Search and Rescue
Automatic positioning and tracking (AIS) X
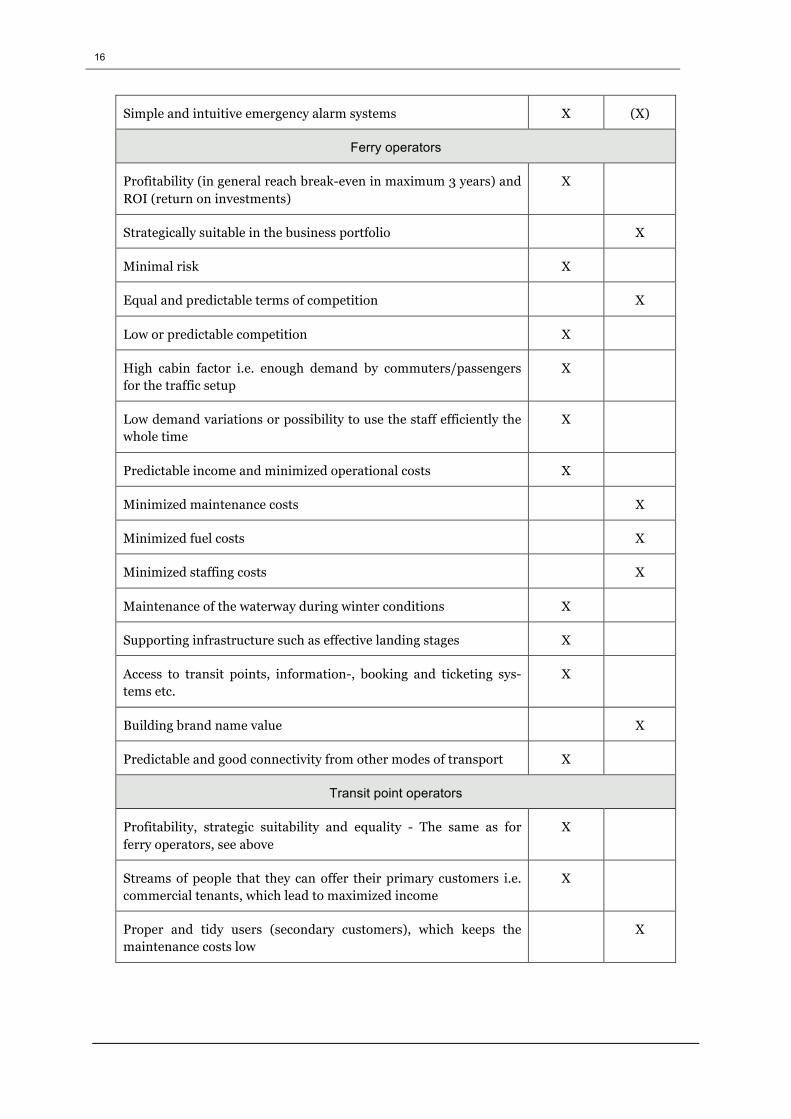
16
Simple and intuitive emergency alarm systems X (X)
Ferry operators
Profitability (in general reach break-even in maximum 3 years) and ROI (return on investments)
X
Strategically suitable in the business portfolio X
Minimal risk X
Equal and predictable terms of competition X
Low or predictable competition X
High cabin factor i.e. enough demand by commuters/passengers for the traffic setup
X
Low demand variations or possibility to use the staff efficiently the whole time
X
Predictable income and minimized operational costs X
Minimized maintenance costs X
Minimized fuel costs X
Minimized staffing costs X
Maintenance of the waterway during winter conditions X
Supporting infrastructure such as effective landing stages X
Access to transit points, information-, booking and ticketing sys-tems etc.
X
Building brand name value X
Predictable and good connectivity from other modes of transport X
Transit point operators
Profitability, strategic suitability and equality - The same as for ferry operators, see above
X
Streams of people that they can offer their primary customers i.e. commercial tenants, which lead to maximized income
X
Proper and tidy users (secondary customers), which keeps the maintenance costs low
X
17
3.3 Passive Stakeholders and their Expectations Passive stakeholders are identified as those individuals or systems that affect or are affected by the system, e.g. by providing input or requirements. Table 2 provides a list of passive stakeholders for the system and their expectations for a system that addresses the mission statement. Each stakeholder expectation is classified as either a capability (functional) or characteristic (non-functional). A brief description of the passive stakeholder’s interaction with the system is presented below.
• Governmental authorities / Society – Develop transport system strategies, legal frame-work and set of regulations. Supervise.
• Strategic regional and city traffic planners – Enabling a seamless system. Their interac-tion with the system will consist of planning for connectivity in terms of housing, relevant bike lanes, roads, safe parking spaces (for both car & bicycles), bus schedules, transition/changing points etc.
• Strategic urban planners – Enabling the build-up of new housings conveniently close to public transport.
• Research institutes – Develop energy efficiency, vessel materials, increase knowledge needed for decisions etc.
• Ship designers – Develop modern sustainable vessels that can operate 365 days a year. • Manufacturers / ship yards – Produce new vessels and provide certain maintenance. • Vessel subcontractors i.e. producers of materials, energy systems, propulsions etc • Property owners – Provide space for transit points, parking, connectivity etc. • Politicians • Investors/funders/sponsors – Invest in modern fleet and relevant vessels.
Table 2. Passive Stakeholder Expectations.
Expectation Capability Charac-teristic
Governmental authorities / Society
Availability and accessibility (Prop 2008/09:93) X
Safe – nobody should be killed or severely injured (Prop 2008/09:93)
X
Limited climate effects through increased energy efficiency and broken fossil dependence (Prop 2008/09:93)
X
Fossil independent – in year 2030 Sweden should have a fleet of vehicles independent of fossil fuels (Prop 2008/09:162)
X
Space efficient – promoting walking and biking (SLL 2013) X
Adding transport capacity in urban areas X
Trustworthy and robust X
Flexible and smooth (undisturbed) X
Created job opportunities X
Contributing in reaching climate quality objectives and increased health
X
18
Strategic traffic planners
Intermodal attractive and space effective transport X
Strategic urban planners
Lowered deficit of housings, preferably close to public transport X
Manufacturers / ship yards
More business and orders X
Vessel subcontractors
Bulk production in order to generate more business X
Property owners
Increase value of their property due to public transport presence X
Politicians
Successful demonstration objects that create voters X
Fulfilment of transport political goals X
Investors/funders/sponsors
Return on investment (ROI) X
Do something positive for the environment and/or city X
Public Transport Authorities (RKTM)
To supply attractive and effective public transport with minimal negative impact on environment and health
X
…in an accessible and coherent region X
Predictable supply and therefore an everyday function, 365 days a year, although it might be winter conditions
X
Cost effectiveness X
An obvious choice for commuting / travelling X
An increased share of the motorized travelling in the region X
19
Municipalities
Accessibility for their inhabitants X
Maximized income/value of their properties and taking part of in-creased property value due to mass transit presence
X
Synergies for local businesses and tourism X
Influence, significance and power X
Ship owners
Efficient use of assets in order to increase ROI (return on invest-ment).
X
Preserved asset value i.e. satisfying maintenance of the ships X
3.4 Sacred Expectations From the stakeholder analysis performed above the sacred system expectations are defined as listed in Table 3.
Table 3. Sacred expectations.
No. Sacred Expectations
S1 Provide increased urban transport capacity
S2 …during all 365 days of the year
S3 … in a more or equally attractive and sustainable way as existing solutions
S4 …before 2020.

20
4 Key Performance drivers
The design of the envisioned system is influenced by a variety of factors. The key system drivers are presented in Table 4. The key performance drivers (KPD) will be addressed in the system design to meet the system performance requirements.
Table 4. Performance drivers.
No. Sacred Expectations Key Performance Drivers Performance Drivers
S1 Increase urban ca-pacity…
Selection of waterborne transport solutions and ability to attract commuters.
• time at terminal • departure frequency • pax capacity • vessel speed
S2 …during all 365 days a year…
Ice-going capacity and maintenance of the waterways during winter conditions.
• navigation in ice
S3
… in a more or equally attractive and sustainable way as existing solu-tions…
Energy consumption/person-kilometre
• power source • fuel • vessel design’s suitability
for modularisation and rational manufacturing
• energy efficiency Accessibility for everybody • bike capacity
• adaptation for function disabled passengers
• light cargo • interface with other
means of transport • ticketing system
Cabin Factor
• departure frequency • comfort • time at sea • size of vessel (no of pax)
Business Models • new subsidy solutions
S4 …before 2020. Technology Readiness Level, TRL, of selected solutions

21
5 Concept Development
5.1 Concepts We have identified three different concept branches:
A. Mass Transit Concepts Waterways a fully integrated part of the public transport system. Additional capacity, mobility and resilience to the mass transit system. Better connectivity for passengers with / without bikes and smaller goods/light cargo.
B. Infrastructure Concepts (bridge or tunnel substitute) Ferry solutions dedicated to buses, bikes and/or pedestrians. Supporting, enhancing and im-proving the overall transport system (minimizing total number of personal kilometres, in-creasing accessibility and mobility).
C. Individual Waterborne Transportation Concepts Enabling the same flexibility and privacy for the commuter/traveller as the car (e.g. Newt).
For all concept branches the concept generation is focusing on the following performance drivers (also presented in Table 4). One of the key performance drivers for the Nordic climate is the capability for ice-going capacity. It is in the concept evaluations assumed that this is solved by either own ice-braking capacity or assisted with ice-strengthened ships. At this stage the different concepts are not compared or valued.
− navigation in ice
− time at terminal (embark/debark)
− departure frequency (time between departure)
− time at sea
− pax capacity (number of sitting/standing)
− bike capacity (number of)
− power source (electrical engine/combustion engine)
− fuel (electricity (battery/air cable), gas (fossil/bio), methanol (fossil/bio), conventional (fossil))
− vessel design’s suitability for modularisation and rational manufacturing
− comfort (space, conditions for working, cafeteria, news stand, etc)
− energy efficiency i.e. power consumption/paxkm (vessel weight, speed, vessel resistance, wash, etc)
− Technology readiness level, TRL
5.2 Concept branch A – Mass Transit Concepts The transit points or nodes of the public transport system connect road, rail and water seamlessly. The payment system is not interfering with changes between lines or modes of transport. The traveller plans the trip without reflecting on whether it goes on road, rail or water.
This concept branch is developed focusing on the waterborne part and the land-sea interface (e.g. new ferry solutions as in Figure 4). The following are prerequisites for this concept branch:
− Year-round operation of the land based part of the public transport system.
− The terminal is a node integrated to the local main flow of the public transport system. Just a

22
possibility to reach the terminal by for instance a low frequency bus or tram link is not enough for being considered as an integrated node.
− Ticket notification shall not affect the embarkation or the departure time.
− The waterborne part of the public transport system is based on a certain volume so that the organizational and material resources to provide infrastructure maintenance (e.g. ice clear-ance and traffic management) and vehicle maintenance (servicing and replacement units) can be efficiently used and cost effective.
Based on the performance drivers and the difference between city traffic and suburban service, the concept branch is split in two. The suburban service is characterised by pronounced rush hours in the morning and afternoon with more or less unidirectional passenger flow while the city traffic is charac-terised by short distances, high departure frequency and short time at sea. This leads to the conclusion that the transport unit, the City boat, for city traffic should be smaller but with a generally high depar-ture frequency compared to the Suburban shuttle which will be serving the more remote, and less pop-ulated parts of the city. This is similar of course to city busses and articulated or bi-articulated busses used in bus rapid transit schemes.
Figure 4 shows an example of a city boat concept developed by students (Linnea Våglund, Karin Bodin, Harsha Cheemakurthy, Johan Fridström, Urban Andrén and Simon Eklund) at KTH and Konstfack in a collaborate student project in the course Marine Innovation at KTH Centre for Naval Architecture. The concept came on 5th place in the TRA-VISIONS 2014 academic competition and will be included in the VISIONS-TRA book that will be widely disseminated to the industry. Sjöbanan is a boat train that will be powered by one locomotive-boat. It could vary in size to fit the routs and number of passengers. It will cover routs from different parts of the big island around Stockholm to commuter hubs in the city like Slussen.
Figure 4. Example of a futuristic vision of a waterborne public transport system (Sjöbanan) for the inner city water-ways developed by students at KTH and Konstfack in a collaborative student project in the course Marine Innova-tion given at KTH Centre for Naval Architecture.
23
5.2.1 A1- The City boat The City boat is the waterborne complement to busses, trams and underground. It is intended for dis-tances less than 3 nautical miles (5.5 km) with the most common distance between terminals to be less than 1.5 nautical miles (corresponding to the distance between 3 bus stops or 1-3 underground sta-tions). The travel time is typically a few to 10 minutes. The passenger compartments are inspired by subway cars, but with a slightly lower proportion of standing passengers, approximately 1.5 standing per seated which is a normal rate for city buses. To fit into the urban pace the departure frequency must be less than approximately 10 minutes (with reference to Stockholm the departure frequency of the major bus lines during rush hours are around 5 min). High frequency plays an important role. When it comes to ice conditions and the ice braking capacity for the City boat concept it is catered for by assisting units (harbour tugs or icebreakers) similar to the support units for land based public transport. The time at terminal including mooring is considered a performance driver that is strongly influenced by embark/debark time and docking. To keep this time down the City boat moor alongside and the passenger flow is through several sets of sliding doors as for underground and commuter trains. The time to embark/debark is estimated to 1.5 minutes per 100 pax and 25 bikes, scaled from figures presented by Hallberg et. al. (2008).
The short distances between terminals indicate that the efficiency of the journey is not only dependent of the speed at sea. (Travel time A-B include: transfer time, time waiting at terminal, embarking, dock-ing time, time at sea, docking time, time to debark, transfer time). Therefore and considering the strong correlation between speed and energy consumption the City boat is given a design speed of 10 knots or 18.5 km/h. This is similar to the mean speed 17.6 km/h reported by Blomquist P (2013) for the city bus and tram service in Gothenburg. Providing a measure to relate to, the time at sea is re-duced by 1.5 minutes if the speed is increased from 10 to 12 knots for a 1.5 nautical mile (2.7 km) route.
The City boat is lighter than traditional passenger ships. The target level for the payload is 35-40% of the displacement whereas traditional passenger ferry generally are 20%. Reference projects are the mono-hull Hammarby ferry with a payload displacement ratio of 25% (Stockholm stad 2000) and the twin-hull design Älvis with a ratio of 45% (Hallberg et al. (2008)) both designed for urban traffic. A lighter craft shall here be interpreted as a more simple ship than traditional vessels justified by short journeys in sheltered waters. The weight save should save material and manufacturing cost, minimize installed propulsion power and fuel consumption. Larger payload-displacement ratio will increase the change in ship draught during the embark/disembark procedure influencing the terminal-vessel inter-face. The mono-hull concepts due to their larger water plane area are less sensitive to this compared with the twin-hull concepts. A lighter craft, with the passengers on top, might be more difficult to de-sign for stability. In this respect the twin hull might be a favourable concept. Among the reference craft are also the Älvsnabben (in service today) and the new Älvskytteln II representing where we are today. Neither of these are considered adequate for the City boat concept due to both size and energy con-sumption. Still it is of course worth noticing that also the Älvsnabben seems to be competitive to buses when it comes to energy efficiency. With this in mind the difference in energy efficiency between (idea design) Älvis and the (in service) craft Älvsnabben is extraordinary. The latter is a traditional design and the Älvis a lightweight craft design. Although the figures on Älvis are uncertain they illustrate the potential in designing lighter and more energy efficient craft.
The city boat concept pallet is, based on the above, limited to two main variants mono-hull/twin-hull with versions powered by electrical or combustion engines.

24
Table 5. The City boat concept pallet. City boat, distance at sea<3M
Reference craft Concept craft
Hammarby ferry
mono hull
Älvis Älv-snabben
Älv-skytteln
II
C1/2 Monohull
Electr/combust
C3/4 Monohull
Electr/combust
C5/6 Twinhull
Electr/combust
C7/8 Twinhull
Electr/combust
Reference craft: Hammarby Hammarby Älvis Älvis
Design speed [kt] 12 8 12.5 8 9.8 10.1 10 10
Installed power [kW]1
400 1002 1324 ?/350 95 121 113 135
Power at design speed (80%)
320 80 1059 ?/280 76 97 90 108
kWh/persKm (100%)
0.06 0.027 0.102 0.042/0.063
0.03 0.04 0.039 0.047
kWh/persKm (65%)3
0.09 0.04 0.16 0.07/0.104
0.05 0.06 0.06 0.07
Fn 0.39 0.26 0.37 0.23 0.39 0.39 0.39 0.37
Time at sea5 (3 nau-tical mile) [min]
16.0 23.5 15.4 23.5 19.4 18.8 19.0 19.0
Time at sea (1.5 nautical mile) [min]
8.5 12.3 8.2 12.3 10.2 9.9 10.0 10.0
Length [m] 26 25 31.5 32 17 18 18 20
Breadth [m] 6.5 10 8.1 7.9 4 5 6.0 7.0
Deck area for pax & bikes
114 165 165 50 58 62 87
Number of seats 102 150 158 73 50 50 50 75
No. of pax standing (or seats on upper deck)
148 50 290 227 75 75 75 50
Bike capacity [no of (20kg)]
40 50 20 80 0 25 40 40
Scale factor rel. ref 1 1 0.66 0.71 0.8 0.9
The two envisaged City boat concepts are both sketched for max 125 passengers, 50 seated, corre-sponding to common capacity of 18 m articulated busses. Passenger compartments are at one level. The reference crafts, Hammarby Ferry and Älvis, are in fact designed for urban public transport but in this context considered as too large. Stressing the importance of departure frequency and the travel time door-to-door, the speed at sea for those short distances is subordinate. At the proposed design speed (around 10 knots or 18.5 km/h) the energy consumption, estimated for 65% fullness is less than for busses, a fair estimate is to say, in the range between trains and busses at present state of technolo-gy (based on Stenqvist (2002), Table 6). Illustrative is also the graph in Figure 5 Trafikverket (2014) on energy consumption and emission for transportation modes in relation to private car.
1 Estimated for the concept C1-C4 as the ref. craft installed power times the scale factor to the power of 3.5. For the catamaran concepts the estimated installed power is taken as twice the reference craft installed power times the length scale factor to the power of 3.5. 2 Estimated from the power demand at acceleration (72.6 kW) given by Hallberg et al. (2008). 3 The energy consumption is estimated from assuming that 80 % of installed power is the mean power outtake. Fur-ther, the figure is based on 65 % capacity usage. 4 The lower figure is taken from Karlson & Forsberg (2013) and the higher is estimated from figures on energy de-mand Carlsen & Gustavsson (2012). 5 Time at sea is calc as distance divided by design speed + 1 min.

25
Table 6. Energy consumption and emission per person-kilometre for different transportation modes, Stenquist (2002).
Vehicles Energy cons (kWh/paxkm)
CO2 (g/paxkm)
Car 1) 0.33 110 Bus 2) 0.15 6) 15 Train 3) 0.05 1 Air (domestic) 4) 0.66 171 Air Boeing 787 5) 0.29 76 1) Average car 1997 year with 2 passengers. 2) Large bus 1997 with 60 passengers. 3) Inter city 65% occupancy. 4) Travel within Sweden with 65% occupancy. 5) Average travel Hongkong-New York 65% occupancy. 6) Approximation based on Lenner (1993) stating 0.07
kWh/paxkm for bus at 80% fullness and 0.22 for bus at medium fullness and 0.46 at 10% fullness.
Figure 5. Energy consumption and emission for different transportation modes in relation to private car (index 100), Trafikverket(2014).
The mono-hull concept can be favourable for these relatively small units. The weight of the passengers is relatively large in relation to the craft displacement and so the “unnecessary” transport is limited but the stability is impaired. Removing even more craft weight might be possible with a catamaran concept but with the drawback that the changes in draught during embarkation/debarkation might be too large. Means to meet this would be to widen the semi hulls thus enlarging the water plane area. This might on the other hand lead to unfavourable resistance characteristics. In essence; a mono hull con-figuration might be a good choice for the City boat. For larger units, with a requirement on passenger compartments on one deck level, the catamaran is most likely the better solution.

26
The following example illustrates the City boat running the waterway providing shortcuts and adding new routes, i.e. capacity, see Figure 6 (in Stockholm this could for instance be routes on Saltsjön). The City Boats operate between two terminals or in a round-trip service for the 3 terminals. Estimation of departure frequency, journey time and capacity with different numbers of boats in service are summa-rized in Table 7. Shuttling and round-trip services can of course be combined for instance using 4 ves-sels in round trip during peak hours (one departure every 11 min with a capacity of 4000 pax/hour) turning to shuttle service with 3 units during off peak hours (departure every 12th to 19th minute with a capacity of 3100 pax/hour).
Table 7. Example on City boat service. Time at sea is calculated as distance divided by design speed plus 1 min. The City boat is assumed to stop 2 min at terminal. Craft: C3/4 Route I Route II Route III Number of
boats in traffic Max number of pax/hour
Distance [nautical miles] 0.5 0.7 1 Distance [km] 0.93 1.30 1.85 Time at sea [min] 4.0 5.2 6.9 Shuttle service Departure frequency 11.9 14.3 17.9 3 Capacity (pax/hour in each direc-tion, 2 min at terminal)
628 524 419 3 3143
Departure frequency (Xth minute) 6.0 7.2 8.9 6 Capacity 1256 1048 839 6 6286 Round trip service Departure frequency 22.1 22.1 22.1 2 Capacity (pax/hour in each direc-tions, 2 min at terminal)
340 340 340 2 2039
Departure frequency 11.0 11.0 11.0 4 Capacity 680 680 680 4 4078 Departure frequency 7.4 7.4 7.4 6 Capacity 1020 1020 1020 6 6117

27
Figure 6. Example routes for the City boat.
5.2.2 A2- The Suburban shuttle The Suburban shuttle is intended for distances between 3 to 10 nautical miles (5.5-18.5 km). While the City boat is the capillaries of the public transport network the Suburban shuttle is the arteries with larger transport units and an acceptance for lower departure frequency. A guideline value is a depar-ture every 20 minutes, compare with the departure frequency for buses in suburban Stockholm during rush hour being about every tenth minute according the travel planner (www.sl.se). The shuttle capaci-ty is typically twice the City boat and providing seats for (in principle) all passengers (the concepts also refer to standing passengers but that is indicative showing on flexibility depending on route).
Sta$on
Sta$
on
2Berlin
Exit
Sta$on
Sta$on
Sta$on
10 Stockholm
1
23
3

28
Figure 7. The blue routes exemplify suburban shuttle routs for distances <10 nautical mile (18.5 km).
The service has pronounced rush hours and the low departure frequency demands for good timekeep-ing and reliability as well as possibilities for the commuters to spend the waiting time in a valuable way. The travel time is strongly dependent on speed at sea and the concept pallet is more varied in this respect in relation to the City boat concept. The time between terminals should in any case be less than approximately 45 minutes. The longer journey typically also requires added comfort values such as conditions to work, having a meal, WC, lounge, etc. Energy consumption is mainly driven by vessel speed so from an economic and environmental perspective it is important to find solutions with a low-er speed yet still an attractive complement in the public transport system. Although embark/debark time is a smaller part of the travel time compared to the City boat, boarding is done alongside at simi-lar, and often the same, terminals as for the City boats.
The lower departure frequency and longer distances complicates the ice-navigation matter somewhat. Depending on the overall traffic in the fairway it might be rational and cost effective to design the Sub-urban shuttle with ice-breaking capacity to some extent. Maybe some units in a system can have the ability to clear the fairway and at the same time bring passengers. An option is also that the vessels, or some of them, are temporarily strengthened during periods of ice navigation.
In the near future the vessels for this service are expected to be powered by combustion engines run by liquid fuel; fossil or renewable. A little further ahead the vessels might be equipped by electric, fuel cell powered, engines.
The suburban shuttle concept pallet is, based on the above, limited to seven variants; five mono-hull/twin-hull variants for the medium to high speed range and three high-speed concepts, all pow-ered by combustion engines. The concepts have approximately 50-75% higher passenger capacity (150-200 seated) than the City boat and cover a speed range from 15-40 knots. The concepts are based on a set of reference craft. Again the Hammarby ferry is used as a reference vessel as it was for the City

29
boat, this because it is well documented with suitable passenger capacity (although not realised!). In addition, low speed at sea is energy efficient and attractive routes can be designed for the Suburban shuttle distance range and the low speed concepts should not be forgotten. The vessel Vaxö, operated by Waxholmsbolaget, represents a fairly traditional solution for relatively fast passenger traffic. The ship and her sisters are operating the Stockholm archipelago. At higher speeds two carbon-fibre sand-wich catamarans built by the Norwegian company Bröderna Aa (http://www.braa.no/ ) the 27 knots, 160 pax vessel MS Valö operated by Styrsöbolaget (http://www.styrsobolaget.se/om-oss/fartyg/valo ) and the 33 knots, 295 pax vessel Fjordprins constitute the reference craft.
The carbon fibre catamarans (e.g. reference craft Valö and Fjordprins and linked concepts) seem to be compatible with land borne public transport units with respect to speed (around 25 knots i.e. 40 km/h) as well as energy consumption (ab. 0.15 kwh/personKm). It is hence seen that the fast concepts may be a very attractive solution to increase transport capacity in an environmentally competitive way. This would need further analysis and a question is how to design a socially as well as economically sustainable system allowing both flexibility with niche solutions and rational advantages of scale.
Based on the results for the high-speed carbon-fibre ferries (Valö and Fjordprins), concepts with ves-sels doing 40 knots and above are also a very interesting branch to investigate in future projects on rapid water transit systems. At such speeds more sophisticated solutions are expected. Here we indi-cate techniques as hover craft, surface effect ships (SES) or hydro-foil solutions.

30
Table 8. Suburban shuttle concept main particulars. Suburban Shuttle, 3M<distance at sea<10M Reference craft Concept craft Hammarby ferry
mono hull Vaxö mono hull
Valö Twinhull
Fjordprins Twinhull
C9 Monohull
C10 Monohull
C11 Monohull
C12 Twinhull
C13 Twinhull
Reference craft:
Hammar-by
Hammar-by
Vaxö Valö Valö
Design speed [kt]
12 21 27 33 13.5 15.4 18.0 20 28
Installed power [kW]
400 1800 1500 2880 890 1214 1800 1500 2146
Power at design speed (80%)
320 1440 1200 2304 712 14576 1080 8407 1717
kWh/persKm (cabin factor 100%)
0.06 0.11 0.15 0.13 0.11 0.20 0.22 0.14 0.16
kWh/persKm (cabin factor 65%)
0.09 0.17 0.23 0.20 0.18 0.31 0.33 0.21 0.25
Fn 0.39 0.58 0.85 0.89 0.39 0.42 0.50 0.63 0.85 Time at sea (max dist) [minutes]
51.0 29.6 23.2 19.2 45.6 40.0 34.3 31.0 22.1
Time at sea (min dist) [minutes]
16.0 9.6 7.7 6.5 14.4 12.7 11.0 10.0 7.3
Length [m] 26 35 27 37.5 33 36 35 27 30 Breadth [m] 6.5 7.5 8.4 10.8 8 9 7.5 8.4 9.3 Number of seats
102 200 163 295 150 200 150 163 200
No. of pax standing (alt. seats on upper deck)
148 140 0 0 100 50 0 0 0
Bike capacity [no of (20kg)]
40 63 75 40
Scale factor rel.ref craft
1 1 1.3 1.4 1.0 1.0 1.1
6 The estimate assumes a 50 % higher power outtake at the higher Froude number compared to the reference craft. The assumption is based on the resistance calculations presented by the design report (Stockholm stad 2000). 7 The power at design speed is estimated as 70% of the reference craft due to the significantly lower speed.

31
5.3 Concept Branch B – Infrastructure Concepts This concept branch focuses on infrastructure support solutions for utilization of the waterways, such as ferry solutions dedicated to buses, bikes and/or pedestrians as part of the road network to enhance and improve the overall transport system (minimizing total number of personal kilometres, increasing accessibility and mobility). The payment- and business models may differ from more traditional solu-tions used in public transport, e.g. road-tolls may be one solution here or the concept is financed as part of the infrastructure bill on new bus- and bike lanes. The payment model for the individual com-muter is not interfering with changes between lines or modes of transport. The traveller plans the trip without reflecting on whether it goes on road, rail or water.
This concept branch is developed focusing on the waterborne part and the land-sea interface. The pre-requisites for this concept branch are the same as for Concept Branch A:
− Year-round operation of the land based part of the public transport system.
− The terminal or access point is a node integrated to the local main flow of the public transport system. Just a possibility to reach the terminal by for instance a low frequency bus or tram link is not enough for being considered as an integrated node.
− Ticket notification shall not affect the embarkation or departure time.
− The waterborne part of the public transport system is based on a certain volume so that the organizational and material resources to provide infrastructure maintenance (e.g. ice clear-ance and traffic management) and vehicle maintenance (servicing and replacement units) can be efficiently used and cost effective.
5.3.1 B1 – The Movable Terminal Platform (Bus-Ferry) The Bus-Ferry concept is a movable terminal platform for 4-6 buses (normal- or articulated buses) and some additional space for pedestrians and cyclists. No cars. The ferry operates much like a bus termi-nal where passengers can change between different bus services at the same time as the passengers are transported over the waterway. The ferry is a direct part of the road network with dedicated bus lanes (this is one such bus lane), which offers a fully intermodal transport service with uninterrupted public transport services across the waterways.
Figure 8. Bus-ferry concept.

32
The land-sea transition nodes can be part of a larger terminal area with other transport nodes (e.g. stores, cafés, traditional ferries as well as bus-, tram- and subways services) or just a simple pier for bus and pedestrian boarding and perhaps parking for private cars and bicycles. The payment model for the passengers is the same as for the land-based public transport system with monthly access cards, single journeys tickets, etc. For pedestrians and cyclists the ferry is “free” much in the same ways as the road system or existing road-ferries are but if boarding a bus on the ferry this is subject to the same payment models as on land.
Table 9. The Bus-Ferry concept.
Bus-Ferry
Design speed [kt] 10-15 Installed power [kW] 2x400 Power at design speed (80%)
640
kWh/persKm (cabin factor 100%)
0.052
kWh/persKm (cabin factor 65%)
0.08
Fn 0.3-0.37 Time at sea (12 nautical mile @ 15kn) [min]
48
Time at sea (6 nautical mile @ 12kn) [min]
30
Length [m] 45 Breadth [m] 15 Deck area for pax & bikes 280 Number of seats 260 No. of pax standing (or seats on upper deck)
20
Bike capacity [no of (20kg)] 24 Scale factor rel.ref -
A possibility with this concept may also be to utilize the off-peak capacity for city logistics such as de-livery vans and bicycle couriers as the platform is a roll-on/roll-off vessel accessible to both small and large vehicles with access points at the city centres and urban nodes with high population density.
The envisioned system concept (Table 9) is a catamaran solution (large deck area with high stability and low resistance) with all-electric propulsion (high energy efficiency, low noise, and easy to adapt to various renewable energy sources). The concept maps in particular to the following key performance drivers:
• Time at terminal (embark/debark): o The passengers are already seated and there is no changing and waiting between dif-
ferent modes of transport.
• Passenger capacity (number of sitting/standing) o Passenger capacity and comfort is the same as on the buses plus an additional capacity
for pedestrians and cyclists.

33
• Bike capacity (number of) o There is room for additional pedestrians and cyclists.
• Comfort (space, noise, conditions for working, cafeteria, news stand, public WC, etc) o Same comfort as on bus, but with the possibility to go outside on the ferry for fresh air
or access on-board service facilities e.g. cafeteria (depending on travel time), silent due to electrification.
• Technology readiness level, TRL o The ferry platform as such is a relatively simple construction with as few as possible
on-board systems, basically a moving platform with possibly some sheltered areas and the opportunity to buy coffee and snacks. The on-board comfort zones are provided by the busses with the technology readiness levels from the automotive industry. Hence not binding all the capital in the ferry solution and utilizing the competence from the automotive industry to assemble cost effective waterborne transport solutions.
As with the other concepts one of the major challenges (especially for the Nordic climate) is to design energy efficient and sustainable ferry concepts that can maintain service during 365 days of the year with ice and snow. Also, as the vision is to utilize electrified propulsion the design of this system is a challenge, in particular regarding energy storage and charging.
5.3.2 B2 – The Sea Lift (line ferry for pedestrians & bicycles) The Sea Lift concept is a line ferry that could be driven by the passengers themselves (after having taken a so called driver´s license) which enables lower costs and increased flexibility and frequency. In a sense the sea lift could be seen as a prolonged piece of road or bike lane crossing over shorter water distances in order to increase density and accessibility as well as enabling less total number of personal kilometres.
Figure 9. The sea lift carries maximum 12 people and the reference is the line ferry of Strömstad kommun between the north and south Koster islands.

34
5.4 Concept Branch C – Individual Waterborne Transport Concepts This concept branch focuses on enabling the same flexibility and privacy for the commuter/traveller as the car or any other motorized personal transportation vehicle. As for the above concept branches (A&B) the concept generation is based on the performance drivers identified in Table 4 and also high-lighted above in Section 5.1.
5.4.1 C1 – Individual Amphibious Commuter Vehicle NEWT This is a concept for an amphibious commuter vehicle (Figure 10 and Figure 11) which is based on a previous concept study performed at KTH in collaboration with Vattenbussen AB and Gestalt Industri-ell Design. It is a zero-emission (all-electric) vehicle for 1-2 persons primarily intended as an attractive eco-friendly mean of commuting to work in city regions with close contact with waterways (such as Stockholm), with focus on efficiency, comfort and safety. The vehicle is about half the size of a small car and convenient to use both on land and on waterways. From a user perspective, the design is a critical factor in the acceptance of personal transportations means and hence critical for the success of a market introduction of such vehicle. The main particulars are presented in Table 10.
A solution like NEWT, is a complement to an efficient public transport system and attractive to the need for accessibility, privacy and flexibility that a private vehicle can offer but with a shorter and quicker route and less environmental impact. Individual transport solutions also have the advantage that they can be relatively quickly introduced and used without major infrastructure investment and thus also allow for a more mobile workforce. Economically, it is very attractive to find solutions that do not require extensive investments in infrastructure or high costs in operation and maintenance bur-dening the taxpayer’s budget.
Figure 10. The concept vehicle NEWT is a zero-emission fully encapsulated vehicle for a seamless comfortable trav-el environment over both land and water.
Figure 11. Concept of operation NEWT.

35
Table 10. The NEWT concept.
NEWT
Design speed [kt] 15 Installed power [kW] 6 Power at design speed (80%)
4
kWh/persKm (2 pax) 0.06 kWh/persKm (1 pax) 0.125 Fn - Time at sea (5 nautical mile) [min]
20
Time at sea (1.5 nautical mile) [min]
6
Length [m] 2.5 Breadth [m] 1 Deck area for pax & bikes - Number of seats 2 No. of pax standing (or seats on upper deck)
-
Bike capacity [no of (20kg)] - Scale factor rel.ref -

36
6 Operational Scenarios
The concepts developed in this study are evaluated against three example use case scenarios in the Stockholm area. Of course, the concepts are not restricted to these areas, but the application of the envisioned concepts to example scenarios enables an exemplification of the concept performance with respect to the sacred expectations. This is however, not to be taken as a base for the transport needs nor the full concept performance for these areas as only one example route is considered. A transport need analysis is not part of this work.
In all three scenarios data for land transport is generated from the Stockholm public transport trip-planner (www.sl.se). Assumptions: walk speed 5 km/h, bike 15 km/h (when a bus journey is switched with a bike trip the bike mean speed is assumed slightly slower than the bus), 2 min are added after a walk/bike trip as a necessary margin for catching the next ride. The waiting time before a boat trip is assumed to be half the departure frequency.
The trip-planner may of course not give the best travel choice for every commuter, e.g. if the distance is only 1-2 km there may not be a need to take a bus at all.
6.1 Scenario #1: Tanto to Waldemarsudde The example journey is taken from central Stockholm, Tanto to Waldemarsudde, Figure 12. The travel distance is a straight line about 5 km, sea leg 0.7 nautical miles i.e. 1.3 km. The City boat for the sce-nario is C3/4 and the distance matches Route II in Table 7 and Figure 6.
Figure 12. Travel scenario 1: Tanto – Waldemars udde. The indicated route represents the present public transport service proposed by the trip-planner (www.sl.se).
Table 11 show the journey broken down in parts from door to door (A to B). For this scenario, the City boat line constitutes a better alternative than the present public transport system offers. That does not have to be the case of course. Still the scenario example shows that the waterway can add capacity, alternative routes and opportunities for bikers, i.e. flexibility to the commuter system. If we instead
Directions to Prins Eugens WaldemarsuddePrins Eugens Väg 6, 115 21 Stockholm, Sweden7.4 km – about 16 mins

37
consider a more radical concept like the individual amphibious commuter vehicle in concept branch C (NEWT), and evaluate in the same way (Table 11) the travel time compared to the present public transport system will be a third and shorter than the City boat with the flexibility and privacy of the motorist. However, of course this implies a higher private investment, a much higher degree of per-sonal activity and responsibility in driving in inner city traffic as well as on waterways and on transi-tion ramps, and finding parking spaces. For the NEWT concept the speed on land is assumed to be 20 km/h and on the water 12 kt (as this is the speed limit). Further assuming an extra 2 min for the land-sea transition the door-door time for this concept is 19 min.
Table 11. Travel scenario time breakdown. Dep. A Arr. B min Walk Bus Tram Walk [min] 6 2 24 5 14 1.5 53 Walk Bus City boat Tram Walk [min] 6 2 16 7.5/2 5.2 2 3 1.5 39 Bike City boat Bike [min] 20 2 5.2 2 29 Newt
land Newt
sea Newt
land
[min] 10 2 4 2 1 19
6.2 Scenario #2: Ekerö (Bergsvägen) to central Stockholm (Mosebacke) This example journey is taken from the suburb Ekerö (Bergsvägen) to central Stockholm (Mosebacke torg), Figure 13. The total distance is about 18 km with a sea leg of 8 nautical miles i.e. 14.8 km. The Suburban shuttle C11/12 is serving the route.
Table 13 show timetable examples for different shuttle concepts. In this case the Suburban shuttle constitutes an equal journey as the present public transport system offers. It adds capacity and the opportunity to bring the bike and by that also enables a 15 min faster commuting time, see Table 12.
As for scenario #1 above, the individual amphibious transport concept branch C NEWT (assuming an average speed of 30 km/h on land and 15 kt on water and 2 min/land-sea transition) offers the fastest transport from A to B. The most drastic time saving is if an average speed of 30 km/h can be kept over the entire land distance i.e. 36 min which is the same as using some other means of personalized space efficient moderately fast transport such as a moped or scooter. For the longer transport routes (such as this) where a continuous undisturbed commuting time can be used for work etc. all personal trans-ports mean active interaction with driving the vehicle and hence the time cannot be used as efficiently as in public transport.
Table 12. Scenario 2 time breakdown. Dep. A Arr. B min Walk Bus Underground Walk [min] 11 2 20 5 22 5 65 Walk Bus Suburban shuttle Walk [min] 11 2 12 15/2 27 5 64.5 Bike Suburban shuttle Bike [min] 19 2 27 2 50 Newt land [min] 36 Newt
land Newt sea Newt
land
[min] 6 2 32 2 2 45

38
Table 13. Timetable example for the Suburban shuttle serving the Ekerö route of travel scenario #2.
8 nautical mile route. Time table at peak hours
C11/12 4 ships in service at 17.7 kt mean speed
Time at sea 27 min
Departure frequency every 15 min
Capacity pax/h in each direction 500
Shuttle no. Departure Arrival Departure Arrival
1 6.45 7.12 7.15 7.42
2 7.00 7.27 7.30 7.57
3 7.15 7.42 7.45 8.12
4 7.30 7.57 8.00 8.12
1 7.45 8.12 8.15 8.12
2
C13 3 ships in service at 24 kt mean speed
Time at sea 20 min
Departure frequency every 15 min
Capacity pax/h in each direction 800
Shuttle no. Departure Arrival Departure Arrival
1 6.45 7.05 7.08 7.28
2 7.00 7.20 7.23 7.43
3 7.15 7.35 7.38 7.58
1 7.30 7.50 7.53 8.13
2 7.45
C9/10 4 ships in service at 13 kt mean speed
Time at sea 37 min
Departure frequency every 20 min
Capacity pax/h in each direction 400
Shuttle no. Departure Arrival Departure Arrival
1 6.50 7.27 7.30 8.07
2 7.10 7.47 7.50 8.27
3 7.30 8.07 8.10 7.47
4 7.50 8.27 8.30 9.07
1 8.10
2

39
Figure 13. Transport scenario Ekerö to Stockholm city. The indicated route represents the present public transport service proposed by the trip-planner (www.sl.se).
6.3 Scenario #3: Nacka - Karlaplan The distance straight line is about 12 km, sea leg 3.5 nautical mile i.e. 6.5 km. The thought traveller lives in the Stockholm suburb Nacka and travel to work close to Karlaplan in central Stockholm, see Figure 14. The Suburban shuttle C11/12 is serving the route. Again the waterway offers an equivalently fast journey adding the opportunity to bring the bike as shown in the trip time breakdown Table 14.
Figure 14. Travel scenario #3: Nacka (Talluddsvägen) to Östermalm/Karlaplan (Värtavägen). . The indicated route represents the present public transport service proposed by the trip-planner (www.sl.se).
Start Bergsvägen, 178 32 Ekerö, SwedenEnd Mosebacke
Mosebacke torg 3, 116 46 Stockholm, SwedenWhen 2/27/14 after 8:00am
Duration 59 mins total
Loading...
©2014 Google - Map data ©2014 Google -
Directions to Värtavägen14.7 km – about 21 mins

40
Table 14. Scenario time breakdown. Dep. A Arr. B min Walk Bus Underground Walk [min] 1 2 17 6 8 1 35 Walk Bus Suburban shuttle Underground Walk [min] 1 2 10 15/2 12 2 5 1 40.5 Bike Suburban shuttle Bike [min] 14 2 12 6 34 Newt
land Newt sea Newt land
[min] 2 2 18 2 5 29
6.4 Use Case Sequence Diagrams This section illustrates sequence diagrams for a few different use case scenarios highlighting the stake-holder interactions and the functional requirements for the different stakeholders. The use case sce-narios here are taken from the above transport scenarios (bike commuter and traditional public transport commuter) and one scenario from a service and maintenance perspective (cleaning). These are just some examples, of course for a complete screening, many more use cases would have to be analysed. To mention some: motorized commuter, tourist, city logistics, search and rescue operations, repair & maintenance of vessels, and many more Figure 15 illustrates the use-case scenario for a bike-commuter. For this use case, it can be seen how the ICT systems act as support for the user in planning the trip and may also be part in the payment models for on-board services such as internet access. Further, the user, obviously, needs access to a bike in this use-case. The bike may be a personal asset or provided by some other service, like bike rentals. The ferry needs to be accessible for bikes, provide some kind of bike parking and opportunity to charge for the services. There may also be other on-board services. Finally, this work can be extended to include more details, but the main conclusion from this exercise is that the main active stakeholders have been identified according to Figure 3 given these three use-case scenarios. It can be seen how the next use-case diagram (Figure 16), is very simi-lar to the one in Figure 15, except that the land based transportation is provided by the bus-service and that the ferry does not need capability to provide access to- and accommodate bicycles. The last use-case (Figure 17), which is different from the two previous ones, highlights the need for access points and information systems to plan maintenance.
Figure 15. Sequence diagram bike commuter.

41
Figure 16. Sequence diagram bus, ferry and subway.
Figure 17. Sequence diagram, use-case cleaning.

42
7 Concept Evaluation
This section considers an evaluation of the envisioned concepts generated here with focus to identify gaps8 and disruptions9 in current and future technologies and platforms. For a transparent and tracea-ble evaluation of concept performance and key research areas to address, two well established methods for concept evaluation are adopted here: quality function deployment (QFD) and Pugh-chart matrix evaluation. It is important, however, to realize that the results of this concept evaluation are depending on the customer importance weighting, which of course may differ between different customer groups and even between individuals in similar customer groups. Further, the difference between stated- and revealed preferences by the customers complicates the concept evaluation, in particular for concepts providing a technology disruption. Hence, it is difficult to evaluate a system that does not yet exist. The ranking between different concepts should be taken as a base for discussion and guidelines rather than facts.
7.1 QFD A QFD analysis may be very comprehensive and time-consuming depending on the depth of the analy-sis. Here, the two most important stakeholder groups are selected for the QFD analysis where the stakeholder requirements/expectations are mapped against the system design characteristics in order to identify the main performance drivers and key development areas. As can be seen in Figure 18, both time to load & unload passengers as well as route frequency score high on technical importance rating (bottom row) which indicates the importance of the logistics planning of the system. This also high-lights how fast loading times and high route frequency addresses several of the stakeholders expecta-tions. Further high speed also scores high (as expected) as this couples directly to faster commuting times and increased capacity. Of course, the effect on the over-all commuting time from the vessel speed and loading/un-loading times depends on the total travel distance. Interesting to note, however, is that high-speed ferries according to Table 8 are competitive with land transport solutions in speed and energy efficiency/passenger km even on parallel tracks. Further, ferry passenger capacity as well as bike carrying capacity and noise are other aspects that are important from a stakeholder requirements perspective. Available space/pax is also connected to comfort values hence the size of the passenger area relative to passenger capacity is a conflicting performance driver.
7.2 Pugh-Chart The second part in the concept evaluation process is the Pugh-chart matrix evaluation. Here, in con-trast to the QFD-matrix the concepts are evaluated against each other and a benchmark reference solu-tion. The three transport scenarios from above are used in the evaluation, where a selection of key per-formance parameters based on the sacred expectations are evaluated. The importance of each criterion is rated based on an over-all evaluation of the stakeholders stated preferences. Of course, this involves a certain degree of subjectivity. This method is also rather blunt in that it only allows for one level of bet-ter/worse score, which leads to perhaps a somewhat misleading concept evaluation where one concept being just slightly better on many areas scores very high values, while other concepts being much better on some areas but performs about the same on others may score just slightly better than the bench-mark. An example of this is that a personal concept vehicle, performs high on flexibility, speed, com-fort, etc. but is for the individual a much more expensive solution. Hence the score of the different con-cepts should, be taken as indicative of the concept performance and provide a base for discussions and future work.
With the restrictions mentioned above in mind, it can be seen from the Pugh-chart scores, that the
8 Gap - Capability shortfalls of the navies either current or future ones that need to be addressed trough appropriate technologies. 9 Disruption - New technologies which cause a capability disruption in the sense that they may provide a completely new capability.

43
individual transport concepts, NEWT, and Bike+Boat, scores high as these concepts offer flexibility and fast commuting times from door-to-door. Further, interesting to note from scenario #1&2 is that the bike-boat concept scores high, even though the bike does not offer the most comfortable trip. Perhaps, as humans, our revealed preferences for comfort are much higher than the stated preferences due to the fact that bicycle commuting is not dominating as much in reality as it should if only valuing the shortest commuting time. Also, the personal transports score high as flexibility is valued high here. However, flexibility may also be to not have a personal vehicle to be responsible for in the city traffic. Hence, with a different weighting of the importance, and interpretation of the stakeholder expectations, the score would be different. The results here reveal some interesting aspect on how to evaluate differ-ent concepts and how to value stakeholder expectations.
Figure 18. Quality function deployment analysis of system design characteristics against stakeholder requirements.
QFD: House of QualityProject: Waterways 365 - subproblem WaterwaysRevision: Simplified analysisDate: 2014-02-26
Fu
nct
ion
al R
equ
irem
ents
(S
yste
m D
esig
n
Obj
ecti
ves)
Customer Requirements (Explicit and
Implicit)
1 |||||| 13% 90 9
2 ||||||| 14% 100 9
4 ||||| 12% 80 9
5 ||||| 10% 70 9
7 ||||| 12% 80 9
20 ||||||| 14% 100 9
22 ||||| 10% 70 9
24 ||||||| 14% 100 9
Ice
goin
g ca
paci
ty
13
−
−
−
−
−
+
−−
−
−
−
−
Cap
acit
y (b
icyc
le)
Tim
e (l
oadi
ng/
un
load
ing)
serv
ice
(cof
fee,
inte
rnet
, … )
Am
oun
t of
ren
ewab
le e
ner
gy f
or p
ropu
lsio
n (
% o
f to
tal
nee
ded)
Cos
t (/
un
it &
ope
rati
onal
cos
ts)
Spa
ce (
m^
2/pa
x)
−
Des
ign
ch
arac
teri
stic
s (A
esth
etic
s/V
isu
al)
Com
fort
ch
arac
teri
stic
s (p
erce
ived
)
noi
se le
vel (
dB)
11 12
� �
�
� �
�
� � �
�
� � � �
� ��
�
�
�
C
ust
omer
Im
port
ance
R
elat
ive
Wei
ght
R
ow #
W
eigh
t C
har
t
Column #
Direction of Improvement
�Fast (short commuting times)
Smooth (short waiting times and few transport mode changes)Flexible
Comfortable
�
�
Reliable
Cap
acit
y (p
ax s
eate
d/st
andi
ng)
14 15 16
� � � � � � �2 3
247.8 234.8 436.2 408.7 537.7 160.9 113 139.1 0 0156.5 133.3 121.7
0%
||| ||| |||||| |||||| ||||||||
|| |
7% 5% 5% 4% 4% 6%8% 7% 13% 13% 16% 5% 3%
|| ||||
Technical Importance Rating
Target
Max Relationship 9 3
Weight Chart
Relative Weight
||
0%
197.1
9 99 9 9 9 9
221.7 160.9
|||
9
� �4 5 6 7 8 9 10
9 9 9
| |||
4%
�
Correlations
Positive +
Negative −No Correlation
Direction of Improvement
Relationships
Strong �Moderate �
Weak �
���
Maximize
Target
Minimize
9
M
axim
um
Rel
atio
nsh
ip
Increased capacity� � � � � �
�
1
�
� � � � � � �
Vel
ocit
y
En
ergy
con
s. (
kwh
/nm
)
Fre
quen
cy (
freq
uen
cy o
f se
rvic
e)
��
� �
US
ER
S
Sweden's environmental objectives (2030 fossil-fuel free transports)
� � � �
SO
CIE
TY
, GO
V. A
UT
H.
�
Transport policy objectives (Consideration goals and Functional Goals) � � � � � �

44
Figure 19. Pugh-chart matrix of transport scenario #1.
Figure 20. Pugh-chart matrix of transport scenario #2.
Page 1
Key Criteria
Impo
rtan
ce R
atin
g
Exi
stin
g P
ublic
Tra
nspo
rt (b
us, t
ram
, sub
way
)
City
Boa
t (A
1)
Sub
urba
n S
huttl
e (c
11)
Bus
-Fer
ry (B
1)
NE
WT
Bic
ycle
+ C
ity B
oat
Fast (short commuting times) 100 53 min + na na + +
Smooth (short waiting times and few transport mode changes) 80 1 travel change (5min waiting) - + +
Flexible 80 no bikes allowed + + +
Comfortable 90 Indore climate and seats S + -
Reliability (timing accuracy, 365 service, ...) 80 Timing and reliability depending on weather S - S
Increased capacity 100 Bus, tram and subway systems already lack capacity
+ + +
Transport policy objectives 70 + + +
Sweden's environmental objectives (2030 fossil-fuel free transports) 100 + + +
Cost (for the commuter) 70 Access card 790 sek/month S - S
TRL (NASA taxonomy 1-9) 100 9 - - -
5 0 0 7 6
2 0 0 3 2
3 0 0 0 2
450 0 0 620 530
180 0 0 250 190
270 0 0 370 340
Weighted Sum of Positives
Weighted Sum of Negatives
TOTALS
Pugh Matrix: Transport Scenario #1 (Tanto to Waldemars Udde)Solution Alternatives
Sum of Positives
Sum of Negatives
Sum of Sames
Concept Selection Legend Better + Same S Worse -
Page 1
Key Criteria
Impo
rtan
ce R
atin
g
Exi
stin
g P
ublic
Tra
nspo
rt (b
us, t
ram
, sub
way
)
City
Boa
t (A
1)
Sub
urba
n S
huttl
e (c
11)
Bus
-Fer
ry (B
1)
NE
WT
Bic
ycle
+ B
oat
Fast (short commuting times) 100 65 min na S S + +
Smooth (short waiting times and few transport mode changes) 80 1 travel change, 7 min waiting and 16 min walk
S + + +
Flexible 80 no bikes allowed + + + +
Comfortable (climate, service, exhaustive, …) 90 Indore climate and seats + + + -
Reliability (timing accuracy, 365 service, ...) 80 Timing and reliability depending on weather S S - -
Increased capacity 100 Bus, tram and subway systems already lack capacity
+ + + +
Transport policy objectives 70 + + + +
Sweden's environmental objectives (2030 fossil-fuel free transports) 100 S S + +
Cost (for the commuter) 70 Access card 790 sek/month S S - S
TRL (NASA taxonomy 1-9) 100 9 - - - S
0 4 5 7 6
0 1 1 3 2
0 5 4 0 2
0 340 420 620 530
0 100 100 250 170
0 240 320 370 360
Weighted Sum of Positives
Weighted Sum of Negatives
TOTALS
Pugh Matrix: Transport Scenario #2 (Ekerö to Mosebacke)Solution Alternatives
Sum of Positives
Sum of Negatives
Sum of Sames
Concept Selection Legend Better + Same S Worse -
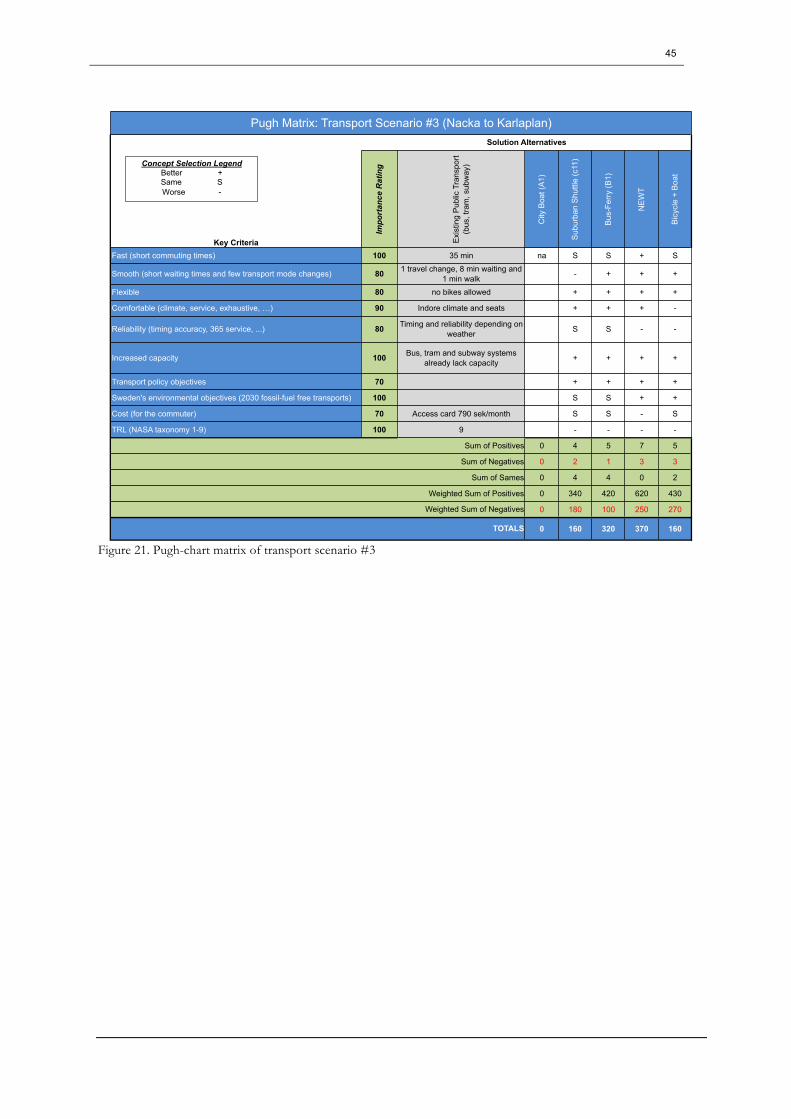
45
Figure 21. Pugh-chart matrix of transport scenario #3
Page 1
Key Criteria
Impo
rtan
ce R
atin
g
Exi
stin
g P
ublic
Tra
nspo
rt (b
us, t
ram
, sub
way
)
City
Boa
t (A
1)
Sub
urba
n S
huttl
e (c
11)
Bus
-Fer
ry (B
1)
NE
WT
Bic
ycle
+ B
oat
Fast (short commuting times) 100 35 min na S S + S
Smooth (short waiting times and few transport mode changes) 80 1 travel change, 8 min waiting and 1 min walk
- + + +
Flexible 80 no bikes allowed + + + +
Comfortable (climate, service, exhaustive, …) 90 Indore climate and seats + + + -
Reliability (timing accuracy, 365 service, ...) 80 Timing and reliability depending on weather S S - -
Increased capacity 100 Bus, tram and subway systems already lack capacity
+ + + +
Transport policy objectives 70 + + + +
Sweden's environmental objectives (2030 fossil-fuel free transports) 100 S S + +
Cost (for the commuter) 70 Access card 790 sek/month S S - S
TRL (NASA taxonomy 1-9) 100 9 - - - -
0 4 5 7 5
0 2 1 3 3
0 4 4 0 2
0 340 420 620 430
0 180 100 250 270
0 160 320 370 160
Weighted Sum of Positives
Weighted Sum of Negatives
TOTALS
Pugh Matrix: Transport Scenario #3 (Nacka to Karlaplan)Solution Alternatives
Sum of Positives
Sum of Negatives
Sum of Sames
Concept Selection Legend Better + Same S Worse -

46
8 Conclusions - Relevant Research Questions and Key Technical Perfor-mance Measures
The results of this work and the main conclusions are summarized below in research areas to address. Also, coordination and dialogue with other organizations and authorities have been an important part of this work in order to identify the relevant organisations and institutes for the research topics derived herein. This is highlighted in the clustering of the research topics below.
In order to refine the concept pallet and to fully evaluate the potential for the waterway to answer to the sacred exceptions the following topics need to be addressed:
Transport volume and system design. Looking at bus traffic for instance, the system is built up by more or less standardised units. If a bus breaks down it is replaced by another and towed to the garage for repair. Roads are maintained, during winter sanded/salted and snow is removed. All this service is justified for a certain transport volume (when it comes to mature land based public transport systems many aspects on volume and standardization are global). For a waterborne system of sufficient size, it might be justified with simple vessels following special regulations adopted for sheltered waters and adequate reliable support systems. How many vessels or what transport volume represents a sufficient size?
Terminal and vehicle-terminal interface design. Time at terminal, thus efficient embarkation and debarkation is an identified system performance driver and an obvious concern for terminal de-sign. Terminal functions (technical issues as mooring, flexibility to variation in ship draught, refuelling and or charging capacity as well as travellers comfort aspects as internet access, possibility to purchase food and drinks, lounge, library…) need to be identified and specified.
Choice of engine and fuel addressing sustainability performance drivers. Investigating the potential for electrified propulsion systems is an important task. This includes battery and fuel-cell techniques. Linked is the question of fuel for combustion engines and in the broader sustainability per-spective to sort out where different fuels are the best choice. It might for instance be more rational to electrify land-based public transport leaving the limited amount of energy dense liquid bio-fuel to the seaborne units. Such should be discussed together with a thorough, inventive and open-minded study on possible solutions for electrification (battery/air cable/...) use of gas (fossil/bio), alcohols (fos-sil/bio) and conventional (fossil) fuels.
Off-the-shelf seaborne transport units. A performance driver important for the complete set of sacred expectations including economically sustainable is the idea on serial production of vessels de-signed for modularisation and rational manufacturing. This is a complex multidisciplinary task includ-ing the Naval architect’s topic domain concerning hull shape, structural design and material system, speed, energy efficiency, wake-wash etc.
Comfort influence on system design. Stakeholders expect waterborne public transport to be at-tractive. Comfort is a performance driver defined differently for different journeys. A forty min journey by boat, comfortably seated and reading could very well be preferred before a say 30 min underground journey with a change at half time. For short trips on the other hand comfort is something else. When integrating the waterways and seaborne journeys into a public transport system it is important to know how comfort influences the travellers decisions and what comfort mechanisms to consider in system design.

47
Lightweight design for sustainability. Material usage, manufacturing costs, maintenance and operational costs are connected to the craft weight and in turn to the relation between payload (passen-gers!) and displacement. Use of lightweight materials, composites and sandwich technique, for in-stance, could be a key to lower life cycle costs and less harmful environmental impact. The topic ad-dresses particularly the sacred expectation on steps towards sustainability with existing techniques. Still, the important issue on design for ice loads needs further investigation. Connected to this is the question on how navigation in ice should be handled on a system level, to what extent the vessels them-selves shall host icebreaking capacity (that they have to carry around also during summer) or if the fairway ice clearance should be the concern of system-common service units. In this context a project (LightIce) is formulated focusing on how the choice of construction material affects the total structural weight of craft exposed to ice loads. The study comprises a systematic series of experiments and the outcome is expected to guide designers to the most efficient material from a life cycle perspective.
Waterway vehicle design. The concept sub-branches; the City boat and Suburban shuttle, derives from differences in population density and transport demand pattern. Particularly for the smaller units with passenger compartments on one deck level and designed for slightly higher speed the hull shape design is a challenge. Keeping in mind that the different units should fit the same terminal interface and be compatible manufacturing and maintenance wise, the seaborne units suitable to supplement public transport systems worldwide is a demanding design task.
System performance assessment. The sacred expectations on the Waterway 365 address capacity increase in a sustainable way. Both capacity and sustainability are quantifiable but how is not obvious. Methods need to be identified, perhaps modified or developed, capable of:
• modelling and evaluating how added waterway routes and capacity influence the rest of the system,
• modelling the values and costs when adding waterborne transport capacity (including aspects of not needing to expand the land infrastructure, changes in transport flow within the existing system, scale effects with respect to volume of the waterborne part of the system in terms of both manufacturing and operation),
• modelling sustainability
• modelling attractiveness for commuters
Cost Analysis. Comparative analysis of costs for waterway transport systems towards other modes of transport including: optimized vessel designs, investments costs, operating costs, supporting infra-structure maintenance systems costs etc from a societal point of view are important aspects that needs to be considered.
Other defined key areas that need to be addressed are:
True intermodality. Several issues concerning intermodality between different modes of transport need to be further investigated and developed:
• Integrated information and ticketing systems offering easy access (ICT)
• Strategic planning and securing land-use and property allocation for transit points where wa-terborne systems can be connected to land based systems
• Intermodal solutions and transit point design including waterborne systems

48
• Connectivity system development
Finance and business models. In order to reach more benefits within the transport system such as increased attractiveness in public transport, higher sustainability and decreased costs new ways of working together between the business sector and the public sector need to be developed. Today a business could get either 50 % subsidy or nothing at all for providing public transport and it is almost impossible to plan ahead in a sustainable way for the business sector. On the other hand the public sector struggles with low innovation level and increasing costs for procurement.
Finally, of course the development of regulations and legal framework need to be in line with technical development.
The ambition for the future work within Waterway 365 is to continuing exploring all the topics above. Nevertheless, some areas are judged more urgent or closer to our competence area. Figure 22 indicate by the blue sectors how Waterway 365 intends to prioritise the effort in the next couple of years.
Figure 22. Illustration on how Waterway 365 intends to prioritise the effort in the next couple of years.

49
References
Blomquist P. (2013). Underlagsrapport – trafikstrategi för Göteborg kollektivtrafik Trafikkontoret dnr 0894/11 Rapportnummer 1:5:2013.
Börjesson & Kihl (2013). Omvärldsanalys urbana vattenvägar – resultat av informationssökning, Del-rapport inom forsknings och innovationsprojektet Koll på vatten, Vattenbussen.
Camay, Zielinski and Zaranko (2012). New York City´s East River Ferry: Expanding Passenger Ferry Service and Stimulating Economic Development in the New York City Region, Transportation Re-search Record: Journal of the Transportation Research Board, No. 2274, Transportation Research Board of the National Academies, Washington, D.C., 2012, pp. 192–200.
Carlsen S. & Gustavsson A. (2012). Elektrifiering av Älvskytteln, Examensarbete, Institutionen för sig-naler och system, Chalmers Tekniska Högskola
CyCity (2012). Cycitys fältstudier av cykelstaden.
Hallberg et. al. (2008). Älvis the GoPax, Department of Shipping and Marine Technology, Chalmers University of Technology.
Häggroth (2011). Bostadsförsörjningen i Stockholm län – Analys och åtgärder.
K2 & Svensk Kollektivtrafik (2013). Färdplan, Kollektivtrafikens roll i en hållbar samhällsutveckling.
Kamen & Barry (2011). Design, Economics and Politics: The Viability of Urban Ferry Systems, paper in Sustainabilty in the Maritime Industry: A collection of relevant papers, ed. Rich Delpizzo, Haifeng Wang & Andrew Panek, Society of Naval Architects and Marine Engineers.
Kamen & Barry (2007). Urban Passenger-Only Ferry Systems: Issues, Opportunities and Technologies, Transactions - Society of Naval Architects and Marine Engineers, 2007, Vol.114, pp.82-107.
Karlson & Forsberg (2013). Energi och ruttoptimerade transportlösningar, SSPA Presentation vid Road show om energieffektiva färjor, Stockholm 15 maj 2013.
Lenner M (1993). Energiförbrukning och avgasemission för olika transporttyper, VTI meddelande 718 1993.
Partnersamverkan för en fördubblad kollektivtrafik (2012). Bytespunkter - övergripande principer för tillträde och prissättning - en vägledning, Rapport del 1 av projektet "Marknadstillträde och principer för tillträde och prissättning av infrastruktur".
Prop 2008/09:162, En sammanhållen klimat- och energipolitik.
Prop 2008/09:93, Mål för framtidens resor och transporter.
Prop 2009/10:200, Ny kollektivtrafiklag.
Prop 2011/12:76, Komplettering av kollektivtrafiklagen.
Sipe & Burke (2011). Can River Ferries Deliver Smart Growth? Experience of CityCats in Brisbane, Aus-tralia, TRANSPORTATION RESEARCH RECORD, 2217; 79-86.
SL (2011). Förslag på försök med nya pendelbåtslinjer på Stockholms inre vatten, PM SL-2011-05172

50
SL (2011a). Kundsegment och ökat resande, Rapport 2011-02-07.
SL (2012). Fakta om SL och länet. AB Storstockholms Lokaltrafik, SL 2013-6099, Datum: 2013-09-25
SLL (2013). Landstingets långsiktiga mål för kollektivtrafiken i Stockholms län, Stockholms läns lands-ting.
SMHI (2009). Statistik Isläggning- och islossning.
Stenkvist M. (2002). Energianvändning i transportsektorn EN FAKTARAPPORT INOM IVA-PROJEKTET ENERGIFRAMSYN SVERIGE I EUROPA, Kungliga ingenjörsvetenskaps akademien IVA.
Stockholm Stad (2002). Slutrapport Dnr 193/2000-74 Biogasfärja.
Trafikanalys (2011). Arbetspendling i storstadsregioner – en nulägesanalys, rapport 2011:3
Trafikanalys (2013a). Utvärdering av marknadsöppningar i kollektivtrafiken, 2013:13.
Trafikanalys (2013b). Lokal och regional kollektivtrafik 2012, 2013:20.
Trafiknämnden, SLL (2012). Regionalt trafikförsörjningsprogram för Stockholms län, Stockholms läns landsting.
Trafiknämnden, SLL (2013). Regionalt trafikförsörjningsprogram för Stockholms län Kollektivtrafik på vatten, Stockholms läns landsting.
Trafikverket. (2012). Kapacitetsutredningen 2012:136.
Trafikverket. (2014). http://www.trafikverket.se/Privat/Miljo-och-halsa/Dina-val-gor-skillnad/Jamfor-trafikslag/
UITP (2013). Waterborne Transport, a Unique Contribution to Enhancing Mobility for Cities on Water, International Association of Public Transport (UITP, L’Union internationale des transports publics).
UNFPA (2007). State of the World Population 2007, Unleashing the Potential of Urban Growth, UNFPA, the United Nations Population Fund.