watersheds, the water cycle and you
TRANSCRIPT
Training Environmental Stewards from Mountains to Ocean
Module 1
Watersheds, the Water Cycle and You


1 Watersheds, the Water Cycle and You
Module 1: Watersheds, the Water Cycle and You Learning Objectives:
1. Students will learn about the world’s water, watersheds, and the water cycle.
2. Students will understand basic watershed features such as streams, wetlands, and forests, including the functions and values that each provide.
3. Students will learn how watersheds can be degraded and general management and mitigation practices that can reduce watershed degradation.
Presentation Outline.......................................................................................... iii Presentation Slides and Speaker Notes (60-90 minutes) ................................1 Handouts ...........................................................................................................67
Classroom Activities ........................................................................................71
• Activity 1 (5 min): All the Water on Earth - Demonstration • Activity 2 (20 min): Build a Watershed Model • Activity 3 (20 min): A Look at Watershed Maps • Activity 4 (15-45 min): Which Watershed Do You Live In? – Homework
follow-up • Activity 5 (15-30 min): Pass the Jug Game
Homework Assignments ..................................................................................87
• Activity 1 (60-90 min): What Watershed Do You Live In?
Optional Activities: • Activity 1 (10-15 min): Summary of Land Use Trends in Westside Pacific
Northwest Watersheds (slides that can be inserted after slide 46 of this presentation) ............................................................................................91
• Activity 2: Where does your water come from? Take a field trip to your water supply source.
Resource List ..................................................................................................103
Participant Evaluation (10 min)......................................................................107
i

1 Watersheds, the Water Cycle and You
ii
1 Watersheds, the Water Cycle and You
Presentation Outline 1) Introduction
a) Presentation addresses three topics: i) Overview of watersheds and the water-cycle ii) Descriptions of the natural features within a watershed iii) Introduction to how watersheds are degraded, and what can be done to
reduce degradation
2) Overview of watersheds and the water-cycle a) The world’s water; where water is found and how much is fresh water b) What is a watershed? c) The water-cycle and major water-cycle processes
i) From ocean to air ii) From sky to land iii) Water and trees iv) Overland and Underground v) Surface Water
3) Natural watershed features: definitions of features, and the functions and values they provide to watersheds a) Forests/Native plants: Trees, shrubs, forbs, ferns, and lichens that have evolved
locally and adapted to local habitat types b) Soil: Composite of inorganic and organic materials c) What is groundwater? d) The role of groundwater in the water-cycle e) What are streams and rivers? f) Riparian areas g) The role of streams and riparian areas h) What is a wetland? i) Functions of a healthy wetland j) What is a lake? k) Lakes and the water-cycle l) What is the nearshore m) Functions of the nearshore n) Wildlife and watersheds
4) Watershed degradation
a) Overview of human land use impacts on water quantity and quality i) Water quantity impacts ii) Water quality impacts
(1) Physical (2) Chemical (3) Biological (4) Point and non-point sources of pollutants
b) What we can do to reduce watershed degradation i) Civic participation ii) Government approaches iii) Prevention and conservation iv) Restoration
c) The role of the watershed steward
iii

1 Watersheds, the Water Cycle and You
iv

Watersheds, the Water Cycle
and You
Developed by Paul Racette, MS WSU King County Extension
1
1 Watersheds, the Water Cycle and You

• Watersheds and the Water-CycleThe World’s WaterWhat Is a WatershedThe Water-Cycle
• Natural Watershed Features
• Watershed Degradation
Watersheds, the Water Cycle and You
NOTE: This module consists of three sections. It is recommended that time be allowed for questions and/or discussion after each section of the presentation.
Speaker Notes:This presentation will cover the three topics:• Watersheds and the Water Cycle: will focus on the three subtopics listed on the slide.• Natural Watershed Features: will focus on the features that describe, influence, or are influenced by how water flows across the landscape.• Watershed Degradation: will focus on water quantity and quality impacts, followed by general descriptions of what we can do individually and collectively to reduce degradation.
2
1 Watersheds, the Water Cycle and You

The world’s water
• Oceans and seas 97.2%• Icecaps and glaciers 2.15%• Ground water 0.62%• Lakes
Fresh water 0.009%Inland seas/salt water 0.008%
• Soil moisture 0.005%• Atmospheric water 0.001%• Rivers and streams 0.0001%
Speaker Notes:Most of the world’s water is contained in oceans or seas or is tied up in ice caps and glaciers. Less than 0.65% of all the water on earth today is liquid fresh water. For this reason, it is critically important that we protect our limited water resources.
References:Data source: US Geological Survey
3
1 Watersheds, the Water Cycle and You

If two gallons representsall the water on earth, then:
• All fresh water = 7/8 cup + 6 drops• Icecaps & glaciers = 11 Tb• Ground and soil water = 3 Tb + ½ tsp • Lakes = 8 drops!• Atmospheric water = 1 drop• Rivers and streams = < 1 drop
NOTE: Conduct Activity 5: All the Water on Earth now if desired.
Speaker Notes:This slide depicts how much fresh water there is on earth compared to total amount of water.
References:Data source: University of Nevada Cooperative Extension (2001). Living on the Land: Stewardship for Small Acreages. Western SARE Professional Development Project: UNCE/WSARE CM-03-07.
4
1 Watersheds, the Water Cycle and You

• An area of land that drains all precipitation and runoff (water, sediment, and dissolved materials) to a common body of water (e.g., a lake, the ocean, or some point along a stream or river).
What is a watershed?
Speaker Notes:Examples of watersheds:• The Rocky Mountain's Continental Divide: A large national watershed.• The Columbia River Basin: A major regional watershed, draining water from a multi-state area (Washington, Oregon, Idaho, Utah, Nevada, Montana, Wyoming, as well as Canada.)
• Watersheds within watersheds: Many of the smaller rivers in the above-noted states represent their own watershed areas and are also sub-watersheds within the larger Columbia River watershed.
5
1 Watersheds, the Water Cycle and You

Graphic courtesy of University of Nevada Cooperative Extension
Speaker Notes:Visualize a watershed. Identify the large and small watersheds in this picture. For example:• Watershed 1: area that drains to the river that flows from the mountains to the larger water body in front of the large city.• Watershed 2: area that drains to the stream that flows into the small lake. The low ridge that runs through middle of picture is a divide between the river and the stream watershed areas. Precipitation falling on one side of the divide drains to the river watershed, while precipitation falling on the other side drains to the stream watershed.
References:Graphic courtesy of University of Nevada Cooperative Extension (2001). Living on the Land: Stewardship for Small Acreages. Western SARE Professional Development Project: UNCE/WSARE CM-03-07.
6
1 Watersheds, the Water Cycle and You

Major King County Watersheds
Graphic courtesy of King County Department of Natural Resources and Parks
NOTE: This slide can be substituted with a local watershed example.• Any or all of the watershed exercises listed under Activity 3 can be completed here.• If related assignment What watershed do you live in? has been completed, you may discuss findings now.
Speaker Notes:Know your local watersheds. This map identifies the river systems that make up major watersheds in King County.
References:Graphic courtesy of King County Department of Natural Resources and Parks http://dnr.metrokc.gov/wlr/Mapindex.htm
7
1 Watersheds, the Water Cycle and You

The Water Cycle
Graphic reproduced from Dunne, T. and Leopold, L. (1978). Water in Environmental Planning.
NOTE: Provide print copy of this slide to students so they can follow along with the next several slides (included in handouts).
Speaker Notes:No new water is ever produced on earth. Our water has been in existence for billions of years, moving through the hydrologic cycle. The processes on this slide are detailed on slides 9 through 13.• Evaporation• Condensation/Precipitation• Interception• Evapotranspiration• Overland Flow/Snow Melt Runoff• Infiltration/percolation• Interflow• Surface and Groundwater Flow
References:Graphic reproduced from Dunne, T. and Leopold, L. (1978). Water in Environmental Planning.San Francisco: W.H. Freeman and Company.Information source: U.S. Geological Service: http://ga.water.usgs.gov/edu/watercycle.html
8
1 Watersheds, the Water Cycle and You

From Ocean to Air
• Evaporation
• Condensation
Photo courtesy of WSU King County Extension
Speaker Notes:Evaporation: Sun and wind evaporate water from oceans and lakes, changing water from a liquid form to a gaseous (water vapor) form.
Condensation:• As water vapor rises into the atmosphere it cools, condenses, and turns back into a liquid form.• Clouds contain water vapor and cloud droplets, which are small drops of condensed water.• Water is continually evaporating and condensing in the sky.
Additional Information:Oceans and land:• Evaporation is more prevalent over the oceans than precipitation (due to their vastness, with over 70 percent of earth covered by oceans.) Over the land, precipitation is more prevalent than evaporation. One exception is a desert, where evaporation can exceed precipitation due to geographic conditions .• Most of the water that evaporates from the oceans falls back into the oceans as precipitation.• Only about 10 percent of the water evaporated from the oceans is transported over land and falls as precipitation.
9
1 Watersheds, the Water Cycle and You

• PrecipitationRainSnow, Sleet, Hail
Photo courtesy of R. Hill, USDA-NRCS
From Sky to Land
NOTE: Information in italics can be replaced with regional information as appropriate
Speaker Notes:Precipitation:• Water molecules combine with tiny particles in the air to form droplets, which grow and develop into clouds, a form of water we can see. • Water droplet particles collide and create bigger droplets, until the droplets are large enough to fall out of the cloud as precipitation.
Seattle receives 37 inches of rain a year, and much higher precipitation rates occur as you go uphill into the Cascades, as the clouds bump up against the mountains and drop more rain.Snow fall during cooler climatic periods can accumulate to form glaciers. A long time ago (last time was about 15,000 years) glaciers migrated south and filled the Puget Sound Area. The Seattle area was under 3000 feet of ice, a sheet that extended from the Olympics, across to the Cascade foothills, and south to near Olympia.
References:Photo courtesy of R. Hill, USDA-NRCS http://photogallery.nrcs.usda.gov/
10
1 Watersheds, the Water Cycle and You
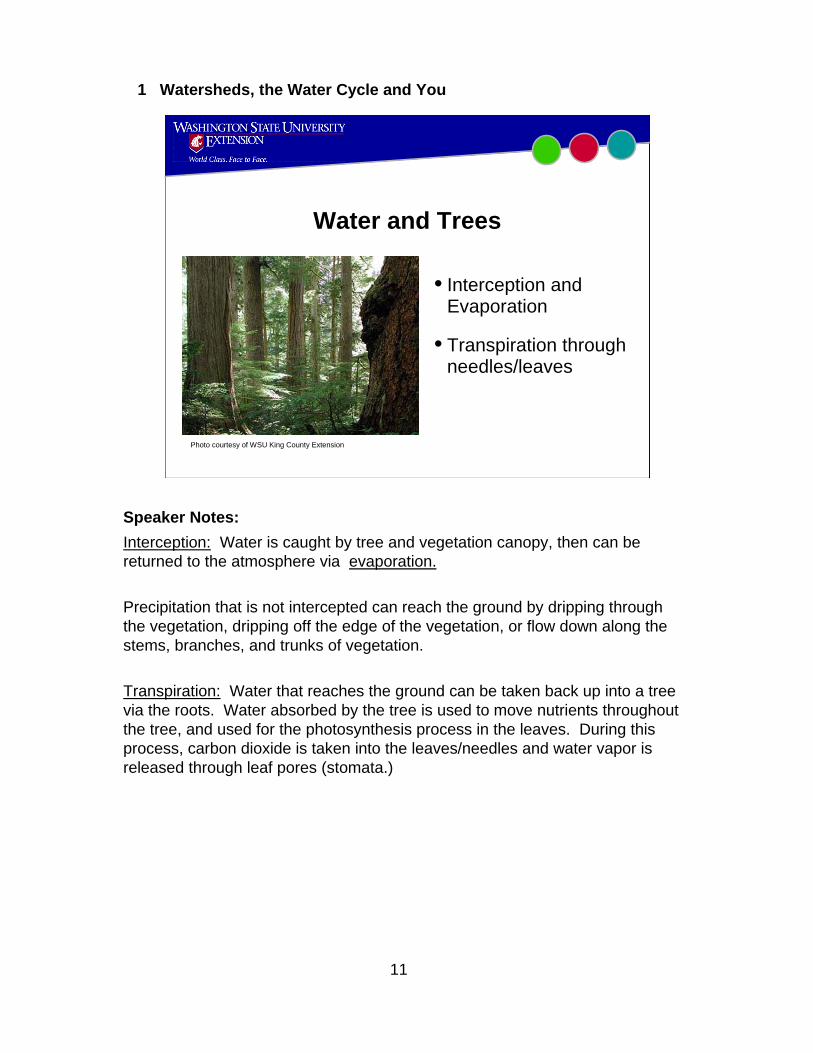
Water and Trees
• Interception and Evaporation
• Transpiration through needles/leaves
Photo courtesy of WSU King County Extension
Speaker Notes:Interception: Water is caught by tree and vegetation canopy, then can be returned to the atmosphere via evaporation.
Precipitation that is not intercepted can reach the ground by dripping through the vegetation, dripping off the edge of the vegetation, or flow down along the stems, branches, and trunks of vegetation.
Transpiration: Water that reaches the ground can be taken back up into a tree via the roots. Water absorbed by the tree is used to move nutrients throughout the tree, and used for the photosynthesis process in the leaves. During this process, carbon dioxide is taken into the leaves/needles and water vapor is released through leaf pores (stomata.)
11
1 Watersheds, the Water Cycle and You
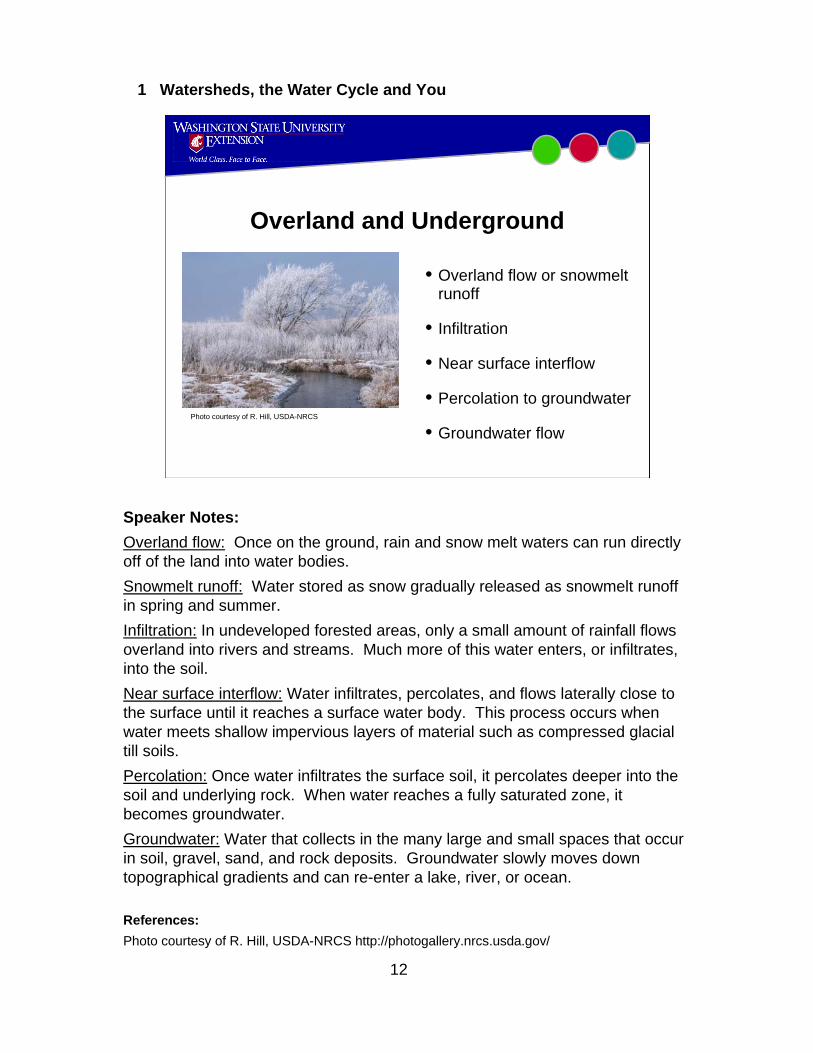
Overland and Underground
• Overland flow or snowmelt runoff
• Infiltration
• Near surface interflow
• Percolation to groundwater
• Groundwater flowPhoto courtesy of R. Hill, USDA-NRCS
Speaker Notes:Overland flow: Once on the ground, rain and snow melt waters can run directly off of the land into water bodies.Snowmelt runoff: Water stored as snow gradually released as snowmelt runoff in spring and summer.Infiltration: In undeveloped forested areas, only a small amount of rainfall flows overland into rivers and streams. Much more of this water enters, or infiltrates, into the soil.Near surface interflow: Water infiltrates, percolates, and flows laterally close to the surface until it reaches a surface water body. This process occurs when water meets shallow impervious layers of material such as compressed glacial till soils.Percolation: Once water infiltrates the surface soil, it percolates deeper into the soil and underlying rock. When water reaches a fully saturated zone, it becomes groundwater.Groundwater: Water that collects in the many large and small spaces that occur in soil, gravel, sand, and rock deposits. Groundwater slowly moves down topographical gradients and can re-enter a lake, river, or ocean.
References:Photo courtesy of R. Hill, USDA-NRCS http://photogallery.nrcs.usda.gov/
12
1 Watersheds, the Water Cycle and You

Surface Water (where we see it)
• Streams filled up by:Snow melt runoff
Overland flow
Resurfacing interflow and groundwater
Photo courtesy of C. Rahm, USDA-NRCS
Speaker Notes:While representing a small percentage of the world’s water; lakes, streams, and rivers are the most visible evidence of the hydrologic cycle.
Snow runoff and overland flow: Contribute surface water to streams and rivers, which return the water, eventually, to the ocean.
Resurfacing interflow and groundwater:• Groundwater: Subsurface water that flows along topographical gradient.• Can resurface lower in the watershed and fill up streams or other water bodies(called recharge). Underground water moves slowly and puts water into streams and rivers even if it has not rained for a while.• Important process in places with long periods without precipitation (like Pacific Northwest summers). Prevents streams from drying up in summer.
References:Photo courtesy of C. Rahm, USDA-NRCS http://photogallery.nrcs.usda.gov/
13
1 Watersheds, the Water Cycle and You

• Watersheds and the Water-Cycle
• Natural Watershed FeaturesForests and Other Native VegetationSoilsGroundwaterStreams and Riparian AreasWetlandsLakesThe NearshoreFish and Wildlife
• Watershed Degradation
Watersheds, the Water Cycle and You
NOTE: End of section 1, you may want to take questions now.
Speaker Notes:This section of the presentation will provide an overview of watershed features that describe, influence, or are influenced by how water flows across the landscape:• Each feature listed on this slide is briefly defined and described.• Functions and values that healthy features provide to the overall watershed are identified.
14
1 Watersheds, the Water Cycle and You
Watersheds
Wetlands
Soils and Geology
Groundwater Lakes
Streams and Riparian Areas
The Nearshore
Forests and Vegetation
Fish and Wildlife
Graphic adapted from University of Nevada Cooperative Extension
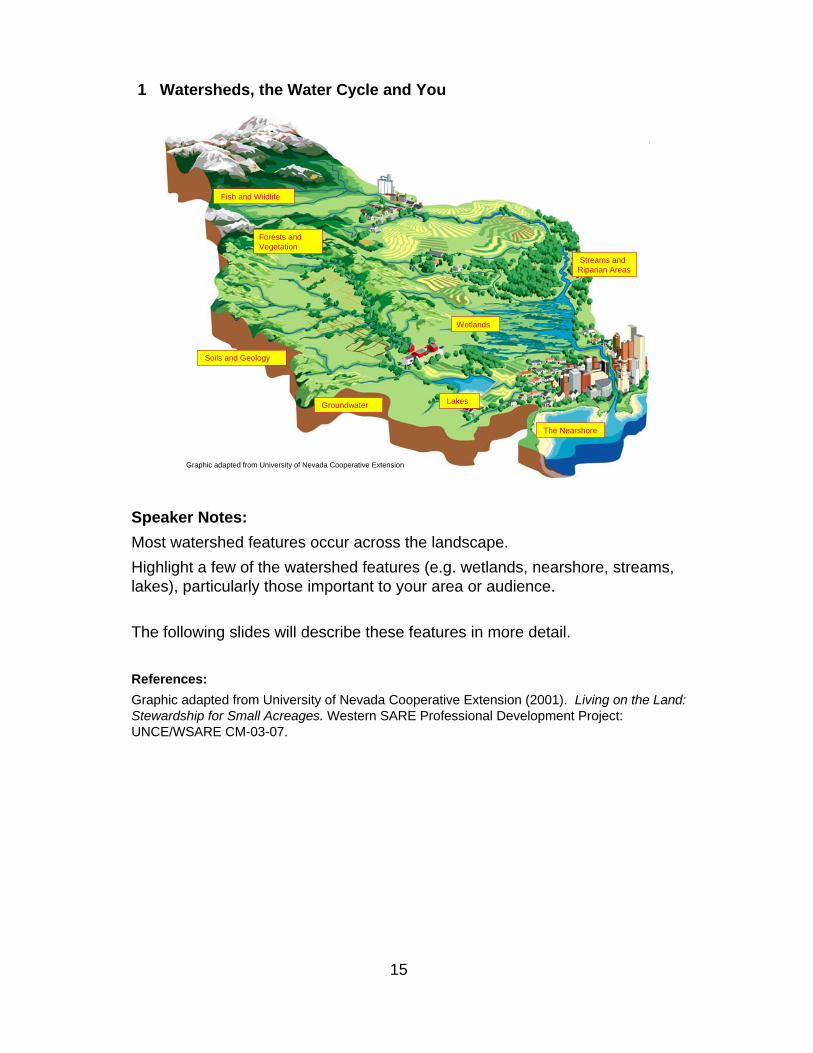
Speaker Notes:Most watershed features occur across the landscape.Highlight a few of the watershed features (e.g. wetlands, nearshore, streams, lakes), particularly those important to your area or audience.
The following slides will describe these features in more detail.
References:Graphic adapted from University of Nevada Cooperative Extension (2001). Living on the Land: Stewardship for Small Acreages. Western SARE Professional Development Project: UNCE/WSARE CM-03-07.
15
1 Watersheds, the Water Cycle and You

• Plant species present in Pacific Northwest prior to European arrival, circa 1800
• Plants evolved locally and adapted to local habitat types
• Coniferous forests predominant
Forests and Other Native Vegetation
Photo courtesy of WSU King County Extension
Speaker Notes:Pacific Northwest forests are made up of a variety of vegetation types such as trees, shrubs, forbs (non-grass herbaceous plants), ferns, and lichens.
• Native plants have evolved in their environment and adapted to it, rather than being transplanted into it.
• Coniferous forests (Douglas fir, western red cedar, and western hemlock) predominate.
• Well established native plants provide a variety of functions and values such as erosion control, water filtration, and flood control. They also provide food, shelter, and cover for native fish and wildlife.
16
1 Watersheds, the Water Cycle and You

Forests and the Water-Cycle
• Forests slow water movement in these ways:
InterceptionFog DripEvaporationTranspirationInfiltration/percolation
Photo courtesy of Chris Evans, The University of Georgia
Speaker Notes:Interception: Forests capture falling water, which slows water movement through the forest ecosystem.Fog Drip: Atmospheric water can be captured on vegetation via condensation as clouds moving through a forest, then drip downward.Evaporation: Occurs as trees and under-story plants capture water in the canopyTranspiration: Trees and under-story plants take up water through their roots and water escapes through the stomata (pores) of leaves as carbon dioxide and water vapor are exchanged during photosynthesis.Infiltration: Water infiltrates into the forest floor layer of duff, and slowly percolates deeper into soil and rock.
References:Photo courtesy of Chris Evans, The University of Georgia, www.forestryimages.org
17
1 Watersheds, the Water Cycle and You
Hydrology in a forest environment
Graphic reproduced from King County Department of Natural Resources and Parks
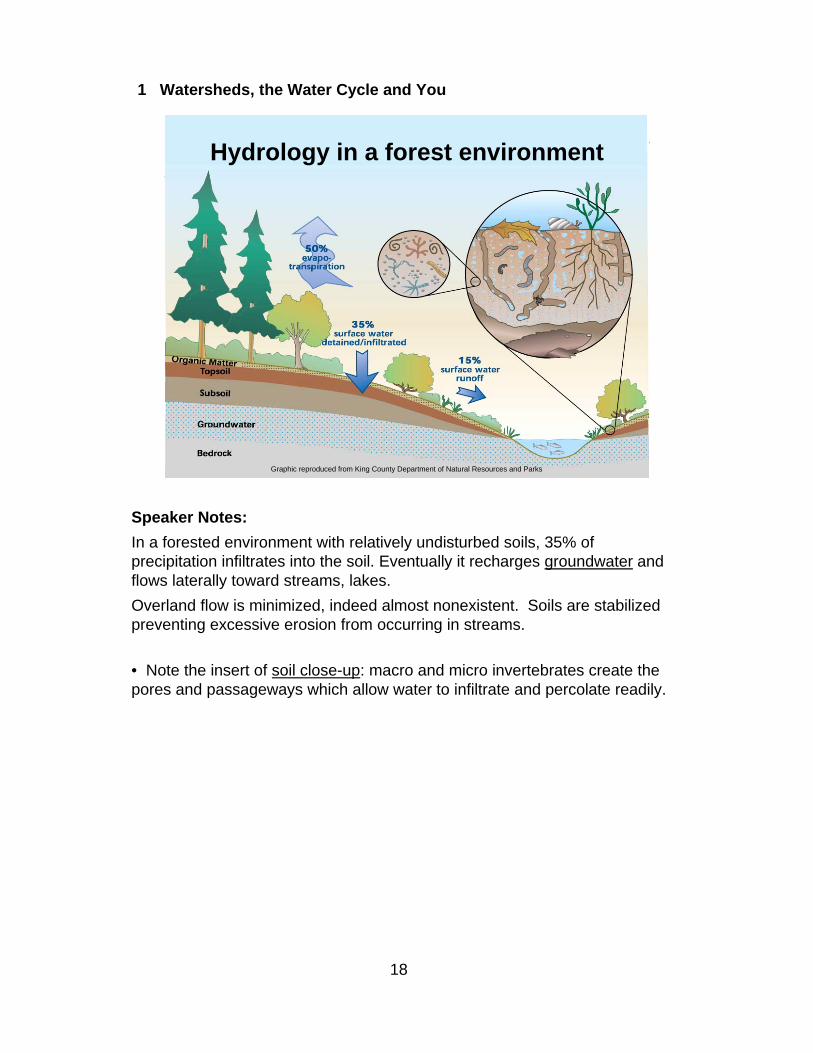
Speaker Notes:In a forested environment with relatively undisturbed soils, 35% of precipitation infiltrates into the soil. Eventually it recharges groundwater and flows laterally toward streams, lakes. Overland flow is minimized, indeed almost nonexistent. Soils are stabilized preventing excessive erosion from occurring in streams.
• Note the insert of soil close-up: macro and micro invertebrates create the pores and passageways which allow water to infiltrate and percolate readily.
18
1 Watersheds, the Water Cycle and You

Forests affect water quality by:
• Filtering nutrients and sediment
• Providing shade, which keeps temperatures cool
• Providing large woody debris (LWD)
• Stabilizing soils and stream channels Photo courtesy of WSU King County Extension
Speaker Notes:Water moving through forest duff and underlying soils filters fine soil particles and nutrients that otherwise could cause excessive erosion and eutrophicationin streams.
Trees and shrubs provide shade:• Keeps cool water cooler• Cool water needed by fish/amphibibian (e.g. to hatch eggs successfully)
Trees provide large woody debris (LWD) such as fallen trees and limbs.• Create pools where water slows• Important resting places for young fish and adult fish returning to spawn
Trees, shrubs, and herbaceous plants along stream banks stabilize the soils and banks through their root systems. • Stabilizes slopes• Controls erosion• Important in regions characterized by steep stream channels with high erosion potential.
19
1 Watersheds, the Water Cycle and You

• Evolved with native pests
• Water filtration (wetland species)
• Food and shelter for native wildlife
Other Native Vegetation Functions and Values
Photo courtesy of WSU King County Extension Photo courtesy of WSU King County Extension
Speaker Notes:Other functions and values associated with forests and native vegetation include:• Evolved with native pests and diseases
• more resistant • require fewer pesticides
• Wetland plants filter water directly• slow velocity• settle sediment• filters pollutants• provide habitat for native fish, salmon
•Provide food and shelter for native wildlife
References:Center photo courtesy of C. Antieau, WSU CAHE NW Native Plant Database http://gardening.wsu.edu/nwnative/
20
1 Watersheds, the Water Cycle and You

Role of Soils in the Water-Cycle
Soils: A mixture of minerals,organic materials, and livingthings
Graphic courtesy of NRCS
Graphic reproduced from University of Minnesota Extension Service
Speaker Notes:Soils are: A composite of inorganic (sand, silt, and/or clay) and organic (decaying vegetation, insects, and micro-organisms) materials. Soils harbor a multitude of life forms (e.g., earthworms, insects, fungi, bacteria and a variety of other microorganisms) that break down nutrients and recycle them back into the forest canopy.
The role of soil in the water-cycle:• The worm graphic shows that soil includes “pore space”, the spaces between soil particles that can fill up with water when it rains. Size and extent of pore spaces dependent on soil type.• The second graphic demonstrates how soil acts as a water reservoir:
• During rainfall event, water can run off surface of land. However, much will infiltrate into the soil pore spaces.• Some will percolate deeper into the soil, replenishing aquifers.• Some will evaporate, or be transported through roots into above-ground vegetation, then transpired back into the atmosphere.• After a period of drought, little water may remain in soil pore spaces. Native plants will have adapted to these seasonally dry periods.
21
1 Watersheds, the Water Cycle and You

Graphic reproduced from League of Women Voters of Pennsylvania Citizen Education Fund
What is Groundwater?
Speaker Notes:This diagram demonstrates water flow through soil and underlying bedrock materialsGroundwater: “Subsurface water occupying the saturated zone”
Unsaturated zone: Where pores spaces present in soil and rock hold both water and air. Note infiltration occurs at surface, while “water seepage”definition on slide refers to percolation.
Saturated zone: Where all pore spaces are filled with water. The depth below which all pore spaces are filled with water is called the water table.
References:Graphic reproduced from League of Women Voters of Pennsylvania Citizen Education Fundhttp://www.pikeconservation.org/Groundwater.htm
Definitions source: International Glossary of Hydrology at http://webworld.unesco.org/water/ihp/db/glossary/glu/aglu.htm
22
1 Watersheds, the Water Cycle and You
Graphic reproduced from League of Women Voters of Pennsylvania Citizen Education Fund
Where Groundwater Goes
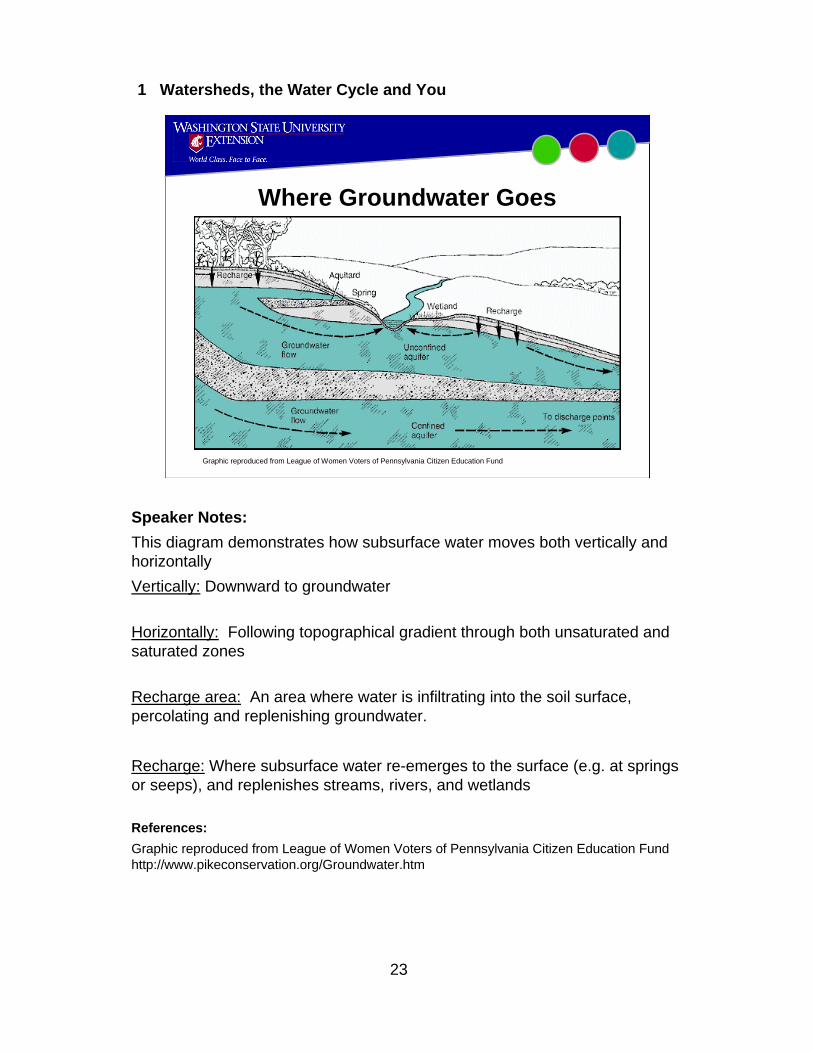
Speaker Notes:This diagram demonstrates how subsurface water moves both vertically and horizontally Vertically: Downward to groundwater
Horizontally: Following topographical gradient through both unsaturated and saturated zones
Recharge area: An area where water is infiltrating into the soil surface, percolating and replenishing groundwater.
Recharge: Where subsurface water re-emerges to the surface (e.g. at springs or seeps), and replenishes streams, rivers, and wetlands
References:Graphic reproduced from League of Women Voters of Pennsylvania Citizen Education Fundhttp://www.pikeconservation.org/Groundwater.htm
23
1 Watersheds, the Water Cycle and You

Graphic reproduced from USGS
Speaker Notes:This diagram demonstrates aquifers and the aquitards in between.
Aquifer: A permeable groundwater-bearing formation capable of yielding exploitable quantities of water (e.g. a groundwater reservoir.)
Aquitard: Geological formations that are very impervious and transmit water at a very slow rate (e.g. a layer of clay which restricts the downward movement of water.)
Unconfined aquifer: Shallow aquifers where no aquitards are present
Confined Aquifers: When an aquitard layer exists between a deeper aquifer and the surface of the ground.
• Water in confined aquifers may be under pressure as groundwater flows down from higher elevation areas.
• Wells drilled into confined aquifers are artesian, in that there is pressure to force water up the well above the water table (a flowing artesian well is under enough pressure to bring the water to the surface.)
References:Graphic reproduced from USGS, http://wa.water.usgs.gov/outreach/images/gw.xsec.gif
Definitions source: International Glossary of Hydrology at http://webworld.unesco.org/water/ihp/db/glossary/glu/aglu.htm
24
1 Watersheds, the Water Cycle and You
Groundwater’s Role in the Water Cycle
• Conduit and reservoir
• Source of stream, wetland, and lake water (particularly during dry season)
• Water filtrationPhoto courtesy of Clean Water Action Council
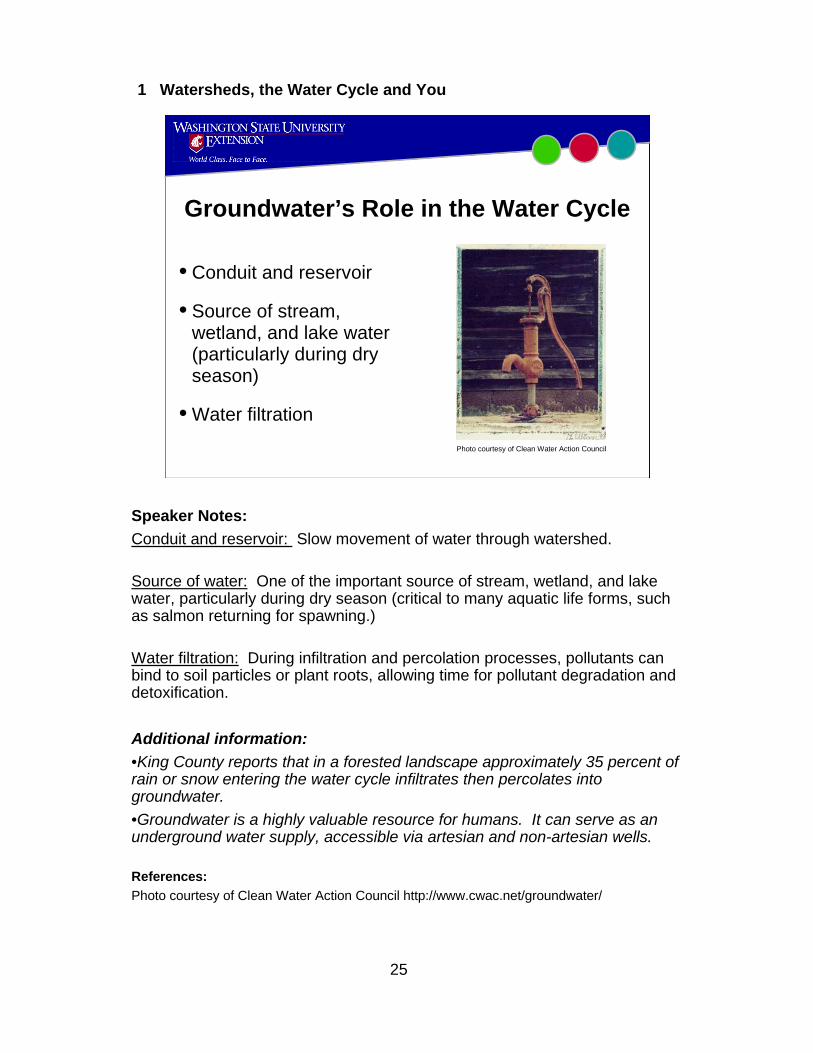
Speaker Notes:Conduit and reservoir: Slow movement of water through watershed.
Source of water: One of the important source of stream, wetland, and lake water, particularly during dry season (critical to many aquatic life forms, such as salmon returning for spawning.)
Water filtration: During infiltration and percolation processes, pollutants can bind to soil particles or plant roots, allowing time for pollutant degradation and detoxification.
Additional information:•King County reports that in a forested landscape approximately 35 percent of rain or snow entering the water cycle infiltrates then percolates into groundwater.•Groundwater is a highly valuable resource for humans. It can serve as an underground water supply, accessible via artesian and non-artesian wells.
References:Photo courtesy of Clean Water Action Council http://www.cwac.net/groundwater/
25
1 Watersheds, the Water Cycle and You

Streams: What They Are
• Water flowing:In the stream channel
Just below the surface (hyporheic zone)
On the flood plain
Graphic reproduced from King County GIS Center
Speaker Notes:Streams: “Relatively small volumes of water moving within a visible channel,”as well as the “sub-surface water moving in the same direction as the surface water, and the associated riparian vegetation.”
Rivers: Same as above, except “a relatively large volume of water…”
Hyporheic zone: Under-the-streambed zone where ground water and surface water mix.
Flood Plain: Nearly level land along a stream flooded only when the stream flow exceeds the water carrying capacity of the channel.• May be a narrow corridor of land along mid-elevation streams or much broader plains along lower elevation rivers.
References:Graphic reproduced from King County GIS Center, http://www.metrokc.gov/gis/mapportal/iMAP_main.htm
Stream/River definition source: Naiman, R.J. and Bilby R.E. (eds.) (1998). River Ecology and Management, Lessons From the Pacific Coastal Ecoregion. New York: Springer-Verlag.
26
1 Watersheds, the Water Cycle and You

Streams: How They Form
Graphic reproduced from WSU
• Channel Formation:ErosionTransitionDeposition
• Channel Meanders and Migration
• Pools and Riffles
Speaker Notes:Stream channel formation: (Using example of Pacific Northwest stream that flows from steep mountainous areas, through lower foothills, and finally to more level flood plains near the Puget Sound):• Erosion: Water flow in steep headwater areas erodes sediment and other materials from hillsides, carving a stream channel.• Transition: Stream gains in water volume. As land becomes less steep, stream flow velocity decreases and transition zone is reached where sediment erosion and deposition is in equilibrium. The stream channel often begins to meander, and a flood plain begins to form.• Deposition: As stream or river reaches broader and flatter lowlands, streamvelocity slows further, river meandering increases, and more sediment deposition occurs.
Stream Channel Meanders and Migration• Flowing water meanders back and forth, making serpentine channel forms• Over long time periods, stream channel can migrate back and forth across it’s flood plain
Pools/Riffles• Channel meanders scour out pools as outside bank is eroded by water flow.• Riffles form in shallower stretches of water between pools, and inside the bank where sediment deposition occurs.
27
1 Watersheds, the Water Cycle and You

Riparian Areas
• Transition area between aquatic and upland zones
Photo courtesy of USDA-NRCS
Speaker Notes:The riparian area is the land along a water body that is influenced by the surface and subsurface water of the stream and adjacent flood plain. The most obvious riparian feature is the water dependent vegetation.
Riparian areas exhibit high physical and biological diversity based on:• Complex soil distribution due to erosion and deposition• High frequency of hydrologic disturbances (e.g. during flooding)• Abundance of water
References:Photo courtesy of USDA-NRCS http://photogallery.nrcs.usda.gov/
28
1 Watersheds, the Water Cycle and You

What Healthy Streams andRiparian Areas Look Like
• Good water quality
• High water table
• Increased water storage capacity
• Diverse plant and animal life
Photo courtesy ofUSDA-NRCS
Photo courtesy of King County DNRP
• Channel meanders
• Flood plain/overflow channels
• Deeply rooted native vegetation
• Balance of flow, sediment, and large wood
Speaker Notes:Channel meanders: Healthy streams migrate back and forth across a floodplain.Flood plain/overflow channels: Healthy streams form flood plains, and in some cases create a complex of braided channels and side channels.Native vegetation: Water dependent native vegetation thrive along stream bank and across riparian zone.Balance of flow, sediment, and large wood: Healthy streams reach equilibrium between water flow and sediment erosion, transport, and deposition. Fallen trees (referred to as woody debris) from adjacent riparian areas contribute to this balance (for example, by stabilizing a stream bank.)Good water quality: Watersheds that are minimally impacted by human activities produce clean water. High water table and increase water storage capacity: Floodplain, side channels, and wetlands will slow and store water.
The above processes create habitat for diverse plant and animal life in/along stream
References:Photo courtesy of USDA-NRCS http://photogallery.nrcs.usda.gov/
29
1 Watersheds, the Water Cycle and You

What Healthy Stream/Riparian Areas Do• Hold sediments
Stabilize banks
• Slow/reduce floodsRecharge aquifersMaintain stream flows
• Maintain water qualityFilter sediments/pollutantsShade/keeps water cool
• Supply nutrients
• Provide fish/wildlife habitatPhotos courtesy of WSU
Speaker Notes:Hold sediments: Excessive sediment scouring is reduced when densely rooted riparian vegetation and fallen logs stabilize stream banks and adjacent land.
Slow/reduce floods: Channel meanders and roughness slow the flow of water, reducing or preventing flooding. Detained water can recharge groundwater, and be delivered to streams slowly over longer time periods (important for salmon returns during low flow summer/fall periods).
Maintain Water Quality:• Reduce sediment erosion into streams, particularly during storm events..• Hold, store, and transform (make less toxic) non-point source pollutants, particularly wetlands• Overhanging trees and shrubs shade/keeps water cooler; required for aquatic life
Supply nutrients: In the form of plants, animals, and woody debris. Nutrients maintain stream productivity (for example, food for aquatic organisms).
30
1 Watersheds, the Water Cycle and You
What is a Wetland?
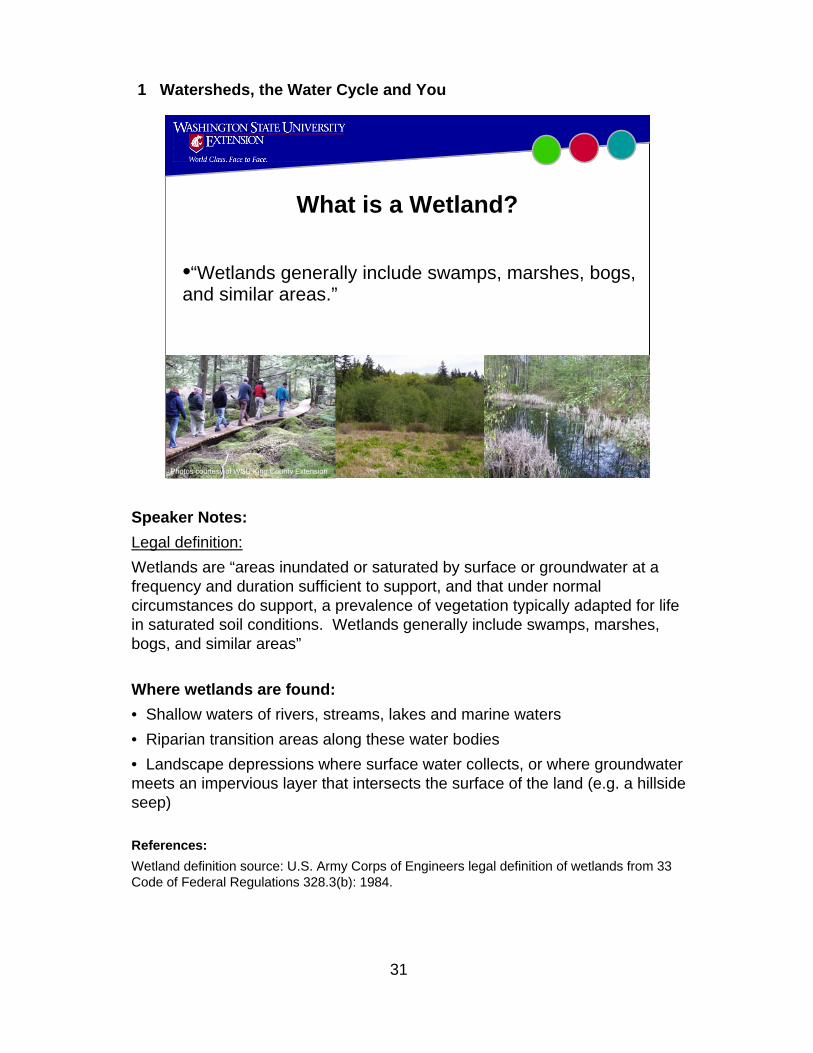
•“Wetlands generally include swamps, marshes, bogs, and similar areas.”
Photos courtesy of WSU King County Extension
Speaker Notes:Legal definition:Wetlands are “areas inundated or saturated by surface or groundwater at a frequency and duration sufficient to support, and that under normal circumstances do support, a prevalence of vegetation typically adapted for life in saturated soil conditions. Wetlands generally include swamps, marshes, bogs, and similar areas”
Where wetlands are found:• Shallow waters of rivers, streams, lakes and marine waters• Riparian transition areas along these water bodies• Landscape depressions where surface water collects, or where groundwater meets an impervious layer that intersects the surface of the land (e.g. a hillside seep)
References:Wetland definition source: U.S. Army Corps of Engineers legal definition of wetlands from 33 Code of Federal Regulations 328.3(b): 1984.
31
1 Watersheds, the Water Cycle and You

What Makes A Wetland?
• Wetland delineation:Hydrology
Water-influenced or hydric soils
Vegetation
Photo courtesy of USDA-NRCS
Speaker Notes:People who delineate wetlands examine the hydrology, soil and vegetation of a particular area and to determine if a wetland exists and the extent of the wetland.
References:Photo courtesy of USDA-NRCS http://photogallery.nrcs.usda.gov/
32
1 Watersheds, the Water Cycle and You

Functions/Values of Healthy Wetlands
• Water quality• Water movement• Wildlife habitat and food web• Cultural and social• Economic worth
Photos courtesy of USDA-NRCS
Speaker Notes:Water quality: Temperature maintenance, bacterial concentration reduction, sediment capture, nutrient removal/transformation
Water movement: High flow storage, reduced peak flows to influence flooding, base flow maintenance, groundwater recharge, shoreline stabilization for erosion control
Wildlife habitat and food web: High diversity and abundance of fish, birds, and other aquatic life which support the larger food web
Cultural and social: Open space and passive recreation, outdoor education and research, hunting and fishing
Economic Values: Stem from all the above ( e.g. water quality, storm water control, wildlife/recreational values.)
References:Photos courtesy of USDA-NRCS http://photogallery.nrcs.usda.gov/Information source: Oregon State University (1998). Watershed Stewardship, A Learning Guide, EM 8714.
33
1 Watersheds, the Water Cycle and You

Lake Formation
• Geological: glaciers made most lakes• Humans: man-made lakes and reservoirs• Animals: damming rivers and streams
Photos courtesy of WSU
Speaker Notes:Geological Process: Glaciers that were active 10,000 to 20,000 years ago formed vast lake-dotted and marshy landscapes found in North America. Glaciers formed lake basins by gouging holes in loose soil or bedrock, by depositing material across streams beds, or by leaving buried chunks of ice that melted to form lake basins.
Humans and beavers: More recently have created lakes and reservoirs by damming rivers and streams.
References:Information source: The Washington Lake Book at http://www.ecy.wa.gov/programs/wq/plants/lakes/characteristics.html
34
1 Watersheds, the Water Cycle and You

Lake Processes
• Eutrophicationthe natural aging process
• Sedimentationsoils eventually fill the lake
Photo courtesy of L. Betts, USDA-NRCS
Speaker Notes:Over its lifetime, a lake progresses from a more oligotrophic to a more
eutrophic state. Ultimately, most lakes are destined to fill with sediment and organic materials through a natural, slow process.
Oligotrophic: Deficient in plant nutrientsEutrophication Process:1. Nutrients (phosphorus and nitrogen) wash into a lake with storm or stream
water.2. Nutrients fertilize the lake and encourage algae and larger plants to grow. 3. Plants die and decompose, reducing the dissolved oxygen content of the
water, which causes animals to die and decompose. Dead matter accumulates on the lake bottom as organic sediments.
After hundreds or thousands of years of plant growth and decomposition, the lake may resemble a marsh, a bog, or a meadow.
Sedimentation: Wind and water move soil particles from the watershed into a lake. Soil particles settle on the bottom of a lake, decreasing lake depth.
Human activities can accelerate these processes in lakes dramatically.
References:Photo courtesy of L. Betts, USDA-NRCS http://photogallery.nrcs.usda.gov/
35
1 Watersheds, the Water Cycle and You
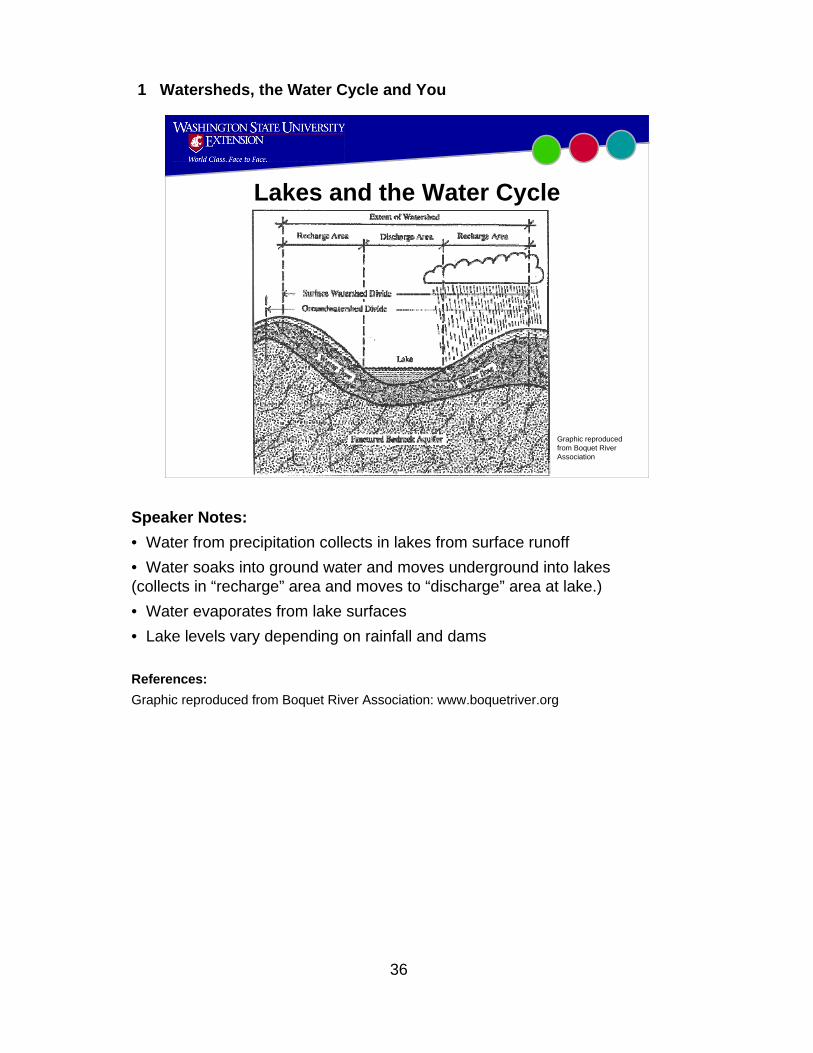
Lakes and the Water Cycle
Graphic reproduced from Boquet River Association
Speaker Notes:• Water from precipitation collects in lakes from surface runoff• Water soaks into ground water and moves underground into lakes(collects in “recharge” area and moves to “discharge” area at lake.)• Water evaporates from lake surfaces• Lake levels vary depending on rainfall and dams
References:Graphic reproduced from Boquet River Association: www.boquetriver.org
36
1 Watersheds, the Water Cycle and You

The Nearshore
Speaker Notes:Nearshore is roughly defined as shallow water between the shoreline and
open sea.• Dynamic habitat, never static• Inputs from land and ocean at all times
Nearshore waters are defined by the surrounding shoreline; nearshore habitat.
References:Graphic reproduced from King County Department of Natural Resources and Parkshttp://dnr.metrokc.gov/wlr/watersheds/puget/nearshore/BeachTopics-
Processes/LgRiverMouthSalmon.pdf
37
1 Watersheds, the Water Cycle and You
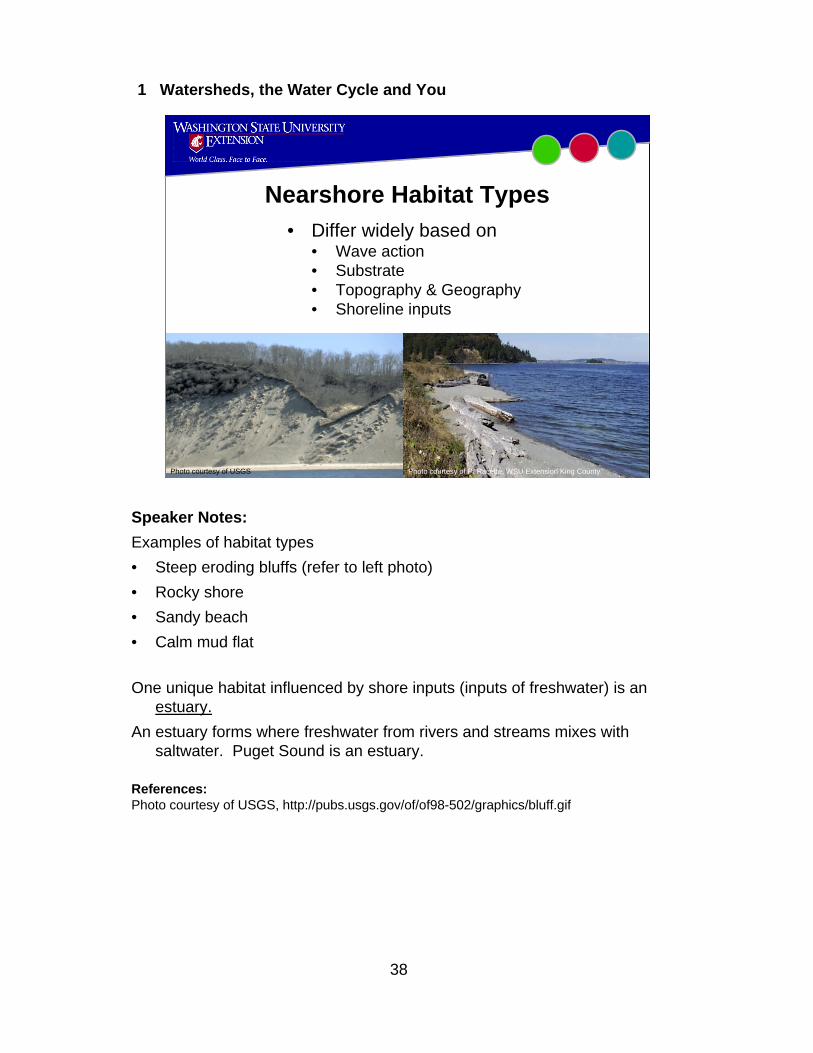
Photo courtesy of USGS Photo courtesy of P. Racette, WSU Extension King County
• Differ widely based on • Wave action• Substrate• Topography & Geography• Shoreline inputs
Nearshore Habitat Types
Speaker Notes:Examples of habitat types• Steep eroding bluffs (refer to left photo)• Rocky shore• Sandy beach• Calm mud flat
One unique habitat influenced by shore inputs (inputs of freshwater) is an estuary.
An estuary forms where freshwater from rivers and streams mixes with saltwater. Puget Sound is an estuary.
References:Photo courtesy of USGS, http://pubs.usgs.gov/of/of98-502/graphics/bluff.gif
38
1 Watersheds, the Water Cycle and You

• Shoreline erosion protection
• Water pollution filtration
• Flood mitigation
• Nutrient-rich nursery
• Spawning, rearing, and feeding ground
• Critical juvenile salmon nursery Photo courtesy of King County Department of Natural
Resources and Parks
Functions and Values of Nearshore
Speaker Notes:• Shoreline erosion protection from wave energy• Water pollution filtration through vegetation and sedimentation (photo of
eelgrass)• Flood mitigation in salt marshes• Nutrient-rich nursery providing the basis for the food chain• Spawning, rearing, and feeding ground for numerous species
• Most commercially valuable fish spend some part of life cycle innearshore
• Habitat for 80% of fish species in US
Estuary habitats are particularly valuable• Very rich in nutrients from
• Stream sediments and detritus• Tidal energy and marine drift; plankton
• Provide critical basis for food chain
References:Photo courtesy of King County Department of Natural Resources and Parkshttp://dnr.metrokc.gov/wlr/waterres/marine/img/vegetation/eelgrass2.jpg
39
1 Watersheds, the Water Cycle and You

Wildlife and Watersheds“The health and well-being of fish and wildlife is important not only to the species themselves, but to humans as well. Often, when fish and wildlife populations are threatened, their decline can predict environmental hazards or patterns that also may have a negative impact on people.” --Washington Department of Fish and Wildlife: http://wdfw.wa.gov/
Photos courtesy of WDFW
Speaker Notes:Wildlife is an important feature of our watersheds.Some wildlife functions and values:• Food for humans• Food chain for humans and other wildlife• Recreation (hunting, fishing, wildlife viewing)• Indicators of overall health of environment (e.g. salmon indicators of overall watershed health)
References:Photos courtesy of Washington Department of Fish and Wildlife, http://wdfw.wa.gov/gallery/albums.php
40
1 Watersheds, the Water Cycle and You

It’s All About Habitat• Food• Water• Shelter• Space
Photo courtesy of UW Burke Museum Photo courtesy of WDFW Photo courtesy of WDFW
Speaker Notes:Habitat: Areas where plants, animals and other organisms live and find adequate amounts of food, water, shelter and space needed to sustain their populations.Our watersheds provide habitat for many kinds of wildlife! Almost 30% of wildlife species found in riparian forests depend upon riparian and aquatic resources (obligate species).Many amphibians depend on the moist habitats offered by riparian areas.
References:Photos courtesy of UW Burke Museum, http://www.washington.edu/burkemuseum/mammalogy/mamwash/luca.html and Washington Department of Fish and Wildlife, http://wdfw.wa.gov/gallery/albums.php
41
1 Watersheds, the Water Cycle and You
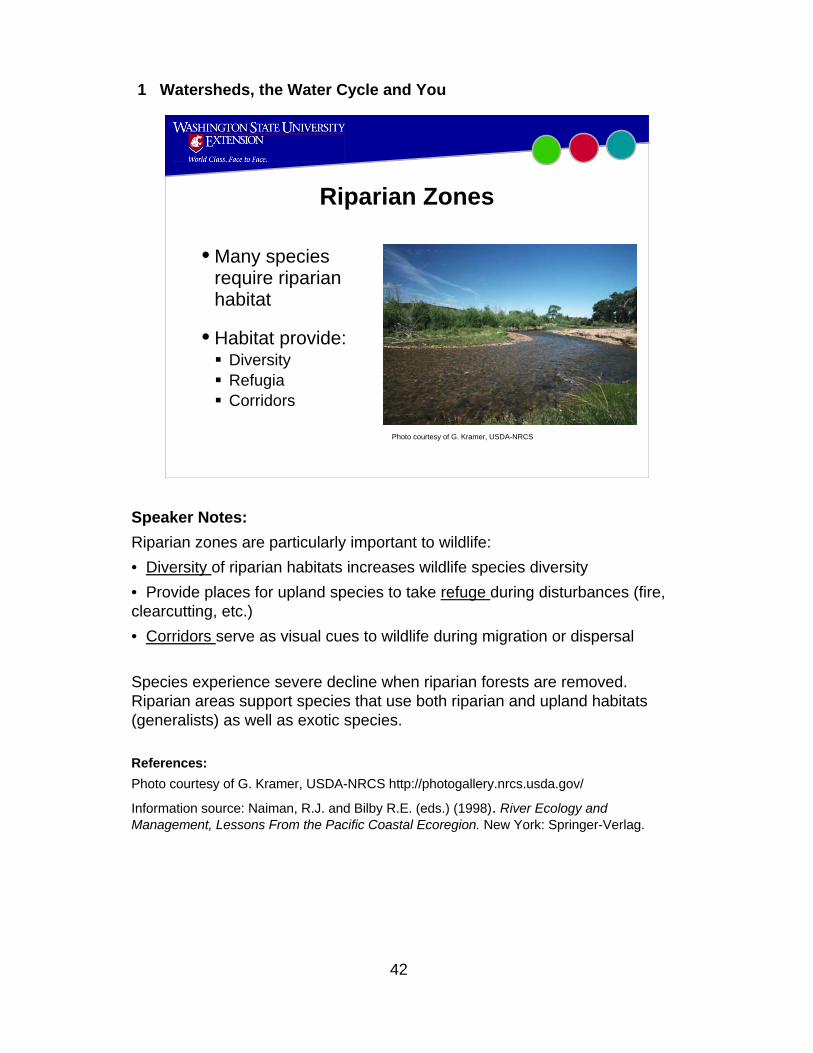
Riparian Zones
• Many species require riparian habitat
• Habitat provide:DiversityRefugiaCorridors
Photo courtesy of G. Kramer, USDA-NRCS
Speaker Notes:Riparian zones are particularly important to wildlife:• Diversity of riparian habitats increases wildlife species diversity• Provide places for upland species to take refuge during disturbances (fire, clearcutting, etc.)• Corridors serve as visual cues to wildlife during migration or dispersal
Species experience severe decline when riparian forests are removed. Riparian areas support species that use both riparian and upland habitats (generalists) as well as exotic species.
References:Photo courtesy of G. Kramer, USDA-NRCS http://photogallery.nrcs.usda.gov/
Information source: Naiman, R.J. and Bilby R.E. (eds.) (1998). River Ecology and Management, Lessons From the Pacific Coastal Ecoregion. New York: Springer-Verlag.
42
1 Watersheds, the Water Cycle and You

Stream Corridor Connectivity
Speaker Notes:This slide illustrates landscapes with high and low degrees of habitat connectivity. A connected landscape structure generally has higher levels of function than a fragmented one.
References:Graphic reproduced from Stream Corridor Restoration: Principles, Processes, and Practices, Federal Interagency Stream Restoration Working Group (FISRWG), 1998.
43
1 Watersheds, the Water Cycle and You

Important Fish Habitat Needs• Sufficient water quantity and
good water quality• Cool well oxygenated waters
in spawning gravels• Habitat Structures
Pools (escape-cover)Riffles(spawning)Undercut banks/woody debris (cover and food)
• Riparian vegetation (shade, insect and leaf drop)
• Absence of migration barriersPhoto courtesy of WSU King County Extension
Speaker Notes:25% of PNW fish are anadromous, meaning they start their lives in freshwater, move to salt to grow and mature, then return to fresh to reproduce.
•Examples of anadromous fish include lamprey, sturgeon, salmon, and trout.
Collectively the five major species of salmon in the Pacific Northwest region use all parts of the watershed, from headwater streams to main-stem rivers, to estuaries. (Important habitat needs for these and other fish species are listed on the slide.)
44
1 Watersheds, the Water Cycle and You

Watersheds, the Water Cycle and You
• Watersheds and the Water Cycle
• Natural Watershed Features
• Watershed DegradationImpacts on Water Quantity and QualityWhat We Can Do To Reduce Impacts
NOTE: End of section 2, you may want to take questions now.
Speaker Notes:The next section of the presentation provides summary of watershed degradation processes, focusing on water quantity and quality impacts, followed by general descriptions of what we can do individually and collectively to reduce degradation.
45
1 Watersheds, the Water Cycle and You

Human Impacts on Watersheds
• Forestry• Agriculture• Land Development/urbanization• General Household Practices• Recreation (such as boating and fishing)
Photo courtesy of USDA-NRCSPhoto courtesy of WSU King County Extension Photo courtesy of USDA-NRCS
NOTE: If you choose to do Optional Activity 1: Summary of Land Use Trends in Westside Pacific Northwest Waters, insert slides here. This activity covers the impacts of forestry, agriculture, development, household practices and recreation on watersheds in the PNW. (Modules 2-6 cover these topics in more detail.)
Speaker Notes:The way people use land impacts water quality and quantity:• Forestry: Removing or changing forest cover alters the water cycle and may degrade water quality.• Agriculture: Livestock and crop production can increase runoff, and introduce nutrients and other pollutants into water bodies.• Land development: Land clearing, road construction and development dramatically alter the hydrologic cycle, increasing surface water runoff (often high in pollutants) and sedimentation in streams.• Household Practices: Indoor and outdoor water use, landscaping, and the use of household chemical products can impact water quality and quantity.• Recreation: Boating, fishing, camping, and trail uses can introduce pollutants and increase sedimentation into water bodies.
References:Photos courtesy of USDA-NRCS, http://photogallery.nrcs.usda.gov/
46
1 Watersheds, the Water Cycle and You
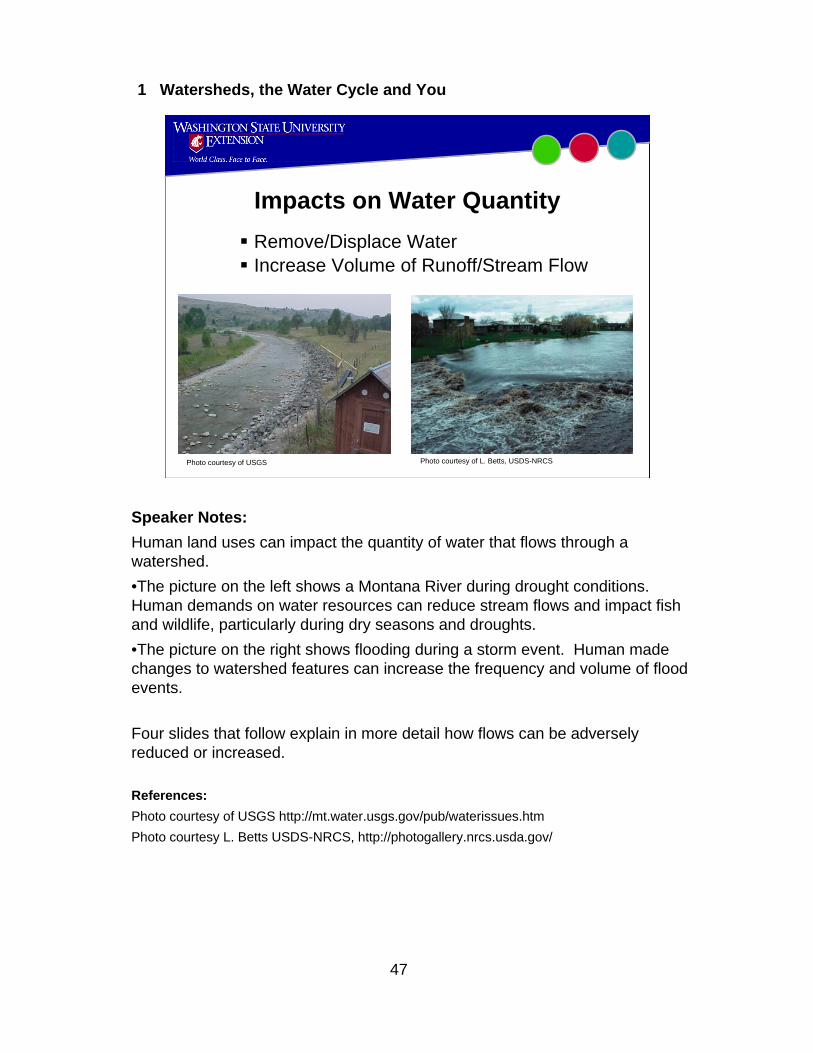
Impacts on Water QuantityRemove/Displace WaterIncrease Volume of Runoff/Stream Flow
Photo courtesy of USGS Photo courtesy of L. Betts, USDS-NRCS
Speaker Notes:Human land uses can impact the quantity of water that flows through a watershed.•The picture on the left shows a Montana River during drought conditions. Human demands on water resources can reduce stream flows and impact fish and wildlife, particularly during dry seasons and droughts.•The picture on the right shows flooding during a storm event. Human made changes to watershed features can increase the frequency and volume of flood events.
Four slides that follow explain in more detail how flows can be adversely reduced or increased.
References:Photo courtesy of USGS http://mt.water.usgs.gov/pub/waterissues.htmPhoto courtesy L. Betts USDS-NRCS, http://photogallery.nrcs.usda.gov/
47
1 Watersheds, the Water Cycle and You

Water Removed or Displaced For:
From river to reservoir… to pipeline… to you.
• Drinking
• Cleaning and bathing
• Power generation
• Irrigation and agriculture
• Business and industry
• Transportation
Photos courtesy of WSU King County Extension
Speaker Notes:People need water for a variety of uses.
• Removal: To meet user demands, water is physically withdrawn from reservoirs, rivers, and aquifers.
• Displacement: Water may be returned to the same watershed or discharged into another watershed or to marine waters.
•As a result of displacement and use, less water of lower quality may be available to replenish streams and aquifers.
48
1 Watersheds, the Water Cycle and You

50• Fish primary, water supply secondary100• Reserved for fish
150City of Seattle water right claim unperfected
10545
• Reserved for water supply• Water supply primary, fish secondary
150City of Seattle perfected water right
249Must remain for in-stream flow549Average river flow
Average Annual Flow RatesMillion Gallons Per Day
Water Use
Case Study: Cedar River, Washington Flow Rates
Speaker Notes:The purpose of this slide is to demonstrate demands placed on a watershed by water users. Case study shows how Cedar River Water flow is allocated for use by City of Seattle residents and for in-stream flow:• Recent Endangered Species Act Habitat Conservation Plan requires average annual flow rate of 249 million gallons per day (MGD) to maintain river flow for aquatic life needs (e.g. for salmon, ecosystem services)• City of Seattle claims a 300 MGD water right, with 150 MGD perfected (city has permit, water is being used) and 150 MGD unperfected (city has made claim for water that it does not yet use.)• River flow monitored continuously to assure in-stream flow rates met.• The most critical time for fish are low flow periods in the summer and early fall months when several species of salmon return to the river. Under the Habitat Conservation Plan, the city must guaranteed river flows in the Cedar River, including minimum (base) and supplemental flows to provide beneficial conditions for salmon and steelhead.
References:Data source: Seattle Public Utility http://www.seattle.gov/util/About_SPU/Water_System/Habitat_Conservation_Plan--HCP/index.asp
49
1 Watersheds, the Water Cycle and You
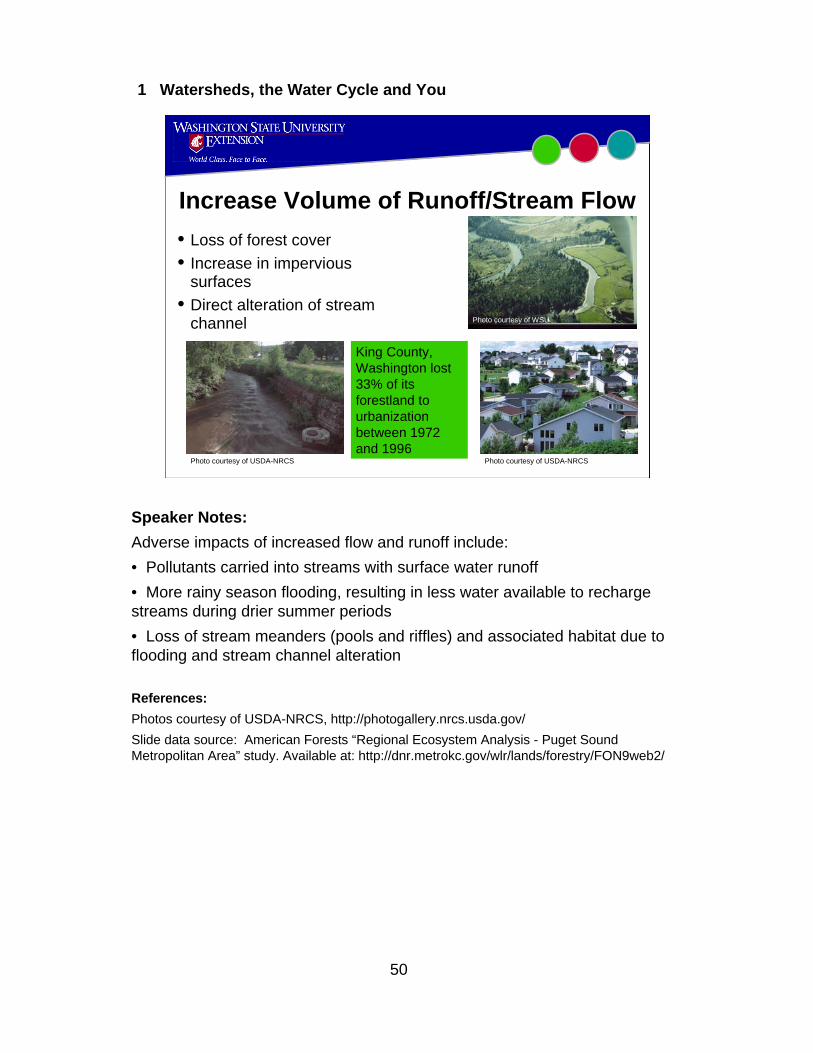
Increase Volume of Runoff/Stream Flow• Loss of forest cover• Increase in impervious
surfaces• Direct alteration of stream
channel
Photo courtesy of USDA-NRCS
King County, Washington lost 33% of its forestland to urbanization between 1972 and 1996
Photo courtesy of WSU
Photo courtesy of USDA-NRCS
Speaker Notes:Adverse impacts of increased flow and runoff include:• Pollutants carried into streams with surface water runoff• More rainy season flooding, resulting in less water available to recharge streams during drier summer periods• Loss of stream meanders (pools and riffles) and associated habitat due to flooding and stream channel alteration
References:Photos courtesy of USDA-NRCS, http://photogallery.nrcs.usda.gov/Slide data source: American Forests “Regional Ecosystem Analysis - Puget Sound Metropolitan Area” study. Available at: http://dnr.metrokc.gov/wlr/lands/forestry/FON9web2/
50
1 Watersheds, the Water Cycle and You

EFFECT OF FOREST LOSS ON FLOOD PEAKS IN CEDAR RIVER SUBBASINS
0%
20%
40%
60%
80%
100%
120%
140%
160%
180%
200%
0% 10% 20% 30% 40% 50% 60% 70% 80% 90% 100%PERCENT OF FOREST LAND CONVERTED BY 1992
PE
RC
EN
T IN
CR
EA
SE
IN F
LOO
D P
EA
K
DORORT
GIN
FAI
MA
CHI
CGRTAYWEPET
ROC
WA
MA
Graphic reproduced from King County DNRP
Speaker Notes:This slide shows how flood peaks increase as watersheds lose forest cover and become urbanized. Graph plots stream watersheds within the greater Cedar River watershed in King County, showing that those with greater forest loss experience greater flooding.
51
1 Watersheds, the Water Cycle and You
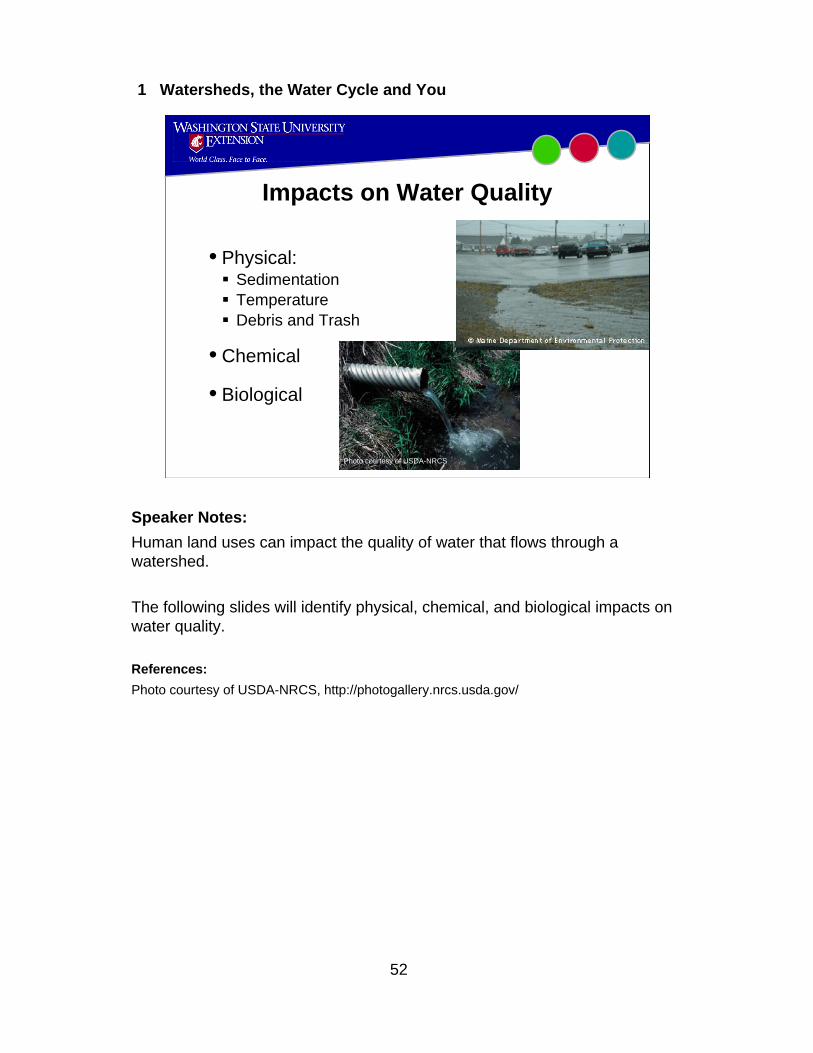
Impacts on Water Quality
• Physical:SedimentationTemperatureDebris and Trash
• Chemical
• Biological
Photo courtesy of USDA-NRCS
Speaker Notes:Human land uses can impact the quality of water that flows through a watershed.
The following slides will identify physical, chemical, and biological impacts on water quality.
References:Photo courtesy of USDA-NRCS, http://photogallery.nrcs.usda.gov/
52
1 Watersheds, the Water Cycle and You

Sedimentation
• Overland flow• Stream bank erosion
Photos courtesy of USDA-NRCS
Salmon require gravels with low concentrations of fine sediments and organic matter for successful spawning and incubation
Speaker Notes:Sediments are carried into a stream, wetland, or shoreline area via surface water runoff and stream bank erosion.• Erosion/deposition is a natural watershed processes, but can be accelerated by human impacts:
• Increases in cleared or developed land• Increases in stream bank erosion during flood events
• Adverse impacts include:• Lower water quality• Smothering of aquatic life, including covering of gravel spawning beds (redds) used by salmon.
References:Photos courtesy of USDA-NRCS, http://photogallery.nrcs.usda.gov/
53
1 Watersheds, the Water Cycle and You
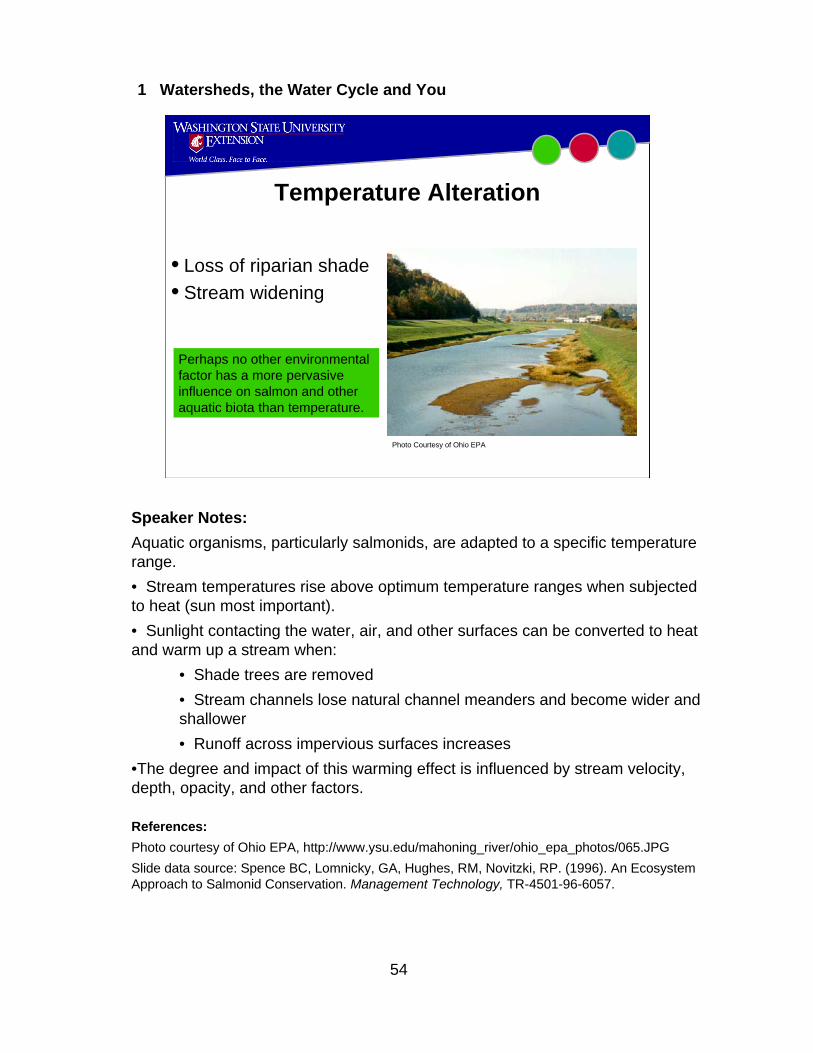
Temperature Alteration
• Loss of riparian shade• Stream widening
Photo Courtesy of Ohio EPA
Perhaps no other environmental factor has a more pervasive influence on salmon and other aquatic biota than temperature.
Speaker Notes: Aquatic organisms, particularly salmonids, are adapted to a specific temperature range.• Stream temperatures rise above optimum temperature ranges when subjected to heat (sun most important).• Sunlight contacting the water, air, and other surfaces can be converted to heat and warm up a stream when:
• Shade trees are removed• Stream channels lose natural channel meanders and become wider and shallower• Runoff across impervious surfaces increases
•The degree and impact of this warming effect is influenced by stream velocity, depth, opacity, and other factors.
References:Photo courtesy of Ohio EPA, http://www.ysu.edu/mahoning_river/ohio_epa_photos/065.JPGSlide data source: Spence BC, Lomnicky, GA, Hughes, RM, Novitzki, RP. (1996). An Ecosystem Approach to Salmonid Conservation. Management Technology, TR-4501-96-6057.
54
1 Watersheds, the Water Cycle and You

Debris and Trash• Illegal dumping• Street litter• Yard waste (lawn
clippings, leaves)
Photo courtesy of Mendocino County
Americans generate 179 million tons of trash per year, including 32 million tons of yard trimmings.
Speaker Notes:At a minimum, such dumping is unsightly.Excessive dumping may:• Fill wetland areas or introduce pollutants• Include plastic trash such as six-pack straps that can injure and kill wildlife• Include lawn materials such as leaves and grass clippings that can add excessive nutrients to a water body or introduce lawn chemicals
Trash cleanup is expensive, and requires the hard work of volunteers.
References:Photo courtesy of Mendocino County, California, Online Recycling Guide at http://www.mendorecycle.org/dumping.htm.Slide data source: U.S. Environmental Protection Agency web page: http://www.epa.gov/epaoswer/non-hw/reduce/catbook/index.htm
55
1 Watersheds, the Water Cycle and You

Chemical• Herbicides
• Pesticides
• Fertilizers
• Industrial/Household
• Automotive In King County, Washington, 23 pesticides were detected in water from urban streams during rainstorms, and the concentrations of 5 of these pesticides exceeded limits set to protect aquatic life.
Photo courtesy of Water Quality Consortium
Additional Information:A primary concern is the toxicity of these pollutants. Water quality standards have been established for most common pollutants. The standards are set at pollutant concentrations that have not been found to be toxic to humans and aquatic organisms. Toxicity can refer to lethal effects (organisms are killed by the pollution concentration) or effects that impair basic life functions (e.g. cause cancer, impact reproduction, impair liver, kidney, lung function).
References:Photo courtesy of Water Quality Consortium http://www.psat.wa.gov/Programs/Pie_Ed/Water_Ed_Materials.htmSlide data source: Pesticides Detected in Urban Streams During Rainstorms and Relations to Retail Sales of Pesticides in King County, Washington. U.S. Geological Survey Fact Sheet 097-99, April 1999.
56
1 Watersheds, the Water Cycle and You
Biological
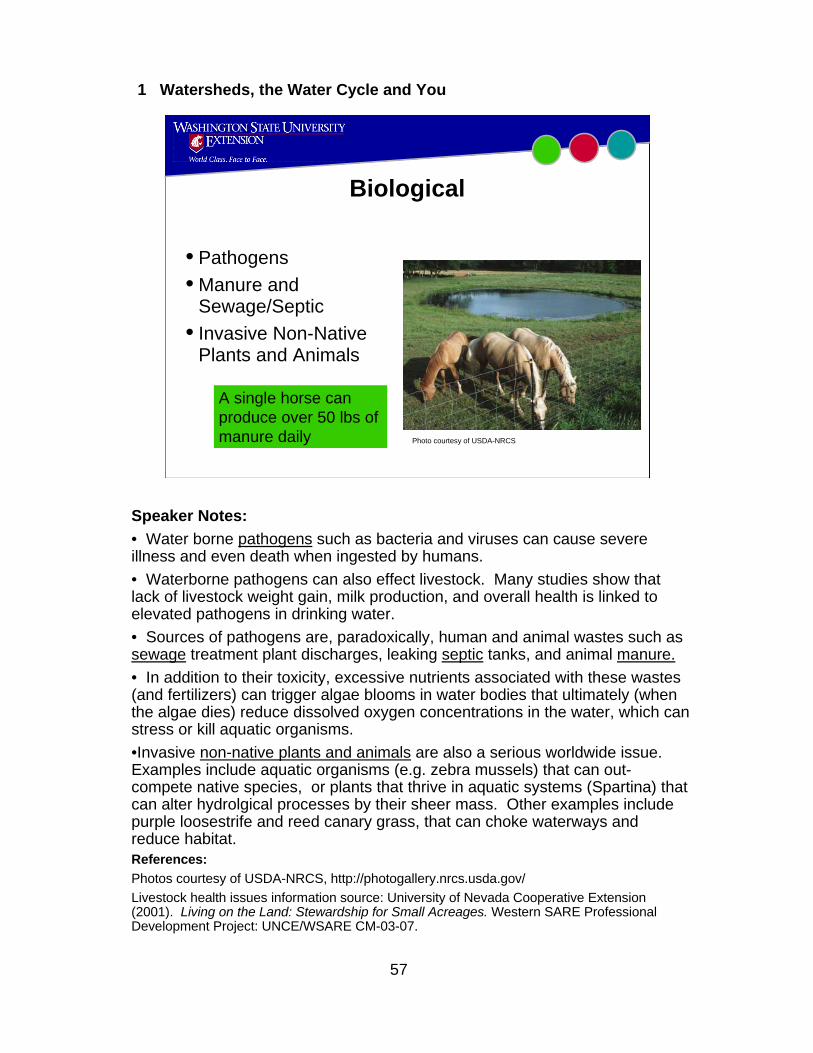
• Pathogens• Manure and
Sewage/Septic• Invasive Non-Native
Plants and Animals
A single horse can produce over 50 lbs of manure daily Photo courtesy of USDA-NRCS
Speaker Notes:• Water borne pathogens such as bacteria and viruses can cause severe illness and even death when ingested by humans.• Waterborne pathogens can also effect livestock. Many studies show that lack of livestock weight gain, milk production, and overall health is linked to elevated pathogens in drinking water.• Sources of pathogens are, paradoxically, human and animal wastes such assewage treatment plant discharges, leaking septic tanks, and animal manure.• In addition to their toxicity, excessive nutrients associated with these wastes (and fertilizers) can trigger algae blooms in water bodies that ultimately (when the algae dies) reduce dissolved oxygen concentrations in the water, which can stress or kill aquatic organisms.•Invasive non-native plants and animals are also a serious worldwide issue. Examples include aquatic organisms (e.g. zebra mussels) that can out-compete native species, or plants that thrive in aquatic systems (Spartina) that can alter hydrolgical processes by their sheer mass. Other examples include purple loosestrife and reed canary grass, that can choke waterways and reduce habitat.References:Photos courtesy of USDA-NRCS, http://photogallery.nrcs.usda.gov/Livestock health issues information source: University of Nevada Cooperative Extension (2001). Living on the Land: Stewardship for Small Acreages. Western SARE Professional Development Project: UNCE/WSARE CM-03-07.
57
1 Watersheds, the Water Cycle and You

Sources of Pollutants• Nonpoint source pollution:
Indirect discharge from multiple sources
Is America’s largest unregulated water quality problem and is estimated to represent more than 50 percent of the nation's remaining water pollution problems (Living on the Land, 2001)
• Point source pollution:Direct discharges from pipes and treatment plants
Photos courtesy of USDA-NRCS
Speaker Notes:Non-Point Sources: Indirect discharges of pollutants into a waterway from multiple sources.• Pollutants include: fertilizers, pesticides, automotive (oil/grease/anti-freeze), and soils (construction sites/farm fields) that are widely dispersed across the landscape.• Pollutants are picked up in storm water runoff as it flows across the land and enters surface water bodies.• Difficult to regulate; difficult to measure where pollution is coming from and at what concentrations and loadings (total amount of pollutant released over time).
Point Sources: Direct discharges of pollutants into a waterway from a single point such as a pipe.• Industrial or municipal (e.g. waste water treatment plant) sources.• Are regulated (e.g. a permit is required to discharge pollutants at concentrations below water quality standards).
References:Photos courtesy of USDA-NRCS, http://photogallery.nrcs.usda.gov/Data source: University of Nevada Cooperative Extension (2001). Living on the Land: Stewardship for Small Acreages. Western SARE Professional Development Project: UNCE/WSARE CM-03-07.
58
1 Watersheds, the Water Cycle and You
What We Can Do To ReduceWatershed Degradation
• Civic Participation
• Government ApproachesRegulatoryNon-Regulatory
• Prevention and Conservation
• Restoration
Speaker Notes:Individuals and communities have sought to reduce adverse human impacts on watersheds using a variety of practices.• Brief overviews of each practice are provided in the remaining Module 1 slides.• Practices relevant to specific human land uses are detailed further in Modules 2 through 6.
59
1 Watersheds, the Water Cycle and You
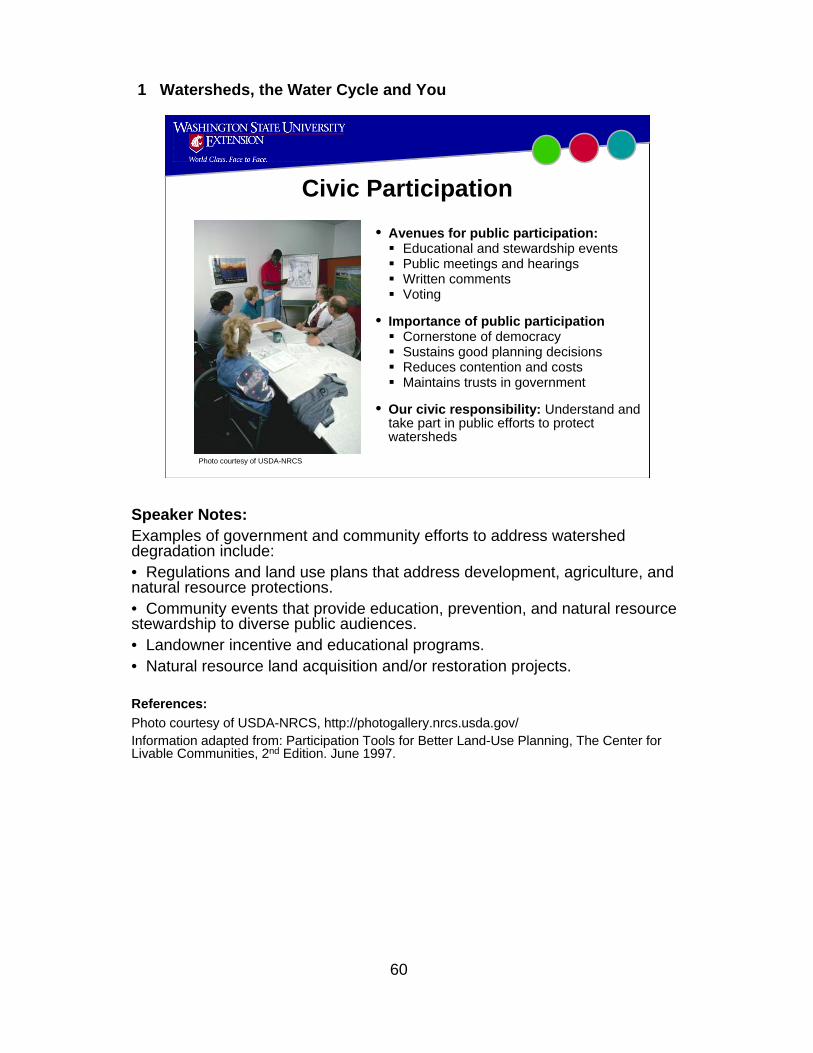
Civic Participation• Avenues for public participation:
Educational and stewardship eventsPublic meetings and hearingsWritten commentsVoting
• Importance of public participationCornerstone of democracySustains good planning decisionsReduces contention and costsMaintains trusts in government
• Our civic responsibility: Understand and take part in public efforts to protect watersheds
Photo courtesy of USDA-NRCS
Speaker Notes:Examples of government and community efforts to address watershed degradation include:• Regulations and land use plans that address development, agriculture, and natural resource protections.• Community events that provide education, prevention, and natural resource stewardship to diverse public audiences.• Landowner incentive and educational programs.• Natural resource land acquisition and/or restoration projects.
References:Photo courtesy of USDA-NRCS, http://photogallery.nrcs.usda.gov/Information adapted from: Participation Tools for Better Land-Use Planning, The Center for Livable Communities, 2nd Edition. June 1997.
60
1 Watersheds, the Water Cycle and You

GovernmentRegulatory Approaches
• Government laws and regulations:Federal: activities and resources on federal landState: activities and resources on state/private landLocal: land use activities such as building
• May apply to:Water uses and dischargesProtection of wetlands and shorelinesProtection of fish and wildlifeDevelopment of land
• What we can do: Comment during rulemaking processVote for legislators that support your interests
• To be effective…laws must be enforced
Photo courtesy of the DC SHPO
Speaker Notes:Federal, state, and local water laws originate from:• Federal or state constitutions• Court decisions (common law)• Government legislation (source of most water laws)
Laws may set technology or “best available science” requirements, such as:• Water treatment facilities that can remove prescribed level of chemical or biological pollutants.• Water retention facilities for new development that prevent and/or treat rapid runoff during precipitation events.• Livestock management ordinances that set restrictions on numbers of animals per acre to prevent water quality impacts.
Additional Information:See the Appendix section for a Water Law Resource List.
References:Photo Courtesy of DC SHPO at http://www.cr.nps.gov/nr/travel/wash/dc76.htm
61
1 Watersheds, the Water Cycle and You

GovernmentNon-Regulatory Approaches
• Best management practices (BMPs)
• Tax incentives• Direct monetary
compensation• Technical assistance• Homeowner education• What we can do: educate
ourselves and others about watershed best practices and incentive/assistance programs
Photo courtesy of USDA-NRCS
Speaker Notes:Best management practices (BMPs): Recommended methods for performing resource management tasks that seek to lesson adverse impacts onwatersheds.• Developed for farming, forestry, and land development activities.
Tax incentives for conserving open space and resource lands.Direct monetary compensation for conserving open space such as a conservation easement purchases or land rentals.Technical assistance on the implementation of BMPs and other practices, such as Conservation District personnel helping small farmers develop farm plans.Other educational programs for homeowners and general public, such as brochures and workshops on non-toxic alternatives or how to recycle materials (with goal of going beyond knowledge transfer to actual behavioral changes to protect water quality and quantity.
References:Photo courtesy of USDA-NRCS, http://photogallery.nrcs.usda.gov/
62
1 Watersheds, the Water Cycle and You

Prevention and Conservation
• Address watershed impacts before they occur
• What we can do:Use non-toxic alternatives
Conserve water in and outside of the house
Support public and private efforts to protect water quality and natural lands.
Photos courtesy of Cascade Land Conservancy
Speaker Notes:Prevention and conservation practices can apply to both water resources and the land itself. Many of these practices must be implemented on a broad scale by the public at large (us) to be most effective.
Prevention examples:• Preventing waste by using less- or non-toxic alternatives, such as lower or non-toxic pesticides in the garden.• Maintaining vehicles to prevent oil and anti-freeze leaks, and tire wear.• Maintaining native vegetation along streamside property to reduce runoff of sediments and pollutants into stream, and provide a cool habitat for birds, fish and other aquatic life.
Conservation examples:• Maintaining a lawn that does not require heavy irrigation during summer months.• Installing water conservation devices to reduce water use, such as low flow faucets in the home or drip irrigation on farms.• Preserving undeveloped lands acquired via a conservation purchase or easement may protect water quality, wildlife, and natural lands. Such acquisition is often supported by public tax dollars or private contributions to land trust organizations.
63
1 Watersheds, the Water Cycle and You

Restoration• Restore degraded watershed
features:Plant native vegetationReplace road culvertsRebuild streambeds
• Supported by:Non-profit and Community groupsConservation DistrictsGovernment agencies
• What you can do:Support agencies and groupsVolunteer
• Projects funded on both public and private land
Photo courtesy of WSU
Speaker Notes:There are many ongoing efforts in the Pacific Northwest to restore degraded watershed features:• Native vegetation is being planted on stream banks• Road culverts blocking fish migration are being replaced• Streambeds are being “rebuilt” by restoring channel meanders and placing large woody debris and boulders in and along stream channels
Restoration projects often require community volunteers to assist with project organization and direct labor (e.g. removing invasive plants, planting native plants.• Restoration projects can be expensive, time consuming, and small scale.• Important educational goal of restoration is to create a better understanding about the connections between small scale restoration projects and overall watershed management issues.
64
1 Watersheds, the Water Cycle and You
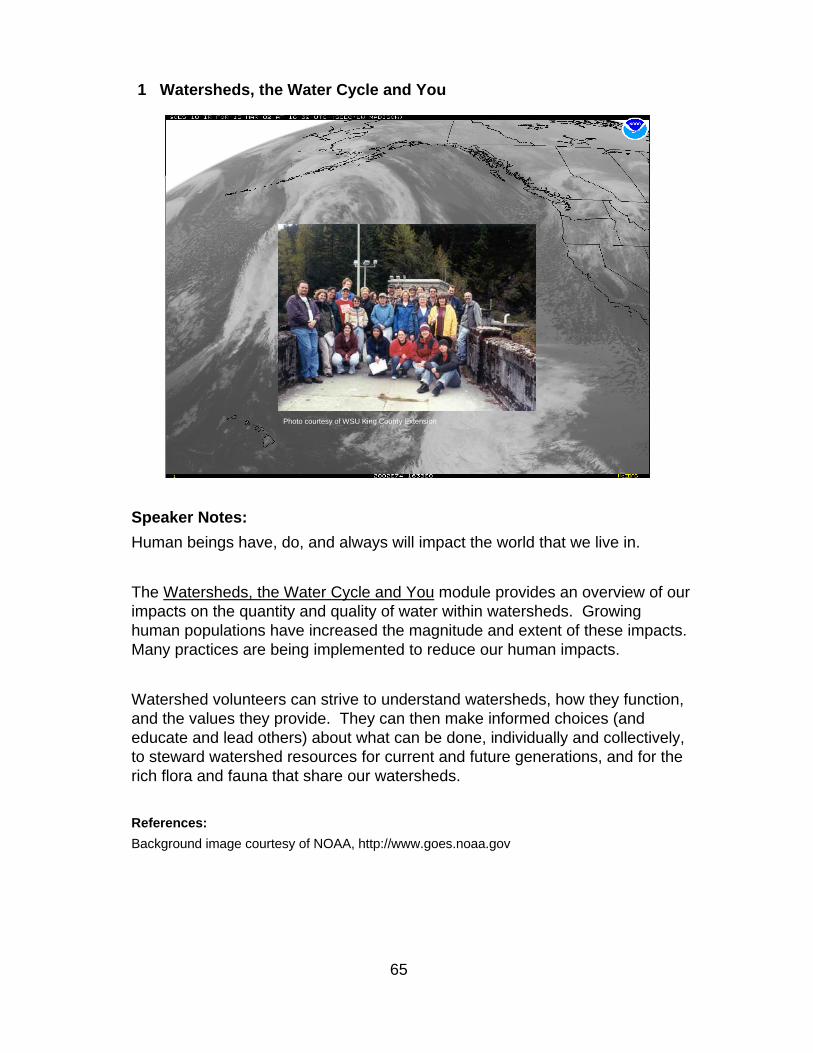
Photo courtesy of WSU King County Extension
Speaker Notes:Human beings have, do, and always will impact the world that we live in.
The Watersheds, the Water Cycle and You module provides an overview of our impacts on the quantity and quality of water within watersheds. Growing human populations have increased the magnitude and extent of these impacts. Many practices are being implemented to reduce our human impacts.
Watershed volunteers can strive to understand watersheds, how they function, and the values they provide. They can then make informed choices (and educate and lead others) about what can be done, individually and collectively, to steward watershed resources for current and future generations, and for the rich flora and fauna that share our watersheds.
References:Background image courtesy of NOAA, http://www.goes.noaa.gov
65
1 Watersheds, the Water Cycle and You
Questions?
References:Photo courtesy of WSU King County Extension
66
1 Watersheds, the Water Cycle and You

1 Watersheds, the Water Cycle and You
Watersheds, the Water Cycle and You
Handouts Pages 67 – 70
67

1 Watersheds, the Water Cycle and You
68

The Water Cycle
From Dunne and Leopold, 1978 Water in Environmental Planning
69
1 Watersheds, the Water Cycle and You

70

1 Watersheds, the Water Cycle and You
Watersheds, the Water Cycle and You
Classroom Activities Pages 71 – 86
71

1 Watersheds, the Water Cycle and You
72

1 Watersheds, the Water Cycle and You
Activity 1: All the Water on Earth Objective: Students will visualize how little of the earth’s water is freshwater, and how little of this freshwater is directly available for human consumption. Materials needed: 1. Two gallons of water (e.g. two 1-gallon milk jugs filled with water) 2. Cup measure 3. Measuring spoons 4. Water dropper 5. Ice cubes Directions: Start with two gallons of water to represent all the water on earth, both fresh and salt water. Use the following numbers to illustrate relative amounts of fresh water by category: All fresh water = 7/8 cup + 6 drops. This includes:
• Icecaps & glaciers = 11 tablespoons (about 3 ice cubes, currently melting) • Ground and soil water = 3 tablespoons + ½ teaspoon • Lakes = 8 drops! • Atmospheric water = 1 drop • Rivers and streams = < 1 drop
References: Adapted from University of Nevada Cooperative Extension (2001). Living on the Land: Stewardship for Small Acreages. Western SARE Professional Development Project: UNCE/WSARE CM-03-07.
73

1 Watersheds, the Water Cycle and You
Activity 2: Build a watershed model Objective: Students will understand what a watershed is by constructing a simple three-dimensional watershed model. Materials:
1. Sheets of 8x11 white paper 2. Tape 3. Non-permanent, felt tip pens 4. Spray bottles filled with tap water 5. Red food coloring (optional)
Steps to Follow: This activity can be completed by individuals or by small groups of 2 to 3 students. • Each group starts with two pieces of paper. • Crumble one sheet in ball, then roughly un-crumble sheet and place on
second sheet. • Arrange first sheet to create landscape features such as hills, mountains, and
plains, and then tape in place on second sheet. • Mark “watershed dividing lines” with felt pen. Ask students to think about
where rainfall would flow on their models. • Spray models with water and examine flow patterns. Where do streams and
lakes form? What are the watershed boundaries, and the common watershed outlets?
As an optional exercise, have students place small red food coloring drop on map, and re-spray. Note that dye may represent pollution source (e.g. someone dumped unused pesticides). Where does the red dye migrate? At end of exercise, have groups come together to show their models and discuss their findings.
74

1 Watersheds, the Water Cycle and You
Activity 3: Look at watershed maps Objective: Students will examine 2- and 3-dimensional maps to further understand what a watershed is and how to locate one on a map. Choose one or more of Activities A through D below, which look at watershed maps on a state, regional, county, and local scale, respectfully. A. Obtain a map of the major watersheds in your state. For example, see attached Washington State Department of Ecology map (Map A) of the 62 major watersheds in the state. Note that the 1998 Watershed Planning Act requires local governments to develop watershed plans for each of these 62 watersheds, for the purpose of managing water resources and protecting existing water rights. B. Show a 3-dimensional map of your region. For example, use a Seattle/Puget Sound Area 3-dimensional map (or instructor may obtain a 3-dimensional map of any watershed, or construct such a map following Activity 2 instructions; map not included). Note that the mapmakers raised the elevation lines that you see on a 2-dimensional map to visually portray landscape (hills, mountains, etc.). Spend some time delineating watersheds. Note watershed divides, and trace a water body’s watershed area (e.g. from headwater streams to discharge point in river, stream, lake, or marine waters.) C. Show a watershed map of your county, for example, King or Pierce County. Describe the general hydrology of the area. In the King County example (Map C), the Cascade Mountains have resulted in a series of west-side watersheds that, in general, run east to west. These watersheds are defined by the creeks and rivers that drop out of the Cascade Mountains and combine to form larger rivers such as the Green, Cedar, and Snoqualmie. These rivers meander across the flatter lands in western King County and drain into Puget Sound. We are located in the larger Puget Sound watershed, and depending on where we live in King County, we live in one of these smaller river basin watersheds. D. Present a smaller scale topographical map that shows all or a portion of one watershed. Describe what a USGS topographical map is. Note that these maps show ground features like rivers, towns, and roads. There are also lines drawn on these maps that correspond to elevation above sea level. Each line represents a specific elevation. Provide an informal explanation about how the swirling topographical lines on the map can be read to make out landscape features like mountain tops, valleys, and watershed boundaries. Then ask students to trace the watershed boundary, and describe where water will flow on either side of the boundary.
Example: See map showing a portion of the Cedar River Watershed and the watersheds just to the north, east, and south (Snoqualmie, Yakima, and Green). This watershed is important to Seattle residents because it
75

1 Watersheds, the Water Cycle and You
provides much of the region’s water supply. Provide copies of topo map 1 and topo map 2. • Describe or have students describe the watershed boundaries. • Topo map 1 shows no watershed boundaries; have students find and
trace the Cedar River watershed boundaries.
• Topo map 2 has most of the watershed boundaries drawn; have students complete the boundary. Note that rain and snow falling on either side of these watershed divides will follow completely different paths.
• Inside the watershed: Starting with the upper Cedar River, point out
Chester Morse Lake and follow the river upstream. Note how it breaks up into smaller tributaries, like the roots of a tree.
• Looking north: Look north at those steep topographical lines that rise
to mountain peaks (MT Washington, MT Kent, and MT Gardner.) This ridge of mountains and hills to the north forms the northern boundary of the watershed. Trace out the small tributaries that flow south to the Cedar, and others on the far side of those mountains that flow north to the Snoqualmie.
• Looking east: Look east to the Cascade Crest (dividing line between
King and Kittitas County). These high mountains create a watershed boundary separating western Washington rivers from the east-side rivers that flow into the Columbia River. Eastward flowing water will fill up the headwater streams that are starting their journey down into the Yakima River, to the Columbia River and the Pacific Ocean.
• Looking south: Looking south, you can see headwater streams that
flow south into the Green River, which eventually drains into the Duwamish River and Elliot Bay adjacent to Seattle.
• Looking west: On the west side, you can see the north and south
forks of the Cedar River. This Cedar River water will flow into Lake Washington, Lake Union, through the Ballard Locks, and out into the Puget Sound in Ballard. Or, it may flow through pipes into residential homes, to be consumed, or bathed in, or used to water lawns.
76

1 Watersheds, the Water Cycle and You
Activity 4: Which watershed to you live in? Objective: Students will discuss the watersheds that they live in and local issues impacting water quality and quantity. Information for Instructor: Facilitate a discussion on the "Which watershed do you live in?" homework assignment, asking students to describe their watersheds, the issues impacting their watersheds, and the source/destination of their household water. If the homework assignment has not been assigned, the instructor should be prepared to initiate class discussion by identifying some of the primary issues that impact local watersheds (e.g., primary water quality and quantity issues, major sources of pollution, primary sources of water supply.)
77
1 Watersheds, the Water Cycle and You
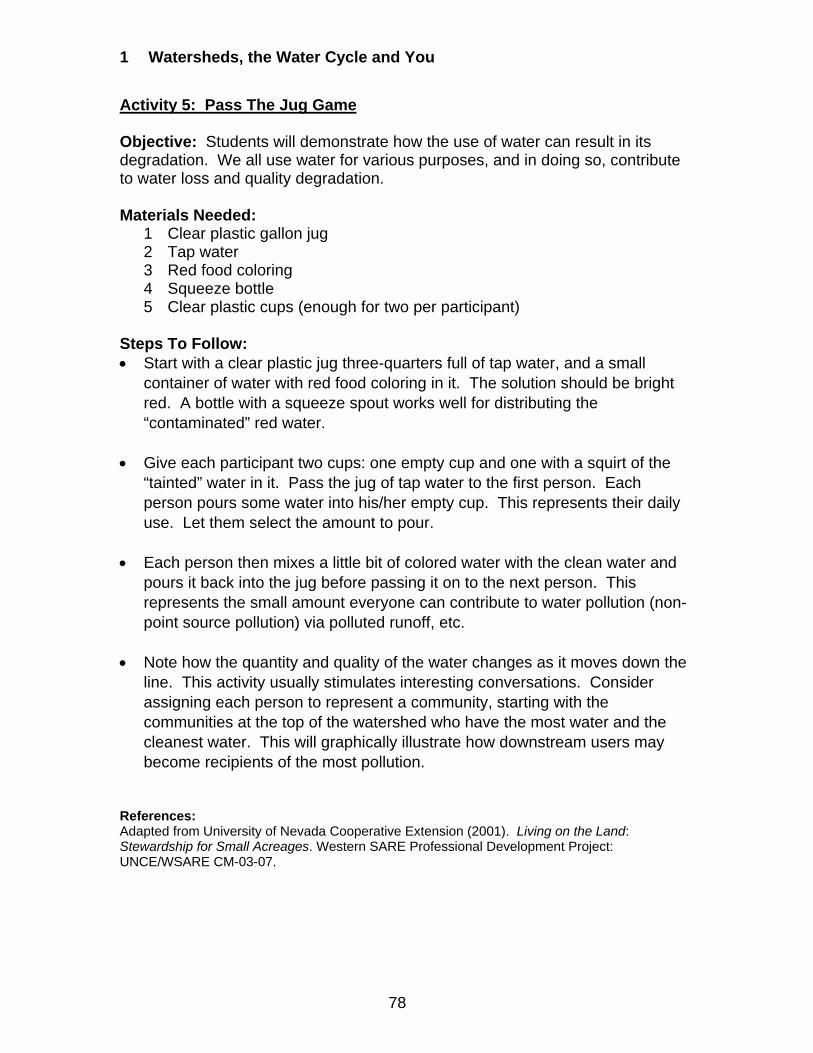
Activity 5: Pass The Jug Game Objective: Students will demonstrate how the use of water can result in its degradation. We all use water for various purposes, and in doing so, contribute to water loss and quality degradation. Materials Needed:
1 Clear plastic gallon jug 2 Tap water 3 Red food coloring 4 Squeeze bottle 5 Clear plastic cups (enough for two per participant)
Steps To Follow: • Start with a clear plastic jug three-quarters full of tap water, and a small
container of water with red food coloring in it. The solution should be bright red. A bottle with a squeeze spout works well for distributing the “contaminated” red water.
• Give each participant two cups: one empty cup and one with a squirt of the
“tainted” water in it. Pass the jug of tap water to the first person. Each person pours some water into his/her empty cup. This represents their daily use. Let them select the amount to pour.
• Each person then mixes a little bit of colored water with the clean water and
pours it back into the jug before passing it on to the next person. This represents the small amount everyone can contribute to water pollution (non-point source pollution) via polluted runoff, etc.
• Note how the quantity and quality of the water changes as it moves down the
line. This activity usually stimulates interesting conversations. Consider assigning each person to represent a community, starting with the communities at the top of the watershed who have the most water and the cleanest water. This will graphically illustrate how downstream users may become recipients of the most pollution.
References: Adapted from University of Nevada Cooperative Extension (2001). Living on the Land: Stewardship for Small Acreages. Western SARE Professional Development Project: UNCE/WSARE CM-03-07.
78

62
611 60
494 482 59523
5847
19
20
56 51
50 5518
577
17
4546 54
5342
15 84316 4421
56
34
939
2214
41
4010
1213
3811
2324 36
3526 3337
25 32
3027 3129
28
Water Resource Inventory Areas
GIS Technical Services12/15/04wria-bw
1. Nooksack 2. San Juan 3. Lower Skagit/Samish 4. Upper Skagit 5. Stillaguamish 6. Island 7. Snohomish 8. Cedar/Sammamish 9. Duwamish/Green10. Puyallup/White11. Nisqually12. Chambers/Clover13. Deschutes14. Kennedy/Goldsborough15. Kitsap16. Skokomish/Dosewallips17. Quilcene/Snow18. Elwha/Dungeness19. Lyre/Hoko20. Soleduc21. Queets/Quinault
22. Lower Chehalis23. Upper Chehalis24. Willapa25. Grays/Elochoman26. Cowlitz27. Lewis28. Salmon/Washougal29. Wind/White Salmon30. Klickitat31. Rock/Glade32. Walla Walla33. Lower Snake34. Palouse35. Middle Snake36. Esquatzel Coulee37. Lower Yakima38. Naches39. Upper Yakima40. Alkaki/Squilchuck41. Lower Crab42. Grand Coulee
43. Upper Crab/Wilson44. Moses Coulee45. Wenatchee46. Entiat47. Chelan48. Methow49. Okanogan50. Foster51. Nespelem52. Sanpoil53. Lower Lake Roosevelt54. Lower Spokane55. Little Spokane56. Hangman57. Middle Spokane58. Middle Lake Roosevelt59. Colville60. Kettle61. Upper Lake Roosevelt62. Pend Oreille
0 20 40
Miles
Scale 1:2,600,000

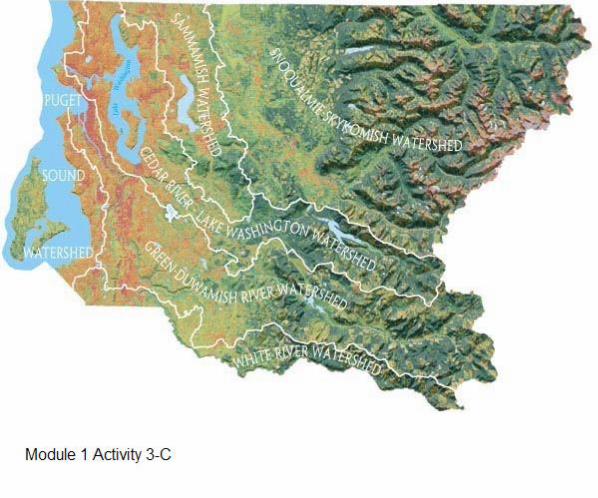


1 Watersheds, the Water Cycle and You
Watersheds, the Water Cycle and You
Homework Assignments
Pages 87 – 90
87

1 Watersheds, the Water Cycle and You
88

1 Watersheds, the Water Cycle and You
Homework Assignment: What Watershed Do You Live In? Directions: Write a one-page report that addresses the following: Name and describe the watershed you live in: • Where it drains, • What its main resource issues are, and • How water gets from inside and outside your house to its ultimate destination. Information for Instructor: This assignment may be combined with a class exercise. The instructor facilitates a discussion regarding the assignment, asking trainees to describe their watersheds, the issues impacting their watershed, and the source/destination of their household water.
89

1 Watersheds, the Water Cycle and You
90

1 Watersheds, the Water Cycle and You
Watersheds, the Water Cycle and You
Optional Activities
Pages 91 – 102
91

1 Watersheds, the Water Cycle and You
92

Watersheds, the Water-Cycle and You
• Watersheds and the Water-Cycle• Natural Watershed Features• Watershed Degradation
Human Land UsesImpacts on Water Quantity and QualityWhat We Can Do To Reduce Impacts
NOTE: This is Optional Activity 1, Summary of Land Use Trends inWest-side Pacific Northwest Watersheds. Instructors outside of King County can adapt this presentation to reflect local conditions.• These slides can be inserted after slide #46 of the Watersheds, the Water Cycle and You presentation.
Speaker Notes:These slides provide a summary of human land uses that can impact watersheds, focusing on the west-side Pacific Northwest region (King County, Washington).
93
1 Watersheds, the Water Cycle and You

Watersheds
Graphic courtesy of UNCE
Speaker Notes:Revisit this depiction of a watershed, noting that in a very general sense this slide represents the west side of the Cascade mountains-to-sound landscape. Note that the major human land uses that we can consider include:• Forestry in the Cascade foothills• Agriculture in the river valleys that drain these mountains• Development across the landscape, focused on the Interstate 5 corridor and east-side cities, towns, and suburbs• General household practices that occur both inside and outside of our homes• Recreation that occurs across the landscape from hiking in the foothills to boating in the Puget Sound.
References:Graphic courtesy of University of Nevada Cooperative Extension (2001). Living on the Land: Stewardship for Small Acreages. Western SARE Professional Development Project: UNCE/WSARE CM-03-07.
94
1 Watersheds, the Water Cycle and You
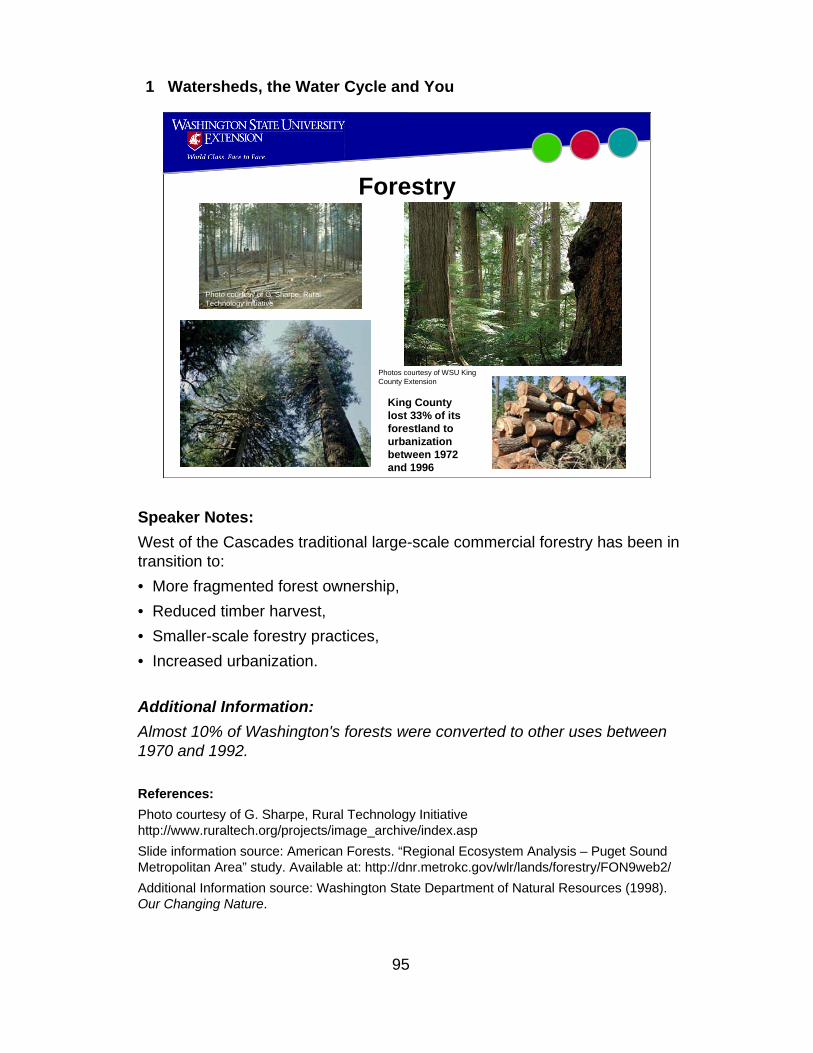
Forestry
Photos courtesy of WSU King County Extension
Photo courtesy of G. Sharpe, Rural Technology Initiative
King County lost 33% of its forestland to urbanization between 1972 and 1996
Speaker Notes:West of the Cascades traditional large-scale commercial forestry has been in transition to:• More fragmented forest ownership,• Reduced timber harvest,• Smaller-scale forestry practices,• Increased urbanization.
Additional Information:Almost 10% of Washington's forests were converted to other uses between 1970 and 1992.
References:Photo courtesy of G. Sharpe, Rural Technology Initiative http://www.ruraltech.org/projects/image_archive/index.aspSlide information source: American Forests. “Regional Ecosystem Analysis – Puget Sound Metropolitan Area” study. Available at: http://dnr.metrokc.gov/wlr/lands/forestry/FON9web2/Additional Information source: Washington State Department of Natural Resources (1998). Our Changing Nature.
95
1 Watersheds, the Water Cycle and You
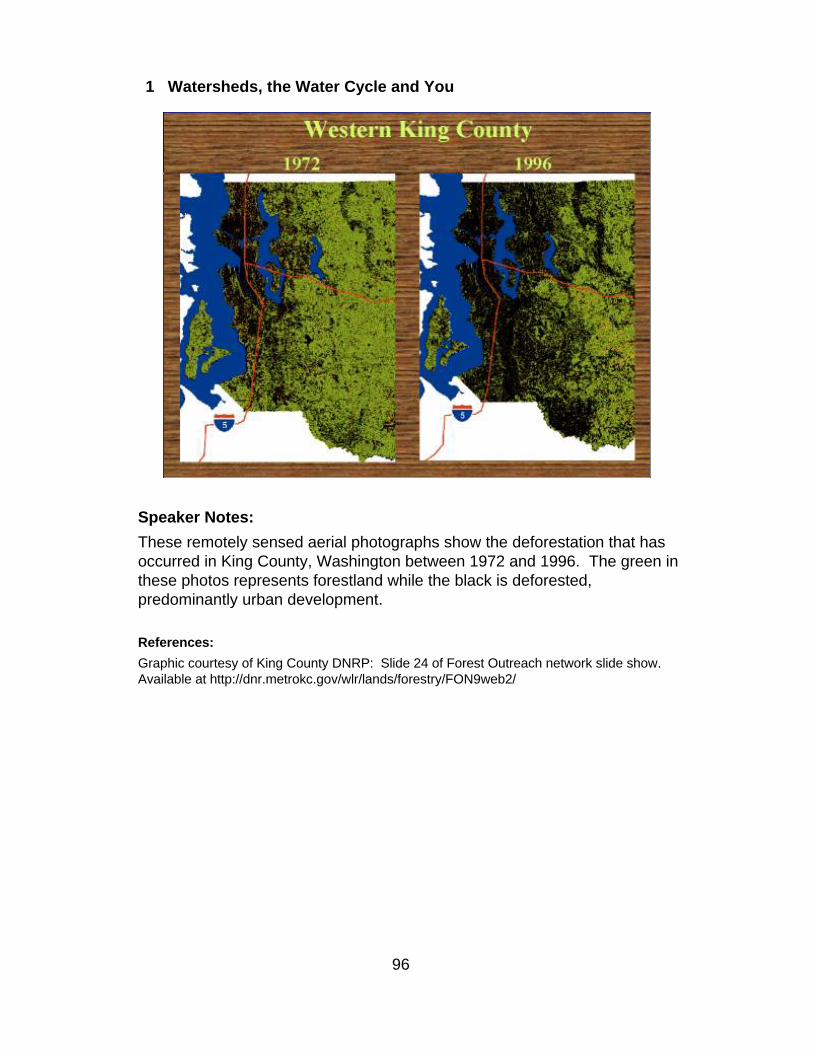
Speaker Notes:These remotely sensed aerial photographs show the deforestation that has occurred in King County, Washington between 1972 and 1996. The green in these photos represents forestland while the black is deforested, predominantly urban development.
References:Graphic courtesy of King County DNRP: Slide 24 of Forest Outreach network slide show. Available at http://dnr.metrokc.gov/wlr/lands/forestry/FON9web2/
96
1 Watersheds, the Water Cycle and You
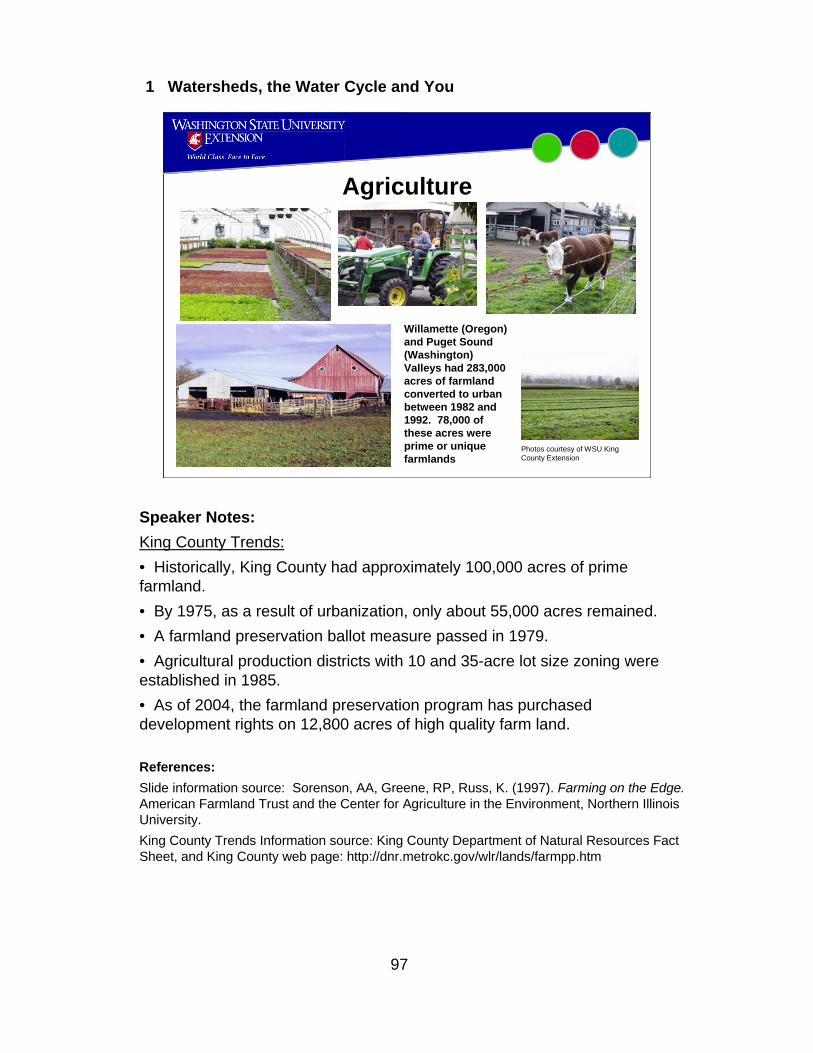
Agriculture
Willamette (Oregon) and Puget Sound (Washington) Valleys had 283,000 acres of farmland converted to urban between 1982 and 1992. 78,000 of these acres were prime or unique farmlands
Photos courtesy of WSU King County Extension
Speaker Notes:King County Trends:• Historically, King County had approximately 100,000 acres of prime farmland.• By 1975, as a result of urbanization, only about 55,000 acres remained.• A farmland preservation ballot measure passed in 1979.• Agricultural production districts with 10 and 35-acre lot size zoning were established in 1985.• As of 2004, the farmland preservation program has purchased development rights on 12,800 acres of high quality farm land.
References:Slide information source: Sorenson, AA, Greene, RP, Russ, K. (1997). Farming on the Edge.American Farmland Trust and the Center for Agriculture in the Environment, Northern Illinois University.King County Trends Information source: King County Department of Natural Resources Fact Sheet, and King County web page: http://dnr.metrokc.gov/wlr/lands/farmpp.htm
97
1 Watersheds, the Water Cycle and You

Land Development
Photos courtesy of USDA-NRCS
King County’s population up 40 percent between 1980 and 1998, from 1.2 to 1.7 million.
Speaker Notes:2000 Census shows that King County's population is 1,737,034, a 15% increase from 1,507,300 in 1990.• Washington State, with 5,894,100 persons, grew 21% during the 1990s, twice as fast as the nation.• Seattle, the state's largest city, had a population of 563,374, up 9% from 1990.• The 38 cities outside Seattle now have more than 820,000 persons - nearly half the County's population.•King County is the 13th most populated county in the country. The County’s population increased by over half a million between 1980 and 1998 - over a 40% increase in just 18 years.The result is an increase in land development and urbanization, as reflected in the loss of forest and agricultural lands shown in previous slides.
References:Photos courtesy of USDA-NRCS http://photogallery.nrcs.usda.gov/Data source: http://www.metrokc.gov/exec/news/2001/0323011.htmData source: Slide 1 of Forest Outreach Network slideshow, Available at: http://dnr.metrokc.gov/wlr/lands/forestry/FON9web2/
98
1 Watersheds, the Water Cycle and You

Photos courtesy of King County DNRP
Creation of Impervious Surfaces
Near Renton, King County
Speaker Notes: Impervious surfaces such as roads, roofs, and parking lots increase as land is developed and urbanized.
99
1 Watersheds, the Water Cycle and You
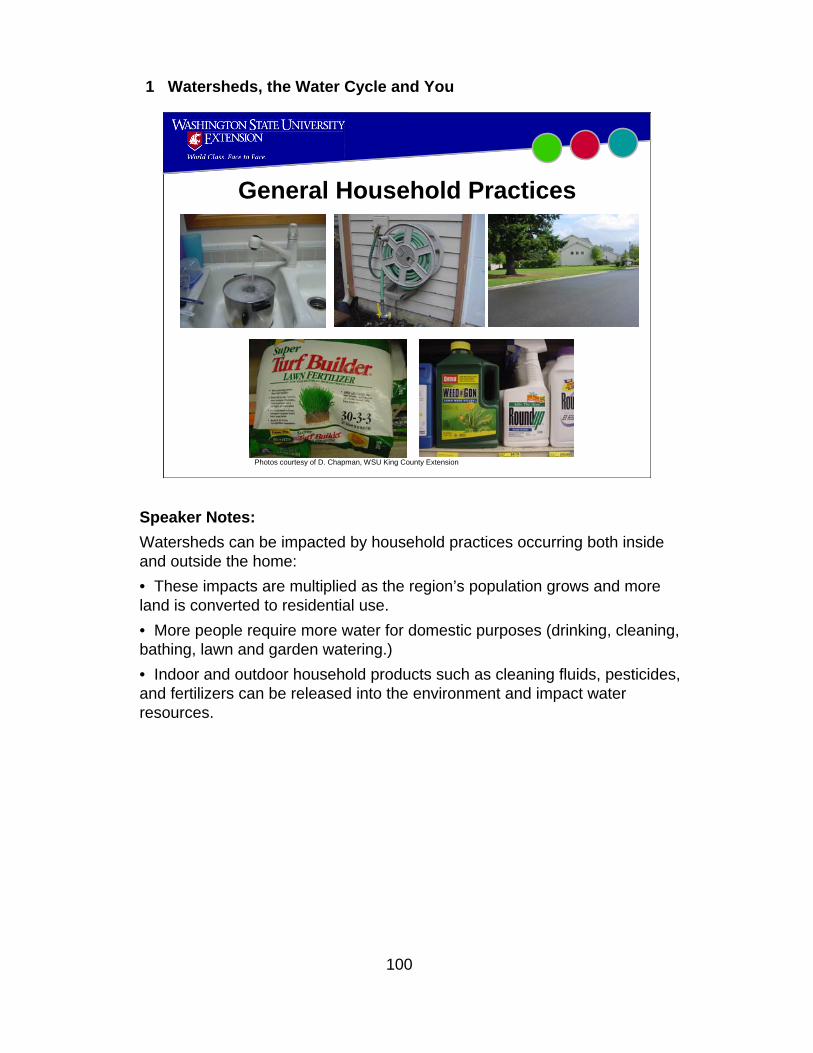
General Household Practices
Photos courtesy of D. Chapman, WSU King County Extension
Speaker Notes:Watersheds can be impacted by household practices occurring both inside and outside the home:• These impacts are multiplied as the region’s population grows and more land is converted to residential use.• More people require more water for domestic purposes (drinking, cleaning, bathing, lawn and garden watering.)• Indoor and outdoor household products such as cleaning fluids, pesticides, and fertilizers can be released into the environment and impact water resources.
100
1 Watersheds, the Water Cycle and You

Recreation
Photo courtesy of USDA-NRCS
Photo courtesy of WA State ParksPhoto courtesy of WA State ParksPhoto courtesy of WA State Parks
Photo courtesy of USDA-USFS
Photo courtesy of USDA-USFS
Speaker Notes:Many high quality recreational opportunities exist on the west side of Cascade, from skiing, climbing and hiking in the Cascade Mountains, to camping and boating along the shores of the Puget Sound.• Golf courses, while they offer open space and storm water infiltration services, can also detrimentally impact water quality and quantity. They can require significant volumes of irrigation water, and may use pesticides and herbicides that can runoff into adjacent surface water bodies.• Impacts on watershed resources are increasing as growing numbers of people seek recreational opportunities in the region.• Examples of recreational impacts include:
• Damage to riparian plants by trampling and soil compaction.• Introduction of noxious weeds from boot soles, tire treads, boat propellers, and trailers.• Disposal of trash and other camping wastes into rivers and woodlands.
References:Photos courtesy of USDA-USFS http://www.fs.fed.us/r6/mbs/recreation/, USDA NRCS http://photogallery.nrcs.usda.gov/, and Washington State Parks.Information source: Taking care of Streams in Washington, Oregon, Idaho, and Alaska, A Recreationist’s Guide to Riparian Areas, October 2002. A Pacific Northwest Extension Publication. See http://wawater.wsu.edu/ to download or order copies.
101
1 Watersheds, the Water Cycle and You

Questions?
102
1 Watersheds, the Water Cycle and You

1 Watersheds, the Water Cycle and You
Resource List: Watersheds, the Water Cycle and You Watersheds and the Water Cycle Natural Resource Learning Site, Pike County Conservation District, Pennsylvania: Website with concise overviews and graphical representations of watersheds, groundwater, and watershed stewardship issues. Available at: http://www.pikeconservation.org/Watershed.htm National Oceanic and Atmospheric Administrations National Climatic Data Center (NCDC): Website with the world's largest active archive of weather data. NCDC produces numerous climate publications and responds to data requests from all over the world. Available at: http://www.ncdc.noaa.gov/oa/climateresearch.html International Glossary of Hydrology: Website with concise definitions of hydrological and watershed terms in multiple languages. Available at: http://webworld.unesco.org/water/ihp/db/glossary/glu/HINDEN.HTM Washington’s Waters, Washington State University: Website hub for Washington State University's statewide water resource programs. Includes activities, resources, and contacts related to water quality and quantity issues. Available at: http://wawater.wsu.edu/index.htm Monitoring and Assessing Water Quality, U.S. EPA: Website with resource materials for volunteer water quality monitors including method manuals for monitoring estuaries, lakes, wetlands, and streams. Available at: http://www.epa.gov/owow/monitoring/vol.html University of Nevada Cooperative Extension (2001). Living on the Land: Stewardship for Small Acreages. Western SARE Professional Development Project: UNCE/WSARE CM-03-07: Curriculum addressing the needs of those who live on small acreage properties. Topics include goal setting and property inventory, soils, water, plants, and animals. Available through Susan Donaldson: [email protected] Oregon State University (1988). Watershed Stewardship, A Learning Guide. EM 8714: Publication with basic knowledge about watersheds and how communities can work together to enhance them. Available through Oregon State University Extension Service, (541) 737-2513
103

1 Watersheds, the Water Cycle and You
Natural Watershed Features
Forests and Native PlantsU.S. Forest Service, Glossary of Watershed Terms, Galena Watershed Analysis-Supplement 2002: Website for the Malheur National Forest in eastern Oregon. Includes glossary definitions for general watershed management issues, forestry and forest ecology. Available at: http://www.fs.fed.us/r6/malheur/galena/glossary.pdf Pojar, J and MacKinnon A. (1994). Plants of the Pacific Northwest Coast: Washington, Oregon, British Columbia, and Alaska. Lone Pine Publishing: Identification guide for plants native to the Pacific Northwest Coast. Soils Soils and How They Formed in the Puget Sound Area: Power Point Presentation prepared by Rob Harrison and A.B. Adams of the University of Washington, Seattle; June 5, 2002. Provides an overview of primary soil types of the Puget Sound. Available through presentation authors: [email protected], [email protected] Kruckeberg, A. (1991). Natural History of Puget Sound Country. University of Washington Press: Book containing a chapter on “The Lay of the Land, Landforms and Geology of the Puget Sound Basin”, providing an excellent overview of geological processes that shaped the landforms of the Puget Sound region. Groundwater Pike County Natural Resource Learning Site, The Groundwater Connection: Website providing a good textual and graphical summary of basic groundwater concepts. Available at: http://www.pikeconservation.org Streams and RiversNaiman, R.J. and Bilby R.E. (eds.) (1998). River Ecology and Management, Lessons From the Pacific Coastal Ecoregion. New York: Springer-Verlag: Academic publication describing the physical and biological components of Pacific Coast river systems, ecosystem processes, and management approaches.
104
1 Watersheds, the Water Cycle and You
Federal Interagency Stream Restoration Working Group (FISRWG) (1998). Stream Corridor Restoration: Principles, Processes, and Practices: Document providing information on stream corridor restoration, water quality, recreation, fish and wildlife, and agriculture. Encourages local participation in restoration planning and implementation. Available through the National Technical Information Service: http://www.ntis.gov/products/bestsellers/stream-corridor.asp?loc=4-2-0 Riparian Areas Riparian Areas Page, Oregon State University’s Malheur Experimental Station web site: Website summarizing principles of riparian area management and general management recommendations. Available at: http://www.cropinfo.net/riparian.htm Environmental Law Institute (2003). Conservation Thresholds for Land Use Planners: Report summarizing studies of conservation thresholds. Of particular interest is a summary of recommended riparian buffer widths to protect water quality and habitat. Available at: http://www.elistore.org/reports_detail.asp?ID=10839 WetlandsMitsch, W.J. and Gosselink, J.G. (2000). Wetlands, 3rd Edition. John Wiley & Sons: Textbook that extensively covers wetlands, the wetland environment, coastal wetland ecosystems, inland wetland ecosystems, and wetland management. Washington State University King County Extension (1992). A Field Guide to Wetland Characterization: Non-technical approach to wetland stewardship for people who want to actively protect wetlands. Includes a supplemental wetland plant guide. Limited copies. Available through WSU Extension King County: (206-205-3100) Cooke, S.S. (1997). A Field Guide to the Common Wetland Plants of Western Washington & Northwestern Oregon. Seattle Audubon Society: Identification guide for wetland plants of the Pacific Northwest. Lakes The Washington Lake Book, Washington Department of Ecology: Website providing descriptions of lakes, their watersheds, and the causes, effects, and solutions to water quality problems. Available at: http://www.ecy.wa.gov/programs/wq/plants/lakes/characteristics.html
105

1 Watersheds, the Water Cycle and You
Watershed Degradation The Forest Outreach Network: Website and slide show summarizing why forests are valuable, threats to the forested foothills, and strategies to keep the foothills forested. Available at: http://www.dnr.metrokc.gov/wlr/lands/forestry/FON.htm Farming on the Edge, American Farmland Trust: Website providing information and statistics on the issue of the loss of farmland to development. Available at: http://www.farmland.org/resources/fote/default.asp
106

1 Watersheds, the Water Cycle and You
107
Participant Evaluation
Please answer the following questions and add any additional comments below each one: 1. How much of the information in this presentation was new?
1 2 3 4 5 None Some All
2. Could you explain the information that was presented to a friend or neighbor? 1 2 3 4 5
Definitely not Not sure Definitely so 3. Will this information help you as a volunteer? 1 2 3 4 5 Definitely not Not sure Definitely so 4. How likely are you to use the information that you learned today during the next year? 1 2 3 4 5 Very unlikely Not sure Very likely 5. How would you rate the presentation skills of the speaker? 1 2 3 4 5 Poor Fair Excellent 6. Did you complete any of the activities or assignments associated with this lesson? ___ Yes (which ones? __________________________________________) ___ No 7. If you answered yes, did the activities/assignments enhance your understanding of the topic? 1 2 3 4 5
Definitely not Not sure Definitely so 8. List three things that you learned from today’s presentation/activities:
1. ________________________________________________________________________
________________________________________________________________________
2. ________________________________________________________________________
________________________________________________________________________
3. ________________________________________________________________________
________________________________________________________________________ 9. Was there any topic not covered that you were hoping to learn about? ____________________________________________________________________________

1 Watersheds, the Water Cycle and You
108