watershed enhancement board
TRANSCRIPT

Watershed Enhancement BoardAnnual Performance Progress Report
Reporting Year 2021
Published: 9/20/2021 2:35:33 PM
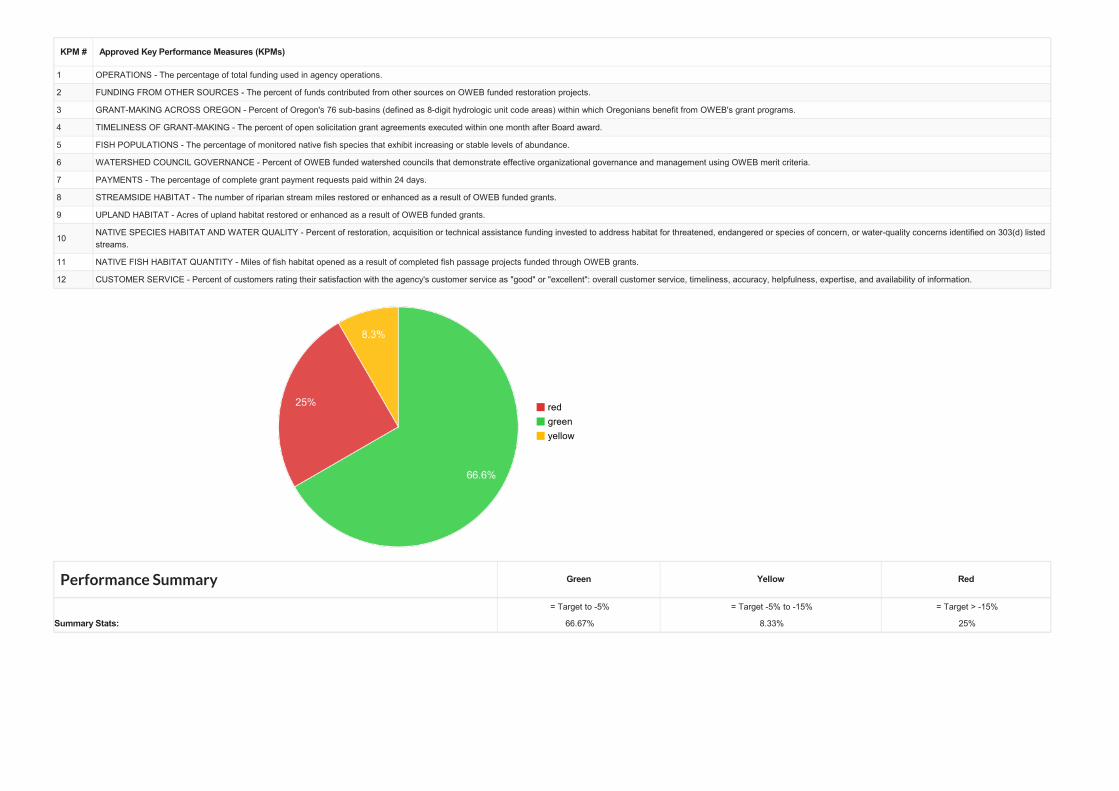
KPM # Approved Key Performance Measures (KPMs)
1 OPERATIONS - The percentage of total funding used in agency operations.
2 FUNDING FROM OTHER SOURCES - The percent of funds contributed from other sources on OWEB funded restoration projects.
3 GRANT-MAKING ACROSS OREGON - Percent of Oregon's 76 sub-basins (defined as 8-digit hydrologic unit code areas) within which Oregonians benefit from OWEB's grant programs.
4 TIMELINESS OF GRANT-MAKING - The percent of open solicitation grant agreements executed within one month after Board award.
5 FISH POPULATIONS - The percentage of monitored native fish species that exhibit increasing or stable levels of abundance.
6 WATERSHED COUNCIL GOVERNANCE - Percent of OWEB funded watershed councils that demonstrate effective organizational governance and management using OWEB merit criteria.
7 PAYMENTS - The percentage of complete grant payment requests paid within 24 days.
8 STREAMSIDE HABITAT - The number of riparian stream miles restored or enhanced as a result of OWEB funded grants.
9 UPLAND HABITAT - Acres of upland habitat restored or enhanced as a result of OWEB funded grants.
10NATIVE SPECIES HABITAT AND WATER QUALITY - Percent of restoration, acquisition or technical assistance funding invested to address habitat for threatened, endangered or species of concern, or water-quality concerns identified on 303(d) listedstreams.
11 NATIVE FISH HABITAT QUANTITY - Miles of fish habitat opened as a result of completed fish passage projects funded through OWEB grants.
12 CUSTOMER SERVICE - Percent of customers rating their satisfaction with the agency's customer service as "good" or "excellent": overall customer service, timeliness, accuracy, helpfulness, expertise, and availability of information.
Performance Summary Green Yellow Red
= Target to -5% = Target -5% to -15% = Target > -15%
Summary Stats: 66.67% 8.33% 25%
redgreenyellow

KPM #1 OPERATIONS - The percentage of total funding used in agency operations.Data Collection Period: Jul 01 - Jun 30
* Upward Trend = negative result
Report Year 2017 2018 2019 2020 2021
Percentage of funding used in operationsActual 10.34 10.30 9.88 8.79 7.70Target 11 11 11 11 11
How Are We DoingIn the current FY2021 reporting cycle, the percentage of total funding used in agency operations was again slightly lower than the previous report (9.88% in FY2019 and 8.79% in FY2020). Themethodology calculates the percentage of operations costs to total costs (total costs = operations plus grants).
Because OWEB is largely a ‘pass-through’ grant agency, it is appropriate to compare operational cost ratios with private foundations and charitable organizations. For comparison, OWEB obtaineddata from the Foundation Center, a leading source of information about philanthropy worldwide, on the average operations cost for private foundations with 19-129 employees (n = 29) in theirdatabase at that time. The average operations cost for these foundations was 21.7%, where operation cost was calculated as 1 - (total giving/total expenditures). This comparison suggests thatOWEB’s administrative costs are below average for comparable entities in the U.S. The target of 11% has been set quite low to ensure the majority of funds reach local watersheds.
Factors Affecting ResultsIncreases in grant payments (noted in FY 2020 and FY 2021) result in minor decreases in the operations value compared with previous reports. This value shows that OWEB continues to be highlyefficient in its staffing approaches to support the agency’s granting programs.
During the 2017 Legislative session, OWEB’s calculation for this KPM was revised to include direct-cost positions in agency operations costs. These positions were previously excluded, resulting in alower percentage for this calculation. In 2018, the agency worked with DAS and the Legislative Fiscal Office to correct the methodology to the following equation: the percentage of operations costs tototal costs (total costs = operations plus grants). Subsequent to this correction, values for 2017 and 2018 were calculated using this method.
actual target
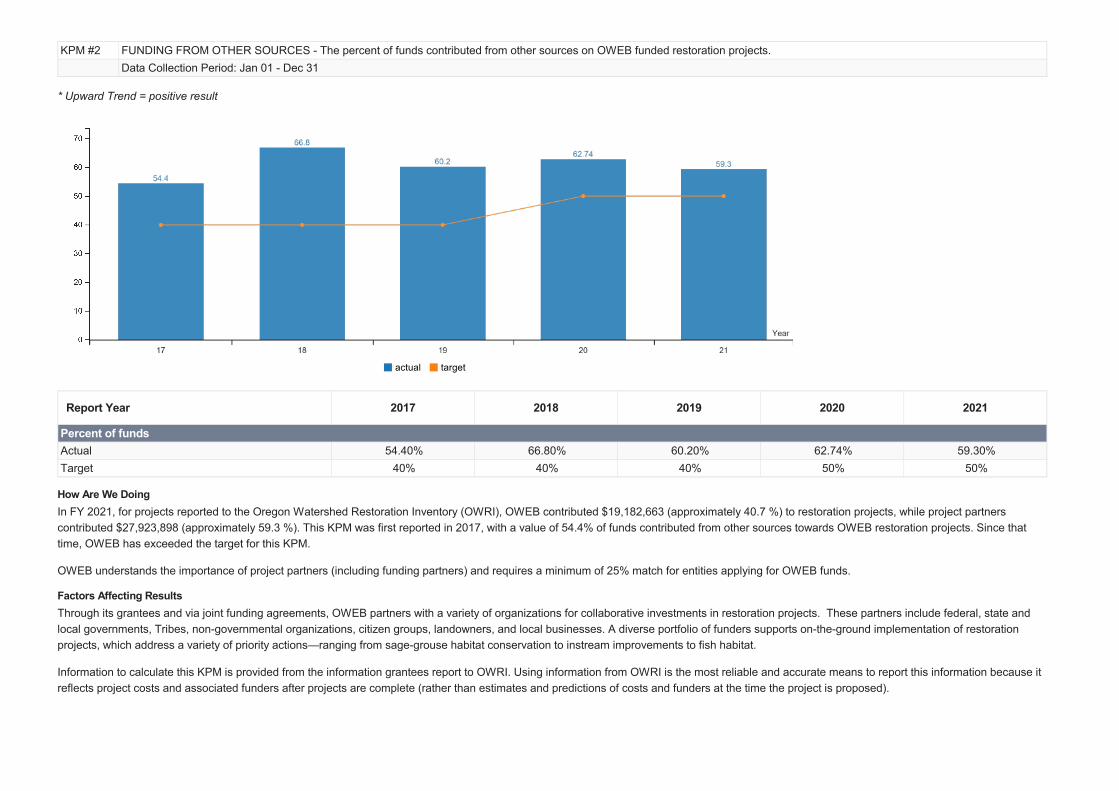
KPM #2 FUNDING FROM OTHER SOURCES - The percent of funds contributed from other sources on OWEB funded restoration projects.Data Collection Period: Jan 01 - Dec 31
* Upward Trend = positive result
Report Year 2017 2018 2019 2020 2021
Percent of fundsActual 54.40% 66.80% 60.20% 62.74% 59.30%Target 40% 40% 40% 50% 50%
How Are We DoingIn FY 2021, for projects reported to the Oregon Watershed Restoration Inventory (OWRI), OWEB contributed $19,182,663 (approximately 40.7 %) to restoration projects, while project partnerscontributed $27,923,898 (approximately 59.3 %). This KPM was first reported in 2017, with a value of 54.4% of funds contributed from other sources towards OWEB restoration projects. Since thattime, OWEB has exceeded the target for this KPM.
OWEB understands the importance of project partners (including funding partners) and requires a minimum of 25% match for entities applying for OWEB funds.
Factors Affecting ResultsThrough its grantees and via joint funding agreements, OWEB partners with a variety of organizations for collaborative investments in restoration projects. These partners include federal, state andlocal governments, Tribes, non-governmental organizations, citizen groups, landowners, and local businesses. A diverse portfolio of funders supports on-the-ground implementation of restorationprojects, which address a variety of priority actions—ranging from sage-grouse habitat conservation to instream improvements to fish habitat.
Information to calculate this KPM is provided from the information grantees report to OWRI. Using information from OWRI is the most reliable and accurate means to report this information because itreflects project costs and associated funders after projects are complete (rather than estimates and predictions of costs and funders at the time the project is proposed).
actual target

KPM #3 GRANT-MAKING ACROSS OREGON - Percent of Oregon's 76 sub-basins (defined as 8-digit hydrologic unit code areas) within which Oregonians benefit from OWEB's grant programs.Data Collection Period: Jul 01 - Jun 30
* Upward Trend = positive result
Report Year 2017 2018 2019 2020 2021
Percent of Oregon sub-basinsActual 92.10% 93.42% 97.37% 93.42% 94.70%Target 90% 90% 90% 90% 90%
How Are We DoingResults for FY 2021 demonstrate that nearly 95% of Oregon’s sub-basins benefitted from OWEB’s grant programs. In FY2021, there were a total of 793 grants analyzed, representing the second fiscalyear of the 2019-2021 biennium. Seventy-two out of 76 watersheds included an OWEB funded project during this reporting period.
This KPM was reported for the first time in 2017. At that time, for the 2015-17 biennium, OWEB grants were awarded in 92.1% of the states’ sub-basins. Results since then are similar, with amaximum percentage of 97.37% in 2019.
OWEB’s mission is to protect and restore healthy watersheds that support thriving communities and strong economies. This KPM assesses how grants achieving OWEB’s mission are distributedthroughout the state. By looking at grant-making across Oregon, OWEB can determine if some areas of Oregon less frequently receive grant awards and, as needed, explore reasons for this. It isimportant to note that this KPM is dependent on grant applications being received from local partners in various locations around the state.
Factors Affecting ResultsThis KPM is calculated as the percent of Oregon sub-basins with at least 50% of their land area contained with the boundary of the State of Oregon that receive at least one OWEB grant within abiennium. Sub-basin is a terminology used by the U.S. Geological Survey as part of its categorization of hydrologic units. A sub-basin is equivalent to an 8-digit hydrologic unit code. There are 76sub-basins within Oregon that have at least 50% of their land area contained with the State of Oregon boundary.
OWEB offers nearly 20 grant programs, including Open Solicitation; Focused Investment Partnerships; several specific and specialized programs, such as Conservation Reserve Enhancement
actual target

Program Technical Assistance grants; and Small Grants, among others.

KPM #4 TIMELINESS OF GRANT-MAKING - The percent of open solicitation grant agreements executed within one month after Board award.Data Collection Period: Jul 01 - Jun 30
* Upward Trend = positive result
Report Year 2017 2018 2019 2020 2021
Percent of open solicitation grants awarded within 1 monthActual 19.50% 18.13% 26.67% 16.18% 45%Target 95% 95% 95% 75% 75%
How Are We DoingOWEB strives for accuracy and efficiency in all aspects of the grant-making process. In the FY 2021 report, only one award cycle for OWEB Open Solicitation grants was included to calculate thevalue for this KPM. This limitation resulted from a pause on OWEB grant-making that occurred due to significant lottery revenue decreases in 2020 due to the COVID-19 pandemic. After revenuesbegan to increase again, at the 3/10/21 OWEB Board meeting, 85 out of 143 applications were approved. Of these, 80 were opened, and 36 received their GA within 31 days, resulting in a 45% valuefor this KPM. For reference, in the previous FY 2019-20 report, two Open Solicitation grant cycles were included, resulting in 136 grants awarded, and of these 22 had grant agreements executedwithin 31 days of Board award (16.15%).
This KPM is influenced by both staff and grantee timelines. The agency recognizes this KPM may not achieve the target but tracking this information has helped the agency identify importantbottleneck areas that need process improvements. The low values are partially attributed to workflow for grant agreements, which involve several steps and distributed responsibilities (e.g., signing bygrantees; in some cases, review by Oregon Department of Justice [DOJ]). In addition, the overall lower number of grants awarded reflects the effects of the COVID-19 pandemic.
Factors Affecting ResultsSeveral factors can delay execution beyond the target: 1) the requirement under OWEB’s administrative rules for grantees to resolve outstanding final reports for other, open grants prior to beingissued a new grant agreement; 2) time needed for DOJ to review agreements for awards greater than $150,000 unless these utilize standard grant agreement conditions; and 3) time required for theOWEB-executed grant agreement to be signed by the grantee and returned to OWEB. Additionally, the timeframe of 31 days since award time also includes weekends and holidays, which may resultin an inaccurate representation and variability from month to month.
actual target
Although the grant-making process may have been timelier in FY 2021 because the requirement to hold agreements for outstanding reports was waived (because of the COVID-19 pandemic), OWEBwas operating with reduced staff capacity (i.e., only about two thirds of the FY 2020 staff levels).
Finally, as noted in previous APRRs, OWEB has taken action to improve timeliness of grant agreement execution. For example, the agency worked with DOJ to streamline the review process forgrants that are more standard in nature while still exceeding the $150,000 limit for reviews. In addition, staff have improved systems designed to help grantees know when they have outstandingreports, with the goal of reducing time delays based on outstanding grantee reports. OWEB has implemented methods for consistently tracking the time required for individual steps in the grantagreement workflow in greater detail, enabling staff to identify actual target specific steps during which delays are common, and explore opportunities for improvements.

KPM #5 FISH POPULATIONS - The percentage of monitored native fish species that exhibit increasing or stable levels of abundance.Data Collection Period: Jul 01 - Jun 30
* Upward Trend = positive result
Report Year 2017 2018 2019 2020 2021
Percentage of native fish species that are increasing or stableActual 65% 71% 71% 84% 71%Target 75% 75% 75% 75% 75%
How Are We DoingFish biologists from the Oregon Department of Fish and Wildlife (ODFW) determined that the percentage of monitored native fish species exhibiting increasing or stable levels of abundance hasremained relatively stable over the past several reporting periods (2015 – 75%, 2016 – 71%, 2017 – 65%, 2018 – 71%, 2019 – 71%). An increase during the previous FY 2020 reporting period (84%)was followed by a return to previous levels (71%) attributable primarily to reduced monitoring for some species (i.e., Borax Lake Chub, Alvord Chub, Foskett Dace). The species included in thisassessment have varied through time in response to fluctuations in monitoring resources and priorities. Seventeen native fish species that were assessed in either the 2005 Native Fish Status Reportor in the 1995 Biennial Report on the Status of Wild Fish in Oregon were monitored in FY 2021 For some species, such as salmon, steelhead, and native trout, the species designation can includeseveral Species Management Units (SMUs). Of the species monitored in FY 2021, results show 12 species with long-term stable or increasing abundance: chum salmon, coho salmon, spring Chinooksalmon, winter steelhead, coastal cutthroat trout, bull trout, eulachon, white sturgeon, Miller Lake lamprey, Warner sucker, sockeye salmon, and Oregon chub. Pacific lamprey has declined relative tohistorical abundance, but current trends are uncertain. Abundances of salmon and steelhead populations are cyclical, and many of Oregon’s salmon and steelhead populations have experienced lowadult returns over the past several years in response to poor ocean conditions and successive years of drought. These lower abundances generally continued through FY2021. Abundances haveincrementally improved in some species management units (e.g., Oregon Coast Coho; L. Columbia Coho; Coastal Chinook) but runs of some species have remained low (e.g., summer steelhead).
Factors Affecting ResultsOWEB's ability to report on this measure is dependent upon ODFW. FY 202021 monitoring included species that are not specifically monitored for abundance or that have not been intensivelymonitored on a longer term or regular basis necessary to evaluate trends in abundance (e.g., Lahontan Cutthroat Trout, Pacific Lamprey). Abundances of salmon and steelhead SMUs across Oregonhave remained lower relative to some recent high-abundance years, likely as a response to poor conditions for ocean survival. Continued monitoring in the coming years will identify whether thesedeclines are temporary or if they indicate a longer term, decreasing trend that persists during more favorable ocean conditions. OWEB will continue to work with ODFW to refine the capability to report
actual target

on this measure through assessment and monitoring efforts. Conservation and recovery plans are a priority for ODFW, and specific targets described in these plans identify monitoring prioritiesneeded to track the long-term status and trends for Endangered Species Act-listed and native fish species. A conservation plan for several salmonid species in the Rogue and South Coast basins iscurrently in development. ODFW maintains the Salmon Recovery Tracker to report on progress made towards achieving the measurable criteria identified in the State of Oregon’s fish conservationand recovery plans. These criteria focus on fish abundance, productivity, diversity, and spatial structure, as well as the condition of habitat. Sufficient funding for sustained monitoring is necessary toenable reporting on this KPM.

KPM #6 WATERSHED COUNCIL GOVERNANCE - Percent of OWEB funded watershed councils that demonstrate effective organizational governance and management using OWEB merit criteria.Data Collection Period: Jul 01 - Jun 30
* Upward Trend = positive result
Report Year 2017 2018 2019 2020 2021
Percent of watershed councils that meet merit criteriaActual 91.50% 100% 100%Target 100% 100% 100% 100%
How Are We DoingThis KPM is measured on a biennial basis.
Fifty-eight Watershed Council Capacity grant applications were received by the March 2021 application deadline. The applications were evaluated based on four merit criteria: 1) effective governanceand management, 2) progress in planning, 3) progress in on-the-ground watershed restoration, and 4) progress in community engagement for watershed restoration purposes. All criteria are equallyweighted in the review process. OWEB staff considered the following information in the review: 1) information in the council’s two-year work plans; 2) answers to the Council Capacity grant applicationquestions; 3) OWEB staff’s knowledge of council performance; 4) any supplemental information provided by the council in response to OWEB’s request; and 5) if requested by OWEB, interviews withcouncil officers and staff. OWEB considers a watershed council to have met its work plan objectives if they meet all four merit criteria.
For the 2021-2023 Council Capacity grant cycle, all 56 of the watershed councils recommended for funding met all four of the merit criteria and received full funding; two councils demonstratedinadequate performance and were not funded. Specific to this KPM, 56 out of 56 organizations receiving funding met both the effective governance and management criteria.
Factors Affecting ResultsThe purpose of OWEB’s grants to watershed councils is to support effective watershed council staff and operations in carrying out activities and projects to protect or restore native fish or wildlifehabitats and improve water quality. These groups also undertake resource assessment, planning, design and engineering, technical assistance, monitoring, and outreach to involve landowners andcitizens in voluntary actions to protect, restore and maintain the ecological health of lands and waters. The councils’ ability to demonstrate progress in work plan implementation and maintain effectiveorganizational management and governance shows the effectiveness of OWEB’s investment in helping to support the operating costs of watershed councils.
actual target

Currently watershed councils are evaluated for merit every two years at the start of each biennium. The watershed council capacity (Council Capacity) grant process supports OWEB’s goal of resilient,sustainable local organizations, is performance and outcome based, and contains high standards for eligibility, reporting, and accountability. In July of 2014, the OWEB Board adopted new rules andguidance for Council Capacity grants. The new funding criteria contain higher standards for eligibility and merit than in the past.
The 2021-23 Council Capacity grant cycle is the fourth time watershed councils have been evaluated using the new merit criteria and ranked for funding using three funding levels (fully fund, fund at areduced level, and do not fund). In the three biennia that have occurred since OWEB implemented this approach, the percentage of councils that meet both the effective governance and managementcriteria continues to increase, from 81% in 2015-2017, 92% in 2017-2019, to 100% in 2019-2021 and 2021-23.

KPM #7 PAYMENTS - The percentage of complete grant payment requests paid within 24 days.Data Collection Period: Jul 01 - Jun 30
* Upward Trend = positive result
Report Year 2017 2018 2019 2020 2021
Percentage of grant payments paid within 30 days (24 days starting in FY 2012)Actual 100% 100% 100% 100% 100%Target 100% 100% 100% 100% 100%
How Are We DoingThe operation and management of a competitive grant program is a major component of OWEB’s business activities. The timely processing of grant payments benefits OWEB and its partners byproviding the necessary resources to implement watershed enhancement work in an expeditious manner. The target is ambitious, but OWEB believes it is necessary to be prompt with paymentrequests and strives for excellence. Many grantees depend on the timely disbursement of these resources to support operation and management obligations. During the current FY 2021 reportingcycle, OWEB again met the 100% target of complete grant payment requests paid within 24 days. OWEB met its target during each of the last 15 fiscal years.
Factors Affecting ResultsOWEB is statutorily required to make payments within a 45-day period and continues to meet and well exceed this statutory requirement as noted in the KPM results. The review of payments, effectivestaffing levels matched to workload, and strategic investments in new techniques and technology to improve efficiency enables OWEB to meet this target.
actual target
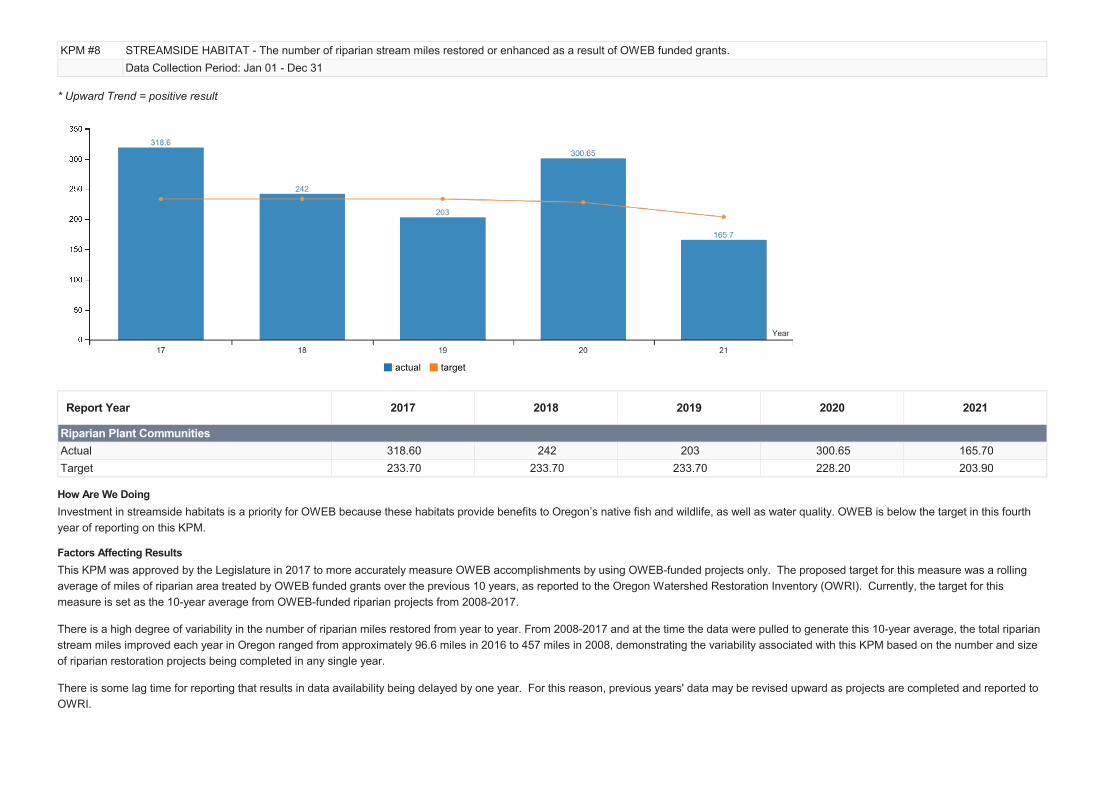
KPM #8 STREAMSIDE HABITAT - The number of riparian stream miles restored or enhanced as a result of OWEB funded grants.Data Collection Period: Jan 01 - Dec 31
* Upward Trend = positive result
Report Year 2017 2018 2019 2020 2021
Riparian Plant CommunitiesActual 318.60 242 203 300.65 165.70Target 233.70 233.70 233.70 228.20 203.90
How Are We DoingInvestment in streamside habitats is a priority for OWEB because these habitats provide benefits to Oregon’s native fish and wildlife, as well as water quality. OWEB is below the target in this fourthyear of reporting on this KPM.
Factors Affecting ResultsThis KPM was approved by the Legislature in 2017 to more accurately measure OWEB accomplishments by using OWEB-funded projects only. The proposed target for this measure was a rollingaverage of miles of riparian area treated by OWEB funded grants over the previous 10 years, as reported to the Oregon Watershed Restoration Inventory (OWRI). Currently, the target for thismeasure is set as the 10-year average from OWEB-funded riparian projects from 2008-2017.
There is a high degree of variability in the number of riparian miles restored from year to year. From 2008-2017 and at the time the data were pulled to generate this 10-year average, the total riparianstream miles improved each year in Oregon ranged from approximately 96.6 miles in 2016 to 457 miles in 2008, demonstrating the variability associated with this KPM based on the number and sizeof riparian restoration projects being completed in any single year.
There is some lag time for reporting that results in data availability being delayed by one year. For this reason, previous years' data may be revised upward as projects are completed and reported toOWRI.
actual target


KPM #9 UPLAND HABITAT - Acres of upland habitat restored or enhanced as a result of OWEB funded grants.Data Collection Period: Jan 01 - Dec 31
* Upward Trend = positive result
Report Year 2017 2018 2019 2020 2021
Upland Habitat RestoredActual 35,646 42,984 52,671 44,685 36,317Target 47,560 47,560 47,560 50,800 50,015
How Are We DoingThis KPM recognizes the significant contributions of OWEB funded projects to upland restoration throughout Oregon. The measure indicates progress towards improving upland habitat conditions forthe benefit of native species and, in some cases, water quality. The results for the current FY 2021 reporting period are below the desired target.
Factors Affecting ResultsThis KPM was approved by the Legislature in 2017 to more accurately measure OWEB accomplishments by using OWEB-funded projects only. The proposed target for this measure was a rollingaverage of upland acres restored by OWEB funded grants over the previous 10 years, as reported to the Oregon Watershed Restoration Inventory (OWRI). Currently, the target for this measure is setas the 10-year average of OWEB-funded upland projects from 2008-2017.
There is a high degree of variability in the number of upland habitat acres restored from year to year. From 2008-17 and at the time the data were pulled to generate this 10-year average, the totalnumber of upland acres restored or enhanced each year in Oregon ranged from approximately 20,864 in 2016 to 95,926 acres in 2009, demonstrating the variability associated with this KPM based onthe number and size of upland enhancement projects being completed in any single year.
There is some lag time for reporting that results in data availability being delayed by one year. For this reason, previous years' data may be revised upward as projects are completed and reported toOWRI.
actual target

KPM #10 NATIVE SPECIES HABITAT AND WATER QUALITY - Percent of restoration, acquisition or technical assistance funding invested to address habitat for threatened, endangered or speciesof concern, or water-quality concerns identified on 303(d) listed streams.Data Collection Period: Jul 01 - Jun 30
* Upward Trend = positive result
Report Year 2017 2018 2019 2020 2021
Investments to address T&E species, species of concern; or concerns identified on 303(d) listed streamsActual 89.34% 96.20% 92.30% 90.20%Target 90% 90% 90% 90%
How Are We DoingThis is the fourth-year data were available to report on this KPM, and results continue to surpass the target level. Results allow OWEB to track all projects that address habitat for threatened,endangered, or species of concern, as well as water-quality concerns identified on 303(d) listed streams over time.
Factors Affecting ResultsTo track this KPM, OWEB added a question to the agency’s online application system for restoration, technical assistance, and acquisition grants. Applicants’ responses provided the informationanalyzed for this KPM. Only approved and funded grants, identified by their grant agreement execution date, were included in the analysis. OWEB continues to track progress on this KPM to helpbetter understand the factors affecting results.
actual target

KPM #11 NATIVE FISH HABITAT QUANTITY - Miles of fish habitat opened as a result of completed fish passage projects funded through OWEB grants.Data Collection Period: Jan 01 - Dec 31
* Upward Trend = positive result
Report Year 2017 2018 2019 2020 2021
SALMON HABITAT QUANTITYActual 146.60 179.21 131 73.17 113.12Target 138.80 138.80 138.80 125.50 113.90
How Are We DoingThis KPM measures progress toward removing barriers to fish passage through OWEB funded projects in rivers and streams throughout Oregon.
Factors Affecting ResultsThis KPM was approved by the Legislature in 2017 to more accurately measure OWEB accomplishments by focusing on reporting OWEB-funded projects. The proposed target for this measure wasa rolling average of miles opened/improved by OWEB funded grants over the previous 10 years, as reported to the Oregon Watershed Restoration Inventory (OWRI). Currently, the target for thismeasure is set as the 10-year average of results from fish passage projects from 2008-2017.
There is substantial variability from year to year in this metric. Between 2008 and 2017 and at the time the data were pulled to generate this 10-year average, the number of stream miles madeavailable ranged annually from 32.01 in 2017 to 198 in 2008 miles.
The yearly numbers of salmon habitat opened or improved have generally been decreasing since 2010. This trend likely is due to the fact that restoration efforts early in the history of the Oregon Planfor Salmon and Watersheds may have focused on fish-passage projects that were less complicated and simpler to implement. As restoration efforts have matured, more complicated and expensiveprojects are beginning to be implemented, which take more planning time.
There is some lag time for reporting that results in data availability being delayed by one year. For this reason, previous years' data may be revised upward as projects are completed and reported toOWRI.
actual target

KPM #12 CUSTOMER SERVICE - Percent of customers rating their satisfaction with the agency's customer service as "good" or "excellent": overall customer service, timeliness, accuracy,helpfulness, expertise, and availability of information.Data Collection Period: Jul 01 - Jun 30
Report Year 2017 2018 2019 2020 2021
Availability of InformationActual 75.70% 80.30% 83.70% 81.30% 90.20%Target 91% 91% 91% 91% 91%TimelinessActual 85.40% 88% 86.70% 89% 90.30%Target 91% 91% 91% 91% 91%HelpfulnessActual 94.40% 95.60% 96% 94.50% 96.70%Target 91% 91% 91% 91% 91%OverallActual 91% 93% 92.50% 91.80% 95.60%Target 91% 91% 91% 91% 91%ExpertiseActual 91.70% 94.50% 95.60% 91.80% 95.60%Target 91% 91% 91% 91% 91%AccuracyActual 91% 91.30% 91.70% 94% 96.70%Target 91% 91% 91% 91% 91%
How Are We Doing
actual target
OWEB strives for excellent customer service in all areas for its applicants and grantees. In FY 2021, OWEB exceeded the target for overall quality of service, with over 95% of respondents ratingOWEB in the excellent and good categories. All Customer Service ratings increased in comparison with the previous (FY 2020) report.
OWEB was slightly below target for Timeliness (90.3% compared with the target of 91%). This metric has been steadily increasing over the past few reporting years.
OWEB’s rating for Availability of Information improved substantially in comparison with the previous report (81.3% in the FY 2020 report). This increase may reflect that customers have become moreaccustomed to the task-oriented website layout.
Many narrative comments in the customer service survey underscored customers’ appreciation for the frequent and open communication from OWEB about status of revenues and grant offeringsduring the COVID-19 pandemic.
Factors Affecting ResultsThe OWEB customer service survey was sent via email to 591 email addresses, receiving 92 responses. Since 2017, OWEB has used a targeted methodology to circulate the customer service surveyvia email to contact information provided to the agency’s online grant application system. This approach increased response rates when compared with pre-2017 surveys. OWEB receives manypositive narrative comments from customers about the quality of its staff and the online grant application and management systems, among other topics. The agency continues to solicit feedback fromusers and identify necessary improvements to meet their needs, taking into consideration challenges presented by the pandemic.