watercourse pollution due to surface runoff following slurry spreading, part 2: decision support to...
TRANSCRIPT

J. agric. Engng Res. (2000) 75, 429}447doi:10.1006/jaer.2000.0527, available online at http://www.idealibrary.com on
00
Watercourse Pollution due to Surface Runo! following Slurry Spreading,Part 2: Decision Support to minimize Pollution
M. B. McGechan; D. R. Lewis
Environment Division, SAC, West Mains Rd, Edinburgh EH9 3JG, UK; e-mail of corresponding author: [email protected]
(Received 17 August 1999; accepted in revised form 11 January 2000)
Procedures for avoiding or minimizing pollution of watercourses by surface runo! (overland #ow) during orafter slurry spreading are explored. Output from simulations with the Swedish soil water model SOIL for "eldswith a range of conductivities and drainage system e$ciencies (as described in Part 1) have been analysed withparticular reference to occurrence of surface runo!. The analytical procedure was linked to a simple model ofthe duration of pollution risk following slurry spreading. Development of this model, which simulates thedecline in potency of slurry components due to microbial degradation, volatilization and the e!ect of gentle rainassisting in"ltration, is also described. Results show the greatest opportunities for reducing pollution fromselecting "elds for spreading slurry which are not susceptible to surface runo! because they have a high &pro"leconductivity' (a combination of the hydraulic conductivities of the soil layers and the e$ciency of the "elddrainage system if present). It is impossible to avoid pollution if slurry is spread on a "eld with a low pro"leconductivity, so slurry spreading on such "elds should be avoided altogether, particularly in winter. For "eldswith intermediate conductivities in the range 5}10 mm d~1, there is a bene"t from selecting spreading dayswhich meet certain weather and soil wetness conditions.
( 2000 Silsoe Research Institute
1. Introduction
All-year housing of pigs and poultry and over-winterhousing of cattle results in large quantities of animalmanure and slurry which are traditionally disposed of byland spreading. Municipal and industrial wastes are alsoincreasingly disposed of on agricultural land. Spreadingthese wastes can cause serious water and air pollutionproblems, but they are also valuable as plant nutrientsand if managed e$ciently can substantially reduce chem-ical fertilizer requirements. There is concern that typicalfarming practice neither minimizes pollution nor maxi-mizes the fertilizer value of slurry.
This paper is concerned with avoiding or minimizingpollution of watercourses caused by surface runo! (over-land #ow) during or after slurry spreading. This may beachieved either by avoiding spreading on runo! suscep-tible "elds or by careful timing of spreading on runo!susceptible "elds. The opportunities for applying bothapproaches are explored.
Modelling can be a valuable tool to address environ-mental pollution issues, particularly where processes are
21-8634/00/040429#19 $35.00/0 42
heavily dependent on weather. The preceding paper (Part1, Lewis & McGechan, 1999) describes adaptation andparameterization of the Swedish soil water simulationmodel SOIL (Johnsson & Jansson, 1991; Jansson, 1996)to represent the occurrence of surface runo! [followingan earlier study in which SOIL was parameterized forconditions of low runo! susceptibility by McGechanet al., (1997)]. In this paper (Part 2), a link is made witha simple model of the duration of pollution risks follow-ing slurry spreading, in order to explore the occurrenceof pollution associated with surface runo!. The resultspresented here represent an &Environmental Risk Assess-ment' for surface runo! pollution, which becomes thebasis for a decision support system for slurry spreading(Perros, 1998).
2. Existing measures to minimize pollution
The potential for water pollution associated withslurry spreading is well established. It is described infarmers' advisory (code of practice) publications for
9 ( 2000 Silsoe Research Institute

Notation
(&Nutrient' refers sequentially to ammonium NH`4
,nitrate NO~
3, and phosphate PO3~
4ions)
Cav
available concentration of nutrientin soil interaction zone, mg/l
CR
concentration of slurry nutrient instorage reservoir, mg/m2
CinitR
initial value of concentration ofslurry nutrient in storage reservoir,mg/m
Cs
concentration of nutrient sorbedonto soil surfaces in interactionzone, mg/l
CT
total concentration of nutrient insoil interaction zone, mg/m2
C3T
initial value of total concentrationof nutrient in soil interaction zone,mg/m2
Cw
concentration of nutrient in solu-tion phase in interaction zone, mg/l
Cf
clay content of soil, %E
pevaporation of ponded water,mm/d
Et
evapotranspiration from soil inter-action zone, mm/d
I1
in"ltration (water #ux) through soilsurface, mm/d
I2
in"ltration (water #ux) out of inter-action zone, mm/d
Kd
partition coe$cient between solidphase and water phase
Kdy
decay rate of slurry nutrient due tobiodegradation, 1/d
P rainfall, mm/dP.!9
cumulative rainfall leading to com-plete release of slurry nutrient, mm/d
R runo!, mm/dt time, d<1
volume of ponded water on soilsurface per unit area, m
<init1
initial value of volume of pondedwater on soil surface per unit area,m
<2
volume of water in interaction zoneper unit area, m
<init2
initial value of volume of water ininteraction zone per unit area, m
*z thickness of interaction zone, mmb extraction coe$cient/ soil porosity, fraction# relative volume of water, m3/m3
om
soil dry bulk density, kg/m3
M. B. McGECHAN; D. R. LEWIS430
England and Wales (MAFF, 1991) and for Scotland(SOAEFD, 1997). A number of guidelines are describedin these publications, including drawing up a &waste man-agement plan', which is required by any livestock farmerwho does not have installed storage for at least sixmonths slurry production. This includes calculation ofthe required store size from the volume of slurry produc-ed by the animals on the farm, and planning where andwhen slurry should be spread taking account of "eld andweather conditions as well as crop nutrient requirements.Certain categories of "elds or parts of "elds are men-tioned as being unsuitable for spreading at any time,including the vicinity of riverbanks or watercourses,dwelling houses, water supply springs or boreholes, des-ignated nature conservation areas, and "elds with newlyinstalled "eld drains (including mole drainage). Otherareas should be avoided at certain times of year, parti-cularly those liable to #ooding. Slurry must not be spreadduring frozen and snow-covered conditions. Application
rates should not exceed 50 m3/ha for surface spreadingor 140 m3/ha with injection. The following recommenda-tion is made regarding the e!ect of soil conditions onsuitability for spreading (SOAEFD, 1997). &The quantityof liquid waste which can be applied to an area withoutcausing surface runo! with the subsequent risk of pollu-tion is a function of soil type, soil moisture content,in"ltration rate and surface gradient. As the permeabilityand in"ltration rate of a soil decrease and the surfacegradient increases, the greater the risk of surface runo!.To minimize this risk, liquid waste should not be appliedat rates greater than the in"ltration capacity of the soiland at no time when a soil is waterlogged. The use ofheavy, fully laden tankers in wet conditions increases therisk of soil compaction and smearing, which will reducethe in"ltration capacity of the soil and increase run-o!.'There is no speci"c "gure mentioned for a limiting per-meability or in"ltration rate, although SAC Adviserswho draw up waste management plans for farmers
431WATERCOURSE POLLUTION DUE TO SURFACE RUNOFF
consider 10 mm/d to be a minimum surface in"ltrationrate or conductivity for a "eld if it is to be consideredsuitable for spreading (D. Howat, pers. comm.).
3. Contaminant transport processes
Contaminated runo! originates through transfer ofchemicals at the soil or slurry surface. This transfer oc-curs through a variety of processes, such as during themixing of rainwater with the soil solution and slurrysolution, through the associated dissolution of chemicalspresent in a solid form, from the desorption of chemicalsabsorbed to the soil, or through adsorption of chemicalsto eroded soil or slurry particulates (Baily et al., 1974).Prior to runo! initiation, the in"ltrating rainwater willmix with the chemicals in the soil, and may cause surfacechemicals to dissolve and in"ltrate into the soil. Follow-ing water ponding and the occurrence of runo!, part ofthe rainwater still in"ltrates into the soil. This rainwatermixes with chemicals in a spatially limited mixing layer ofthe soil matrix (near to the surface), and the degree ofinteraction between the rainwater and soil water usuallydepends upon depth, a concept known as non-uniformmixing (Ashraf & Borah, 1992). Transport of con-taminants along the soil surface occurs through bothconvective and dispersive means, with chemical routingdetermined by the soil roughness coe$cient, the slope,the dispersivities of the solute or particulates, the spatialvariability of the soil, and the surface distribution of thepollutant along the slope which may provide source orsink #uxes. Any model of surface chemical transport willrequire some representation or approximation in someform of all of the above processes.
4. Duration of pollution risk from surface spread slurry
4.1. Factors in-uencing duration of pollution risk
When slurry is spread by a surface spreading tech-nique, material remains on the surface for a number ofdays afterwards (unless it is ploughed in). There is a criti-cal period during which slurry components remain onthe surface in su$cient quantities and with su$cientpotency to cause a pollution incident if runo! occurs, buteventually the quantity and potency decline to a levelwhere the e!ect is insigni"cant. The decline in potencyarises due to breakdown of slurry components by micro-bial action and (for the ammonia component) due tovolatilization, while the decline in quantity is in#uencedby gentle rain assisting in"ltration of slurry into the soil.This decline, at a faster rate for nitrogen than for phos-phorus, is illustrated in curves presented by Sherwood
(1992) based on a series of experiments carried out inIreland. The length of the critical period is likely todepend on factors such as temperature, wind speed, thequantity of gentle rain falling and the characteristics ofthe soil surface. The critical period is generally likely tobe longer for phosphorus than for nitrogenous compo-nents of slurry, since phosphorus is not volatile, haslower solubility, and may be less in#uenced by microbialprocesses compared to nitrogen. However, this period isalso shortened by nutrient losses associated with themovement of soil particles. Phosphorus and ammoniaare removed from soils which have signi"cant erosionproperties, however nutrient losses from grass-covered"elds is predominantly through the soluble nutrientform.
4.2. Requirement for pollution risk duration model
A very simple approach to the duration of runo!pollution risk, adopted in an earlier study by McGechan& Wu (1996) is to assume the critical period to be ofa constant length for each of the nitrogen and phos-phorus components of slurry, based on the curves pre-sented by Sherwood (1992). In e!ect, such an approachassumes that all "elds have the same surface character-istics and that there would always be the same pattern ofenvironmental factors including gentle rain followingslurry spreading. This was thought to be a gross over-simpli"cation, particularly as it ignores the possiblebene"cial e!ect of gentle rain (with intensity below thatwhich causes runo! ) in assisting the process of in"ltra-tion of slurry components into the soil and reducing thelength of the critical period. An attempt was thereforemade to develop a weather-dependent runo! risk dura-tion model.
4.3. General principles of simple pollution risk durationmodel
The objective of the study described in this series ofpapers is to investigate watercourse pollution arisingfrom the runo! transport of applied slurry. This requiresa simulation model to describe the movement of nutri-ents (e.g. nitrogen and phosphorus) from "elds treatedwith slurry. Such a model should necessarily consist oflinked sub-surface hydrology, and surface soil/slurrytransport and nutrient transport components (Wanget al., 1996). The pollution risk duration model describedhere includes representation of chemical solute trans-formation and transport within the surface interactionzone. This model is linked to output representing watermovements and soil water contents from the hydrology
M. B. McGECHAN; D. R. LEWIS432
model SOIL (Jansson, 1996) calibrated for speci"c sitesas described in Part 1 (Lewis & McGechan, 1999).
The surface slurry model (Fig. 1) is based on the treat-ment of nutrient movement in the groundwater loadinge+ects of agricultural management systems (GLEAMS)model (Leonard et al., 1987) and the agricultural nutrientmodel (ANIMO) (Groenendijk & Kroes, 1997). In theGLEAMS model, the depth of the surface interactionzone is usually regarded as a function of soil tillage,rainfall and soil texture; however, for the current calcu-lations, it has been set at 1 cm thickness, due to a lack ofany established relationships. Within this interactionzone, it is assumed that chemical extraction from the soiltakes place by water #owing over the soil surface andby a mixing of the soil material with #owing water.Chemical losses are estimated as products of averageconcentration in the soil water of the interaction zoneand the in"ltration, runo!, and evaporation volume re-spectively, with these volumes determined through pre-viously run simulations using the SOIL model. Model-ling of contaminant transport processes is con"ned tothose for slurry nitrogen and phosphorus componentsmoving from the surface pool, through the interactionzone, into deeper soil layers. No attempt has been madeat a complete description of contaminant transport pro-cesses in surface runo! #ows. Instead, the focus is on theoccurrence of runo! and hence the potential for pollutionif this occurs when the concentration of nutrients in theinteraction zone remains above a critical threshold level.
4.4. Pollution risk duration model equations
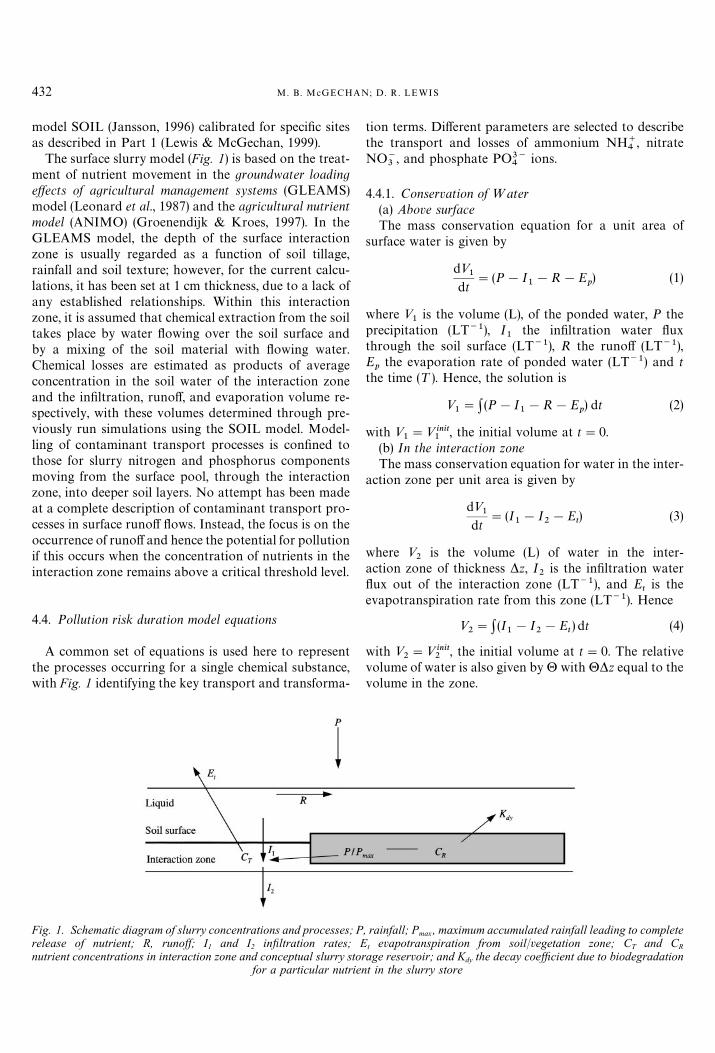
A common set of equations is used here to representthe processes occurring for a single chemical substance,with Fig. 1 identifying the key transport and transforma-
Fig. 1. Schematic diagram of slurry concentrations and processes; Prelease of nutrient; R, runow; I1 and I2 inxltration rates; Enutrient concentrations in interaction zone and conceptual slurry sto
for a particular nutrie
tion terms. Di!erent parameters are selected to describethe transport and losses of ammonium NH`
4, nitrate
NO~3
, and phosphate PO3~4
ions.
4.4.1. Conservation of =ater(a) Above surfaceThe mass conservation equation for a unit area of
surface water is given by
d<1
dt"(P!I
1!R!E
p) (1)
where <1
is the volume (L), of the ponded water, P theprecipitation (LT~1), I
1the in"ltration water #ux
through the soil surface (LT~1), R the runo! (LT~1),Ep
the evaporation rate of ponded water (LT~1) and tthe time (¹ ). Hence, the solution is
<1": (P!I
1!R!E
p) dt (2)
with <1"<init
1, the initial volume at t"0.
(b) In the interaction zoneThe mass conservation equation for water in the inter-
action zone per unit area is given by
d<1
dt"(I
1!I
2!E
t) (3)
where <2
is the volume (L) of water in the inter-action zone of thickness *z, I
2is the in"ltration water
#ux out of the interaction zone (LT~1), and Et
is theevapotranspiration rate from this zone (LT~1). Hence
<2": (I
1!I
2!E
t) dt (4)
with <2"<init
2, the initial volume at t"0. The relative
volume of water is also given by # with #*z equal to thevolume in the zone.
, rainfall; Pmax, maximum accumulated rainfall leading to completet evapotranspiration from soil/vegetation zone; CT and CR
rage reservoir; and Kdy the decay coezcient due to biodegradationnt in the slurry store
433WATERCOURSE POLLUTION DUE TO SURFACE RUNOFF
4.4.2. Nutrient release from slurry through rainfallSlurry is considered to enter an imaginary layer, in
which it is stored and released only when in"ltration orruno! occurs (Groenendijk & Kroes, 1997). The nutrientconcentration, C
R(M L~2), in this layer is reduced in
proportion to the rainfall rate and is completely releasedwhen the accumulative rainfall exceeds a given maximumvalue P
.!9(L). Simultaneously, the nutrient concentra-
tion in this store is assumed to decay in proportion to itsconcentration, giving the equation
d(CR)
dt"!
PCR
P.!9
!Kdy
CR
(5)
where the decay rate for the slurry representing bio-degredation is given by K
dy(T~1), and this term
encompasses all transformation processes such as volatil-ization, nitri"cation, denitri"cation, mineralization, etc.This equation has the simple solution
CR"Cinit
RexpC!A
P
P.!9
#KdyB tD (6)
with CR"Cinit
R, the initial concentration at t"0.
4.4.3. Dissolved concentrationThe rate of change of nutrient mass, C
T(M L~2), in the
soil surface interaction zone is given by the equation
d(CT)
dt"!C
w(I
2!I
1) (7)
where Cw
is the nutrient concentration in the solutionphase (M L~3), and I
1and I
2are water #uxes (L T~1).
Since nutrients are sorbed onto soil surfaces, the amountin solution is determined through a partition coe$cientK
dbetween the solid phase and the water phase accord-
ing to the linear adsorption isotherm
Kd"
Cs
Cw
(8)
where Cs
(M L~3) is the concentration in soil. Thispartition coe$cient is taken to be dependent upon thesoil clay fraction through the empirical expressions(Knisel, 1993)
Kd"1)34#0)083 C
ffor NH
4(9)
Kd"0 for NO
3
Kd"100#2)5 C
ffor PO
4
with Cf
the percent clay in the soil layer. Nutrients areextracted from the soil surface when overland #ow occursand by mixing of the soil material with this runo! water.In the interaction zone, extraction of nutrients is incom-plete, and the soil and water concentrations of this sur-
face layer is described by
Cs"
Cav
Kdb
1#Kdb
(10)
and
Cw"
Cav
b1#K
db
where Cav
(M L~3) is the available concentration in theinteraction zone and b is the extraction coe$cient whichhas values of (Leonard et al., 1987)
b"G0)5 K
d41)0
0)598 exp [!0)179 Kd], 1)0(K
d(10)0
0)1, Kd510)0
(11)
At saturation, the nutrient mass can be determined fromthe above equilibrium coe$cients and Eqn (7) can beintegrated to give an approximation for C
Tas
CT"C0
Texp C
!(I2!I
1)
Kd(1!/)/o
m#/D (12)
where om
and / are the soil density and porosity, res-pectively. The initial value of the total concentrationC0
Tis dependent upon the released nutrient from the
slurry pool. This equation can then be related to theavailable concentration C
avthrough
Cav"
C0T
om(1!/)
(13)
4.5. Experimental data for model calibration
Parameters of the pollution risk duration model wereestimated using data from a previous investigation (car-ried out in County Wexford, Ireland) into the e!ects ofland spreading of animal manures on surface water qual-ity. This consisted of a series of slurry spreading experi-ments with measurements at three grassland sites proneto surface runo!, during the period 1976}80 (Sherwood& Fanning, 1981; Sherwood, 1980, 1981, 1985).
The "rst set of experiments took place during1976}1979 (Sherwood, 1980, 1981), in which cattle andpig slurry were applied at three application rates at twosites (Castlebridge and Hoarstone Field), but runo! re-sults were reported in detail only for pig slurry at thehighest application rate (90 m3 ha~1) at Castlebridge.Surface runo! water was typically analysed for totalN and P concentrations and soil water analysed for NH`
4and NO~
3contents, following the slurry application.
More detailed results are reported by Sherwood andFanning (1981) from slurry applications at the same twosites on 31 January 1980, with similar volumetric applica-tion rates but with slurry of much higher dry matter

Table 1Average volume, dry matter (DM) and nutrient content of pig slurry applied at three 5eld sites in County Wexford, Ireland
Site Soil and drainage Volume, mm DM, t/ha Total N, kg/ha Total P, kg/ha
Hoarstone Moderately well-drainedloam
9)05 7)1 573 139
Burrels Field Imperfectly drained loam 7)5 6)1 432 121Castlebridge Impermeable silty-clay soil
with gleying 7)7 7)1 490 132
M. B. McGECHAN; D. R. LEWIS434
concentration at Castlebridge than at Hoarstone. Ina "nal set of experiments in October 1980 (Sherwood,1985) at the same two sites plus a third (Burrel's Field),slurry was applied at both high and low rates. Theseexperiments showed that runo! concentrations of N, andP were largest immediately after slurry application witha steady decrease with time, which was independent ofthe volume of the runo!. Volatilization of ammonia ledto a rapid disappearance of NH`
4following slurry ap-
plication with between 40 and 80% losses within 7 days.Nitrate leaching accounted for between 5 and 15% andruno! losses ranged from 10 to 15% of the total appliednitrogen. There was also evidence of modest nitri"catione!ects and rapid denitri"cation in waterlogged soils.
The most useful measurements for estimation of modelparameters (apart from the details of the applied slurrywhich are listed in Table 1) were the concentrations of thedi!erent nitrogen and phosphorus species in runo! waterat various time intervals after spreading. Unfortunately,the best time series of events is reported in terms of totalnitrogen and phosphorus in runo! for di!erent rates ofapplications (Sherwood, 1985), and so the initial fractionsof each form needed to be inferred from other datasources (Sherwood, 1980, 1981). Weather data were ob-tained from the daily weather recording station at Joh-nstown Castle, Wexford near to the experimental sites.
4.6. Model calibration
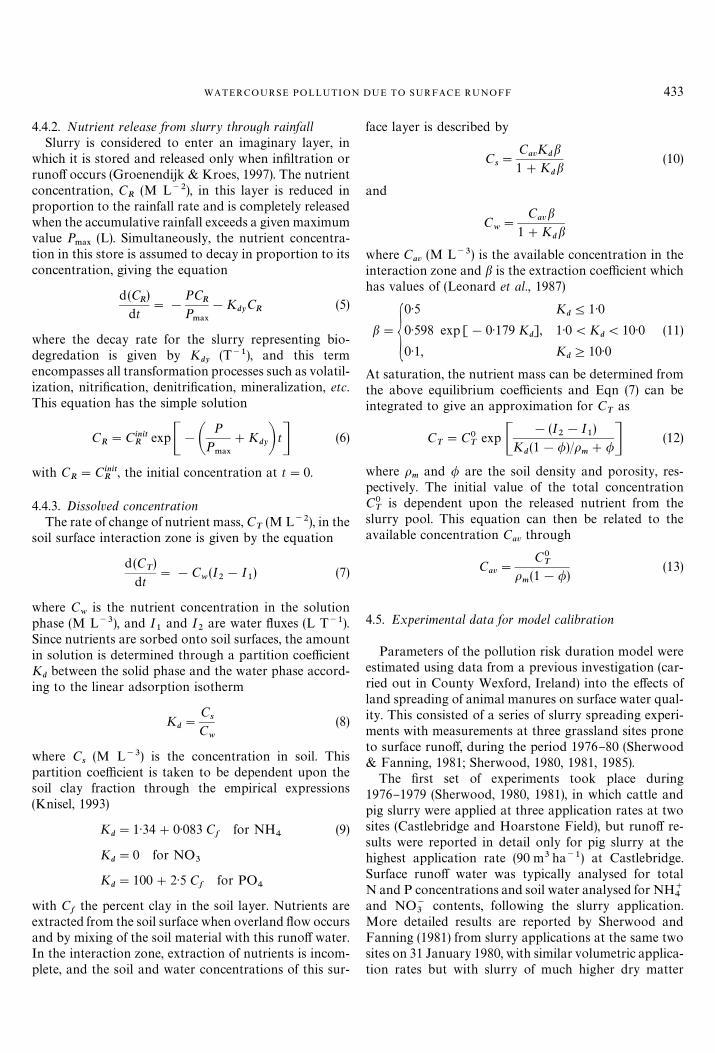
Selection of model parameters (model calibration) wascarried out on the basis of data from the above series ofexperiments. Sample plots of simulated against measuredruno! volumes and total concentrations of nitrogen andphosphorus in runo! water are shown in Figs 2 and 3.There are some discrepancies between the observed andpredicted hydrology (given by the SOIL model), butoverall the surface slurry model gives a good "t to theobserved data according to the RMS values shown Figs2 and 3. The calibrated model parameters used to "t theresults in these "gures are given in Table 2, and the valuesof these parameters can be related to the basic behaviourof the chemical substances in soils. For example, the
N species have higher decay rates than the P ion, whilegreater accumulated rainfall is required to cause theconceptual nutrient store of the P ion to be depleted withrespect to the N ions. This basic modelling approach alsoshows that the predicted runo! concentrations are moresensitive to the decay rate parameter than the incidenceof gentle rainfall (during the period between slurryspreading and the occurrence of runo! ).
4.7. ¸ength of critical period
Two possible options were considered for de"ning thelength of the critical period of potential polluting runo!,the concentration of nutrients remaining on the surface(per unit area), and the concentration of nutrients in thewater (per unit volume) in the interactive zone. Anexample of the decline of both of these concentrationsfollowing a slurry application is illustrated in Fig. 4, withvalues of the concentration in the water in the interactivezone being signi"cant only on days with rainfall. Thechoice was eventually made to de"ne the end of thecritical period as the last day on which the concentrationin the interactive zone water was above 1% of the con-centration in the applied slurry, with separate criticalperiods estimated on this basis for nitrogen and phos-phorus. Also, for nitrogen, this was de"ned in terms of thetotal NH
4plus NO
3concentration in the interactive
zone water relative to the total NH4
plus NO3
concen-tration in the applied slurry.
4.8. Accuracy required for pollution risk duration model
The decline in nitrogen and phosphorus nutrient con-centrations in both the slurry and the interaction zonewater follow a very similar pattern to those in the curvespresented by Sherwood (1992), with the concentration ofthe nitrogen components declining at a faster rate thanthe phosphorus component. This similarity is not sur-prising, since both sets of curves are derived from thesame set of experimental data. The spread in values of theconcentrations in the slurry for slurry applications on
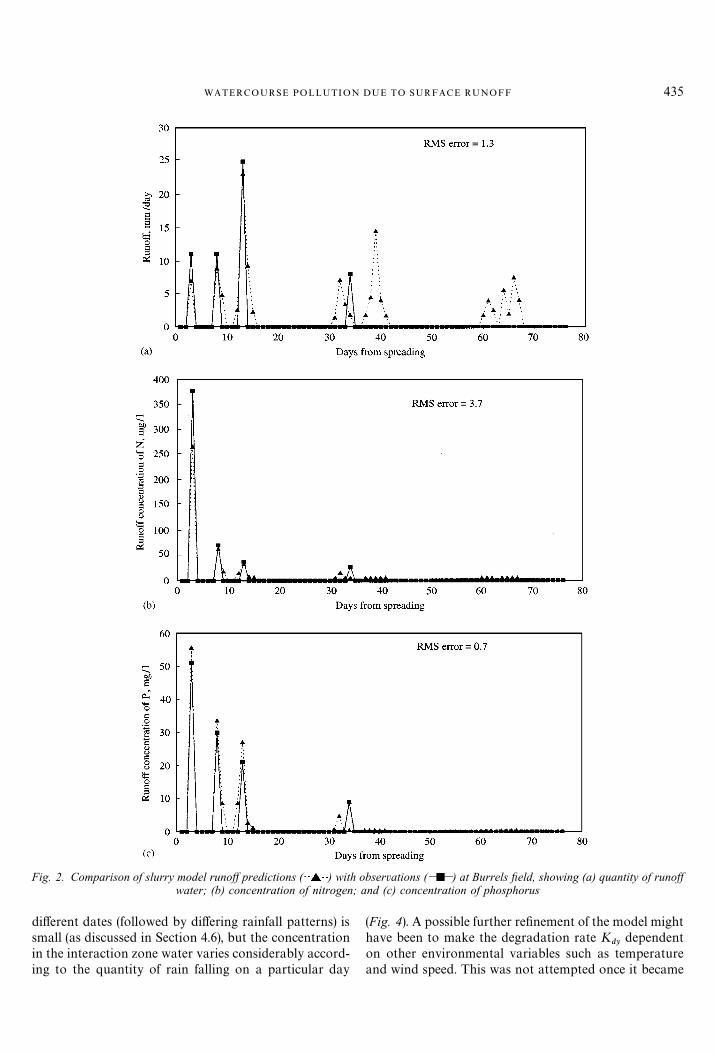
Fig. 2. Comparison of slurry model runow predictions ( ) with observations ( ) at Burrels xeld, showing (a) quantity of runowwater; (b) concentration of nitrogen; and (c) concentration of phosphorus
435WATERCOURSE POLLUTION DUE TO SURFACE RUNOFF
di!erent dates (followed by di!ering rainfall patterns) issmall (as discussed in Section 4.6), but the concentrationin the interaction zone water varies considerably accord-ing to the quantity of rain falling on a particular day
(Fig. 4). A possible further re"nement of the model mighthave been to make the degradation rate K
dydependent
on other environmental variables such as temperatureand wind speed. This was not attempted once it became

Fig. 3. Comparison of slurry model runow predictions ( ) with observations ( ) at Hoarstone xeld, showing (a) quantity ofrunow water; (b) concentration of nitrogen; and (c) concentration of phosphorus
M. B. McGECHAN; D. R. LEWIS436
clear from applying the model for risk assessments (inSection 9), that a detailed knowledge of the length of thecritical period is only relevant for a small number of soils
and sites with a narrow range of pro"le conductivityvalues. Further re"nement of the duration of runo! riskmodel was therefore considered to be a low priority.

Table 2Parameters of pollution risk duration model
Nutrient Partition coezcient (Kd) Extraction coezcient (b)Nutrient
decay rate (Kdy), 1/dCumulative rainfall
(Pmax), mm
NH4
3 0)35 0)35 200NO
30 0)5 0)3 200
PO4
15 0)1 0)15 300
Fig. 4. Decline in concentration of nutrients (nitrogen and phos-phorus) in slurry. , areal concentration of N and P in slurry;
, concentration of N and P in interaction zone water; , rainfall(all on same day); , , areal concentration of N and P inslurry on two other days. Nitrogen (top), phosphorus (centre) and
rainfall (bottom)
437WATERCOURSE POLLUTION DUE TO SURFACE RUNOFF
5. Selection of 9spreading days:
Two possible approaches to timing slurry spreading toavoid surface runo! were considered. The "rst is based ona "xed window of opportunity such as spreading only insummer (April}September). The second involves selectingspreading days, particularly in winter, based on prevailingweather and soil conditions. A range of criteria can bepostulated for determining what is a &spreading day' (orworkday) to spread with minimal environmental risk. Forthis study, the decision was made to de"ne the spreadingday criterion in terms of the following conditions:
1. no snow cover;2. ground not frozen (soil. surface temperature'3C);3. rainfall on current day below a threshold value;4. air-"lled pore space in soil pro"le above a threshold
value; and5. forecast rainfall on a set number of future days below
a threshold value.
The snow and frost constraints are speci"ed by UKenvironmental protection regulations (MAFF, 1991;SOAED, 1997). An initial threshold value of 2)5 mm fordaily rainfall on the current day was tested, such thathigher rainfall will incur a risk of runo! while rainfall atlower levels will assist the in"ltration process. Similarly,researchers in Ireland have suggested a threshold value of10 mm for the sum of forecast rainfall on the 2 daysfollowing spreading. With the current level of accuracy ofweather forecasts, forecasts of rainfall beyond 2 daysahead are so unreliable they are not worth consideringand of no value compared with assuming no knowledgeat all. Various values can be suggested for the limitingair-"lled pore space, 5, 10, 15 and 20 mm being tested inthe "rst instance.
6. Simulation of surface runo4
Weather-driven simulations were carried out usingthe SOIL model with parameter values selected as de-scribed in Part 1 (Lewis & McGechan, 1999), to indicatethe occurrence of surface runo!. The seven soil pro"les con-sidered (numbered 1}7), with the full list of parameters

Table 3Details of soil pro5les
Drainable porosity, %Proxle conductivity Air-xlled pore Air-xlled
Proxle Soil type/ (winter period), Surface layer, Lower topsoil, space at xeld pore spaceno. Location cropping regime mm/d 0}0)1 m 0)1}0)3 m capacity, mm in criterion, mm
1 Warren "eld,Wexford,Ireland
Sandy clay loam/cut grass
2)0 11)0 8)0 27)0 5
2 Cowlands,Wexford,Ireland
Sandy loam/grazed grass
0)5 9)0 8)0 25)0 10
3 Fence,Strathclyde
Sandy silt loam/grassland
0)6 12)0 11)0 35)0 5
4 Beechgrove,Bush Estate,Penicuik
Clay loam/grazed grass
8)2 14)2 7)2 28)6 15
5 GlencourseMains Farm,Penicuik
Clay loam/arable, tilled
20)0 14)7 9)0 32)7 15
6 No 3 "eld,Bush Estate,Penicuik
Sandy loam/arable, continuous
47)0 20)7 15)8 52)3 20
7 Crichton RoyalFarm,Dumfries
Silty clay loam/grassland
100)0 4)2 4)6 13)4 5
4a(Beechgrove,conductivity]0)5)
Beechgrove,Bush Estate,Penicuik
Clay loam/grazed grass
5)0 14)2 7)2 28)6 15
4b(Beechgrove,conductivity]0)75)
Beechgrove,Bush Estate,Penicuik
Clay loam/grazed grass
7)0 14)2 7)2 28)6 15
4c(Beechgrove,conductivity]1)5)
Beechgrove,Bush Estate,Penicuik
Clay loam/grazed grass
13)0 14)2 7)2 28)6 15
4d(Beechgrove,conductivity]2)0)
Beechgrove,Bush Estate,Penicuik
Clay loam/grazed grass
18)0 14)2 7)2 28)6 15
M.B
.M
cGE
CH
AN
;D
.R
.L
EW
IS438
Tab
le4
Ten
year
mea
npr
ecip
itat
ion
and
evap
otra
nspi
ration
tota
ls,th
ree
site
s
Pre
cipi
tati
on,
mm
Eva
potr
ansp
irat
ion
Gra
ss(P
rox
le3)
Bar
ley
(Prox
le4)
Win
ter
Sum
mer
Win
ter
Sum
mer
Win
ter
Sum
mer
Site
Year
s(O
ct}M
ar)
(Apr}Se
p)A
nnua
l(O
ct}M
ar)
(Apr}Se
p)A
nnua
l(O
ct}M
ar)
(Apr}Se
p)A
nnua
l
Bus
h,ne
arEdi
nbu
rgh,
Scotlan
d19
86}19
9553
9)4
407)
694
7)0
117)
630
6)8
424)
456)4
309)
036
5)4
Dum
frie
s,Sc
otlan
d19
86}19
9566
8)5
388)
210
56)7
75)4
274)
635
0)0
35)0
278)
231
3)2
Johns
tow
nC
astle,
Wex
ford
,Ir
elan
d19
80}19
8962
3)2
423)
210
46)4
81)8
324)
640
6)4
22)7
322)
234
4)9
Table 5Output parameters from SOIL model for analysis of pollution
risk duration and surface runo4
Variable no. Variable description
1 Water content in 0}0)1 m layer, %2 Water content in 0)1}0)2 m layer, %3 Water content in 0)2}0)3 m layer, %4 Depth of snow pack, mm5 Water #ow from 0}0)1 m to 0)1}0)2 m
layer, mm/d6 In"ltration through soil surface, mm/d7 Surface runo!, mm/d8 Extent of freezing in 0}0)1 m layer, fraction9 Roughness length of soil or crop surface, mm
10 Evaporation/evapotranspiration, mm/d11* Water table depth, m12* Water #ow through "eld drains, mm/d13 Precipitation, mm/d14 Air temperature, 3C15 Wind speed, m/s
*Used for checking, plotting, and estimating pro"le conduc-tivities, but not in main calculations.
439WATERCOURSE POLLUTION DUE TO SURFACE RUNOFF
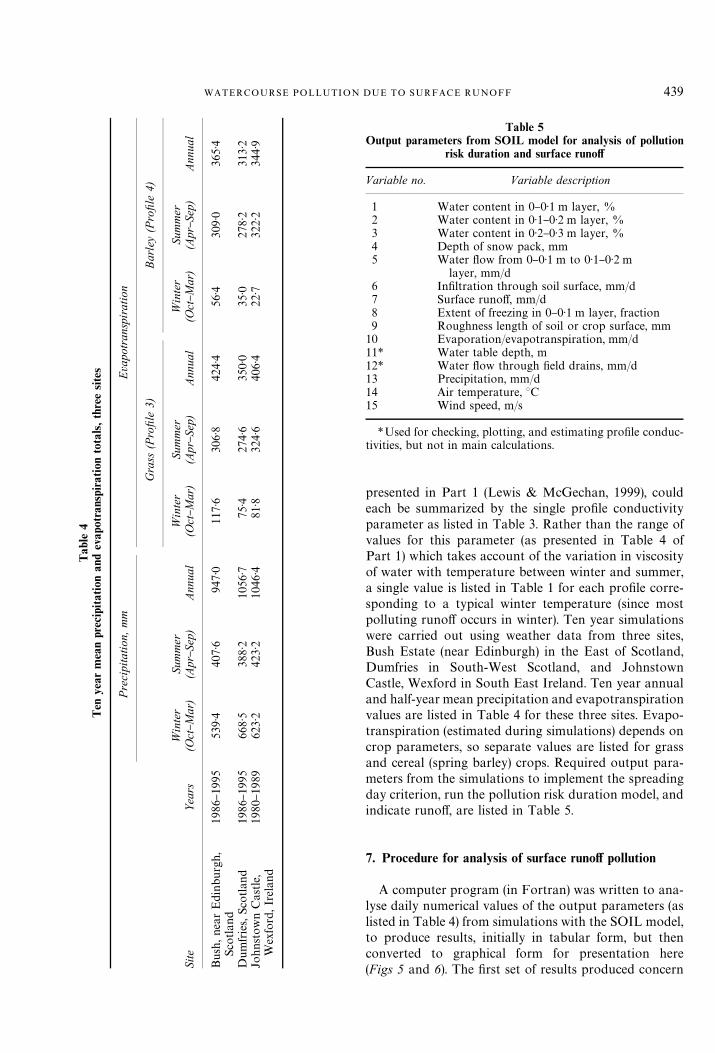
presented in Part 1 (Lewis & McGechan, 1999), couldeach be summarized by the single pro"le conductivityparameter as listed in Table 3. Rather than the range ofvalues for this parameter (as presented in Table 4 ofPart 1) which takes account of the variation in viscosityof water with temperature between winter and summer,a single value is listed in Table 1 for each pro"le corre-sponding to a typical winter temperature (since mostpolluting runo! occurs in winter). Ten year simulationswere carried out using weather data from three sites,Bush Estate (near Edinburgh) in the East of Scotland,Dumfries in South-West Scotland, and JohnstownCastle, Wexford in South East Ireland. Ten year annualand half-year mean precipitation and evapotranspirationvalues are listed in Table 4 for these three sites. Evapo-transpiration (estimated during simulations) depends oncrop parameters, so separate values are listed for grassand cereal (spring barley) crops. Required output para-meters from the simulations to implement the spreadingday criterion, run the pollution risk duration model, andindicate runo!, are listed in Table 5.
7. Procedure for analysis of surface runo4 pollution
A computer program (in Fortran) was written to ana-lyse daily numerical values of the output parameters (aslisted in Table 4) from simulations with the SOIL model,to produce results, initially in tabular form, but thenconverted to graphical form for presentation here(Figs 5 and 6). The "rst set of results produced concern
M.B
.M
cGE
CH
AN
;D
.R
.L
EW
IS440

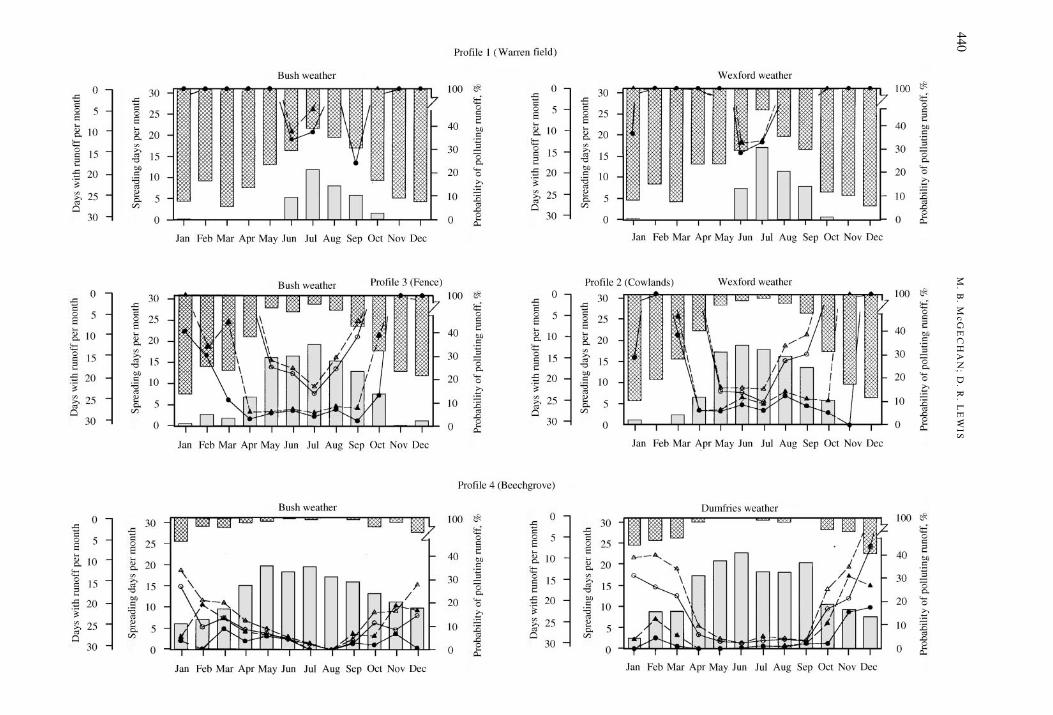
Fig. 5. Spreading days, days with runow, and probability of pollution due to runow, for six proxles and three weather sites, mean of 10 years. , number of spreading days;, days with runow; , probability of N pollution as a %, spreading on selected spreading days only; , probability of P pollution as a %, spreading on selected spreading
days only; , probability of N pollution as a %, spreading any day; , probability of P pollution as a %, spreading any day. Not shown~ results for Proxle 6 (Bush No.3)which are similar (for all weather sites) to those shown for Proxle 7 (Crichton) with Dumfries weather
441W
AT
ER
CO
UR
SE
PO
LL
UT
ION
DU
ET
OSU
RF
AC
ER
UN
OF
F

Fig. 6. Spreading days and probability of pollution due to runow, for Proxles 3 and 4, Bush weather data, mean of 10 years., spreading days with weather forecast condition in criterion; , additional spreading days without weather forecast condition in
criterion; , probability of N pollution as a %, with weather forecast condition in spreading day criterion; , probability ofP pollution as a %, with weather forecast condition in spreading day criterion; , probability of N pollution as a %, without weatherforecast condition in spreading day criterion; , probability of P pollution as a %, without weather forecast condition in spreading
day criterion.
M. B. McGECHAN; D. R. LEWIS442
the number of spreading days according to the chosencriterion, both with and without the forecast weathercondition. Next, the consequences of slurry spreading oneach day in each of ten years were considered, by runningthe pollution risk duration model starting with the initialvalues of the slurry component parameters on each dayand running it for 30 subsequent days. For each start day,the day on which N and P components dropped belowcertain critical levels was noted, and the probability (over
10 years) of surface runo! occurring before each compo-nent had dropped below its critical value was estimated.
The probability of polluting runo! is zero only whereno surface runo! at all takes place. However, where onlyoccasional runo! occurs, the probability of pollutingruno! can be low, and an arbitrary choice had to bemade about what level of probability can be consideredto be acceptable. For the decision support system basedon the results of this study (Perros, 1998), the chosen
443WATERCOURSE POLLUTION DUE TO SURFACE RUNOFF
values of the maximum probabilities of pollution were10% for nitrogen components of slurry, and 20% forphosphorus components.
8. Observations and results of simulations, and analysisof simulated output
8.1. Choice of air-,lled pore space in spreading daycriterion
A choice had to be made of the value of the limitingair-"lled pore space in the spreading day criterion, asdescribed in Section 5. Initially, the e!ect of selecting 5,10, 15 and 20 mm was tested for each pro"le. It was foundthat there was a maximum value, above which zero orvery low numbers of spreading days were indicated. Thismaximum value was around 40% of the air-"lled porespace at "eld capacity (assumed to be at 5 kPa soil watertension), although this relationship was not very exact(Table 1). There was a de"nite trend towards a low value(5 mm) where the air-"lled pore space at "eld capacity (orthe drainable porosity) of the pro"le was low, as illus-trated by the Crichton grass pro"le which has a very #atwater release curve. It is therefore important to identifypro"les with such a low drainable porosity and select thelowest option for the air-"lled pore space limit in suchcases.
8.2. Numbers of spreading days
Ten year average monthly numbers of spreading daysaccording to the chosen criterion are presented for eachsoil pro"le and two out of the three weather sites inFig. 5. If the weather forecast condition is omitted fromthe criterion, numbers of spreading days are increasedvery slightly in each case, as shown (for two pro"les) inFig. 6.
Results show a trend amongst the pro"les, with anincrease in numbers of spreading days as the pro"leconductivity increases. The one exception to this trend isWarren "eld (Pro"le 1) which has fewer spreading daysthan Cowlands or Fence (Pro"les 2 and 3) despite havinga higher pro"le conductivity. This is due to incomingwater from a spring which occurs at the Warren "eldalone amongst the pro"les, as discussed in Part 1 (Lewis& McGechan, 1999). There is almost no variation inaverage annual spreading day numbers between weathersites, with small, random variations (with no consistenttrend) for individual months. As expected, spreading daynumbers are higher in summer than winter, with a pro-gressive reduction towards the middle of winter andlowest numbers in January.
For speci"c pro"les, there are almost no spreadingdays at all in winter months for Warren "eld (Pro"le 1),which has a high water table for long periods so the air-"lled pore space condition in the spreading day criterionis not met. For Cowlands and Fence (Pro"les 2 and 3),spreading day numbers are very low in winter, 10 yearaverages below 3)0 in November, December, January andFebruary and some individual years with no spreadingdays at all during these months. This would create asituation where a strategic planning decision to spread inthese months cannot be justi"ed. For Beechgrove (Pro"le4), there are adequate spreading days in every month atthe Bush and Wexford weather sites, the lowest numbersaround 5}7 in January and February. However, with thehighest rainfall site at Dumfries, spreading day numbersdrop below the acceptable level (10 year average around3 with none in some years) in January only, with ad-equate spreading days in all other months. Spreading daynumbers are adequate, the lowest being around 10 inJanuary, for Crichton (Pro"le 7) and both arable pro"les(Pro"les 5 and 6). Many of the non-spreading days inJanuary and the other winter months for Pro"les 5}7arise due to the snow and frost conditions in the criterion.
8.3. Occurrence of runo+
Sample plots of surface runo! over time are shown inFig. 7, and 10 year average numbers of days with runo!per month are presented in Fig. 5. There is almost con-tinuous runo! in winter for Warren "eld (Pro"le 1), andfrequent occurrences of runo! in winter for Cowlandsand Fence (Pro"les 2 and 3). There are some runo!events for Beechgrove (Pro"le 4), occasional occurrencesfor Glencorse (Pro"le 5), and (with one exception) noruno! at all for Bush No. 3 (Pro"le 6) and Crichton(Pro"le 7). The one exception arises with the Crichtonpro"le where there is occasional runo! with Wexfordweather only, mainly arising in connection with snowcover and frozen ground during exceptionally coldweather in December 1981. Similar low temperaturesoccurred in December 1981 at the Scottish sites but withless snow so no runo! occurred with this pro"le. Thegeneral progression amongst pro"les is as would be ex-pected from their conductivities, except there is moreruno! with the Warren "eld pro"le than the Fence pro-"le due to the spring in the Warren "eld, as discussed inSection 8.2. Also, runo! for the Crichton pro"le andWexford weather under low-temperature conditions, butnot with the same weather and Bush No. 3 which hasa lower pro"le conductivity, may arise because the Crich-ton pro"le has a very low drainable porosity (as dis-cussed in Section 8.1).

Fig. 7. Sample plots of surface runow and yows through xelddrains in relation to water table depth, from simulations with SOILmodel. , surface runow in mm/d and water table depth in m;
, yow through xeld drains in mm/d
M. B. McGECHAN; D. R. LEWIS444
8.4. Probability of pollution due to runo+
Ten year monthly percentage probabilities of pollutingruno! (for N and P) are presented in Figs 5 and 6. Whencalculating these probabilities, a runo! event is assumedto pollute if the potency of the slurry component (N or P),as given by the pollution risk duration model, has notdropped below its critical level by the time runo! occurs.
Results show a trend amongst the pro"les, with a de-crease in probability as the pro"le conductivity increases,except there is a higher probability with the Warren "eld(Pro"le 1) than Cowlands or Fence (Pro"les 2 and 3) dueto the spring in the Warren "eld, as discussed in Section8.2. There is very little variation in average annual pro-babilities between weather sites, and larger di!erences invalues for individual months between sites show no con-sistent trend.
Since spreading day numbers in winter months forPro"les 1, 2 and 3 are either zero or very low, meaningfulprobabilities can only be calculated assuming spreadingany day (i.e. ignoring the spreading day criterion), andthese are very high (typically over 90 and often 100%).For Warren "eld (Pro"le 1), probabilities are well abovethe acceptable levels even for spreading on summer dayswhich do meet the spreading day criterion. For Cow-lands and Fence (Pro"les 2 and 3), probabilities arebelow the acceptable limits (10% for N and 20% for P) inthe summer months (April}September) if spreading isrestricted to days which meet the spreading day criterion,for all these months with Bush weather, for most monthswith Dumfries weather, and some months with Wexfordweather. If the spreading day criterion is not adhered toin these months, probabilities are nearly always abovethe acceptable limits although not near 100%. ForBeechgrove (Pro"le 4), probabilities in winter months(December}March) are within the acceptable limits if
spreading is restricted to days which meet the spreadingday criterion, for all these months with Bush weather andmost months for Dumfries or Wexford weather. Ifspreading is carried out any day without regard forwhether the spreading day criterion is met, probabilitiesare higher, usually above the limits, and sometimes veryhigh. For Glencorse (Pro"le 5) in winter months, pro-babilities are low, well below the acceptable limits re-gardless of whether spreading is restricted to days whichmeet the spreading day criterion, but are reduced slightlyin most months if the criterion is adhered to. Probabili-ties are zero in summer months for Pro"le 5 and in allmonths for Pro"les 6 and 7, with the exception of Pro"le 7and Wexford weather where non-zero values in Novem-ber, December and January are well below the limits.
Overall, restricting spreading to days which meet thespreading day criterion is bene"cial only for spreading insummer months for Cowlands and Fence (Pro"les 2 and 3)and for spreading in winter months for Beechgrove (Pro-"le 4). In these months, probabilities are usually reducedslightly if the weather forecast condition is included in thespreading day criterion compared to leaving it out, but ina few months the reverse is the case (Fig. 6).
Each &forecast' of rainfall based on historical weatherdata used in this study was 100% accurate, which is notthe situation with a real weather forecast. Probabilities ofruno! based on real (imperfect knowledge) weather fore-casts would have been in between those based on perfectknowledge and those ignoring the forecast altogether. Inthe "gures presented here, the two sets of calculatedprobabilities are so similar that this further distinctionwould make very little di!erence.
9. Range of 5elds showing major bene5ts fromspreading day criterion
Out of the "ve pro"les tested, only Pro"le 4 showedsigni"cant bene"t from selecting days with conditionssuitable for spreading slurry in winter, the period of theyear when the main environmental problem of slurryruno! pollution occurs. This pro"le has an intermediatevalue of the pro"le conductivity parameter, and it wouldbe helpful to know what range of values of this parameterlead to such bene"ts of selecting spreading days. Ideally,parameters should be measured for further pro"les inthe hope of "nding ones with conductivities at the upperand lower limits to which this situation applies. Thisapproach was not pursued, as it would have requireda further large programme of measurements, with noguarantee that any of the selected pro"les would have theappropriate limiting conductivity values. As an alterna-tive, a &&sensitivity analysis'' approach was adopted byadjusting the soil matrix and macropore saturated
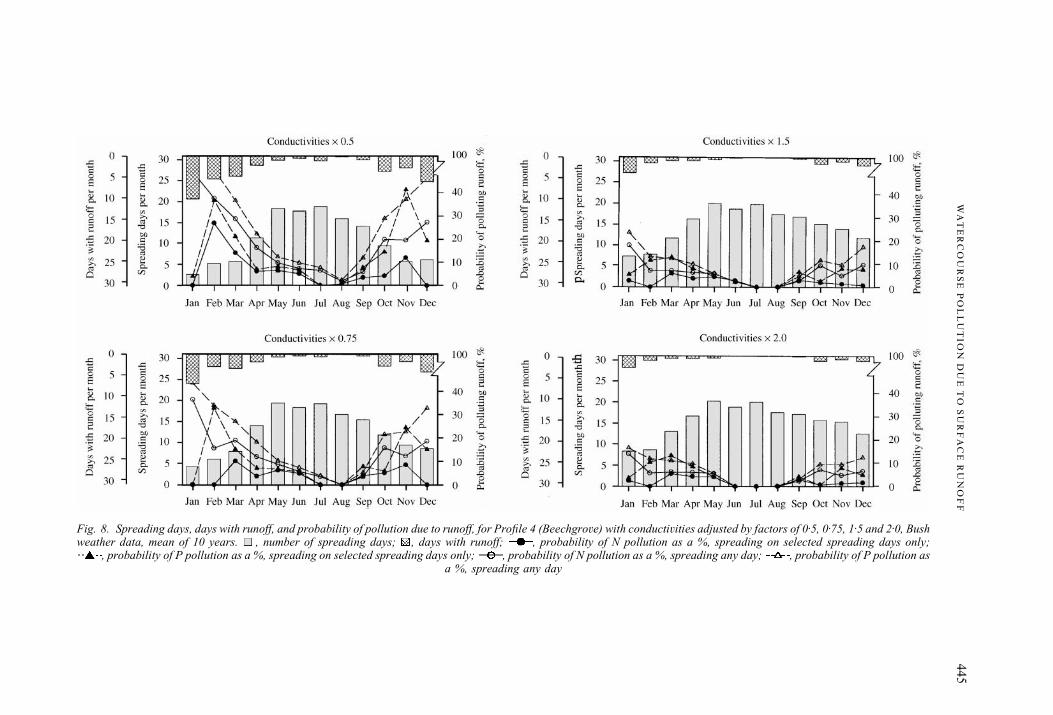
Fig. 8. Spreading days, days with runow, and probability of pollution due to runow, for Proxle 4 (Beechgrove) with conductivities adjusted by factors of 0)5, 0)75, 1)5 and 2)0, Bushweather data, mean of 10 years. , number of spreading days; , days with runow; , probability of N pollution as a %, spreading on selected spreading days only;
, probability of P pollution as a %, spreading on selected spreading days only; , probability of N pollution as a %, spreading any day; , probability of P pollution asa %, spreading any day
445W
AT
ER
CO
UR
SE
PO
LL
UT
ION
DU
ET
OSU
RF
AC
ER
UN
OF
F
M. B. McGECHAN; D. R. LEWIS446
conductivity values by factors of 0)5, 0)75, 1)5 and 2)0, tocreate four new ("ctitious) sets of pro"le parametersidenti"ed as Pro"les 4a, 4b, 4c and 4d, respectively(Fig. 8).
Results showed a bene"t from selecting spreading daysin winter with Pro"les 4b, 4c and 4d (Fig. 8), in additionto Pro"le 4. Pro"le 4a gave unacceptably high levels ofprobability of polluting runo! in winter (similar to Pro-"les 2 and 3). Pro"le 4d only just showed a bene"t fromselecting spreading days in winter, such that any furtherincrease in conductivity would have given acceptableprobabilities regardless of when spreading was carriedout (similar to Pro"le 5). Comparing with pro"le con-ductivities listed in Table 3, this suggests a range ofconductivities (given by Pro"les 4b, 4, 4c and 4d) ofapproximately 7}18 mmd~1 for which selecting spread-ing days for winter spreading is bene"cial. It is also onlyfor pro"les with this range of conductivities that detailed,weather-related variations in the decline of the pollutionpotential of slurry nutrient components (rather than theaverage decline due to microbial degradation) wouldhave a signi"cant e!ect on the results, as discussed inSection 4.8.
10. Surface runo4 due to snow cover or frozen soil
Inspection of plots of all the simulated runo! events(such as shown in Fig. 7) indicated that runo! due tosnow cover or frozen soil occurred only for the combina-tion of the Crichton pro"le (Pro"le 7) and Wexfordweather, and most particularly during very low temper-atures in December 1981 as discussed in Section 8.3. Allother runo! events in the simulations could be attributedto heavy or prolonged rainfall leading to the water tablerising to the surface.
Inclusion of the condition in the regulations prohibit-ing slurry spreading on frozen soil was controversialwhen the Code of Practice (SOAEFD, 1997) was beingdrawn up, since farmers traditionally often carry outwinter tractor operations on hard frozen soil. Suchoperations are feasible on high water content soil if it isfrozen, whereas tractability problems would occur if itwere unfrozen.
Simulations with early versions of the SOIL modelindicated surface runo! whenever snow or freezing con-ditions occurred. More recently, StaK hli and Jansson(1996) have carried out a detailed study of water move-ment in frozen and snow-covered soil. They observedthat water in frozen soil typically consists of a mixture ofimmobile ice and mobile liquid water. They implementedan optional new feature in the latest version of SOIL witha two-component representation of soil water underfreezing conditions, an immobile ice component and
a mobile liquid water component. In the current study, itwas decided to carry out simulations with this new op-tion switched on, since the modi"cation to the model hadbeen extensively tested and validated with "eld data inSweden (StaK hli & Jansson, 1996). Using this option, re-sults suggest that surface runo! takes place with non-runo!-susceptible pro"les only with a combination ofvery low temperatures (causing freezing to some depth)and heavy snowfall, and may also be con"ned to pro"leswith a low drainable porosity. These results suggest thatthe condition prohibiting slurry spreading under freezingsoil conditions might be relaxed for non-runo! suscep-tible "elds under certain circumstances, possibly onlyif the soil has a high drainable porosity (and then only ifthe runo! susceptibility and the drainable porosity ofa "eld is known).
11. Conclusions and recommendations regarding decisionsupport
The results of this study show that by far the mostimportant decision about slurry spreading concerns se-lection of "elds inherently suitable for spreading. Theanalysis presented here indicates that "elds can be cat-egorized as follows regarding surface runo! :
(1) Totally unsuitable for slurry spreading, runo! pollu-tion risk unacceptably high in both summer andwinter, or unsuitable because of proximity to openwatercourses, water sources, houses, etc., liable to#ood, or newly drained, moled, subsoiled or cracked.
(2) Totally unsuitable for slurry spreading in winter butacceptable risk in summer, with a clear weather win-dow (the summer, e.g. April}September) de"ned atthe strategic planning stage, during which spreadingdays need to be selected according to the criterion tokeep pollution risk from runo! at an acceptable level.
(3) Suitable for spreading in summer and winter, butspreading days need to be selected according to thecriterion in winter to keep pollution risk from runo!at an acceptable level, for soils/sites with a fairlynarrow range of pro"le conductivity of about 7}18mm/day.
(4) Suitable in summer and winter, with very occasional(and randomly/unpredictably occurring) runo!, pol-lution at acceptable level if slurry spread any day, butpollution risk reduced very slightly if spreading daysselected according to criterion.
(5) Suitable at all times without causing runo! pollution,as surface runo! never occurs.
Decisions about timing of spreading are relativelyless important than those about selecting "elds. For "elds
447WATERCOURSE POLLUTION DUE TO SURFACE RUNOFF
suitable for spreading in summer but not winter (cat-egory 2 above), the timing decision concerns both selec-tion of the weather window, in this case roughly1 April}30 September, and selection of days with suitableconditions within this window. The most complex timingdecision concerns "elds in category 3 which have valuesof the pro"le conductivity parameter in a fairly narrowintermediate range. In this case, careful selection ofspreading days in winter is important to avoid runo!pollution. However, the inclusion of a weather forecastcondition in the spreading day selection criterion is ofvery small bene"t compared to missing it out. The samedecision about selecting spreading days can be applied to"elds in category 4, but the bene"t in reducing pollutionis very small. There are no relevant timing decisionsregarding "elds in categories 1 or 5.
Results also suggest that the condition in the currentcode of practice, prohibiting slurry spreading underfreezing soil conditions, might be relaxed for "elds incategory 5, provided it can be shown that the soil doesnot have a low drainable porosity.
Acknowledgements
This research was supported by funds from the Scot-tish O$ce Agriculture, Environment and Fisheries De-partment, and also from the European Union under theproject &Optimal use of animal slurry for input reductionand protection of the environment in sustainable agricul-tural systems' (SWAMP). The authors also wish to thankto Professor P.-E. Jansson and colleagues of the Depart-ment of Soil Sciences, The Swedish University of Agricul-tural Sciences, Uppsala, for assistance with using theSOIL model, and partners in the SWAMP project forvaluable comments.
References
Ashraf M S; Borah D K (1992). Modelling pollutant transportin runo! and sediment. Transactions of the ASAE, 35,1789}1797
Baily G W; Swank R R Jr; Nicholson H P (1974). Predictingpesticide runo! from agricultural land: a conceptual model.Journal of Environmental Quality, 6, 159}162
Groenendijk P; Kroes J G (1997). Modelling the nitrogen andphosphorus leaching to groundwater and surface water;
ANIMO 3.5. Wageningen, DLO Winand Staring Centre.Report 144
Jansson P E (1996). Simulation model for soil water and heatconditions. Report 165 (revised edition), Department of SoilSciences, Swedish University of Agricultural Sciences,Uppsala. 82 pp
Johnsson H; Jansson P E (1991). Water balance and soil moist-ure dynamics of "eld plots with barley and grass ley. Journalof Hydrology, 129, 149}173
Knisel W G (ed) (1993). GLEAMS Version 2.1. University ofGeorgia, Coastal Plain Experimental Station, Tifton, GA.UGA-CPES-BAED Publication No. 5
Leonard R A; Knisel W G; Still D A (1987). GLEAMS: ground-water loading e!ects of agricultural management systems.Transactions of the ASAE, 30, 1403}1418
Lewis D R; McGechan M B (1999). Watercourse pollution dueto surface runo! following slurry spreading, part 1: calib-ration of the soil water simulation model SOIL for "eldsprone to surface runo!. Journal of Agricultural EngineeringResearch, 72, 275}290
MAFF (1991). Code of Good Agricultural Practice for theProtection of Water. Publication PB0617, Ministry of Agri-culture, Fisheries and Food, London
McGechan M B; Graham R; Vinten A J A; Douglas J T; HoodaP S (1997). Parameter selection and testing the soil watermodel SOIL. Journal of Hydrology, 195, 312}334
McGechan M B; Wu L (1996). Modelling pollutant transportprocesses following the land spreading of wastes. Paper 96E-004, AgEng International Conference, Madrid
Perros Y (1998). SWAMP - ADS Software Description, Users'Manual. Algosystems S. A., Athens
Sherwood M (1980). The e!ect of landspreading of animal ma-nures on water quality. In: E%uents from Livestock (GasserJ K R ed), Applied Science Publishers, London, pp 379}390
Sherwood M (1981). Fate of nitrogen applied to grassland inanimal wastes. Proceedings of XIV International GrasslandCongress, Lexington, Kentucky, USA, pp 347}350
Sherwood M (1985). Loss of nutrients in surface runo! fromgrassland treated with pig slurry. Proceedings of the XV Inter-national Grassland Congress, Kyoto, Japan, pp 1207}1209
Sherwood M (1992). Weather, soils and pollution from agricul-ture. AGMET Group, Dublin
Sherwood M; Fanning A (1981). Nutrient content of surfacerun-o! water from land treated with animal wastes. In: Ni-trogen losses and surface runo! (Brogan J C ed), pp 379}390.EEC, Brussels-Luxembourg
SOAEFD (1997). Prevention of Environmental Pollution fromAgricultural Activity, Code of Good Practice. The ScottishO$ce Agriculture, Environment and Fisheries Department,Edinburgh
StaK hli H; Jansson P-E (1996). Preferential water #ow in a frozensoil * a two-domain model approach. HydrologicalProcesses, 10, 1305}1316
Wang Y; Edwards D R; Daniel T C; Scott H D (1996). Simula-tion of runo! transport of animal manure constituents.Transactions of the ASAE, 39, 1367}1378