water well and septic system survey report
TRANSCRIPT
4418 November 13, 2002 Mr. Derek Ali, MBA., P.Eng., Associate Director Water and Waste Water Engineering The Regional Municipality of Niagra Public Works Department Niagara Region Environmental Centre 3501 Schmon Parkway PO Box 1042 Thorold, Ontario L2V 4T7 Re: Wainfleet Groundwater Impact Assessment - Water Well and Septic System
Survey – Final Report The Regional Municipality of Niagara
Dear Mr. Ali:
We are pleased to provide you with the final copy of the Wainfleet Groundwater Impact Assessment -Water Well and Septic Survey report, prepared in support of the Water and Wastewater Servicing Strategy for the Township of Wainfleet. If you have any questions, please do not hesitate to contact Muin Husain at (905) 475-7270 ext. 276.
Yours truly, MacViro Consultants Inc.
Eric A. D. MacDonald, M.Sc., P.Eng. President & CEO
Muin Husain, Ph.D, P.Geo. Project Manager
/SD Enclosure

Wainfleet Groundwater Impact Assessment - Water Well and Septic System Survey
4418 ES-1
Executive Summary A hydrogeological study was carried out to assess potential human health and safety concerns associated with existing private water and wastewater services in the community of Belleview Beach, Morgan’s Point and Camelot Beach within the Township of Wainfleet. The study consisted of an assessment of the local geology, hydrogeology and land use information along with a detailed survey of 128 residences for well water quality and septic systems.
The detailed water well and sewage system survey found that 30% of homes had e.coli exceedences, 52% of homes had total coliform exceedences and 7% of homes had nitrate exceedences compared to the Ontario Drinking Water Protection Regulation (ODWPR). Problems with water quantities were minimal. The survey also found that 40% of homes had septic systems greater than 20 years of age, 44% did not meet the legal setback requirements between wells and septics and 29% were not adequately maintained. This study also showed that a significant portion of the area can be defined as sensitive due to the presence of fractured bedrock aquifers close to the surface. The very thin overburden provides little or no attenuation to septic effluent being discharged from individual septic systems. As the bedrock serves as a water supply aquifer, the potential for contamination of drinking water supply is high. The substantial number of problems found during the water supply and sewage disposal component of the survey confirms a significant impact on local water supplies resulting from private individual sewage disposal systems.
Specifically, local groundwater resources are at high risk of contamination from nitrate and other sewage effluent contaminants (including bacteria and other pathogens). In addition, it was found that phosphate loading and pathogen contamination, resulting from groundwater contamination by septic systems is a threat to the natural environment of Lake Erie.
Wainfleet Groundwater Impact Assessment - Water Well and Septic System Survey
4418 i
Table of Contents Transmittal Letter Executive Summary Table of Contents
1. Introduction ....................................................................................................................1-1
1.1 Background.........................................................................................................................1-1 1.2 Scope..................................................................................................................................1-1
2. Methodology....................................................................................................................2-1
2.1 Inventory of Land Use Information .....................................................................................2-1 2.2 Description of Topography and Local Surface Water Features .............................................2-1 2.3 Characterization of the Hydrogeological Setting..................................................................2-1
2.3.1 Description of Local Geology................................................................................................ 2-1 2.3.2 Description of the Regional and Local Hydrogeology ............................................................ 2-2
2.4 Private Well and Septic Survey ...........................................................................................2-2 2.4.1 Survey Protocol .................................................................................................................... 2-3 2.4.2 Well Use and Construction Documentation............................................................................ 2-3 2.4.3 Water Quality Sampling Protocol .......................................................................................... 2-3 2.4.4 Septic System Evaluation ...................................................................................................... 2-5 2.4.5 Data Management and Notification ....................................................................................... 2-5
2.5 Groundwater Impact Assessment.........................................................................................2-6 2.6 Assessment of Impact to Lake Erie......................................................................................2-6
3. Characterization of Local Features................................................................................3-1
3.1 Land Use ............................................................................................................................3-1 3.2 Physiography and Topography ............................................................................................3-1 3.3 Local Drainage and Surface Water Features ........................................................................3-2
3.3.1 Surface Water Quality........................................................................................................... 3-2 3.4 Geology and Hydrogeology.................................................................................................3-2
3.4.1 Geology................................................................................................................................ 3-2 3.4.2 Hydrogeology ....................................................................................................................... 3-3
4. Water Well and Septic Survey .......................................................................................4-1
4.1 Water Wells Survey ............................................................................................................4-1 4.1.1 Water Supply and Quantity ................................................................................................... 4-1 4.1.2 Treatment Systems................................................................................................................ 4-2 4.1.3 Water Quality Results ........................................................................................................... 4-3
4.2 Septic System Survey..........................................................................................................4-7 4.2.1 Septic Construction ............................................................................................................... 4-7 4.2.2 Age....................................................................................................................................... 4-8 4.2.3 Setback Distances ................................................................................................................. 4-9 4.2.4 Maintenance ......................................................................................................................... 4-9
4.3 Summary of Findings ........................................................................................................4-10
5. Impact Assessments ........................................................................................................5-1
5.1 Water Supply Impact Assessment........................................................................................5-1 5.1.1 Hydrogeological Considerations............................................................................................ 5-1

Wainfleet Groundwater Impact Assessment - Water Well and Septic System Survey Table of Contents
4418 ii
5.1.2 Estimate of Contaminant Loading on Shallow Groundwater System ..................................... 5-1 5.2 Impact Assessment on Lake Erie.........................................................................................5-2
6. Conclusions .....................................................................................................................6-1
7. References .......................................................................................................................7-1
Figures
Figure 1 – Study Area Figure 2 – Residential Densities Figure 3 - Bedrock Geology Figure 4 – Quaternary Geology Figure 5 – MOE Water Well Records and Cross-Section Locations Figure 6 – Cross Section A-A’ Figure 7 – Cross Section B-B’ Figure 8 – Cross Section C-C’ Figure 9 – Cross Section D-D’ Figure 10 – Locations of Well and Septic Surveys Figure 11 – Survey Lot Size Distribution Figure 12 – Well Type Figure 13 – Treatment Systems Figure 14 – E.coli Findings Figure 15 - Total Coliform Findings Figure 16 – Nitrate Findings Figure 17 – Septic Systems vs. Holding Tanks Figure 18 – Septic System Ages Figure 19 – Setback Findings Figure 20 – Pump Out Frequencies Figure 21 – Distribution of E.Coli Exceedences Figure 22 – Distribution of Total Coliform Exceedences Figure 23 – Distribution of Nitrate Exceedences
Appendices
Appendix A – Well and Septic System Survey Protocols
Appendix B – Well and Septic Survey Summary and Results
Appendix C – Laboratory Records
Appendix D – Nutrient Impact Assessment Calculations
Wainfleet Groundwater Impact Assessment - Water Well and Septic System Survey
4418 1-1
1. Introduction
1.1 Background
The Regional Municipality of Niagara is currently in the process of developing a water and/or wastewater servicing strategy for the Township of Wainfleet. A key component of designing a water and wastewater servicing strategy is to assess the current status of the existing water and wastewater systems in order to determine their performance in protecting the health and safety of the public and the environment. Currently, private homes and other premises within the Township of Wainfleet are serviced by individual on-site water wells and septic systems, with the exception of Long Beach. In the Long Beach area, drinking water is provided through a privately owned communal water supply system while sewage disposal is serviced by individual on-site septic systems. Individual on-site septic systems that are not functioning adequately pose a risk to public health and safety through contamination of groundwater used as drinking water supply. In addition, improperly functioning septic system causes the discharge of inadequately treated sewage effluent to ground surface through break outs or shallow groundwater discharges and can cause adverse environmental effects through excessive nutrient loading to surface water features such as lakes and rivers. To assess the threat to drinking water supply and public health, a Sanitary Survey was conducted by the Public Health Department of the Region of Niagara in the Long Beach area in 2001. The survey identified public health concerns with the existing sewage disposal systems. In addition, the survey concluded that the majority of the existing sewage disposal systems were malfunctioning, causing a potential impact to public health and safety and the environment. As a result of this survey, concerns were raised by the Region regarding the status of the potable groundwater quality, environmental degradation and the effectiveness of the water and waste water systems in communities of a similar nature within the Township of Wainfleet. The communities of particular interest were located along Lake Erie in areas identified as Belleview Beach, Morgan’s Point and Camelot Beach, since they support the majority of the population in the Township of Wainfleet and are of a similar nature to the community of Long Beach. To address these concerns, the Region of Niagara retained MacViro Consultants Inc. (MacViro) to undertake a study to identify and assess the potential impacts of the existing private water and sewage systems on the health and safety of the public and the environment. The study includes the lakeshore communities of Belleview Beach, Morgan’s Point and Camelot Beach.
1.2 Scope
The scope of this study therefore involves gathering and assessing information to determine the potential impacts to public health and safety and the environment resulting from the use of individual private wells and septic systems in the communities of Belleview Beach, Morgan’s Point and Camelot Beach. Specifically, the issues of public health and safety are addressed by:
Wainfleet Groundwater Impact Assessment - Water Well and Septic System Survey Introduction
4418 1-2
• Determining if the groundwater, which acts as the potable water supply source in the study area, is contaminated based on the occurrence of development related contaminants including bacteria, ammonia, nitrates, nitrite, phosphate and chloride; and
• Determining if a significant number of individual septic systems are contaminating
surface and/or groundwater. This study encompasses a review and assessment of information gathered from existing reports, mapping information, MOE water well records, available climatic data and land use planning documents. Furthermore, a field survey of 128 properties was conducted in order to determine well water quality, well construction and use and septic system type and condition.

Wainfleet Groundwater Impact Assessment - Water Well and Septic System Survey
4418 2-1
2. Methodology The following methodology was used in this study.
2.1 Inventory of Land Use Information
A study area encompassing Belleview Beach, Morgan’s Point and Camelot Beach and surrounding areas was chosen. A background study of existing relevant reports, publications, topography maps and base maps, land use plans, Ministry of Environment (MOE) water well records, and air photos were conducted in order to characterize land use and the nature of development within the Wainfleet study area.
2.2 Description of Topography and Local Surface Water Features
The topography and local surface water features were examined using 1:50 000 scale topographical maps and 1:10,000 scale OBM mapping.. Climatic conditions in the area were also assessed using available data from the Ministry of Environment and Environment Canada.
2.3 Characterization of the Hydrogeological Setting
Local subsurface conditions were characterized in order to:
� Identify the major aquifer and aquitards in the area;
� Determine the susceptibility of the major water supply aquifers to contamination; and
� Identify groundwater flowpaths and potential contaminant receptors.
2.3.1 Description of Local Geology
The following information about the study area was collected and reviewed:
• Surficial (Quaternary) Geological Maps;
• Topographical Maps (1:50 000);
• Ontario Base Mapping (1:10 000);
• The Physiography of Southern Ontario, L.J. Chapman and D.F. Putnam, 1984;
• Published Water Well Logs (Ministry of the Environment).
• Existing technical reports regarding groundwater resources in the Wainfleet area, as identified in the References section of this report.
The above information was reviewed and geological cross sections were generated to understand the geological and hydrogeological setting of the study area. Based on the cross sections, significant geological units were characterized in terms of their genesis, texture, composition, thickness, and continuity. The characterization also included a description of surficial geology.
Wainfleet Groundwater Impact Assessment - Water Well and Septic System Survey Methodology
4418 2-2
2.3.2 Description of the Regional and Local Hydrogeology
The collected geological information was used in conjunction with water level data gathered from the water well records and information obtained from field work to classify the geological units as aquifer or aquitard, and to develop a conceptual hydrostratigraphic model of the study area.
2.4 Private Well and Septic Survey
A private well and septic system survey was carried out in the communities of Belleview Beach, Morgan’s Point and Camelot Beach. In order to obtain a representative sample of local residential developments, a survey of 128 homes based on lot size and location was carried out. Based on discussions with the Public Health Department, lots less than 10,000 square feet in size were of primary concern, as well as lots in older, high density areas close to the shoreline, since the majority of the Township’s population resides in these areas. Proximity to the shoreline was also considered important as the scope of this study includes the evaluation of potential impacts on Lake Erie near-shore areas. Lots surveyed were chosen taking these discussions into consideration. In addition, they were chosen to ensure that the survey provided a representative cross-section of the density, geological conditions and land coverage across all three communities. Although the entire study area captured 1804 parcels of land, the three communities of interest (Belleview Beach, Morgan’s Point and Camelot Beach), and the remaining developed shoreline areas outside these communities, have an estimated coverage of 913 lots. As the survey was designed based on all of these considerations, a sample size of 128 was considered representative of the study area.
The private water well component of the survey was undertaken to assess existing groundwater quality and the condition of existing wells. The wells were also assessed to determine if they were properly constructed and maintained in accordance with MOE Regulation 903. Untreated water samples and treated samples, where applicable, were taken at each surveyed residence and analysed for total coliform, e.coli, ammonia, pH and anions (nitrates, nitrites, chloride, bromine, fluoride, phosphates and sulphates). In total 64 homes had only untreated samples taken, 41 homes had only treated samples (i.e. samples that had gone through a treatment system installed in the home) taken and 23 homes had both treated and untreated water samples taken. Generally, a sample of treated water only was taken where it was not possible to by-pass the treatment system, and/or where the treatment did not involve disinfection.
The septic system component of the survey documented the design, construction and existing condition of individual septic systems by taking into account applicable MOE regulations and guidelines, as well as, the age and frequency of system maintenance.
A Global Positioning System (GPS) unit was used to obtain the latitude and longitude readings of visible wells, buried wells and representative areas of sites where the location of the well was unknown.
A sample copy of the well and septic system survey documentation and questionnaire sheet is presented in Appendix A.
Wainfleet Groundwater Impact Assessment - Water Well and Septic System Survey Methodology
4418 2-3
2.4.1 Survey Protocol
Prior to undertaking the survey, the Region of Niagara delivered a notification letter to approximately 160 property owners in the study area. The letter informed the residents of the proposed survey and invited all interested parties to contact the Region if they were interested in participating in the study. A sample copy of this letter is presented in Appendix A. A total of 28 property owners responded to the notice. Of these, 20 were interested in participating in the survey.
MacViro contacted the interested property owner at each property in advance of the survey and made appointments to visit the home. Where possible, the appointment was scheduled at least two days in advance of the sampling event to allow the property owner enough time to accommodate MacViro's visit.
If MacViro field staff encountered set backs during the sampling day, the property owner was notified of any appointment delays. In the event that a property owner could not fulfil his/her appointment, the field staff attempted to accommodate the time change within the same day. However, if changes could not be made during the same day, an alternate appointment was scheduled.
Where appointments could not be made in advance, because of no response to the Region’s notification letter, MacViro staff contacted residents in the field by visiting door-to-door and presenting the Region’s notification letter and MacViro identification. If the resident was interested, and relied on groundwater for water supply and/or sewage disposal, a detailed survey was carried out.
2.4.2 Well Use and Construction Documentation
Property owners were interviewed as per the “Well and Septic Survey” Survey Sheet questionnaire shown in Appendix A. Wells were inspected for construction details and if accessible, water level and well depth were measured using an electronic measuring device. The device was cleaned and disinfected between each use.
2.4.3 Water Quality Sampling Protocol
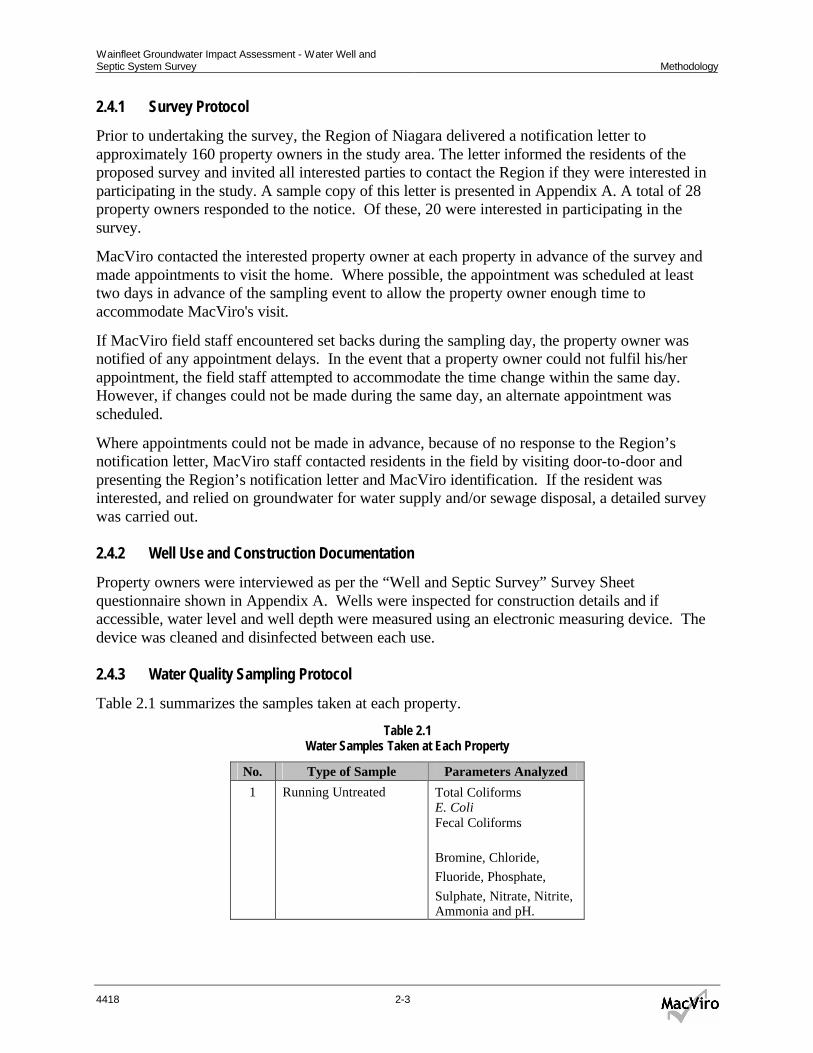
Table 2.1 summarizes the samples taken at each property.
Table 2.1 Water Samples Taken at Each Property
No. Type of Sample Parameters Analyzed
1 Running Untreated Total Coliforms E. Coli Fecal Coliforms Bromine, Chloride, Fluoride, Phosphate, Sulphate, Nitrate, Nitrite, Ammonia and pH.
Wainfleet Groundwater Impact Assessment - Water Well and Septic System Survey Methodology
4418 2-4
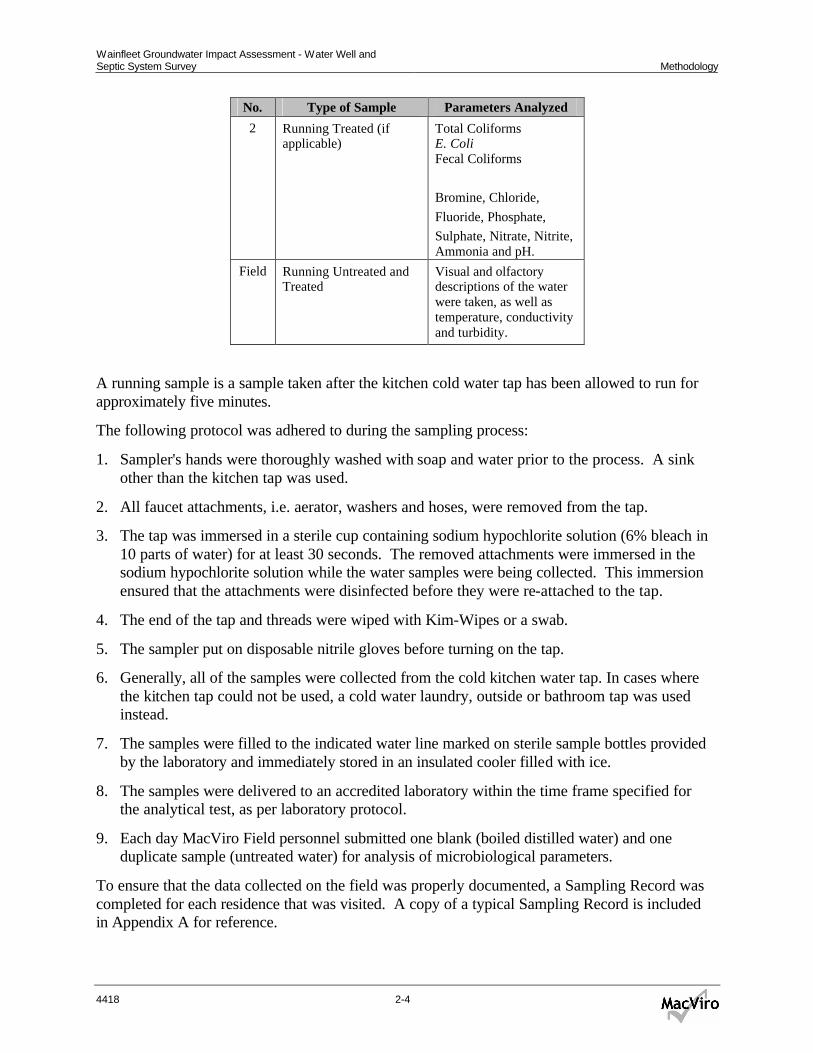
No. Type of Sample Parameters Analyzed
2 Running Treated (if applicable)
Total Coliforms E. Coli Fecal Coliforms
Bromine, Chloride, Fluoride, Phosphate, Sulphate, Nitrate, Nitrite, Ammonia and pH.
Field Running Untreated and Treated
Visual and olfactory descriptions of the water were taken, as well as temperature, conductivity and turbidity.
A running sample is a sample taken after the kitchen cold water tap has been allowed to run for approximately five minutes.
The following protocol was adhered to during the sampling process:
1. Sampler's hands were thoroughly washed with soap and water prior to the process. A sink other than the kitchen tap was used.
2. All faucet attachments, i.e. aerator, washers and hoses, were removed from the tap.
3. The tap was immersed in a sterile cup containing sodium hypochlorite solution (6% bleach in 10 parts of water) for at least 30 seconds. The removed attachments were immersed in the sodium hypochlorite solution while the water samples were being collected. This immersion ensured that the attachments were disinfected before they were re-attached to the tap.
4. The end of the tap and threads were wiped with Kim-Wipes or a swab.
5. The sampler put on disposable nitrile gloves before turning on the tap.
6. Generally, all of the samples were collected from the cold kitchen water tap. In cases where the kitchen tap could not be used, a cold water laundry, outside or bathroom tap was used instead.
7. The samples were filled to the indicated water line marked on sterile sample bottles provided by the laboratory and immediately stored in an insulated cooler filled with ice.
8. The samples were delivered to an accredited laboratory within the time frame specified for the analytical test, as per laboratory protocol.
9. Each day MacViro Field personnel submitted one blank (boiled distilled water) and one duplicate sample (untreated water) for analysis of microbiological parameters.
To ensure that the data collected on the field was properly documented, a Sampling Record was completed for each residence that was visited. A copy of a typical Sampling Record is included in Appendix A for reference.

Wainfleet Groundwater Impact Assessment - Water Well and Septic System Survey Methodology
4418 2-5
2.4.3.1 Analytical Laboratories
For this project, MacViro used PSC Analytical Services to conduct the analysis for ammonia, pH and anions (nitrates, nitrites, chloride, bromine, fluoride, phosphates and sulphates) and MDS Environmental for the microbiological analysis. Both are CAEAL accredited laboratories located in southern Ontario.
2.4.4 Septic System Evaluation
Septic system owners were interviewed as per the “Well and Septic Survey” Survey Sheet questionnaire (Appendix A). The septic system was inspected for construction details, overall condition and the accessibility of the system. Setback distances from wells, buildings and surface water bodies were also measured.
2.4.5 Data Management and Notification
2.4.5.1 General
As the surveys were completed and laboratory results were received, the information was entered into a master database, which classified each property by its address. The database enabled MacViro staff to track the survey results, as well as the status and accuracy (through duplicate and blank analyses) of analytical results reported by the laboratories. The database was maintained regularly.
In general, MacViro received the microbiological test results from the water sampling within two to three business days after the laboratory received the water samples. The water chemistry test results were generally received five to seven business days following the submission of samples. All analytical results were faxed to MacViro's office.
2.4.5.2 Exceedance Notification
Laboratory results were compared against the Ontario Drinking Water Protection Regulation (ODWPR). Any health-related exceedances, microbiological or anionic, were immediately reported to the resident by telephone where possible. The telephone call was followed up by a letter, which was mailed within 24 hours of receiving the results, to the mailing address supplied by the resident during the field survey. Copies of the letter were immediately faxed to the Niagara Region Public Health Unit and the Regional Municipality of Niagara Project Manager.
2.4.5.3 Quality Assurance/Quality Control
A quality assurance and quality control (QA/QC) program was implemented to address both the office and field programs. All project documentation was maintained and controlled under each specific site file with a unique site file identifier.
A QA/QC co-ordinator was assigned to the project to ensure that all samples had the proper field identification and sample location. The QA/QC co-ordinator also completed the chain of custody forms, releasing selected samples to the laboratory for analysis. All samples were submitted for laboratory analysis. A chain of custody form accompanied the samples at all points of handling. Samples were preserved until delivered to Philip Analytical Services Inc., Mississauga, Ontario and MDS Laboratory, London for laboratory analysis.

Wainfleet Groundwater Impact Assessment - Water Well and Septic System Survey Methodology
4418 2-6
The MDS QA/QC tests conducted by the project laboratory consisted of:
§ process blanks, in which a sample known to be free of contaminants is analyzed to identify any ambient or background concentrations;
§ process percent recoveries, in which a blank water sample, spiked with a known concentration of an analyte, is analyzed and the measured concentration is compared to the spiked concentration (percent recovery reported);
§ matrix spikes, in which a sample, spiked with a known concentration of an analyte, is analyzed to determine whether the matrix (water) is biasing the results; and
§ laboratory replicates of samples to measure reproducibility of results.
Travel blanks and one duplicate sample accompanied each day’s sampling event, in which water samples were shipped to MDS for bacteriological testing. Each of the blanks was tested and no bacteria were detected. Duplicate results were within acceptable limits.
2.5 Groundwater Impact Assessment
A groundwater impact assessment was then conducted to determine the potential extent of contamination of local water supply aquifers. The assessment was undertaken by analysing the hydrogeological characteristics of the study area, climatic conditions, land use, and the results of the individual well and septic system survey. The MOE guidelines “Technical Guideline for Individual On-Site Sewage Systems: Water Quality Impact Risk Assessment” and “Technical Guideline for Private Wells: Water Supply Assessment” were used for direction in assessing the potential impacts to groundwater. Although these guidelines were published for proposed developments on individual private services, they provide some MOE direction in assessing contaminant attenuation of effluent from existing private sewage systems.
2.6 Assessment of Impact to Lake Erie
A critical assessment was then conducted to determine the extent of contamination discharging to Lake Erie. The evaluation included a mass balance assessment to determine nutrient/contaminant loading on shallow aquifers discharging to Lake Erie, as well as a comparison with the preliminary results of a near shore survey conducted in August 2002 by the Ministry of Environment. The full MOE study was not completed at the time this report was prepared.

Wainfleet Groundwater Impact Assessment - Water Well and Septic System Survey
4418 3-1
3. Characterization of Local Features
3.1 Land Use
The study area is shown in Figure 1. Within the study area, land use is primarily rural residential, with minimal commercial or industrial use. The majority of land, except for the developed areas, is designated rural and agricultural.
The residential development is a mix of privately serviced seasonal and permanent residences, which are primarily concentrated along the shores of Lake Erie. In total, there are 1804 lots in the overall study area. However, the main focus of this study was on development along the shoreline, primarily in the communities of Belleview Beach, Camelot Beach and Morgan’s Point, which has 913 lots. Current estimates provided by the Township of Wainfleet showed that 60% of the residences are seasonal, where homes are occupied for less than nine months of the year, and 40% are considered as permanent. The trend in recent years, as estimated by the Township, is the transition of seasonal residences into permanent homes, with the distribution moving towards 50% permanent.
Average residential densities in the area of study are shown in Figure 2. The number of lots were counted, based on Terranet mapping provided by the Region of Niagara and divided by the area covered by residential development (see Appendix D). The average lot size of developments in the vicinity of Lake Erie was calculated as 0.189 ha (20,301 ft2). However, lot sizes varied greatly, ranging from less than 0.093 ha (10,000 ft2) to well above the average. Gross density of the residential area was calculated as 5.1 lots/ha, excluding rural development. Strip density was found to range between 1.2 lots/ha to 17.4 lots/ha.
As there are no municipal water or waste water services in the area, homes use water wells, beach (lake) wells, cisterns or lake water for drinking water. Various classes of sewage systems were also identified in the area.
3.2 Physiography and Topography
The study area is located in the Haldimand Clay Plain physiographic region, as described by Chapman and Putnam, 1984. Soils in this region tend to be heavy textured and poorly drained. The Onondaga Escarpment lies to the northeast and northwest of the site and controls drainage in the Niagara area. A low saddle appears in the brow of the Escarpment, between Port Maitland and Port Colborne, in the vicinity of the study area (MNDM, 1991) (See Figure 3). Significant areas of exposed bedrock with a thin veneer of glaciolacustrine sediments are found in this area. Morainic hills are also present in the area to the north of Morgan’s Point and Crystal Beach, representing thicker units of overburden in the area.
Generally, topographic relief is low, with elevations around Belleview Beach and Camelot Beach varying between 176.5 masl and 180 masl, from north of the railway line to Lake Erie. However, at the vicinity of Morgan’s Point topographic highs of 190 masl are found in the central inland portion of the point, sloping to approximately 178 masl along the south shoreline, as well as to the west, north and east.

Wainfleet Groundwater Impact Assessment - Water Well and Septic System Survey Characterization of Local Features
4418 3-2
3.3 Local Drainage and Surface Water Features
Lake Erie is the major surface water feature in the Township of Wainfleet. The shoreline of the Lake is low and appears to be controlled by the bedrock surface, which, together with the morainic hills found in the vicinity, form headlands in the area (Chapman and Putnam, 1984). Few streams flow southward from the Onondoga Escarpment to drain the area, the most notable being the Casey Drain west of Belleview Beach. Wetland areas are found to the northeast of Camelot Beach.
The long-term mean annual precipitation for this area is 938 mm/yr, while average annual evapotranspiration is 525 mm/yr (Gartner Lee, 1987), resulting in a water surplus of 413 mm/yr. The water surplus is allocated between infiltration to shallow and deep aquifers and runoff.
3.3.1 Surface Water Quality
Surface water quality in Lake Erie along the shoreline has been poor in recent years, with several occurrences of elevated e.coli (in excess of 100 cfu/100 ml) reported by Niagara Public Health, as well as aesthetic fouling by algae (MOE, 2002).
Surface water quality in near shore areas of Lake Erie immediately to the west of the study area was surveyed by the Ministry of Environment (MOE) in August of 2002 during the same time period that the well and septic system survey was conducted for this study.
The survey found that the average pH was measured at 8.5 and alkalinity was 95 mg/l CaCO3. Average ammonium, nitrite and nitrate values were 0.03 mg/l, 0.0056 mg/l, and 0.325 mg/l respectively. Average phosphate was 2.59 µg/l and total phophorous was 25 µg/l, with a high of 105 µg/l . Finally, average e.coli measured was 355 cfu/100 ml, confirming that water quality in near-shore areas of Lake Erie is poor as compared to the Provincial Water Quality Objectives.
3.4 Geology and Hydrogeology
3.4.1 Geology
In the study area, the overburden thickness ranges between 0 meters to over 35 meters and is comprised of glaciolacustrine deposits consisting predominantly of silts and clay. Minor beach sand and gravel deposits are found along the shoreline of the study area (See Figure 4). The bedrock, exposed at surface in the vicinity of Morgan’s Point and in the western and northern portions of Camelot Beach and Belleview Beach, is comprised of cherty limestone and sandstone of the Onondaga and Bois Blanc Formations (Feenstra, 1984).
As a part of the study, MOE water well records were used to construct stratigrahic cross-sections (AA’ to DD’), as shown in Figures 5 to 9. The cross-sections show varying thicknesses of silts and clay across the study area, with minor sand deposits in the vicinity of the Wainfleet Moriane. The bedrock surface is irregular, with an elevation high in the Morgan’s Point area.
Wainfleet Groundwater Impact Assessment - Water Well and Septic System Survey Characterization of Local Features
4418 3-3
3.4.2 Hydrogeology
The MOE water well records were used to obtain information on the hydrogeological characteristics of the study area. Geological cross-sections prepared from the MOE water well records show the existence of one prominent aquifer unit, a confined to partially unconfined bedrock aquifer system which serves as the primary water supply source for homes in the area. Static water levels vary between 3 and 15 meters below ground surface, depending on location. A small number of wells are completed into a minor overburden aquifer, which appears only in areas where sand deposits are present, such as in the vicinity of the Wainfleet Moraine.
Groundwater flow direction is generally toward Lake Erie, however a groundwater divide is present close to the northern boundary of the general study area in the vicinity of the CNR railway line. A groundwater high is also found on Morgan’s Point, with radial groundwater flow appearing to follow topography.
Based on current MOE guidelines, significant portions of the study area would be defined as hydrogeologically sensitive, due to the presence of fractured bedrock close to surface with areas of thin soil cover. As such, the MOE would not normally support individually serviced developments in these areas (MOE, 1996).

Wainfleet Groundwater Impact Assessment - Water Well and Septic System Survey
4418 4-1
4. Water Well and Septic Survey A water well and septic system survey was carried out to determine the current status of well water supplies and septic systems in Belleview Beach, Morgan’s Point and Camelot Beach. The survey took place between August 20, 2002 and September 11, 2002.
Over 200 homes were visited door to door, and of those, a total of 165 homeowners were willing to participate in the study. Of these, 21 used cisterns and 16 used beach wells, which take water directly from Lake Erie, for water supply and as such did not meet the survey criteria. The remaining 128 homes were considered suitable for the complete water well and septic survey inspection due to their reliance on groundwater for both water supply and sewage disposal. The locations of these homes are shown in Figure 10.
The homes surveyed represented a variety of lot sizes. The distributions of lot sizes encountered during the survey are provided in Figure 11.
4.1 Water Wells Survey
Appendix B contains the completed survey information sheets for all residences evaluated
4.1.1 Water Supply and Quantity
The survey found that there were various types of water supply systems in use in the study area including cisterns, beach wells, dug wells, bored wells and drilled wells. . Se homes also obtain water directly from Lake Erie. The findings on the types of water supply systems in use at the 165 properties visited are presented below in Figure 12.
Figure 12 - Water Supply Systems
Dug Well5%
Drilled Well68%
Beach Well3%
Other 22%
Unknown2%

Wainfleet Groundwater Impact Assessment - Water Well and Septic System Survey Water Well and Septic Survey
4418 4-2
Water Supply Type Number of Homes Number of Homes with Quality Problems
Number of Homes with Quantity
Problems
Dug Well 9 5 2
Bored Well 0 N/A 0
Drilled Well 111 68 12
Beach Well 5 1 2
Other (beach wells not surveyed, cistern, etc.)
37 N/A N/A
Unknown 3 N/A N/A
N/A – not applicable
Drilled wells are constructed with rotary or cable tool drilling machines and have small diameter casings. They can be shallow or deep and can also be installed in bedrock, which is likely why the majority of wells in the study area are drilled. Dug wells are usually constructed using a backhoe or by hand and have large diameter casings. They are common in shallow overburden aquifers. Both drilled wells and dug wells had a similar percentage (>50%) of quality problems.
Almost all wells reported good water quantity. Due to the hydrogeological characteristics of the area, i.e. fractured limestone and the positioning of wells in a regional discharge zone, water quantity problems are not expected. It was found that only 16 wells reported water quantity problems, all to varying degrees. Of these, 12 were drilled wells, two were dug wells and two were beach wells.
4.1.2 Treatment Systems
A total of 76% of the 128 homes surveyed in detail had some form of treatment systems installed. Treatment systems included water softeners, sediment filtration, iron filtration, UV treatment, reverse osmosis and chlorinationThe distribution of treatment system types is illustrated in Figure 13 below:
Wainfleet Groundwater Impact Assessment - Water Well and Septic System Survey Water Well and Septic Survey
4418 4-3
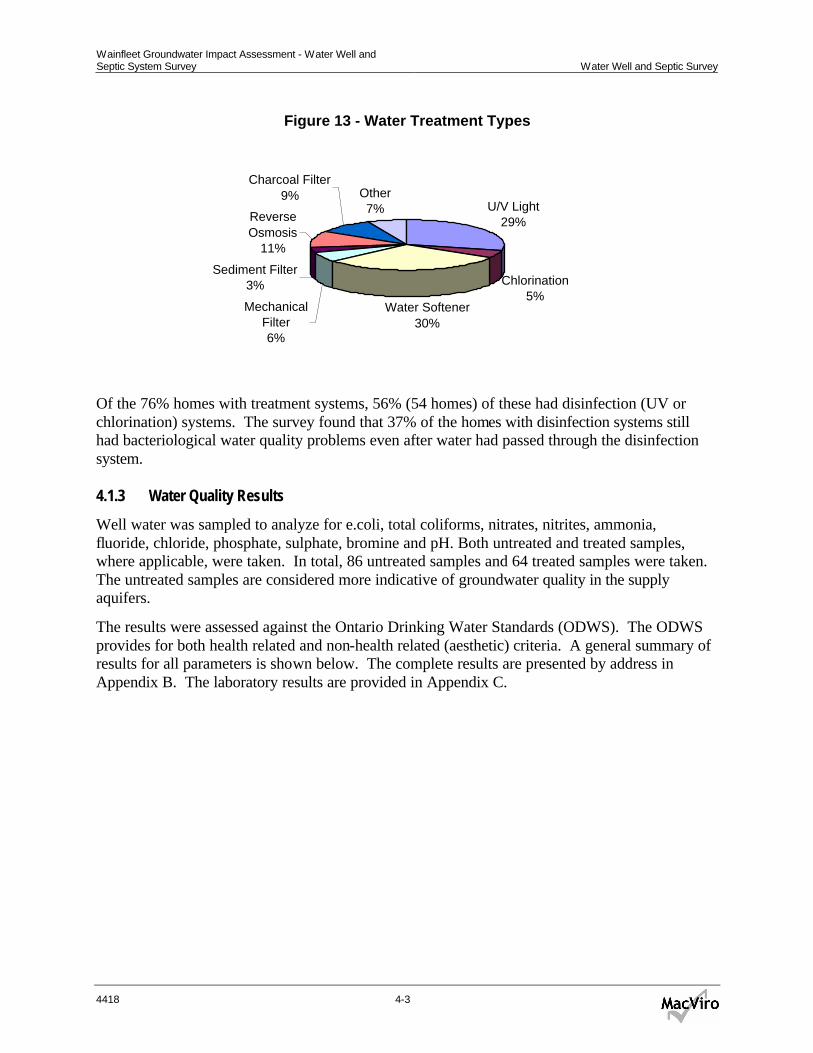
Figure 13 - Water Treatment Types
U/V Light29%
Chlorination5%
Water Softener30%
Mechanical Filter6%
Sediment Filter3%
Reverse Osmosis
11%
Charcoal Filter9% Other
7%
Of the 76% homes with treatment systems, 56% (54 homes) of these had disinfection (UV or chlorination) systems. The survey found that 37% of the homes with disinfection systems still had bacteriological water quality problems even after water had passed through the disinfection system.
4.1.3 Water Quality Results
Well water was sampled to analyze for e.coli, total coliforms, nitrates, nitrites, ammonia, fluoride, chloride, phosphate, sulphate, bromine and pH. Both untreated and treated samples, where applicable, were taken. In total, 86 untreated samples and 64 treated samples were taken. The untreated samples are considered more indicative of groundwater quality in the supply aquifers.
The results were assessed against the Ontario Drinking Water Standards (ODWS). The ODWS provides for both health related and non-health related (aesthetic) criteria. A general summary of results for all parameters is shown below. The complete results are presented by address in Appendix B. The laboratory results are provided in Appendix C.

Wainfleet Groundwater Impact Assessment - Water Well and Septic System Survey Water Well and Septic Survey
4418 4-4
Untreated Water Samples Treated Water Samples Parameter
Maximum Minimum Average Maximum Minimum Average E.coli (cfu/100 ml)
40000 0 660 650 0 13
Total Coliform (cfu/100 ml)
600000 0 10489 3100 0 74
PH
8.10 7.29 7.72 8.14 7.2 7.6
Fluoride (mg/L)
1.5 0.1
0.38 1.6 0.1 0.31
Chloride (mg/L)
382 5.6 70.5 1120 2 126
Nitrite (mg/L)
<0.2 <0.2 <0.2 0.3 <0.2 0.26
Bromide (mg/L)
4
<0.5 <0.5 <0.05 <0.05 <0.05
Nitrate (mg/L)
21.0 <0.2 2.6 44 0.2 4.7
Phosphate (mg/L)
1.0 <1 <1 <1 <1 <1
Sulphate (mg/L)
652 14.8 82.5 360 0.6 96.4
Ammonia (mg/L)
1.31 <0.03 0.12 7.71 <0.03 0.36
4.1.3.1 Health Related Parameters
The five health-related parameters analysed as part of this study were e.coli, total coliforms, nitrates, nitrites and fluoride
E. Coli
The result distribution for e.coli is provided in Figure 14 below.
Figure 14: Ecoli Concentrations for Untreated Samples
(cfu/100ml)
063%
1 to 10 16%
11 to 10014%
101 to 1000 5%
>1000 2%

Wainfleet Groundwater Impact Assessment - Water Well and Septic System Survey Water Well and Septic Survey
4418 4-5
The ODWS for e.coli is 0 cfu/100 ml. It was found that 37% of the untreated water samples taken had e.coli present at varying levels. However, when taking into account all 128 households, (as not all households were sampled for untreated water), 30% of the homes had e.coli exceedences. The maximum e.coli value measured was 40000 cfu/100ml.
Total Coliform
The results of the total coliform analysis on untreated water supply systems are provided in Figure 15 below:
The ODWS for total coliform is 0 cfu/100 ml. It was found that 66% of the untreated water samples taken had total coliform present at varying levels. Taking all 128 homes sampled into account, , 52% of homes had total coliform exceedences. The maximum total coliform value measured was 600000 cfu/100 ml.
Figure 15: Total Coliform Concentrations for Untreated Samples (cfu/100ml)
034%
1 to 10 9%
11 to 10020%
101 to 1000 22%
>1000 15%
Wainfleet Groundwater Impact Assessment - Water Well and Septic System Survey Water Well and Septic Survey
4418 4-6
Nitrate
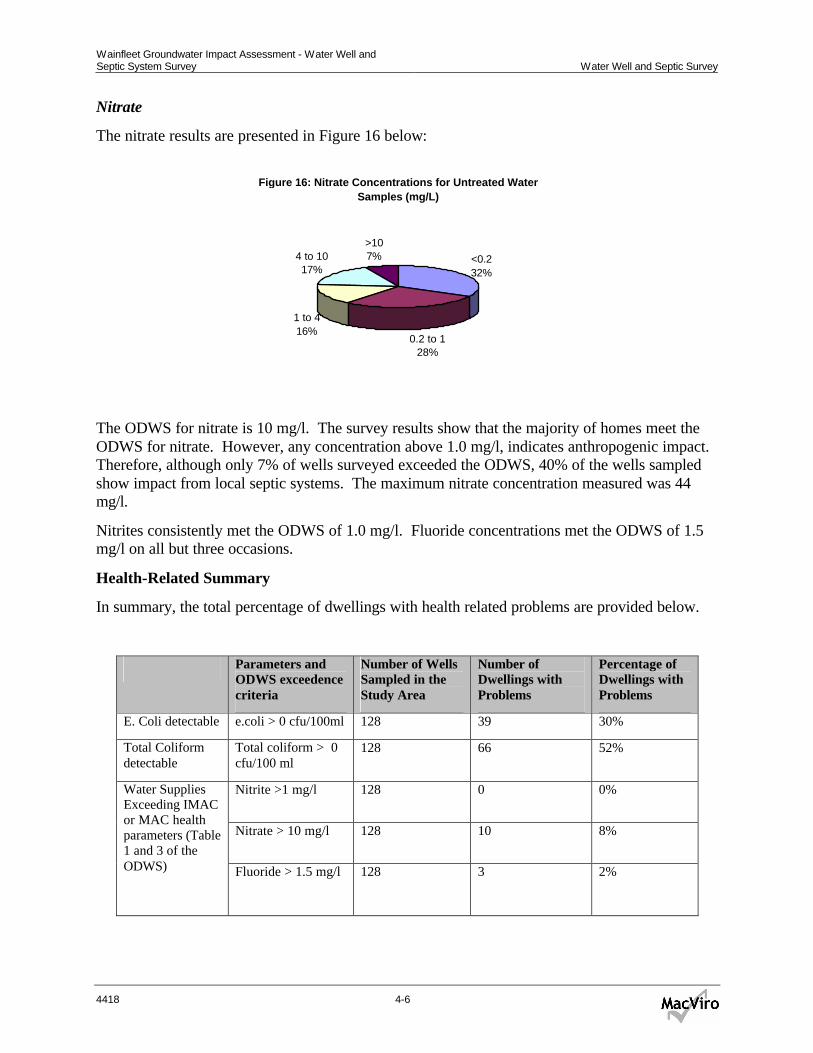
The nitrate results are presented in Figure 16 below:
The ODWS for nitrate is 10 mg/l. The survey results show that the majority of homes meet the ODWS for nitrate. However, any concentration above 1.0 mg/l, indicates anthropogenic impact. Therefore, although only 7% of wells surveyed exceeded the ODWS, 40% of the wells sampled show impact from local septic systems. The maximum nitrate concentration measured was 44 mg/l.
Nitrites consistently met the ODWS of 1.0 mg/l. Fluoride concentrations met the ODWS of 1.5 mg/l on all but three occasions.
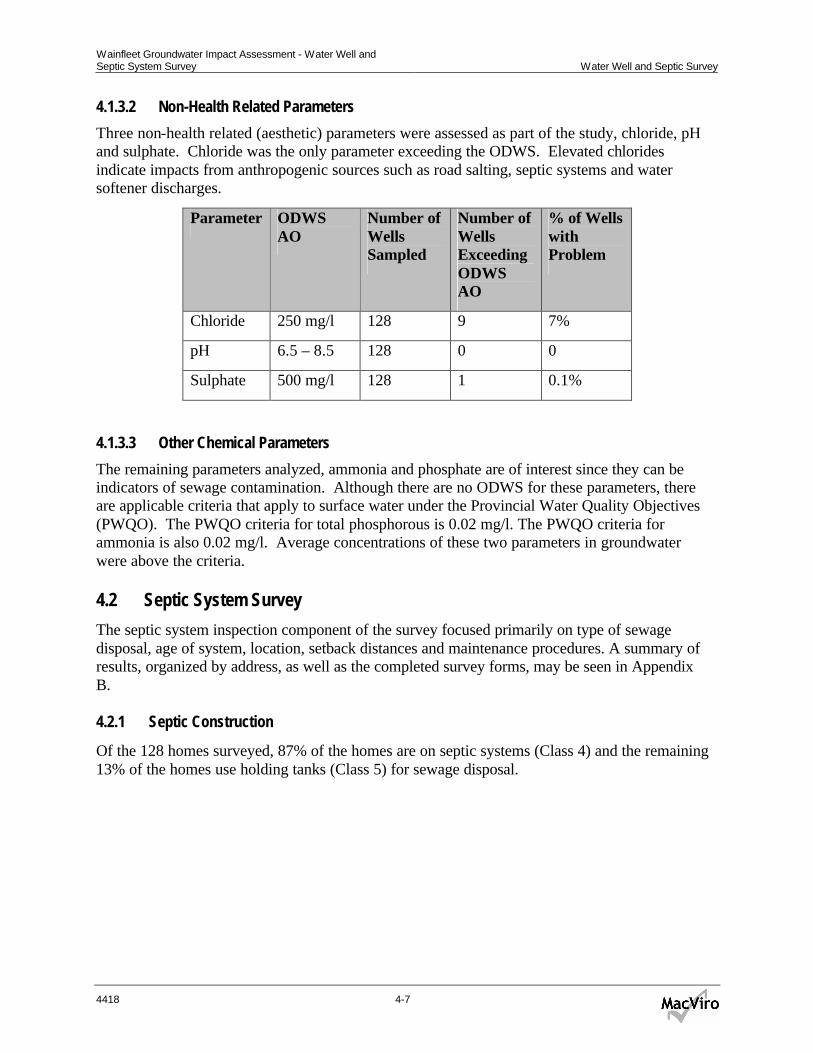
Health-Related Summary
In summary, the total percentage of dwellings with health related problems are provided below.
Parameters and ODWS exceedence criteria
Number of Wells Sampled in the Study Area
Number of Dwellings with Problems
Percentage of Dwellings with Problems
E. Coli detectable e.coli > 0 cfu/100ml 128 39 30%
Total Coliform detectable
Total coliform > 0 cfu/100 ml
128 66 52%
Nitrite >1 mg/l 128 0 0%
Nitrate > 10 mg/l 128 10 8%
Water Supplies Exceeding IMAC or MAC health parameters (Table 1 and 3 of the ODWS) Fluoride > 1.5 mg/l 128 3
2%
Figure 16: Nitrate Concentrations for Untreated Water Samples (mg/L)
<0.232%
0.2 to 128%
1 to 416%
4 to 1017%
>107%
Wainfleet Groundwater Impact Assessment - Water Well and Septic System Survey Water Well and Septic Survey
4418 4-7
4.1.3.2 Non-Health Related Parameters
Three non-health related (aesthetic) parameters were assessed as part of the study, chloride, pH and sulphate. Chloride was the only parameter exceeding the ODWS. Elevated chlorides indicate impacts from anthropogenic sources such as road salting, septic systems and water softener discharges.
Parameter ODWS AO
Number of Wells Sampled
Number of Wells Exceeding ODWS AO
% of Wells with Problem
Chloride 250 mg/l 128 9 7%
pH 6.5 – 8.5 128 0 0
Sulphate 500 mg/l 128 1 0.1%
4.1.3.3 Other Chemical Parameters
The remaining parameters analyzed, ammonia and phosphate are of interest since they can be indicators of sewage contamination. Although there are no ODWS for these parameters, there are applicable criteria that apply to surface water under the Provincial Water Quality Objectives (PWQO). The PWQO criteria for total phosphorous is 0.02 mg/l. The PWQO criteria for ammonia is also 0.02 mg/l. Average concentrations of these two parameters in groundwater were above the criteria.
4.2 Septic System Survey
The septic system inspection component of the survey focused primarily on type of sewage disposal, age of system, location, setback distances and maintenance procedures. A summary of results, organized by address, as well as the completed survey forms, may be seen in Appendix B.
4.2.1 Septic Construction
Of the 128 homes surveyed, 87% of the homes are on septic systems (Class 4) and the remaining 13% of the homes use holding tanks (Class 5) for sewage disposal.

Wainfleet Groundwater Impact Assessment - Water Well and Septic System Survey Water Well and Septic Survey
4418 4-8
Figure 17 - Septic Systems vs. Holding Tanks
Septic systems (Class IV)
87%
Holding tanks (Class V)
13%
4.2.2 Age
The majority of septic systems surveyed were greater than 20 years old. Of the 111 septic systems inspected, 40% were older than 20 years, 16% were between 10 and 20 years old and 12% were installed within the past 10 years. Some 32% of the residents were unable to comment on the age of the septic system. Older septic systems are at greater risk of malfunction.
Figure 18 - Septic System Age
>20 Years 40%
10 to 20 Years16%
<10 Years12%
Unknown32%

Wainfleet Groundwater Impact Assessment - Water Well and Septic System Survey Water Well and Septic Survey
4418 4-9
Age of Septic tank/tile bed systems Number of homes surveyed
>20 years 45
10 to 20 years 18
<10 years 13
Unknown 35
Total number of homes in Problem Area 913
4.2.3 Setback Distances
Section 8 of the 1997 Ontario Building Code (O.Reg.278/99) outlines the minimum clearance distances for Class 4 and 5 sewage systems in Ontario. The minimum clearance between a Class 4 treatment unit and a well is 15m and the minimum distance from the distribution piping and a well with a watertight casing is 15m. However, the minimum distance from the distribution piping and any other well, such as a dug well, is 30 m. In addition, the minimum clearance from a Class 5 holding tank and any well is 15m. Based on these clearance distances it was found that 44% of the homes were not in compliance and therefore at risk of well contamination.
Figure 19 - Setback Clearances from Well
Systems not in Compliance
with Minimum Setback
Clearances44%
Systems in Compliance
with Minimum Setback
Clearances56%
4.2.4 Maintenance
The frequency at which a septic tank should be pumped out largely depends on the capacity, wastewater flow and volume of solids entering the wastewater stream. In general, septic tanks should be pumped out every three to five years. Figure 20 below shows the pump-out frequency of septic tanks in the study area based on information provided by the residents. As shown, some 29% of the septic tanks have not been pumped out within the past five years. Of these, 16% have never been pumped-out. In addition, another 8% did not know when the septic tank was last pumped out. Improper maintenance of septic systems leads to increased risk of malfunction and impact to groundwater. A significant portion of the septic systems assessed

Wainfleet Groundwater Impact Assessment - Water Well and Septic System Survey Water Well and Septic Survey
4418 4-10
were not adequately maintained. 4 out of 111 homes with septic systems had observed ponding and discharge of sewage effluent at surface.
Figure 20 - Septic Tank Pump-out Frequency
<1 Year24%
1 to 3 Years27%
3 to 5 Years12%
>5 Years29%
Unknown8%
Number of Dwellings Surveyed Number of Dwellings with
Problems
Sewage: Ponding or Discharge off property
111 4
Septic tanks never pumped out 111 18
Exceeds minimum Setback Distance from well
95 42
4.3 Summary of Findings
The results of the survey show that the majority of wells assessed have water quality problems associated with sewage contamination, as shown by the exceedences in e.coli, total coliform and nitrates. Elevated levels of ammonia, phosphate and chlorides, also indicators of sewage effluent and development impacts, were also found. Furthermore, although a significant number of homes had disinfection systems in place, 37% of these were not functioning properly, based on the water quality results of samples that were taken passing through disinfection systems. Quantity problems were reported as minimal.
The survey also showed that the septic systems exhibited numerous risk factors for malfunction and impact on water supplies. Specifically, the majority of systems surveyed were greater than 20 years of age, were not in compliance with minimum setback distances and were not maintained regularly.
Therefore, the survey findings suggest a significant risk to human health and safety and the environment as a result of water supply contamination from septic systems in the study area.

Wainfleet Groundwater Impact Assessment - Water Well and Septic System Survey
4418 5-1
5. Impact Assessments
5.1 Water Supply Impact Assessment
The impact to groundwater in the Camelot Beach, Belleview Beach and Morgan’s Point area can be further evaluated by taking into account not only the survey results, but the hydrogeological characteristics of the area and the contaminant load on the receiving aquifer.
5.1.1 Hydrogeological Considerations
The hydrogeology of the area is considered sensitive with respect to development impacts. The occurrence of thin overburden over fractured bedrock and the presence of near surface fractured bedrock limits the attenuation capacity of the aquifer. The sand and gravel shoreline areas are also considered hydrogeologically sensitive due to their limited attenuation capacity. Furthermore, the Environmental Protection Agency considers karst, gravel, or fractured bedrock aquifers to be sensitive to microbial contamination (EPA, 2000).
Therefore, greatest impact is expected in the areas of exposed/thin overburden over bedrock and sand and gravel deposits. This is evident in the spatial distribution of e.coli, total coliform and nitrate exceedences in the study area as shown in Figures 21, 22 and 23. Exceedences are most evident in areas of bedrock exposure at surface and/or thin overburden (which can be seen in Figure 4).
5.1.2 Estimate of Contaminant Loading on Shallow Groundwater System
The average contaminant load on the aquifer can be estimated by taking into account the hydrogeological characteristics of the area, the groundwater flow direction, infiltration, development density and chemical characteristics of raw sewage effluent. The contaminant loading assessment of the aquifer provides average worst-case estimates on the risk of effluent impact from septic systems on the aquifer. It also provides estimates on the appropriate development densities based on the hydrogeological environment.
A mass balance approach was used to determine the potential worst-case impact to the groundwater system. As the study area is hydrogeologically sensitive, dilution is considered as the only means of contaminant attenuation and provides an average worst-case scenario result. The mass balance approach and dilution assumptions are both in accordance with the MOE “Technical Guideline for Individual On-Site Sewage Systems: Water Quality Impact Risk Assessment”. Calculations can be seen in Appendix D
The critical contaminant assessed is nitrate as it is health-related, as well as a semi-conservative tracer for sewage effluent.
Therefore, Ct = ( Ce*Ve +CiVi ) /Vt
Where: Ct = final nitrate concentration in mg/l Ce = concentration of nitrate in raw effluent = 40 mg/l Ve = volume of sewage effluent = 1000 l/lot/day
Ci = concentration of nitrate in infiltration = 0 mg/l

Wainfleet Groundwater Impact Assessment - Water Well and Septic System Survey Impact Assessments
4418 5-2
Vi = volume of infiltration = infiltration m/yr * development area m2 Vt = total volume Based on 913 lots in the vicinity of Lake Erie, producing an average effluent volume of 1000 l/day containing 40 mg/l nitrate, with 60% seasonal occupancy, the average yearly nitrate load to the groundwater system is 11,330,000 kg/yr.
The potential average worst-case nitrate impact on groundwater is 15.1 mg/l, which is well above the Ontario Drinking Water Standard of 10 mg/l.
The minimum lot size required to meet 10 mg/l is 0.5 ha (53,800 ft2), corresponding to a density of 2 lots/ha. The average density in the current communities of Belleview Beach, Camelot Beach and Morgan’s Point is 5.1 lots/ha.
Therefore, the results of the mass balance assessment indicate that local groundwater resources are at high risk of contamination from nitrate and other sewage effluent contaminants, including bacteria and other pathogens. It follows that areas of the highest density have a higher risk factor for septic related problems.
The results of the water quality survey confirm this. Figures 21, 22, and 23 show the distribution of exceedences for bacteria and nitrates. Although the hydrogeological characteristics of the area appear to primarily control the degree of impact, those areas of higher density also show a tendency for sewage contamination.
5.2 Impact Assessment on Lake Erie
As groundwater in the study area discharges directly to Lake Erie, impacts on the groundwater system will potentially be transferred to surface water.
In the case of surface water, (total phosphorous) is considered the critical contaminant, rather than nitrate, as it is a limiting nutrient for algae growth. The total phosphate load to Lake Erie, through shallow groundwater discharge, is estimated at 4,249,000 kg/yr. Calculations are shown in Appendix D. As a worst-case scenario, all phosphate is considered to enter surface water as soils and bedrock in this type of environment tend to have limited sorption capacities. Phosphate loading can lead to excessive algae growth, which can cause aesthetic fouling, decreased oxygen content and other related environmental problems in surface water. The 2002 MOE surface water survey noted the historical occurrence of algae blooms in the near shore areas of Lake Erie in the vicinity of the study area (MOEE, 2002).
Due to the short travel distance to the Lake and rapid flow through the bedrock fracture system, bacteria and other pathogens are expected to enter the Lake in significant proportions. As there are no point “surface” sources of e.coli or nutrients in the vicinity of the study area (MOE, 2002), the significant proportion of e.coli counts measured in Lake Erie are potentially the result of septic system use in the developed areas along and in the vicinity of the shoreline.
Therefore phosphate loading and pathogen contamination, resulting from groundwater contamination by septic systems, is a potential threat to the Lake Erie and the environment in the study area.

Wainfleet Groundwater Impact Assessment - Water Well and Septic System Survey
4418 6-1
6. Conclusions 1. The detailed water well and sewage system survey of 128 homes found that 30% of
homes had e.coli exceedences, 52% of homes had total coliform exceedences, 7% of homes had nitrate concentration exceedences and 7% of homes had chloride concentration exceedences. The survey also found elevated levels of ammonia, nitrites and chlorides in the water supply aquifer. Problems with water quantities were minimal.
2. The survey also found that 40% of homes had septic systems greater than 20 years of age, 44% did not meet the legal setback requirements between wells and septics and 29% were not adequately maintained.
3. The large number of problems found during the water supply and sewage disposal component of the survey indicates significant impact on local water supplies resulting from private individual sewage disposal systems.
4. Based on current Ministry of Environment guidelines (MOE, 1996), much of the study area would be defined as hydrogeologically sensitive, due to the presence of fractured bedrock at surface and areas of thin soil cover. As such, the MOE would not normally support development on individual services in these locations.
5. Local groundwater resources are at high risk of contamination from nitrate and other sewage effluent contaminants (including bacteria and other pathogens), due to both sensitive hydrogeological environment and density of development.
6. Phosphate loading and pathogen contamination, resulting from groundwater contamination by septic systems, is a threat to the Lake Erie and the environment in the study area.
Wainfleet Groundwater Impact Assessment - Water Well and Septic System Survey
4418 7-1
7. References Chapman, L. J., and Putman, L., “The Physiography of Southern Ontario”, Special Volume 2, Ontario Geological Survey, 1984
Environmental Protection Agency website http://www.epa.gov/OGWDW/gwr.html, Proposed Groundwater Rule, April 2000
Feenstra, B. H., “Quaternary Geology of the Niagara Welland Area”, Map 2496, Ontario Geological Survey, 1984
Gartner Lee Ltd., “Water Resources of the Niagara Frontier and the Welland River Drainage Basin”, Ontario Ministry of the Environment, 1987
Ministry of Environment, “Technical Guideline for Individual On-Site Sewage Systems: Water Quality Impact Risk Assessment”, August 1996
Ministry of Environment “Wainfleet Area Shoreline Water Quality Study: investigation of land-based influences on nearshore water quality” and associated data, 2002 (study currently in progress).
Ministry of Northern Development and Mines, MAP 2556 “Quaternary Geology of Ontario”, Queen’s Printer 1991
Ministry of Northern Development and Mines, MAP 2544 “Bedrock Geology of Ontario”, Queen’s Printer 1991
Regional Niagara Public Health Department “Sanitary Survey – Long Beach, Township of Wainfleet”, 2001
Robertson, W.D., “Development of Steady-State Phosphate Concentrations in Septic System Plumes”, Journal of Contaminant Hydrogeology 19(1995) 289-305
Ministry of Municipal Affairs and Housing, “Ontario Building Code 1997”, 1999