water treatment plant for cities
TRANSCRIPT
8/4/2019 Water Treatment Plant for Cities.
http://slidepdf.com/reader/full/water-treatment-plant-for-cities 1/38
WATER TREATMENT PLANT
DESIGN COMPONENTS and COST ESTIMATES
MAY 14, 2003
SECTION 1 PROJECT ALTERNATIVES AND
WATER TREATMENT COMPONENTS
1.1 Project and System Alternatives
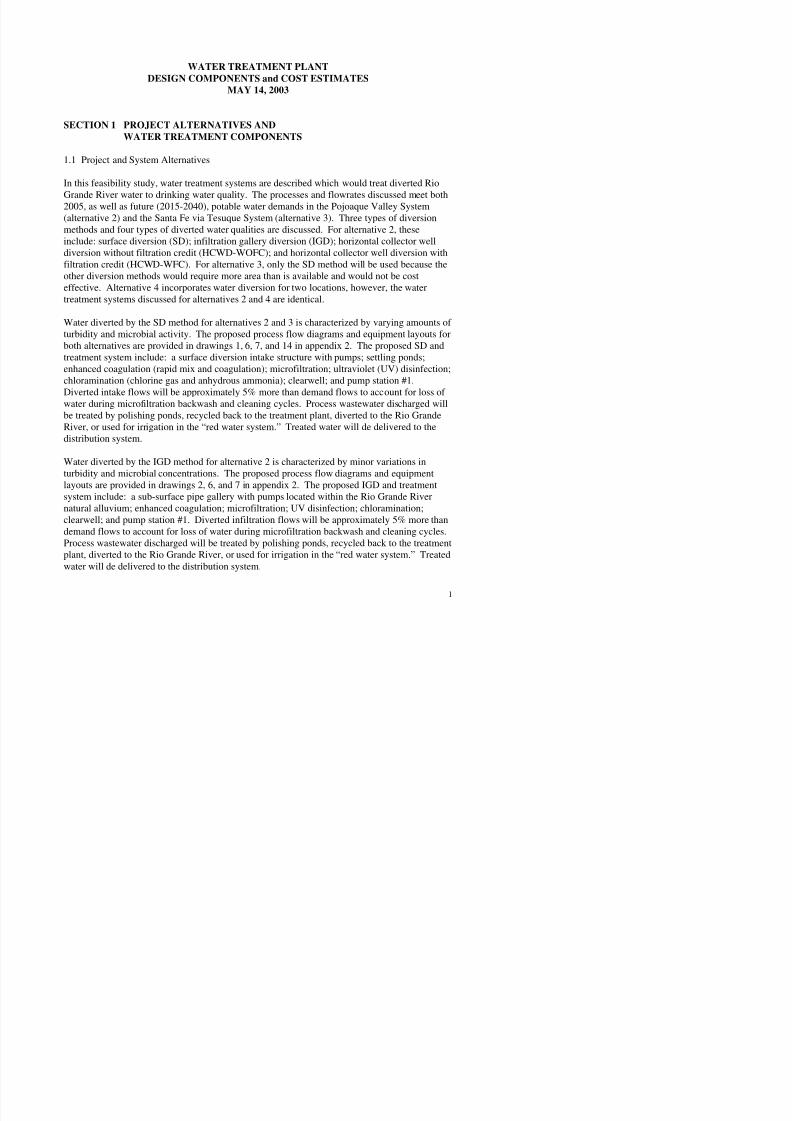
In this feasibility study, water treatment systems are described which would treat diverted RioGrande River water to drinking water quality. The processes and flowrates discussed meet both2005, as well as future (2015-2040), potable water demands in the Pojoaque Valley System(alternative 2) and the Santa Fe via Tesuque System (alternative 3). Three types of diversionmethods and four types of diverted water qualities are discussed. For alternative 2, theseinclude: surface diversion (SD); infiltration gallery diversion (IGD); horizontal collector welldiversion without filtration credit (HCWD-WOFC); and horizontal collector well diversion with
filtration credit (HCWD-WFC). For alternative 3, only the SD method will be used because theother diversion methods would require more area than is available and would not be costeffective. Alternative 4 incorporates water diversion for two locations, however, the watertreatment systems discussed for alternatives 2 and 4 are identical.
Water diverted by the SD method for alternatives 2 and 3 is characterized by varying amounts of turbidity and microbial activity. The proposed process flow diagrams and equipment layouts forboth alternatives are provided in drawings 1, 6, 7, and 14 in appendix 2. The proposed SD and
treatment system include: a surface diversion intake structure with pumps; settling ponds;enhanced coagulation (rapid mix and coagulation); microfiltration; ultraviolet (UV) disinfection;chloramination (chlorine gas and anhydrous ammonia); clearwell; and pump station #1.Diverted intake flows will be approximately 5% more than demand flows to account for loss of water during microfiltration backwash and cleaning cycles. Process wastewater discharged willbe treated by polishing ponds, recycled back to the treatment plant, diverted to the Rio GrandeRiver, or used for irrigation in the “red water system.” Treated water will de delivered to thedistribution system.
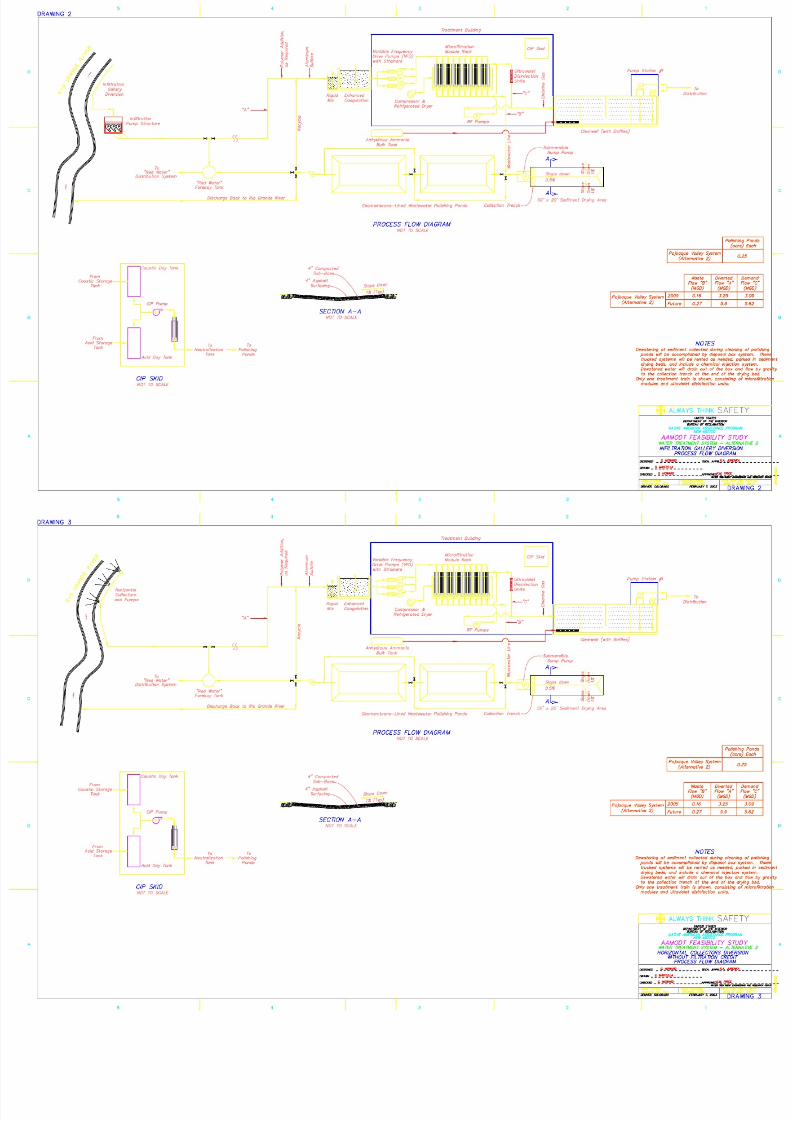
Water diverted by the IGD method for alternative 2 is characterized by minor variations inturbidity and microbial concentrations. The proposed process flow diagrams and equipmentlayouts are provided in drawings 2, 6, and 7 in appendix 2. The proposed IGD and treatmentsystem include: a sub-surface pipe gallery with pumps located within the Rio Grande Rivernatural alluvium; enhanced coagulation; microfiltration; UV disinfection; chloramination;

8/4/2019 Water Treatment Plant for Cities.
http://slidepdf.com/reader/full/water-treatment-plant-for-cities 2/38
The proposed HCWD-WOFC method for alternative 2 will divert “pre-filtered” surface watercollected in sub-surface pipe galleries located within the Rio Grande River alluvium. With this
diversion method, it is assumed that no filtration credit is allowed by USEPA because onlyparticles greater than 10 microns will be removed, resulting in treatment system feed water withvarying amounts of turbidity and microbial concentrations. The proposed process flow diagramsand equipment layouts are provided in drawings 3, 6, and 7 in appendix 2. The proposedHCWD-WOFC and treatment system include: sub-surface horizontal collectors with pumps;enhanced coagulation; UV disinfection; chloramination; clearwell; and pump station #1. Anirrigation “red water system” on the intake line is also provided. Treated water will de deliveredto the distribution system.
The proposed HCWD-WFC method for alternative 2 is an engineered system constructed belowthe natural Rio Grande River alluvium which provides natural filtration of river water andassociated groundwater. With this diversion method, it is assumed that a 99% (2-log credit)inactivation of Giardia lambia (Giardia) and removal of viruses will be allowed under theUSEPA’s Surface Water Treatment Rule (SWTR), and that only disinfection will be required tomeet treatment regulations. The proposed process flow diagram and equipment layout are
provided in drawing 11 in appendix 2. The proposed HCWD-WFC and treatment systeminclude: sub-surface horizontal collectors with pumps; UV disinfection; chloramination;clearwell; and pump station #1. An irrigation “red water system” on the intake line is alsoprovided. Treated water will de delivered to the distribution system.
Table 1 lists each alternative, diversion method, diverted flowrate, wastewater flowrate, anddemand flowrate for 2005 and future conditions.
Table 1 Diversion Methods and Flow RatesAlternative Year
*Type of Diversion Demand –
MGDDiverted –MGD
Wastewater -MGD
Pojoaque ValleySystem –Alternative 2
2005200520052005FutureFuture
FutureFuture
Surface (SD)Infiltration (IGD)
Horizontal CollectorNote 1
Horizontal CollectorNote 2
Surface (SD)Infiltration Gallery
Horizontal Collector Note 1
Horizontal CollectorNote 2
3.093.093.093.095.625.62
5.625.62
3.253.253.253.095.95.9
5.95.62
0.160.160.1600.270.27
0.270
Santa Fe via TesuqueSystem –Alternative 3
2005Future
Surface (SD)Surface (SD)
10.519
11.020
0.51
*Future is defined as 2015 through 2040.Note 1: System to treat water from horizontal collector with no filtration credit

8/4/2019 Water Treatment Plant for Cities.
http://slidepdf.com/reader/full/water-treatment-plant-for-cities 3/38
Table 2 Pojoaque Valley System (alternative 2) Flowrates and Equipment Phasing
Pojoaque ValleySystem(alternative 2)
Year* Diverted Flowrate(MGD) # of TreatedWater Pumps # of MicrofiltrationTrains
# of UltravioletUnits
Surface (SD),Infiltration (IGD), andHorizontal CollectorWithout FiltrationCredit (HCWD-WOFC)
20052010201520202025203020352040
3.253.634.014.394.765.145.525.9
33444444
22233333
22233333
Collector withfiltration credit(HCWD-WFC)
20052010201520202025203020352040
3.093.453.814.174.543.95.265.62
33444444
22233333
22233333
Table 3 Sante Fe via Tesuque System (alternative 3) Flowrates and Equipment Phasing
Santa Fe via TesuqueSystem(alternative 3)
Year*
Diverted Flowrate(MGD)
# of TreatedWater Pumps
# of MicrofiltrationTrains
# of UltravioletUnits
Surface (SD) 2005201020152020
2025203020352040
1112.2913.5714.86
16.1417.4318.7120
3344
4444
6668
881010
6668
881010
SECTION 2 WATER QUALITY
2.1 Water from the Rio Grande River.
Both the Pojoaque Valley System (alternative 2) and the Santa Fe via Tesuque System(alternative 3) will divert water from the Rio Grande River above or below the Otowi gagelocated in the area of State Road 502 bridge. Alternative 4 will divert water from two locations,above and below the Otowi gage, which will be pumped to the treatment system.

8/4/2019 Water Treatment Plant for Cities.
http://slidepdf.com/reader/full/water-treatment-plant-for-cities 4/38
feasibility data presented herein. During the piloting testing and design phases, water qualitysamples should be taken during high turbidities and total organic carbon (TOC) episodes in the
river.
Table 4 Water Quality for HCWD Method 1
Parameter Average Design Range SMCL 2
Electrical Conductivity (EC), µmhos/cm 511 630-400
PH 7.3 7.6 - 7.1
Temperature, oC 15 17.5-13
Turbidity, NTU not detected
TDS, mg/L 354 400 - 314 500Sulfates (SO4
-), mg/L 34 39 – 33 250
TOC, mg/L 2.4 4.5 – 1
Alkalinity, mg/L 231 270 - 199
Chlorides, mg/L 13.7 21 - 8.9 250
1. Data from four samples collected in September, October, November 2001, and January 2002 as part of a previoushorizontal collector well (Ranney) demonstration project.2. SMCLs are established by USEPA for control of aesthetic qualities relating to public acceptance and includecontaminants that may affect taste, color, odor, and appearance.
Table 5 Water Quality for SD Method 2
Parameter Average Design Range SMCL 3
Electrical Conductivity (EC), µmhos/cm 309 462-204
PH 8.2 8.7 – 7.7
Temperature, oC 12.6 25.2 – 1
Turbidity, NTU 49 480 – 1.1
TDS, mg/L 1 236 258 – 223 500
Sulfates (SO4-), mg/L 42.5 50 – 33 250
TOC, mg/L 1 3.9 7.5 – 1
Alkalinity, mg/L 102 139 – 62
Chlorides, mg/L 7.3 9.1 – 5 250
1. All data, except TDS and TOC, are samples taken from January 1980 – September 2001, from USGS samplingstation #08313000 Rio Grande River at Otowi Bridge, NM.2. TDS and TOC are from four samples collected in September, October, November 2001, and January 2002 as partof a previous horizontal collector well (Ranney) demonstration project.
3. SMCLs are established by USEPA for control of aesthetic qualities relating to public acceptance and includecontaminants that may affect taste, color, odor, and appearance.
2.2 Comparison of Water Quality of the Diversion Methods.
Table 6 provides a comparison of the tables 4 and 5 water qualities. Table 4 indicates a 50%increase in total dissol ed solids (TDS) sing the s b s rface HCWD method as a res lt of

8/4/2019 Water Treatment Plant for Cities.
http://slidepdf.com/reader/full/water-treatment-plant-for-cities 5/38
Table 6 Comparison of Water Quality from the Two Diversion Types
ParameterHCWD
Average
HCWD
Range
SD
Average
SD
Range
Comments
Electrical Conductivity(EC), µmhos/cm
511630 –
400309
462 –
204
Indicates groundwatercomponent in HCWDsamples
PH 7.37.6 –
7.18.2
8.7 –
7.7
Temperature, oC 1517.5 –
1312.6
25 –
2.1
Higher temperatures and lessfluxuation in HCWDsamples
Turbidity, NTU not detected 49 400 –1
TDS, mg/L 354400 –
314236
258 –
223
Influence of groundwatercomponent may approachSMCL
Sulfates (SO4-), mg/L 34
39 –
3342.5
50 –
33
Exposed sulfate source indrainage basin
TOC, mg/L 2.44.5 –
1
3.97.5 –
1
HCWD concentrations mayindicate dissolved organic
carbon (DOC) component
Alkalinity, mg/L 13.721 –
8.97.3
9.1 –
5
Indicated groundwatercomponent in HCWDsamples
Chlorides, mg/L 231270 –
199102
139 –
62
SECTION 3 TREATMENT REQUIREMENTS
3.1 Water from the Rio Grande River by Surface and Infiltration Gallery Diversions
Surface water diverted by SD, IGD, and HCWD-WOFC that will be used for potableconsumption must be treated to comply with the SWTR. The SWTR was published in theFederal Register on June 29, 1989, and is promulgated by the USEPA as the National PrimaryDrinking Water Regulations for public water systems using surface water sources orgroundwater under the direct influence of surface water. The filtration and disinfectionrequirements under the SWTR protect consumers against the potential exposure to such diseasecausing pathogens as Giardia, Cryptosporidium (Crypto), viruses, Legionella, and heterotrophicbacteria. The SWTR requires 99.9% (3-log) inactivation of Giardia and 99.99% (4-log) removalof viruses. The reduction and removal of potential pathogens is accomplished by the use of theUSEPA’ b t il bl t h l i (BAT) f filt ti d di i f ti N l d t d

8/4/2019 Water Treatment Plant for Cities.
http://slidepdf.com/reader/full/water-treatment-plant-for-cities 6/38
includes a Maximum Contaminant Level (MCL) of 80 µg/L for Total Trihalomenthanes(TTHM), 60 µg/L for the five Haloacetric Acids (HAA5), 10 µg/l for Bromate, and 1.0 µg/l for
Chlorite. Stage 1 will also require a reduction of TOC by the treatment plant. Based on theTOC and alkalinity data provided in tables 2 and 3, the potable water systems for the PojoaqueValley System (alternative 2) and the Santa Fe via Tesuque System (alternative 3) will require a25% reduction in TOC. Stage 2 of the D/DBP will only apply to surface water systems servingmore than 10,000 people and further reduces the MCL for TTHMs to 40 µg/l and HAA 5 to 30µg/L. The proposed Microbial/Disinfection By-Products Rule (M/DBP), if promulgated, willcharacterize the required treatment processes based on a “BIN” category as determined byaverage Crypto concentration in the source water. Sampling at the diversion/intake points will
be required to determine the “BIN” category of the Rio Grande River at the location of thevarious diversions.
Tables 4 and 5 indicate relatively high concentrations of TOC (2.4 in HCWD and 3.9 in SD). Inaddition, the long detention times in the distribution piping from the treatment system to somedelivery points may indicate a potential for DBP production that may exceed current and futureregulatory limits for distribution systems or delivery to consumers.
3.2 Sub-Surface Water from HCWD-WFC
In this feasibility study, it is assumed that the HCWD-WFC method satisfies the water qualityfiltration requirements of the SWTR (99% [2-log credit] inactivation of Giardia and removal of viruses). Water diverted by the HCWD methods (WOFC or WFC) must be disinfected toprovide a 90% (1-log) inactivation of Giardia and 99.9% (3-log credit) removal of viruses.
SECTION 4 DESCRIPTION OF WATER TREATMENT PROCESSES
FOR WATER FROM THE SD, IGD AND HCWD-WOFC
The water quality produced by the SD, IGD, and HCWD-WOFC in alternative 2 and SD inalternative 3 will require treatment consisting of enhanced coagulation, microfiltration, UVdisinfection, and chloramination to provide multiple treatment barriers for removal of pathogens.Chloramines provide a chlorine residual in the treated water during distribution, which is not
conducive to DBP formation, and provide an additional disinfection barrier. Based onmanufacturer’s data, the proposed treatment system should meet and exceed the treatment andquality requirements of the SWTR. Drawings showing the proposed processes and equipmentlayouts are provided on drawings 1, 2, 3, 6, 7, and 14 in appendix 2. A comprehensive pilotstudy is required prior to final design or construction to verify the feasibility data presentedherein regarding effectiveness and operation of each unit process and resultant water quality

8/4/2019 Water Treatment Plant for Cities.
http://slidepdf.com/reader/full/water-treatment-plant-for-cities 7/38
as shown in table 7. Each pond is designed with a 3-hour detention time providing optimumconditions for the reduction of turbidity to acceptable limits prior to the enhanced coagulation
and microfiltration systems. Based on the turbidity of incoming water, the ponds may be by-passed. Settling tests required during pilot testing will confirm the detention time in each pond.To reduce the impact of the ponds on regional groundwater through infiltration and to preventpossible damage to the pond embankments during cleaning, each pond is lined with 6-inches of reinforced concrete. The ponds will require cleaning every 15 – 20 years, depending on actualriver turbidities. Sediment removed during cleanings is loaded into the sediment drying beddewatering boxes where it is chemically treated. Once the material is dewatered, it is hauled to alandfill for disposal.
Settling ponds are not required with the IGD and HCWD methods because the source water is“pre-filtered” by the river alluvium to remove large amounts of turbidity.
Table 7 Settling Pond Requirements for SD Method
Alternative, MaximumInfluent Flowrate
Volume of Each Pond(gallons)*
Area of Each Pond with a 10’ Depth (2’ Freeboard) and3:1 Side Slopes (acres)
Alternative 2, 5.9 MGD 737,500 0.3
Alternative 3, 20 MGD 2,500,000 0.9
*Each pond has a 3-hour detention time.
4.2 Enhanced Coagulation (Rapid Mix and Coagulation)
In surface waters with variable annual turbidity or moderate to high TOC concentrations, typicalof water using the SD, IGD, and HCWD-WOFC methods, microfiltration systems usuallyinclude enhanced coagulation prior to filtration to coagulate small-suspended particles in thewater and increase the filtration efficiency. This process also increases removal of organicmatter thus reducing DBP formation (meeting the Stage 1 and Stage 2 D/DPB Rules). Thispretreatment process uses a chemical coagulant. Rapid mix of the chemical is designed with a40-second detention time and enhanced coagulation is designed with a 5-minute detention time,providing optimum conditions for the reduction of turbidity to acceptable limits prior tomicrofiltration.
In the Pojoaque Valley System (alternative 2) and the Santa Fe via Tesuque System (alternative3), 1 rapid mix tank is provided to meet the 2005 and future demands (2,700 gallons and 9,000gallons, respectfully). For each system, 1 coagulation tank will be constructed in 2005 (11,000gallons for alternative 2 and 33,000 gallons for alternative 3), with an identical sized tank addedin the year 2025. Each tank will include a mixer to mix the chemical and promote flocculation.
8/4/2019 Water Treatment Plant for Cities.
http://slidepdf.com/reader/full/water-treatment-plant-for-cities 8/38
raw water line to obtain a concentration is about 25 mg/L in the feed water prior to enhancedcoagulation.
In the alternative 2, 1 – 2,500 gallon chemical feed tank is provided to meet 2005 flowrates andspace for 1 additional same sized tank to meet future flowrates. In alternative 3, 1 – 7,000 gallonchemical feed tank is provided to meet 2005 flowrates and space for 1 additional same sized tank to meet future flowrates.
Enhanced coagulation is not required for the HCWD-WFC method because it is assumed theRio Grande River water is “filtered” to meet SDWA filtration requirements by the engineered
and constructed collector well system located in the river alluvium.
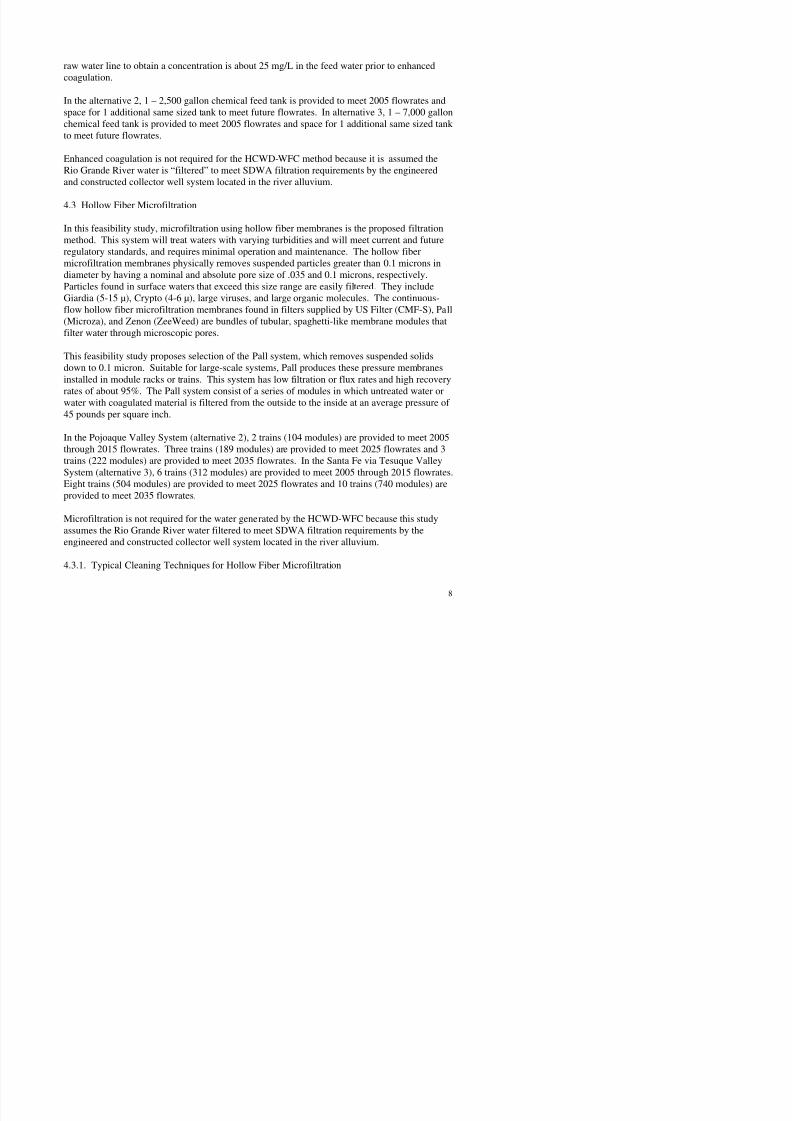
4.3 Hollow Fiber Microfiltration
In this feasibility study, microfiltration using hollow fiber membranes is the proposed filtrationmethod. This system will treat waters with varying turbidities and will meet current and futureregulatory standards, and requires minimal operation and maintenance. The hollow fibermicrofiltration membranes physically removes suspended particles greater than 0.1 microns indiameter by having a nominal and absolute pore size of .035 and 0.1 microns, respectively.Particles found in surface waters that exceed this size range are easily filtered. They includeGiardia (5-15 µ), Crypto (4-6 µ), large viruses, and large organic molecules. The continuous-flow hollow fiber microfiltration membranes found in filters supplied by US Filter (CMF-S), Pall(Microza), and Zenon (ZeeWeed) are bundles of tubular, spaghetti-like membrane modules thatfilter water through microscopic pores.
This feasibility study proposes selection of the Pall system, which removes suspended solidsdown to 0.1 micron. Suitable for large-scale systems, Pall produces these pressure membranesinstalled in module racks or trains. This system has low filtration or flux rates and high recoveryrates of about 95%. The Pall system consist of a series of modules in which untreated water orwater with coagulated material is filtered from the outside to the inside at an average pressure of 45 pounds per square inch.
In the Pojoaque Valley System (alternative 2), 2 trains (104 modules) are provided to meet 2005
through 2015 flowrates. Three trains (189 modules) are provided to meet 2025 flowrates and 3trains (222 modules) are provided to meet 2035 flowrates. In the Santa Fe via Tesuque ValleySystem (alternative 3), 6 trains (312 modules) are provided to meet 2005 through 2015 flowrates.Eight trains (504 modules) are provided to meet 2025 flowrates and 10 trains (740 modules) areprovided to meet 2035 flowrates.

8/4/2019 Water Treatment Plant for Cities.
http://slidepdf.com/reader/full/water-treatment-plant-for-cities 9/38
The following cleaning scenarios are for the Pall hollow fiber membrane modules, but similarcleaning techniques are required for all other manufactured microfiltration systems. A
combination of all the cleaning cycles account for the approximate 5% loss of diverted water inthe SD and IGD methods.
Pressure loss is monitored in each module to determine the cleaning cycles required to removethe accumulation of material on the outside of the fibers. At a preset operation period, eachmodule rack goes through a reverse filtration (RF) cycle to clean the fibers. In this cleaningprocedure, treated product water is pumped from the inside to the outside of the fibers todislodge the accumulated material on surface of each hollow fiber. The reverse filtration cycle
lasts about 15 - 30 seconds and the wastewater from the cleaning cycle is discharged to the plantdrain line and wastewater polishing ponds. The reverse filtration cycle restores the modules tonear clean condition. However, once every 30 - 120 minutes an air scrubbing cycle is alsorequired. Instrument-grade compressed air is introduced into the feed side of each module whilemaintaining the feed flow through the modules for a period of time. The air scrub cycle istypically about 120 seconds – 30 seconds with air and 90 seconds with air and water.
Periodically, the system will require a more thorough cleaning than the reverse filtration and airscrubbing cycles can provide. In the clean-in-place (CIP) cycle, cleaning chemicals stored onthe clean-in-place skid are circulated to regenerate the modules. After circulation, the chemicalsare pumped back to the CIP skid for reuse. If unusable, the chemicals are neutralized beforebeing dumped to the plant drain and discharged to the wastewater polishing ponds. Pallproposes use of citric acid and chlorine solutions for the CIP and sodium hydroxide and sodiumbisulfite for neutralization. After a CIP cycle, each module rack goes through a reverse flowbackwash before placing the module back in filtration mode.
4.3.2 Integrity Testing
During operation, continuous integrity testing of the modules is performed to detect increases inturbidity and particle counts, while an off-line pressure hold test provides the ability to isolateand identify the questionable module.
4.3.3 Log Credits for Filtration
Based on manufacturer’s data provided by Pall, the enhanced coagulation and microfiltrationtreatment processes will provide a 99.9999% (6-log) inactivation of Giardia and Crypto and 99%(2-log) removal of viruses. This meets all the SWTR requirements for Giardia and Crypto, andhalf the removal requirements for viruses.

8/4/2019 Water Treatment Plant for Cities.
http://slidepdf.com/reader/full/water-treatment-plant-for-cities 10/38
the microfiltration system is settled out and treated or “polished.” After this passive treatmentoccurs, water can be recycled back to the potable water treatment system, back to the Rio Grande
River downstream of the intake, or used as part of the “red water” flow used for irrigation. Theponds will require cleaning every 30 - 40 years. Sediment removed during cleanings is loadedinto the sediment drying bed roll off-type dewatering boxes where it is chemically treated. Oncethe material is dewatered it is removed to a landfill for disposal. Each pond is lined with a 45-mil geo-membrane system to reduce the impact of the wastewater on regional groundwater.
Table 8 Polishing Pond Requirements for SD and IGD Methods
Alternative, Maximum
Influent Flowrate
Volume of Each Pond
(gallons)*
Area of Each Pond with a 10’ Depth (2’ Freeboard) and
3:1 Side Slopes (acres)
Alternative 2, 5.9 MGD 295,000 0.25
Alternative 3, 20 MGD 1,000,000 0.72
*Each pond has a 24-hour detention time.
4.5 Sediment Drying Beds
A sediment drying area is provided for placing individual systems of modified roll off-typedewatering boxes. Each box will dewater sediment excavated from the settling ponds (SD) andthe wastewater polishing ponds when they are cleaned (SD, IGD, and HCWD-WOFC). Thisarea is graded and asphalted. These boxes will chemically treat the excavated material – cleanwater will drain to the polishing ponds and dried sediment will hauled away with the boxes.New rented boxes are required for each wastewater polishing pond cleaning cycle.
SECTION 5 DISINFECTION OF FILTERED WATER
The disinfection process for all diversion/treatment methods for alternative 2 (SD ,IGD, andHCWD-WOFC with microfiltration or HCWD-WFC) and the SD for alternative 3 is the same.To ensure proper disinfection, the turbidity of the water prior to disinfection must be 0.3 NTU orless.
5.1. Ultraviolet (UV) Disinfection Units
After filtration (microfiltration or sub-surface), disinfection is accomplished by the state-of-the-art “flow through” UV disinfection units. Each unit consists of a stainless steel chambercontaining 2 UV lamps, an automatic cleaning system, a UV monitoring system, and a controlcabinet. Each unit will provide a minimum UV dose of 40 mJ/cm2 to the filtered water before

8/4/2019 Water Treatment Plant for Cities.
http://slidepdf.com/reader/full/water-treatment-plant-for-cities 11/38
5.1.1 Log Credits for Disinfection
Based on manufacturer’s data, the proposed Aqionics UV unit will provide an additional 99.9%(3-log) inactivation of Giardia and Crypto and an additional 99.99% (4-log) removal of viruses.Based on this information, the combined unit processes of microfiltration and UV disinfectionwill provide an inactivation of 99.9999999% (9-log) for Giardia and Crypto and 99.9999% (6-log) removal for viruses. These reductions far exceed all SDWA requirements.
5.2. Chloramination (Chlorine Gas and Anhydrous Ammonia)
Once disinfected by UV, the treated water will discharge to the clearwell where chlorine gasfollowed by anhydrous ammonia will be injected. This chloramination process provides achlorine residual in the treated water distribution system and storage facilities. Chloraminationreduces the potential for DBP formation that can occur during extended contact times in thedistribution system and storage facilities when free chlorine is applied. Chloramination aids inthe prevention of taste and odor problems. Chloramination residual lasts longer thus eliminatingthe need for re-chloramination stations.
The required chemical dosages and detention times must be determined during pilot testing. Inthis feasibility study, an estimated chloramine dosage of 2.00 ppm is used. This consists of a 1.5ppm demand and 0.5 ppm residual. A ratio of 3 parts chlorine gas to 1 part anhydrous ammoniais used to size the chlorine and ammonia storage areas and provide a cost estimate. Although theresidual is not provided by free chlorine, chloraminaton will provide additional disinfection logcredits based on the contact time in the treated water distribution system. An estimate of the
contact times and additional log credits provided within the treated water distribution system isprovided in appendix 2.
5.2.1 Chlorine Gas
Ton containers of chlorine gas are used for all treatment systems and will be supplied by thechlorine gas suppler. As shown on the drawings, each treatment building includes a separateroom for chlorine gas storage. Chlorine gas will be drawn from the containers under vacuum
and injected in the filtered water piping before entering the clearwell.
Due to the risks involved with the use of chlorine gas, a continuous chlorine gas monitor isprovided in each chlorine storage room and operators will be required to have special training.In addition, each treatment building includes a separate room for an emergency chlorine scrubbersystem This system is a pre-engineered self-contained single pass emergency chlorine gas

8/4/2019 Water Treatment Plant for Cities.
http://slidepdf.com/reader/full/water-treatment-plant-for-cities 12/38
with chlorine gas.
5.2.2 Anhydrous Ammonia
Due to the differing demands of each alternative, a 500 gallon anhydrous ammonia storage tank is provided for Pojoaque Valley System (alternative 2) and a 1,000 gallon anhydrous storagetank is provided for the Santa Fe via Tesuque System (alternative 3). For all alternatives, theammonia tanks are located outside and are isolated from view by concrete masonry unit wallscovered with stucco. As shown on the drawings, ammonia will be withdrawn from the tank andinjected through the clearwell into a manifold as a gas.
The ASME rated pressurized tanks are located as far away as possible from the chorine storagecontainers and contain volumes below which US EPA requires a risk assessment plan. Due tothe risks involved with the use of gaseous ammonia, operators will be required to have specialtraining.
5.2.3 Log Credits for Contact Time
Water from SD in alternative 2 and 3, or IGD in alternative 2 will have a minimum watertemperature of 1o C. At this temperature the proposed clearwell will provide a minimum 15minute detention time at the maximum future demand, resulting in a 0.01-log inactivation of Giardia cysts and 0.02-log removal of viruses. An additional log credit will be obtained in waterdistribution system and storage facilities as a result of the time the water resides in the system.The total estimated log credits for each community is provided in appendix 2.
Water from either the HCWD-WOFC and HCWD-WFC in alternative 2 will have a minimumwater temperature of 15o C. At this temperature, the proposed clearwell will provide a 15 minutedetention time at the maximum future demand resulting in a 0.03-log inactivation of Giardiacysts and 0.07-log removal of viruses. An additional log credit will be obtained in waterdistribution system and storage facilities as a result of the time the water resides in the system.The total estimated log credits for each community is provided in appendix 2.
5.2.4 Clearwell
Clearwells are provided to ensure adequate contact time and mixing for the chloramines beforedischarge to the distribution systems, as well as an adequate storage volume for distributionpumping. In the Pojoaque Valley System (alternative 2), a 93,500 gallon clearwell with a 15-minute detention time is provided to meet 2005 and future flowrates. In the Santa Fe viaTesuque System (alternative 3) a 197 917 gallon clearwell with a 25-minute detention time is

8/4/2019 Water Treatment Plant for Cities.
http://slidepdf.com/reader/full/water-treatment-plant-for-cities 13/38
water treatment plant. All plant structures, except intakes, must be located above the 100-yearflood plain, which is approximately elevation 5530 feet.
6.1 Site Plans
As noted in the proposed site plans, drawings 4,5,10, and 13, access to the water treatmentbuildings service yards is by a new 24-foot wide paved access road connecting to existing pavedroad SI 102, 125 feet north of New Mexico State Highway 502. Each site plan has the followingcommon design features.
After vegetation clearing, topsoil will be stripped from the service yard site and access roadright-of-way to a depth of 1 foot and placed in the berm areas. The top and outer slopes of theberms will be shaped to imitate natural landforms and screen views into the water treatmentplant yard. The berms will be planted with native tree and grass species. The berms outer slopeswill vary from 4:1 to 6:1, while the inside faces will be a consistent 3:1 slope. The height of theberms for plant sites with settling ponds (SD) will average 10-feet in height, and plant siteswithout settling ponds (IGD, HCWD-WOFC, and HCWD-WFC) will average 8-feet in height. Itis assumed that all material required, as well as the stripped material already placed to constructthe berms, will come from on-site borrow.
The service yard will be enclosed with a 7-foot high chain link security fence with one 24-footwide gate. The fence will be located 6 feet from the toe of the inside berm slopes. The yard willbe surfaced with 6-inches of aggregate base. The mean finish surface elevation of the serviceyard will be 5529.0.
Concrete-lined settling ponds are required for water treatment facilities associated with the SDmethod. The bottom elevation of the ponds will be set at the yard elevation and outer and innerslopes will be 3:1. A 16-foot wide ramp with a maximum 10% slope will access the top 16-footwide berm around the ponds at elevation 5541.0.
6.2 Treatment Plant Buildings
Separate water treatment buildings are designed for each diversion method associated with the
Pojoaque Valley Alternative (alternative 2) and the Santa Fe via Tesuque Alternative (alternative3). The water treatment building associated the alternative 3 SD is larger than the watertreatment buildings associated with alternative 2, and the water treatment buildings associatedwith alternative SD, IGD, and HCWD-WOFC are similar but larger than the water treatmentbuildings associated with HCWD-WFC. The buildings are designed to house the watertreatment systems and related equipment required to meet the future demands up to year 2040

8/4/2019 Water Treatment Plant for Cities.
http://slidepdf.com/reader/full/water-treatment-plant-for-cities 14/38
module cleaning skid, and motor control center. The main process area is higher than the rest of the plant to accommodate HVAC and other equipment. It will be cooled by swamp coolers and
heated with gas duct furnace.
Buildings for the water treatment system for alternative 2 HCWD-WFC will house UV units,vacuum pumps, internal piping, chemical storage tanks, control room, laboratory, and toilet.
The ammonia storage room, located outside the buildings, is separated by at least 50-feet fromthe chlorine storage tank room inside the building. The chlorine storage room is included in themain building, but has an outside entrance and a separate HVAC system to eliminate the risk to
the operators if leakage occurs in any of the containers. The chlorine storage room for bothalternatives will house chlorine gas in ton containers under pressure. Anhydrous ammonia willbe stored in pressurized tanks for both alternatives outside the building.
A room next to the chlorine storage room in each building is dedicated to a gaseous chlorinescrubbing system. If a major leak occurs in a chlorine gas storage tank the room air will beevacuated through a chlorine scrubbing system before being discharged to the atmosphere.
All other spaces in each treatment plant will have individual air conditioners/heat pumps.Additional details are shown on the drawing for each building.
There are three main types of architectural design styles used in the City of Santa Fe. These arepueblo style, territorial style, and northern New Mexico style. Although there is no requirementto design the buildings strictly to Santa Fe standards outside of the city, the proposed buildingsare designed in pueblo style architecture that is widely used in and around Santa Fe.
The construction of buildings will be structural steel and concrete unit masonry with outsidestucco and vigas in brown or earthtone color, and doors and trim in turquoise color that areprevalently used in the area. The roof will be flat with rainspouts as feature and function both.
The buildings will be designed accessible as required by American Disability Act of 1990, andwill fully meet the requirements of NFPA 101 Life Safety Code and International Building Code2000 edition. Further details are shown on the drawing for each building.
A septic tank and disposal field is provided for each building to treat and dispose of rawwastewater generated from the unisex toilet.
6.3 Clearwell

8/4/2019 Water Treatment Plant for Cities.
http://slidepdf.com/reader/full/water-treatment-plant-for-cities 15/38
6.4 Pumping Systems
6.4.1 Pump Station # 1 Service Pumps - Pojoaque Valley System (alternative 2)
Pump Station #1 (located above the clearwell) withdraws water from the treated water clearwelland pumps the water to the relift pumping plant at the intersection of US84/285 and MN503.Vertical turbine pumps were selected based on the operating head and to maximize pumpefficiency. Three equally sized 1,370 gpm vertical turbine pumps will be installed in 2005. Twoof the 3 pumps are required to meet the 2005 flow requirements, the third pump will be astandby. By 2015, the flow requirements exceed the capacity of the 2 pumps, at which point a
fourth 1,370 gpm vertical turbine pump will be installed. With 4 pumps installed, 3 pumps willmeet future flow requirements and the fourth pump will be a standby.
Fixed speed pumps were selected to meet the varying flow requirements. Between 2005 and2015, 1 pump will operate continuously when flow is required, while a second pump will cycleon and off based on the water level in the clearwell. The pumps will be controlled by levelswitches that sense the water levels in the clearwell. The clearwell is large enough to allow thepump that cycles on and off to operate for a minimum of 20 minutes. Between 2015 and 2040, 2pumps will operate continuously, while a third pump cycles on and off based on the water levelin the clearwell.
Fixed speed pumps were selected instead of variable speed pumps due to lower operating costs.To utilize variable speed pumps, friction would need to be added to the system to allow thepumps to run at lower flows. The additional friction in the pipeline would result in a higherhorsepower requirement. Additional friction is required because the hydraulic pipe losses
between the pump station #1 and the relift plant at US84/285 @ NM503 are a small componentof the total dynamic head loss due to the wide flow range required between 2005 and 2040.
Below deck discharge heads with valve vaults were selected since the pumps are outdoors. Thevalve vaults will minimize freezing in the piping.
6.4.2 Pump Station # 1 Service Pumps – Santa Fe via Tesuque System (alternative 3)
With the exception of the alternative 3 pumps being sized at 4,620 gpm each, the pumps willoperate identically to alternative 2 pumps described above.
6.4.3 Waste Flow B Pumps - Pojoaque Valley System (alternative 2)
The waste flow B pumps withdraw water from the polishing ponds and transfer it to either the

8/4/2019 Water Treatment Plant for Cities.
http://slidepdf.com/reader/full/water-treatment-plant-for-cities 16/38
6.4.4 Waste Flow B Pumps - Santa Fe via Tesuque System (alternative 3)
With the exception of the alternative 3 pumps being sized at 305 gpm each, the pumps willoperate identically to alternative 2 pumps described above.
6.4.5 Pump/Motor Life Assumptions
The following assumptions have been made:
- Pump impellers and pump bowls will be replaced every 20 years,- Pumps use is alternated to achieve equal wear on pumps,- Regular preventative maintenance is followed, and- Pump motor will be replaced every 20 years. When pumps are energized, they will be run for aminimum of 20 minutes.
6.4.6 Valve Characteristics and Functions
A check valve and motor-operated butterfly valve will be installed on each of the pump station #1 Service pump unit discharge lines. A check valve and manual butterfly valve will be installedon each of the Waste Flow B pump unit discharge lines.
A check valve will be installed on each pump discharge line to prevent reverse flow through thepumps during normal operation and in case of power failure.
The butterfly valve will be installed on each pump discharge line as a guard valve for isolation of the pump for maintenance. If required, the butterfly valve may also be used to throttle the flowto meet the design flow.
Motor operated butterfly valves will be installed on the IGD influent, HCWD influent, andprocess wastewater lines to divert flow between pipe lines.
Motor operated v-port knifegate valves will be installed on the SD pipeline to modulate flows to
the settling ponds.
Pressure sustaining valves will be installed on the waste flow B pump discharge lines to addfriction to the pipe system. Additional friction is required to achieve the variable flow rangerequired.

8/4/2019 Water Treatment Plant for Cities.
http://slidepdf.com/reader/full/water-treatment-plant-for-cities 17/38
6.4.8 Air Valves
Combination air valves are provided on the unit discharge piping for each of the pumps. The airvalves are capable of both releasing and admitting air during unit startup and draining of thepiping.
6.4.9 Valve Life Assumptions
The following assumption have been made:
- Butterfly valve life is in excess of 50 years although butterfly valve seats will be replaced every20 years, and- Butterfly valves will be utilized as a throttling valve only on a minimal basis.
6.4.10 Flow Meters
In all options, 2 remotely monitored flow meters will be required to monitor and control theamount of water flowing to the treatment plant and to the “red water” forebay tank. In the
feasibility design and cost estimate, 24-inch magnetic flow meters are provided for the PojoaqueValley (alternative 2) and 42-inch magnetic flow meters are provided for the Santa Fe viaTesuque System (alternative 3).
SECTION 7 OPERATION AND MAINTENANCE REQUIREMENTS
7.1 Controls
Each treatment building includes a master control room which houses a master ProgrammableLogic Controller (PLC) with distributed Input/Out (I/O) boards. The master PLC controls allaspects of the operation of the water supply system including diversions, water treatmentprocesses, pumping plants, and on-line treated water storage tanks. The complete system can beoperated in automatic mode or in local mode where operators are present to manually control theoperation of individual pumps, valves, and other processes.
The control enclosures in the master control room contain the main control panel. The maincontrol panel includes the master PLC, microfiltration valve rack control panel, microfiltrationclean-in-place I/O panel, diversion control panel, all pumping plants control panels, and controlpanel displaying the water level of each on-line treated water storage tank.

8/4/2019 Water Treatment Plant for Cities.
http://slidepdf.com/reader/full/water-treatment-plant-for-cities 18/38
Contact with the master PLC by plant operators will be through a Pentium III-based computer
with 256MB RAM and 30 GB hard drive. Control and monitoring features will include pumps,microfiltration train operation, system pressures, flowrates, turbidity, residual chloramines,particle counters, pH, valve position, water levels, and other parameters as required anddetermined during pilot testing.
7.2 Plant Operators
Although all water treatment systems proposed in this feasibility study can operate in automatic
mode with minimal operator interface, a minimum of 2 certified water treatment plant operatorswill be required at each plant 24 hours a days to monitor operations and provide adjustments.During routine or emergency maintenance, it is expected that as many as 3 maintenance personalmay be required.
7.3 Chemicals
Annual chemical usage for treating water discharged from the SD, IGD, and HCWD-WOFC
include those required for routine cleaning of the hollow fiber membranes, aluminum sulfate toflocculate the small suspended particles in the source water, and chlorine and ammonia to formchloramines residual to keep the water disinfected during distribution.
Annual chemical usage for water discharged from the HCWD-WFC will be chlorine andammonia gas to form a chloramine residual to keep the water disinfected distribution.
7.4 Power
Annual major power usage for the SD ,IGD, and HCWD-WOFC includes: mixers for enhancedcoagulation; microfiltration booster pumps; air compressors; UV disinfection units; and thetreated water service pumps. Power usage for smaller loads such as chemical metering pumps,heating and cooling, and chlorine and ammonia systems are accounted for in the power costestimate provided in appendix 3.
Annual major power usage for water discharged from the HCWD-WFC is the UV disinfectionunits and treated water service pumps. Power usage for smaller loads such as chemical meteringpumps, heating and cooling, and chlorine and ammonia systems are accounted for in the powercost estimate provided in appendix 3.
7 5 Equipment Replacement

8/4/2019 Water Treatment Plant for Cities.
http://slidepdf.com/reader/full/water-treatment-plant-for-cities 19/38
SECTION 8 MISCELLANEOUS
8.1 Considerations Prior to Final Design
Future sampling and analysis is required prior to final design or construction to verify allfeasibility data presented herein. This feasibility level design assumes that adequate chloramineresidual is maintained throughout the 10 miles of the main distribution system, and that re-chlorination, if required, will be done by each community. Prior to final design, a chloraminesdegradation study must be completed to verify this assumption. This study also assumes therewill be little DBP formation in the distribution system and storage facilities. Prior to final
design, a Trihalomethane Formation Potential Analysis (Standard Methods 5710 B) must becompleted to verify this assumption.
8.1.1 Pilot Study
Prior to final design of the selected alternative, a comprehensive pilot study using the proposedtreatment system is required to collect design data to optimize each treatment process. The pilotplant should operate 24 hours a day over a minimum of 12 consecutive months to determine
treatment requirements based on changing water conditions. The pilot study will determine the:most efficient chemical to use for coagulation; chemical injection rates based on changing waterquality; backwash requirements and membrane cleaning requirements; and wastewater qualityand production rates. It will determine the potential for DBP formation during distribution;chloramines residual values in the distribution system; and operation requirements. It will verifythe ability of the treatment system to meet current and future regulatory standards; provide datato update capital and operation and maintenance costs, and provide training for future operators
of the full-scale treatment system. A line item providing a sum of $200,000 to fund the pilotstudy is included in the capital cost of each alternative.
8.2 Back-up Power
Included in the unlisted costs for each alternative is a back-up emergency generator with theability to energize the alarms, lights, HVAC system, and the chorine scrubber system duringpower outages.
8.3 Blending of Treated Water with Groundwater
Prior to final design, an analysis must be completed of the potential deterioration of water qualitythat may result from mixing or blending treated water with lower quality groundwatercharacteristic of the service area

8/4/2019 Water Treatment Plant for Cities.
http://slidepdf.com/reader/full/water-treatment-plant-for-cities 20/38
diversions, and producing four types of water, treat the water to drinking water standards, andconvey the treated water to meet 2005 and future flowrates are provided in Chapter xxx. The
details on individual cost parameters for each proposed water treatment system, not includingdiversions, is provided in appendix 3.
9.1 Water Treatment Costs for SD and IGD Methods
9.1.1 Capital Costs
For alternative 2, the capital costs for the water treatment plant to treat water discharged from
each diversion method to meet potable requirements are:
• $16,000,000 for water from SD,
• $14,725,000 for water from IGD,
• $14,725,000 for water from HCWD-WOFC, and
• $5,173,000 to water from HCWD-WFC.
For a complete discussion on capital costs, see the cost section in the main report.
9.1.2 Annual Operation and Maintenance (O&M) Costs
Of the many ways to compare water treatment plant O&M costs, one method is to determine thetotal cost of O&M between 2005 and 2040.
For alternative 2 the total O&M expenditure over the 35 years are estimated at:
• $39,000,000 for the SD or an average of $1,365,000 per year,
• $38,000,000 for the IGD or an average of $1,330,000 per year,
• $38,000,000 for the HCWD-WOFC or an average of $1,330,000 per year, and
• $12,000,000 to the HCWD-WFC or an average of $343,000 per year.
Annual O&M costs are based on 24-hour operation at the design flowrates. Details of eachestimate are provided in appendix 22 of the Feasibility Study Report.
SECTION 10 FEASIBILITY LEVEL COST ESTIMATES –
SANTA FE via TESUQUE SYSTEM – ALTERNATIVE 3

8/4/2019 Water Treatment Plant for Cities.
http://slidepdf.com/reader/full/water-treatment-plant-for-cities 21/38
APPENDIX
WATER TREATMENT DRAWINGS AND SUPPORTING DATA
Drawing 1 – Settlement Alternatives 2 & 3 – Surface Intake Process Flow Diagram
Drawing 2 – Settlement Alternative 2 Infiltration Gallery Diversion Process Flow Diagram
Drawing 3 – Settlement Alternative 2 Horizontal Collectors Diversion w/o Filtration Credit
Process Flow Diagram
Drawing 4 – Settlement Alternative 2 Surface Diversion Treatment Plant Site PlanDrawing 5 – Settlement Alternative 2 Infiltration Gallery and Horizontal Collector
Diversion w/o Filtration Credit Treatment Plant Site Plan
Drawing 6 – Settlement Alternative 2 Surface Diversion, Infiltration Gallery, and
Horizontal Collector w/o Filtration Credit Equipment Layout and Floor Plan
Drawing 7 – Settlement Alternative 2 Surface Diversion, Infiltration Gallery, and
Horizontal Collector w/o Filtration Credit Sections
Drawing 8 – Settlement Alternative 2 Surface Diversion, Infiltration Gallery, and
Horizontal Collector w/o Filtration Credit Floor Plan
Drawing 9 – Settlement Alternative 2 Surface Diversion, Infiltration Gallery, and
Horizontal Collector w/o Filtration Credit Section and Front Elevation
Drawing 10 – Settlement Alternative 2 Horizontal Collector with Filtration Credit
Treatment Plant Site Plan
Drawing 11 – Settlement Alternative 2 Horizontal Collector Diversion with Filtration
Credit Process Flow Diagram, Equipment Layout, and Floor Plan
Drawing 12 – Settlement Alternative 2 Horizontal Collector Diversion with FiltrationCredit Floor Plan, Elevation, and Section
Drawing 13 – Settlement Alternative 3 Surface Diversion Treatment Plant Site Plan
Drawing 14 – Settlement Alternative 3 Surface Diversion Equipment Layout and Floor
Plan
Drawing 15 – Settlement Alternative 3 Surface Diversion Floor Plan
Drawing 16 – Settlement Alternative 3 Surface Diversion Section and Front Elevation
Drawing 17 – Electrical Installation – Single-Line Diagram
8/4/2019 Water Treatment Plant for Cities.
http://slidepdf.com/reader/full/water-treatment-plant-for-cities 22/38

8/4/2019 Water Treatment Plant for Cities.
http://slidepdf.com/reader/full/water-treatment-plant-for-cities 23/38

8/4/2019 Water Treatment Plant for Cities.
http://slidepdf.com/reader/full/water-treatment-plant-for-cities 24/38

8/4/2019 Water Treatment Plant for Cities.
http://slidepdf.com/reader/full/water-treatment-plant-for-cities 25/38

8/4/2019 Water Treatment Plant for Cities.
http://slidepdf.com/reader/full/water-treatment-plant-for-cities 26/38

8/4/2019 Water Treatment Plant for Cities.
http://slidepdf.com/reader/full/water-treatment-plant-for-cities 27/38

8/4/2019 Water Treatment Plant for Cities.
http://slidepdf.com/reader/full/water-treatment-plant-for-cities 28/38

8/4/2019 Water Treatment Plant for Cities.
http://slidepdf.com/reader/full/water-treatment-plant-for-cities 29/38

8/4/2019 Water Treatment Plant for Cities.
http://slidepdf.com/reader/full/water-treatment-plant-for-cities 30/38

8/4/2019 Water Treatment Plant for Cities.
http://slidepdf.com/reader/full/water-treatment-plant-for-cities 31/38

8/4/2019 Water Treatment Plant for Cities.
http://slidepdf.com/reader/full/water-treatment-plant-for-cities 32/38

8/4/2019 Water Treatment Plant for Cities.
http://slidepdf.com/reader/full/water-treatment-plant-for-cities 33/38

8/4/2019 Water Treatment Plant for Cities.
http://slidepdf.com/reader/full/water-treatment-plant-for-cities 34/38

8/4/2019 Water Treatment Plant for Cities.
http://slidepdf.com/reader/full/water-treatment-plant-for-cities 35/38

8/4/2019 Water Treatment Plant for Cities.
http://slidepdf.com/reader/full/water-treatment-plant-for-cities 36/38

8/4/2019 Water Treatment Plant for Cities.
http://slidepdf.com/reader/full/water-treatment-plant-for-cities 37/38

8/4/2019 Water Treatment Plant for Cities.
http://slidepdf.com/reader/full/water-treatment-plant-for-cities 38/38