water stress - over_heating_asia
TRANSCRIPT
OVER HEATINGFinancial Risks from Water Constraints on Power Generation in AsiaIndia, Malaysia, Philippines, Thailand, Vietnam
WRI
Amanda Sauer
Piet Klop
HSBC
Sumeet Agrawal
ISBN: 978-1-56973-742-2
ABOUT WRI
The World Resources Institute (WRI) is an environmental think tank that goes beyond research to create practical ways to protect the Earth and improve people’s lives. Our mission is to move human society to live in ways that protect the Earth’s environment for current and future generations.
Our programs meet global challenges by using knowledge to catalyze public and private action.
• To reverse damage to ecosystems. We protect the capacity of ecosystems to sustain life and prosperity.
• To expand participation in environmental decisions. We collaborate with partners worldwide to increase people’s access to information and influence over decisions about natural resources.
• To avert dangerous climate change. We promote public and private action to ensure a safe climate and a sound world economy.
• To increase prosperity while improving the environment. We challenge the private sector to grow by improving environmental and community well-being.
In all its policy research, and work with institutions, WRI tries to build bridges between ideas and actions, meshing the insights of scientifi c research, economic and institutional analyses, and practical experience with the need for open and participatory decision making.
ABOUT HSBC CLIMATE CHANGE CENTRE OF EXCELLENCEThe HSBC Climate Change Centre of Excellence was created in 2007, to help advise HSBC and its clients on the evolution and impacts of climate change. The team performs macro research on climate change science, policies and markets.
The Centre also publishes joint research pieces in collaboration with fundamental analysts, helping highlight valuation impacts of climate change. Global and country-specifi c reports highlight investment potential related to policy and market changes.
10 G Street, NESuite 800Washington, DC 20002www.wri.org

Each World Resources Institute report represents a timely and scholarly treatment of a subject of public concern. WRI takes responsibility for choosing the study topics and guaranteeing its authors and researchers freedom of inquiry. It also solicits and responds to the guidance of advisory panels and expert reviewers. Unless otherwise stated, however, all the interpretations and findings set forth in WRI publications are those of the authors.
ISBN: 978-1-56973-742-2
Copyright 2010 World Resources Institute

Contents
I. KEY FINDINGS FOR INVESTORS AND ANALYSTS 3
II. SECTOR OVERVIEW 9
III. WATER SCARCITY ANALYSIS AND TRENDS 14
A. Climate Change 17
B. Demand for Water Resources 19
IV. WATER RISK EXPOSURE FRAMEWORK 21
A. Business Model 22
B. Water Dependency 25
C. Water Security 29
V. IMPACTS ON SHAREHOLDER VALUE 32
A. Operating Efficiency 33
B. Capital Investments 34
C. Strategic Positioning 35
HSBC India Case Study 36
VI. RECOMMENDATIONS 39
APPENDIX A: METHODOLOGY AND DATA TABLES 41
NOTES 49

ABOUT THE PROJECT This report would not have been possible without the financial support of the International Finance Corporation (IFC) and grant funding from the Government of Japan.
The research project’s objective is to guide investors and analysts through assessing the financial impacts of select environmental trends on listed companies in India, Indonesia*, Malaysia, Philippines, Thailand, and Vietnam. Other research reports produced within this series are listed below. More information on the project and copies of the reports are avail-able for download at http://www.wri.org/project/envest.
Emerging Risk: Impacts of Key Environmental Trends in Emerging Asia.
Undisclosed Risk: Corporate Environmental and Social Reporting in Emerging Asia.
Weeding Risk: The Financial Impacts of Climate Change and Water Scarcity Trends on Asia's Food and Beverage Sector.
Surveying Risk, Building Opportunity: The Financial Impacts of Energy Insecurity, Water Scarcity and Climate Change on Asia’s Commercial Real Estate Sector.
Weeding Risk, Over Heating and Surveying Risk include contributions from HSBC’s Climate Change Centre of Excellence and HSBC’s India Equity Research Division.
*Note: Indonesia is not included in this report because it has no publicly listed power generation companies. It is included in the other reports.
ACKNOWLEDGMENTS The authors wish to give special thanks to our World Resources Institute colleagues, Janet Ranganathan, Eliot Metzger, Jeff Rodgers, and Evan Branosky, who generously reviewed drafts of this report. We are also grateful for the thoughtful contributions by the World Business Council for Sustainable Development’s working group on power and water, Claudia Kruse from APG Investments, Anthony D’Agostino from the National University of Singapore’s Institute of Water Policy, and Daniel Beneat. Special thanks are owed to Euan Marshall and Berit Lindholdt Lauridsen of the IFC for providing ongoing guidance on the scope and direction of this research. We are deeply grateful to HSBC for their valuable contributions, especially from Roshan Padamadan, Sumeet Agrawal, Charanjit Singh, and Pankaj Jain. Also thank you to Jennie Hommel for managing the review process, Allison Sobel for copyediting, and Maggie Powell for providing layout services.
ABOUT THE AUTHORS Amanda Sauer is a Senior Associate in the Envest project at WRI. [email protected] Klop is a Senior Fellow in the Envest project at WRI. [email protected]
COVER PHOTO CREDIT IStockPhoto.com
April 2010

I . K E Y F I N D I N G S F O R I N V E S T O R S A N D A N A L Y S T S
3World Resources Institute
I. Key Findings for Investors and Analysts
Water-related risks are receiving more attention than in the past, yet the connection to power sector development is not well understood by investors, governments, and companies in South and Southeast Asia. This report presents a framework for investors and analysts to assess the risk of impacts from water-related issues, including growing water scarcity and declining water quality, on thermal and hydroelectric power generation plants. While this analysis focuses on publicly listed power generation companies in India, Malaysia, Philippines, Thailand, and Vietnam, the risks outlined may apply to listed power generation companies operating in other water scarce regions.
CONTEXT Emerging Asia is projected to have the fastest growth rate of power consumption in the world.
The drivers behind this power appetite – economic and population growth – are also increasing demands on limited freshwater resources.
The power sector requires a steady supply of water for cooling and generation to maintain loads and avoid disruptions.
The availability and quality of freshwater is rapidly declining in many parts of South and Southeast Asia due to demographic pressures and climate change.
India in particular faces critical water shortages in the next decade.
Malaysia, Thailand, the Philippines, and Vietnam are expected to face localized water pollution and shortages, with climatic patterns shifting towards longer dry seasons with more concentrated rainfall periods.
Investors are taking on more water risk.
The power sector is being liberalized in many countries in the region to attract the invest-ment necessary to meet economic goals, with higher risk-reward propositions for investors.
Deregulated power markets may offer little or no protection to shareholders in the event of an outage or load loss resulting in lost revenues or increased costs (if stipulated by operating license).
New thermal and hydro power development places long-term bets on water availability – yet future water supplies are often uncertain and potentially oversubscribed in the most electric power hungry and water scarce regions.
Technology will play a key role in mitigating water risk yet at a price and efficiency tradeoff.
Advanced cooling systems for thermal power such as dry cooling can reduce or eliminate freshwater dependency yet increase carbon emissions per unit power output through effi-ciency losses.
Likewise there are water penalties for carbon dioxide emission reducing technologies such as carbon capture and storage.

O V E R H E A T I N G
4 World Resources Institute
These competing priorities make it difficult for investors and companies to anticipate the impact of future climate change and water policies on investments.
Water risk has been obscured to date by regulatory protections.
Examples of water-related load losses or outages have occurred throughout South and Southeast Asia yet the financial impact has been limited due in part to heavy govern-mental support that minimizes shareholder risks.
Shareholder protections will become more costly to sustain and may drive regulatory change as freshwater scarcity increases over the longer term.
KEY FINDINGS 74 GW – over half of existing and planned capacity for major power companies – is located in areas that are considered to be water scarce or stressed.
WRI mapped water scarcity data with plant locations for the largest publicly listed power generation companies in the region, as shown in Figure 1.
See Appendix A for more information on this analysis.
FIGURE 1. Thermal Power and Hydropower Plant Locations and Water Stress Level
Note: Water stress indicators (WSIs) represent the ratio of total withdrawals to utilizable water. These indicators do not reflect anticipated demographic or climate changes (such as the tim-ing/quantity of precipitation) and therefore do not represent all facets of water-related risk. See Appendix A for information.Source: WRI. Data for power plants are from carma.org and 2008 company reports. The water stress indicators are from CGIAR/WRI/University of Kassel 2004.

I . K E Y F I N D I N G S F O R I N V E S T O R S A N D A N A L Y S T S
5World Resources Institute
FIGURE 2. Location of Power Capacity* by Water Stress Level in India
* Includes thermal and hydro plants owned by NTPC, Tata Power, and Reliance Infrastructure (including Reliance Power).Note: Planned capacity includes all stages of project development reported in corporate financial disclosures but not yet operational in 2009. Source: WRI. See Appendix A for more information.
0% 20% 40% 60% 80% 100%
Percentage of Total Capacity
Water scarce
Water stressed
Moderate water availability
Water abundant
Planned(60 GW’s)
Existing(33 GW’s)
Total(93 GW’s)
TABLE 1. Water Risk Framework for the Power Generation Sector
Business Model Water Dependency Water Security
Are shareholder returns protected from falling output?
How much water is required to maintain loads?
Is the plant in a water scarce region?How are the plant’s water supplies secured?
Risk
Lev
el
High• Merchant • Open-loop thermal
• Run-of-the-river hydro• Water scarce or stressed area• History of water-related events• High rate of urbanization/industrialization in watershed
Medium
• Hybrid (Regulated/ Merchant)• Regulated (high utilization rate
required)
• Closed-loop thermal• Reservoir hydro• Supercritical coal• Combined cycle gas
• Reservoir with irrigation commitments• Dependence on seasonal precipitation
Low
• Regulated (no risk from falling output)• Captive• Competitive tariff
• Renewables (excluding biomass and concentrated solar thermal)
• Seawater cooling• Wastewater cooling• Air cooling
• Water abundant area • Long-term water contract
Source: WRI.
In India, 79% of new capacity will be built in areas that are already water scarce or stressed.
NTPC, Tata Power, and Reliance Infrastructure's (including Reliance Power’s) new capaci-ty is increasingly located in water scarce or stressed areas, as shown in Figure 2.
Water scarcity is expected to intensify in the future as the impacts of climate change and demographic pressures decrease renewable water supplies.
Water risk is determined by a plant’s business model, dependency on water, and security of water supplies.
Table 1 presents a framework that investors and analysts can use to assess exposure to water risks.

O V E R H E A T I N G
6 World Resources Institute
Potential financial impacts of water-related issues for the power generation sector include:
Lost revenues and increased costs of goods sold (COGS).
Water-related disruptions such as prolonged droughts and heat waves can lead to low reservoir levels and insufficient cooling water, resulting in load losses or outages that often coincide with periods of heavy demand, thereby forfeiting revenues.
Water shortages can necessitate temporary water and power supply measures that increase production costs and therefore COGS.
Water shortages are episodic in nature and can occur in any timeframe, although their frequency and severity are projected to increase over time.
Impacts on shareholder value will vary by business model and power purchase contracts.
Higher capital expenditures (CAPEX).
As water availability and quality declines, companies may need to invest in water infra-structure projects to secure supplies (such as pipelines, dams/reservoirs, and desaliniza-tion facilities), water treatment systems (for plant influents or/and effluents), and/or more advanced cooling systems (such as air, seawater, wastewater reuse, or condensed water cooling).
The need for such investments will increase in the future, with the impact on the industry determined by regulations and financing terms.
Project execution delays and constraints on growth.
As water shortages become more acute, policymakers are likely to respond by requiring more stringent water efficiency and usage requirements. This could increase permitting and development periods for new plant projects. As a result, financing may become more difficult and expensive.
New plants may be restricted in water scarce regions by government decree or by lack of financing if water supply cannot be secured at an attractive rate.
These risks are currently present in some Indian states where signed MOU’s for new power capacity are believed to exceed available water resources.
Over time these risks will increase in severity and geographic scope.
An HSBC analysis suggests that delays in project execution and loss of output due to water scarcity could be material.
Analysts found that a delay of three months in project execution due to water permitting issues will result in the internal rate of return (IRR) dropping by a mere 25 basis points (bps), but as the delay period extends, the drop in IRR becomes more serious. A 12-month delay in commercial operation results in the IRR dropping by nearly 150 bps.
If water shortages reduce power output, each 5% drop in the plant load factor will result in nearly a 75 bp drop in the project IRR.
I . K E Y F I N D I N G S F O R I N V E S T O R S A N D A N A L Y S T S
7World Resources Institute
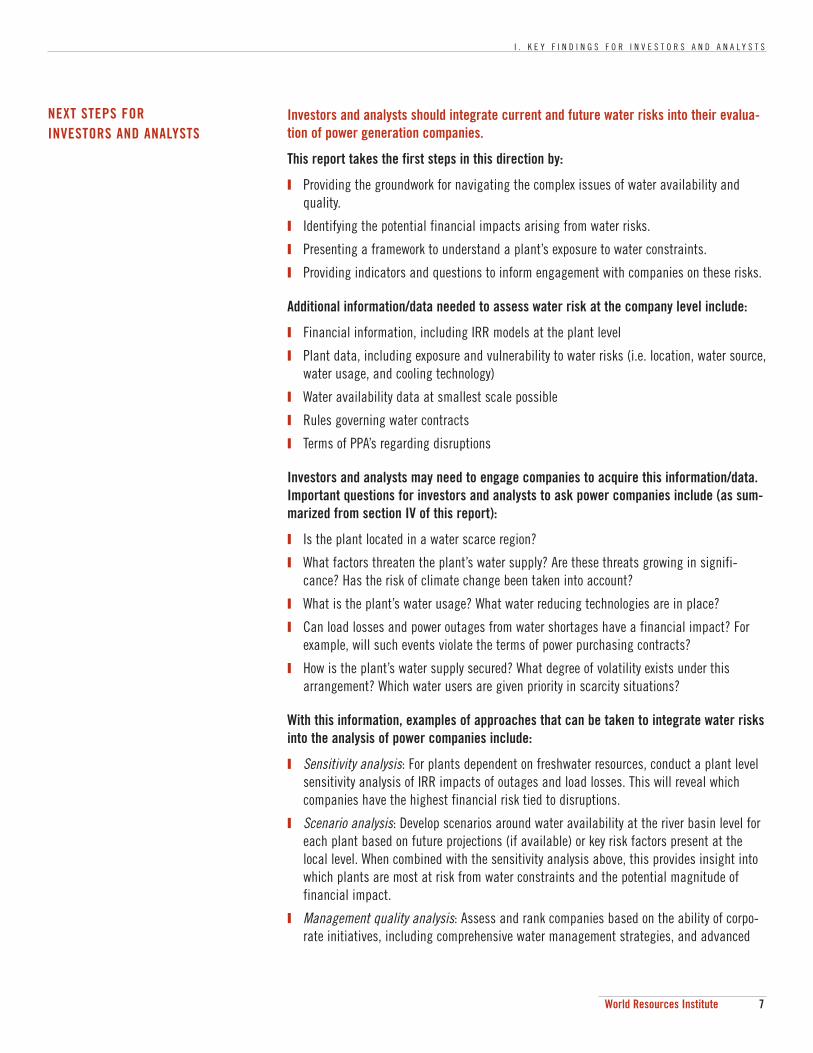
NEXT STEPS FOR INVESTORS AND ANALYSTS
Investors and analysts should integrate current and future water risks into their evalua-tion of power generation companies.
This report takes the first steps in this direction by:
Providing the groundwork for navigating the complex issues of water availability and quality.
Identifying the potential financial impacts arising from water risks.
Presenting a framework to understand a plant’s exposure to water constraints.
Providing indicators and questions to inform engagement with companies on these risks.
Additional information/data needed to assess water risk at the company level include:
Financial information, including IRR models at the plant level
Plant data, including exposure and vulnerability to water risks (i.e. location, water source, water usage, and cooling technology)
Water availability data at smallest scale possible
Rules governing water contracts
Terms of PPA’s regarding disruptions
Investors and analysts may need to engage companies to acquire this information/data. Important questions for investors and analysts to ask power companies include (as sum-marized from section IV of this report):
Is the plant located in a water scarce region?
What factors threaten the plant’s water supply? Are these threats growing in signifi-cance? Has the risk of climate change been taken into account?
What is the plant’s water usage? What water reducing technologies are in place?
Can load losses and power outages from water shortages have a financial impact? For example, will such events violate the terms of power purchasing contracts?
How is the plant’s water supply secured? What degree of volatility exists under this arrangement? Which water users are given priority in scarcity situations?
With this information, examples of approaches that can be taken to integrate water risks into the analysis of power companies include:
Sensitivity analysis: For plants dependent on freshwater resources, conduct a plant level sensitivity analysis of IRR impacts of outages and load losses. This will reveal which companies have the highest financial risk tied to disruptions.
Scenario analysis: Develop scenarios around water availability at the river basin level for each plant based on future projections (if available) or key risk factors present at the local level. When combined with the sensitivity analysis above, this provides insight into which plants are most at risk from water constraints and the potential magnitude of financial impact.
Management quality analysis: Assess and rank companies based on the ability of corpo-rate initiatives, including comprehensive water management strategies, and advanced

O V E R H E A T I N G
8 World Resources Institute
technologies, such as air cooling, to mitigate water risk. Use this information to appropri-ately adjust conclusions from the sensitivity and scenarios analyses.
How, or if, the results from these approaches can be integrated into financial models will depend on factors including the analyst’s view on the probability of impact and the reliabil-ity of the underlying data. However, even if they cannot be integrated into financial models they can be used to inform the general view on management quality. This subjective view-point on a company, combined with investor data on companies, can inform the following investment decisions: buy/sell decisions, engagement of various intensities and stock/sector weightings in portfolios.

I I . S E C T O R O V E R V I E W
9World Resources Institute
II. Sector Overview
KEY POINT
The rapid growth of thermal and hydroelectric power plants increases the risk of water-related issues for power generation companies in the region.
The power sector in South and Southeast Asia is expected to experience significant growth over the medium to long-term.
Emerging Asia has the fastest projected growth in electric power generation in the world.1 Despite the recent global economic downturn, longer-term projections point to sustained growth in electricity demand and higher than average GDP growth rates (Figure 3).2 Conventional wisdom indicates that in a developing economy the rate of growth of demand for power is about 50% more than the rate of economic growth.3 Vietnam has exceeded this with the electricity industry growing at 15% versus 7% GDP growth between 2001 – 2008.4
Source: IEA WEO 2009.
FIGURE 3. Electricity Consumption and GDP Growth Rate Projections to 2030
9%
8%
7%
6%
5%
4%
3%
2%
1%
0%
GDP
Grow
th R
ate
1980–1990 1990–2006 2006–2015 2015–2030
India
OECD
Non-OCED Asia
World
Elec
trici
ty C
onsu
mpt
ion
TWh
India
Non-OECD Asia(excl. China & India)
201520061980 2000 2030
2000
1500
1000
500
0
India is by far the largest power consumer and producer in the region, with expected demand in 2013 more than double that of the rest of the countries combined (Figure 4). To meet this demand, power capacity is expected to grow by over 50% in India to 217 GWs (Figure 5).5
The Indian government has determined that generating capacity needs to grow from the 2006 level of 144 to 778GW by 2032.6,7 In the nearer-term, the Central Electricity Authority of

O V E R H E A T I N G
10 World Resources Institute
the Indian government has instated a goal to reach “power for all” by 2012, requiring an additional 56 GW from 2008 to 2012.8 Even if this rapid capacity addition is achieved, sup-ply would still not be able to meet demand, with a demand-supply mismatch projected to continue until at least 2017.9
Heavy regulation of the sector will continue with governments planning to meet energy goals primarily with thermal and hydroelectric power.
The sector is far from liberalized, with state ownership characterizing the majority of power production in the region. In India, states own 52% of power production, the central govern-ment owns 34%, and the private sector owns 14%.10 The private sector share is expected to rise in the future, with one source estimating 27% of installed capacity will be privately owned by 2017.11 The Indian government plays a large role in project development, with 90% of new power projects publicly funded.12 In Vietnam, only 24% of installed capacity in 2006 was private, although this share is expected to increase as it depends more heavily on IPPs (independent power producers) and SPPs (small power producers) to meet energy goals.13
The majority of private sector power projects are regulated, with companies entering into long-term power purchase agreements (PPAs) with state entities that encourage investment by reducing risks for shareholders through guaranteed rates of return, cost pass-through mechanisms, and/or tariffs/subsidies. In South and Southeast Asia, such agreements are often paired with a single-buyer model – that is, when the state entity is the sole purchaser of wholesale power. Each country has undergone some degree of power sector reforms in recent years with more planned in the future. To date, electricity spot markets exist only in India and the Philippines. See Table 2 for a comparison of key power sector characteristics.
Source: JPMorgan 2009, Electricity of Vietnam (EVN) 2009.
1000
800
600
400
200
0India Malaysia Philippines Thailand Vietnam
Projected Growth 2009–2013
2008
FIGURE 4. Power Demand 2008 and Projected New Power Demand 2013 (Billion KWh)
Powe
r Dem
and
in B
illio
n KW
h’s
Source: JPMorgan 2009, Electricity of Vietnam (EVN) 2009.
FIGURE 5. Power Capacity 2008 and Projected New Power Capacity 2013 (GW)
Powe
r Cap
acity
in G
W
225
200
175
150
125
100
75
50
25
0
Projected Growth 2009–2013
2008
India Malaysia Philippines Thailand Vietnam

I I . S E C T O R O V E R V I E W
11World Resources Institute
TABLE 2. Comparison of Power Sector Characteristics, 2008
% Market Privately Owned
Installed Capacity1
New Planned Capacity 2009 – 20132
Current Fuel Mix3
Factors Driving Future Fuel Trends
Wholesale Power Markets?
Dominant Business Model
India 14% 144 GW 74 GW 53% coal25% gas10% hydro
Domestic coal reserves limited. Emphasis on large capacity ther-mal projects (4,000+ MWs).
Yes Regulated PPAs
Malaysia 50% 21 GW 2.8 GW 64% gas29% coal7% hydro
Constraints on domestic gas resources. 30GW hydro potential.
No Single-buyer (TNB)
Philippines 43%* 16 GW 0.3 GW 26% coal 21% hydro 18% gas12% geo-thermal
Domestic fossil resources limited. Over 1 GW new geothermal and 7 GW hydro potential.
Yes Long term PPAs
Thailand 37% 29 GW 7 GW 73% gas19% coal6% hydro
Natural gas will remain dominant with 60% market share.
No Single-buyer (EGAT)
Vietnam 24%4 12 GW 13 GW 53% coal25% gas10% hydro
Hydro to account for 39% of pro-duction with 12 GW untapped resources.
No Single-buyer (EVN)
* Percent of state assets privatized as of May 2008. Sources:1. World Bank 2008 and EIA 2006.2. JPMorgan estimates (Lee and Li, 2009) except Vietnam, which was calculated based on data from EIA. 2008 and estimates from JPMorgan “Company Visit Note: VSH” June 8, 2009.3. World Bank 2008 and EIA 2006.4. 2006. Source: EVN website. http://www.evn.com.vn/
While many of the governments have goals to increase the development of renewable sources of energy; coal, natural gas, and hydroelectric plants are expected to provide the majority of electricity supply. See Figure 6.
* Not including biomass, which is included under thermal.Source: WRI. Based on JPMorgan 2009, Nomura International Ltd 2009, World Bank 2008, ADB 2009.
FIGURE 6. Projected Power Mix in 2013
0% 20% 40% 60% 80% 100%
Percentage of Total Power Capacity, 2013
Thermal
Hydro
Renewables*
India
Malaysia
Philippines
Thailand
Vietnam

O V E R H E A T I N G
12 World Resources Institute
The dependency of thermal and hydroelectric power plants on water for cooling and gen-eration creates water-related risks for the sector.
Hydroelectric plants are dependent on water for generation as maintenance of water reser-voir or river levels is necessary for full capacity generation. Thermoelectric plants, including coal, natural gas, biomass, and nuclear, require varying amounts of water for steam, cool-ing, and other process uses. Fuel type, cooling system technology, and capacity are the greatest determinants of water use. Wind and solar photovoltaic power require very little water. See p 25 for more information on factors affecting a power plant’s water require-ments.
Water quality can affect the availability of water supplies for both thermal and hydroelectric plants. For example in the case of hydro, high turbidity (often linked to a flood event) can affect plant performance or cause plant shutdowns. The same consequences can happen to thermal plants when a heat wave increases the temperatures of intake cooling water supplies above an acceptable threshold. In addition to physical constraints, water quality regulations requiring temperature and/or pollution standards may force load losses or outages when these regula-tions cannot be met (such as a heat wave that increases effluent water temperatures above regulatory thresholds).
Water-related risks are emerging in South and Southeast Asian power markets.
Water scarcity and quality trends are decreasing the availability of suitable water supplies in key parts of India and metro areas in Southeast Asia, which will be discussed in Section III. The nature of water supply risk is similar to fuel supply risk given that lack of cooling water, poor water quality, and reduced reservoir levels can lead to reduced output or in the most extreme cases, power outages. This is true even in regions that are water abundant on average but where changes to the timing of water flows can create temporary water short-ages. Figure 7 maps recent examples of water constraints to power generation in South and Southeast Asia.

I I . S E C T O R O V E R V I E W
13World Resources Institute
Source: WRI.Notes: 1. http://www.thaindian.com/newsportal/business/kerala-set-to-face-water-shortage-due-to-poor-monsoon_10068608.html.2. The Australian, “India in Crisis as Heat Leads to Power Shortages” April 19, 2007.3. Hindustan Times, "Power Cuts to Take Care of Water Scarcity" April 23, 2006.4. China Daily, “Indian Power Plant Shuts Down” August 16, 2004.5. Financial Express (India)-Hydro Logical – 29 June 2009.6. Associated Press “Power cuts, water shortage hit Philippines as dry spell persists” July 27, 2007.7. Manila Standard, “Power Outages Feared: Time to Tap IPPS” May 18, 2002.8. Gemma G. Naling, “Dry Spell” Makati Business Club, No. 7, December 1998.9. Marc Levinson, Watching Water, JPMorgan Global Equity Research April 2008.10. Thai Press Reports – “Power Shortage Looms” – April 1, 2004.11. Saigon Times Weekly -Power Cut To Last Until June- 19 April 2008.12. Dow Jones & Company, Inc.- Vietnam Forecasts Electricity Shortage This Yr – Official- 10 February 2006.13. Financial Times Information – “Industry: Vietnam Faces Power Shortage Following Drought” – April 28, 2005.14. Industry – Electricity Shortage Haunting Vietnam – 16 May 2000.
FIGURE 7. Examples of Water Constraints to Power Generation in India, Philippines, Thailand, and Vietnam
HIMACHAI PRADESH, 2004:Floods shutdown a 1,500 MW hydro plant for seven days due to high silt lev-els.4
KERALA, 2008Power cuts ordered when monsoon rainfall was 65% less than normal.1
MADHYA PRADESH, 2006Power cuts made to allevi-ate the water shortage in the region.3
INDIA, 2002–03Rainfall 19% below normal reduced hydropower by 12.9%.5
MAHARASHTRA, 2007Heat waves led to power shortages of 20% in the state and 9% across India.2
THAILAND, 2004Lack of rain reduced power generation in all major hydroelectric dams.10
RAYONG, 2005EGCO's Rayong plant nearly ran out of cooling water in the dry season of 2005 when cooling water reservoirs fell to only 9% of capacity.9
HANOI, 2008Water shortages led to the release of 2.2 billion m3 of water (equivalent to 430 million kWh of electricity) from three major hydropower plants to supply agri-culture users. EVN lost VND6.1 trillion (US$380 mil-lion) from buying 24.11 billion kWh's from other power sources.11
NORTH VIETNAM, 2006Water shortages at key hydro plants led to power cuts of 200 million kWh's of electricity.12
HO CHI MINH, 2000Late rainfalls led to power cuts.14
MANILA, 1997–1998Prolonged drought led to severe water shortages at the Angat dam.8
LUMBAN, 2007The Caliraya hydro-power plant was shut down when a prolonged dry spell hit during the rainy season.6
VIETNAM, 2005Three months of drought and severe weather reduced power production at eleven hydroelectric plants comprising 40% of total generation capacity. Water was diverted for agriculture, lead-ing to a power shortfall of 854 million kWh's.13
MANILA, 2002The Angat Dam faced criti-cally low reservoir levels due to an unusually long dry spell during an El Niño year.7

O V E R H E A T I N G
14 World Resources Institute
III. Water Scarcity Analysis and Trends
KEY POINTS
A significant proportion of power generation is located in areas at high risk of experienc-ing water-related issues.
Higher temperatures, greater variability in precipitation, and increasing competition for water will increase the frequency and severity of water shortages in the region in the future.
India is most at risk, although all countries are expected to experience longer dry seasons and more intense wet seasons.
The majority of existing and new power generating capacity for publicly listed companies in South and Southeast Asia are located in areas classified as water scarce and stressed.
Figure 8 provides a preliminary picture of water scarcity in areas of power generation. WRI mapped over 150 existing and planned thermal and hydro power plants from the largest publicly listed power generation companies in the region by using data from corporate finan-cial reports and carma.org. Planned capacity includes all stages of project development reported in corporate financial disclosures but not yet operational in 2009. Water scarcity data is from the International Water Management Institute, WRI, and the University of Kassel. These indicators do not include important elements of water risk, including future climatic changes and demographic trends. For example, plants located in regions classified as water abundant may face risks due to changes in the timing of precipitation patterns (as shown by examples in Figure 7). See Appendix A for more information.
The analysis found that new capacity will be increasingly located in areas already consid-ered to be water stressed or scarce, as shown in Figure 9. India is the country of most con-cern for water constraints, as shown in Figure 10, with 73% of capacity (62% of existing and 79% of new capacity) of the three largest power generation companies — NTPC, Tata Power, and Reliance Infrastructure (including Reliance Power) — located in water scarce or stressed areas.
While the water stress index data used in this analysis is too coarse to provide insights at the plant level, it does highlight the areas considered to be of highest risk of water scarcity. However it does not provide information about changes in the timing and reliability of water flows, the most important factor when considering impacts to the power generation sector. As a result, it may understate water risks related to the timing of water flows in water abun-dant areas in Southeast Asia.

I I I . W A T E R S C A R C I T Y A N A L Y S I S A N D T R E N D S
15World Resources Institute
Source: WRI. Data for power plants are from carma.org and company reports and the water stress indicators are from CGIAR/WRI/University of Kassel 2002.Note: Water stress indicators (WSIs) represent the ratio of total withdrawals to utilizable water. Water stress indicators (WSIs) represent the ratio of total withdrawals to utilizable water. These indicators do not reflect anticipated demographic or climate changes (such as the timing/quantity of precipitation) and therefore do not represent all facets of water-related risk. See Appendix A for information.
FIGURE 8. Existing and Planned Thermal Power and Hydropower Plants by Capacity and Water Stress Level
EXISTING PLANT CAPACITY (MW)
PLANNED PLANT CAPACITY (MW)

O V E R H E A T I N G
16 World Resources Institute
Climate change and increasing competition will exacerbate water constraints in the future.
Water scarcity is a growing concern for many parts of the world. In India in particular, and in parts of the other four countries, high demand for water, coupled with water pollution, means that available water supplies are declining. This trend will accelerate in the future as population and economic growth leads to higher per capita water consumption in the region.
Source: WRI. See Appendix A for more information.
FIGURE 9. Existing and Planned Power Generation Capacity by Water Availability
Capa
city
in G
W
40
35
30
25
20
15
10
5
0Water Scarce
Existing
Planned
Water Stressed Moderate WaterAvailability
Water Abundant
Source: WRI. See Appendix A for information.
FIGURE 10. Percent of Power Capacity by Water Availability for India, Malaysia, Philippines, Thailand, and Vietnam
Water scarce
Water stressed
Moderate water availability
Water abundant
0% 20% 40% 60% 80% 100%
Percentage of Existing and Planned Capacity
India
Malaysia
Philippines
Thailand
Vietnam

I I I . W A T E R S C A R C I T Y A N A L Y S I S A N D T R E N D S
17World Resources Institute
India is by far the most water scarce country included in the analysis. In India, over 70% of water resources are inaccessible, not renewable, unreliable, or restricted due to environmen-tal regulations.14 Furthermore, water demand is expected to outgrow supply in India by 50% by 2030 and the World Bank estimates that India will exhaust all available water supplies by 2050.15
The other focus countries are in Southeast Asia, one of the water-rich regions in the world. With abundant rainfall, the volume of water available per person is higher than most other regions in the Asia-Pacific. However, much of the region’s precipitation is seasonal and is expected to be impacted by climate change. For example, Thailand has abundant water resources but the problem is the timing and accessibility of water. Experts believe that in the northeast, where a third of the population lives, water will need to be transported from abundant to scarce areas, greatly increasing costs.16
The two primary drivers of increasing water scarcity and declining water quality, climate change and increased demand, are discussed in more detail in the following sections.
A. CLIMATE CHANGE Climate change will continue to affect the quantity and quality of fresh water renewals in the region, with impacts increasing over time.
The primary impact of the heat-trapping gasses that contribute to global climate change is to increase the mean average temperature over time, as shown in Table 3 for countries included in this report. Higher temperatures can affect water availability in the following ways:
Higher rates of evaporation
Increased melting of snowpack and glaciers that feed river systems
Changes to precipitation patterns
Salt intrusion in coastal freshwater resources
TABLE 3. Projected Temperature Increases in Select Asian Countries
CountryObserved Temperature Increases (°C)
(1979–2005)
Range of Projected Temperature Increases(mean surface temperature)* (°C)
2010–2039 2040–2069 2070–2099
India 0.68 per century 0.89–0.92 1.54–2.56 2.34–4.5
Indonesia 1.04–1.40 per century 0.75–0.87 1.32–2.01 1.96–3.77
Malaysia Data not available
Philippines 1.4 per century
Thailand 1.04–1.80 per century
Vietnam 1.0 per century
* Range based on low and high emissions scenarios. Temperature increases for India are from data for South Asia averaged over 4 seasons. Baseline period is 1980–1999.1. Asian Development Bank. April 2009. “The Economics of Climate Change in Southeast Asia: A Regional Review.” Page 23.2. Contribution of Working Group II to the Fourth Assessment Report, Climate Change 2007, Impacts, Adaptation and Vulnerability, p. 475.

O V E R H E A T I N G
18 World Resources Institute
Increased evaporation rates can directly affect the availability of water supplies. In Vietnam, increased evaporation due to higher temperatures has reduced the availability of water for agricultural and industrial purposes.17
The melting of mountain glaciers due to higher global temperature is expected to bring about major shifts in river flows.18 This effect is predicted to reduce water supplies for more than one-sixth of the world’s population that lives in glacier or snowmelt-fed river basins.19 Asia will be dramatically impacted by changing hydrological patterns, particularly river run-off. The siting process for new power plants should consider these long-term changes, espe-cially in the case of hydroelectric power.
India is one of the regions most at risk from this effect as climate change leads to the recession of the Himalayan glaciers. About 67% of Himalayan glaciers are reported to be receding. As the ice diminishes glacial flows will at first increase and then decrease over the long-term as the glaciers retreat. Nearly 70% of the water in the Ganges River system comes from these glaciers.20
Higher temperatures will impact precipitation patterns. From 1960-2000, Southeast Asia experienced a decrease in rainfall and a decreased number of rainy days. This trend is expected to continue with future projections, shown in Table 4. In the next 50 years, under a high greenhouse gas emissions (base case) scenario, precipitation in Southeast Asia is pro-jected to decrease, but then to increase by the end of the century, with strong variation expected between March and May. In broad terms, the wet season will become wetter and the dry season drier. Southeast Asia has also experienced an increase in extreme events, includ-ing prolonged droughts. These events are predicted to occur with even greater frequency.
In India, precipitation is expected to increase more than in Southeast Asia. As with Southeast Asia, there will be increased seasonal variation. In northern India, precipitation is expected to decrease by 15–30 mm per month most of the year except with an upsurge dur-
TABLE 4. Projected Precipitation in Select Asian Countries
Country Observed Changes in Precipitation*
Projected mean Change in Precipitation (%)**
2010–2039 2040–2069 2070–2099
India*** Increase in extreme rains in North-West during summer monsoon in recent decades; lower num-ber of rainy days along East coast.
2.5 to 5.5 10.25 to 11.75 9.75 to 6.75
Malaysia Number of rainy days has declined throughout Southeast Asia.
0.25 to -1.00 1.00 to 2.25 3.00 to 8.00Philippines Increase in annual rainfall and in the number of rainy days.
Thailand Decreasing annual rainfall for the last five decades.
Vietnam Decrease in monthly rainfall in July-August and increase in September to November.
* Studies conducted over varying time periods.** Range based on low and high emissions scenarios. Baseline period is 1961–1990.*** Precipitation changes for India are from data for South Asia averaged over 4 seasons.1. Asian Development Bank. April 2009. “The Economics of Climate Change in Southeast Asia: A Regional Review.” Page 27.2. Contribution of Working Group II to the Fourth Assessment Report, Climate Change 2007, Impacts, Adaptation and Vulnerability, p. 475.

I I I . W A T E R S C A R C I T Y A N A L Y S I S A N D T R E N D S
19World Resources Institute
ing the rainy season. As a result, although overall precipitation will increase, it will be con-centrated on the monsoon season with dryer months for the rest of the year.21
The vast majority of cooling water and water for hydroelectric generation is sourced from riv-ers, rather than groundwater. Impacts on power generation will need to be assessed at the river basin level. Figure 11 shows the rivers in the focus countries with the lowest projected water supply in 2025.
As with the water stress indicators shown in Figure 8 (on p 15), this metric does not capture changes in seasonal water flows. For example, the Mekong River is not categorized as a water scarce river basin using this metric, however the variability of water renewals is expected to increase. Compared with 1960-1990 levels, the maximum monthly flow of the Mekong River in Vietnam is projected to increase between 35% and 41% in the basin and the minimum monthly flow will fall by 17-24% in the basin.22 By the end of the 21st century, the annual flow of the Mekong River is projected to decline by 16–24%.23
B. DEMAND FOR WATER RESOURCES Demand for water will increase across the region as population grows and becomes wealthier, driving competition among domestic, industrial and agricultural uses.
Population and economic growth will increase demands for food production globally. The Food and Agriculture Organization of the United Nations estimates that by 2050 food production will need to increase by 100% in developing countries to meet population demands. As the primary water user, food production will increase demands on renewable freshwater sources. In India, water demand is expected to increase by 32% by 2050 due to increased food production.24
Source: WRI.
FIGURE 11. Major River Basins Facing Water Stress and Scarcity in South and Southeast Asia
Wat
er S
uppl
y Per
Cap
ita
1995
20252500
1500
1000
500
0
2000
Ponn
aiyar
(India
)
Rabarm
ati (In
dia)
Penn
er (In
dia)
Damod
ar (In
dia)
Cauweri
(India
)
Indus
(India
)
Krish
na (In
dia)
Tapti (
India)
Mahi (I
ndia)
Hong (
Vietna
m)
Chao P
hraya
(Thail
and)
Suba
marekh
a (Ind
ia)
Godav
ari (In
dia)
Narmad
a (Ind
ia)
Brahman
i (Ind
ia)
Gange
s (Ind
ia)
Water Stressed
Water Scarce

O V E R H E A T I N G
20 World Resources Institute
Irrigated agriculture, which serves as the backbone of food production in the region, is the main water user in each of the focus countries, as shown in Figure 12. Climate change will likely increase demand for irrigated agriculture due to changes in precipitation patterns resulting in prolonged dry periods. One study forecasts an increase in demand by 10% to irri-gate crops for every 1 degree Celsius rise in temperature in Asia. This research estimates an increase of over 40% in irrigated land by 2080.25 However, there is great potential to improve the efficiency and productivity of agricultural and irrigation systems, and therefore improve water availability, through technological innovations, increased investment, crop choice and improved drought resistant plants, and better regulations and oversight of water use.
Hydroelectric power plants in particular watersheds may face risks from the increasingly dif-ficult trade-offs in reservoir management, where power and irrigation demands compete for the same stored water resources. While the bulk of hydropower water use is non-consump-tive and can be used for other purposes downstream, competition occurs over the right to withdraw water from the reservoir. Most large hydropower plants are multipurpose dams uti-lized for power generation, flood control, irrigation, water storage, and recreational activities.
Thermoelectric plants along Thailand’s eastern seaboard, a heavily industrialized region with many of the country’s power plants, receive little rainfall and rely on a small number of res-ervoirs and pipelines to meet freshwater demand. However, there has been increasing con-flict between agricultural and industrial users over water resources – particularly during times of drought. The issue has become increasingly politicized as government officials face pressure from the farmer’s demands to protect agricultural water allocations.26
The impacts of water scarcity are expected to be most dramatic in India. India’s National Water Policy outlines water allocation priorities as drinking water, irrigation, hydropower, ecology, industry, and navigation.27 However there is no consistent framework for dealing with water users’ rights, especially when priority uses are in competition. There is social pressure to favor people over industrial users in conflict situations.28 More broadly, the sta-tus of rural and agricultural populations’ water rights will likely heighten political tensions between water users in the region as water becomes scarcer in the future.
* Power generation falls under Industry in this classification.Source: FAO 2004
FIGURE 12. Water Withdrawals by Use, 2004
Agriculture
Industry*
Domestic
0% 25% 50% 75% 100%
Percent of Total Freshwater Withdrawals
India
Malaysia
Philippines
Thailand
Vietnam

I V . W A T E R R I S K E X P O S U R E F R A M E W O R K
21World Resources Institute
IV. Water Risk Exposure Framework
KEY POINTS
A plant’s regulatory protection from shareholder risk, water dependency, and the security of water supplies should be considered when assessing exposure to water constraints.
Important data and information are rarely publicly reported; therefore investors and ana-lysts will need to engage with companies to understand risk exposure.
Exposure to water constraints can be assessed using the following risk factors:
A. Business Model: Given the heavy regulation of the power generation sector in South and Southeast Asia, the primary determinant of water risk lies in the terms of the power purchase agreement (PPA, also called an off-take agreement).
B. Water Dependency: A plant’s water requirements are primarily influenced by fuel type/technology and cooling system water source and technology.
C. Water Security: Future risks to water supplies, including shortages and/or declining quality, must be assessed at the local level with consideration to changes in climate and hydrological patterns as well as trends affecting competing uses. The relative strength and timeframe of water allocations and contracts must also be considered.
Table 5 presents a framework for evaluating exposure to water-related risks. These risk lev-els provide guidance for analysts and investors to assess risk exposure, but each plant should be considered on a case-by-case basis.
TABLE 5. Water Risk Framework for the Power Generation Sector
Business Model Water Dependency Water Security
Are shareholder returns protected from falling output?
How much water is required to maintain loads?
Is the plant in a water scarce region?How are the plant’s water supplies secured?
Risk
Lev
el
High • Merchant • Open-loop thermal• Run-of-the-river hydro
• Water scarce or stressed area• History of water-related events• High rate of urbanization/ industrialization in water-
shed
Medium • Hybrid (Regulated/ Merchant)• Regulated (high utilization rate required)
• Closed-loop thermal• Reservoir hydro• Supercritical coal• Combined cycle gas
• Reservoir with irrigation commitments• Dependence on seasonal precipitation
Low • Regulated (no risk from falling output)• Captive• Competitive tariff
• Renewables (excluding biomass and con-centrated solar thermal)
• Seawater cooling• Wastewater cooling• Air cooling
• Water abundant area • Long-term water contract
Source: WRI

O V E R H E A T I N G
22 World Resources Institute
Shareholder risk to water-related disruptions will primarily be determined by the plant’s business model.
In general, shareholder risks are currently minimal for most power plants due to existing power purchase agreements that allow generators to pass costs through while guaranteeing a level of power demand or even a return on equity. However, there are circumstances today where water scarcity risk will affect shareholders. Plants without off-take agreements that guarantee returns or cost pass-throughs are at highest risk. Even for regulated plants, supply disruption may void terms of some PPAs that require utilization or generation levels to remain in effect.
Determining a plant’s water dependency and water security risks can be difficult due to lack of publicly available data.
Information on purchasing contracts and water allocations is generally accessible. However, information on water usage varies while there is very limited data available on water avail-ability at the level of detail required to properly assess risk. As a result, investors and ana-lysts can use the questions and metrics outlined in Figures 13, 16, and 19 to engage com-panies on potential exposure to regulatory, water dependency, and water security risks. These three dimensions of water-related risks must be considered together in order to assess expo-sure at the plant or company level.
The following presents more information on each dimension of water scarcity risk.
A. BUSINESS MODEL Currently, shareholder risk to water scarcity is largely minimized by protective regulations.
As discussed in Section II, electric power generation is heavily regulated and closely tied to national economic development plans in all focus countries. Much of the power sector in Asia (and certainly in the five focus countries) is state-owned and heavily regulated. In a regulated environment, valuation is driven primarily by the need to maintain reliability and ability to pass their costs through to the end user. The IPPs typically depend on PPAs which cover their fixed costs. Financiers and investors often rely more heavily on a strong power off-take agreement than on their assessment of the plant’s stand-alone value.
Regulated power plants typically have long-term PPAs with state entities with some combi-nation of guaranteed rates of return, cost pass-through mechanisms, and/or tariff/subsi-dies. Competitive tariff is a model emerging in India where the developer sets the PPA terms through a bidding process. Captive power plants are those with a dedicated private sector buyer, often industrial, with a long-term contract for a specified percentage of the power produced. Merchant power plants are those that do not have PPAs and instead sell electricity to wholesale markets.
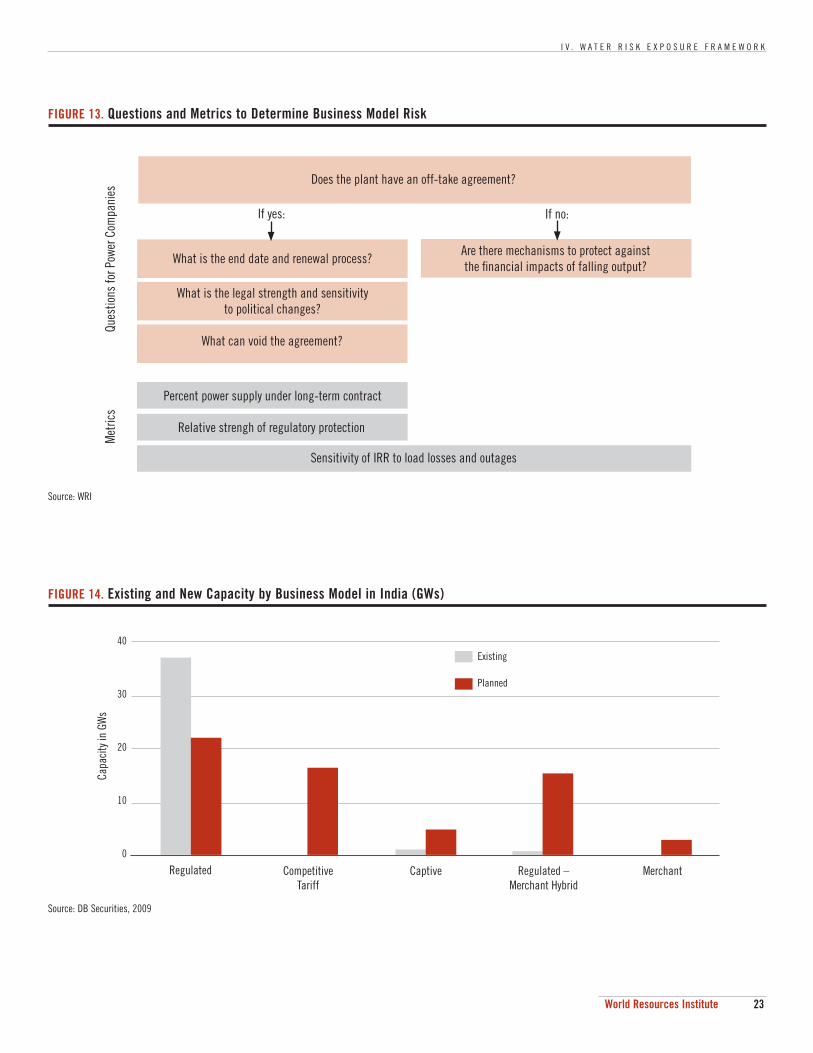
Most, but not all, power produced in the region is regulated. An unregulated example is Aboitiz Power’s 360MW Magat hydro facility, a pure merchant power plant that sells power to the Philippine electricity spot market.29 India has one of the most deregulated markets in the region, with unregulated projects representing a small but growing market share.30 In 2009, merchant plants represented about 6% of total power sold in India yet this share is predict-ed to increase to over 30% by 2017.31 See Figure 14 for a comparison of Indian capacity by business model and Figure 15 for a comparison of India’s largest power companies.
I V . W A T E R R I S K E X P O S U R E F R A M E W O R K
23World Resources Institute
What is the end date and renewal process?
FIGURE 13. Questions and Metrics to Determine Business Model Risk
Source: WRI
Ques
tions
for P
ower
Com
pani
es
Does the plant have an off-take agreement?
Met
rics
What is the legal strength and sensitivity to political changes?
What can void the agreement?
Are there mechanisms to protect againstthe fi nancial impacts of falling output?
Percent power supply under long-term contract
Relative strengh of regulatory protection
Sensitivity of IRR to load losses and outages
If no:If yes:
Source: DB Securities, 2009
FIGURE 14. Existing and New Capacity by Business Model in India (GWs)
Capa
city
in G
Ws
40
30
20
10
0
Regulated
Existing
Planned
CompetitiveTariff
Captive Regulated –Merchant Hybrid
Merchant

O V E R H E A T I N G
24 World Resources Institute
Despite regulatory protection, water risk may become material under certain circum-stances if:
1. Unregulated plants (without PPA’s) do not have the ability to pass costs onto consumers; or
2. Load losses or outages caused by water shortages violate the terms of the purchase agreements; or
3. The regulatory framework changes.
Water scarcity risk is most prominent for merchant plants that rely on spot electricity mar-kets and do not have regulated returns. However, even regulated plants may not be immune to water scarcity risk. If a severe drought or heat wave results in a load loss or outage that violates the PPA plant load factor requirements, they may be exposed. Risk associated with competitive tariff and captive business models must be assessed on a case-by-case basis depending on PPA terms. See Table 6 for a comparison of relevant shareholder risk protec-tions across the region.
Source: DB Securities, 2009
FIGURE 15. Percent of New Capacity by Business Model for NTPC, Tata Power, and Reliance Infrastructure in India
0% 20% 40% 60% 80% 100%
NTPC
Tata
Reliance
Regulated
Competitive Bidding
Captive
Hybrid (Regulated + Merchant)
Merchant
10% 30% 50% 70% 90%
TABLE 6. Comparison of Regulatory Protection against Shareholder Risks from Falling Output by Country
Country Business Model Shareholder Protections against Falling OutputUtilization
Rate Required
India
Utility Partial 14.0%/15.5% RoE for existing/new plants 80%/85%
Regulated IPP Partial
Competitive Tariff/Captive Determined by developer on case-by-case basis
Merchant None No shareholder protection —
MalaysiaUtility None No shareholder protection —
IPP Partial Capacity payments cushion IPP’s to some extent, most recent PPA’s share more risk 70%
PhilippinesIPP Partial Must meet utilization threshold 83%
Merchant None No shareholder protection —
ThailandIPP Full No shareholder risk —
SPP Partial Must supply contracted capacity and minimum efficiency requirements. 85%
Vietnam IPP None No shareholder protection —
Note: IPP (Independent Power Producer); SPP (Small Power Producer)Source: Adapted from JPMorgan, Deutsche Bank, VinaSecurities 2009

I V . W A T E R R I S K E X P O S U R E F R A M E W O R K
25World Resources Institute
B. WATER DEPENDENCY As water usage by the power sector is rarely publicly reported in Asia, knowledge of key plant design characteristics is necessary to understand water dependency.
Water is used by power plants in two ways: (1) Withdrawals, water that is used and then returned to its source, and (2) consumption, water that is lost from the system (primarily through evaporation). The ratio of water withdrawals to consumption can vary greatly by plant type and technology. Water withdrawals determine a plant’s dependency on steady water supplies and are therefore the most relevant for understanding exposure to water-related risks.
Combined cycle natural gas power plants are less water intensive than pulverized coal and nuclear plants, while nuclear requires the most steam and cooling water relative to power produced of any thermoelectric technology.32 Hydropower is most dependent on reliable and renewable water flows for generation, although the water per unit of output varies greatly. Hydropower also consumes the most water through evaporative losses from reservoirs.
When comparing power generation in about half of U.S. states, hydro plants consumed a weighted average of 69 m3/MWh while thermoelectric plants consumed 1.8 m3/MWh.33 Figure 17 shows water withdrawals and consumption for major fuel and cooling system combina-tions based on data from the United States (this data is not available for Asia).
What is the plant’s water usage?(If unknown, proceed based on technology/type)
FIGURE 16. Questions and Metrics to Determine Water Dependency
Source: WRI
Ques
tions
for P
ower
Com
pani
esM
etric
s
Open or closed-loopcooling?
M3/MWh water withdrawals
Number of water quality violations
For hydro:For thermal:
What water quality regulationsaffect plant effl uents?
Percent river volume and/or reservoir capacitynecessary to maintain full loads
Dry cooling?
Sea or reclaimedwater source?
Is the plant’s water supply at risk fromhigh levels of siltation?
What is the plant’s sensitivityto changes in river and reservoir levels?
Run of the river? Reservoir?
What is the river volume threshold for load losses
and outages?
What is the reservoir level threshold for load losses
and outages?

O V E R H E A T I N G
26 World Resources Institute
Thermoelectric water usage
For thermoelectric plants, water is primarily used to cool and condense the steam used to drive the turbines while smaller amounts of water are used for steam ‘make-up’ and for other processes. Water usage is largely determined by:
Cooling and process water needs, and
The system used to provide the cooling water.
* Also includes Biomass and Waste Power Generation** Hydroelectric water withdrawals vary by site and design and therefore cannot be averaged. Note: This data is not currently available for power plants in Asia. As a result, this figure is useful to show the relative ranges of water consumption and withdrawals by plant and cooling system type but actual values may vary for plants in South and Southeast Asia.Source: DOE Report to Congress on the Interdependency of Energy and Water, 2006
FIGURE 17. Typical Range of Water Withdrawals and Consumption for Power Generation in the United States
Nuclea
r (OL)
Nuclea
r (CL)
Coal *
(OL)
Coal *
(CL)
Natural
Gas (O
L)
Natural
Gas (C
L)
Natural
Gas (D
ry)
Hydro *
* (Rese
rvoir)
Hydro *
* (Run
-of-R
iver)
Geothe
rmal
Geothe
rmal
(Dry)
Solar
Therm
al
Solar
PVWind
Aver
age
Wat
er U
se (
m3 /M
Wh)
10
9
8
7
6
5
4
3
2
1
0
265
215
165
115
65
15
OL = Open-Loop
CL = Closed-Loop
Dry = Dry or air cooled
Consumption
Withdrawals

I V . W A T E R R I S K E X P O S U R E F R A M E W O R K
27World Resources Institute
There are two basic water cooling system configurations, open-loop (also called ‘once-through’) and closed-loop (also called ‘recirculating’). Open-loop systems withdraw the most water, requiring 30 to 50 times more water than their closed-loop counterparts, while air cooling systems (also called ‘dry cooling’) require virtually no water and are used primarily for combined cycle gas plants.34
There is a tradeoff between water withdrawals, water consumption, energy efficiency, and cost between open-loop, closed-loop, and air cooling systems. Closed-loop systems dramati-cally reduce water withdrawals with increases in water consumption due to higher evapora-tive rates. Closed-loop systems may use cooling towers to reduce evaporative losses (and therefore water consumption) by returning the water to the source at a lower temperature. However the water effluents from closed-loop systems are more concentrated than open-loop effluents and generally require greater treatment before release. The cost of water treatment systems for effluents will depend on the stringency of water quality regulations.
Closed-loop water cooling systems cost roughly 40% more than their open-loop counter-parts. Air cooling systems are 3 to 4 times more expensive than closed-loop systems and are less energy efficient.35
The risk of water shortages for thermal plants can be significantly mitigated by technol-ogy choice.
New thermoelectric power projects in water scarce regions often use closed-loop or air cool-ing technologies. Seawater cooling, for coastal plants, and wastewater cooling are options to reduce freshwater dependency. However both of these alternative water sources increase cost. Open-loop systems may also be subject to environmental regulations to minimize the thermal impacts of water discharges on aquatic life. There is a moratorium on seawater cooling systems in the state of California for this reason.
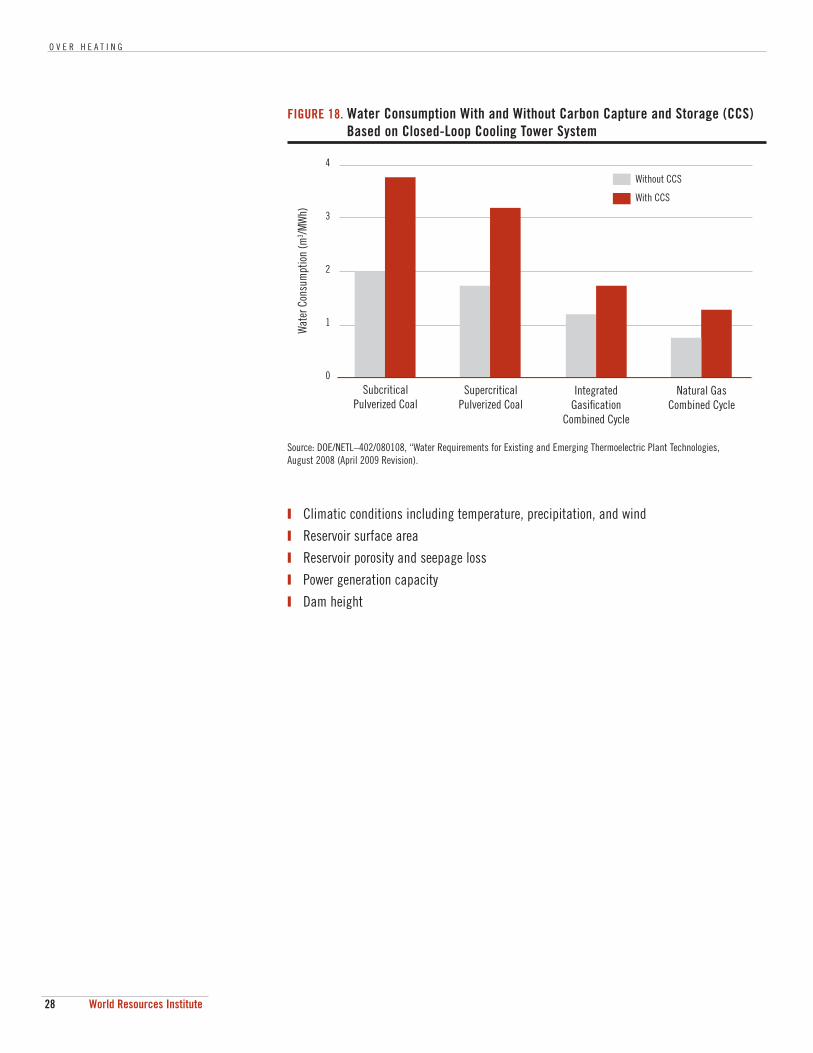
Fossil-fuel based power generation is a major contributor to global greenhouse gas emis-sions that are creating climate change, with electric power and heat comprising 25% of global greenhouse gas emissions. As a result, there is great interest in new technologies to reduce carbon dioxide emissions from the power sector, particularly from coal power plants. Carbon capture and storage (CCS) is an emerging technology that is generating interest from policymakers, although it still at an early stage of development. One of the drawbacks to CCS is that it increases the water intensity of power production. See Figure 18 for a com-parison of water usage with and without deploying CCS technology.36
Hydroelectric water usage
Water scarcity risk for hydroelectric plants is primarily determined by water availability (discussed in the Water Security section).
There is some variability in exposure by the type and design of hydroelectric facilities. Run-of-the-river plants do not have water storage capabilities and therefore are directly exposed to changes in water availability. For hydro plants with water storage capacity, the following factors determine the ratio of water usage to electricity generation:
O V E R H E A T I N G
28 World Resources Institute
Climatic conditions including temperature, precipitation, and wind
Reservoir surface area
Reservoir porosity and seepage loss
Power generation capacity
Dam height
Source: DOE/NETL–402/080108, “Water Requirements for Existing and Emerging Thermoelectric Plant Technologies, August 2008 (April 2009 Revision).
FIGURE 18. Water Consumption With and Without Carbon Capture and Storage (CCS) Based on Closed-Loop Cooling Tower System
Wat
er C
onsu
mpt
ion
(m3 /M
Wh)
4
3
2
1
0Subcritical
Pulverized Coal
Without CCS
With CCS
Supercritical Pulverized Coal
Integrated Gasifi cation
Combined Cycle
Natural Gas Combined Cycle

I V . W A T E R R I S K E X P O S U R E F R A M E W O R K
29World Resources Institute
C. WATER SECURITY Water availability must be assessed at the local level.
Water security risks consider the quality, quantity and timing of water resources that are required for a plant to run at optimal performance, as well as the legal dimensions of securing water allocations. As discussed in Section III, water security will be influenced over the long-term by the impacts of global climate change and increasing demand from competing users.
Reliable data on current water availability at the sub-basin level is not consistently avail-able. It is even more difficult to assess projections of potential climate change and demo-graphic impacts on local water resources, or more importantly, on changes to the likelihood of a drought or flood event. For example, the water scarcity index used in Figures 8, 9 and 10
Has the plant ever had a water shortage?
FIGURE 19. Questions and Metrics to Determine Water Security Risk
Source: WRI
Ques
tions
for P
ower
Com
pani
es
Is the plant in a water scarce region?(If unknown, proceed based on historical events and future trends)
Met
rics
Projected changes to river volumes/levels from climate change
How are water supplies legally secured?
What is the end date and renewal process?
What is the legal strength and sensitivity to political changes?
Percent of reservoir water committed to other uses
Water withdrawals as a percent total renewable supply, current and projected(M3/person/year)
What were the underlying causes?
Who/what are the primarycompeting water users?
Are there risks from upstream or downstream users?
To what extent are water supplies dependent on regular
precipitation patterns?Glacial melting?
Relative security of water allocations

O V E R H E A T I N G
30 World Resources Institute
only consider average water withdrawal to renewal ratios across large river basins, such as the Ganges. Unfortunately this data is not of high enough resolution to understand impacts for a particular plant.
Some useful information may be available for new plants through water permitting and plant siting processes, however unless future climate change impacts are considered, important questions about future risks are left unanswered. In light of the difficulty in obtaining reliable data on future water availability, investors and analysts should engage plant managers using the questions outlined in Figure 19.
Water quality can limit the availability of water supplies.
Water quality is an important consideration that is not included in water scarcity data. High temperatures can create issues for power generation by raising water temperatures above the threshold allowed for cooling purposes or permitted by law for effluents. For example in the southeastern United States, Brown’s Ferry nuclear plant had to be shut down during a heat-wave in August 2007 that increased the river temperatures and led to record power demands. Several other nuclear power plants in this region had to reduce their output by up to 50% due to low river levels during this drought.37
In addition, poor water quality can have adverse effects on plant performance. Water quality impacts on power plants include:38
Calcium and phosphate increase mineral scaling.
Biological Oxygen Demand (BOD), phosphate, and ammonia “biofoul” heat transfer sur-faces and biological growth on cooling tower fill material surfaces.
Ammonia increases corrosion, pitting, and stress cracking damage to metal and heat transfer surfaces and to metal structure.
High turbidity (TSS and TDS) affects performance of the power plant.
Higher water temperatures require increased cooling water requirements and lower effi-ciency for power production.
Hydropower is among the most vulnerable energy sectors to the impacts of climate change because of its direct tie to the timing and quality of water supply.39
Hydro plants generally have a long life span (around 80 years). As a result, the impacts of climate change may dramatically change local water flows from when they were first studied during project development. There are three main climate change impacts on hydroelectric power plants:
1. Changes in river volumes: Changes in temperature and precipitation in the catchment area impact the volume of stream flow and will directly influence the financial viability of the plant. Operations may need to be reconsidered to adapt to hydrological periodicities and seasonal changes in order to maintain base and peak loads. Power plant design will need to be flexible for the future, using adaptive, rather than optimized, modular designs.
2. Increased incidence of extreme weather: Unexpected variability may trigger extreme climate events, most notably floods and droughts. For example, Bangladesh is expect-ed to suffer from extreme flooding due to substantial increases in discharge from three

I V . W A T E R R I S K E X P O S U R E F R A M E W O R K
31World Resources Institute
major rivers; Ganges, Brahmaputra, and Meghna. One study found that the volume of water in the Ganges would increase by 5 to 15 percent, depending on temperature changes.40
3. Changes to water quality: Changing hydrology and possible extreme events will impact sediment risks and measures. Increased sediment and changes to water composition raise the probability of turbine erosion and can lower turbine efficiency, leading to declines in output.
In Vietnam, hydroelectric power is considered an ideal and logical power source. However the country has experienced increasing power outages during the dry season because water is scarce. Normally, during the wet season power is sent to the south from the north, but in recent years power has had to be sent to the north from the south to meet growing demand.41
The governance of water supplies, including long-term contracts and allocation rights, will grow more important in water scarce regions as competition increases.
Upstream activities and competing water uses can dramatically alter water availability. Therefore the position of a plant within the river watershed is an important indicator of potential risk. Plants in river basins contained within one political regime are less at risk than those that cross international boundaries. The political and economic power of compet-ing water users are another indicator of potential risks to securing water supplies. In all focus countries, irrigated agriculture is the dominant user of water resources and accounts for a majority of withdrawals from freshwater sources, including rivers and groundwater.

O V E R H E A T I N G
32 World Resources Institute
V. Impacts on Financial Value
KEY POINTS
Water-related disruptions can cause load losses or outages, possibly reducing revenues and increasing costs.
To mitigate water-related disruptions, investments in water supply and treatment sys-tems will need to increase in new and existing plants.
Decreasing water availability may lead to financing and permitting problems for new projects, potentially constraining power sector growth over the longer-term.
Water-related issues are both physical and regulatory in nature.
To date, most of the financial impacts on the power generation sector from environmental issues have been through regulation, particularly pollution control standards. There are many examples of how environmental regulations have impacted shareholder value in the power generation sector, including the recent ruling in Thailand to declare Map Ta Phut and four other districts in Rayong pollution control zones. As the new, stricter standards will take time to be developed, they could cause new projects to be cancelled or delayed if investors lack confidence in the upcoming regulations.42
The financial consequences of water-related impacts range in timeframe and potential magnitude.
Severe water shortages will reduce hydro and thermoelectric power output due to low reser-voir levels and inadequate cooling water, potentially reducing revenues and increasing pro-duction costs. Intense flooding can also affect power generation by increasing turbidity lev-els in intake water. Hydroelectric facilities are most affected and over the long term, increased siltation can reduce reservoir capacity and compromise generator performance.
These water events are episodic in nature and their frequency and severity are projected to increase over time.43 The other financial impacts of water constraints may be more structur-al and play out in the medium to long-term as the lack of water availability evokes regulato-ry responses that reshape project finance and execution processes while prescribing technol-ogy use. In the most serious case, water availability may constrain growth in new capacity. See Table 7.
The financial impacts and likelihood of occurrence of water-related issues will vary at the geographic, plant, and company levels. The magnitude of the financial impacts will depend on the risk factors discussed in Section IV.
V . I M P A C T S O N F I N A N C I A L V A L U E
33World Resources Institute
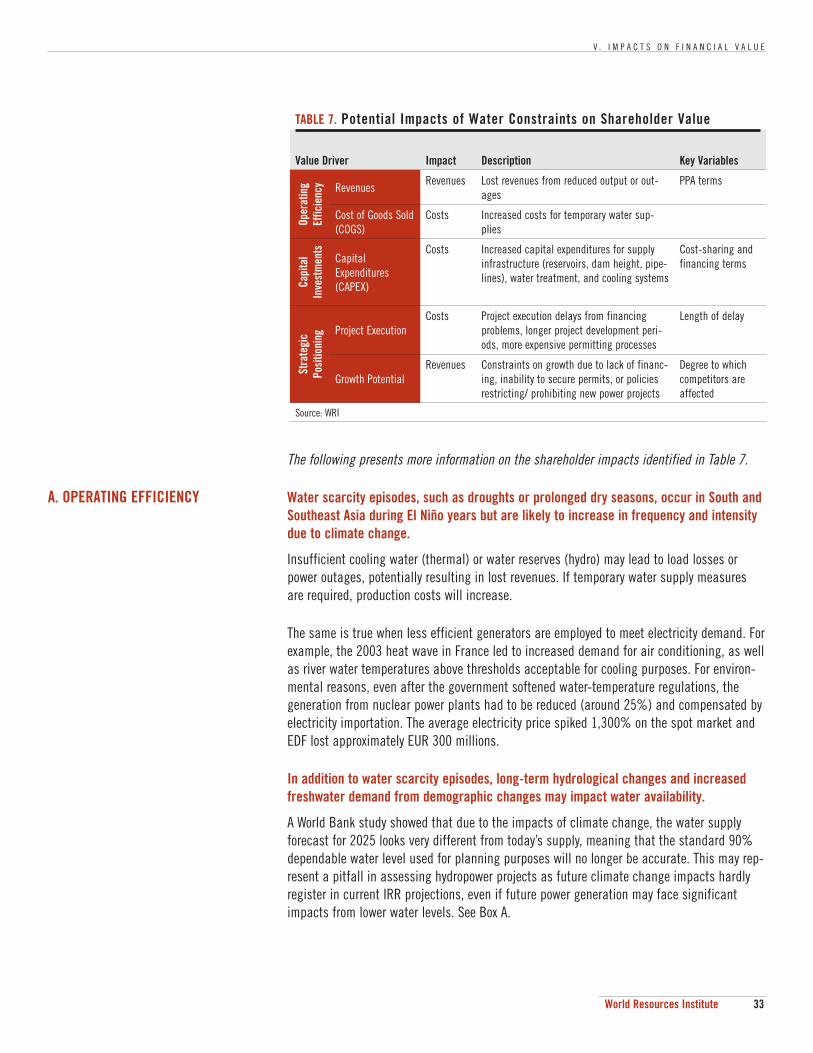
The following presents more information on the shareholder impacts identified in Table 7.
A. OPERATING EFFICIENCY Water scarcity episodes, such as droughts or prolonged dry seasons, occur in South and Southeast Asia during El Niño years but are likely to increase in frequency and intensity due to climate change.
Insufficient cooling water (thermal) or water reserves (hydro) may lead to load losses or power outages, potentially resulting in lost revenues. If temporary water supply measures are required, production costs will increase.
The same is true when less efficient generators are employed to meet electricity demand. For example, the 2003 heat wave in France led to increased demand for air conditioning, as well as river water temperatures above thresholds acceptable for cooling purposes. For environ-mental reasons, even after the government softened water-temperature regulations, the generation from nuclear power plants had to be reduced (around 25%) and compensated by electricity importation. The average electricity price spiked 1,300% on the spot market and EDF lost approximately EUR 300 millions.
In addition to water scarcity episodes, long-term hydrological changes and increased freshwater demand from demographic changes may impact water availability.
A World Bank study showed that due to the impacts of climate change, the water supply forecast for 2025 looks very different from today’s supply, meaning that the standard 90% dependable water level used for planning purposes will no longer be accurate. This may rep-resent a pitfall in assessing hydropower projects as future climate change impacts hardly register in current IRR projections, even if future power generation may face significant impacts from lower water levels. See Box A.
TABLE 7. Potential Impacts of Water Constraints on Shareholder Value
Value Driver Impact Description Key Variables
Oper
atin
g Ef
ficie
ncy Revenues
Revenues Lost revenues from reduced output or out-ages
PPA terms
Cost of Goods Sold (COGS)
Costs Increased costs for temporary water sup-plies
Capi
tal
Inve
stm
ents
Capital Expenditures (CAPEX)
Costs Increased capital expenditures for supply infrastructure (reservoirs, dam height, pipe-lines), water treatment, and cooling systems
Cost-sharing and financing terms
Stra
tegi
c Po
sitio
ning Project Execution
Costs Project execution delays from financing problems, longer project development peri-ods, more expensive permitting processes
Length of delay
Growth PotentialRevenues Constraints on growth due to lack of financ-
ing, inability to secure permits, or policies restricting/ prohibiting new power projects
Degree to which competitors are affected
Source: WRI

O V E R H E A T I N G
34 World Resources Institute
B. CAPITAL INVESTMENTS Climate change induced changes in future water availability may require increased capi-tal expenditures for quantity and quality supply measures.
On the supply side, infrastructure investments may be required for plants to survive longer dry periods and increased occurrences of droughts. Water infrastructure projects such as pipelines, reservoirs, dams, and desalinization facilities are expensive undertakings to increase water supplies. In many situations, these investments in water storage and supply infrastructure would benefit multiple users. Therefore it is unlikely that a power company would bear the entire cost and the financial implications would depend on cost-sharing and financing arrangements.
For new thermal plants, water efficiency may be improved by advanced technologies, includ-ing air cooling systems for gas plants. Freshwater dependency can also be reduced through use of seawater or wastewater for cooling purposes. Technology mitigation options for ther-mal cooling systems include:
Dry cooling (air is used to condense steam in turbines)
Wastewater reuse (wastewater is treated onsite to be returned to the power plant)
Condensed water cooling (water vapor is recovered via the flue gas exiting power plants and condensed back into water)
Ultra-super critical (USC) technology (advanced steam generation with supercritical steam pressure and temperatures > 1,100°F)
Seawater use (intake water from marine sources used with open or closed-loop system)
Box A. Analysis of Climate Change Impacts on Hydropower in India and Vietnam
The baseline used to determine water resources when assessing a hydro project is the water level available 90% of the year. This is a conserva-tive approach, yet it is just one data point and leaves most hydrological information, including the timing of water resources, unused. A case study looking at the Vishnugad Pipalkoti 400 MW project in Northern India and a 75 MW dam on the Thac Mo river in Vietnam found that in 2025, the rainy season will have higher levels of water than the base-lines used during planning, while water resources become more limited during the dry seasons.
The study found that in the Vishnugad Pipalkoti project, electricity gen-eration would increase in 2025 by about 7.5% due to increased reservoir volumes during the rainy season. This translates to a small positive impact on IRR of 0.3 percentage points. However, because this project does not have large storage capacity, it cannot exploit all of the addi-tional precipitation during the rainy season for power generation. The same study looked at a hydro project in Sri Lanka that would experience a 45% increase in power generation because the installed reservoir capacity is large enough to absorb the additional precipitation. This would increase the project’s IRR by 1.7%.
The Thac Mo project in Vietnam is a run-of-the-river system and there-fore would produce 14% less electricity per year due to increased volatil-ity and the inability to take advantage of increased precipitation during the rainy season. This would lead to a loss in IRR of 0.2%. However, if a reservoir were constructed, the project could increase generation from 383 GWh to 524 GWh per year with the IRR increasing by 0.7% over the additional project costs associated with the reservoir construction. It should be noted that run-of-the-river systems are considered to be more environmentally friendly than reservoirs because they have a smaller impact on river ecosystems. Therefore the addition of reservoir capacity presents an environmental tradeoff.
The timing of climate change impacts on precipitation is crucial to the financial impacts. In the Vietnam example, if climate change affected hydrology from the beginning of operation, the IRR would rise from 21.9% to 35%. This may represent a pitfall in assessing hydropower projects as future climate change impacts hardly register in current IRR projections, even though it may have significant impact on future generation levels.
Source: Atsushi IIMI, “Estimating Global Climate Change Impacts on Hydropower Projects:
Applications in India, Sri Lanka and Vietnam” World Bank, Washington, DC September 2007.

V . I M P A C T S O N F I N A N C I A L V A L U E
35World Resources Institute
Investments in more water efficient cooling systems and water supply measures may reduce water risk but at high cost. The state of California conducted a cost analysis comparing water-saving cooling systems at four different sites for the construction of a new, gas-fired, combined-cycle 500 MW plant. Capital costs ranged from $2.7 to $4.1 million for wet sys-tems and from $18 to $47 million for dry systems.44 Dry systems also require four to six times more energy than wet systems, thereby reducing efficiency and in some cases, limiting capacity.45 Retro-fits to existing plants tend to be cost prohibitive.
Degraded water quality may also lead to increased capital expenditures. For example, increased sediment caused by more frequent flooding may require pre-treatment through water treatment systems. If pre-treatment options or alternative water supplies are not available, there could be disruptions or the need to relocate the facility.46
C. STRATEGIC POSITIONING The physical and regulatory limitations on water availability may shape future power markets in water scarce regions.
Water usage and the securing of water supplies will play a larger role in the ability to finance and permit new projects. Increased water scarcity will likely invoke a regulatory response, especially as competition for water resources increases across sectors and regions. In agricultural and urban regions, competition for water resources may create a complex and challenging political climate for the power industry.
Increased government intervention and competition for water resources will likely lead to longer project development periods that will affect costs and profitability if cost overruns are not allowed by regulators. Risks of execution delays are usually higher for private sector projects as state sponsored projects can receive faster clearances and streamlined permit-ting processes.
New plants may be restricted or even banned in water scarce regions by government decree or by lack of financing if water supply cannot be secured at a dependable level and attrac-tive rate. For example, the nuclear shutdowns during the heat wave in 2007 in the Southeastern U.S. have spurred the state governments to impose a moratorium on the installation of new merchant power plants because of cooling constraints.47
There is evidence that water scarcity is already constraining power development in India. Some analysts believe that certain Indian states (such as Chattisgarh) have already entered into more MOUs for new power capacity than land and water resources allow to be imple-mented.48 As a result, not all planned capacity will necessarily be realized, presenting a potentially significant risk to those companies valued for their high growth strategies.

O V E R H E A T I N G
36 World Resources Institute
HS
BC
CA
SE
ST
UD
Y
WRI partnered with HSBC to assess the potential impacts of water scarcity on the power generating sector in India. The following is a case study authored by HSBC.
The case study is written by an HSBC equity research analyst and is based on his/her knowledge of the climatic and environmental factors that have an impact on the business of companies in this sector. It does not constitute investment research and is not part of the analyst's ongoing research coverage. Readers of this report, whether existing clients of HSBC or not, should in no circumstances rely on this material when making investment decisions or use it as the basis of an investment strategy.
Please see http://wri.org/project/envest for more information on the assumptions and methodology used in this analysis.
HSBC INDIA CASE STUDY
Water scarcity is already impacting power projects in India, causing delays and operational losses. For example, the NTPC’s (National Thermal Power Corporation’s) Sipat plant was shut down in 2008 due to lack of water supplies from the state of Chattisgarh. Thermal plants under construction in Orissa state are also reportedly witnessing delays due to water alloca-tion problems.
Utilities can take a range of measures to protect themselves from water scarcity risks. They could, for instance, incur capital costs that include building back-up supply resources such as canal network or pipelines. Another approach is to identify coastal locations for future plants to tackle the problem of increasing freshwater shortage by installation of desalina-tion plants. However, such measures are costly and affect a company’s bottom line.
The financial impact of these additional costs may be limited if they can be passed on to end-customers through tariffs. This case study assesses the financial impact of water scar-city on the internal rate of return (IRR) of a typical coal-based plant at two stages of the project life cycle:
1) Project development stage, when water scarcity can delay project execution, leading to loss of revenues, profits and hence project IRR; and
2) Operating life of the project, when water scarcity can reduce the plant load factor, there-by affecting profitability and valuation.
These risks were assessed from both a short/medium-term perspective as well as a longer-term view, as the regulatory framework within which the sector operates today may change over time, resulting in a different risk-reward equation.
1. IRR Impacts of Project Execution Delays Due to Water Scarcity
In order to ascertain the impact of water scarcity at the project development stage, it is important to understand the overall project award process. The use of water and land by power plants in India is screened at a very early stage. The government’s decision to allow use of water from a particular source takes into account water requirements for other criti-cal uses such as irrigation in and around the region.
This water allocation system will be further strengthened under the National Action Plan on Climate Change launched by the Prime Minister of India on June 30, 2009. The Plan includes a national water mission to ensure that integrated policies are put in place for resource management to help conserve water, minimize wastage and allow for the most equitable distribution of scarce water supplies both across and within states. Additional national level initiatives will also be undertaken to deal with the impact of climate change.
In power projects launched as a joint venture between the central and state governments, the state approves water allocation and benefits from a share of the power production as well as local employment generation during construction and operation. Alternatively, water
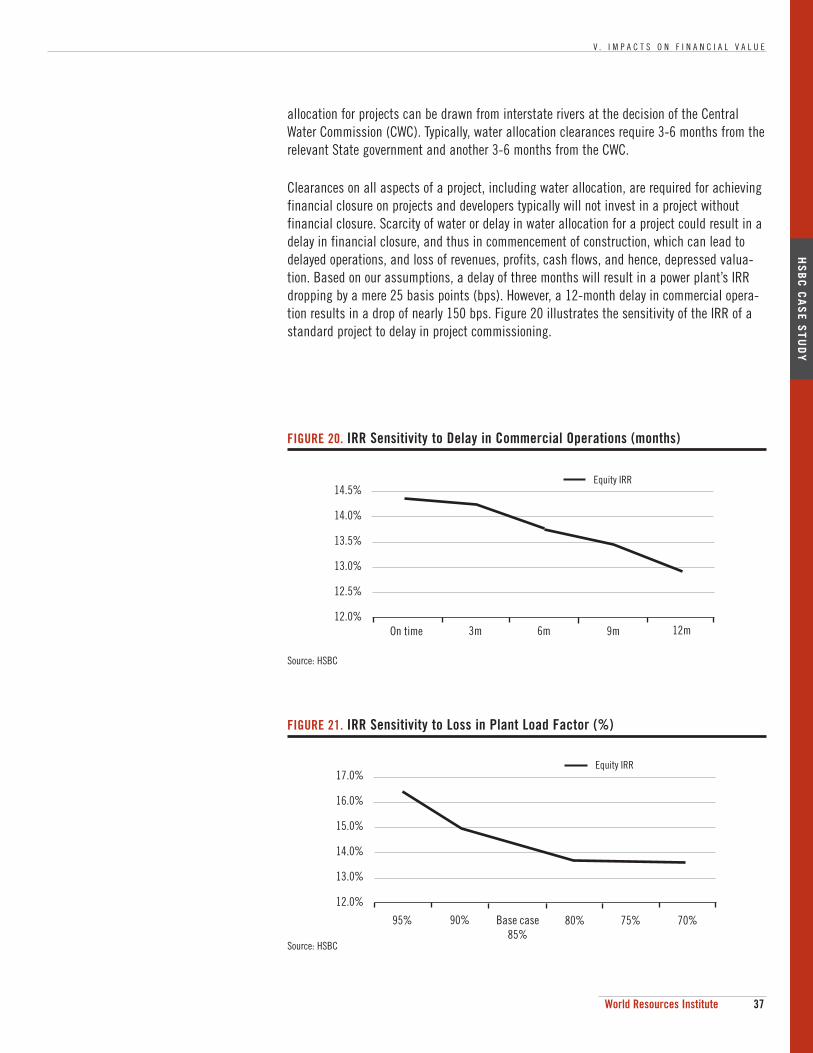
V . I M P A C T S O N F I N A N C I A L V A L U E
37World Resources Institute
HS
BC
CA
SE
ST
UD
Y
allocation for projects can be drawn from interstate rivers at the decision of the Central Water Commission (CWC). Typically, water allocation clearances require 3-6 months from the relevant State government and another 3-6 months from the CWC.
Clearances on all aspects of a project, including water allocation, are required for achieving financial closure on projects and developers typically will not invest in a project without financial closure. Scarcity of water or delay in water allocation for a project could result in a delay in financial closure, and thus in commencement of construction, which can lead to delayed operations, and loss of revenues, profits, cash flows, and hence, depressed valua-tion. Based on our assumptions, a delay of three months will result in a power plant’s IRR dropping by a mere 25 basis points (bps). However, a 12-month delay in commercial opera-tion results in a drop of nearly 150 bps. Figure 20 illustrates the sensitivity of the IRR of a standard project to delay in project commissioning.
Source: HSBC
FIGURE 20. IRR Sensitivity to Delay in Commercial Operations (months)
14.5%
14.0%
13.5%
13.0%
12.5%
12.0%On time 3m 6m 12m9m
Equity IRR
FIGURE 21. IRR Sensitivity to Loss in Plant Load Factor (%)
Source: HSBC
17.0%
16.0%
15.0%
14.0%
13.0%
12.0%
95% 90% Base case85%
70%75%
Equity IRR
80%
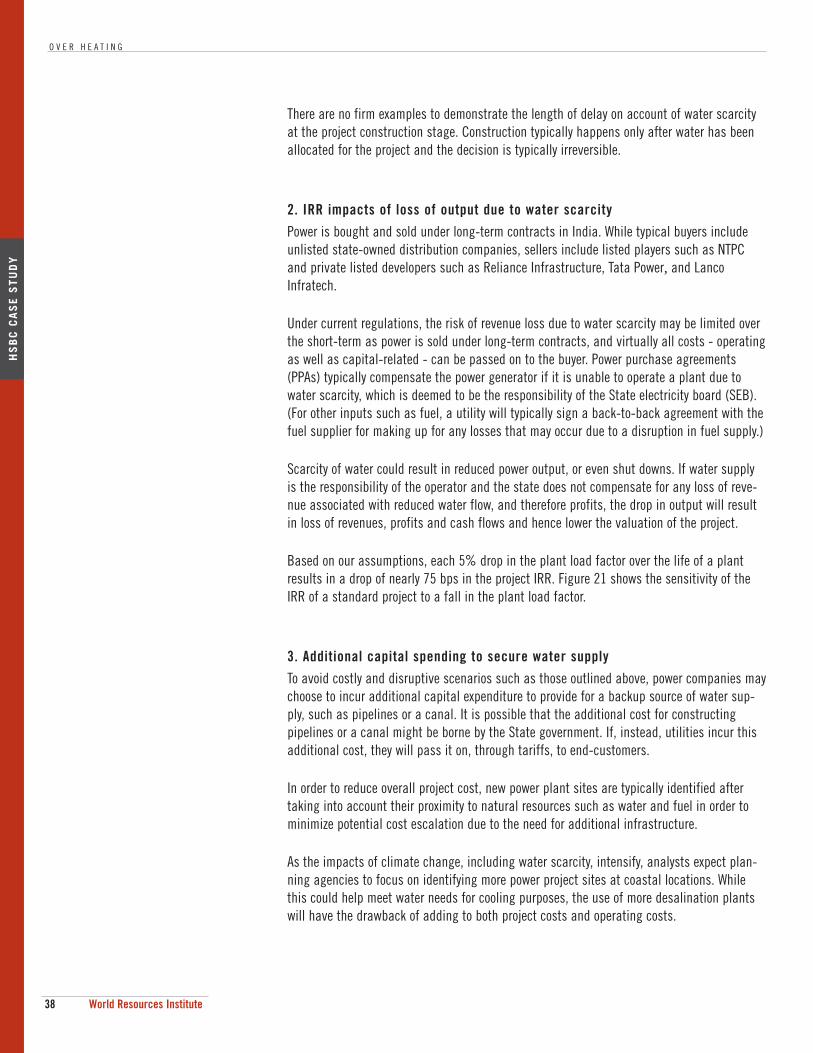
O V E R H E A T I N G
38 World Resources Institute
HS
BC
CA
SE
ST
UD
Y
There are no firm examples to demonstrate the length of delay on account of water scarcity at the project construction stage. Construction typically happens only after water has been allocated for the project and the decision is typically irreversible.
2. IRR impacts of loss of output due to water scarcity
Power is bought and sold under long-term contracts in India. While typical buyers include unlisted state-owned distribution companies, sellers include listed players such as NTPC and private listed developers such as Reliance Infrastructure, Tata Power, and Lanco Infratech.
Under current regulations, the risk of revenue loss due to water scarcity may be limited over the short-term as power is sold under long-term contracts, and virtually all costs - operating as well as capital-related - can be passed on to the buyer. Power purchase agreements (PPAs) typically compensate the power generator if it is unable to operate a plant due to water scarcity, which is deemed to be the responsibility of the State electricity board (SEB). (For other inputs such as fuel, a utility will typically sign a back-to-back agreement with the fuel supplier for making up for any losses that may occur due to a disruption in fuel supply.)
Scarcity of water could result in reduced power output, or even shut downs. If water supply is the responsibility of the operator and the state does not compensate for any loss of reve-nue associated with reduced water flow, and therefore profits, the drop in output will result in loss of revenues, profits and cash flows and hence lower the valuation of the project.
Based on our assumptions, each 5% drop in the plant load factor over the life of a plant results in a drop of nearly 75 bps in the project IRR. Figure 21 shows the sensitivity of the IRR of a standard project to a fall in the plant load factor.
3. Additional capital spending to secure water supply
To avoid costly and disruptive scenarios such as those outlined above, power companies may choose to incur additional capital expenditure to provide for a backup source of water sup-ply, such as pipelines or a canal. It is possible that the additional cost for constructing pipelines or a canal might be borne by the State government. If, instead, utilities incur this additional cost, they will pass it on, through tariffs, to end-customers.
In order to reduce overall project cost, new power plant sites are typically identified after taking into account their proximity to natural resources such as water and fuel in order to minimize potential cost escalation due to the need for additional infrastructure.
As the impacts of climate change, including water scarcity, intensify, analysts expect plan-ning agencies to focus on identifying more power project sites at coastal locations. While this could help meet water needs for cooling purposes, the use of more desalination plants will have the drawback of adding to both project costs and operating costs.

V I . R E C O M M E N D A T I O N S
39World Resources Institute
VI. Recommendations
Water scarcity risks are receiving more attention than in the past, yet the connection to power sector development does not appear to be well understood by investors, governments, and companies in the region. A recent assessment from the Asian Development Bank could find no evidence that any Asian developing country has seriously assessed the current and future water requirements of its energy sector.49 In addition, a survey of power sector equity research reports shows scarce mention of water supply related issues.
This is due in part to the limited affect of water scarcity issues on the power sector in Asia to date.50 However, this has not been the case in other water scarce regions around the world. The confluence of increasing water demands associated with the projected growth in the power sector and other water intensive sectors such as agriculture coupled with a changing climate will create a very different operating environment in the future.
Unfortunately important data to understand water dependency and supply risks is not readily available in the focus countries. The physical impacts of climate change are complicated to predict at the level of detail necessary for planning purposes. Beyond scientific limitations, the political and social dimensions of water allocations and regulatory changes also make it diffi-cult to predict how water scarcity issues will play out across sectors at the local level.
This does not mean that there is nothing for companies, investors, and analysts to do to assess potential water scarcity risks. The potential magnitude and scale of water scarcity risks, especially in electricity hungry regions such as India, requires forward-looking strate-gies by stakeholders in the industry. Specifically:
Investors and analysts should engage with companies to learn more about their expo-sure to water scarcity risks and their ability to mitigate these risks.
Because of the lack of publicly available data, the best way for investors and analysts to gauge a company’s exposure to water scarcity risk is to open a dialogue with the companies on these issues. Section IV includes questions and indicators for investors to engage with companies to assess their exposure to water scarcity risk.
With this information, investors and analysts should integrate current and future water risks into their evaluation of power generation companies.
See the “Next Steps” outlined on p. 7 for suggestions on approaches and techniques for evaluating water risks to inform investment perspectives.
Power companies should focus on reducing water consumption and dependency in existing and new facilities where required, while planning for increased uncertainty and stress on water resources in the future.
New plant site selection, technology choice, negotiating long-term access rights to water resources and contingency planning will be key to mitigating risks.

O V E R H E A T I N G
40 World Resources Institute
The private sector should work together with the public sector and NGOs to improve planning processes and data availability for critical aspects of water scarcity.
Such efforts could include integrating an assessment of climate change impacts on water resources with long-term energy and water planning. Water and power are not usually gov-erned by the same agency and therefore most countries lack a coordinated approach to water and energy issues. Yet these issues are deeply related, with power development having significant impacts on water management. India, which stands out as the most electric power-demanding and water scarce country in focus, has much at stake over how power and water resources are developed. If not managed well, water could become a major constraint on power production and economic development.
Necessity may force governments to think about long-term energy and water issues together, a departure from today’s mindset, which could result in a very different approach to power sector development. Ideally this approach would reduce water-related risks for companies in the planning and development process and minimize exposure to water-related disruptions during operation. On the other hand, shareholder protections enjoyed today that are depen-dent on public subsidies may not be fiscally sustainable over the long-term. The magnitude of the challenge of meeting growing water demand in the future will require a business model for power development that more accurately prices water risk.

A P P E N D I C E S
41World Resources Institute
Appendix A: Methodology and Data Tables
WRI mapped power plant locations against water scarcity data to assess the potential for water constraints to affect the power generation sector in South and Southeast Asia.
SCOPE The analysis included over 150 existing and planned thermal and hydroelectric plants (total-ing 137 GW) owned by major publicly listed companies. See Tables A and B. More specifical-ly, the analysis included the following parameters:
Geographic:
Domestic plants owned by companies in India, Malaysia, Philippines, Thailand, and Vietnam.
Plants owned outside these countries were not included (i.e. Ratch’s hydro facilities in Laos).
Indonesia was not included because it has no publicly listed companies.
Power Plants:
Thermal (all fuel types, including coal, natural gas, and biomass)
Hydro
No nuclear plants are currently owned or planned by publicly listed companies in the region.
Existing and planned (to the extent reported by companies in press releases and annual reports as of August 2009).
Companies:
NPTC, Tata Power, Reliance Infrastructure (including Reliance Power), Tenaga Nasional Berhad, Tanjong, YTL, First Generating Company, Energy Development Corp, Aboitiz, Ratch, Electric Generating Company, Glow Energy, Pha Lai Thermal, and Vinh Son – Song.
DATA SOURCES Plant Data
Plant data are from company reports, press releases, and equity research reports. Plant locations are from CARMA (www.carma.org). When not available on CARMA, the XY coordi-nates for the closest district, town, or city were used.

O V E R H E A T I N G
42 World Resources Institute
Water Stress Indicators
Water scarcity data is from the International Water Management Institute (IWMI), WRI, and the University of Kassel : Vladimir Smakhtin, Carmen Revenga and Petrol Doll, 2004. “Taking into Account Environmental Water Requirements in Global-scale Water Resources Assessment.” Comprehensive Assessment of Water Management in Agriculture, Research Report 2. International Water Management Institute, Colombo, Sri Lanka.
The IWMI water stress indicators (WSI’s) represent the ratio of total withdrawals (including all water users) to utilizable water, which is considered to be the river’s resource capacity less the minimum amount of water used by the ecosystem. This is illustrated below:
Withdrawals
Total available water – Environmental needsWSI =
The WSI has the following classifications:
Water scarce: WSI > 1Water stressed: 0.6 ≤ WSI < 1 Moderate water availability: 0.3 ≤ WSI < 0.6 Water abundant: WSI < 0.3
The WSI has several important limitations in this application:
First, it does not considering the timing or frequency of water flows in its assessment of available water. As a result it does not predict the likelihood of a water scarcity event, an important consideration for power generation.
Second, it does not account for water quality, meaning that river basins that appear to be “safe” may in reality face water shortages due to pollution, siltation, or other causes.
Third, it assigns one water stress indicator to an entire river basin, such as the Ganges, which is not specific enough to accurately assess water stress at the plant level. Instead it provides an overall illustration of the level of water stress in a watershed.
Lastly, it only considers current water stress and does not account for future changes due to demographic and climate change pressures.

A P P E N D I C E S
43World Resources Institute
TABLE A. Power Generating Companies Included in Analysis
CompanyReuters/ Bloomberg Ticker Country Type
Market Cap ($US Million)
Plants in Focus Region
Installed MW’s Planned MW’s
National Thermal Power Corporation (NTPC)
NTPC.BONATP IN
India Utility 36,550 53 29,737 24,727
Tata Power TTPW.BOTPWR IN
India IPP 6,970 19 2,405 5,536
Reliance Infrastructure
RLIN.BORELI IN
India IPP 5,020 19 941 28,320
Tenaga Nasional Berhad
TENA.KLTNB MK
Malaysia Utility 10,380 27 10,854 3,992
YTL Power International
YTLP.KLYTLP MK
Malaysia IPP 4,230 2 1,212 0
Tanjong Public Limited Company
TJPL.KLTJN MK
Malaysia IPP 2,150 3 1,490 0
First Gen Corporation
FGEN.PS FGEN PM
Philippines IPP 736 26 1,846 192
Aboitiz Power AP.PSAP PM
Philippines IPP 2,050 21 578 1,807
Ratchaburi Electricity Generating Holding
RATC.BKRATCH TB
Thailand IPP 1,640 4 4,347 1,085
Glow Energy GLOW.BKGLOW TB
Thailand IPP 1,700 7 1,708 929
Electric Generating Company
EGCO.BKEGCO TB
Thailand IPP 1,290 11 3,821 272
Pha Lai Thermal PPC.VMPPC VN
Vietnam IPP 288 4 1,040 370
Vinh Son - Song VSH.VMVSH VN
Vietnam IPP 166 6 136 470
Source: Bloomberg (as of 03/22/10), 2008 company reports. Plant data limited by parameters described on p. 41.
DATA TABLES

O V E R H E A T I N G
44 World Resources Institute
TABLE B. Power Plant Data Used in Water Stress Mapping
Company Name
% Ownership TypeCurrent
Capacity (MW)Planned
Capacity (MW)
Country
Latitude LongitudeWater Stress
Level
Company DataCARMA, Maplandia,
Google Earth IWMI 2004
ABOITIZ Ambuklao-Blinga 50% hydro 175.0 50.0 Philippines 16.5000 120.6667 Abundant
ABOITIZ Angat 100% hydro 246.0 Philippines 14.9130 121.0490 Abundant
ABOITIZ Backup plants 100% oil 60.0 Philippines 7.0731 125.6128 Abundant
ABOITIZ Bakun 50% hydro 70.0 Philippines 16.8881 120.5292 Abundant
ABOITIZ Cebu 26% coal 246.0 Philippines 10.3792 123.6419 Stressed
ABOITIZ Cebu Private Power Corporation
60% oil 70.0 Philippines 10.3070 123.8980 Stressed
ABOITIZ East Asia Utilities Corporation
50% oil 50.0 Philippines 10.3000 124.0000 Stressed
ABOITIZ Magat 50% hydro 360.0 Philippines 16.7833 121.5333 Abundant
ABOITIZ Mini-projects 100% hydro 38.2 Philippines 16.0333 120.4500 Abundant
ABOITIZ Redondo Peninsula Energy, Inc.
50% coal 300.0 Philippines 17.7500 121.7333 Abundant
ABOITIZ Sibulan 100% hydro 42.5 Philippines 9.3580 123.2850 Moderate
ABOITIZ Southern Philippine Power Corporation
20% oil 55.0 Philippines 6.1128 125.1717 Abundant
ABOITIZ STEAG State Power Incorporated
34% coal 232.0 Philippines 8.1683 123.8475 Abundant
ABOITIZ Tamugan 100% hydro 27.5 Philippines 7.2308 125.3764 Abundant
ABOITIZ Western Mindanao Power Corporation
20% oil 100.0 Philippines 6.9060 122.0690 Abundant
EGCO BLCP 50% coal 1434.0 Thailand 12.7170 101.0540 Moderate
EGCO ECGO Green Cogen 80% gas 117.0 Thailand 12.6756 101.2783 Moderate
EGCO Gulf Cogeneration Co 50% gas 110.0 Thailand 14.5864 100.9978 Moderate
EGCO Gulf Power Gen Co (Kaeng Kong 2)
50% gas 1510.0 Thailand 14.5833 101.0167 Moderate
EGCO Gulf Yala Green Co 50% biomass 23.0 Thailand 6.5425 101.2831 Abundant
EGCO Khanom (Kegco) 100% gas 824.0 Thailand 9.2047 99.8611 Abundant
EGCO Nong Khae Cogernation Co 50% gas 126.0 Thailand 14.3333 100.8667 Moderate
EGCO Rayong Electric Gen Co (Regco)
100% gas 1232.0 Thailand 12.6683 101.2750 Moderate
EGCO Roi-et Green 70% biomass 9.9 Thailand 16.0533 103.6525 Abundant
EGCO Samutprakarn Cogeneration Co
50% gas 126.0 Thailand 13.6000 100.6000 Moderate
FGEN Agusan 100% hydro 1.6 Philippines 8.4822 124.6472 Abundant
FGEN Bauang 37% diesel 225.0 Philippines 16.4944 120.3281 Abundant
FGEN Masiway 100% hydro 12.0 Philippines 15.8114 121.1436 Abundant
FGEN Pantabangan 100% hydro 100.0 Philippines 15.8114 121.1436 Abundant
FGEN San Lorenzo 60% gas 500.0 Philippines 13.7781 121.0431 Abundant
FGEN Santa Rita 60% gas 1000.0 Philippines 13.7781 121.0431 Abundant

A P P E N D I C E S
45World Resources Institute
GLOW CFB 3 100% coal 115.0 Thailand 12.7170 101.0540 Moderate
GLOW GHECO-One 65% coal 660.0 Thailand 12.7170 101.0540 Moderate
GLOW Glow IPP Power Plant 100% gas/ die-sel
713.0 Thailand 13.1744 100.9306 Moderate
GLOW Glow SPP 1 Central Utilities Cogeneration Plant
100% gas/ die-sel
124.0 Thailand 12.7170 101.0540 Moderate
GLOW Phase 2 Central Utilities Cogeneration Plant
100% gas/ die-sel
281.0 Thailand 12.7170 101.0540 Moderate
GLOW Phase 3 & 4 Hybrid Cogeneration Plant
100% gas/ coal 590.0 Thailand 12.7170 101.0540 Moderate
GLOW Phase 5 100% gas 385.0 Thailand 12.7170 101.0540 Moderate
NTPC Anta 100% gas 413.0 India 25.1000 76.5167 Stressed
NTPC Auraiya 100% gas 652.0 India 26.7700 79.0100 Stressed
NTPC Badarpur 100% coal 705.0 India 28.5167 77.3333 Stressed
NTPC Barh 100% coal 0.0 3300.0 India 25.5544 85.4177 Stressed
NTPC Bhilai 50% coal 574.0 India 21.2200 81.4300 Moderate
NTPC Bihar State Electricty Board 100% coal 1980.0 India 24.6060 84.1250 Stressed
NTPC Bongaigaon 100% coal 750.0 India 26.4933 90.3625 Abundant
NTPC Dadri 100% coal 840.0 980.0 India 28.5700 77.5500 Stressed
NTPC Dadri 100% gas 817.0 India 28.5700 77.5500 Stressed
NTPC Durgapur 50% coal 120.0 India 23.4800 87.3200 Scarce
NTPC Farakka 100% coal 1600.0 500.0 India 24.1800 88.2600 Stressed
NTPC Faridabad 100% gas 430.0 India 28.4333 77.3167 Stressed
NTPC Indira Ghandi 50% coal 1500.0 India 28.6200 76.6500 Scarce
NTPC Jhanor-Gandhar 100% gas/ liq-uids
648.0 1300.0 India 21.8339 73.1111 Scarce
NTPC Kahalgaon 100% coal 1840.0 500.0 India 25.2700 87.2200 Stressed
NTPC Kanti Bijlee Utpadan Nigam 50% coal 220.0 India 26.2167 85.3000 Stressed
NTPC Kawas 100% gas 645.0 1300.0 India 21.1600 72.8300 Scarce
NTPC Koldam 100% hydro 800.0 India 30.4978 77.9217 Stressed
NTPC Korba 100% coal 2100.0 500.0 India 22.0833 82.1500 Moderate
NTPC Lata-Tapovan 100% hydro 171.0 India 30.5700 79.5700 Stressed
NTPC Loharinag Pala 100% hydro 600.0 India 30.7333 78.4500 Stressed
NTPC Mauda 100% coal 1000.0 India 21.1560 79.0890 Stressed
NTPC Meja 50% coal 1320.0 India 25.4430 81.8280 Stressed
NTPC Nabinagar 74% coal 1000.0 India 24.7500 84.3700 Stressed
NTPC North Karanpura 100% coal 1980.0 India 24.2167 84.8667 Stressed
NTPC Rajiv Gandhi CCPP Kayamkulam
100% gas/ liq-uids
350.0 India 9.1700 76.4900 Moderate
TABLE B. Power Plant Data Used in Water Stress Mapping (cont.)
Company Name
% Ownership TypeCurrent
Capacity (MW)Planned
Capacity (MW)
Country
Latitude LongitudeWater Stress
Level
Company DataCARMA, Maplandia,
Google Earth IWMI 2004

O V E R H E A T I N G
46 World Resources Institute
NTPC Ramagundam 100% coal 2600.0 India 18.4333 79.1500 Stressed
NTPC Rammam-3 100% hydro 120.0 India 27.0333 88.2667 Abundant
NTPC Ratnagiri Gas and Power Private limited (RGPPL)
100% gas/ liq-uids
1480.0 India 17.6000 73.1667 Abundant
NTPC Rihand 100% coal 2000.0 1000.0 India 24.6828 83.0656 Stressed
NTPC Rihand 100% hydro 4.0 India 24.6828 83.0656 Stressed
NTPC Rourkela 50% coal 120.0 India 22.1200 84.5400 Abundant
NTPC Simhadri 100% coal 1000.0 1000.0 India 17.7000 83.3000 Moderate
NTPC Singrauli 100% coal 2000.0 India 25.1500 82.5833 Stressed
NTPC Singrauli 100% hydro 8.0 India 25.1500 82.5833 Stressed
NTPC Sipat 100% coal 1000.0 2480.0 India 22.0833 82.1500 Moderate
NTPC Talcher STPS 100% coal 3000.0 India 20.8500 85.1000 Abundant
NTPC Talcher STPS 100% coal 460.0 India 20.8500 85.1000 Abundant
NTPC Tanda 100% coal 440.0 India 26.5500 82.6500 Stressed
NTPC Tapovan Vishnugad 100% hydro 520.0 India 30.4000 79.3500 Stressed
NTPC Unchahar 100% coal 1050.0 India 26.1300 81.1300 Stressed
NTPC Vallur 50% coal 1000.0 India 13.1500 79.9100 Scarce
NTPC Vindhyachal 100% biomass 1.5 India 24.4100 81.8800 Stressed
NTPC Vindhyachal 100% coal 3260.0 India 24.4100 81.8800 Stressed
PPS Mong Duong 25% coal 1000.0 Vietnam 21.0167 107.3167 Abundant
PPS Pha Lai-1 100% coal 440.0 Vietnam 15.2167 102.3333 Abundant
PPS Pha Lai-2 100% coal 600.0 Vietnam 15.2167 102.3333 Abundant
PPS Quang Ninh 10% coal 1200.0 Vietnam 20.1500 107.0000 Abundant
RATCH Pratu Toa-A Field 100% gas 1.8 Thailand 16.9525 99.9761 Moderate
RATCH Ratchaburi 100% gas 3645.0 Thailand 13.5463 99.6182 Abundant
RATCH Ratchaburi Power 25% gas 1400.0 Thailand 13.5300 99.8000 Abundant
RATCH Ratchaburi Tri Energy 50% gas 700.0 Thailand 13.5300 99.8000 Abundant
RELIANCE Amulin 100% hydro 420.0 India 28.4000 94.5500 Abundant
RELIANCE Butibori-Hinga 100% coal 300.0 India 21.0700 79.2700 Stressed
RELIANCE Dadri 100% gas 7480.0 India 28.6667 77.4333 Stressed
RELIANCE Dahanu 100% thermal 500.0 India 19.0000 73.0000 Abundant
RELIANCE Emini 100% hydro 500.0 India 28.4000 94.5500 Abundant
RELIANCE Kochi-Kerala 100% naphtha 165.0 India 10.0200 76.2300 Moderate
RELIANCE Krishnapatnam 100% coal 4000.0 India 14.2833 80.1167 Scarce
RELIANCE Mithundon 100% hydro 400.0 India 28.4000 94.5500 Abundant
RELIANCE MP Power 100% coal 3960.0 India 24.4167 81.8833 Stressed
RELIANCE Peddapuram SamalKot 100% gas 220.0 India 16.9333 82.2167 Scarce
TABLE B. Power Plant Data Used in Water Stress Mapping (cont.)
Company Name
% Ownership TypeCurrent
Capacity (MW)Planned
Capacity (MW)
Country
Latitude LongitudeWater Stress
Level
Company DataCARMA, Maplandia,
Google Earth IWMI 2004
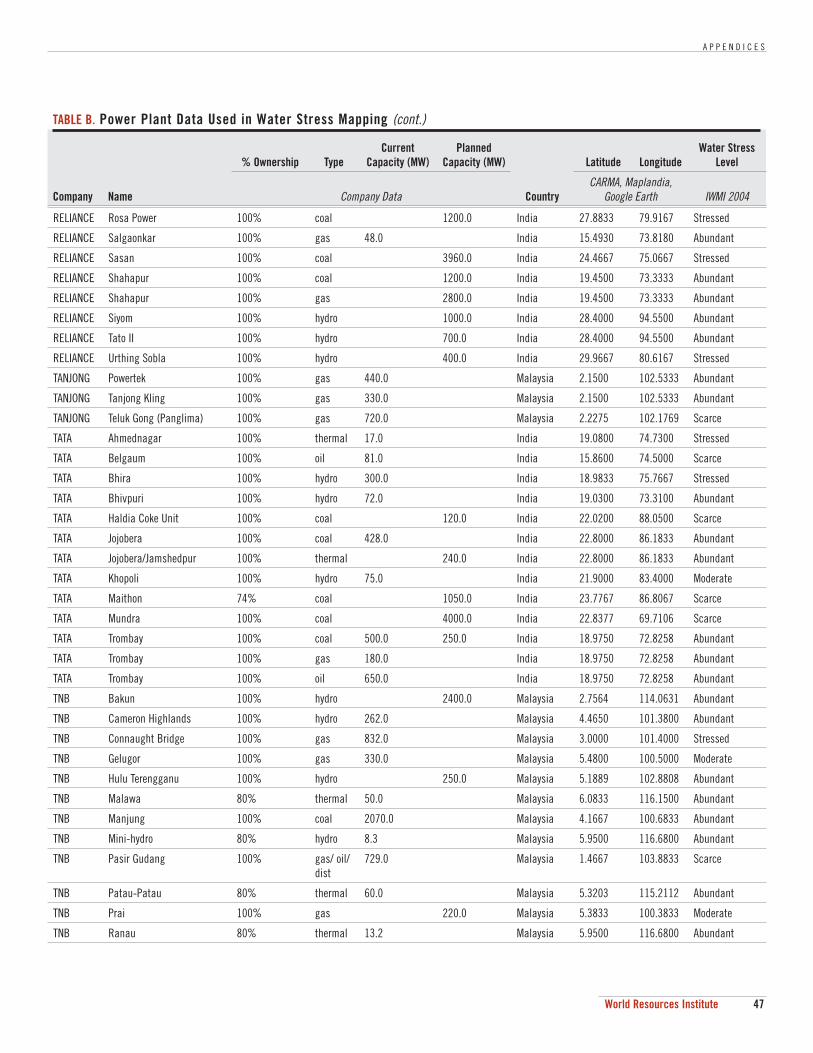
A P P E N D I C E S
47World Resources Institute
RELIANCE Rosa Power 100% coal 1200.0 India 27.8833 79.9167 Stressed
RELIANCE Salgaonkar 100% gas 48.0 India 15.4930 73.8180 Abundant
RELIANCE Sasan 100% coal 3960.0 India 24.4667 75.0667 Stressed
RELIANCE Shahapur 100% coal 1200.0 India 19.4500 73.3333 Abundant
RELIANCE Shahapur 100% gas 2800.0 India 19.4500 73.3333 Abundant
RELIANCE Siyom 100% hydro 1000.0 India 28.4000 94.5500 Abundant
RELIANCE Tato II 100% hydro 700.0 India 28.4000 94.5500 Abundant
RELIANCE Urthing Sobla 100% hydro 400.0 India 29.9667 80.6167 Stressed
TANJONG Powertek 100% gas 440.0 Malaysia 2.1500 102.5333 Abundant
TANJONG Tanjong Kling 100% gas 330.0 Malaysia 2.1500 102.5333 Abundant
TANJONG Teluk Gong (Panglima) 100% gas 720.0 Malaysia 2.2275 102.1769 Scarce
TATA Ahmednagar 100% thermal 17.0 India 19.0800 74.7300 Stressed
TATA Belgaum 100% oil 81.0 India 15.8600 74.5000 Scarce
TATA Bhira 100% hydro 300.0 India 18.9833 75.7667 Stressed
TATA Bhivpuri 100% hydro 72.0 India 19.0300 73.3100 Abundant
TATA Haldia Coke Unit 100% coal 120.0 India 22.0200 88.0500 Scarce
TATA Jojobera 100% coal 428.0 India 22.8000 86.1833 Abundant
TATA Jojobera/Jamshedpur 100% thermal 240.0 India 22.8000 86.1833 Abundant
TATA Khopoli 100% hydro 75.0 India 21.9000 83.4000 Moderate
TATA Maithon 74% coal 1050.0 India 23.7767 86.8067 Scarce
TATA Mundra 100% coal 4000.0 India 22.8377 69.7106 Scarce
TATA Trombay 100% coal 500.0 250.0 India 18.9750 72.8258 Abundant
TATA Trombay 100% gas 180.0 India 18.9750 72.8258 Abundant
TATA Trombay 100% oil 650.0 India 18.9750 72.8258 Abundant
TNB Bakun 100% hydro 2400.0 Malaysia 2.7564 114.0631 Abundant
TNB Cameron Highlands 100% hydro 262.0 Malaysia 4.4650 101.3800 Abundant
TNB Connaught Bridge 100% gas 832.0 Malaysia 3.0000 101.4000 Stressed
TNB Gelugor 100% gas 330.0 Malaysia 5.4800 100.5000 Moderate
TNB Hulu Terengganu 100% hydro 250.0 Malaysia 5.1889 102.8808 Abundant
TNB Malawa 80% thermal 50.0 Malaysia 6.0833 116.1500 Abundant
TNB Manjung 100% coal 2070.0 Malaysia 4.1667 100.6833 Abundant
TNB Mini-hydro 80% hydro 8.3 Malaysia 5.9500 116.6800 Abundant
TNB Pasir Gudang 100% gas/ oil/ dist
729.0 Malaysia 1.4667 103.8833 Scarce
TNB Patau-Patau 80% thermal 60.0 Malaysia 5.3203 115.2112 Abundant
TNB Prai 100% gas 220.0 Malaysia 5.3833 100.3833 Moderate
TNB Ranau 80% thermal 13.2 Malaysia 5.9500 116.6800 Abundant
TABLE B. Power Plant Data Used in Water Stress Mapping (cont.)
Company Name
% Ownership TypeCurrent
Capacity (MW)Planned
Capacity (MW)
Country
Latitude LongitudeWater Stress
Level
Company DataCARMA, Maplandia,
Google Earth IWMI 2004

O V E R H E A T I N G
48 World Resources Institute
TNB Sandakan 80% thermal 34.0 Malaysia 5.8600 118.0500 Abundant
TNB Serdang 100% gas/ dist 625.0 Malaysia 2.9800 101.7800 Moderate
TNB Sultan Aziz (Kapar) 60% coal 1600.0 Malaysia 3.0000 101.4000 Stressed
TNB Sultan Aziz (Kapar) 60% gas 820.0 Malaysia 3.0000 101.4000 Stressed
TNB Sultan Ismail (Paka) 100% gas/ dist 1139.0 Malaysia 4.6500 103.4300 Abundant
TNB Sultan Mahmud (Kenyir) 100% hydro 400.0 Malaysia 5.0667 103.0167 Abundant
TNB Sungai Piah Ulu (Perak) 100% hydro 1248.0 Malaysia 4.4000 101.1833 Abundant
TNB Tawau 80% thermal 36.0 Malaysia 4.2500 117.9000 Abundant
TNB Teluk Ewa 100% dist 68.0 Malaysia 6.4250 99.0128 Abundant
TNB Telupid 80% thermal 13.2 Malaysia 5.6500 117.1167 Abundant
TNB Tenom-Pangi 80% hydro 66.0 Malaysia 5.1333 115.9500 Abundant
TNB TJGS 100% gas 714.0 Malaysia 2.5230 101.8000 Moderate
TNB Tuanku Jaafar 100% gas 750.0 750.0 Malaysia 2.5230 101.8000 Moderate
TNB Tungku 80% thermal 13.2 Malaysia 5.0186 118.8839 Abundant
TNB Ulu Jelai 100% hydro 372.0 Malaysia 4.1833 102.0500 Abundant
VSH Dong Cam 0% hydro 120.0 Vietnam 11.1103 107.1811 Abundant
VSH Song Hinh 0% hydro 70.0 Vietnam 10.9667 106.6500 Abundant
VSH Upper Kon Tum 0% hydro 220.0 Vietnam 14.3833 107.9833 Abundant
VSH Vihn Son (Song Kon) 0% hydro 66.0 Vietnam 13.7667 109.2333 Abundant
VSH Vihn Son-2 0% hydro 100.0 Vietnam 13.7667 109.2333 Abundant
VSH Vihn Son-3 0% hydro 30.0 Vietnam 13.7667 109.2333 Abundant
YTLP Paka 100% gas 808.0 Malaysia 4.6500 103.4300 Abundant
YTLP Pasir Gudang 100% gas 404.0 Malaysia 1.4667 103.8833 Scarce
TABLE B. Power Plant Data Used in Water Stress Mapping (cont.)
Company Name
% Ownership TypeCurrent
Capacity (MW)Planned
Capacity (MW)
Country
Latitude LongitudeWater Stress
Level
Company DataCARMA, Maplandia,
Google Earth IWMI 2004

N O T E S
49World Resources Institute
Notes
1. U.S. Energy Information Administration, International Energy Outlook 2006.2. The most recent IMF and ADB economic forecasts project improved GDP growth rates in 2010. See IMF World
Economic Outlook: Crisis and Recovery, 2009 and Asian Development Bank Outlook 2009: Rebalancing Asia’s Growth (updated May 7, 2009).
3. Tata 89th Annual Report 2007-2008 p.45.4. Syriyan Pietersz, Company Visit Note: Vihn Son Song Hinh Hydropower Joint Stock Company, JPMorgan, June
8, 2009.5. Edmond Lee, Positioning for Further Recovery, JPMorgan Asia Pacific Equity research, May 7 2009.6. Energy Information Administration website: http://www.eia.doe.gov/emeu/cabs/India/Electricity.html.7. NTPC Annual Report 2007-2008 p.34.8. Tata Power Annual Report 2008 p. 46.9. Sumeet Agrawal, Indian Power Utilities: A new, competitive landscape. HSBC Global Research, August 29,
2008.10. CEA’s executive summary, Economic Survey 2007-2008.11. Amish Shah and Sagar Rastogi, “India Utilities Sector: Plans versus Plants” Credit Suisse Equity Research,
October 3, 2009.12. Edmond Lee, Positioning for Further Recovery, JPMorgan Asia Pacific Equity research, May 7 2009.13. EVN website. http://www.evn.com.vn/14. 2030 Water Resources Group. "Charting Our Water Future: Economic Frameworks to Inform Decision-
Making." 2009. 15. Gleick,, P. 2007. The World’s Water 2006-2007: A Biennial Report on Freshwater Resources.16. FAO, “Thailand’s Water Vision: A Case Study” 2001.17. Cuong, N 2008. Viet Nam Country Report – A Regional Review on the Economics of Climate Change in
Southeast Asia. Report submitted for RETA 6427: A Regional Review of the Economics of Climate Change in Southeast Asia. Asian Development Bank, Manilla. 2009.
18. Mukherji A et al 2009. “Revitalizing Asia’s Irrigation: to sustainably meet tomorrow’s food needs. Colombo, Sri Lanka: International Water Management Institute, Rome, Italy: Food and Agriculture Organization of the United Nations.
19. Jason Morrison et al., “Water Scarcity & Climate Change: Growing Risks for Businesses & Investors” CERES, Boston February 2009.
20. United Nations Environment Programme and the Asian Institute of Technology, “Freshwater Under Threat: South Asia” Nairobi: 2008.
21. Contribution of Working Group II to the Fourth Assessment Report, Climate Change 2007, Impacts, Adaptation and Vulnerability.
22. Hoanh et al “Will we produce sufficient food under climate change? Mekong Basin (South-east Asia).” In J.C.J.H. Aerts and P.Droogers, eds. Climate Change in Contrasting River Basins: Adaptation Strategies for Water, Food, and Environment. CABI Publishing, Wallingford 2004.
23. ADB 2004. Climate Change in Asia: Viet Nam Country Report. Manila.24. Mukherji A et al 2009. “Revitalizing Asia’s Irrigation: to sustainably meet tomorrow’s food needs. Colombo,
Sri Lanka: International Water Management Institute, Rome, Italy: Food and Agriculture Organization of the United Nations.
25. Guenther Fischer et al, “Climate Change Impacts on Irrigation Water Requirements: Effects of Mitigation, 1990-2080.” Technological Forecasting and Social Change 74, no.7 (September 2007): 1083-1107.
26. Marc Levinson, Watching Water, JPMorgan Global Equity Research April 2008.27. Government of India, Ministry of Water Resources, “National Water Policy” New Delhi, April 2002. http://
wrmin.nic.in/writereaddata/linkimages/nwp20025617515534.pdf.

O V E R H E A T I N G
50 World Resources Institute
28. “Forum on Clean Energy, Good Governance and Regulation” Materials, March 16-18 2008. Hosted by Centre on Asia and Globalisation, Lee Kuan Yew School of Public Policy National University of Singapore.
29. Gio Dela-Rosa, Philippine Power Sector, The next wave. Deutsche Bank, April 24, 2008.30. Manish Saxena, Deepak Agrawala, Sandeep Palgota, “Is this the first sign of cracks for power utilities in
India?” Deutsche Bank, June 2, 2009.31. Amish Shah and Sagar Rastogi, “India Utilities Sector: Plans versus Plants” Credit Suisse Equity Research,
October 3, 2009.32. DOE Report to Congress on the Interdependency of Energy and Water, 2006.33. P. Torcellini, N. Long, and R. Judkoff, “Consumptive Water Use for U.S. Power Production” NREL, 2003.
NREL/TP-550-33905.34. Powerscorecard.org, “How does electric power production use and consume water.”35. National Energy Technology Laboratory, “Water Requirements for Existing and Emerging Thermoelectric
Plant Technologies” DOE/NETL-402/080108. April 2009 revision.36. It’s worth noting that the data presented in Figure 18 is specific to one technology (a monoethanolamine
(MEA) recovery unit based on the fluor econamine FG technology). However, research in this area is ongoing and systems with improved efficiency, costs and/or water balances are being pursued.
37. Energy Velocity Suite, Nuclear Regulatory Commission Outage query. http://www1.ventyx.com/velocity/vs-overview.asp.
38. Argonne National Laboratory. “Use of Reclaimed Water for Power Plant Cooling,” 2007.39. Atsushi IIMI, “Estimating Global Climate Change Impacts on Hydropower Projects: Applications in India, Sri
Lanka and Vietnam” World Bank, Washington DC September 2007.40. M. Monirul Qader Mirza , R. A. Warrick and N. J. Ericksen, “The Implications of Climate Change on Floods of
the Ganges, Brahmaputra and Meghna Rivers in Bangladesh” Climatic Change, Volume 57, Number 3 / April, 2003. Pp. 287-318.
41. Viet Nam: Mong Duong Thermal Power Project Environmental Assessment Report #39595. Prepared by the Government of Vietnam for the Asian Development Bank August 2006.
42. Thaniya Kevalee and Siriporn Sothikul, “Thailand Power Sector: Bottom-fish the beta play” Credit Suisse Equity Research, March 20, 2009.
43. Working Group II Contribution to the IPCC, 4th Assessment Report, Climate Change Impacts, Adaptation and Vulnerability, Summary for Policy Makers.
44. California Energy Commission, “Comparison of Alternate Cooling Technologies for California Power Plants: Economic, Environmental, and Other Tradeoffs. 500-02-079F. February 2002.
45. California Energy Commission, “Comparison of Alternate Cooling Technologies for California Power Plants: Economic, Environmental, and Other Tradeoffs. 500-02-079F. February 2002.
46. Pacific Institute. “Water Scarcity and Climate Change: Growing Risks for Businesses and Investors,” February 2009. Page 12.
47. Running Dry, EPRI Journal Summer 2007.48. Amish Shah and Sagar Rastogi, “India Utilities Sector: Plans versus Plants” Credit Suisse Equity Research,
October 3, 2009.49. Asian Water Development Outlook 2007.50. Marc Levinson, Watching Water, JPMorgan Global Equity Research April 2008.

Each World Resources Institute report represents a timely and scholarly treatment of a subject of public concern. WRI takes responsibility for choosing the study topics and guaranteeing its authors and researchers freedom of inquiry. It also solicits and responds to the guidance of advisory panels and expert reviewers. Unless otherwise stated, however, all the interpretations and findings set forth in WRI publications are those of the authors.
ISBN: 978-1-56973-742-2
Copyright 2010 World Resources Institute

OVER HEATINGFinancial Risks from Water Constraints on Power Generation in AsiaIndia, Malaysia, Philippines, Thailand, Vietnam
WRI
Amanda Sauer
Piet Klop
HSBC
Sumeet Agrawal
ISBN: 978-1-56973-742-2
ABOUT WRI
The World Resources Institute (WRI) is an environmental think tank that goes beyond research to create practical ways to protect the Earth and improve people’s lives. Our mission is to move human society to live in ways that protect the Earth’s environment for current and future generations.
Our programs meet global challenges by using knowledge to catalyze public and private action.
• To reverse damage to ecosystems. We protect the capacity of ecosystems to sustain life and prosperity.
• To expand participation in environmental decisions. We collaborate with partners worldwide to increase people’s access to information and influence over decisions about natural resources.
• To avert dangerous climate change. We promote public and private action to ensure a safe climate and a sound world economy.
• To increase prosperity while improving the environment. We challenge the private sector to grow by improving environmental and community well-being.
In all its policy research, and work with institutions, WRI tries to build bridges between ideas and actions, meshing the insights of scientifi c research, economic and institutional analyses, and practical experience with the need for open and participatory decision making.
ABOUT HSBC CLIMATE CHANGE CENTRE OF EXCELLENCEThe HSBC Climate Change Centre of Excellence was created in 2007, to help advise HSBC and its clients on the evolution and impacts of climate change. The team performs macro research on climate change science, policies and markets.
The Centre also publishes joint research pieces in collaboration with fundamental analysts, helping highlight valuation impacts of climate change. Global and country-specifi c reports highlight investment potential related to policy and market changes.
10 G Street, NESuite 800Washington, DC 20002www.wri.org