water & sanitation services in greece and the ... · surface water 765 recorded streams, of...
TRANSCRIPT

WATER & SANITATION SERVICES IN GREECE
and the sustainability challenges
D. AssimacopoulosSchool of Chemical Engineering
National Technical University of Athens, Greece

Presentation contents
1. Overview of the Country and the major water issues
2. A short reference to water management practices in the ancient times
3. The structure of the Greek Water Industry today
4. Urban water services in the large metropolitan areas
� Infrastructure & investments
� Problems & opportunities
5. Urban water services in the non-metropolitan areas
� Until 2010 and after the Administrative Reform of 2010
� Subsequent changes and issues
6. Sustainability challenges and Concluding remarks

A region at the crossroads

Greece: A timeline

Some figures
� Area: 131,990 km²� Topography
� More than 40 % of the land > 500 amsl� Coastline: 13,676 km� ∼ 6,000 islands and islets - 227 inhabited
� Population: ∼ 10.79 million (2011)� 1/3 concentrated along the coast
� Administrative divisions� 13 Regions
� 9 in the mainland� 4 for insular complexes
� 325 municipalities
� 14 Hydrological Departments
Regions
Hydrological
Departments
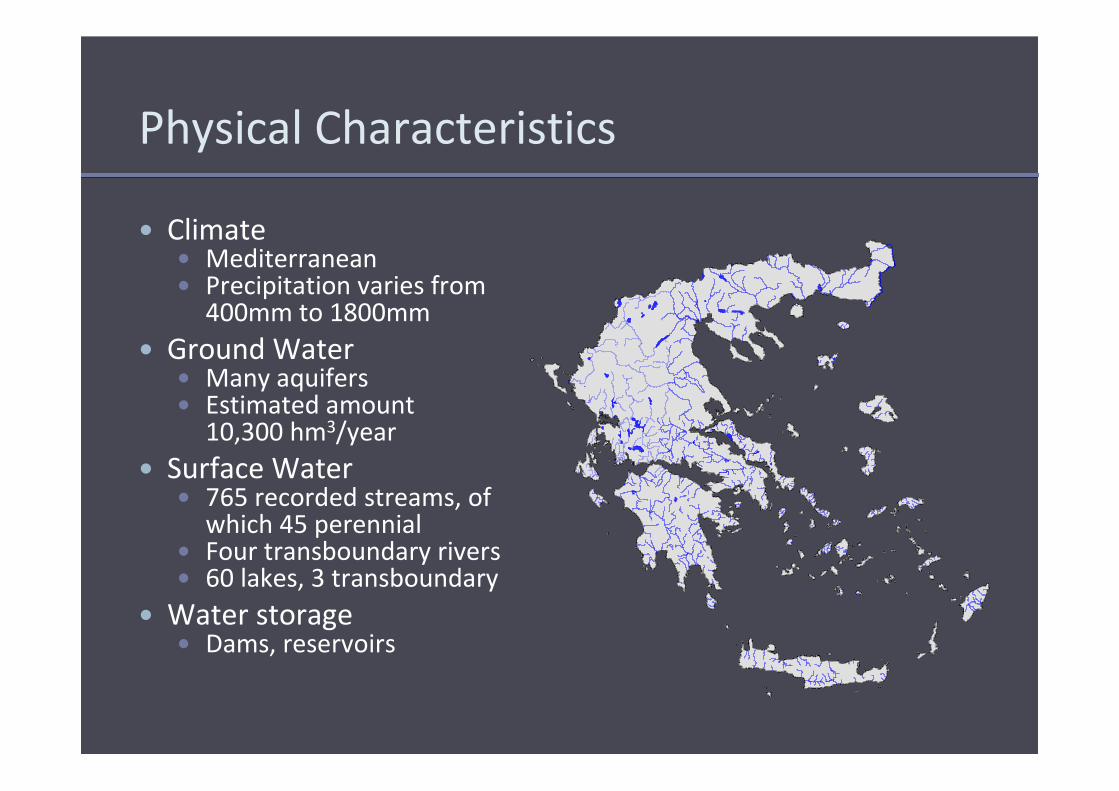
Physical Characteristics
� Climate� Mediterranean � Precipitation varies from
400mm to 1800mm
� Ground Water� Many aquifers � Estimated amount
10,300 hm3/year
� Surface Water� 765 recorded streams, of
which 45 perennial� Four transboundary rivers� 60 lakes, 3 transboundary
� Water storage� Dams, reservoirs

Issues
� Main user: Agriculture highly dependent on irrigation
� Seasonality of demand� Tourism, peaks in the summer
� Agriculture, peak demand in the dry season
� Uneven distribution of resources
� Uneven distribution of population
� Overexploitation and salinization of underground aquifers
� Dependence on transboundary waters flowing from northern regions � 30% of total average annual water resources originates outside the country
� Increasing frequency of droughts and torrential rains in recent years

Uneven distribution of Resources –
Population Areas under stress

The water issues
The “Kathimerini “ newspaper, 29 June
2008
1. Lack of basic infrastructure projects in several areas
2. Lack of contingency plans for areas vulnerable to drought
3. Costly and difficult (in terms of obtaining approvals) for citizens to harvest rainwater (loss of traditional water saving options)
4. Lack of consistent irrigation water pricing mechanisms; irrigation water is often not metered, and its use tends to be wasteful
5. Drip irrigation has not been widely adopted; low efficiency due to inefficient irrigation scheduling
6. Deterioration of surface and groundwater due to agrochemicals and industrial pollution
7. Treated effluents are not used for irrigation or aquifer recharge
8. Significant conveyance and distribution losses
9. Uncontrollable groundwater extraction, mostly through illegal boreholes
10. High water consumption in insular and coastal areas due to tourist influx
11. Coastal aquifers subject to salinization due to overexploitation

LEGACY IN WATER SUPPLY AND
SANITATION

The Minoan and Mycenaean periods
� Minoan civilization (3500-1200 BC)
� Wells from as early as 1900 BC
� Pipes for water conveyance fromnearby springs
� Underground distribution piping
� Rainwater harvesting
� Sanitation facilities (bathrooms, bathtubs)
� Recreational water use
� Mycenaean civilization (1600-1100 BC)
� Large-scale hydraulic works
� Sanitation facilities
Terracotta pipes for water distribution
under the floor of the Knossos palace,
Crete
Cistern for rainwater storage in Faistos,
Crete. Water would first pass through a
sand filter and then stored in the cisternThe “Bathtub of Nestor”
Mycenaean palace of Pylos, Peloponnese

Classical period: Tunnel of Eupalinos (530-520 BC)
� Conveyance of water to the city of Pythagorio, through the Kastromountain� Aim: Ensure that the water supply of the
city was not vulnerable to enemy attacks
� Tunnel length: 1036m
� Aqueduct length: 2800m
� First- known deep tunnel in history, with many innovations� Construction started from two openings
� Use of geometry to determine the route and eliminate uncertainty in position and direction
� Ensure gradient for water flow
Plan-view plot of a tunnel axis

Classical period: Water management in
Athens
� Athenians had to cope with limited water supply even at that time – low rainfall and intermittent run-off
� Public and private wells
� More than 400 wells have been excavated in the city centre
� 6th century BC: Pisistratian Aqueduct� Conveyance of water from the foothills of
Hymettus mountain to the city centre
� 4th century BC: Groundwater gradually replaced by cisterns for rainwater harvesting
� No more large-scale waterworks before the Roman times!
� Emphasis on large reservoirs for rainwater storage and self-sufficiency (during war or siege) and not on abundance through large-scale transfers
� Democratic decision-making and reluctance to spend money on costly projects
The design of the Pisistratian
Aqueduct
Part of the Pisistratian Aqueduct ,
excavated in Athens: Small holes were
used for cleaning/maintenance purposes

Classical period: Regulation on private wells & water
sharing
�
any private wells →� Overexploitation problems
� Conflicts over water supply
The Law of Solon (638 BC The Law of Solon (638 BC –– 558 BC)558 BC)•When there is a public well within a
“hippikon” (740m distance), all should draw
from that water source
•If the distance is greater, people would
have to try to get water on their own
•However, if, after digging up to a depth of
10 fathoms (18.3m), they could not get
water, they could take it from a neighbor's
well, up to an amount of a 20 L jar twice
per day
Ancient wells, excavated
in the centre of Athens
• Regulation and halting of private
groundwater abstractions
• Solidarity and help to those in need, but
not to those who were idle

AN OVERVIEW OF THE GREEK WATER SECTOR

Adapted from
Podimata and
Yannopoulos, 2012)
The water
management
framework
1st
Level
3rd
Level
2nd
Level
Greek
Government
National Water
Committee
National Water
Council
Ministry of
Environment,
Energy &
Climate Change
Other Ministries
Special
Secretariat for
Water
Decentralized
Administration
Other
Departments of
Decentralized
Administration
with Joint
Competence
Regional Water
Authority
Elective Region
Department of
Environment &
Hydro‐Economy
Other
Departments of
Elective Region
with Joint
Competence
MunicipalitiesWater Supply &
Sanitation
Other Municipal
Departments
Municipal
Council
Regional
Council
Regional
Water Council
River Basin

Water use patterns across Greece
� Irrigated agriculture is
the most significant
water use in all RBDs
� Exception is the Attica
RBD
� The Metropolitan area
of Athens is the
country’s largest urban
center (∼ half of the
population of Greece)
Source: EEA, 2007
River Basin
District
Agriculture
(hm³/yr)
Cattle-
breeding
(hm³/yr)
Domestic
Supply
(hm³/yr)
Industry
(hm³/yr)
Other
(hm³/yr
)
Total
1West Peloponnese
201.0 5.0 23.0 3.0 20.0 252.0
2North Peloponnese
401.5 6.6 41.7 3.0 452.8
3East Peloponnese
324.9 4.7 22.1 351.7
4 West Sterea 366.5 9.0 22.4 397.9
5 Epirus 127.4 9.9 33.9 1.0 172.2
6 Attica 99.0 2.5 400.0 17.5 519.0
7 East Sterea 773.7 9.9 *165.9 12.6 962.1
8 Thessaly 1550.0 12.0 54.0 1616.0
9West Macedonia
609.4 7.9 43.7 30.0 80.0 771.0
10Central Macedonia
527.6 8.0 99.8 80.0 715.4
11 East Macedonia 627.0 5.8 32.0 664.8
12 Thrace 825.2 7.1 27.9 11.0 871.2
13 Crete 320.0 10.2 42.3 372.5
14 Aegean Islands 80.2 6.8 37.2 124.2
Grand Total 6833.4 105.4 1045.0 158.1 100.0 8242.8
82.9% 1.3% 12.7% 1.9% 1.2% 100.0%
* 41.6 hm3
of them are consumed by District 7 & 124.3
hm3
by Athens (Attica)

� Almost full access to piped water supply
� Private boreholes or other sources for some remote houses
� All connections (at a household level) are metered
� IBTs are universally applied
� Connections to sewerage networks &
UWWTPs have increased over the last
decade
� The Implementation of the UWWT
Directive has been satisfactory,
despite the initial delay
Public water supply and sanitation
services
Source: Eurostat Source: EEA

Current organization of the Urban water sector
(1/2)
� Metropolitan area of AthensEYDAP (Act 1068/1980)
� Metropolitan area of ThessalonikiEYATH (Act 2651/1998)
� Each comprises two entities� A public (“asset”) company “Owner” of
the major hydraulic infrastructure (dams, conveyance networks)
� A semi-private water utility “Owner” & “Manager” of treatment plants & water distribution networks
� Both semi-private utility shares are traded in the Athens Stock Exchange� EYDAP private shares: 39%� EYATH private shares: 26%
� Other cities
� Municipal Enterprises for Water Supply and Sewerage
� DEYAs (Act 1069/1980)
� Enterprises operating under private law but owned and controlled by the municipalities
� Assets (networks, treatment units, etc.) are owned by the municipality –Public assets
� DEYAs are responsible for operation and maintenance� Financial costs are recovered through
water billing
� Infrastructure development is financed by the municipality, the State or EU Structural Funds
Costs are often borne to the Utilities by the Asset companies
(such as the repair of damages in conveyance network)

Current organization of the Urban water sector
(2/2)
� EYDAP (Athens) ∼ 4.3 million inhabitants
� EYATH (Thessaloniki) ∼ 1 million inhabitants
� All DEYAs ∼ 5 million inhabitants

Urban Water Services in Athens
Mornos Dam & Lake, Western Greece (1972)
Marathon dam, 1931
Yliki lake, 1958
Evinos dam, 2001


Milestones and institutional changes in the provision of
water services in Athens during the 20th century
Adapted from Kallis, 2010, Coevolution in water resource development: The vicious cycle of water supply and
demand in Athens, Greece, Ecological Economics, 796-809

Severe
drought
Economic
Crisis
The evolution of water consumption
Civil war

An expanding hydraulic system
Source: D. Koutsoyiannis, NTUA
1920
1930
1940
1950
1960
1970
1980
1990
2000
Hadrian aqueduct
Marathon dam
Yliki
Mornos dam
Evinos-Mornos aqueduct
0 1000 2000 3000 4000
Population
0 100 200 300 400 (hm3/)yr
ConsumptionDrought
Drought

An expanding hydraulic system
1920
1930
1940
1950
1960
1970
1980
1990
2000
Hadrian aqueduct
Marathon dam
Yliki
Mornos dam
Evinos-Mornos aqueduct
0 1000 2000 3000 4000
Population
0 100 200 300 400 (hm3/)yr
ConsumptionDrought
Drought

An expanding hydraulic system
1920
1930
1940
1950
1960
1970
1980
1990
2000
Hadrian aqueduct
Marathon dam
Yliki
Mornos dam
Evinos-Mornos aqueduct
0 1000 2000 3000 4000
Population
0 100 200 300 400 (hm3/)yr
ConsumptionDrought
Drought
� Raw water supply relies mainly on surface
water sources
� 3 artificial reservoirs (dams) and 1 natural lake
� Total water abstraction: 451.42 hm³/yr
� 105 boreholes (max. capacity of 0.8 hm³/d) for
emergency water supply conditions

Water treatment & distribution (2012)
� Population served: 4.3 million� Directly by EYDAP: 84%� Indirectly through municipal
networks: 16%� 2,030,000 water supply
connections� 1.15 hm³/d average
consumption
� Raw water is treated in 4 WTPs� Total capacity of 1.9 hm³/d
� 55 local reservoirs� Total capacity of 885,000 m³
� 9,500 km network length� 81 pumping stations � SCADA monitoring system Water distribution network of EYDAP S.A.

Sewerage infrastructure
� Separate system: 96%� 6,000 km network length� 44 pumping stations� SCADA monitoring system
� 400,000 sewerage connections� Network is expanding towards the
outskirts, following city growth
� Three WWTPs1. Psyttaleia
� Advanced secondary treatment with nitrogen removal, sludge treatment and electricity production from biogas
2. Metamorphosis3. Thriasio (industrial zone of the
Athens Metropolitan Area)
� Plans for one additional WWTP1. Mesogeia (towards the airport)
A very small uninhabited island and former naval
prison became the “kidney” of an entire metropolis

Equity and Investments by EYDAP S.A.
� EYDAP S.A. private shares: 39%
� According to EYDAP foundation law, the State is committed to subsidize 60% of capital expenditure
� EYDAP Investment Programme� Improvement of currently
provided services by using economies of scale � Reduction of operational costs � Improved management
� New activities� Electricity production projects� Expansion towards new markets
Source: EYDAP 2011
Total Investment budget for 2011 Total Investment budget for 2011
(own resources): 57M(own resources): 57M€€

Pricing policy
� “Low cost” pricing policy(Law 2744/99)
� Increasing Block Tariffs for water supply� 8 tariff categories � Households: 67% of water supply
revenues� Municipal water supply: 14% of
revenues
� Tariffs and sewerage charges are renegotiated every 5 years with the Ministries of Finance and the Environment� Inflation� Costs of water service provision � Water Framework Directive
requirements

Tariffs
� Increasing Block Tariffs� Volumetric charge
� Differentiated according to the type of use (Residential vs. Commercial/Industrial)
� Minimum consumption� Fixed charge
� Simple volumetric rates� Public buildings� Bulk water supply to
municipalities that manage their own network
� Sewerage/WWTP charges� 75% of volumetric charges
for water supply

EYDAP – Water Tariffs Monthly consumption (m³) Rate (€/m³)
Residential Use
(minimum consumption of 2 m³/month)
0-5 0.4138
5-20 0.6471
20-27 1.8566
27-35 2.5992
>35 3.2357
Commercial /industrial use
(minimum consumption of 100 m³/month)
<1000 0.8381
>1000 0.9896
Public buildings/institutions Independent 0.9972
Municipal water supply Independent 0.4880
Untreated water Independent 0.1804
Monthly fixed charge Consumption Rate (€)
Meter Diameter between 5/8΄΄ and 3/4΄΄ (Residential use) <30m3/trimester 0.5600
30-60m3/trimester 0.8700
>60m3/trimester 1.6400
Diameter between 1’’ and 6’’ (industrial use/supply
reinforcement)4.37-43.62
Other charges
Sewerage charges 75% of charges for water supply
VAT13% on water supply
23% on fixed & sewerage charges

Revenues, costs & profit The effects of the economic crisis
Revenues from water services O&M costs
Net profit

Urban Water Services in Thessaloniki


Water distribution & Sewerage infrastructure
� 1939: Creation of “Organization
for Water Supply of the
Thessaloniki”
� 1998: Formation of EYATH S.A.
and EYATH Asset Company
� Raw water from surface (Aliakmonas river)
& groundwater reserves
� Main water treatment plant near Sindos� Capacity of 150,000 m³/d
� Water distribution network
� 250,000 m³/day average potable water
production
� 2,200 km network length
� 48 pumping stations
� SCADA surveillance system
� 510,000 water supply connections
� Sewerage network
� Separated network
� 1,700 km network length
� 35 pumping stations
� 2 WWTPs (Sindos, Aineia)
� SCADA surveillance system
� 510,000 clients- consumers

Equity & Investments by EYATH S.A.
� The public “asset” company (EYATH Fixed Assets) owns the infrastructure for water abstraction� Water abstraction works� Pumping stations & wells� Conveyance networks
� The semi-private utility (EYATH S.A.) manages water/wastewater treatment plants, distribution & sewerage networks
� Shareholders� Private shareholders: 26%
� Suez Environment: 5%� Other companies: 11%� Small shareholders: 9%
� State participation: 74%
Source: EYATH

Pricing policy and tariffs
� The pricing policy is based on:� The O&M costs of the company
� The implementation of new
infrastructure (Law 2937/2001)
� Increasing Block Tariffs
� Domestic users: 70% of total
revenue
� Tariffs are renegotiated every 5
years with the competent
Ministries
Water supply rates 4-month
consumption (m³)
Rate (€/m³)
Residential Use 0-10 0.47
11-30 0.65
31-60 0.74
64-120 1.18
121-180 2.42
>180 4.03
Commercial /industrial use<500 (per month) 0.54
>500 (per month) 0.83
Public buildings/institutions - 0.65
Municipal water supply - 0.38
Untreated water - 0.1804
Fixed charge Rate (€/4-month period)
Meter diameter between
1/2΄΄ & 3/4΄΄*
3.08* If consumption exceeds 40m³/4-month
period, fixed charges are doubled
Meter diameter between 1’’
& 3’’60.32
Meter diameter >= 4’’ 90.52
Other charges
Sewerage charges 80% of charges for water supply
VAT13% on water supply
23% on fixed & sewerage charges

Revenues, costs & profit for EYATH S.A.
Sales revenue Sales cost
Gross profit
Source: EYATH

Urban Water Services in the non-Metropolitan areas

Until 2010…
� 230 Municipal enterprises for water supply and sewerage - DEYAs
� Population served (2010): 4.3 million
� Average consumption: 93 m³/cap/yr
� Investments: 5.5 billion € spent since 1980 (current prices)
Population served Number of DEYAs
(before 2010)
>100,000 inh. 3
50,000 – 100,000 16
20,000 – 50,000 25
10,000 – 20,000 62
< 10,000 124
Total 230

The 2010 reform : Re-organization of the Greek local
administration (Kallikratis Law)
� Main law features� Abolishment of prefectures� Reduction in the number of
municipalities (merging)� Larger powers vested in Regions
& Municipalities
� Before the reform� 910 municipalities & 124
communities� ~230 DEYAs� 4.3 million inh. served
� After the reform� 325 municipalities� 142 DEYAs� 5.1 million inh. served (+ 20%)
Source: EDEYA, Safarikas N., 2010

Pricing policy and tariffs
� Tariffs vary per utility (population, infrastructure etc.) � Main objective: Recovery of
O&M costs� Increasing Block Tariffs
� According to EDEYA (sample of 70 DEYAs in 2008)� Average rate: 1.35 €/m³� Minimum rate (lowest block):
0.23 €/m³� Maximum rate (highest block):
2.76 €/m³
DEYA: Population
served
Average rate
(2005)
50,000 – 100,000 1.49 €/m3
20,000 – 50,000 1.39 €/m3
10,000 – 20,000 1.17 €/m3
< 10,000 0.84 €/m3
Source: Safarikas N. et al, 2003

The present-day problems
� Policies and strategy dominated by the Municipal Council
� Small size, dispersed in space, without a common strategy/bonds
� High exposure to the economic crisis� DEYAs are dependent on State/Municipal
funding, esp. for investments
� Low municipal funds for financing DEYAsactivities (even the O&M costs)
� Higher costs for water supply provision, due to higher energy prices
� 10% average decrease in consumption
� Average revenue decrease of about 15- 20%
http://cyclades24.g
r

CONCLUDING REMARKS

The Sustainability challenge
� Ensuring resource conservation -Environmental sustainability� Wastewater treatment & reuse� More efficient technology –
water/energy conservation
� Ensuring adequate funding for maintaining, enhancing & upgrading current water systems - Financial sustainability� Cost recovery� Efficient allocation of economic
resources� Private investment
� Ensuring access & affordability, particularly for low-income groups -Social sustainability� Tariffs & cost allocation across different
social groups

Challenge #1: Wastewater collection &
treatment
� EU Urban Waste Water Directive 91/271/EC� All wastewaters to be treated by
2005� Greece missed deadline but is
expected to meet requirements by the end of 2013
� Progress in the development of wastewater treatment� 1985-2008: increase in the share of
population connected to a WWTP from 10% to 70%
� 1995-2008: increase in the share of population connected to tertiary treatment from 6.3% to 64.4%)
Source: EEA

Challenge #1: Wastewater collection &
treatment
� National Information Database on
WWTPs1. Location
2. Served agglomerations and
population served
3. Detailed description of technology &
infrastructure
4. Quality parameters accessible to the
public and updated on a regular basis
� Wastewater collection & treatment –
Issues� Not proper operation of some
WWTPs
� Further investments are required� Full compliance with the Urban
Wastewater Treatment Directive
� Rehabilitation of existing infrastructure
Source: Hellenic Ministry of Environment (YPEKA), 2012
http://ypeka.plexscape.com/He
WTTP not operatingWTTP data available
WTTP data not available yet

Challenge #1: Wastewater Reclamation &
Reuse
� Potential uses for treated wastewater in Greece� Crop irrigation
� Irrigation of public parks and gardens
� Aquifer recharge
� Provisions for water reuse set through a “Joint Ministerial Decision” issued in 2011� Quality parameters for different use purposes
� Framework for the issue of permits, monitoring & control
� Design & planning of WWTPs have seldom considered the possibility of wastewater reuse
� Applications remain limited� High cost of developing infrastructure
� Very recent law – provisions to be tested

Challenge #1: WW Reuse opportunities
� Attica region: Plan of EYDAP & Ministry of the Environment
� Reuse of wastewater for irrigating public parks & peri-urban green areas
� Estimated that about 13% of the WWTP outflow can be reused
� About 40 hm³/yr – max 270,000 m³/d
� Annual water saving ∼ max 6%
� State funding required: 30 M€
� Plan of EYATH
� Treated wastewater for crop irrigation in the Chalastra valley (1,200 ha)
� Sludge of WWTP as a soil fertilizer
� EDEYA (the union of Greek DEYAs)
� Initiatives for promoting infrastructure for wastewater reuse

Challenge #1: Water conservation-
Losses
� Major problem of water services in Greece, particularly in small DEYAs� Old infrastructure/
damaged water meters� Network leakages
� Substantial amounts of non-revenue water1. Municipal buildings 2. Irrigation of public
gardens- parks3. Illegal connections
� Actions to be
implemented� Conservation and
replacement of damaged
equipment
� SCADA control
� Continuous inspection of
connections
� Enforcement of tariffs for
the public sector
� Fines for illegal actions

Challenge #2: Cost recovery
Source: OECD, 2009
Price (USD) per m3 of water and
wastewater services for a household
consuming 15 m3/month in various
OECD countries
� Environmental &
resource costs are
ignored despite being
introduced in the WFD
Transposition Law
(3199/2003)
� In many RBDs, even
financial costs (esp.
capital costs) are not
recovered
� In 2005, 74 DEYAs
recovered just 60% of
their total financial cost

Challenge #2: Cost recoveryAverage expenditure for water services
Source: Safarikas, 2008

Challenge #2: New investments
GDP
(USD
billion)
GDP/cap
(USD)
Current
expenditure on
water
infrastructure
(USD billion)
Projected
expenditure on
water
infrastructure as
% of GDP
Average annual
investment
(USD billion)
By 2025
Australia 602 29,893 4.52 1.08 9.95
Austria 254 31,254 1.91 0.89 3.91
Belgium 309 29,707 2.32 0.69 4.38
Canada 1050 32,921 7.87 0.83 15.74
Finland 152 29,305 1.14 0.69 2.15
France 1724 27,738 12.93 0.83 25.84
Germany 2391 28,988 17.93 0.83 35.84
Greece 224 20,362 1.68 0.81 3.34
Hungary 152 15,546 1.14 1.37 2.79
Source OECD, 2009

Challenge #3: Social considerations
� Awareness of “true water cost”
� Acceptability of water price increase
� Economic crisis
� Water- related charges must be affordable to all
� What was affordable before, may not be affordable
anymore… (at least for some consumers)

The Greek economic crisis (1/3)
� Household water consumption is decreasing
� Reduction in revenues from water services & from new connections
� O&M costs are also decreasing
� Reduction in labour costs (enforced by the State for all state- controlled utilities)
� Reduction in energy use
� Despite the initial shock, profits show an upward trend for EYDAP & EYATH S.A.
� Both companies have a positive economic result

The Greek economic crisis (2/3)
� No more (or very limited) State funding for infrastructure development
� Privatization of EYDAP and EYATH S.A.� The two SAs are among the first on the list
� Most State shares will be sold to private investors
� The State may keep a small share in order to maintain some control over decisions
� Open issues� Conditions and price of assets
� The value of stocks has declined but the companies are profitable
� Asset ownership/transfer (networks, WTPs)
� Future tariff regulation
� Rules for the privatization of the two major Water Utilities (EYDAP and EYATH) have not yet been fixed

The Greek economic crisis (3/3)
� Increase of outstanding payments
� Municipalities which receive water in bulk often delay payment
� Municipalities’ debt to EYDAP SA: 205.8 M€
� EYDAP tries to resolve the problem by taking ownership/signing concession contracts for municipal networks
� Payments by the State (public buildings, damages to public assets) have been suspended
� Government debt to EYDAP SA: 506 M€
� Several consumer categories face difficulties to meet water bills
� Difficulty to propose an increase of tariffs or enforce payment

The few emerging opportunities in a rapidly
changing environment…
� Market expansion of Water
Utilities beyond the water
sector/own geographical focus
� Technical assistance to other
areas of Greece (e.g. Aegean
islands)
� Management of sludge &
exploitation of biogas
� Consulting & othr commercial
activities� Combined ventures (fiber optics
along pipe networks)
� Pursuit of contracts in other
regions: Kazakhstan, Azerbaijan,
M. East, Africa
� The opportunity & challenge of
new partnerships
� Proper coordination &
exploitation of funding tools &
mechanisms
� Asset modernization
� Wastewater reuse projects
� Improved management
� New organizational framework for
water services (privatization)

THANK YOU VERY MUCH FOR YOUR
ATTENTION!