water resources of the albany-schenectady-troy area new … · water resources of the...
TRANSCRIPT
Water Resources of the Albany-Schenectady-Troy Area New York
GEOLOGICAL SURVEY WATER-SUPPLY PAPER 1499-D
Prepared in cooperation with the State of New York and the U.S. Army, Corps of Engineers
fCEivi?jr>jAN 22 ^ \\
\w K D -^ //


Water Resources of the Albany-Schenectady-Troy Area New YorkBy H. N. HALBERG, O. P. HUNT, and F. H. PAUSZEK
WATER RESOURCES OF INDUSTRIAL AREAS
GEOLOGICAL SURVEY WATER-SUPPLY PAPER 1499-D
Prepared in cooperation with the State of New York and the U.S. Army, Corps of Engineers
UNITED STATES GOVERNMENT PRINTING OFFICE, WASHINGTON : 1964

UNITED STATES DEPARTMENT OF THE INTERIOR
STEWART L. UDALL, Secretary
GEOLOGICAL SURVEY
Thomas B. Nolan, Director
For sale by the Superintendent of Documents, U.S. Government Printing Office Washington, D.C. 20402

CONTENTS
PageAbstract_________________________________________ DlIntroduction._____________________________________________________ 2Mohawk River subarea________-______-___-_________----______-_-__ 5
Ground water_________________________________________________ 6Mohawk River flood plain._________________________________ 6Remainder of the subarea-__-__-------------_----_-__------ 7Water levels in wells_________-__________-___-______________ 12Quality of ground water_______________________-_________-__ 13
Surface water.________________________________________________ 17Mohawk River____________________________________________ 17Small streams..___________________________________________ 28
Public water-supply systems.___________________________________ 32Upper Hudson River subarea._______-_________-_____----____--_____ 35
^Ground water_________________________________________________ 35Surface water.______________________________________________ 36
Hudson River___________________________________________ 36Hoosic River____________________________________________ 40Small streams__________________________________________ 43
Public water-supply systems._______-_____________--___-_---____ 44Lower Hudson River subarea.______________________________________ 44
Ground water.________________________________________________ 45Hudson River flood plain______________________-___________- 45Remainder of the subarea._________________________________ 45Quality of ground water.._______________________________ 48
Surface water.________________________________________________ 48Hudson River___________________________________________ 48Poesten Kill...______________________________ 50Small streams-_-----_-___-__-__-_____-_____---_-_-_----___ 53
Public water-supply systems.___________________________________ 55Present use of water.______________________________________________ 58Possibility of further development.___________________--_---__----___ 60
Mohawk River valley____________________-________--______-____ 61Hudson River valley___________________________________-__-___- 61Hoosic River basin.___________________________________________ 62Buried-channel and other coarse-grained deposits_____---_-_-----__ 62Small streams.________________________________________________ 62Public water-supply systems._-----_______-________-----_----__- 63
Selected references_______________________________________________ 63iii

IV CONTENTS
ILLUSTRATIONS[Plates are in pocket]
PLATE 1. Areal geologic map of the surficial deposits and buried channels showing measuring and sampling sites of Albany-Schenectady- Troy area, New York.
2. Chart showing available streamflow data.Page
FIGURE 1. Map of Hudson River basin showing location of report area_ _ D32. Boundaries of subareas________________________________ 43. Longitudinal section in the Mohawk River valley between
Hoffmans and Schenectady and transverse section at Scotia__ ___________________________________________ 7
4. Water level in well near Mohawk River and stages of MohawkRiver at Schenectady, 1951__________________________ 8
5. Generalized bedrock geologic map________________ _____ 106. Graph showing weekly fluctuation of ground-water level,
1951-52.._______________________________ 147. Hardness and concentration of dissolved solids in ground
water.______________________________________________ 158. Graphs showing temperature fluctuations of water in wells,
Mohawk River water, and air, January 1948 to April 1949__ 199. Duration curve of daily flow, Mohawk River____________ 20
10. Low-flow frequency curves, Mohawk River._______________ 2111. Flood-stage frequency curve, Mohawk River at Cohoes_____ 2212. Water-surface profiles during selected floods, Mohawk River
from lock 8 to mouth________-___._____________-----_- 2313. Cumulative-frequency curve of hardness, dissolved solids,
and specific conductance, Mohawk River at Vischer Ferry Dam__________________________________ 26
14. Specific conductance and dissolved solids, Mohawk River atVischer Ferry Dam, January to December 1952_________ 27
15. Cumulative frequency curve of average water temperatures,Mohawk River_____________________________________ 28
16. Temperature of Mohawk River water at Vischer Ferry Dam and Hudson River water at Mechanicville and Green Island, 1952 and 1953__________________________ 31
17. Source of and demand on major public water supplies, 1953__ 3318. Duration curve of daily flow, Hudson River.______________ 3719. Low-flow frequency curves, Hudson River at Mechanicville__ 3820. Stages of annual floods, Hudson River at Green Island, water
years 1931-55____________^_______________________ 3921. Flood-stage frequency graph, Hudson River at Mechanic-
vine. ___________________________________________ 4022. Water-surface profiles during selected floods, Hudson River
from lock 4 to Castleton-on-Hudson____________________ 4123. Duration curve of daily flow, Hoosic River near Eagle Bridge. 4224. Low-flow frequency curves, Hoosic River near Eagle Bridge._ 4325. Section showing unconsolidated deposits along the Hudson
River between Troy and Castleton-on-Hudson___________ 46

CONTENTS V
Page26. Magnitude and number of floods, by months, Hudson River
at Green Island______________________________________ D4927. Flood-stage frequency curve, Hudson River at Green Island;
based on records for water years 1931-55________________ 4928. Duration curve of daily flow, Poesten Kill near Troy______ 5129. Low-flow frequency curves, Poesten Kill near Troy_________ 5230. Water used during 1953____---__-___________________ 58
TABLES
TABLE 1. Yields, composition, and relative importance of water-bearing Page formations in the Albany-Schenectady-Troy area.________ Dll
2. Water levels reported from wells in geologic formations in theAlbany-Schenectady-Troy area, 1945-49_______________ 13
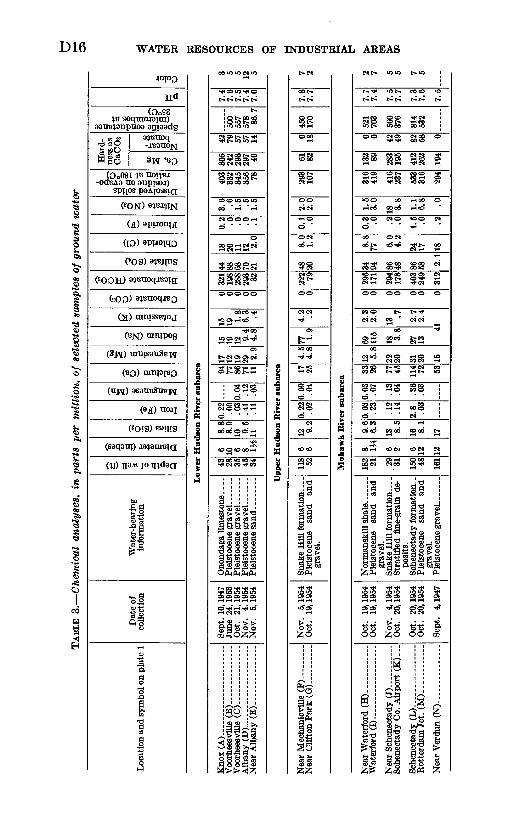
3. Chemical analyses of selected samples of ground water._____ 164. Summary of streamflow data___________________________ 185. Chemical analyses of selected samples of surface water._____ 246. Duration of low flow of selected small streams _____________ 297. Magnitude and frequency of annual low flow of selected small
streams _____________________________________________ 308. Major public water-supply systems.______________________ 349. Chemical analyses of finished water from public water-supply
systems.____________________________________________ 5710. Average use of water in the Albany-Schenectady-Troy area
in 1953__________________________________________ 5911. Use of water by selected industries, 1953__________________ 60


WATER RESOURCES OF INDUSTRIAL AREAS
WATER RESOURCES OF THE ALBANY-SGHENEGTADY- TROY AREA, NEW YORK
By H. N. HALBERG, O. P. HUNT, and F. H. PAUSZEK
ABSTRACT
The two major streams in the Albany-Schenectady-Troy area, the Hudson and Mohawk Rivers, assure an ample water supply for all foreseeable needs. The flows of the Hudson River above the Mohawk River, and those of the Mohawk River equal or exceed 1,300 and 580 mgd, respectively, 95 percent of the time. Ground water is available in moderate to large quantities from the uncon- solidated deposits in the river valleys and old river channels, and in small quan tities from the bedrock formations and fine-grained unconsolidated deposits. Small streams in the area are also important sources of water. The cities of Albany, Mechanicville, and Troy obtain their public water supplies from the headwaters of small tributaries of the Hudson River. These waters are un polluted, and treatment costs are small.
Floods in the Albany-Schenectady-Troy area are not a serious problem. The major rivers fluctuate through a small range in stage and generally only a nar row strip along the streams is subject to flooding.
Use of water in the area is relatively great. The average withdrawal of water was about 829 mgd in 1953. Industry used about 765 mgd and most of the remainder, about 64 mgd, was used for domestic purposes. Of the 829 mgd withdrawn about 91 mgd was for public supplies, and about 738 mgd was self- supplied for industry and rural uses.
The uses of water in this area are mostly nonconsumptive and they cause little depletion of the supply; however, practically all withdrawal uses add dis solved or suspended matter to the water and decrease its usefulness for some purposes. On the other hand, some uses of water outside the area affect the supply within the area. Thus the supply available to the Albany-Schenectady- Troy area is reduced by diversions from Schoharie Creek for the water supply of New York City, but it is increased by the diversion from the Black River basin for improvement of navigation in the Erie (Barge) Canal. Storage of water in Delta Reservoir for improvement of navigation, in Hinckley Reservoir for improvement of navigation and the public supply of Utica, and in Sacandaga and Indian Lake Reservoirs for power development and improvement of naviga tion, increases the low flow available for other uses.
Water-bearing sand and gravel in the river valleys are the principal sources of ground water, especially where they are recharged by infiltration from streams. The most productive area is between Hoffmans and Schenectady where much larger quantities than the present 25 mgd could be withdrawn. More develop-
Dl

D2 WATER .RESOURCES OF INDUSTRIAL AREAS
ment of ground water is possible in the flood plain of the Mohawk River between Vischer Ferry and Mohawk View and in the flood plain of the Hudson River between Troy and Castleton-on-Hudson.
Moderately large quantities of water, as much as 700 gpm or about 1 mgd, have been obtained from a single well in the ancient Colonie channel north of Shakers Village, and from the sand and gravel now buried beneath younger deposits. Smaller quantities of water, 100 gpm or less from a single well, can be obtained from some parts of the sand-plain areas and from other coarse grained deposits; the most productive of these are the Albany-Schenectady sand plain, the Wynants Kill kame area, and the Schodack terrace. Other buried channels contain materials that are too fine to yield more than a few tens of gallons per minute to single wells. Most wells tap till or bedrock and yield less than 20 gpm. The depth to water in most wells in the Albany-Schenectady- Troy area is between 5 and 60 feet below the land surface.
Small streams like Lisha, Anthony, and Poesten Kills, and others that have large drainage areas are good sources of water. Streams that drain coarse grained stratified deposits have the largest sustained yield per square mile; those that drain fine-grained stratified deposits have the smallest.
The mineral content indicates that surface water in the area is of good chemi cal quality, being soft to moderately hard, but softening may be required at some places for uses requiring low hardness. The water is of the calcium bicarbonate type. In general it contains less than 200 ppm of dissolved solids. Fragmentary information indicates that water from the Mohawk River is harder than that from the Hudson River.
Water from the sands and gravels is generally moderately hard to hard, being slightly harder and more mineralized than surface water. Water from the bed rock formations generally is even harder and more mineralized.
INTRODUCTION
The orderly and economical development of water resources to meet our increasing demands requires knowledge of the occurrence and use of water. Specifically, information is required about the sources of water, quantity available, chemical and physical quality, amount used, effect of use on the quantity and quality, and magnitude and frequency of floods. Such information is essential to the planning, construction, and operation of facilities that will provide water to satisfy increasing industrial and domestic demands, requirements of defense mobiliza tion, and demands for water at times of disaster.
This report summarizes those types of information, expressed in general terms, insofar as data are available. Water-resources infor mation has been collected in the Albany-Schenectady-Troy area since 1887; however, there are deficiencies of certain types of data, especially on the quality and use of the water. This report will aid in the early stages of planning by giving the sources of water, describing their quantity and quality, and by giving the range in water levels. The information in the report will probably be adequate, if used with eco nomic factors, to select a source of water; however, additional infor-

ALBANY-SCHENECTADY-TROY AREA, NEW YORK D3
ALBANY- SCHENECTADYTROY^ AREA
FIGDHB 1. Map of Hudson River basin showing location of report area.

D4 WATER RESOURCES OF INDUSTRIAL AREAS
mation and investigation may be required for the design of specific water-supply facilities.
The Albany-Schenectady-Troy area, most of which is highly in dustrialized, includes parts of Albany, Rensselaer, Saratoga, and Schenectady Counties (pi. 1 and fig. 1). The region described in this report encompasses 732 square miles of river valleys and adjacent hills and plateaus, and contains the cities of Albany, Cohoes, Mechanicville, Rensselaer, Schenectady, Troy, and Watervliet. Most of the region is a part of the Mohawk-Hudson lowland at altitudes between 10 and 400 feet above sea level. To the southwest the Helderberg cliffs and plateau rise 1,000 feet or more above the lowland. The lowland is bounded on the north by the Adirondack Mountains and on the east by Rensselaer plateau, both of which are outside the report area.
ri^iojLic^lwvEfiLA r~~~s~ \:-^ rri /
FIGURE 2. Boundaries of subareas.

ALBANY-SCHBNECTADY-TROY AREA, NEW YORK D5
The availability and quantity of water varies widely throughout the Albany-Schenectady-Troy area. To increase the utility of the re port and to simply the description of the water supply, the area has been divided into subareas: the Mohawk Eiver, upper Hudson River, and lower Hudson River (fig. 2).
This report is one of a series describing the water resources of industrial areas of national importance. It was prepared by H. N. Halberg, hydraulic engineer, under the direct supervision of J. E. Upson, district geologist; O. P. Hunt, hydraulic engineer, under the direct supervision of A. W. Harrington, district engineer; and F. H. Pauszek, district chemist. L. A. Wiard, hydraulic engineer, did most of the early work on that part of the report relating to surface water. K. A. MacKichan, hydraulic engineer, assisted by J. C. Kammerer, geologist, was responsible for staff coordination.
Most of the basic data used in this report were collected by the U.S. Geological Survey as part of the programs in cooperation with the New York State Departments of Commerce, Conservation, Health and Public Works, the New York Water Power and Control Com mission, and the U.S. Army, Corps of Engineers. Additional infor mation was obtained from industries, public officials, and individuals. Much of the ground-water data used in the preparation of this report has been published by the New York Water Power and Control Com mission in a series of cooperative Federal-State reports on Albany, Rensselaer, and Schenectady Counties (Arnow, 1949; Cushman, 1950; Simpson, 1952, respectively).
MOHAWK RIVER SUB ARE A
The Mohawk River flows through the central part of the Albany- Schenectady-Troy area and empties into the Hudson River through several channels near Cohoes (pi. 1). The flood plain of the Mohawk River is narrow from Hoffmans to Schenectady, where it widens to about 2 miles. About 4 miles downstream from Schenectady the river enters -a narrow rock channel in which it flows to Niskayuna. Down stream from Niskayuna the flood plain widens until the river enters the rocky channel through which it flows into the Hudson River.
Below Schenectady the Mohawk River flood plain is bordered by a lowland of sand plains, clay plains, and till-eovered gently rolling country. (See pi. 1.) The sand-plain area lies southeast of Sche nectady, and an arm of it crosses the Mohawk River near Dunsbach Ferry. Upstream from Schenectady the topography of the area bor dering the flood plain is rougher than downstream. Industrial estab lishments are concentrated in the wider parts of the flood plain. The

D6 WATER RESOURCES OF INDUSTRIAL AREAS
largest concentration of industry and population in the subarea is at Schenectady.
The Mohawk River is the channel of the Erie (Barge) Canal through most of the area. The river and extensive sand and gravel de posits under and along its channel are important sources of water.
GROUND WATER
MOHAWK RIVER FLOOD PLAIN
The 8-mile reach of the Mohawk River flood plain between Hoff- mans and Schenectady, which is underlain by the river's preglacial channel (pi. 1; Simpson, 1952) is a present and potential source of large quantities of ground water; however, the most productive water* bearing beds probably lie between lock 8 in the Erie (Barge) Canal and Schenectady. Near lock 8 gravel beds more than 100 feet thick lie at and below river level (fig. 3). Between Schenectady and lock 8 the yields of 9 of the 10 Schenectady public-supply wells were about 3,600 gpm (gallons per minute) each, when tested in 1942 and 1943. These wells receive water that infiltrates from the river. One of the two public-supply wells of the village of Scotia has been pumped at the rate of 1,500 gpm, the other at 1,100 gpm. These two wells are in the Mohawk River flood plain about 1 mile north of the river but probably are not greatly affected by the river. (See Simpson, 1952, p. 1,36,59-65,95.)
Between locks 8 and 9 yields of wells are moderate to high. The public-supply well of the village of Rotterdam Junction has been pumped at 310 gpm and 2 privately owned wells yielded 777 and 226 gpm. Between lock 9 and Hoffmans most of the gravel beds lie above river level and rest on thick beds of clay and sand which may extend from river level to considerable depth. Interfingered with these fine materials are beds of gravel which may not be connected hydraulically with the river.
According to Simpson (1952, p. 44) the yields of 27 wells (exclusive of the Schenectady public-supply wells) tapping stratified sand or gravel in the Mohawk River flood plain between Hoffmans and Sche nectady ranged from 2 to 1,500 gpm and averaged 280 gpm.
The average withdrawal of ground water in the Hoffmans-Sche- nectady area was about 25 mgd (million gallons per day) in 1953 of which about 23 mgd was withdrawn in the vicinity of Schenectady. This 8-mile reach has produced large volumes of ground water con tinuously for more than 50 years with no sign of depletion of the supply. The sustained high production from wells in this area is probably due largely to induced infiltration from the Mohawk River.
The water levels in most wells tapping sand and gravel deposits

ALBANYHSCHENECTADY-^TROY AREA, NEW YORK D7
FIGURE 3. Longitudinal section in the Mohawk River valley between Hoffmans and Schenectady and transverse section at Scotia. Location of section shown on plate 1.
underlying the alluvium in the Mohawk River flood plain near Sche nectady are between 10 and 40 feet below land surface. The pattern of water-level fluctuations reflects changes in rates of pumping of nearby wells and changes in stage of the Mohawk River. Fluctu ations of water level in a well at Schenectady illustrate the latter type of change. (See fig. 4.)
The alluvium in the Mohawk River flood plain is largely clay, silt, and sand. Because these deposits are not very thick and are relatively fine grained, they are not likely to yield large quantities of water.
REMAINDER OF THE SUBAREA
.The Colonie and Alplaus buried channels, that part of the Mohawk buried channel south of the flood plain of the present Mohawk River, sand plains, till, and bedrock are also sources of ground water (pi. 1;

JANUARY FEBRUARY MARCH APRIL MAY JUNE JULY AUGUST SEPTEMBER OCTOBER NOVEMBER DECEMBER
FIGURE 4. Water level In well near Mohawk Elver and stages of Mohawk Elver at Schenectady, 1951.
STAGE, IN FEET ABOVE MEAN SEA LEVEL
J £ § 8 §\-
C_
X
<(c
<.
<f
(
C
Ii.
^
<
£.
f
1
*
<
<
<
<4
<<
<
- _____
r^ r
^ =^"*-*
r
>
>
^^; j
^>p>
>
i
>
f- j>\>
s
=^
-. =»
0̂0
o^
flohawk River at of (downstream
Schenectady, low from) lock 8
%
I
WATER LEVEL, IN FEET BELOW LAND-SURFACE DATUM
Ifs°°OS
I?3J51's
§1(B <»
Ss
svaav iviHiLsncLMi io saoanosaa aajLVM g(j

ALBANY-SCHENECTADY-TROY AREA, NEW YORK D9
Simpson, 1949). The Oolonie channel is a buried preglacial river valley whose northward extension is believed by Stoller (1911, p. 12) to have included a rock depression now occupied in part by Bound Lake and Saratoga Lake (both lakes are north of the area of this report). Colonie channel extends southward from the vicinity of Bound Lake, crosses the present Mohawk Biver near Verdun, and joins the preglacial Mohawk channel west of Albany. The most productive water-bearing beds in the buried valley are deposits of sand and gravel in the northern part of that section of the channel between the Mohawk Biver and the village of Colonie. The sand and gravel deposits under lie clay and silt and are coarser grained north of the village of Shakers than south of it. The deposits have accumulated in the channel to a maximum known depth of 305 feet; of this about 75 feet is sand and gravel.
The Latham Water District operates 8 wells near the axis of the Colonie channel. The wells are screened in gravel and are 48 to 244 feet deep. The yields of individual wells range from 118 to 705 gpm and the total yield is as much as 2,100 gpm (3 mgd). Becently the water district began to use surface water from Stony Creek north of the Mohawk Biver because water levels in the vicinity of the wells had declined appreciably.
The buried preglacial channel of the Mohawk Biver follows the flood plain of the present Mohawk Biver from Hoffmans to Schenec- tady; the yields of wells in this reach of the channel have been dis cussed above. At Schenectady the channel turns southward then southeastward, passes west of Albany, and joins the present Hudson Biver channel about 12 miles south of Albany. (See pi. 1; Simpson 1949,1952). Well yields in the southward-trending part of the chan nel within the Mohawk Biver subarea are described below under the Albany-Schenectady sand plain.
The Alplaus channel is a small short buried channel that enters the buried Mohawk channel from the north a few miles south of Schenectady. (See pi. 1.) Mixed stratified deposits of fine gravel and sand interfingered with fine-grained deposits are the principal water-bearing materials in the buried Alplaus channel north of Scotia; they yield small to moderate supplies of water.
The Albany-Schenectady sand plain extends from southern Sche nectady southeastward toward Albany (pi. 1) and covers part of the buried Mohawk, Alplaus, and Colonie channels. An arm of the sand plain extends northward across the Mohawk Biver along the Clifton Park-Half moon town line almost to the northern boundary of the Al- bany-Schenectady-Troy area.

D10 WATER RESOURCES OF INDUSTRIAL AREAS
The sand ranges in thickness from 10 to 100 feet and overlies beds of silt, clay, and till. The sands are not highly permeable, yielding only enough water for household supplies; in some places, however, the sand is thick enough to yield sufficient water for small industrial supplies. The yield of a well in shallow sand may be greatly reduced when the ground-water level is low and will not be increased by deepen ing the well if it already extends to, or close to, the bottom of the water-bearing sand.
An industrial well screened from 22 to 28 feet in the sand plain at Schenectady is reported to have yielded 150 gpm when it was installed in 1938 and later to have been pumped continuously at 45 gpm.
Water occurs also in the bedrock formations in the subarea, which include the Schenectady and Snake Hill formations and the Normans- kill shales. (See fig. 5.) The yields in these and other bedrock for mations in the Albany-Schenectady-Troy area vary widely, but the median yields of wells in all formations seem to be about the same, from 2 to 4 gpm, based on reported yields of a/bout 240 wells (table 1). Small quantities of water sufficient for the needs of farms or house holds may be obtained from most wells. In Schenectady County the yields of wells in the Schenectady formation are greatest where the
EXPLANATION
42°50/ /
FIGURE 5. Generalized bedrock geologic map.

TABL
E 1
. Y
ield
s, c
ompo
sitio
n, a
nd r
elat
ive
impo
rtan
ce o
f w
ater
-bea
ring
for
mat
ions
in
the
Alb
any-
Sche
nect
ady-
Tro
y ar
ea
A
Peri
od
Qua
tern
ary ..
.
Do
Do
Dev
onia
nan
dSi
luri
an.
Ord
ovic
ian .
...
Do
Do -
Cam
bria
n _ --
ge
Epo
ch
Rec
ent..
....
..
Plei
stoc
ene .
...
- .do.
Mid
dle
and
Ear
ly D
ev
onia
n an
dL
ate
Silu
rian
.M
iddl
e O
rdov
icia
n.
..
do
-.d
o .
....
Ear
ly C
am
bria
n.
Nam
e of
geo
logi
cfo
rmat
ion
or u
nit
All
uviu
m.-
. -
.
Stra
tifie
d sa
ndan
d gr
avel
(flu
viog
laci
alan
d la
cust
rine
depo
sits
) .
Till. .
(17
form
atio
ns).
.
Sche
nect
ady
form
atio
n.
Snak
e H
ill
form
atio
n.
Nor
man
skill
shal
e.
Scho
dack
and
Nas
sau
for
mat
ions
.
Num
ber
ofw
ells
for
whi
chda
ta o
nde
pth
and
yiel
d w
ere
obta
ined
3
115 9 16 73 37 49 66
Ran
gein
dept
hof
wel
ls(f
eet)
eo
on
oz-w
6-10
3
18-2
00
10-2
22
29-5
50
29-6
39
38-3
50
50-3
40
Ran
ge o
fyi
eld
ofm
iddl
e80
per
cent
of w
ells
repo
rted
»(g
pm)
4-1,
250
1-5
3-20
0-12
0-20
1-10
1-10
Med
ian
yiel
d(g
pm) 100 40 3 4 2 4 4 4
Max
imum
yiel
d re
po
rted
(gpm
) 350
3,60
0 7 30
« 15
0
100 30 30
Dep
th o
fm
axim
umyi
eldi
ngw
ell
(fee
t)
ff> O£i <»fi
OO 50 135
f 17
5 \
210
208
250 69
Cha
ract
er o
f mat
eria
l and
im
port
ance
as
a w
ater
be
arin
g fo
rmat
ion
Sort
ed d
epos
its m
ainl
y of
cla
y an
d si
lt an
d m
ore
rare
lyof
san
d an
d gr
avel
, fo
rmin
g pa
rt o
f th
e flo
od p
lain
sof
the
lar
ger
stre
ams.
Im
port
ant
aqui
fer
whe
n oc
cu
rrin
g as
sa
nd
or
grav
el
rech
arge
d th
roug
h an
adja
cent
str
eam
bed.
Sort
ed s
and,
gra
vel,
and
silt
depo
site
d in
for
mer
gla
cial
lake
s an
d st
ream
s.
Sand
an
d gr
avel
, co
mm
only
rest
rict
ed t
o m
ain
stre
am v
alle
ys a
nd l
owla
nd,
ism
ost
prod
ucti
ve a
quif
er i
n re
port
are
a, e
spec
ially
whe
re r
echa
rged
by
over
lyin
g or
nea
rby
stre
am,
orif
in
buri
ed
stre
am
chan
nel.
Fine
san
d an
d si
ltyi
eld
smal
l su
pplie
s fo
r do
mes
tic u
se t
o du
g w
ells
of la
rge
diam
eter
.U
nsor
ted
mix
ture
of
boul
ders
, gr
avel
, sa
nd,
and
clay
depo
site
d by
gla
cial
ice
. Po
or a
quif
er b
ut o
f w
ide
spre
ad
area
l ex
tent
, es
peci
ally
in
up
land
ar
eas.
Supp
lies
wat
er to
som
e do
mes
tic a
nd f
arm
wel
ls.
Lim
esto
nes,
sh
ales
, an
d sa
ndst
ones
in
H
elde
rber
gM
ount
ains
and
pla
teau
in
Alb
any
Cou
nty.
G
en
eral
ly u
nim
port
ant
as a
n aq
uife
r ex
cept
for
dom
estic
supp
lies.
Cla
yey
shal
e in
terb
edde
d w
ith
coar
se-g
rain
ed
sand
st
one
in n
orth
wes
tern
and
wes
t-ce
ntra
l par
t of
repo
rt
area
. V
ery
poor
aqu
ifer
exc
ept
whe
re o
verl
ain
bype
rmea
ble
sand
and
gra
vel.
Fold
ed s
hale
wit
h lo
cal
laye
rs o
f lim
esto
ne a
nd s
and
ston
e,
in c
entr
al a
nd n
orth
-cen
tral
par
t of
rep
ort
area
. Po
or a
quif
er in
mos
t pla
ces
exce
pt fo
r dom
estic
supp
lies.
Fold
ed c
laye
y sh
ale
cont
aini
ng b
eds
of c
hert
and
san
dst
one,
in
east
ern
part
s of
rep
ort
area
. P
oor
aqui
fer
in m
ost
plac
es e
xcep
t for
dom
estic
sup
plie
s.Fo
lded
sh
ales
in
ea
ster
nmos
t pa
rts
of r
epor
t ar
ea;
incl
udes
so
me
beds
of
qu
artz
ite,
sa
ndst
one,
an
dlim
esto
ne.
Poo
r aq
uife
r in
mos
t pl
aces
exc
ept
for
dom
estic
sup
plie
s.
a
' Mid
dle
80 p
erce
nt r
efer
s to
wel
ls r
emai
ning
aft
er o
mit
ting
wel
ls h
avin
g hi
ghes
t 10
per
cent
and
low
est
10 p
erce
nt o
f yi
elds
rep
orte
d.
In g
ener
al, 8
of
ever
y 10
wel
ls d
rille
d w
ill h
ave
yiel
ds w
ithi
n th
e ra
nge
indi
cate
d fo
r the
mid
dle
80 p
erce
nt, e
xcep
t in
are
as w
here
test
dri
lling
has
sho
wn
espe
cial
ly f
avor
able
or u
nfav
orab
le g
roun
d-w
ater
con
ditio
ns.
2 Tw
o w
ells
hav
e th
e sa
me
yiel
d, w
hich
is th
e m
axim
um r
epor
ted
for t
he S
chen
ecta
dy f
orm
atio
n.

D12 WATER RESOURCES OF INDUSTRIAL AREAS
formation is covered by an appreciable thickness of sand or gravel which releases water readily to the underlying rock (Simpson, 1952, p. 25). The yields of 10 wells, which tap the Schenectady formation where the overburden is sand and gravel, ranged from 3 to 150 gpm and averaged 51 gpm; the median yield was 15 gpm. The yields of 29 wells, where the overburden is till c.nd clay, ranged from 1 to 6 gpm and averaged 2.4 gpm (median 2 gpm). Where the overburden is thin or absent (less than 10 ft. thick), the yields of 9 wells ranged from 2 to 20 gpm and averaged 7.7 gpm (median 6 gpm). The yield that may be expected from wells that tap bedrock in Schenectady County is shown by a study of the reported yields of 65 wells, 60 of which tap the Schenectady formation. The following tabulation (after Simp- son, 1952, p. 43) shows the percentages of the wells in five yield groups.
Yield(gpm) Percentage of wells
Less than 1_______________________ _ 91 to 5________________________________________ 465 to 10_____________________________________-_ 2810 to 50_____________________________________ 11More than 50____________________________ 11
Till, an unsorted mixture of clay, sand, and boulders, forms a sur- ficial blanket, generally not more than 30 feet thick; it is present nearly everywhere in the uplands. In the lowlands and valleys till occurs beneath the stratified deposits. Till is important as a source of small quantities of water sufficient for homes and small farms. Probably the maximum yield that can be obtained from unsorted clay or silt de posits in the till is about 200 gpd (gallons per day), according to Simp- son (1952, p. 31). However, in some places the till contains discon tinuous lenses of sand or other sorted material which yield larger quantities of water. Most of the wells in till are dug wells 10 to 20 feet deep and 2 to 4 feet in diameter.
WATER LEVELS IX WELLS
The depth to water in most wells in the Mohawk Eiver subarea, as in other parts of the Albany-Schenectady-Troy area, is between 5 and 60 feet below the land surface (table 2). The median water -level is 8 feet below land surface for wells that tap till, 14 feet for wells in other Pleistocene and Recent deposits, and 16 to 20 feet for wells in bed rock formations. In general, the water table is closer to the land surface in lowland areas than on or near the tops of the hills and uplands, but local geologic and hydrologic conditions may cause some variation from the general rule. Of the 280 wells inventoried from 1945-49 in the subarea, 7 were reported flowing.
ALBANY-SCHENECTADY-TROY AREA, NEW YORK D13
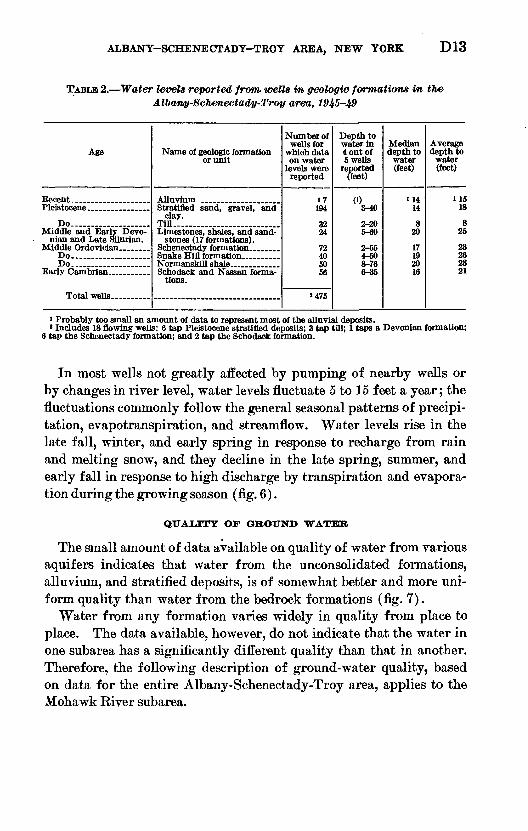
TABLE 2. Water levels reported from' wells in. geologic -formations in the A.lbany-8chenectady-Troy area, 1945-49
Age
Recent ___________Pleistocene ________
Do- __ .. _.._-.. Middle and Early Devo
nian and Late Silurian. Middle Ordovician ........
Do... ........ .......Do... __ ....... __ .
Total wells ......
Name of geologic formation or unit
Alluvium __________Stratified sand, gravel, and
clay. Till. ... __ ... _ .........Limestones, shales, and sand
stones (17 formations).
Snake Hill formation ..........Normansktll phale
tions.
Number of wells for
which data on water
levels were reported
17194
3224
72405056
» 475
Depth to water in 4 out of 5 wells
reported fleet)
(03-40
2-205-60
2-554-508-766-35
Median depth to
water (feet)
U414
820
17192016
Average depth to
water (feet)
»1518
825
23262821
1 Probably too small an amount of data to represent most of the alluvial deposits.2 Includes 18 flowing wells: 6 tap Pleistocene stratified deposits; 3 tap till; 1 taps a Devonian formation;
6 tap the Schenectady formation; and 2 tap the Schodack formation.
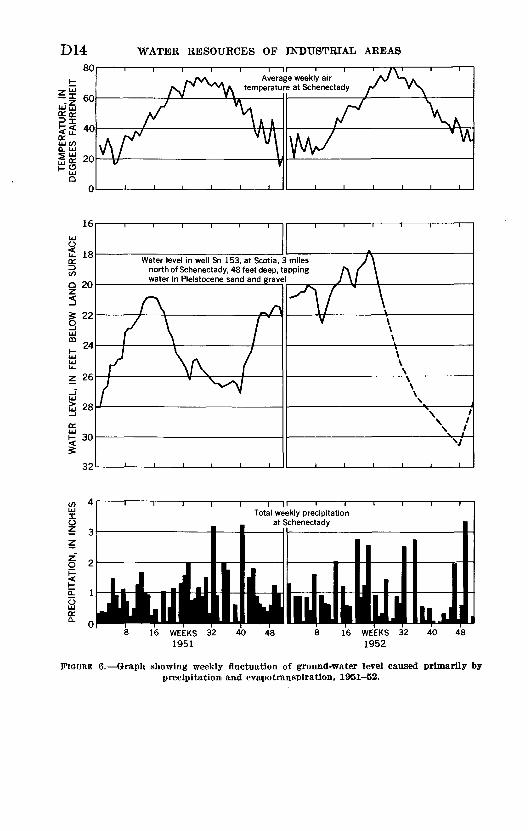
In most wells not greatly affected by pumping of nearby wells or by changes in river level, water levels fluctuate 5 to 15 feet a year; the fluctuations commonly follow the general seasonal patterns of precipi tation, evapotranspiration, and streamflow. Water levels rise in the late fall, winter, and early spring in response to recharge from rain and melting snow, and they decline in the late spring, summer, and early fall in response to high discharge by transpiration and evapora tion during the growing season (fig. 6).
QUALITY OP GROUND WATER
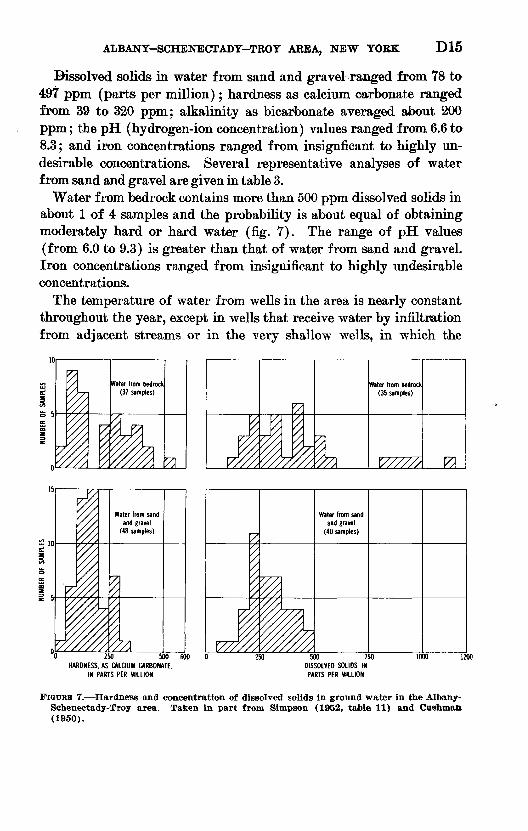
The small amount of data available on quality of water from various aquifers indicates that water from the unconsolidated formations, alluvium, and stratified deposits, is of somewhat better and more uni form quality than water from the bedrock formations (fig. 7).
Water from any formation varies widely in quality from place to place. The data available, however, do not indicate that the water in one subarea has a significantly different quality than that in another. Therefore, the following description of ground-water quality, based on data for the entire Albany-Schenectady-Troy area, applies to the Mohawk River subarea.
D14 WATER RESOURCES OF INDUSTRIAL AREAS
Average weekly air temperature at Schenectady
Water level in well Sn 153, at Scotia, 3 miles north of Schenectady, 48 feet deep, tapping water in Pleistocene sand and gravel
O ? 3
i II i i Total weekly precipitation
at Schenectady
8 16 WEEKS 32 40 48 1951
8 16 WEEKS 32 40 48 1952
FIGURE 6. Graph showing weekly fluctuation of ground-water level caused primarily by precipitation and evapotranspiration, 1&51-52.
ALBANY-SCHENECTADY-TROY AREA, NEW YORK D15
Bissolved solids in water from sand and gravel-ranged from 78 to 497 ppm (parts per million); hardness as calcium carbonate ranged from 39 to 320 ppm; alkalinity as bicarbonate averaged about 200 ppm; the pH (hydrogen-ion concentration) values ranged from 6.6 to 8.3; and iron concentrations ranged from insignficant to highly un desirable concentrations. Several representative analyses of water from sand and gravel are given in table 3.
Water from bedrock contains more than 500 ppm dissolved solids in about 1 of 4 samples and the probability is about equal of obtaining moderately hard or hard water (fig. 7). The range of pH values (from 6.0 to 9.3) is greater than that of water from sand and gravel. Iron concentrations ranged from insignificant to highly undesirable concentrations.
The temperature of water from wells in the area is nearly constant throughout the year, except in wells that receive water by infiltration from adjacent streams or in the very shallow wells, in which the
Water from bedrock (37 samples)
Water from sand and grave!
(48 samples)
250 500 600 HARDNESS. AS CALCIUM CARBONATE.
IN PARTS PER MILLION
250
Water from sand and gravel
(40 samples)
500 750 DISSOLVED SOLIDS. IN
PARTS PER MILLION
1200
FIGURE 7. Hardness and concentration of dissolved solids in ground water in the Albany- Schenectady-Troy area. Taken in part from Simpson (1952, table 11) and Cushman (1950).
Near Waterford (H) _ ......... Waterford (I).. ____ --- .-.- Near Schenectady (J)_. _ ..... Schenectady Co. Airport (K).._ Schenectady (L). _ ___ ..... Rotterdam Jet. (M). ........... Near Verdun (N). ____ . ....
g> oo 03 oo g. ?-r r° r?-^ pp p,jft ,co,co
ift CnCn CnCn Cn Cn
Normanskill shale. . __ Pleistocene sand and
gravel.
Snake Hill formation-.-. Stratifled fine-grain de
posits.
Schenectady formation. . Pleistocene sand and
gravel. Pleistocene gravel. . __
3s ^SS coto to oo
3 toos toos t-oo
*I OOOS 00 CO OS CO
^ Cn COOSto o
8* KK SSo
pco oi-> oo coos if^co -Jo5
S^j > ift ^i to co tOlft Cn~4 OSCO
OOH- * bO > H* OS CO-4 COQO >-«0
to to ,co to tolft-«I -4 O CO
g || §| 5| cnOO iftQO COCO tO SOOS OOOS Iftlft
l-» (-* tO *^oo -»i ift ift ps -»i oo
too oot- O
tO OCn OtO OCO
osj-1 eooo eoh->O OOt- oo OCn
to COCn tO4t iftCO
S Sto SS coto
o Sto coto ooi Cnoo COcn -4Cn i WH-> -4O> pto i tO>ft OSO COl->
^j -j») -4-J -4~1
Cn OSCO -»I en ift -4
! Cn-J cncn -4 to
Mohawk River subarea
Near Mechanicville (F)... ...... Near Clifton Park (G). ......
P
Snake Hill formation- ... Pleistocene sand and
gravel.
Cn h-t tooo
OS OS
coto to
o
o
85
OOCn
CO
to to
oo
-4 tocotogfeh->00
tooO
ot
to tooo
1182
ooo
§1-JOO
tO -4
Upper Hudson River subarea
Knox (A) .. ___ . __ ... VoorheesvUle (B)..... ..........
Voorheesvule (C) _______ .. Albany (D) .............. . Near Albany (E) ...............
< < ^ 5 «*tOtOh-*
SSI15
Onondaga limestone. Pleistocene gravel. __ .. Pleistocene gravel ....... Pleistocene gravel ....... Pleistocene sand -. __
SSSSSSI-'OOOSOOS
h->COOOOO3
Cn COOOo
CSSgg PI 1Ol->o' i
S283S
CO
ift CD to CO Cn oo ift
. OS j CO Cn
OOOOO
SSSSfcH* H-* tO >
to.tOH-Sooo
oh-OOOlO
h- h- CO
Cn cncn OS os
-4 Cn ift cop OOOSCn to CO
s§lH§H-* cncn -4 ift ift~)-<lcolO
Cn Cn Cn i 00-4CnQi
O ift Cn os ift
Cn to cncn CO
Lower Hudson River subarea
Location and symbol on plate 1
§ **
Water-bearing information
Depth of well (ft)
Diameter (inches)
Silica (SiO2)
Iron (Fe)
Manganese (Ma)
Calcium (Ca)
Magnesium (Mg)
Sodium (Na)
Potassium (K)
Carbonate (CO«)
Bicarbonate (HCOs)
Sulfate (SO4)
Chloride (Cl)
Fluoride (F)
Nitrate (NOs)
Dissolved solids (residue on evapo ration at 180°C)
Ca, MgNoncar-
bonate<?§?
Specific conductance (micromhos at 25°C)
pH
Color
E00
i
Co
8 i'
J
1.
oCo
1
ICo
e
!
1
svaav,10 saoanosaa9TQ

ALBANY-SCHENECTADY-TROY AREA, NEW YORK D17
water temperature is affected by air temperature. Water from most wells that tap bedrock ranges in temperature from 49° to 53°F. Water from unconsolidated deposits at depths of a few tens of feet has a slightly wider range in temperature. In some places infiltration of stream water affects the temperature of water from wells in sand and gravel. For example, the temperature of water from some of the Schenectady public-supply wells fluctuates between 40° and 65°F. The extreme temperatures lag 1 or 2 months behind the corresponding extremes in temperature of the Mohawk River (fig. 8).
SURFACE WATER
MOHAWK RIVER
The flow of the Mohawk River in the Albany-Schenectady-Troy area is affected by several reservoirs and one diversion which exports water from the basin. Except for spillage during periods of high flow, the entire flow of Schoharie Creek above Schoharie Reservoir is diverted into Ashokan Reservoir for New York City's water supply. Delta Reservoir on the main river and Hinckley Reservoir on West Canada Creek are maintained primarily for navigation in connection with operation of the Erie (Barge) Canal (fig. 1). Some water is diverted into Delta Reservoir from the Black River basin through Black River Canal (flowing south) and Lansing Kill.
The flow of Mohawk River has been measured at Cohoes since 1925 (table 4 and pi. 2). Streamflow records were collected at Crescent Dam from 1917 to 1925 but are not comparable with the records at Cohoes because water was not diverted from Schoharie Creek during that time. The pattern of regulation by Delta and Hinckley Reser voirs and the diversion into and from the basin have remained prac tically unchanged during the time records have been collected at Cohoes; therefore, the records at this station were collected under present conditions of diversion and storage. In addition to the diver sion from the basin at Schoharie Reservoir, water is diverted around the Cohoes gage during the navigation season in the Erie (Barge) Canal.
The flow of Mohawk River, like the flow of all streams in the Albany-Schenectady-Troy area, is likely to be high or moderate in the late winter or spring and low in the summer and fall. However, the

o H-» 00
TABL
E 4
. Su
mm
ary
of s
trea
mfi
ow d
ata
In
dex
no.
<pl.
1)
1 32
34
37
Loc
atio
n of
gag
ing
stat
ion
Hoo
sic
Elv
er n
ear
Eag
le B
ridg
e.
Hud
son
Kiv
er a
t M
echa
nicv
ille.
Moh
awk
Riv
er a
t C
ohoe
s.
Hud
son
Eiv
er a
t G
reen
Isl
and.
Fo
este
n K
ill n
ear
Tro
y.
Dra
in
age
area
(s
q m
i) 510
4,50
0
3,45
6
8,09
0 89
Ele
vatio
n of
gag
e (f
eet a
bove
m
ean
sea
leve
l)
355.
41
49.1
3
-.31
s 32
1. 4
6
Per
iod
of re
cord
Aug
ust
1910
to
Mar
ch 1
922.
Ju
ly 1
923
to d
ate.
O
ctob
er 1
887-
Se
ptem
ber
1931
. O
ctob
er 1
931-
Se
ptem
ber
1956
. > Ju
ly 1
925
to d
ate.
.
Feb
ruar
y 19
46 to
da
te.
July
192
3 to
dat
e..
Ave
rage
flo
w
Qua
n
tity
(m
gd)
596
4,80
3
3,70
7 3,
770
9,40
0 90.5
Num
be
r of
year
s 41
66 28
28 7 30
Max
imum
flo
w
Qua
n
tity
(c
fs)
55,4
00
120,
000
118,
000
130,
000
181,
000
11,9
00
Gag
e he
ight
(f
eet)
21.1
5
22.5
7
27.0
5
12.1
Dat
e
Dec
. 31
,194
8
Mar
. 28
, 191
3
Jan.
1,
1949
Mar
. 19
, 193
6
Dec
. 31
,194
8
Sept
. 22
, 193
8
Min
imum
dai
ly f
low
Qua
n
tity
(m
gd)
19 39.7
15
84
821 1.
2
Dat
e
Sept
. 14
,191
3
Feb
. 1,
1931
.
Aug
. 24
, 19
41.
Jan.
17,
193
1.
Sept
. 5,
194
9.
Oct
. 12-
14,
1930
.
Rem
arks
Reg
ulat
ed b
y In
dian
L
ake
Res
ervo
ir a
nd
sinc
e 19
30 b
y Sa
can-
da
ga R
eser
voir
. B
elow
div
ersi
on.
Abo
ve d
iver
sion
.
Div
ersi
on fr
om Q
uake
n K
ill,
an u
pstr
eam
tr
ibut
ary.
Rec
ord
colle
cted
und
er p
rese
nt s
tora
ge c
ondi
tions
. C
ity
of T
roy
datu
m.
fel

TEMPERATURE, IN DEGREES FAHRENHEIT
6ia'vasv

D20 WATER RESOURCES OF INDUSTRIAL AREAS
1/
If/
/
/
/
/
/
j/
>
.
*'//
o
o
,1
I1
/t/
\
/
/t7^
//y
E
1
§a» s> IsKI3--o -^^
1£
*
1
1 o
I *Q.
UJ
/
o
i
o
1 1
>/
I
1 s
1 a
S
//
//
,^
/
//
//'
/
/~?
t 3 8 8 0-888*80, - AVQ H3d SNcmvs jo SNOITIIW NI 'SOHVHOSIQ
70,000 60,000 50,000 1 1 1 1 0
§ o~ p" m c\i
\
o
o "o'o ' ' ' o ' ' «," ' ' ' '
QN003S d3d 133J 01800 NI '30aVHOSia
18 S
^» « «! "M-a 610 2
"8 ao% oo
ds "3
ed
in fl
<w
-S fe *f S
-s s 1^ Q fr»
ft h-S x -S
S o ^O o~:h5 *gUJ 00s a
op AQ_ *
0 I*
£ £-" | 2fi !
ja, s1
o «
f
1 *fc g
S aco £
g- ?1
OS
s as D 0
fa

ALBANY-SCHENECTADY-TROY AREA, NEW YORK D21
lowest flow of the year may occur during the winter when ice affects the flow. The flow-duration curve, figure 9, shows the percentage of time that the flow equaled or exceeded different quantities. The low- flow frequency curves, figure 10, show the average recurrence interval
2500-
2000-
1000-
800-
600-
500- o
8 400-
o 200
.IONS OF GALLONS PER DAY
sz SO
£ 60
^ 500
40
30
20
'1°
^:*5
v"x\.
X
\'* «
\\
X
\"" ».
X
-^,
"
^
X
X
l"-
-«^~
X
\
EXPLANATION
^^ 2''''Sjj*~-""~~-~^Li"* ̂
^x^^
\fy
Flow atiove Crescent Dam
Flow below Crescent Dan (Cohoes gage)
^fc^io -(feT^^^ -
\
^ '
Exam pi
~-^.
-^.^
^
$x x
j: Thexf int Crtha as Ma
r~5
^
xvx^
'
i2i2-» ».-~
-<%s^k.
^-58
--
^
^X
day
=:
-^
^-
X
Jt~ -.
**.
^
N
-^
X
in
^,
; daily flow below Crescent Dam ected to be less than 29 mgd at jrvals of 10 yrs, and the daily flo sscent Dam may be expected to n 105 mgd at average mterva s o uming that the flow during Apr. r. 31, 1956 was typical
~ ^i. f<
*-~^ "~~^
X
X X
may be ^average N above be lessf 10 yrs
, 1926-
- -.
&L_
^^-~.
Nx>
_ __
~-
~-,
v
-^
"~~
N,
01 1.1 1.2 1.3 1.5 2 34568 10 20 3RECURRENCE INTERVAL, IN YEARS
FIGURE 10. Low-flow frequency curves, Mowhawk River; based on records for April 1, 1926, to March 31, 1956, from a drainage area of S,456 square miles.
at which different flows occur as the annual minimum. The flow- duration curve and low-flow frequency curves can be used to predict the probable occurrence of low .flows, assuming that meteorologic and other hydrologic conditions that influenced these curves remain almost unchanged and operation of storage reservoirs also remains unchanged. For example, over a period of many years the flow above Crescent Dam may be expected to be equal to or greater than 580 mgd 95 per cent of the time. . Below Crescent Dam the flow would be equal to or

D22 WATER RESOURCES OF INDUSTRIAL AREAS
greater than 450 mgd 95 percent of the time (fig. 9). For any one year these figures, based on average conditions, do not apply; for example, a flow of 580 mgd or less above Crescent Dam would not occur every year. Figure 10 shows that the minimum daily flow above Crescent Dam may be expected to be less than 580 mgd at average intervals of 1.07 years or about 9 of 10 years.
Floods in the Mohawk Kiver can be a serious problem. Kecords of floods are useful in the design of intake structures and docks and in locating building sites in areas that may be flooded. Hinckley, Delta, and Schoharie Keservoirs sometimes reduce flood flows greatly. As on other streams in the area, floods in the Mohawk Kiver most likely occur in March, April, and May; however, a great flood may occur in any month. The recurrence intervals of annual peak stages at Cohoes below Crescent Dam are given in figure 11.
715
1<n SI 70
2UJ
§69
I
UJ
| 68<
UJ UJ LL.
z 2-67
Ot-
UJ
UJ
66
65
S
/
s
/
/
//
^///
/
///
/
/
/'//
f
[ 1.5 2 3 4 5 6 7 8 9 10 15 20 3 RECURRENCE INTERVAL. IN YEARS
FIGURE 11. Flood-stage frequency curve, Mohawk River at Cohoes; based on records forwater years 1926-55.

ALBANY-SCHENEGTADY-TROY AREA, NEW YORK D23
The profiles of selected floods in that part of the Mohawk River within the report areas are given in figure 12. The approximate recur rence interval for each flood is given also.
Recurrence intervals (average expectancy) of floods of these magnitudes:
27yrs 8'/2 yrs
"0 5 10 15 20 25DISTANCE, IN MILES
FIGURE 12. Water-surface profiles during selected floods, Mohawk River from lock 8 tomouth.
The quality of Mohawk River water is satisfactory for most uses or the water can .be treated economically for the removal of undesirable substances. The water is moderately hard the median hardness as CaCO3 is 103 ppm (fig. 13). Where a lower degree of hardness is needed^ softening is required. The range in hydrogen-ion concentra tion during water years 1952 and 1953 expressed as pH was from 7.0 to 7.7. (See tabled for a comprehensive analysis.) During 1952 dis solved solids in 10-day composites of daily samples fluctuated from 82 to 176 ppm. (fig. 14). The median concentration of dissolved solids is about 145 ppm (fig. 13).
Daily, specific conductance ranged from 108 to 301 micromhos at 25°C; the median specific.conductance is about 229 micromhos at 25°C; (fig. 13). Specific conductance is a measure of the capacity of water

D24 WATER RESOURCES OF INDUSTRIAL AREAS
»̂
§» o«,t: $00-&.S "a,
e00 «
0^ z*"S _;
1? §
1 *i s» ^&* 5
t 3| a
d
oo"
to
f
e
-^
!M5
9w*t H
g "30
W0,
W uS
O'S'3KJ M
*n!,-£g-cS
CQ^OQ^
Iff
^1@
41t«!l§11|l§|§g~
IIIIIK4H
Source of sample and date of collection
i8csB1«1
OOO (M O
s:- s sOOO* b* Q t*^* 00 »O
s " " sgg S 8
<M<M t~- COrHCO O rH
t-10 O rH
oei txi -H
-1O O C*o
IOCO 00 U3
R9 3 S
SS § S
t- t- -4"
co'"'CD -4" oo
IO «< 00*
0000 -41 -411010 co co
^ S &
88 § So
rHrH O rHo '
OCO O> CO CO CO CN CO
S
10-41
Anthony Kill at Me-
chanicville:
May 26, 1954......... Sept. 2, 1954 _ ...... Hoosic River near Eagle
Bridge:
June 22, 1954......... Hudson River at Me-
chanicville:
July 7, 1954. . .....
1S
1
1
«-H u5 O&
! 1 ^88 18 8 S
S g §
S3 S
O O «M
rH 1-1 CM
O
co' oo* co
S S S
§ 5 S
CM CO rH
CO CO Oid oo* co'
O CO <3> w ^ *
S S Si s 8
§ § So
CO O 10 o ^ >d
J
!! !Mohawk River at
Vischer Ferry Dam: Oct. 1, 1951, to Sept.
30, 19521 ....... Oct. 1, 1952, to Sept.
30, 1953.. ....... Mohawk River at Co-
hoes:
Jan. 9, 1952..........

Low
er H
udso
n R
iver
sub
area
Hud
son
Riv
er a
t G
reen
Is
land
: Ju
ne 1
6, 19
54 .
.....
Aug
. 2
5_
...
....
...
Pos
ten
Kil
l nea
r T
roy:
Ju
ne 2
1, 1
954 .
.. ..
.E
ast
Bra
nch
Hun
ger
Kil
l at
Gui
lder
land
: M
ay 2
6, 1
954.........
Mil
l C
reek
at
Ren
ssel
aer:
M
ay 2
0, 1
954 .
. .
Aug
. 27
-.- _
........
Moo
rden
er
Kil
l ne
ar
Gas
tie t
on:
May
20,
195
4-- .......
Aug
. 27--
... ..
....
Vlo
man
K
ill
at
Ced
ar
Hil
l:
May
20,
19
54
.
.A
ug. 27-.
..
. ...
10,3
001,
870 58
.9
2.32
2.05
5.64
1.27
17.7
3.44
3.36 .35
48 53 71 51 64 58 68
3.6
1.4
6.3
10 8.3
4.3
3.1
6.7
6.5
3.6 .9
0.27 .23
.19
.22
.11
.16
.28
.08
.09
.17
.18
0.10 .00
.03
.01
.00
.01
.00
.00
.00
.00
.00
10 20 7.8
30 37 21 38 17 36 47 45
3.8
3.2
1.8
5.8
4.3
6.8
9.8
4.7
7.1
12 10
3.5
9.8
2.2 1
2.8
9.9
5.9
12
0.5
1.1 .4
8.3
51.
6
01.
0
4.1
60 57 10 91 116 60 134 46 117
130
163
15 26 13 22 21 26 40 22 28 46 40
3.5
8.8
1.5
3.0
1 8
4.5
6.4
4.0
6.0
9.0
8.8
0.2 .0 .2 .0 .0 .1 .0 .1 .0 .3 .0
1.0
2.8
1.4
1.2
2.5
1.0
2.0
2.1
3.2 .7 1.2
88 115
40 127
136
113
190 96 158
209
209
63 63 27 99 110 80 135 62 119
167
153
14 16 11 24 15 31 25 24 23 60 20
139
174 65
.5
213
224
194
306
157
258
352
350
6.9
7.0
6.6
8.0
8.0
7.6
7.8
7.5
8.0
7.8
7.6
10 38 10 r 00
4 *"^
s i
14 W
10 H
1
12
S
1 Ave
rage
of s
ampl
es c
olle
cted
dur
ing
this
per
iod.
O
8

D26 WATER RESOURCES OF INDUSTRIAL AREAS
360
340
COO
§300ccO 5
2 260UJ0
c3 220
Q
O
0 180 O u_OLd
</> 140
1000.
E
Ex
>
\Example:
\V
Dissolved sol ds (10-day composites of daily samples) equaled or exceeded 169 ppm during 10 percent of the time
^
\xample: Hardness (10-day composites of daily
samples) equaled or exceeded 120 ppm during 10 percent of the t me
ampl
\
3: S d e> dti
^
pecif lily E (cee( jrinj me
-^^
\
ic con ample
led 29 I 10 p«
^
;ducta s equ 0 micr srcent
UDa
(Oct.
X
Xnee of aled or omhos of the
ly spec 1,1951
\
X
fie co to Se
V\
X
/nduc pt. 3
\
^
tanc 0, 1?
Dissolved solids (10-day compos ites of daily samples, Oct. 1,
" 1951, to Sept. 30, 1953)
\\
\S
X
e 553)
\
\
X
\
y
\
\
\\
\\
Hardness (10-day compos ites of da ly samples,
. Oct. 1, 1951, to Sept. \30, 1953)
\
X\"S
X^^.
^^L 0.2 0.5 1 2 5 10 20 30 40 50 60 70 80 90 95 98 99 9
PERCENT OF TIME CONSTITUENT EQUALED OR EXCEEDED THAT SHOWN
160
150 z
140 aLda.CO
130 S a.z
120 8
CO
iio 5-coCOLd
Q
100 ^IQz
90 <COQ
S
80 QLd
§
60
50 9.5
FIGURE 13. Cumulative-frequency curve of hardness, dissolved solids, and specific con ductance, Mohawk River at Vischer Ferry Dam.
to conduct an electric current; it varies with the quantity of dissolved mineral constituents, degree of ionization of these constituents, and temperature of the water. Conductance is useful in indicating the total concentration of solutes in water.
Color fluctuates seasonally; it is highest in the fall and lowest during the other seasons of the year. Average color for Mohawk River water was about 14 units (based on the platinum-cobalt standard) in 1952-53.
The temperature of Mohawk Kiver water follows the same seasonal pattern as the air temperature in the region. In 1952 and 1953 the average water temperature (based on two daily readings) fluctuated between 32° and 80° F; the median temperature was 52° F. (See

8 *9 O
SPECIFIC CONDUCTANCE, IN MICROMHOS AT 25°C
DISSOLVED SOLIDS, IN PARTS PER MILLION
IZQ.HHOi ASLSN 'V3HV

D28 WATER RESOURCES OF INDUSTRIAL AREAS
fig. 15.) The water temperature is higher than 71° F only about 25 percent of the time. In some places the temperature of river water may be affected by the inflow of industrial effluent.
Fluctuations in water temperatures of the Mohawk River and the Hudson River at two locations are shown in figure 16.
TEMPERATURE, IN DEGREES FAHRENHEIT
U> ̂ Ul Q\ vj 00 Vf
o o o o o o c
1 ». -^
^V
\ .
\\
\
Ave r a 1
-The V d
V
rage water temperature ladings at Vischer Ferr bout 8 a. m. and 4 p. 951, to Sept. 30, 1953
average water temp ischer Ferry Dam exce uring 25 percent of the t
^ -~_
}f two daily y Dam (at m.) Oct. 1,
erature at jded 71 °F me
- ̂ ̂ _ -^ ̂ -^
1 2 5 10 20 30 40 50 60 70 80 90 95 98 99 99.9 PERCENT OF TIME TEMPERATURE EQUALED OR EXCEEDED THAT SHOWN
99.99
FIGURE 15. Cumulative frequency curve of average water temperatures (two daily readings), Mohawk River.
SMAjUL STREAMS
Many small streams enter Mohawk River between Hoffmans and the mouth of the river. Although discharge measurements have been made on several of these (pis. 1 and 2), a reliable estimate of the low- flow characteristics is possible for only five of the streams. For these streams, the flow that was equaled or exceeded 95 percent of the time ranges from 0.004 to 0.028 mgd per sq mi of drainage area. (See table 6.) This low yield is due to the till or stratified fine-grained deposits that underlie most of the drainage basin of these streams and which release rather small quantities of water to streamflow during dry periods. (See pi. 1.) Although the low-flow characteristics of other small streams in the subarea may be similar to those of the five small streams shown in tables 6 and 7, the effect of local variations in geology and topography makes such a generalization suitable for reconnais sance purposes only.
Of the five small streams in the Mohawk River subarea for which low-flow analyses have been made, Alplaus Kill and Delphus Kill have the highest yields per square mile. With respect to total yield during

TABL
E 6
. D
urat
ion
of lo
w fl
ow o
f sel
ecte
d sm
all s
trea
ms
[Bas
ed o
n di
scha
rge
mea
sure
men
ts a
nd re
cord
s In
the
vici
nity
adj
uste
d to
the
per
iod
1912
-55]
Inde
x N
o.
(pl.
1) 4 11
12
20 27
29 40
43
44 48
47
49
50
53
Stre
am a
nd lo
catio
n
Plot
ter
Kill
at
Eyn
ex C
orne
rs.. _
__
__
__
__
_A
lpla
us K
ill a
t G
lenr
idge
_ . _
....
....
__
....
....
Vlo
man
Kill
at
Ced
ar H
ill n
ear
Sel
kirk
.... .
....
....
Dra
inag
e ar
ea
(sq
mi)
62.4 9.56
3.
70
54.3
18
.2
1.74
0.64
13
.2
41.2
1.
58
169 29
.7
29.8
34
.6
Flow
whi
ch w
as e
qual
ed o
r exc
eede
d fo
r Ind
icat
ed p
erce
ntag
e of
tim
e
Mill
ion
gallo
ns p
er d
ay
6070
8090
9598
Mill
ion
gallo
ns p
er d
ay p
er s
quar
e m
ile
6070
8090
9598
Upp
er H
udso
n R
iver
sub
area
138.
85.
63
0
. o2.
31.
70.
210.
140.
090
0.05
30.
037
0.02
7
Moh
awk
Riv
er s
ubar
ea
0.72
.2
3 12
2.4 .37
0.40
.1
4 7.
7 1.
3 .24
0.18
.0
71
4.3 .58
.14
0.07
8 .0
36
2.3 .24
.073
0.04
1 .0
22
1.5 .14
.048
1.1 .085
.0
34
0.07
5 .0
62
.23
.13
.21
0.04
2 .0
38
.14
.071
.1
4
0.01
9 .0
19
.079
.0
32
.080
0.00
8 .0
10
.042
.0
13
.042
0.00
4 .0
06
.028
.0
08
.028
0.02
0 .0
05
Low
er H
udso
n R
iver
sub
area
0.61
2.
3 3.
5 2.
0 50
6.5
2.2
10
0.57
1.
5 2.
0 2.
0 35
4.4
1.2
7.1
0.54
.8
8 .9
1 1.
9 23
2.7 .54
4.5
0.50
.5
0 .4
1 1.
9 14
1.6 .23
2.7
0.48
.3
4 .2
3 1.
8 9.
9 1.
1 .13
1.9
0.46
.2
5 .1
4 1.
8 7.
5 .83
.078
1.
5
0.95
.1
7 .0
87
1.3 .22
.074
.2
9
0.89
.1
1 .0
49
1.3 .15
.040
.2
1
0.84
.0
67
.022
1.
2 .091
.0
18
.13
0.78
.0
38
.010
1.
2 .054
.0
08
.078
0.75
.0
26
.006
1.
1 .037
.0
04
.055
0.72
.0
19
.003
1.
1 .028
.0
03
.043
i Reg
ulat
ed fl
ow.

o GO o
TAB
LE 7
. M
agnit
ude
an
d f
req
uen
cy o
f a
nn
ua
l lo
w f
low
of
sele
cted
sm
all
str
eam
s
[Res
ults
of a
regi
onal
ana
lysi
s of
stre
amflo
w fr
om A
pr. 1
, 191
1, to
Mar
. 31,
195
5]
Inde
x N
o.
(pl.
1) 4 11
12
20
27
29
40
43
44
46
47
49
50
53
Stre
am a
nd lo
catio
n
Alp
laus
Kill
at
Gle
nrid
ge _
_____________
Del
phus
Kill
at
Dun
sbac
h F
erry
.. _
__
__
__
__
Vlo
man
Kill
at
Ced
ar H
ill n
ear S
elk
irk
.
Dra
in
age
area
(s
qmi)
62.4
9.
66
3.70
54
.3
18.2
1.
74
.64
13.2
41
.2
1.58
16
9 29.7
29
.8
34.6
Low
est f
low
for
rec
urre
nce
inte
rval
and
con
secu
tiv
e pe
riod
indi
cate
d (m
gd)
2-ye
ar>e
curr
ence
inte
rval
1 da
y
1.86
.0
28
.016
1.
04
.084
.0
35
.46
.25
.16
1.77
7.
55
.83
.077
1.
45
7 da
ys
2.22
.0
40
.021
1.
41
.12
.045
.4
8 .3
2 .2
2 1.
80
9.41
1.
06
.12
1.83
30 d
ays
3.44
.0
85
.039
2.
34
.26
.075
.5
0 .5
1 .4
5 1.
85
14.0
1.
65
.24
2.78
5-ye
ar re
curr
ence
inte
rval
Iday
1.06
.0
12
.008
.5
9 .0
39
.019
.4
3 .1
5 .0
65
1.72
4.
72
.50
.035
.9
0
7 da
ys
1.39
.0
17
.010
.8
1 .0
58
.026
.4
5 .1
9 .0
94
1.75
6.
04
.64
.054
1.
15
30 d
ays
2.16
.0
38
.020
1.
35
.12
.044
.4
8 .3
1 .2
1 1.
79
9.09
1.
03
.11
1.77
Low
est
flow
for
rec
urre
nce
inte
rval
and
con
secu
- ^
tive
peri
od in
dica
ted
(mgd
per
sq
mi)
^ &
2-ye
ar re
curr
ence
inte
rval
Iday
0.03
0 .0
03
.004
.0
17
.005
.0
20
.72
.019
.0
04
1.12 .028
.0
03
.042
7 da
ys
0.03
6 .0
04
.006
.0
23
.007
.-0
26
.75
.024
.0
05
1.14 .036
.0
04
.053
30 d
ays
0.05
5 .0
09
.011
.0
38
.014
.0
43
.78
.039
.0
11
1.17 .055
.0
08
.080
5-ye
ar re
curr
ence
inte
rval
Q / H
1 da
y
0.01
7
.009
.0
02
.011
.6
7 .0
11
.002
1.
09 .017
.0
01
.026
7 da
ys
0.02
2
.013
.0
03
.015
.7
0 .0
14
.002
1.
11 .022
.0
02
.033
30 d
ays
Q CO
0.03
5
O
.022
.0
07
B
.025
2
.7
5 2
.0
23
g
.005
,j
1.
13
g
.035
£
.0
04
r
.051
a

ALBANY-SCHENECTADY-TROY AREA, NEW YORK D31
x 90
5 80
£60
zr 50
40
2 30
./-1952
HUDSON RIVER AT MECHANICVILLE Upper Hudson River subarea, above the Mohaw
U.
80
70
60
50
40
30-w=rv>Tra.^r*'
^s' /~
1*
1953 » ,-" /
+/
Lower
ff's 1952
HUDSON Hudson R
VW<P\
'-%...^wH"s
v\X
RIVER AT GREEN ISLAND ver subarea, below the Mohaw
,\~x
k River
\
S^ " V^xJAN. FEB. MAR. APR. MAY JUNE JULY AUG. SEPT. OCT. NOV. DEC.
FIGUEH 16. Temperature of Mohawk River water at Vischer Ferry Dam and Hudson River water at Mechanicville and Green Island, 1952 and 1953; daily readings at about 8 p.m.
periods of low flow, Alplaus Kill is the only one whose flow at the 95-percent duration p6int (flow equaled or exceeded 95 percent of the time), is more than 1 mgd.
Chemical analyses are available for two small streams which are tributary to the Mohawk River in this subarea (table 5): Alplaus Kill at Glenridgeand Stony Brook at Vischer Ferry.
Available data indicate that dissolved solids in water from Alplaus Kill fluctuated from 114 ppm during periods of high flow to 205 ppm during low flow. The range of hardness as CaCO3 followed a similar

D32 WATER RESOURCES OF INDUSTRIAL AREAS
pattern 67 to 136 ppm. The chemical constituents of water from Alplaus Kill were principally calcium and bicarbonate with lesser quantities of other mineral constituents normally found in surface water. However, concentrations of iron at times exceeded 0.3 ppm, and would have to be reduced for some uses of the water.
The range of dissolved solids in water from Stony Brook was narrower than that for Alplaus Kill 107 to 140 ppm. The water was moderately hard 61 to 109 ppm. The chemical constituents of water from Stony Brook consisted principally of calcium and bicarbonate.
PUBLIC WATER-SUPPLY SYSTEMS
Public water-supply systems serve most of the domestic users as well as some of the industrial users of water in the subarea. The major systems in the Mohawk Eiver subarea are those of Schenectady, Cohoes, Latham, and Waterf ord (fig. 17). Schenectady has an ample source of water in its well field in the flood plain of the Mohawk River. Waterf ord obtains its water from the Hudson Eiver and the Latham Water District obtains water from wells in the Colonie buried channel and from Stony Creek, a tributary of the Mohawk River. The Stony Creek surface-water supply was developed recently to relieve the draft on the wells because the water level in the vicinity of the wells had declined greatly. Cohoes obtains its water from the Mohawk River. Descriptive data on the wjater-supply systems are given in tableS.
The finished water from the public supplies, with respect to chemi cal and physical characteristics, meets the drinking-water standards of the U.S. Public Health Service for interstate carriers, which are generally accepted for public water supplies. The Schenectady water was the hardest of any of the public supplies in the area 160 ppm. It also had the highest concentration of dissolved solids 197 ppm. In contrast, the Troy water contains 61 ppm of dissolved solids and has a hardness of 40 ppm. The median concentration of dissolved solids of the 10 public water supplies listed in table 8 is about 125 ppm; median hardness is 85 ppm.
It is estimated that of the total population of 403,800 served by these public supplies, 239,400 use water having a dissolved-solids content and hardness less than the median values of 125 and 85 ppm, respectively. Analyses of water from public water supplies in the area are given in table 9.

ALBANY-SCHENECTADY-TEOY AREA, NEW YORK D33
SCHENECTADY**
COUNTY ̂ ^
Rensselaer RENSSELAER
COUNTY^
ALBANY COUNTY
5 MILES
EXPLANATION
Streams Wells and springs
Source of supplyArrows lead from surface-and
ground-water source
25mgd 5 mgd 2.5 mgd 1 mgd
Average daily use in million gallons per day
FIGURE 17. Source of and demand on major public-water supplies In the Albany- Schenectady-Troy area, 1953.

D34 WATER RESOURCES OF INDUSTRIAL AREAS
o"§
s?§» *&- g OS OS
£ **

ALBANY-SCHENECTADY-TROY AREA, NEW YORK D35
UPPER HUDSON RIVER SUBAREA
The Hudson River rises in the Adirondack Mountains and flows southward through the area in a flood plain ranging in width from y2 to iy2 miles. The flood plain is bordered by a lowland comprising clay plains near the river. To the east of the clay plains is a gently rising area of till and bedrock and west'of the clay plain are areas of till and sand plains and sandhills. Tributaries enter the river through steep narrow valleys.
The largest concentrations of population and industry are at Me- chanicville and Waterf ord. A paper plant in Mechanicville uses large quantities of water. Other water-using factories produce textiles and machinery. The channel of the Hudson River serves as the Champlain (Barge) Canal. The Hudson and Hoosic Rivers are the chief sources of water in this subarea but some water is available from wells and small streams.
GROUND WATER
The formations in this subarea do not yield water to wells readily; however, small quantities of water may be obtained from alluvium, stratified deposits, and bedrock.
The alluvial deposits of the Hudson River consist chiefly of clay and silt which-contains sand and gravel lenses in a few places. Because the deposits are relatively fine grained and not very thick, they are not likely to yield large quantities of water.
The delta formed by the ancestral Hoosic River where it entered glacial Lake Albany west of Schaghticoke, rests on a layer of till about 40 feet thick which in turn rests on bedrock. The deltaic material consists of about 100 feet of fine-grained stratified material, chiefly clayey sand, which is overlain by more than 200 feet of coarse sand and gravel. The present Hoosic River has cut through all these deposits and into the underlying bedrock; therefore the deposits are thor oughly drained and storage of large quantities of water is not possible.
The yields of wells in bedrock, till, and stratified fine-grained deposits in the subarea range widely. Generally, however, yields are small but sufficient for the needs of households and farms. The bed rock formations in the subarea are the Schenectady and Snake Hill formations, Normanskill shale, and the Schodack formation. (See fig. 5). The median yield of reported wells that tap these formations is very nearly the same, between 2 and 4 gpm (table 1).
A till blanket, commonly not more than 30 feet thick, covers much of the higher parts of the subarea. Cushman (1950, p. 17) reports that the average yield of 15 wells drawing water from till in Rensselaer

D36 WATER RESOURCES OF INDUSTRIAL AREAS
County is about 10 gpm; however, the reported yield of wells that tap till in the Albany-Schenectady-Troy area is somewhat less, the median yield is only 3 gpm. The fine-grained stratified deposits yield very little water to wells.
Depths to water in wells and fluctuations of water level in the sub- area are about the same as elsewhere in the Albany-Schenectady-Troy area, as described on page 13, table 2, and figure 6. Of the 75 wells inventoried during 1945-49 in this subarea, 5 wells were reported to be flowing.
The quality of ground water in the subarea is about the same as the quality of ground water elsewhere in the Albany-Schenectady-Troy area (p. 16).
SURFACE WATER
HUDSON RIVER
The flow of the Hudson River is affected by the operation of Sacan- daga Reservoir on the Sacandaga River and Indian Lake Reservoir on the Indian River. (See fig. 1.) Sacandaga Reservoir, completed in 1930, has a usable capacity of about 256,000 million gallons and impounds water from a drainage area of 1,044 square miles. It con trols practically the entire flow of Sacandaga River and provides flood-control and low-water stream regulation for sanitary improve ment, navigation, and waterpower. Indian Lake Reservoir, built in 1845 and rebuilt in 1898, has a usable capacity of about 34,000 million gallons from a drainage area of 131 square miles. It is used primarily for power development for industrial needs, and to improve navigation in the lower Hudson River. These reservoirs have an appreciable effect on the flow of the Hudson River. In some months during late summer and fall when streamflow normally is low, more than half the flow of the Hudson River above the Mohawk River is water released from storage.
The flow of the Hudson River above the Mohawk River and within the Albany-Schenectady-Troy area is measured at Mechanicville (table 4). Although streamflow records have been collected at Mechanicville since 1887, the flow records prior to the construction of Sacandaga Reservoir in 1930 are not comparable to those collected since 1930 because of the regulation by the reservoir.
The lowest daily flow that occurred during water years 1931-54 was 397 mgd, or 614 cfs (cubic feet per second), on February 1,1931. The duration curve of daily flow (fig. 18) shows the percentage of time that the flow equaled or exceeded different quantities and the low-flow frequency curve (fig. 19) shows the recurrence interval for different low flows. These curves are based on records subsequent to construe-

100,
000;
80
,000
-
60,0
00 -
0
50
,00
0-
O
40
,00
0-
£
30
,00
0-
CE °-
20,0
00-
t LU
U
- o S
10,0
00;
O
80
00
-
-
60
00
-
g
50
00
-
§
4000
1I ^
3000
-D
200C
-
1000
- 80
0-
80,0
0
60,0
00
50,0
00
> 4
0,0
00
<30,0
00
£ 2
0,0
00
</) z
o _l <
^ 1
0,0
00
0
8000
</5 §
60
00
3
5000
i
40
00
-
3000
uu
O ^
2000
§
o
10
00
800
600
50
0
X X- "*^ ^x
Gre
< /*+
f ^ s"V
sn I
sla
x^
\ -Mec
nd, e
xten
ded
to
Dra
inag
e ar
ea 8
KX
\\ «^ -^K
jwat
er y
ear
D90
sq
m
\ ""V
- ^ N
^
hani
cvill
e, w
ater
yea
rs 1
93
Dra
inag
e ar
ea 4
500
sq m
S193
1-
*>^^^^
^^^
1-5
4H
-54
L"X
^
>^;
f^x^
^
^
f*^
^v^
"
^^
^
"^ "^v^
^nple
: Th
«Is
lace
etim
... 54
>v^
"^v^_
"^^^
^
Exam
ple:
Th
e flo
w o
f th
e H
udso
n R
iver
at
Me-
ch
anic
ville
may
be
expe
cted
to
equa
l or
,
-
the
193ee
d 1300 m
gd d
urin
g 9
5 p
er
tim
e
ass
um
ing
th
at
flow
1-5
4 w
as t
ypic
al
> flo
w o
1 nd
may
d
21
00
e
assu
n w
as t
yp
\ \
<S
>
the
Hue
be
exp
e
mgd
duri
nin
g t
hat
ica
l
"\
son
F
cte
dt
ng95
flow
.^ ~*
**^^?i
ver
o eq
u pe
rce
du
rin
^ ^V
s^
at G
re«
al o
r e
nto
ft
g 193
\
v^
" ^j
sn -
%- _
ie _ '^
^
^^
0.01
0.
05 0
.1 0
.2
0.5
12
5 10
20
30
40
50
60
70
80
90
PE
RC
EN
T
OF
TIM
E
DIS
CH
AR
GE
E
QU
ALE
D
OR
E
XC
EE
DE
D
TH
AT
S
HO
WN
9598
99
99
.5
99.8
99.9
FIG
URE
18
. D
ura
tion c
urve
of
dail
y fl
ow,
Hud
son
Riv
er a
t G
reen
Isl
and;
exte
nded
to
wat
er y
ears
19
31-5
4, f
rom
a d
rain
age
area
of
8,09
0sq
uare
mile
s.d 0
0

r>38 WATER RESOURCES OF INDUSTRIAL .AREAS
4000-
3000-
600- O
500-
1.2 1.3 1.5 2 3456
RECURRENCE INTERVAL, IN YEARS
8 10
FIOUBB 19. Low-flow frequency curves, Hudson River at Mechanicville; based on recordis for April 1, 1930, to March 31, 1956, from a drainage area of 4,500 square miles.
tion of Sacandaga Beservoir and therefore, show the low flow that was experienced with Indian Lake and Sacandaga Keservoirs in use. These curves may be used to predict the probable occurrence of low flow of the Hudson Biver, provided the flow during the period was typical and provided the reservoirs are operated in the same manner as in the past.
Floods in the Hudson Biver are affected by storage in Sacandaga Beservoir and to a much lesser extent by storage in Indian Lake Bes ervoir and in Tomhannock Beservoir in the Hoosic Biver basin. As on other streams in the Albany-Schenectady-Troy area, floods are most likely to occur during March, April, and May; however, a flood may occur in almost any month. (See figs. 20 and 26.) The curve of average recurrence interval of annual peak stages at Mechanicville is given in figure 21. As this curve is based on records collected since Sacandaga Beservoir was built, it. reflects the operational effect of Sacandaga and Indian. Lake Beservoirs and the natural storage effect of Tomhannock Beservoir. The profiles of selected floods on the Hud son Biver and their average recurrence intervals are given in figure 22.
Note that the flood flow of the Mohawk Biver was so great during the 1936 flood to cause flood stages on the Hudson Biver below the Mo hawk Biver to be the highest of record since 1913. (See also fig. 12.)
Although the water is polluted, the mineral content of Hudson Biver water is such that the water is satisfactory for most uses or if necessary, it can be improved by simple treatment. The water con tains moderate concentrations of dissolved solids and is soft (analyses) are given in table 5). The chemical constituents are principally cal cium and bicarbonate. At times, the color of the water is high and may have to be reduced depending on the use of the water.

ALBANY-SCHENECTADY-TROY AREA, NEW YORK D39
The temperature of Hudson Kiver water follows the same seasonal pattern as the air temperature in the region but lags slightly behind it. In some places the water temperature may be affected by inflow of industrial wastes. In 1952 and 1953 water temperatures fluctuated between 32° and 82° F (fig. 16). The water temperature was less than 60° F during 7y2 months in 1953 and during 8 months in 1952.
18
WATER YEARS
FIGUBB 20. Stages of annual floods, Hudson River at Green Island, water years 1931-55.

D40
80
WATER RESOURCES OF INDUSTRIAL AREAS
<78
5
76
- 74
722 5
RECURRENCE INTERVAL, IN YEARS10 20 30
FIGDBB 21. Flood-stage frequency graph, Hudson River at Mechanicville ; based on recordsfor water years 1931-52.
HOOSIC RIVER
The Hoosic River rises in Massachusetts and Vermont and empties into the Hudson River 3 miles north of Mechanicville. The river flows through the northeast corner of the area; however, most of its drainage basin lies outside of the Albany-Schenectady-Troy area.
Hydroelectric plants on the Hoosic River develop power at John- sonville and Schaghticoke. The Tomhannock Reservoir on Tomhan- nock Creek, a tributary of Hoosic River, is the main source of water for Troy. (See pi. 1). Tomhannock Reservoir has a drainage area of 67 square miles and a storage capacity of 12,000 million gallons. It was built in 1904.
The flow of the Hoosic River is measured at Eagle Bridge, outside the Albany-Schenectady-Troy area (table 4 and pi. 2). The flow-du ration curve (fig. 23) and the low-flow frequency curve (fig. 24) show the low-flow characteristics. The curves show the flow above two run- of-the-river powerplants, which change the flow pattern greatly dur ing periods of low flows.
The chemical quality of Hoosic River water is similar to that of water from the Hudson River above its confluence with the Mohawk River. The water is only slightly harder and somewhat more alkaline than water from the Hudson River (analysis given in table 5). The principal chemical constituents are calcium and bicarbonate.

^Rec
urre
nce
inte
rval
s (a
vera
ge e
xpec
tanc
y) a
t M
echa
nicv
ille
-On a
n av
erag
e of
once
eve
ry 2
3 y
ears
-On
an
aver
age
of o
nce
ever
y 11
yea
rs- O
n an
ave
rage
of
once
eve
ry 1
6 m
onth
s
Mo
uth
s o
fM
ohaw
kR
iver
Rec
urre
nce
inte
rva
ls (
aver
age
expe
ctan
cy)
at G
reen
Isl
and:
/O
n a
n av
erag
e of
onc
e ev
ery
25 y
ears
,0
n a
n av
erag
e of
onc
e ev
ery
11V4
yea
rs
On
an a
vera
ge o
f on
ce e
very
32
month
s
153
0D
IST
AN
CE
, IN
M
ILE
S
FIG
URE
22
. Wat
er-s
urfa
ce
prof
iles
duri
ng
sele
cted
flo
ods,
H
udso
n R
iver
fro
m l
ock
4, C
ham
plal
n (B
arge
) C
anal
, to
Cas
tleto
n-on
-Hud
aon.

15,0
00-
10,000-
8000-
6000
- 50
00-
4000-
Q §
3000-
§ a:
20
00
-
o
1000
-00 3
800-
5
600-
£
500-
<
400-
30
0-
100-
80
-
8000
6000
50
00
4000
,_
3000
g g
2000
a. g < 10
00S
80
0
g
60
0
§
500
i
400
-
300
UJ o
cc 5
200
8 Q
100
80 60
50 40
0.
^\
X^v
V.̂s
x\NX\
x.N
- X^x^
^v x
Xs
^^=
^r ^^
^ ^>»«
^-~J
M^ ^
^^ -^
,"
^
31
O.O
i 0.
1 0.
2 0.
5 1
2 5
10
20
30
4
0
50
60
70
80
90
95
98
99
99.5
99
.8 9
9
PE
RC
EN
T O
F TI
ME
D
ISC
HA
RG
E
EQ
UA
LED
O
R
EXC
EED
ED
THA
T S
HO
WN
to § § H
00
FIG
URE
23. D
ura
tion c
urve
of
dall
y fl
ow,
Hoo
sic
Riv
er n
ear
Eag
le B
ridg
e; m
easu
red
flow
dur
ing
wat
er y
ears
192
4-55
, fr
am a
dra
inag
e ar
eaof
510
sq
uare
mile
s.

ALBANY-SCHENECTADY-TROY AREA, NEW YORK D43
Q300- XThe lowest average 30-day flow near Eagle Bridge may be expected to be less than 78 mgd at average intervals of 10 yrs assuming that the flow during 1911- 54 was typical
23 456
RECURRENCE INTERVAL, IN YEARS
FIOUBE 24, Low-flow frequency curves, Hoosic River near Eagle Bridge; based on a regional analysis of records for April 1, 1911, to March 31, 1955, from a drainage area of 510 square miles.
Data on the temperature of Hoosic River water are not available. However, the temperature probably follows a seasonal pattern similar to that of the Mohawk and Hudson Rivers. As the Hoosic is shal lower, the maximum temperature may be higher than that of the larger streams.
SMALL STREAMS
Anthony Kill (pi. 1), a tributary of the Hudson River at the north ern edge of the report area, is the only small stream in the upper Hud son River subarea for which data on flow characteristics are available. It is the outlet of Round Lake and drains an area of 62.4 square miles, most of which is outside the report area. Mechanicville Reservoir, on a small tributary, has little effect on the flow of the stream because the drainage area of the tributary is only 5 percent of the total. The flow- duration data and low-flow frequency data are given in tables 6 and 7. The flow of Anthony Kill at Mechanicville equals or exceeds 2.3 mgd 95 percent of the time. This moderately well sustained dry- weather flow of Anthony Kill results from part of its basin being a sand-plain region similar to the Albany-Schenectady sand plain.
In view of the wide range in low-flow characteristics of the small streams in the other parts of the report area, no estimate can be made of the dry-weather flow of the other small tributaries of the Hudson River between Mechanicville and the Mohawk River. However, be cause they have small drainage basins, the amount of dry-weather flow available for use 95 percent of the time on any one stream is prob ably less than 1 mgd.
The water of Anthony Kill, based on analyses of two samples taken during 1954, is harder and has a higher concentration of dissolved solids than Hudson River water. It is also slightly more alkaline (table5).

D44 WATER RESOURCES OF INDUSTRIAL AREAS
PUBLIC WATER-SUPPLY SYSTEMS
The-public water-supply systems are probably the most economical source of small quantities of water for industrial use or of water of good sanitary quality. The only major system in the upper Hudson River subarea is at Mechanicville (fig. 17). Baker and Plum Brooks, small tributaries of Anthony Kill, are the source of supply. The rated capacity of the system is 2.16 mgd and the maximum daily demand was 0.9 million gallons in 1953. Additional information is given in tableS.
The finished water from the system meets U.S. Public Health Serv ice standards for public water supplies and is about typical for the region; the concentration of dissolved solids in one sample was 117 ppm, hardness as calcium carbonate was 78 ppm, and the iron content was 0.10 ppm. An analysis of the sample is given in table 9.
LOWER HUDSON RIVER SUBAREA
The Hudson River below the Mohawk River is the combined flow of all streams in the Albany-Schenectady-Troy area and, therefore, is the largest source of water in the area. Large quantities of water from the Hudson River are used for cooling and other industrial purposes and some is used for public water supplies. In addition to the Hudson River, small streams and wells are sources of water.
The river flows in a flood plain ranging in width from i/£ to 1 mile cut in a lowland area of thick clayb silt, sand, and till. From the outskirts of Albany northwest to Schenectady and Guilderland this lowland is an area of sand plains and sandhills. South and southwest of this sandy area is an area of flat clay plains that extends eastward beyond the flood plain of the Hudson *4 to 2!/£ miles. East and west of the clay plains are gently rising, more hilly lowlands of till and bedrock. The western part of this gently rising lowland extends to the foot of the Helderberg escarpment, which rises abruptly more than 1,000 feet to the southwestward-sloping Helderberg plateau. The plateau is covered with a thin deposit of till interspersed with outcrops of the underlying limestones and shales.
Industry is concentrated along the flood plain of the river; the residential areas are on the other sections of the lowlands. Albany, the largest city in the area, is the State capital and a port of entry. Troy, at the head of river navigation, is an industrial and educational center.
Ground water is more plentiful in the lower Huds&n River subarea (below the Mohawk River) than in the upper Hudson River subarea. Moderate to large supplies may be obtained at some places in the allu-

ALBANY-SCHENECTADY-TROY AREA, NEW YORK D45
vium in the lower Hudson Eiver flood plain and from sand plain, kame, and terrace deposits. Small supplies may be obtained from till and bedrock.
GROUND WATEB
HUDSON RIVER FLOOD PLAIN
The alluvial deposits of the Hudson River flood plain below the Mohawk River consist chiefly of clay and silt which in some places is inter-stratified with lenses of sand and gravel (fig. 25). These water bearing sand and gravel lenses sustain some industrial and public- supply wells of large capacity and are potential sources of additional large supplies.
The public-supply system of the town of Green Island pumps an average of about 0.5 mgd from an infiltration gallery, and the Borden Co. in Troy pumps about 0.12 mgd from three wells. Tests for the General Aniline Co. at Rensselaer indicated a potential yield of about 5,700 gpm from a horizontal collector-type well. At the Port of Albany, Cargill, Inc. has three wells drawing water from gravelly alluvium which yield 350, 100, and 75 gpm. At Green Island, Breakers Island, and Rensselaer, the high yields are probably due to induced infiltration of river water. Large supplies of ground water may be obtained at these and other places in the Hudson River flood plain where conditions are favorable for well installations inducing recharge from the river.
REMAINDER OF THE SUB AREA
Moderate quantities of water may also be obtained from coarse grained deposits in the Wynants Kill kame area and the Schodack terrace, and small quantities may be obtained from bedrock and till.
The Wynants Kill kame area (pi. 1), 8 square miles in extent, is covered by irregularly shaped knobs, depressions, and small lakes. Underlying the area are deposits of gravel and sand as much as 120 feet thick that are interfingered with fine-grained materials. Wells in the Wynants Kill kame area yield moderate quantities of water and, according to Cushman (1950, p. 18), only a few wells tap the gravel and sand deposits. The largest development is at the Pawling Sana torium where three wells have a maximum combined yield of 80 gpm.
The Schodack terrace lies east of the Hudson River in the south eastern corner of the Albany-Schenectady-Troy area (pi. 1). The terrace consists of well-sorted beds of coarse clean sand and gravel and ranges in thickness from zero at East Greenbush and Schodack Center to more than 100 feet near its center. The sand and gravel in the terrace are a potentially productive source of water because the stratified beds are thick and yield water freely to wells. The East

d £»
05
10
0'
80'
60
'
40
'
f 20'
0'
-20'
40
'
-60'
-80
'
-10
0'
f*. N _ -
>, £
U
J L
1 =\
tl
s=
?i
\ S
EA
LE
VE
L
/
\
\/
* \
\=
\_
**"»
,» -
^>'^._
! \ Q
o g
(Jf O
C^ J^ - - "*"
^--'?'""'
. *
"**^
EX
PL
AN
AT
ION
n i
iR
ecor
d m
issi
ng
San
d H
ardp
an
1 B
0C
lay
Gra
vel
Wel
l scr
een
n
^
« "33 U) c 41 tr 1 2 I i f
i x
^ ^
~\^ \ \ \ \? ^
1 m I It1
- i
\
rv= »
^ \i \i »i \k>
Bed
rock
^
VER
TIC
AL
EXAG
GE
RAT
ION
X 2
64
§ i ! 1 1; ! t t t
SE
A
LE
VE
L
"--^
oc^
**
"*'^
*fcW
f/S
«
! I
- >.
's'"
*^-*- *
1'S
*
,'''
=
2 0
2lit
i
FIG
UR
E
25. S
ect
ion
sho
win
g u
nco
nso
lidate
d d
epos
its
alo
ng
th
e H
udso
n R
iver
betw
een
Tro
y a
nd
Cast
leto
n-o
n-H
udso
nsh
ow
non
pla
te
1.
g o 3 X § g J2 to O 17
*
1
!'
S'''
~^''"'
'
jj
S
_ - " -
4 M
ILE
Si
. L
oca
tion
of
^J § H W OT § M
QQ 0 4 g d CQ K fe S3 H £> CO
sect
ion

ALBANY-SCHENECTADY-JTROY AREA, NEW YORK D47
Greenbush Terrace Water Co. public-supply well reportedly pene trates 10 feet of coarse sand beneath 60 feet of gravel and yields 50 gpm with a drawdown of only 4 inches.
The Albany-Schenectady sand-plain area extends into the lower Hudson Eiver subarea (pi. 1). The buried channels in this part of the report area are mostly filled with clay and are not productive sources of water. In this part of the sand-plain area there is generally only enough water available for domestic use.
The Vorheesville deposit (pi. 1)., a small deltaic deposit northwest of Voorheesville and New Salem, contains gravel beds that are about 60 feet thick in some places. A buried channel that enters the Mohawk buried channel from the west near Voorheesville seems to underlie part of the deposit. These gravel beds are tapped by the public- supply wells of Voorheesville and Bethlehem Water District No. 1. Although the gravel beds are highly permeable, their small area extent probably precludes much further development.
Sand and gravel along Valatie Kill to the east of the Schadack terrace furnishes 140 gpm to a public-supply well at Nassau. Other coarse-grained deposits are near South Bethlehem and south of Watervliet Reservoir.
The yields of wells in bedrock, till, and stratified fine-grained depos its range widely but are generally inadequate for purposes other than domestic and farm use.
The bedrock formations in the lower Hudson River subarea are the Silurian and Devonian limestones, shales, and sandstones, Schenectady and Snake Hill formations, Normanskill shale, and Schodack and Nassau formations. (See fig. 5.) Throughout the Albany-Schenectady-Troy area, the median yield of wells that report edly tap the Schenectady formation is 2 gpm and those that tap the other bedrock formations is 4 gpm. (See table 1.)
The uplands and other areas are underlain by a blanket of till, gen erally not more than 30 feet thick, from which yields of a few gallons per minute are an important source of water in areas not adjacent to more productive sources of supply. The stratified fine-grained de posits of sand and clay also yield small quantities of water. The fine sands yield about the same quantity of water as the bedrock forma tions noted above, but the clays yield little or no water.
In the lower Hudson River subarea, depths to water in wells and fluctuations of water level are about the same as in other parts of the AlTbany-Schenectady-Troy area, as described on page 12, and in table 2 and figure 6. Of the 320 wells inventoried in the lower Hudson ]|iver subarea during 1945-49, there were 6 flowing wells, including 5 in Albany County.
D48 WATER RESOURCES OF INDUSTRIAL AREAS
QUAMTY OF GROUND WATER
Ground water in the lower Hudson River subarea has about the same quality as ground water in the Mohawk River subarea (p. 13). The chief difference is that some limestone occurs in this subarea whereas the bedrock in the Mohawk River basin is all shale and sand stone. In general the water from the limestone contains a higher concentration of dissolved solids and is harder than water from the shale and sandstone. The dissolved solids in water from the limestone are predominantly calcium bicarbonate with lesser aniounts of mag nesium and other constituents. Analyses of ground-water sources located in the lower Hudson River subarea are given in table 3.
SURFACE WATER
HUDSON RIVER
The flow of the Hudson River below the Mohawk River is affected by regulation and diversions in both the Mohawk River and upper Hudson River basins and by Alcove, Basic, and Watervliet Reser voirs on small tributaries.
The flow of the Hudson River below the Mohawk River is measured at Green Island (table 4 and pi. 2). Prior to 1948 streamflow or stage records were collected near the present site by the Ford Motor Co. and the Corps of Engineers.
The lowest daily flow that occurred during water years 1947-54 at Green Island was 821 mgd, equivalent to 1,270 cfs (cubic feet per second) on September 5, 1949. Regulation of the streamflow is such that the minimum daily flow each week commonly occurs on Monday or Tuesday. The flat slope of the duration curve for the Hudson River below the Mohawk River is due in part to the low flow being well maintained by release from storage in Sacandaga Reservoir. (See fig. 18.) Under present conditions of regulation, the flow that was equaled or exceed 95 percent of the time at Green Island is 2,100 mgd.
Floods in this part of the river are affected by storage in Sacandaga Reservoir and to a lesser extent by storage in Hinckley, Delta, Indian Lake, and Schoharie Reservoirs. Floods are most likely to occur during March, April, and May; however, a flood may occur in any month (fig. 26). The highest flood on record since the construction of Sacandaga Reservoir was that of March 1936. Figure 20 shows the highest flood in each year since the construction of Sacandaga Reservoir and figure 27 shows the recurrence interval of floods during water years 1931-55. The profile of selected floods on the Hudson River and their average recurrence intervals are given in figure 22. *

ALBANY-SCHENECTADY-TROY AREA, NEW YORK D49
1 1 1 1 1 1 11936
-7 1 1 1 1
1938 19F
1951
1935 * 2
| «2 1937 19.35
1954 « J2 »«
* * 2 1 I it!i i i i i i i2 1 14 16 8 2 2
JAN. FEB. MAR. APR. MAY JUNE JULY
1945 1932 -2
1 1 1 1 1O 1 2 3 5
AUG. SEPT. OCT. NOV. DEC.NUMBER OF FLOODS FOR MONTHS INDICATED
FIGURE 26. Magnitude and number of floods, by months, Hudson River at Green Island,water years 1931-55.
K 282
1 27_I
y 26
CO
Z 25
1 LU 24
iLU Ll-
z 22
I 2'UJ
20
^ ^
-^^^^
^
/X
xX^ X
X/
//
I 1.5 2 3 4 5 6 7 8 9 10 15 20 2 RECURRENCE INTERVAL, IN YEARS
FIGURE 27. Flood-stage frequency curve, Hudson River at Green Island; based on recordsfor water years 1931^-55.

D50 WATER RESOURCES OF INDUSTRIAL AREAS
The quality of water from the Hudson River from both below and above the Mohawk River is very similar. Analyses of two samples (table 5) indicate that water below the Mohawk River is slightly harder and more mineralized. The pH of one sample was 6.9 and of the other was 7.0. The water is of the calcium bicarbonate type and is satisfactory for most uses.
The temperature of Hudson River water from both below and above the Mohawk River is similar. In 1952 and 1953 it ranged from 32° to 82°F. During 1952 the water temperature was less than 60°F for almost 8 months, and during 1953 it was less than 60°F for a little more than 7 months (fig. 16).
POESTEN KHX
Poesten Kill is a tributary to the Hudson River at Troy. It rises in steep wooded hills and flows through hilly wooded farmland. The lower 2 miles of the stream is in the city of Troy. The city diverts as much as 8 mgd from Quacken Kill, a tributary of Poesten Kill. This diversion is made at a Martin Duhham Reservoir (capacity, 4 million gallons), which impounds water from a drainage area of 11.6 square miles. The diversion has for many years amounted to almost the entire flow of Quacken Kill at that point during periods of low flow.
The flow of Poesten Kill is measured near Troy (table 4; pi. 2). The minimum daily discharge during water years 1924-54 was 1.2 mgd (1.9 cfs) on October 12-14,1930. The drainage basin of Poesten Kill is largely underlain by till and bedrock. Figure 28 shows that the dry-weather flow is moderately well sustained (5.4 mgd at the 95- percent duration point). Low-flow frequency curves are given in figure 29.
Floods on Poesten Kill commonly cause little damage, even within the city of Troy. Cellars near the mouth of the stream occasionally may be flooded and operations at some plants curtailed. The five greatest floods on Poesten Kill at the Troy gage during water years 1924-52 are as follows:
ElevationPeak discharge (feet, city of
Date (cfs) Troy datum)Nov. 4, 1927_____._._________________--. 7,030 329.9Mar. 12, 1936______-_-._.___..___________. 4,750 328.9Sept. 22, 1938...-._____.____.______..__-_- 11, 900 333. 6Mar. 31, 1940______....._____________________ 4,320 328.4Dec. 31, 1948__._._______________________ 10,100 332.7
Water from Poesten Kill has the characteristic good quality of water from other streams in the area. A sample collected on June 21, 1954, had the lowest concentration of dissolved solids and the lowest

3500
2000
1000
500
§
400
</3
£ 200
-
o
100
S,
80
-o
. 50
g
4
0-
<
i JU-
°
20
^
5 \
4
o _
1000
<
300
£E </3
§ <
10
0
o I » ex < « a
10 3
1.5 0.
-
31
O.i
S)
)5 0
V
\i
- 1 0
\ ? 0
X. S
5
Ss 2N
. N. \
N
I
\N
) i
\N
l
0
2
\ -N
0
3
\\
n 4k
\
0
5\S
0 6K.\
0
7\X
0
8\ N
0
9S. N
X.
0
9^
p-^X
5 9
X,
R q^
v^
Q
9C
^ ).5 9
9
S^~
a 99
PE
RC
EN
T O
F T
IME
D
ISC
HA
RG
E
EQ
UA
LED
O
R
EX
CE
ED
ED
T
HA
T
SH
OW
N
FIG
URE
28.
Dura
tion c
urve
of
dail
y fl
ow,
Poe
sten
Kil
l ne
ar T
roy;
bas
ed o
n re
cord
s of
flo
w d
urin
g w
ater
yea
rs 1
924-
54,
from
a dr
aina
ge a
rea
of a
bout
89
squa
re m
iles.
d
Cn

40 i
30-
20-
10
LU
n _
_u.
8
< >
6
,J
5
3
2
1.5-
20
< 6
o S
5
?
3
OB
%On
*,
1.01
1.1
1.2
1.3
1.5
2 3
4
5 6
8
10
R
EC
UR
RE
NC
E
INT
ER
VA
L, I
N
YE
AR
S
20
'
30
40
50
PIG
UEK
29.
Jjo
w-f
low
fre
quen
cy c
urve
s^,
Poe
sten
Kil
l ne
ar T
roy
; ba
sed
on a
reg
iona
l an
alys
is o
f re
cord
s fo
r A
pril
1,
1911
, to
Mar
ch 3
1, 1
955.

ALBANY-SCHENECTADY-TROY AREA, NEW YORK D53
hardness of any water sampled in the area. It also had the lowest alkalinity. An analysis of this sample is given in table 5. Data on the temperature of Poesten Kill water are not available; however, the temperature probably follows the characteristic seasonal pattern of other stream water in the area and averages about the same as the air temperature of the region.
SMAUL STREAMS
The low-flow part of the duration curve and the recurrence interval of low flows have 'been computed for eight small streams by correlat ing a few discharge measurements with the records for nearby streams (tables 6 and 7).
For- these small streams the flow at the 95-percent duration point (flow equaled or exceeded 95 percent of the time) ranges from 0.004 to 1.1 mgd per sq mi of drainage area (table 6). This wide range indicates that the flow of small streams is well sustained in dry weather if the stream drains coarse-grained deposits but is poorly sustained if the stream drains till or fine-grained deposits. No reliable estimate of the low-flow characteristics of an ungaged stream in this area can be made without a few low-flow discharge measurements at the site in question.
Wynants Kill, a tributary to the Hudson Kiver from the east, drains the area immediately south of the Poesten Kill basin. There are several lakes in the Wynants Kill basin, all of which are popular resort areas. The lake levels are regulated during the summer to the best advantage for recreational use. Wynants Kill has 'been, but is no longer, an important source of power.
Base flow of Wynants Kill is sustained at a high level by the lakes, and 'by the high yield of the sandy Wynants Kill kame area, in which about 25 percent of its basin lies. The stream is not included in tables 6 or 7 for lack of sufficient information, but it is estimated that the flow at the 95-percent duration point is more than 5 mgd.
Van Kensselaer Creek drains part of the Albany-Schenectady sand-plain area near Menands. (See pi. 1.) It has an unusually well sustained dry-weather flow of 0.75 mgd per sq mi at the 95-percent duration point. Data on the temperature and quality of the water are not available.
Mill Creek, a small tributary on the east bank of the Hudson Kiver near Rensselaer, drains a basin of rolling farmland that is largely underlain by till. Its dry-weather flow, 0.026 mgd per sq mi at the 95-percent duration point, is much better sustained than some streams such as Lisha Kill and Vloman Kill, but not nearly as well sustained as that of Van Rensselaer Creek and East Branch Hunger Kill.

D54 WATER RESOURCES OF INDUSTRIAL AREAS
Analyses of two samples collected in 1954 indicate that water from Mill Creek is a little harder than water from most other streams in the area for which chemical data are available. The hardness as cal cium carbonate of one sample was 80 ppm and of another 135 ppm. Concentrations of dissolved solids were a little higher than for most small streams in the area, 113 and 190 ppm. However, the water is satisfactory for most uses. Analyses of the two samples are given in table 5.
Temperature of the water taken at the time of sampling is shown in table 5; other temperature data are not available.
East Branch Hunger Kill, a small creek tributary to Normans Kill near Guilderland (pi. 1), drains a part of the Albany-Schenectady sand-plain area. It has a well-sustained dry-weather flow of about 1.1 mgd per sq mi at the 95-percent duration point. East Branch Hunger Kill and Van Rensselaer Creek have the highest sustained dry-weather flow per square mile of any of the streams measured in the Albany-Schenectady-Troy area. Other streams draining similar sand-plain areas probably also have well-sustained flows.
Analyses of two water samples collected during 1954 indicate that the quality of water from East Branch Hunger Kill is about average for the region. The concentrations of dissolved solids were 127 and 136 ppm, hardness as calcium carbonate was 99 and 110 ppm, and color was low (table 5). The temperature of the water sampled was recorded, but other data on water temperature are not available.
Normans Kill, which has the largest drainage basin in this part of the report area, drains an area underlain by several types of water- yielding material. (See pi. 1.) The* flow in the lower part of the basin is regulated by storage and diversion from Watervliet 'Reservoir so that flow figures do not represent, natural yield. Under present conditions of regulation and diversion a flow of about 10 mgd near the mouth at Albany is available 95 percent of the time. Above the
. reservoir the dry-weather flow is poorly sustained with a flow of only 0.006 mgd per sq mi at the 95-percent duration point.
. Moordener Kill, tributary to the Hudson River from the east (pi. 1), drains an area of rolling farmland. The surficial geology of the Moordener Kill drainage basin is different from that of Mill Creek in that the area is partly underlain by till and partly by terrace de posits of Pleistocene sand and gravel. 'Several discharge measure ments made on Moordener Kill, at a site where the drainage area is 29.7 square miles, indicate a flow of 0.037 mgd per sq mi at the 95- percent duration point.
Analyses of two water samples collected during 1954 indicate that quality of water from Moordener Kill is about typical of the small

ALBANY-SCHENECTADY-TROY AEEA, NEW YORK D55
streams sampled in the area. The concentrations of dissolved solids were 96 and 158 ppm; hardness as calcium carbonate was 62 and 119 ppm; and values for color were 10 and 7 units (based on the platinum- cobalt standard). The analyses are given in table 5.
The water temperature was taken at the time of sampling, but other temperature data are not available.
Vloman Kill, a tributary of Hudson River from the west just north of Castleton-on-Hudson (pi. 1), drains farmland and wooded areas. Almost the entire drainage basin is underlain by fine-grained strati fied deposits. Several discharge measurements made at a site where the drainage area is 29.8 square miles show that the dry-weather flow is very poorly sustained, only 0.004 mgd per sq mi at the 95-percent duration point. Such poorly sustained flow is probably typical of drainage basins underlain by fine-grained stratified deposits.
Each of two water samples collected in 1954 had the highest con centration of dissolved solids, 209 ppm, of any water sample from the area. The water was also harder than any other; the hardness ex pressed as calcium carbonate was 167 and 153 ppm. Color was low, 8 and 12. Analyses are given in table 5.
The water 'temperature was taken at the time of sampling, but other temperature data are not available.
Coeymans Creek, a small tributary of .the Hudson River in the vicinity of South Bethlehem has only a moderately well sustained dry-weather flow (0.055 mgd per sq mi at the 95-percent duration point) but because of the relatively large drainage area, the flow at South Bethlehem is one of the largest in the area (1.9 mgd at the 95-percent duration point).
PUBLIC WATER-SUPPLY SYSTEMS
The public water-supply systems may be an economical source of water for industries that require small quantities of water or that require water of good sanitary quality. The major systems in the lower Hudson River subarea are those of Albany, Green Island, McKownville, Rensselaer, Troy, and Watervliet (fig. 17); some of them obtain a major part of their water from outside the areas they serve. Albany's supply is imported into the Albany-Schenectady- Troy area from Alcove Reservoir on Hannacrois Creek (92 percent), and Basic Reservoir on Basic Creek (8 percent). Alcove Reservoir was built in 1930 and has a usable capacity of 12,100 million gallons; Basic Reservoir, built in 1928, has a capacity of 716 million gallons. Additional information is given in taible 8.
An analysis of a sample of finished water from the Albany supply indicated that the water is of excellent chemical quality, somewhat
D56 WATER RESOURCES OF INDUSTRIAL AREAS
less mineralized, and less hard than most of the public supplies in the region (table 9).
Green Island obtains its water from two infiltration galleries lo cated on Center Island in the Hudson River. Water is pumped from the receiving wells to the filtration plant located on Green Island. Ahim and chlorine are applied in the conduit. An analysis of the finished water (table 9) shows that the water was moderately hard (hardness as CaCO3, 128 ppm) and contained 0.4 ppm of iron.
McKownville takes its -waiter from Krum Kill, a small tributary of Normans Kill. An analysis of the water showed a concentration of iron of 0.44 ppm, which is sometimes sufficient to cause staining of bathroom fixtures and other porcelain surfaces. Except for the high concentration of iron in the one sample analyzed, the water was similar to other public water supplies in the area. An analysis of the water is given in table 9.
Rensselaer obtains its water from the Hudson River. A sample of finished water indicated that the water was about typical for the area (table 9).
Troy obtains water from Tomhannock Reservoir on Tomhannock Creek, Martin Dunham Reservoir on Quacken Kill (a tributary of Poesten Kill), and Bradley Lake (Frear Park). The village of Menands obtains its water from Troy. Tomhannock Reservoir has a capacity of 12,000 million gallons and furnishes about TO percent of the city supply. Martin Dunham Reservoir has a capacity of 4 mil lion gallons and supplies the part of Troy about 14th Street, about 30 percent of the water used. Bradley Lake (Frear Park) is used as an auxiliary supply. A sample of finished water from Tomhan nock Reservoir had the lowest content of dissolved solids and hard ness reported for a public water-supply system in the area. Con centration of dissolved solids was 61 ppm, and hardness as calcium carbonate was 40 ppm. An analysis of the water is given in table 9. Descriptive information on the Rensselaer and Troy water sys tems is given in table 8.
Watervliet takes its supply from Watervliet Reservoir on Normans Kill. The reservoir has a usable capacity of 1,500 million gallons and the drainage area above the reservoir is 121 square miles. Additional descriptive information is given in table 8. An analysis of the water indicates that it is a little more mineralized and a little harder than most public supplies in the area. The concentration of dissolved solids was 183 ppm, and hardness expressed as calcium carbonate was 146 ppm. An analysis of the water is given in table 9.

TABL
E 9
. C
hem
ical
ana
lyse
s, i
n pa
rts
per
milU
on, o
f fin
ishe
d w
ater
from
pub
lic w
ater
sup
plie
s
Cit
yD
ate
of
Col
lect
ion
Jan.
16
, 195
2 Ja
n.
16, 1
952
Mar
. 31
, 195
1 O
ct.
21, 1
954
Feb.
28
,195
5 F
eb.
28,1
955
Oct
. 21
,195
4 O
ct.
7, 19
48Ja
n.
23,1
952
Feb.
28
,195
5 O
ct.
20,1
954
£" I 41
39 58
38
37
61 32
' S o 55
55 1.8
5.5
3.2
8.0
6.8
2.6
7.0
3.5
5.0
2.0
Iron
(Fe)
0.00
.0
6 .4
0.0
3 .4
4 .1
0 .1
2 .0
9.0
8 .1
3 .0
3
Manganese
(Mn)
0.00
.0
0
.17
.46
.28
.10
.00
.23
.04
I 2 18
32 36
28
23
18
49
12
22
38
Magnesium
(Mg)
2.2
5.9
7.9
5.0
4.8
3.2
9.1
2.5
3.1
12
Sodium
(Na)
1.7
4.0
2.8
12 2.0
12
9.
2.2
4.6
4.5
Potassium
(K)
0.9
1.1
2.7
2.3
1.7 .9
6 1.
2 1.
8 1.
7
Carbonate
(COs) 0 0 0 0 0 0 0 0 0 0
Bicarbonate (HCO
»)
41
86
173
111 80
37
49
165 33
39
116
Sulfate
(SO*) 21
34 36
30
47
34
31
14
36
51
Chloride (Cl)
2.4
5.1
17 3.2
14 2.0
9.3
9.0
3.1
7.6
6.9
Fluoride
(F)
0.0 .0
.05
.1
.0
.0
.0
.1
.1
.0
.1
Nitrate
(NOa)
0.2
1.4
1.0 .5
1.8
1.1 .6
.2
1.3
1.2 .5
Dissolved
solids (resid
ue on evap oratio
n at
180°C
)
70
132
165
173
117
119
197 61
110
183
Har
dnes
s as
CaC
Oa
tL 6 54
105
128
123 91
77
58
160 41
68
145
it
Jj 21
34 32 25
47
18
25
14
36
50
Turbidity
4.2
6.5
Specific
conduct ance (micromh
os at
26°C)
122
222
249
245
174
187
342
98.6
16
8 29
7
a 8.1
7.1
7.1
7.2
7.2
6.7
6.9
7.7
6.9
7.3
7.7
3 a 2 4 5 10
17 3 17 2 4 7 7
i Ana
lysi
s of
fin
ishe
d w
ater
by
the
New
Yor
k S
tate
Dep
artm
ent
of H
ealt
h.
Rep
orte
d ha
rdne
ss is
tot
al h
ardn
ess
as C
aCO
j. *
Fini
shed
wat
er f
rom
Tom
hann
ock
Res
ervo
ir.

D58 WATER RESOURCES OF INDUSTRIAL AREAS
PRESENT USE OF WATER
About 829 mgd was used in the Albany-Schenectady-Troy area during 1953 (table 10). Industry used about 765 of the 829 mgd. Most of the remainder, about 64 mgd, was used for domestic, rural, and stock supplies (fig. 30). A very small quantity was used for irrigation.
/ Domestic use, public use,\_' and leakage -"^
/ (61 mgd)
PUBLIC-SUPPLIED USE
' s<Tface water
SELF-SUPPLIED USE
FIGUEB 30. Water used during 1953.
Public water supplies furnished about 91 mgd to more than 90 percent of the population of the area. About 20 percent of the water furnished by the Albany public water-supply system was used by industry and about 80 percent for domestic purposes. About 40

ALBANY-SCHENECTADY-TROY AREA, NEW YORK D59
percent of the water delivered by the other two large systems in the area, Troy and Schenectady, was used by industry, and about 40 percent of the water furnished by the Latham system also was used by industry. The approximate percentages of water furnished to industry by other water supplies in the area were as follows: Oohoes, 75 percent; Rensselaer, Waterford and Watervliet, 50 percent; Green Island, 45 percent; and Mechanicville, 22 percent. All water dis tributed by the McKownville Water District was used for domestic purposes.
TABLE 10. Average use of water in the Albany-Schenectady-Troy area in 1963, inmillion gallons per day
Use
Domestic, public, and leakage __ __ _ __ ___
Industrial. __ _ _ _ __Rural domestic _ __ _ __
Total
From, public supply 1
Surface water
44.8 18.3
63.1
Ground water
16.1 12. 2
28.3
Total
60.9 30.5
91. 4
Self-supplied
Surface water
732.3
732.3
Ground water
2.1 3
5.1
Total
734.4 3
737.4
Total
60.9 764.9
3
828. 8
1 Includes public supplies listed In table 8 and other smaller public supplies.
Industries used about 734 mgd of self-supplied water during 1953. About 715 mgd of this was withdrawn from the Hudson and Mohawk Rivers, 17 mgd from small streams, and about 2.1 mgd from wells.
Industry uses water for cooling, boiler feed, in manufacturing pro cesses, and for sanitary and service needs. Table 11 shows the quantity of water used by the major type of industries inventoried in the area and the percentage used for different purposes. The data include water from all sources; however, most of it was self-supplied. Most of the water was used for cooling (629 of 765 mgd). The steam- electric plant of the Niagara Mohawk Power Corp. at Glenmont is the largest single user of water in the area; 523 mgd is withdrawn from the Hudson River, but most of it is returned to the river after cooling the condensers. About one-third of the ground water was used as process water in the manufacture of electrical machinery. In dustry uses about 15 percent more water in summer than in winter, the result of greater demand for air conditioning and refrigeration.
About 48,000 people in the Albany-Schenectady-Troy area live out side areas served by public water-supply systems and must obtain their water from individually owned sources* generally wells and springs.

D60 WATER RESOURCES OF INDUSTRIAL AREAS
TABLE 11. Use of water by selected industries, 1958
Type of industry
Manufacturing of textiles and clothing ..... Food processing. __ ___ __ .....
Brewing _ . ... ______ _ ...Manufacture of ice.-.. __ ______
Manufacture of paper and paper products- . Transportation (operations)-- _______Steel--.. . _ _____ _ _Heavy industry (except electrical ma
chinery). -. __ _ . _____ _Metal fabrication (except electrical ma-
Manufacture of electrical machinery _ ...Generation and distribution of electricity
and distribution of gas ______ . .Printing and publishing .................
All types-. _______________
Total use (mgd)
1.79 2.24 .21
1.05 .31
13.71 66.75 1.90 6.69
14.94
1.39125.31
525. 02 .83
2.92
755
Purpose for which water was used (percentage of total)
Cooling
10.4 27.8 16.0 20.5 16.6 80.5 29.3 16.2 80.6
25.1
39.0 85.9
91.7 55.7 16.3
83.4
Processing
69.2 45.9 37.7 49.6 82.1 12.4 67.8 16.8 9.5
35.0
26.0 8.3
8.2 5.7
71.6
13.9
Boiler feed
7.2 9.9 1.5
14.7 .6
3.6 2.5
43.4 7.9
.2
15.0 1.9
.1 4.8 2.8
0.9
Sanitary and service
13.2 16.4 44.8 15.2
.7 3.5 .4
23.6 2.0
39.7
20.0 3.9
0 33.8 9.3
1.8
It is estimated that this group of people use about 3 mgd. This figure includes the use of water for residences and farms but does not include use of water for irrigation or livestock.
A small amount of water is used in the area for irrigating truck gardens, golf courses, and lawns. Some of the water is drawn from privately owned wells, but a large part of it is drawn from public sys tems supplied from ground-water or surface-water sources. Several truck farms are irrigated with water from the Latham Water District.
POSSIBILITY OF FURTHER DEVELOPMENT
The Albany-Schenectady-Troy area has an abundant supply of water. Only a small fraction of the river water is withdrawn, and most of the water withdrawn is not consumed. Large quantities of ground water may be obtained wherever deposits of coarse-grained sand and gravel exist along the main river channels or in the pre- glacial buried valleys and especially where induced recharge from streams is possible.
The average temperature of surface water in the area is about 52°F, nearly the same as that of water from wells. The temperature of river water ranges from the freezing point to slightly more than 80°F. The temperature of ground water from heavily pumped wells near the Mohawk River ranges from about 40° to about 65°F. The temperature of water from other wells averages about 49°F and fluctuates only 4° to 6°F.
Water from sand and gravel is generally moderately hard to hard; it is slightly harder and more mineralized than surface water. Water

ALBANT-SCHENECTADY-TROY AREA, NEW YORK D61
from bedrock formations generally is even harder and more mineral ized.
MOHAWK RIVER VALLEY
Present withdrawals of water from the Mohawk River is only a small part of the flow, and most of the water withdrawn is not con sumed. The flow above Crescent Dam equals or exceeds 580 mgd 95 percent of the time. Part of the flow of the river is diverted into the Erie (Barge) Canal at Crescent Dam during the navigation season. The flow below Crescent Dam equals or exceeds 450 mgd 95 percent of the time.
Mohawk River water has such a low mineral content that it is satis factory for most uses. It is moderately hard, and treatment is neces sary if soft water is required.
The flood plain of the Mohawk River between Hoffmans and Sche- nectady is one of the best areas for further development of large quan tities of ground water. In some places the aquifers are hydraulically connected with the river, which permits recharge of the aquifers with river water. Wells in the sand and gravel deposits of the flood plain near lock 8 yield as much as 3,600 gpm. Wells in other parts of the flood plain yield 2 to 1,500 gpm and average 280 gpm. Ground- water development is also feasible from the sand and gravel deposits beneath the alluvium between Vischer Ferry and Mohawk View where the Colonie channel crosses the Mohawk River.
Water from the unconsolidated deposits has about the same chemical quality as water from the Mohawk River, especially where pumping has induced infiltration of river water.
HUDSON RIVER VALLEY
Present withdrawal from the Hudson River is only a small part of the flow and most of the water withdrawn is not consumed. The flow above the Mohawk River equals or exceeds 1,300 mgd 95 percent of the time, and the flow below the river equals or exceeds 2,100 mgd 95 percent of the time. Water from the Hudson River seems to be slightly less mineralized and softer than water from the Mohawk River.
The valley fill of the Hudson River flood plain is mostly clay and silt; however, at some places the silt and clay is interstratified with water-bearing sand and gravel. Tests by industry (p. 45) have indi cated that wells yielding as much as 5,700 gpm could be developed at one site where the sand and gravel aquifer is hydraulically connected to the river. Where the aquifer is not connected to the river, wells probably would yield 75 to 350 gpm. The quality of water from the

D62 WATER*RESOURCES OF INDUSTRIAL AREAS
alluvium is similar to that of the river water, especially where infiltration has been induced.
HOOSIC RIVER BASIN
The dry weather flow of the Hoosic River near Eagle Bridge is well sustained; it equals or exceeds 0.18 mgd per sq mi 95 percent of the time. Powerplants at Johnsonville and Schaghticoke cause a diurnal fluctuation and some regulation at low flows. Water from the Hoosic River seems to be slightly harder and a little more alkaline than Hudson River water.
The unconsolidated deposits in the Hoosic delta are not sufficiently saturated to be a source of large quantities of water.
BTTRIED-CHANNEL AND OTHER COARSE-GRAINED DEPOSITS
The norhern reaches of the Oolonie channel are a source of moder ately large quantities of ground water. Wells in this channel range in depth from 48 to 244 feet and yield as much as 700 gpm near the axis of the channel. Deposits south of the village of Shakers are less favorable for large yields. Other buried channels in the area contain fine-grained deposits that are not likely to yield large quantities of water.
Water from the buried channels is likely to be slightly harder and more mineralized than water from the Mohawk or Hudson Rivers. A few wells will yield water containing objectionable quantities of iron.
Other coarse-grained deposits, such as those in the sand-plain and kame areas, and deltaic and terrace deposits may yield moderate quantities of water. The most favorable areas for further development are the Albany-Schenectady sand plain, the Wynants Kill kame area, and the Schodack terrace. Wells in these areas yield as much as 150 gpm. Other deposits are either developed or their capabilities are not known. Further exploration of these deposits may reveal that addi tional water could be developed. The chemical character of water from the coarse-grained deposits is similar to that of water from the buried channels.
SMALL STREAMS
The possibility of developing further supplies from the small streams in the report area depends on their flow characteristics, which in turn depend on the storage and release of water by the aquifers that supply the dry-weather flow. However, the yields show only in a general way a relation with the underlying aquifers that are shown on plate 1. Hence the only way to determine the quantity of water avail-

ALBANY-SCHENECTADY-TROY AREA, NEW YORK D63
able at a particular site is to make measurements of discharge during periods of low flow, and relate the results to the streamflow on the same day at other stream-gaging stations in the area.
Low-flow characteristics of 14 small streams in the report area deter mined in this way are shown in tables 6 and 7. These show that the flow available 95 percent of the time exceeds 1 mgd at some sites on Alplaus Kill, Coeymans Creek, and Normans, East Branch Hunger, Moordener, and Anthony Kills.
PUBLIC WATER-SUPPLY SYSTEMS
The public water supply systems may be the cheapest and most satis factory source of small quantities of water for industrial use or good- quality water for other uses. The capacities of the systems of most of the large cities exceed present peak demands, and adequate water is available to permit expansion of the system. Some of the smaller cities, however, are finding it more and more difficult to supply sufficient quantities of water of good quality.
The finished water from the public-supply systems is similar to the water withdrawn from wells and streams, and it meets all U.S. Public Health Service standards.
SELECTED REFERENCES
Arnow, Theodore, 1949, The ground-water resources of Albany County, N.Y.;New York Water Power and Control Comm. Bull. GW-20, 56 p.
Cook, J. H., 1930, Glacial geology of the Capital District, in Ruedemann, Rudolf,Geology of the Capital District: New York State Mus. Bull. 285, p. 181-199.
Cushman, R. V., 1950, The ground-water resources of Rensselaer County, N.Y.:New York Water Power and Control Comm. Bull. GW-21, 56 p.
Knox, C. E., 1956, Index of surface-water records, pt. 1, North Atlantic slopebasins, to September 30, 1955: U.S. Geol. Survey Circ. 381, 30 p.
Knox, C. E., and Nordenson, T. J., 1955, Average annual runoff and precipitationin the New England-New York area: U.S. Geol. Survey Hydrologic AtlasHA 7, 6 p.
Lohr, E. W., and Love, S. K., 1954, The industrial utility of public water sup plies in the United States, 1952, pt. 1, States east of the Mississippi River:U.S. Geol. Survey Water-Supply Paper 1299, 639 p.
New York State Water Pollution Control Board, 1950, Rules and classificationsand standards of quality and purity for water of New York State: OfficePublic Health Education, New York State Dept. Health, 14 p.
1952, The Mohawk River drainage basin: recommended classificationsand assignments of standards of quality and purity for designated watersof New York State: Mohawk River Drainage Basin Survey Series, rept. 2,245 p.
Ruedemann, Rudolf, 1930, Geology of the Capital District: New York State Mus.Bull. 285, 218 p.
Sinipson, E. S., 1949, Buried preglacial ground-water channels in the Albany-Schenectady area in New York: Econ. Geology, v. 44, no. 8, p. 713-720.

D64 WATER RESOURCES OF INDUSTRIAL AREAS
Simpson, E. S., 1952. The ground-water resources of Schenectady County, N.Y.: New York Water Power and Control Comm. Bull. GW-30, 110 p.
Sirnpson, E. S., Beetem, W. A., Buggies, F. H., Jr., and others, 1959, Hydrologic and tracer studies in the Mohawk River at Knolls Atomic Power Laboratory: U.S. Atomic Energy Comm., Research and Development Rept. 50-45, p. 285.
Stoller, J. H., 1911, Glacial geology of the Schenectady quadrangle: New York State Mus. Bull. 15, 44 p.
1920, Glacial geology of the Cohoes quadrangle: New York State Mus.Bull. 215, 216,47 p.
Thomas, N. D. and Harbeck, G. E., Jr., 1956, Reservoirs in the United States;U.S. Geological Survey Water-Supply Paper 1360-A, p. 1-99.
U.S. Geological Survey, Quality of surface waters of the United States, pt. 1-4,North Atlantic slope basins to St. Lawrence River basin: issued annually asU.S. Geol. Survey Water-Supply Papers.
Surface-water supply of the United States, pt. 1, North Atlantic slope basins and pt. 1-B North Atlantic slope basins, New York to York River: issued annually as U.S. Geol. Survey Water-Supply Papers.
Water levels and artesian pressures in observation wells in the UnitedStates, pt. 1, Northeastern States: issued annually as U.S. Geol. Survey Water-Supply Papers.
Woodworth, J. B., 1905, Ancient water levels of the Champlain and Hudson Valleys: New York State Mus. Bull. 84,265 p.
U.S. GOVERNMENT PRINTING OFFICE: 1964 O 695-925