water resources of morehouse parish, louisianau.s. department of the interior u.s. geological survey...
TRANSCRIPT
U.S. Department of the InteriorU.S. Geological Survey
Fact Sheet 2018-3068June 2019
Prepared in cooperation with the Louisiana Department of Transportation and Development
Water Resources of Morehouse Parish, Louisiana
Introduction Information concerning the availability, use, and quality of
water in Morehouse Parish, Louisiana (fig. 1), is critical for proper water-supply management. The purpose of this fact sheet is to present information that can be used by water managers, parish residents, and others for stewardship of this vital resource. In 2014, 109.84 million gallons per day (Mgal/d) of water were withdrawn in Morehouse Parish: 78.05 Mgal/d from groundwater sources and 31.79 Mgal/d from surface-water sources1 (table 1). Withdrawals for agricultural use—including general irrigation, rice irrigation,
and livestock—accounted for about 97 percent (106.29 Mgal/d) of the total water withdrawn (table 2). Other categories of use included public supply, rural domestic, and industrial. Water-use data collected at 5-year intervals from 1960 to 2010 and again in 2014 indicated that water withdrawals peaked in 1975 at 167.82 Mgal/d (fig. 2).
1Water-withdrawal data are based on estimated or reported site-specific data and aggregated data, which are distributed to sources. For a full description of water-use estimate methodology, see “Data Collection” in Sargent (2011). Tabulation of numbers in text and tables may result in different totals because of rounding; nonrounded numbers are used for calculation of totals.
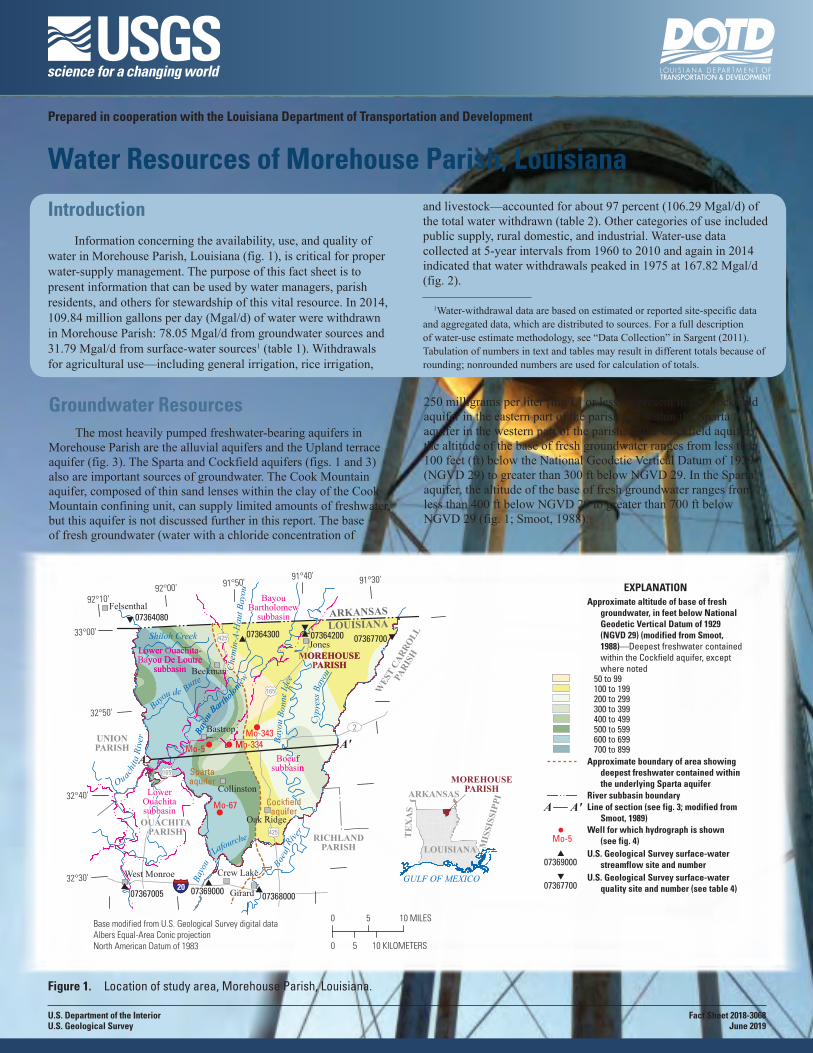
Figure 1. Location of study area, Morehouse Parish, Louisiana.
0 5 10 MILES
0 5 10 KILOMETERS
165
165
20
2
425
425
A'AA
Spartaaquifer
Cockfieldaquifer
Cockfieldaquifer
07369000 07368000
07364300 07364200
07364080
07367005
07367700
07369000 07368000
07364300 07364200
07364080
07367005
07367700
Mo-67
Mo-5Mo-5 Mo-334Mo-334Mo-343Mo-343Bastrop
West Monroe
Beekman
Crew LakeCrew Lake
GirardGirard
Oak Ridge
Jones
Felsenthal
Collinston
LOUISIANAARKANSAS
RICHLANDPARISH
WES
T CARROLL
PARIS
H
OUACHITAPARISH
UNIONPARISH
MOREHOUSEPARISH
RICHLANDPARISH
WES
T CARROLL
PARIS
H
OUACHITAPARISH
UNIONPARISH
MOREHOUSEPARISH
Lower Ouachita-Bayou De Loutre
subbasin
LowerOuachitasubbasin
BayouBartholomew
subbasin
Boeufsubbasin
Lower Ouachita-Bayou De Loutre
subbasin
LowerOuachitasubbasin
BayouBartholomew
subbasin
Boeufsubbasin
Bayo
u L
afourche
Bayo
u L
afourche
Boeuf
River
Boeuf
River
Ouachi
ta R
iver
Bayo
u Barth
olomew
Bayo
u Barth
olomew
Chem
in-A
-Hau
t Bay
ouCh
emin
-A-H
aut B
ayou
Bayou de Butte
Shiloh Creek
Cyp r
ess B
ayou
Bayo
u Bo
nne I
dee
91°30'
32°40'
32°30'
33°00'
32°50'
91°40'91°50'
92°00'92°10' Approximate altitude of base of fresh
groundwater, in feet below National Geodetic Vertical Datum of 1929 (NGVD 29) (modified from Smoot, 1988)—Deepest freshwater containedwithin the Cockfield aquifer, except where noted
50 to 99100 to 199200 to 299300 to 399400 to 499500 to 599600 to 699700 to 899
Approximate boundary of area showing deepest freshwater contained within the underlying Sparta aquifer
River subbasin boundaryLine of section (see fig. 3; modified from
Smoot, 1989)Well for which hydrograph is shown
(see fig. 4)U.S. Geological Survey surface-water
streamflow site and numberU.S. Geological Survey surface-water
quality site and number (see table 4)
EXPLANATION
A'A
Mo-5
07369000
07367700
Base modified from U.S. Geological Survey digital dataAlbers Equal-Area Conic projectionNorth American Datum of 1983
GULF OF MEXICO
TE
XA
S
MIS
SISS
IPPI
ARKANSAS
LOUISIANA
MOREHOUSEPARISH
Groundwater Resources The most heavily pumped freshwater-bearing aquifers in
Morehouse Parish are the alluvial aquifers and the Upland terrace aquifer (fig. 3). The Sparta and Cockfield aquifers (figs. 1 and 3) also are important sources of groundwater. The Cook Mountain aquifer, composed of thin sand lenses within the clay of the Cook Mountain confining unit, can supply limited amounts of freshwater, but this aquifer is not discussed further in this report. The base of fresh groundwater (water with a chloride concentration of
250 milligrams per liter [mg/L] or less) is present in the Cockfield aquifer in the eastern part of the parish and within the Sparta aquifer in the western part of the parish. In the Cockfield aquifer, the altitude of the base of fresh groundwater ranges from less than 100 feet (ft) below the National Geodetic Vertical Datum of 1929 (NGVD 29) to greater than 300 ft below NGVD 29. In the Sparta aquifer, the altitude of the base of fresh groundwater ranges from less than 400 ft below NGVD 29 to greater than 700 ft below NGVD 29 (fig. 1; Smoot, 1988).

GroundwaterSurface water
EXPLANATION
1960 1965 1970 1975 1980 1985 1990 1995 2000 2005 2010 2014
Year
Annu
al w
ithdr
awal
, in
mill
ion
gallo
ns p
er d
ay
180
0
20
40
60
80
100
120
140
160
Figure 2. Water withdrawals in Morehouse Parish, Louisiana, 1960–2014 (U.S. Geological Survey, 2016; Collier, 2018).
Figure 3. Idealized west-to-east hydrogeologic section through Morehouse Parish, Louisiana, showing aquifer and confining unit intervals (individual sand and clay layers not shown). Trace of section shown on figure 1.
Table 1. Water withdrawals, in million gallons per day, by source in Morehouse Parish, Louisiana, 2014 (Collier, 2018).
Aquifer or surface-water body
Groundwater Surface water
Mississippi River alluvial aquifer
69.30
Cockfield aquifer 0.27Upland terrace aquifer 8.24Sparta aquifer 0.24Ouachita River 14.39Boeuf River 2.61Miscellaneous surface waters 14.79Total 78.05 31.79
Table 2. Water withdrawals, in million gallons per day, by use category in Morehouse Parish, Louisiana, 2014 (Collier, 2018).
[<, less than]
Use category Groundwater Surface water Total
Public supply 3.38 0.00 3.38Rural domestic 0.16 0.00 0.16Livestock 0.01 <0.01 <0.01Industrial <0.01 0.00 <0.01Rice irrigation 42.31 28.21 70.52General irrigation 32.18 3.58 35.76Total 78.05 31.79 109.84
Hydrogeologic unit (modified from Smoot, 1988, 1989)
Aquifer containing freshwater—Freshwatercontains a chloride concentration of 250 milligrams per liter or less
Aquifer containing saltwaterConfining unit
Hydrogeologic contact (modified from Smoot,1989)—Separates hydrogeologic units
Approximate freshwater/saltwater interface(modified from Smoot, 1988, 1989)
EXPLANATION
NGVD 29, National Geodetic Vertical Datum of 1929
VERTICAL SCALE GREATLY EXAGGERATED
0 5 10 MILES
0 5 10 KILOMETERS
MO
RE
HO
USE
PAR
ISH
MO
RE
HO
USE
PAR
ISH
UN
ION
PA
RIS
H
WE
ST C
AR
RO
LL
PAR
ISH
Midway confining unit
Sparta aquifer
Cook Mountain confining unit
Cockfield aquifer
MississippiRiver
alluvialaquifer
OuachitaRiver
alluvialaquifer
Uplandterraceaquifer
Cane River confining unit
Carrizo-Wilcox aquifer
A A'
Boeu
f Riv
er
Oua
chita
Riv
er
Bayo
u Ba
rtho
lom
ew
Bayo
u Bo
nne
Idee
NGVD 29
500FEET
500
1,000
1,500
2,000
NGVD 29
500FEET
500
1,000
1,500
2,000
EASTWEST
Alluvial Aquifers
The alluvial aquifers include the Mississippi River alluvial aquifer (called the Mississippi River Valley alluvial aquifer in many publications) on the eastern side of the parish and the much smaller Ouachita River alluvial aquifer in the vicinity of the valleys of the Ouachita River and Bayou Bartholomew. The alluvial aquifers are hydraulically connected to one another and to the Upland terrace
aquifer, where present, and the underlying Cockfield aquifer (Sanford, 1972; Seanor and Smoot, 1995).
The Mississippi River alluvial aquifer is composed of the sand and gravel part of the alluvial sediments deposited primarily by the Mississippi River, and the alluvial deposit thickness generally ranges from less than 80 ft in the south-central part of the parish to greater than 120 ft in the southern part (Whitfield, 1975). The altitude of the base of the aquifer ranges from greater than NGVD 29 in the northeastern part of the parish to greater than 40 ft below NGVD 29 in the central part and along the southeastern border of the parish (Whitfield, 1975).
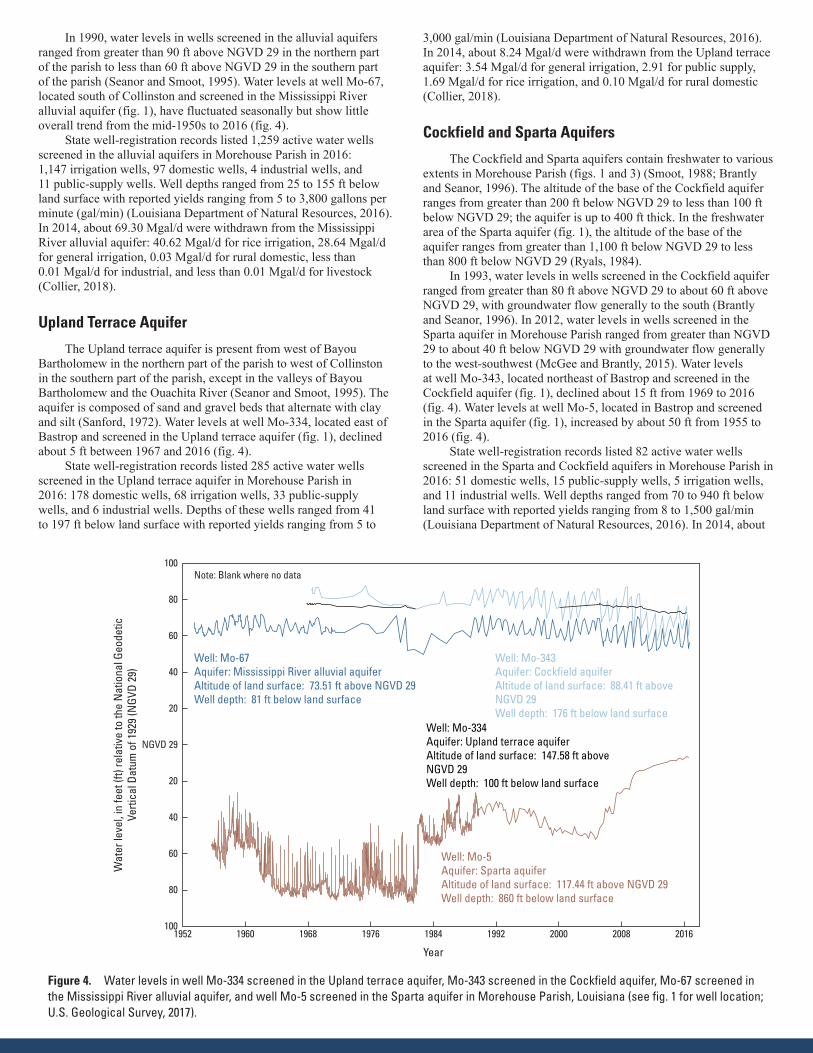
In 1990, water levels in wells screened in the alluvial aquifers ranged from greater than 90 ft above NGVD 29 in the northern part of the parish to less than 60 ft above NGVD 29 in the southern part of the parish (Seanor and Smoot, 1995). Water levels at well Mo-67, located south of Collinston and screened in the Mississippi River alluvial aquifer (fig. 1), have fluctuated seasonally but show little overall trend from the mid-1950s to 2016 (fig. 4).
State well-registration records listed 1,259 active water wells screened in the alluvial aquifers in Morehouse Parish in 2016: 1,147 irrigation wells, 97 domestic wells, 4 industrial wells, and 11 public-supply wells. Well depths ranged from 25 to 155 ft below land surface with reported yields ranging from 5 to 3,800 gallons per minute (gal/min) (Louisiana Department of Natural Resources, 2016). In 2014, about 69.30 Mgal/d were withdrawn from the Mississippi River alluvial aquifer: 40.62 Mgal/d for rice irrigation, 28.64 Mgal/d for general irrigation, 0.03 Mgal/d for rural domestic, less than 0.01 Mgal/d for industrial, and less than 0.01 Mgal/d for livestock (Collier, 2018).
Upland Terrace Aquifer
The Upland terrace aquifer is present from west of Bayou Bartholomew in the northern part of the parish to west of Collinston in the southern part of the parish, except in the valleys of Bayou Bartholomew and the Ouachita River (Seanor and Smoot, 1995). The aquifer is composed of sand and gravel beds that alternate with clay and silt (Sanford, 1972). Water levels at well Mo-334, located east of Bastrop and screened in the Upland terrace aquifer (fig. 1), declined about 5 ft between 1967 and 2016 (fig. 4).
State well-registration records listed 285 active water wells screened in the Upland terrace aquifer in Morehouse Parish in 2016: 178 domestic wells, 68 irrigation wells, 33 public-supply wells, and 6 industrial wells. Depths of these wells ranged from 41 to 197 ft below land surface with reported yields ranging from 5 to
3,000 gal/min (Louisiana Department of Natural Resources, 2016). In 2014, about 8.24 Mgal/d were withdrawn from the Upland terrace aquifer: 3.54 Mgal/d for general irrigation, 2.91 for public supply, 1.69 Mgal/d for rice irrigation, and 0.10 Mgal/d for rural domestic (Collier, 2018).
Cockfield and Sparta Aquifers
The Cockfield and Sparta aquifers contain freshwater to various extents in Morehouse Parish (figs. 1 and 3) (Smoot, 1988; Brantly and Seanor, 1996). The altitude of the base of the Cockfield aquifer ranges from greater than 200 ft below NGVD 29 to less than 100 ft below NGVD 29; the aquifer is up to 400 ft thick. In the freshwater area of the Sparta aquifer (fig. 1), the altitude of the base of the aquifer ranges from greater than 1,100 ft below NGVD 29 to less than 800 ft below NGVD 29 (Ryals, 1984).
In 1993, water levels in wells screened in the Cockfield aquifer ranged from greater than 80 ft above NGVD 29 to about 60 ft above NGVD 29, with groundwater flow generally to the south (Brantly and Seanor, 1996). In 2012, water levels in wells screened in the Sparta aquifer in Morehouse Parish ranged from greater than NGVD 29 to about 40 ft below NGVD 29 with groundwater flow generally to the west-southwest (McGee and Brantly, 2015). Water levels at well Mo-343, located northeast of Bastrop and screened in the Cockfield aquifer (fig. 1), declined about 15 ft from 1969 to 2016 (fig. 4). Water levels at well Mo-5, located in Bastrop and screened in the Sparta aquifer (fig. 1), increased by about 50 ft from 1955 to 2016 (fig. 4).
State well-registration records listed 82 active water wells screened in the Sparta and Cockfield aquifers in Morehouse Parish in 2016: 51 domestic wells, 15 public-supply wells, 5 irrigation wells, and 11 industrial wells. Well depths ranged from 70 to 940 ft below land surface with reported yields ranging from 8 to 1,500 gal/min (Louisiana Department of Natural Resources, 2016). In 2014, about
Year
1952 1960 1968 1976 1984 1992 2000 2008 2016100
80
60
40
20
NGVD 29
20
40
60
80
100
Well: Mo-67 Aquifer: Mississippi River alluvial aquiferAltitude of land surface: 73.51 ft above NGVD 29Well depth: 81 ft below land surface
Well: Mo-5 Aquifer: Sparta aquiferAltitude of land surface: 117.44 ft above NGVD 29Well depth: 860 ft below land surface
Well: Mo-334 Aquifer: Upland terrace aquiferAltitude of land surface: 147.58 ft above NGVD 29Well depth: 100 ft below land surface
Well: Mo-343 Aquifer: Cockfield aquiferAltitude of land surface: 88.41 ft above NGVD 29Well depth: 176 ft below land surface
Wat
er le
vel,
in fe
et (f
t) re
lativ
e to
the
Nat
iona
l Geo
detic
Verti
cal D
atum
of 1
929
(NGV
D 29
)
Note: Blank where no data
Figure 4. Water levels in well Mo-334 screened in the Upland terrace aquifer, Mo-343 screened in the Cockfield aquifer, Mo-67 screened in the Mississippi River alluvial aquifer, and well Mo-5 screened in the Sparta aquifer in Morehouse Parish, Louisiana (see fig. 1 for well location; U.S. Geological Survey, 2017).
0.51 Mgal/d were withdrawn from these aquifers in Morehouse Parish: 0.48 Mgal/d for public supply, 0.03 Mgal/d for rural domestic, and less than 0.01 Mgal/d for livestock (Collier, 2018).
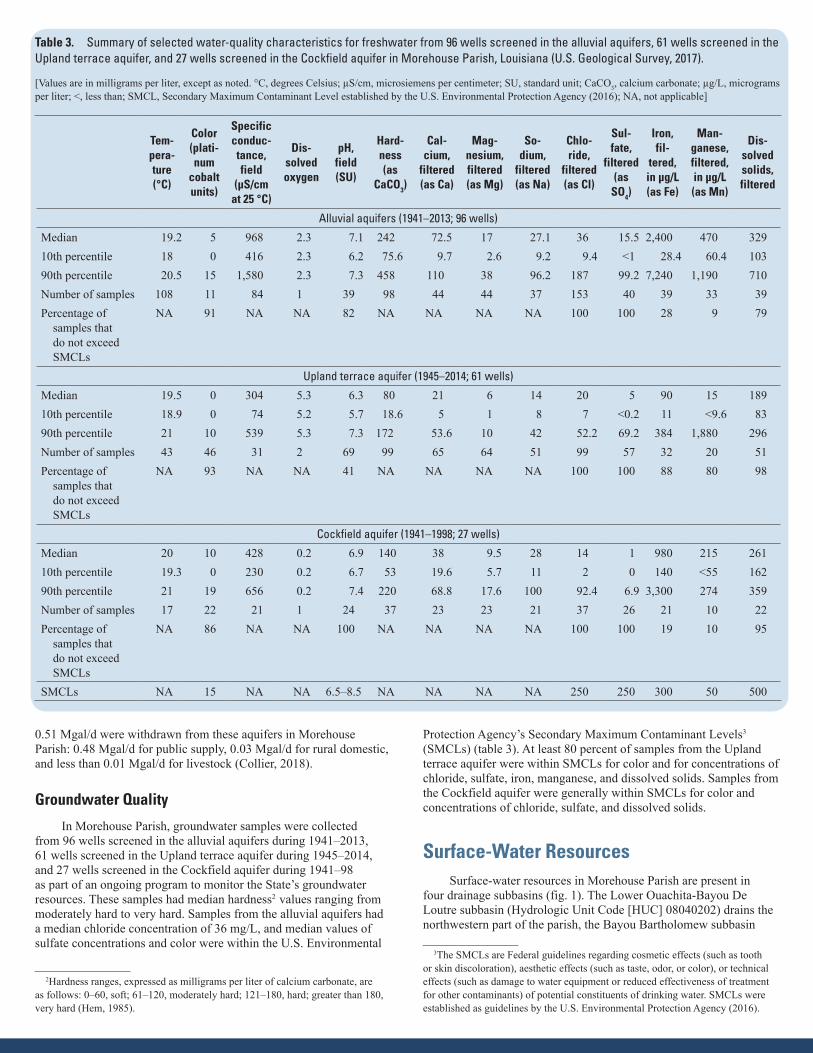
Groundwater Quality
In Morehouse Parish, groundwater samples were collected from 96 wells screened in the alluvial aquifers during 1941–2013, 61 wells screened in the Upland terrace aquifer during 1945–2014, and 27 wells screened in the Cockfield aquifer during 1941–98 as part of an ongoing program to monitor the State’s groundwater resources. These samples had median hardness2 values ranging from moderately hard to very hard. Samples from the alluvial aquifers had a median chloride concentration of 36 mg/L, and median values of sulfate concentrations and color were within the U.S. Environmental
2Hardness ranges, expressed as milligrams per liter of calcium carbonate, are as follows: 0–60, soft; 61–120, moderately hard; 121–180, hard; greater than 180, very hard (Hem, 1985).
Protection Agency’s Secondary Maximum Contaminant Levels3 (SMCLs) (table 3). At least 80 percent of samples from the Upland terrace aquifer were within SMCLs for color and for concentrations of chloride, sulfate, iron, manganese, and dissolved solids. Samples from the Cockfield aquifer were generally within SMCLs for color and concentrations of chloride, sulfate, and dissolved solids.
Surface-Water Resources Surface-water resources in Morehouse Parish are present in
four drainage subbasins (fig. 1). The Lower Ouachita-Bayou De Loutre subbasin (Hydrologic Unit Code [HUC] 08040202) drains the northwestern part of the parish, the Bayou Bartholomew subbasin
3The SMCLs are Federal guidelines regarding cosmetic effects (such as tooth or skin discoloration), aesthetic effects (such as taste, odor, or color), or technical effects (such as damage to water equipment or reduced effectiveness of treatment for other contaminants) of potential constituents of drinking water. SMCLs were established as guidelines by the U.S. Environmental Protection Agency (2016).
Table 3. Summary of selected water-quality characteristics for freshwater from 96 wells screened in the alluvial aquifers, 61 wells screened in the Upland terrace aquifer, and 27 wells screened in the Cockfield aquifer in Morehouse Parish, Louisiana (U.S. Geological Survey, 2017).
[Values are in milligrams per liter, except as noted. °C, degrees Celsius; µS/cm, microsiemens per centimeter; SU, standard unit; CaCO3, calcium carbonate; µg/L, micrograms per liter; <, less than; SMCL, Secondary Maximum Contaminant Level established by the U.S. Environmental Protection Agency (2016); NA, not applicable]
Tem-pera-ture (°C)
Color (plati-num
cobalt units)
Specific conduc-tance, field
(µS/cm at 25 °C)
Dis-solved oxygen
pH, field (SU)
Hard-ness (as
CaCO3)
Cal-cium,
filtered (as Ca)
Mag-nesium, filtered (as Mg)
So-dium,
filtered (as Na)
Chlo-ride,
filtered (as Cl)
Sul-fate,
filtered (as
SO4)
Iron, fil-
tered, in µg/L (as Fe)
Man-ganese, filtered, in µg/L (as Mn)
Dis-solved solids, filtered
Alluvial aquifers (1941–2013; 96 wells)
Median 19.2 5 968 2.3 7.1 242 72.5 17 27.1 36 15.5 2,400 470 32910th percentile 18 0 416 2.3 6.2 75.6 9.7 2.6 9.2 9.4 <1 28.4 60.4 10390th percentile 20.5 15 1,580 2.3 7.3 458 110 38 96.2 187 99.2 7,240 1,190 710Number of samples 108 11 84 1 39 98 44 44 37 153 40 39 33 39Percentage of
samples that do not exceed SMCLs
NA 91 NA NA 82 NA NA NA NA 100 100 28 9 79
Upland terrace aquifer (1945–2014; 61 wells)
Median 19.5 0 304 5.3 6.3 80 21 6 14 20 5 90 15 18910th percentile 18.9 0 74 5.2 5.7 18.6 5 1 8 7 <0.2 11 <9.6 8390th percentile 21 10 539 5.3 7.3 172 53.6 10 42 52.2 69.2 384 1,880 296Number of samples 43 46 31 2 69 99 65 64 51 99 57 32 20 51Percentage of
samples that do not exceed SMCLs
NA 93 NA NA 41 NA NA NA NA 100 100 88 80 98
Cockfield aquifer (1941–1998; 27 wells)
Median 20 10 428 0.2 6.9 140 38 9.5 28 14 1 980 215 26110th percentile 19.3 0 230 0.2 6.7 53 19.6 5.7 11 2 0 140 <55 16290th percentile 21 19 656 0.2 7.4 220 68.8 17.6 100 92.4 6.9 3,300 274 359Number of samples 17 22 21 1 24 37 23 23 21 37 26 21 10 22Percentage of
samples that do not exceed SMCLs
NA 86 NA NA 100 NA NA NA NA 100 100 19 10 95
SMCLs NA 15 NA NA 6.5–8.5 NA NA NA NA 250 250 300 50 500
(HUC 08040205) drains the north-central part, the Boeuf subbasin (HUC 08050001) drains the eastern part, and the Lower Ouachita subbasin (HUC 08040207) drains a small area in the west-southwestern part (U.S. Geological Survey [USGS], 2017).
In 2014, 31.79 Mgal/d were withdrawn from surface-water bodies in the parish for agricultural purposes: 28.21 Mgal/d for rice irrigation, 3.58 Mgal/d for general irrigation, and less than 0.01 Mgal/d for livestock (table 2) (Collier, 2018).
Lower Ouachita-Bayou De Loutre and Lower Ouachita Subbasins
The Ouachita River is the primary stream draining the Lower Ouachita-Bayou De Loutre and Lower Ouachita subbasins in Morehouse Parish. The Ouachita River enters Louisiana from Arkansas and flows in a southerly direction along much of the western border of the parish. Various tributaries flow into the
Ouachita River within these subbasins, including Bayou de Butte, Shiloh Creek, and other small streams (fig. 1). The annual average streamflow for the Ouachita River at West Monroe (USGS site number 07367005), located downstream of Morehouse Parish (fig. 1), was about 19,480 cubic feet per second (ft3/s) during 2007–15 from a drainage area of 15,298 square miles (mi2). During this same period, the highest monthly average flow occurred during April (34,030 ft3/s) and the lowest during August (6,453 ft3/s) (USGS, 2017). Flow in the Ouachita River is affected by reservoirs and control structures located north of Morehouse Parish in Arkansas.
Bayou Bartholomew Subbasin
Bayou Bartholomew enters Louisiana from Arkansas and flows in a general southwesterly direction, entering Morehouse Parish near Jones and discharging into the Ouachita River southwest of Bastrop (fig. 1). Various tributaries flow into Bayou Bartholomew, including
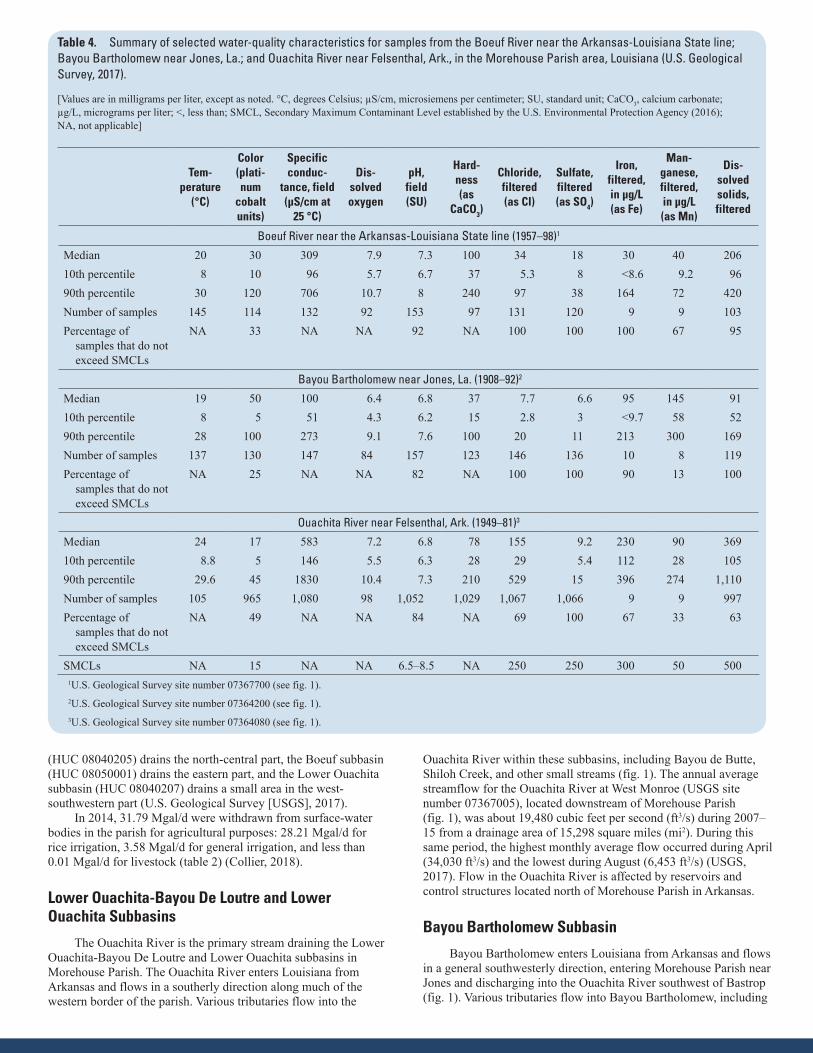
Table 4. Summary of selected water-quality characteristics for samples from the Boeuf River near the Arkansas-Louisiana State line; Bayou Bartholomew near Jones, La.; and Ouachita River near Felsenthal, Ark., in the Morehouse Parish area, Louisiana (U.S. Geological Survey, 2017).
[Values are in milligrams per liter, except as noted. °C, degrees Celsius; µS/cm, microsiemens per centimeter; SU, standard unit; CaCO3, calcium carbonate; µg/L, micrograms per liter; <, less than; SMCL, Secondary Maximum Contaminant Level established by the U.S. Environmental Protection Agency (2016); NA, not applicable]
Tem-perature
(°C)
Color (plati-num
cobalt units)
Specific conduc-
tance, field (µS/cm at
25 °C)
Dis-solved oxygen
pH, field (SU)
Hard-ness (as
CaCO3)
Chloride, filtered (as Cl)
Sulfate, filtered (as SO4)
Iron, filtered, in µg/L (as Fe)
Man-ganese, filtered, in µg/L (as Mn)
Dis-solved solids, filtered
Boeuf River near the Arkansas-Louisiana State line (1957–98)1
Median 20 30 309 7.9 7.3 100 34 18 30 40 20610th percentile 8 10 96 5.7 6.7 37 5.3 8 <8.6 9.2 9690th percentile 30 120 706 10.7 8 240 97 38 164 72 420Number of samples 145 114 132 92 153 97 131 120 9 9 103Percentage of
samples that do not exceed SMCLs
NA 33 NA NA 92 NA 100 100 100 67 95
Bayou Bartholomew near Jones, La. (1908–92)2
Median 19 50 100 6.4 6.8 37 7.7 6.6 95 145 9110th percentile 8 5 51 4.3 6.2 15 2.8 3 <9.7 58 5290th percentile 28 100 273 9.1 7.6 100 20 11 213 300 169Number of samples 137 130 147 84 157 123 146 136 10 8 119Percentage of
samples that do not exceed SMCLs
NA 25 NA NA 82 NA 100 100 90 13 100
Ouachita River near Felsenthal, Ark. (1949–81)3
Median 24 17 583 7.2 6.8 78 155 9.2 230 90 36910th percentile 8.8 5 146 5.5 6.3 28 29 5.4 112 28 10590th percentile 29.6 45 1830 10.4 7.3 210 529 15 396 274 1,110Number of samples 105 965 1,080 98 1,052 1,029 1,067 1,066 9 9 997Percentage of
samples that do not exceed SMCLs
NA 49 NA NA 84 NA 69 100 67 33 63
SMCLs NA 15 NA NA 6.5–8.5 NA 250 250 300 50 5001U.S. Geological Survey site number 07367700 (see fig. 1).2U.S. Geological Survey site number 07364200 (see fig. 1).3U.S. Geological Survey site number 07364080 (see fig. 1).
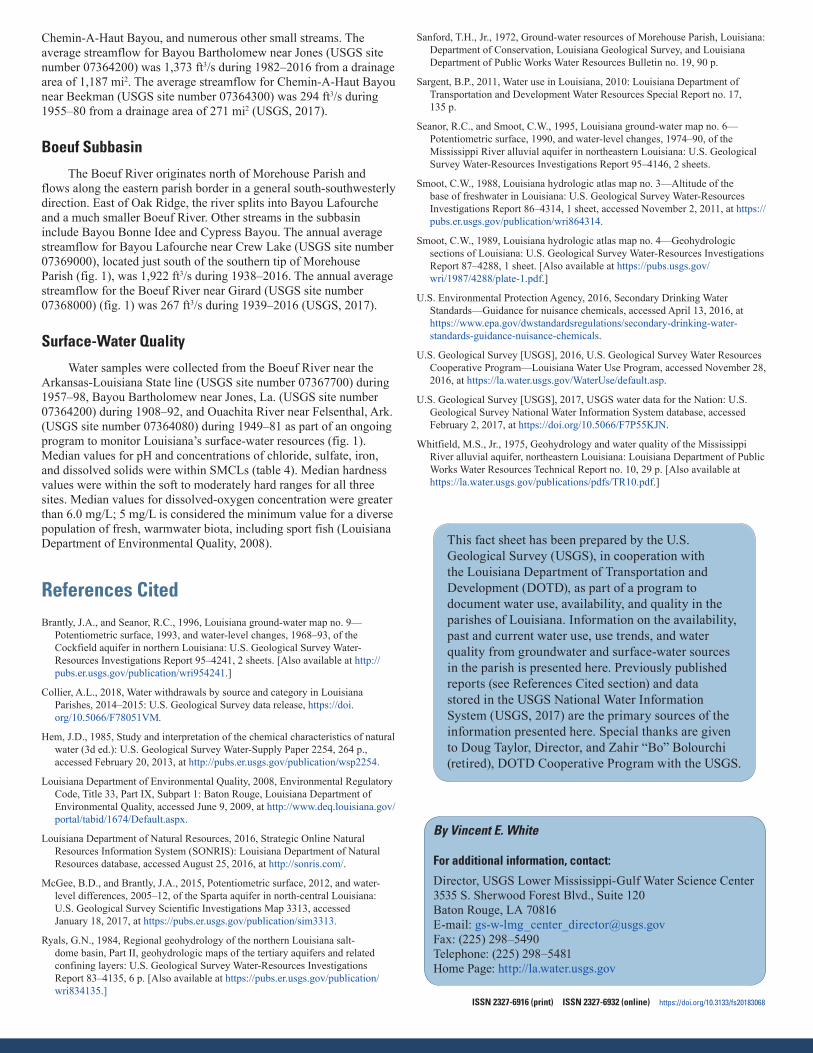
Chemin-A-Haut Bayou, and numerous other small streams. The average streamflow for Bayou Bartholomew near Jones (USGS site number 07364200) was 1,373 ft3/s during 1982–2016 from a drainage area of 1,187 mi2. The average streamflow for Chemin-A-Haut Bayou near Beekman (USGS site number 07364300) was 294 ft3/s during 1955–80 from a drainage area of 271 mi2 (USGS, 2017).
Boeuf Subbasin
The Boeuf River originates north of Morehouse Parish and flows along the eastern parish border in a general south-southwesterly direction. East of Oak Ridge, the river splits into Bayou Lafourche and a much smaller Boeuf River. Other streams in the subbasin include Bayou Bonne Idee and Cypress Bayou. The annual average streamflow for Bayou Lafourche near Crew Lake (USGS site number 07369000), located just south of the southern tip of Morehouse Parish (fig. 1), was 1,922 ft3/s during 1938–2016. The annual average streamflow for the Boeuf River near Girard (USGS site number 07368000) (fig. 1) was 267 ft3/s during 1939–2016 (USGS, 2017).
Surface-Water Quality
Water samples were collected from the Boeuf River near the Arkansas-Louisiana State line (USGS site number 07367700) during 1957–98, Bayou Bartholomew near Jones, La. (USGS site number 07364200) during 1908–92, and Ouachita River near Felsenthal, Ark. (USGS site number 07364080) during 1949–81 as part of an ongoing program to monitor Louisiana’s surface-water resources (fig. 1). Median values for pH and concentrations of chloride, sulfate, iron, and dissolved solids were within SMCLs (table 4). Median hardness values were within the soft to moderately hard ranges for all three sites. Median values for dissolved-oxygen concentration were greater than 6.0 mg/L; 5 mg/L is considered the minimum value for a diverse population of fresh, warmwater biota, including sport fish (Louisiana Department of Environmental Quality, 2008).
References Cited Brantly, J.A., and Seanor, R.C., 1996, Louisiana ground-water map no. 9—
Potentiometric surface, 1993, and water-level changes, 1968–93, of the Cockfield aquifer in northern Louisiana: U.S. Geological Survey Water-Resources Investigations Report 95–4241, 2 sheets. [Also available at http://pubs.er.usgs.gov/publication/wri954241.]
Collier, A.L., 2018, Water withdrawals by source and category in Louisiana Parishes, 2014–2015: U.S. Geological Survey data release, https://doi.org/10.5066/F78051VM.
Hem, J.D., 1985, Study and interpretation of the chemical characteristics of natural water (3d ed.): U.S. Geological Survey Water-Supply Paper 2254, 264 p., accessed February 20, 2013, at http://pubs.er.usgs.gov/publication/wsp2254.
Louisiana Department of Environmental Quality, 2008, Environmental Regulatory Code, Title 33, Part IX, Subpart 1: Baton Rouge, Louisiana Department of Environmental Quality, accessed June 9, 2009, at http://www.deq.louisiana.gov/portal/tabid/1674/Default.aspx.
Louisiana Department of Natural Resources, 2016, Strategic Online Natural Resources Information System (SONRIS): Louisiana Department of Natural Resources database, accessed August 25, 2016, at http://sonris.com/.
McGee, B.D., and Brantly, J.A., 2015, Potentiometric surface, 2012, and water-level differences, 2005–12, of the Sparta aquifer in north-central Louisiana: U.S. Geological Survey Scientific Investigations Map 3313, accessed January 18, 2017, at https://pubs.er.usgs.gov/publication/sim3313.
Ryals, G.N., 1984, Regional geohydrology of the northern Louisiana salt-dome basin, Part II, geohydrologic maps of the tertiary aquifers and related confining layers: U.S. Geological Survey Water-Resources Investigations Report 83–4135, 6 p. [Also available at https://pubs.er.usgs.gov/publication/wri834135.]
Sanford, T.H., Jr., 1972, Ground-water resources of Morehouse Parish, Louisiana: Department of Conservation, Louisiana Geological Survey, and Louisiana Department of Public Works Water Resources Bulletin no. 19, 90 p.
Sargent, B.P., 2011, Water use in Louisiana, 2010: Louisiana Department of Transportation and Development Water Resources Special Report no. 17, 135 p.
Seanor, R.C., and Smoot, C.W., 1995, Louisiana ground-water map no. 6—Potentiometric surface, 1990, and water-level changes, 1974–90, of the Mississippi River alluvial aquifer in northeastern Louisiana: U.S. Geological Survey Water-Resources Investigations Report 95–4146, 2 sheets.
Smoot, C.W., 1988, Louisiana hydrologic atlas map no. 3—Altitude of the base of freshwater in Louisiana: U.S. Geological Survey Water-Resources Investigations Report 86–4314, 1 sheet, accessed November 2, 2011, at https://pubs.er.usgs.gov/publication/wri864314.
Smoot, C.W., 1989, Louisiana hydrologic atlas map no. 4—Geohydrologic sections of Louisiana: U.S. Geological Survey Water-Resources Investigations Report 87–4288, 1 sheet. [Also available at https://pubs.usgs.gov/wri/1987/4288/plate-1.pdf.]
U.S. Environmental Protection Agency, 2016, Secondary Drinking Water Standards—Guidance for nuisance chemicals, accessed April 13, 2016, at https://www.epa.gov/dwstandardsregulations/secondary-drinking-water-standards-guidance-nuisance-chemicals.
U.S. Geological Survey [USGS], 2016, U.S. Geological Survey Water Resources Cooperative Program—Louisiana Water Use Program, accessed November 28, 2016, at https://la.water.usgs.gov/WaterUse/default.asp.
U.S. Geological Survey [USGS], 2017, USGS water data for the Nation: U.S. Geological Survey National Water Information System database, accessed February 2, 2017, at https://doi.org/10.5066/F7P55KJN.
Whitfield, M.S., Jr., 1975, Geohydrology and water quality of the Mississippi River alluvial aquifer, northeastern Louisiana: Louisiana Department of Public Works Water Resources Technical Report no. 10, 29 p. [Also available at https://la.water.usgs.gov/publications/pdfs/TR10.pdf.]
By Vincent E. White
For additional information, contact:
Director, USGS Lower Mississippi-Gulf Water Science Center3535 S. Sherwood Forest Blvd., Suite 120Baton Rouge, LA 70816E-mail: [email protected]: (225) 298–5490Telephone: (225) 298–5481Home Page: http://la.water.usgs.gov
This fact sheet has been prepared by the U.S. Geological Survey (USGS), in cooperation with the Louisiana Department of Transportation and Development (DOTD), as part of a program to document water use, availability, and quality in the parishes of Louisiana. Information on the availability, past and current water use, use trends, and water quality from groundwater and surface-water sources in the parish is presented here. Previously published reports (see References Cited section) and data stored in the USGS National Water Information System (USGS, 2017) are the primary sources of the information presented here. Special thanks are given to Doug Taylor, Director, and Zahir “Bo” Bolourchi (retired), DOTD Cooperative Program with the USGS.
ISSN 2327-6916 (print) ISSN 2327-6932 (online) https://doi.org/10.3133/fs20183068