water resources management plan vanderbilt mansion national
TRANSCRIPT

WATER RESOURCES MANAGEMENT PLAN
VANDERBILT MANSION NATIONAL HISTORIC SITE,
ELEANOR ROOSEVELT NATIONAL HISTORIC SITE, AND
THE HOME OF FRANKLIN D. ROOSEVELT NATIONAL HISTORIC SITE
NEW YORK
SEPTEMBER 1997
UNITED STATES DEPARTMENT OF THE INTERIOR NATIONAL PARK SERVICE
Approved by:
Superintendent Date Roosevelt-Vanderbilt National Historic Sites

ii

iii
Contents
20 22 23 31
39
EXECUTIVE SUMMARY viii INTRODUCTION 1 Locations, Site Descriptions, and Legislation 1 Vanderbilt Mansion National Historic Site Home of Franklin D. Roosevelt National Historic Site Eleanor Roosevelt National Historic Site Site Visitation 10 Surrounding Land Use 10 EXISTING RESOURCE CONDITIONS 12 Watersheds and Hydrography 12 Vanderbilt Mansion National Historic Site Home of Franklin D. Roosevelt National Historic Site Eleanor Roosevelt National Historic Site Topography, Soils, Vegetation, and Land Cover Hydrogeology Water Quantity and Quality Aquatic Biology and Ecology Flora Fauna Park Development and Operations Water Supply Waste Disposal Consumptive Use Road De-Icing Operations Impoundments Staffing and Ongoing Programs 40 WATER RESOURCE ISSUES 41
Restoration of Upper Val-Kill Pond to Historic Conditions (Eleanor Roosevelt National Historic Site) 41
Adequacy of Water Quality Monitoring Program (All Sites) 42 Wetland and Riparian Resource Delineation and Management (All Sites) 44 Monitoring Sedimentation Rates in Ponds (All Sites) 45 Potential Risk of Zebra Mussel Colonization 46
iv
RECOMMENDATIONS 48
Restoration of Upper Val-Kill Pond to Historic Conditions (Eleanor Roosevelt National Historic Site) 48 Proposed Changes to the Current Water Quality Monitoring Program (All Sites) 52 Wetland Resource Identification (All Sites) 59 Monitor Sedimentation Rates of Ponds (All Sites) 60 Monitor for Presence of Zebra Mussels 61
LITERATURE CITED 62
PREPARERS 67
APPENDICES
Appendix A: Water Quality Data, 1994 to 1997 68 Appendix B: Project Statements 75

v
List of Figures
Figure 1. Vicinity map of Roosevelt-Vanderbilt National Historic Site
Figure 2. Map of Vanderbilt Mansion National Historic Site 3
Figure 3. Map of the Home of Franklin D. Roosevelt National Historic Site 7
Figure 4. Map of Eleanor Roosevelt National Historic Site 9
Figure 5. Water Resources of Vanderbilt Mansion National Historic Site 13
Figure 6. Water Resources of the Home of Franklin D. Roosevelt National
Historic Site 15
Figure 7. Water Resources of Eleanor Roosevelt National Historic Site 17 Figure 8. Monthly and annual mean discharge for the Mohawk River
at Cohoes, NY and Wappinger Creek near Wappingers Falls, NY .... 24 Figure 9. Locations of water quality monitoring stations at Roosevelt-Vanderbilt national historic sites 28 Figure 10. Comparison of impact assessment for instream chemistry and biosurveys when conducted at the same locations 58
List of Tables
Table 1.Water quality monitoring stations and number of observations per station in and around Roosevelt-Vanderbilt national historic sites 27 Table 2. The 1996 water quality monitoring program at Roosevelt-Vanderbilt national historic sites 31 Table 3. Fishes of Roosevelt-Vanderbilt national historic sites 34 Table 4.Amphibian and aquatic-based reptile species recorded from Roosevelt-Vanderbilt national historic sites, 1988-1990 37

vi
Executive Summary
Vanderbilt Mansion National Historic Site, Eleanor Roosevelt National Historic Site, and the Home of Franklin D. Roosevelt National Historic Site are commonly grouped together as the Roosevelt-Vanderbilt national historic sites. Primarily managed to preserve and interpret cultural resources, these national historic sites exhibit a regionally-important array of water resources including 4.35 miles of streams, 13.75 acres of ponds, 38.8 acres of freshwater wetlands, 25 acres of tidal freshwater wetlands, and 1.1 miles of frontage along the lower Hudson River all contained within 682 acres. While water quality appears to be good, based on Roosevelt-Vanderbilt national historic sites’ monitoring program (1994 to present), the knowledge base for all water resources remains virtually unknown; e.g., surface and ground water quantity and general hydrology including aquatic biology, wetland delineation and mapping, wetland species composition and structure, and pond sedimentation rates. Compounding this lack of knowledge about the parks’ water resources, is the continued residential and commercial growth either adjacent to park boundaries or within the watershed. Potential nonpoint sources of pollution to park waters include: industrial wastes like toxic compounds; nutrient loading of nitrogen and phosphorus from municipal and residential wastes and fertilizers; road salt and auto exhaust by-product runoff from roads; gasoline and oil product contamination from residential and commercial runoff; and bacterial and infectious agent contamination from septic systems. Units of the national park system are not required to develop a water resources management plan. However, where water resource issues or management constraints are particularly numerous, complex, or controversial, a water resources management plan is useful in providing an identification and analysis of water-related information and issues, and presenting a coordinated action plan to address them. The primary purpose of this water resources management plan is to provide information on potential threats to water resources of the park and guidance on immediate actions that can prevent or mitigate water resource degradation. It is designed to serve as a management implementation plan to guide park water-related activities over the next 10 years. This water resources management plan is complementary to, and consistent with, other existing park management documents, including general management plans and resource management plans. In particular, the summary of water-related information and issues and the proposed management actions that address these issues can be incorporated into the current resource management plan. The water resources management plan is similar to the park’s resources management plan, but includes a more thorough review of existing information, an in-depth analysis of water resources issues, and the development of an implementation plan to address them.

vii
Water resources issues identified as most pressing include: 1) restoration of Upper Val-Kill Pond (Eleanor Roosevelt National Historic Site) to historic conditions; 2) adequacy of a current water quality monitoring program; 3) wetland and riparian resource delineation and management; 4) the need for monitoring sedimentation rates at ponds; and, 5) the potential risk of zebra mussel colonization. Management recommendations or project statements, have been developed to address water resources issues, where appropriate. Project statements are standard National Park Service programming documents that describe a problem or issue, discuss actions to deal with it, and identify the additional staff and/or funds needed to carry out the proposed actions. They are planning tools as well as programming documents used to compete with other projects and park units for funds and staff.

1
Introduction
Water is often a significant resource in units of the National Park Service, either through support of natural systems or providing for park and visitor use. The National Park Service seeks to perpetuate surface and ground waters as integral ecosystem components by carefully managing the consumptive use of water and striving to maintain the quality and health of aquatic ecosystems in accordance with all applicable laws and regulations. Water resource inventory and monitoring activities are essential tools of park resource management. This water resources management plan summarizes existing water resource information and identifies and discusses several water resources-related issues and management concerns pertinent to Roosevelt-Vanderbilt national historic sites. It is designed to serve as a management implementation plan to guide park water-related activities over the next 10 years. This water resources management plan is complementary to, and consistent with, other existing park management documents, including general management plans (National Park Service 1976; 1977; 1980) and the resource management plan (National Park Service 1996). Additionally, the summary of water-related information and issues and the proposed management actions that address these issues can be incorporated into the parks’ resource management plan.
LOCATIONS, SITE DESCRIPTIONS, AND LEGISLATION Roosevelt-Vanderbilt national historic sites consist of three areas totaling approximately 682 acres in Hyde Park, NY (western Dutchess County). The Town of Hyde Park stretches 10 miles along the Hudson River, and is approximately 80 miles north of New York City and 70 miles south of Albany, NY (Figure 1). Each site is a mosaic of cultural and natural resources making it necessary to integrate the preservation and maintenance of historic structures and objects, with the preservation of natural resources, cultural landscapes, and viewsheds (National Park Service 1996). Vanderbilt Mansion National Historic Site A portion of the Frederick W. Vanderbilt estate (Figure 2) was designated a national historic site on December 18, 1940, under authority of the Historic Sites Act of 1935 (49 stat. 666). Creation of Vanderbilt Mansion National Historic Site was at the explicit direction of President Franklin D. Roosevelt, who had a great interest in conservation and history, particularly that of Hyde Park and Dutchess County. Vanderbilt Mansion National Historic Site was conceived as a monument to an era, with the estate providing a historical setting for the elaborate and elegant lifestyle of the Vanderbilts and their contemporaries. The site consists of approximately 212 acres between U.S. Route 9 and the Hudson River.

2

3

4

5
The purposes of Vanderbilt Mansion National Historic Site are to: 1) explain the economic, sociological, historical, and cultural significance of the Vanderbilts and their era in U.S. history; 2) educate present and future generations about the lifestyle and historical significance of wealthy Americans in that era; and, 3) illustrate a phase of man’s relationship with his environment (National Park Service 1976; 1978a). Home of Franklin D. Roosevelt National Historic Site “Springwood”, the lifelong home of President Franklin D. Roosevelt (Figure 3), was transferred in title to the federal government on November 21, 1945, after Eleanor Roosevelt and the family waived their interests. The site presently includes approximately 290 acres between U.S. Route 9 and the Hudson River. Historic preservation efforts include compliance with President Roosevelt’s specific wishes regarding the home and grounds through restoration or reconstruction of selected structures, as well as maintenance or re-establishment of landscape features. The purposes of the Home of Franklin D. Roosevelt National Historic Site are to: 1) memorialize President Franklin D. Roosevelt and his importance in U.S. history for future generations; 2) interpret the home life of the President and his family; and, 3) illustrate a facet of man’s relationship with his environment through the President’s forestry and conservation ideas and practices (National Park Service 1977; 1978b). Eleanor Roosevelt National Historic Site Eleanor Roosevelt National Historic Site (Figure 4) was established on May 26, 1977 (Public Law 95-32). “Val-Kill”, as the site was called by the Roosevelt family, was the place that Eleanor Roosevelt considered her only real home. The operation of the site is a joint effort between the National Park Service and Eleanor Roosevelt’s Val-Kill Inc., a private, nonprofit group instrumental in the effort to designate Val-Kill as a national historic site. The site consists of approximately 181 acres east of U.S. Route 9G, and encompasses all the buildings, gardens, orchards, ponds, fields, and woods important to Eleanor Roosevelt. The purposes of Eleanor Roosevelt National Historic Site are to: 1) commemorate for the education, inspiration, and benefit of present and future generations the life and work of an outstanding woman in American history; 2) provide. . . a site for continuing studies, lectures, seminars, and other endeavors relating to the issues to which she devoted her considerable intellect and humanitarian concerns; and, 3) conserve an area of natural open space in an expanding urbanized environment for public use and enjoyment in a manner compatible with the foregoing purposes (National Park Service 1980).

6

7

8

9

10
SITE VISITATION
All three national historic sites are popular owing to their close proximity to major population centers. However, visitation has been declining since a peak in 1990 when visitation totaled 935,822. In 1996, 658,685 people visited these sites. The average annual visitation for the last 10 years is as follows: Home of Franklin D. Roosevelt National Historic Site 176,665 visitors Vanderbilt Mansion National Historic Site 459,964 visitors Eleanor Roosevelt National Historic Site 66,127 visitors Total: 702,796 visitors per year The months with the heaviest visitation are July, August, and October due to summer vacations and fall foliage tours.
SURROUNDING LAND USE
The Hudson River was the primary reason that the first Europeans settled in the area. Today, the Hudson River is still the dominating feature of Dutchess County, but its role in transportation has greatly diminished. A large network of roads and highways has made all areas of the county accessible.
Dutchess County is a mix of residential, commercial, industrial, and municipal land uses which has undergone a transformation over the past fifty years. Until the 195 Os, the county was predominantly rural with large areas in agricultural production. Dairy farming was the major type of agriculture practiced. By the early 1 960s, the county experienced a shift to an industrial and commercial income base, with IBM and a few other large employers such as Texaco dominating. This led to rapid development, especially in the southern part of the county, but in Hyde Park as well. Although agriculture is still important, the number of dairy farms has dropped from over 1000 in 1950 to less than 100 today. Aerial photographs taken in 1932, show the Route 9 corridor near the Home of Franklin D. Roosevelt National Historic Site mostly in agricultural use, which contrasts vividly with the same area today. Presently, the three national historic sites are some of the few remaining islands of undeveloped land amid residential and commercial land uses. The population of Hyde Park has grown from 4,056 in 1940 to 21,219 in 1990 (U.S. Census Bureau data). Considering that the town of Hyde Park is approximately 24,000 acres in size, population density is about 0.9 persons per acre.

11
Hyde Park does not have a complete public water system or a public system for transporting and treating sewage though plans are underway to construct a central sewage treatment facility (Dutchess County Department of Planning 1985). Most Hyde Park residents have private water sources, such as individual wells. One-third of the population is served by either the Hyde Park Fire and Water District or one of about a dozen private water companies (Dutchess County Department of Planning 1985). Most of the water companies, in turn, rely upon wells. Septic tanks are used for sewage disposal, and there is concern that many of these tanks may be creating health and environmental problems. Expanding residential development increases sewage input into the relatively water-saturated soils of this region. This could result in effluent from septic tanks entering domestic wells. Furthermore, this transport can lead to nutrient loading in the area’s numerous wetlands, leading to deleterious ecological effects in these vulnerable habitats (Dutchess County Department of Planning 1985). The upstream drainages of all three national historic sites have experienced steady residential growth. Large undeveloped tracts of land still exist, but are giving way to residential housing that are serviced only by private septic systems. The rate of residential development has slowed in recent years, as corporate downsizing has had an impact on the local economy (Hayes, D., personal observation 1997).

12
EXISTING RESOURCE CONDITIONS
WATERSHEDS AND HYDROGRAPHY
The climate of the Roosevelt-Vanderbilt national historic sites is northern temperate continental with some coastal influence. Average temperature in nearby Poughkeepsie ranges from 26.2° F in January to 74.7° F in July, with a yearly average of 51.2° F (Dutchess County Department of Planning 1985). Average precipitation in nearby Poughkeepsie ranges from 2.55 inches in January to 3.81 inches in August, with an average annual total of 38.02 inches (Dutchess County Department of Planning 1985). Precipitation rates increase gradually until they reach a first peak in April at 3.59 inches. The rate drops abruptly until August, when the greatest precipitation is expected. From September until January, the rate decreases slowly. Roosevelt-Vanderbilt National Historic Site resides within the primary Hudson River drainage basin (Dutchess County Department of Planning 1985). The Home of Franklin D. Roosevelt and Vanderbilt Mansion national historic sites lie within the Crum Elbow Creek sub-drainage, and Eleanor Roosevelt National Historic Site lies within the Fall Creek sub-drainage. Preliminary estimates of a water resource inventory for Roosevelt-Vanderbilt national historic sites include 4.4 miles of streams, 20.8 acres of ponds, 46.2 acres of known freshwater wetlands, and 25 acres of tidal, freshwater wetlands. Vanderbilt Mansion National Historic Site At Vanderbilt Mansion National Historic Site, there are two perennial streams: Crum Elbow and Bard Rock creeks (Figure 5). Crum Elbow Creek has a drainage area of 11,904 acres (Ayer and Pauszek 1968). It originates in a wetland in Rhinebeck, NY at an elevation of 535 feet. After traveling 13.3 miles, this creek enters the eastern border of the park and empties in the Hudson River 0.64 miles later. Bard Rock Creek originates north of the park in the Town of Hyde Park at an elevation of 200 feet. It drains an area of 640 acres (Ayer and Pauszek 1968). Its total course is 1.5 miles, and forms a portion of the northern boundary of the park before draining into the Hudson River. Only one non-perennial stream exists, and it drains the hillside below the visitors center, often drying during low-flow periods. Until 1994, the Hyde Park Fire and Water District operated a municipal water treatment facility on Crum Elbow Creek, upstream of the park. Crum Elbow Creek was used as the primary fresh water supply in the Town of Hyde Park. The Fire and Water District used alum to settle solids, which led to its discharge into the stream for many years. Due to the circum-neutral pH of the watershed, the remaining alum is apparently not being absorbed into the system (Schmidt et al. 1986). The presence of alum should not pose a problem to park water resources. For example, Bode et al. (1995) examined invertebrate communities in lower Crum Elbow Creek to assess potential impacts from prior discharges of alum. They found no indications of toxic stress at any of the sites downstream from the former water treatment facility.

13

14
The only permanent ponds were constructed during the ownership of Frederick W. Vanderbilt around 1900. These three ponds (approximately 3 acres in total), Upper (White Bridge) Pond, Middle (Powerhouse) Pond and Lower (Lower Dam) Pond are impoundments on Crum Elbow Creek (Figure 5). They have significant sediment deposits in their basins and are shallow with depths ranging from 1 to 3 feet. Known wetland habitats are represented by four small, non-tidal freshwater marshes ranging in size from approximately 0.03 to 0.23 acres (totaling approximately I acre; Figure 5). A non-tidal, freshwater swamp exists along the western boundary. It is created by the discharge of a non-perennial stream that drains the hillside below the visitors center. The Hudson River shoreline is outside the boundary of the park, but the river is considered a critical habitat because it fronts 1.1 miles of the park. For example, a bay at the north boundary near Bard Rock Park contains a small area of tidal, freshwater marsh. Additional wetland habitats exist but need to be systematically delineated, mapped, and inventoried. Home of Franklin D. Roosevelt National Historic Site The major water resources at the Home of Franklin D. Roosevelt National Historic Site consist of two perennial streams, two non-perennial streams, and an impounded pond (Figure 6). Meriches Kill (shown but not named on the U.S. Geological Survey topographic map) is a perennial stream that originates 1.2 miles northeast of the park and has a total course of 1.9 miles. Meriches Kill enters the park from Morgan Ice Pond on the adjacent property and travels for 0.7 miles before emptying into a freshwater tidal cove on the Hudson River. There are two, small non-perennial streams (approximately 1 mile in total length) in the northern portion of the park (Figure 6). The pond known as Roosevelt Ice Pond was formed by a concrete dam constructed on Meriches Kill. It was used for ice harvesting and swimming by the Roosevelt family. The Ice Pond has an area of 0.7 acres and is between 1 and 7 feet in depth (Allen and Bobinchock 1986). Allen and Bobinchock (1986) conducted a field survey of pond sedimentation at the Ice Pond. Since this was the first such survey for the Ice Pond, rates of sedimentation could not be accurately estimated. Despite the lack of a previous survey, a crude approximation yielded an estimate of another 100 years to decrease the average water retention capacity of the pond from its present (1985) 60% to 20%. Water retention capacity is determined by the percentage of fine grained sediment that has filled the ‘hard bottom-to-dam elevation’ cross-sectional areas at sampled transects. The time frame would be shorter if the integrity of the concrete dam is threatened by increased static pressure via the fine-grain sediment wedge. Allen and Bobinchock (1986) suggested that a full-scale geotechnical study of the concrete dam was probably not needed until the 1995 to 2005 time frame, unless structural weakening becomes apparent.

15

16
Adjacent to the southwest boundary of the park is Roosevelt Cove, a 25-acre freshwater tidal marsh (Figure 6). Roosevelt Cove is owned by the State of New York, but is under the stewardship of the National Park Service. This cove was created in the 19th century by the construction of the railroad tracks along the western boundary, which formed an embayment of the Hudson River shoreline. The restricted tidal exchange then led to the establishment of the tidal freshwater marsh system. Roosevelt Cove is a productive system, providing feeding and nesting habitat for waterfowl, shorebirds, and raptors, including one federally endangered species (bald eagle, Haliaeetus leucocephalus) and one state threatened species (osprey, Pandion haliaetus). This marsh system is critically important within the lower Hudson River basin because of the almost complete disappearance of this type of wetland habitat. For this reason, the Nature Conservancy included it in their Natural Areas Registry Program. There are several areas of wetlands (swamps) that have not been adequately described nor mapped. In addition, several wet meadow areas exist downslope of seeps emerging from the steep hillside below the Roosevelt home. Further study is needed to delineate wetland boundaries and describe vegetative communities. Eleanor Roosevelt National Historic Site The main fluvial system at Eleanor Roosevelt National Historic Site is the Fall Kill and its perennial and non-perennial tributaries (Figure 7). The Fall Kill originates north of the park at an elevation of 390 feet near the Town of Hyde Park. It drains an area of 12,160 acres (Ayer and Pauszek 1968). Coursing 7 miles before entering the park, it travels for 0.9 miles before exiting the park and eventually emptying into the Hudson River in the City of Poughkeepsie 6.3 miles downstream. The total course of the stream is 14.2 miles. A wet meadow (approximately 8 acres) has a number of small drainage channels and ponds of agricultural origin. These combine into a single tributary to the Fall Kill near the northern edge of the park boundary. Heavily vegetated, these channels are 0.5 miles in total length. The north and upland drainage tributaries both empty into the Fall Kill. The former begins north of the service road and flows 0.2 miles before joining the Fall Kill. The latter consists of a series of small streams that drain the western, upland portion of the park and joins the Fall Kill at two sites after flowing for 0.75 miles. The Lyons Lane tributary lies wholly outside of the park boundary originating in a pond north of Lyons Lane. Flowing 700 feet before joining the Fall Kill, it may influence water quality conditions within the park because it flows through a residential area which may contribute excess nitrogen or phosphorus from septic systems or lawn fertilizers and organic compounds (primarily oil and oil by-products) from residential activities.

17
18
More is known of the park’s ponds and wetlands than the other units because of the work by Kiemens et al. (1992) on state-listed reptile species and their habitats at the park. However, more accurate and complete hydrological and biological information is needed. There are five permanent ponds in the park (Figure 7). The Middle Woodland Pond (0.45 acres) is a deep pond (over 5 feet deep) typified by mucky substrate and extensive development of the aquatic vegetative community including algae, duckweed (Lemna sp.), water lilies, and emergent shrubs, e.g., buttonbush (Cephalanthus occidentalis). There is no visible inlet or outlet. The Boundary Pond is approximately 2 feet deep, and it is heavily shaded by mixed deciduous and coniferous vegetation, dominated by white oak (Q.uercus alba), black oak (Q. Velutina), red oak (Q. Rubra), black birch (Betula lenta), and flowering dogwood (Cornusfiorida) (Padullo Quirk Associates 1979). Its substrate is composed of a thin layer of mud with a gravely underlying layer. This pond has moderate stands of aquatic vegetation, including duckweed (Lemna minor) and coontail (Ceratuphyllum demersum). The Hayfield Pond, a small, shallow, kettle-type depression is south of the hayfield along the entrance road. It is filled with emergent buttonbush (C. occidentalis). The Curnan House Pond forms part of the wet meadow drainage system and was probably constructed for agricultural purposes during the period of the Roosevelt family ownership. It is relatively open with some submergent aquatic vegetation. The Loosestrife Pond lies west of the Curan House Pond. As the name suggests, this pond is typified by extensive stands of emergent aquatic vegetation, mainly purple loosestrife (Lythrum salicaria) and buttonbush (C. occidentalis). This body of water, having a sand/gravel basin with a thin layer of mud on top, appears to be filling in rapidly. Two vernal or non-permanent ponds occur in the park (Figure 7). The North Woodland Pond is a small pond that is ephemeral. There is no aquatic vegetation present because of the fluctuation in water level, and it has a substrate of leaves and organic debris over gravel. This pond is noted as a significant amphibian breeding site during wet periods (Kiemens et al. 1992). The Buttonbush Pond contains water except during the most severe droughts. It is approximately 1 foot deep, with significant stands of buttonbush (C. occidentalis). The most important of the impounded ponds are the Upper and Lower Val-Kill Ponds (Figure 7). The Upper Val-Kill Pond was created by a concrete dam built in 1925 across the Fall Kill. Currently, this pond has an area of approximately 7 acres with a fringing wetland of 14 acres. Depth varies from several inches in the northern section to about 6 feet in the southern lobe. The pond silted in very early, and regular dredging and/or mowing of aquatic vegetation was necessary to maintain open water. Since the last known dredging in the 1 950s up to 13.7 feet of silt has accumulated (Pandullo Quirk Associates 1979; Allen and Bobinchock 1986). Most of the northern portion is nearly filled in today and has been invaded by emergent aquatic plants, both native species as well as purple loosestrife (Lythrum salicaria), an invasive exotic perennial.

19
As the growing season progresses, increased plant growth (perhaps enhanced by rising nutrient loads via residential septic systems) reduces the amount of open water. This is gradually altering the character of the cultural landscape. Upper Val-Kill Pond was the center of the Roosevelt family recreational activities and now is the cornerstone of the cultural landscape at the park (Kane and Carruth 1981). Dredging has been discussed as an option (Pandullo Quick Associates 1979; Kane and Carruth 1981; Allen and Bobinchock 1986) to recreate the historic scene as mandated by National Park Service policy and the park’s enabling legislation. Pandullo Quirk Associates (1979) and Allen and Bobinchock (1986) conducted field surveys of pond sedimentation of Upper Val-Kill Pond. The latter was an attempt to duplicate the same cross-sectional transects of the former. The Allen and Bobinchock (1986) study was useful in delineating the 1985 conditions of pond geomorphology, the depositional units, and their mean ages of accumulation. However, no accurate assessment of the recent (1979-1985) rates of sedimentation could be performed because Allen and Bobinchock (1986) could not accurately reproduce the Pandullo Quirk Associates (1979) study. Allen and Bobinchock (1986) suggested that another survey of this type be conducted within 5 years to quantify the rates of sedimentation. Lower Vat-Kill Pond (2 acres) is 0.5 miles downstream of Upper Vat-Kill Pond and was formed by a concrete dam built in the 1 960s by a private landowner. Increased siltation and encroaching aquatic vegetation, for the most part, and aspects of cultural eutrophication caused by anthropogenic nutrient loading, to a lesser extent, will soon promote the next phase of wetland evolution. However, because Lower Vat-Kill Pond has little cultural significance and the concrete dam is outside of the park boundary, no attempt will be made to counter the process of eutrophication. South Woodland Pond (Figure 7) was created by an earthen dam of unknown origin and age. It is perched on a ledge on a steep hillside overlooking the Fall Kill. It contains abundant aquatic vegetation similar to Middle Woodland Pond; however, South Woodland Pond contains more shrub vegetation, stumps, and hummocks. Wetlands in the park consist of an unknown number of swamps and marshes adjacent to the more sizable bodies of surface water. A shrub swamp lies on the western edge of Upper Vat-Kill Pond and extends to the Curnan House. Its dominant vegetation includes red maple (Acer rubrum) and sedge (Carex stricta). A wetland lies to the southwest of Lower Val-Kill pond and contains wooded swamp (eastern and north sides) and marsh habitats. A sphagnum shrub swamp is across the entrance road from Buttonbush Pond and drains into the Cuman House Pond. It is composed primarily of red maple and sphagnum, with some purple loosestrife and sedge hummocks. A wet meadow exists between the main entrance and the access corridor for a overhead power transmission line. This wet meadow contains diverse vegetation with many depressions that hold water. Depending upon the season and/or the proximity in time to a precipitation event, these depressions may contain water. The wet meadow vegetation has not been adequately described.

20
TOPOGRAPHY, SOILS, VEGETATION, AND LAND COVER
Roosevelt-Vanderbilt national historic sites are in the Northern Appalachian Plateau and Uplands Ecoregion (Omernik 1987). This ecoregion is characterized by open high hills, tablelands with moderate to considerable relief, northern hardwoods (maple, birch, beech, hemlock), a mosaic of land use including cropland, pastureland, woodland and forest, and inceptisol soils (young soils with minimal horizon development). Dutchess County, the general area west of the Taconic State Parkway and north of Interstate 84, is characterized by numerous small hills ranging in height from 20 to 300 feet above the intervening valleys. Elevations range from 40 feet above mean sea level at the Hudson River to 900 feet. Slopes in excess of 15% occur along the Hudson River, especially at the Vanderbilt Mansion and Home of Franklin D. Roosevelt national historic sites. Dutchess County soils are derived primarily from glacial till and outwash, organic matter, and lacustrine and alluvium sediments (Dutchess County Department of Planning 1985). Glacial till consists of unstratified, mixed deposits of clay, silt, sand and rock fragments deposited by glacial ice. Glacial outwash is material swept out, sorted and deposited beyond the ice front by streams of glacial meltwaters. These deposits are usually stratified and made up of sands and gravels. Organic matter such as decomposed plant and animal residue forms the basis of muck soils. Many of these soils are the direct result of glaciation, which by impeding drainage caused wetlands to form. Lacustrine sediments consist of very fine sands, silts and clays that have settled out of the still water of lakes. Alluvium sediments consist of material moved and redeposited by streams. Major soil types at the Vanderbilt Mansion National Historic Site are Colonie fine sandy loam (hilly and steep phases) and Hoosic gravelly loam (Soil Conservation Service 1955). Crum Elbow Creek follows primarily through Colonie fine sandy loam. The majority of the physical development at this site is on the nearly level phase of Hoosic gravelly loam; the steep phase of Hoosic gravelly loam occurs below the physical development along the floodplain of the Hudson River. Smaller amounts of the following soils also occur: Staatsburg gravelly loam and NassauCossayuna gravelly loams. The latter occurs in the Bard Rock area and along the southwestern park boundary in the Hudson River floodplain. At the Home of Franklin D. Roosevelt National Historic Site the major soil types include Hoosic gravelly loam, Colonie fine sandy loam, Steep ledgy land (Wassaic and Staatsburg soil materials), and Staatsburg gravelly loam (Soil Conservation Service 1955). Surface water within the Meriches Kill fluvial system flows over steep ledgy soils. The majority of the Hudson River floodplain is of this soil type. All physical development and landscaped areas are on Hoosic gravelly loam and Colonie fine sandy loam. Small areas of Rhinebeck silt loam (indicative of a former lake plain terrace) and tidal marsh, freshwater phase (north end of tidal cove), are also present. Major soil types at the Eleanor Roosevelt National Historic Site include Hoosic gravelly loam and Saco silty clay loam (Soil Conservation Service 1955). The Fall Kill fluvial system flows through

21
the latter. Minor soil types include Staatsburg gravelly loam, Hoosic gravelly sandy loam, and muck.
Soil permeability rates for the western half of Dutchess County, including Roosevelt-Vanderbilt national historic sites, are generally less than 0.63 inches per hour. This level severely limits the soil’s suitability for septic tanks (Dutchess County Department of Planning 1985). However, in many of these areas septic systems have been functioning adequately for years. Local variations in soil or slope features and use of fill in creating septic fields have, in the past, enabled these septic systems to operate properly (Dutchess County Department of Planning 1985).
Upland vegetation at Roosevelt-Vanderbilt national historic sites is characterized by mixed oak forest, hemlock/mixed oak forest, and mixed species deciduous forest. On steep moist slopes with shallow soils, chestnut oak-eastern hemlock forest predominates. Lowland red maple forest occupies the moderately low elevations between the riparian zones of streams and the upland forested areas. Early successional ash/gray birch forest has colonized previously open areas at Eleanor Roosevelt National Historic Site.
Klemens et al. (1992) determined the following land cover estimates for Roosevelt-Vanderbilt national historic sites:
Land Cover Acreage Percent CoverHome of Franklin D. Roosevelt NHS* Forest 196.5 67.1% Wetland 4.4 1.5% Meadow 47.4 16.3% Open Water 1.7 0.6% Maintained Landscape 42.5 14.5% Vanderbilt Mansion NHS* Forest 95.0 44.9% Wetland 1.0 0.5% Meadow 46.6 22.0% Open Water 4.7 2.2% Maintained Landscape 64.4 3 0.4% Eleanor Roosevelt NHS* Forest 82.9 45.9% Wetland 40.8 22.6% Meadow 29.8 16.5% Open Water 14.4 8.0% Maintained Landscape 12.6 7.0% *NHS is an abbreviation for National Historic Site.

22
HYDROGEOLOGY
Dutchess County consists of younger unconsolidated glacial and recently deposited materials overlying older consolidated bedrock material. There are five types of bedrock in Dutchess County; however, all three national historic sites overlie only one type - Austin Glen Graywacke and shale (Dutchess County Department of Planning 1985). This formation was deposited on an ancient, unstable continental shelf. It is a poorly sorted rock type that displays many of the features of a rapidly deposited sediment, including ripple marks and cross bedding. The formation consists of thin- to medium-bedded, coarse, gray sandstone or fine-grained conglomerate composed of firmly-cemented rounded fragments. Wells in this formation produce approximately 16 gallons per minute (gpm) of moderately hard water (Dutchess County Department of Planning 1985). During the last glacial period (10 to 20 thousand years ago), Dutchess County was covered by ice (Dutchess County Department of Planning 1985). As the glaciers retreated, layers of glacial till were deposited over much of the bedrock. Glacial till consists of a heterogeneous mixture of poorly-sorted rock materials (clay, sand, pebble, and boulder), often having a high clay content. The western half of the Home of Franklin D. Roosevelt National Historic Site consists of glacial till. Eleanor Roosevelt National Historic Site has only a small portion of glacial till. Glacial till thickness over bedrock ranges from 0 to 20 feet on hilltops and from 20 to 40 feet on slopes. The high clay content of glacial till usually limits permeability; therefore, ground water recharge is slow with average recharge capacities estimated at 0.17 gpm per acre (Dutchess County Department of Planning 1985). Water in usable quantities can only be obtained from glacial till deposits using large diameter wells. Such wells, which are necessarily shallow, often go dry during periods of low precipitation. Recorded yields in glacial till deposits in Dutchess County average 22 gpm (Dutchess County Department of Planning 1985). At Eleanor Roosevelt National Historic Site and Vanderbilt Mansion National Historic Site the bedrock is overlain by glacially-derived sand and gravel. These deposits range from layers of clean sand to layers of mixed sand and gravel, and are usually underlain by thinner layers of silt and clay. The sand and gravel mixture is the most productive water-bearing deposit in Dutchess County. Well production averages 136 gpm with an average recharge rate of 0.74 to 0.93 gpm per acre (Dutchess County Department of Planning 1985). These aquifers are vulnerable to contamination. The same characteristics that enable aquifers to absorb, store, and yield large amounts of ground water allow them to absorb, store, and transmit pollutants. The Dutchess County Department of Planning (1985) stated that many cases of ground water pollution occurred in the years prior to and during its study.

23
WATER QUANTITY AND QUALITY
Roosevelt-Vanderbilt national historic sites lie within the lower part of the 13,400-square-mile Hudson River basin. A U.S. Geological Survey Water Fact Sheet (U.S. Geological Survey 1991) describes the lower Hudson River as follows:
The lower Hudson River begins at the Federal Dam at Troy just downstream from the confluence with the Mohawk River. Average flow at the Federal Dam is 13,600 cubic feet per second (cfs); daily average flow has been as high as 152,000 cfs and as low as 882 cfs. The entire 154 miles of the lower Hudson River is tidal and can undergo a reversal in the direction of flow four times a day. The mean water elevation at Albany is 2 feet above sea level, and the average range in tide is about 4 feet. The lower Hudson River is maintained at a depth of at least 32 feet for commercial traffic from the port of Albany to New York City, but is as deep as 200 feet in places.
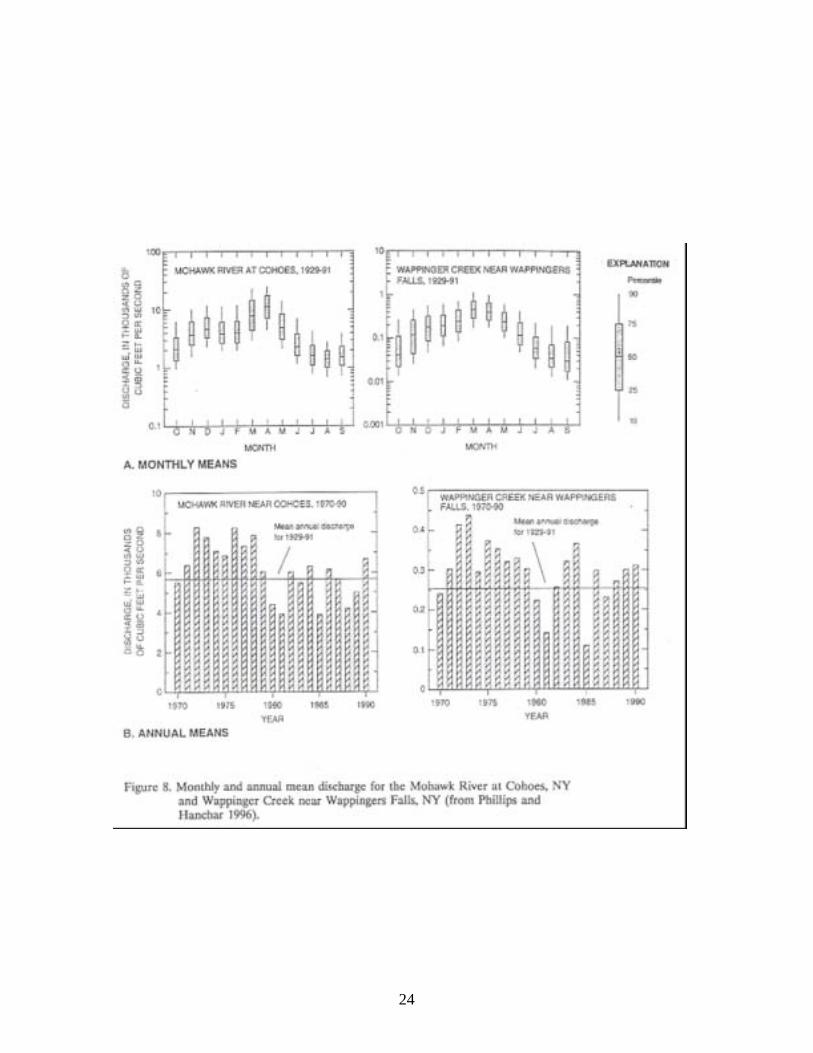
Seasonal and annual patterns of runoff in the Hudson River basin were calculated using daily discharge data from the Mohawk River at Cohoes (Phillips and Hanchar 1996). The median monthly discharge of the Mohawk River at Cohoes for 1929-1991 ranges from less than 2,000 cfs in August to over 10,000 cfs in April (Figure 8). Discharge typically increases from October through December as temperatures decrease, rainfall increases, and the growing season ends. Discharges for January and February, when temperatures decline and much of the precipitation falls as snow, are typically lower than those for December; and median daily discharge typically peaks in March and April, during spring snowmelt. Discharges generally decline from May through August as snowmelt decreases and temperatures and infiltration increase. Other than the Hudson River, no fluvial system within or adjacent to Roosevelt-Vanderbilt national historic sites is or has ever been monitored for discharge on a consistent basis. In an attempt to conduct a seasonal analysis of water quality data collected in and around Roosevelt-Vanderbilt national historic sites, the National Park Service (1995) found the nearest U.S. Geological Survey Hydro-Climatic Data Network (HCDN) station that is most representative of streamflow conditions at the park. The HCDN is basically a subset of U.S. Geological Survey streamflow stations and includes only those stations that are unaffected by artificial diversions, storage, or other disruptions of the natural channel. All HCDN stations generally have at least a 20-year period of record. Consequently, discharge patterns at these stations should reflect only hydrologic and climatic influences. The station most representative of streamfiow conditions at Roosevelt-Vanderbilt national historic sites is Wappinger Creek near Wappingers Falls, NY, which is approximately 15 miles south of Hyde Park (National Park Service 1995). Figure 8 displays the mean annual hydrograph and distribution of daily flows by month for the Wappinger Creek station.
24

25
Unlike the Mohawk River discharge at Cohoes, Wappinger Creek discharge near Wappingers Falls increases from October through March and declines from April through September. The seasonal differences in discharge between these two sites are related to climatic differences between the two drainage basins (Phillips and Hanchar 1996). Wappinger Creek is farther south, is much less mountainous, and has generally warmer winters. Therefore, discharge in Wappinger Creek does not decrease during January and February, and spring snowmelt generally occurs in March. In 1991, the U.S. Geological Survey began to implement a full-scale National Water Quality Assessment (NAWQA) program. The goals of this program are to describe the status of and trends in quality of a large, representative part of the Nation’s surface and ground water resources and to identify the major natural and human factors that affect the quality of these resources. In addressing these goals, the program should produce a wealth of water quality information that will be useful to managers at national, state, and local levels. The Hudson River basin was among the first 20 NAWQA study units selected. Due to the complexity and extensiveness of the Hudson River basin study, results are just now being published in various formats. As part of the Hudson River basin NAWQA program, Phillips and Hanchar (1996) analyzed available nutrient, pesticide, volatile organic compound, and suspended-sediment surface water data collected by the U.S. Geological Survey from 1970-1990. Of particular interest is their analysis from Wappinger Creek near Wappingers Falls, NY, an agricultural watershed (defined as at least 25% farmland and less than 11.5% urban land). Concentrations of most nutrient species in Wappinger Creek increase with increasing discharge. In general, nitrate concentrations at this site increase with increasing discharge, showing little seasonal variability. Total nitrogen showed a similar relationship with discharge, primarily because dissolved nitrate constitutes most of the total nitrogen. In contrast, dissolved ammonium increases slightly with increasing discharge (during discharges less than 200 cfs) and decreases with increasing discharges (above 200 cfs.) This relationship was seen at other sites in the Hudson River basin, regardless of land use. Total phosphorus concentration increases with increasing discharge at discharges greater than 300 cfs. Plots of nutrient concentration in relation to discharge at sites representing differing land uses can help identify whether nutrients are derived from point or nonpoint sources. If nutrient concentrations increase with increasing discharge, nonpoint sources are probably the main control, but if the concentrations decrease with increasing discharge, point sources are probably the main control. The above results indicate that nutrient concentrations in the Wappinger Creek watershed are controlled largely by nonpoint sources. Phillips and Hanchar (1996) determined that suspended sediment and pesticide data are insufficient for a basinwide assessment of current conditions. However, it appears from the limited data that both are related to land-use characteristics. For example, DDT was universally applied to agricultural, urban, and forested watersheds from 1940 to the early 1970s. Total DDT was detected in all but one of 21 sites with available data. In contrast, chlordane was applied
26
primarily in urban areas over essentially the same time period. It was detected at over 80% of the urban sites and at less than 20% of the non-urban sites. All waters at Vanderbilt Mansion, the Home of Franklin D. Roosevelt, and Eleanor Roosevelt national historic sites have been classified under New York State law as either Class C (suitable for fish propagation and fishing) or Class D (suitable for fishing). Crum Elbow Creek, currently rated as Class D, was once plagued with degraded water quality because of alum addition by the upstream municipal treatment plant. Alum treatment was terminated in 1978. Since that time, alum concentrations in the water column have remained at minimal or below detection levels. All park streams now rated Class D, including Crum Elbow Creek, have been proposed for upgrading to Class C. The National Park Service (1995) conducted surface water quality retrievals for Roosevelt-Vanderbilt national historic sites from six of the U.S. Environmental Protection Agency’s national databases, including STORET. The results of these retrievals for the study area (limits include 3 miles upstream and 1 mile downstream of park boundaries) covered the years 1964 to 1995 and included 39 water quality monitoring stations (Table 1; Figure 9), 18 industrial/municipal discharge sites, 22 municipal water supply intakes, seven water impoundments, and six active or inactive U.S. Geological Survey gaging stations. Most (20) of the monitoring stations are outside park boundaries, and represent either older one-time or intensive single-year efforts by collecting agencies, or discontinued stations. The data from these stations are useful for showing historical trends, but are of little use in an assessment of current water quality. However, these data do indicate that surface waters within the study area have been impacted by human activities, including industrial and municipal wastewater discharges, stormwater runoff, and a wide variety of public and private land uses including commercial/residential development.
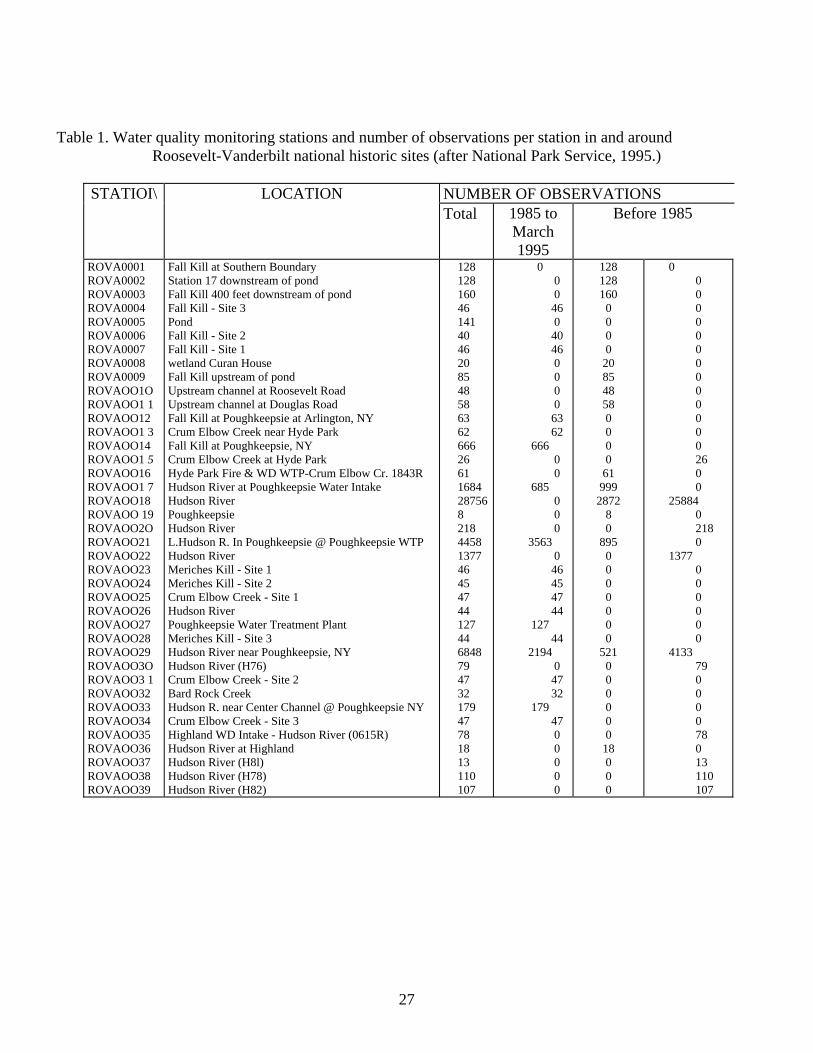
27
Table 1. Water quality monitoring stations and number of observations per station in and around Roosevelt-Vanderbilt national historic sites (after National Park Service, 1995.)
STATIOI\ LOCATION NUMBER OF OBSERVATIONS Total 1985 to
March 1995
Before 1985
ROVA0001 ROVA0002 ROVA0003 ROVA0004 ROVA0005 ROVA0006 ROVA0007 ROVA0008 ROVA0009 ROVAOO1O ROVAOO1 1 ROVAOO12 ROVAOO1 3 ROVAOO14 ROVAOO1 5 ROVAOO16 ROVAOO1 7 ROVAOO18 ROVAOO 19 ROVAOO2O ROVAOO21 ROVAOO22 ROVAOO23 ROVAOO24 ROVAOO25 ROVAOO26 ROVAOO27 ROVAOO28 ROVAOO29 ROVAOO3O ROVAOO3 1 ROVAOO32 ROVAOO33 ROVAOO34 ROVAOO35 ROVAOO36 ROVAOO37 ROVAOO38 ROVAOO39
Fall Kill at Southern Boundary Station 17 downstream of pond Fall Kill 400 feet downstream of pond Fall Kill - Site 3 Pond Fall Kill - Site 2 Fall Kill - Site 1 wetland Curan House Fall Kill upstream of pond Upstream channel at Roosevelt Road Upstream channel at Douglas Road Fall Kill at Poughkeepsie at Arlington, NY Crum Elbow Creek near Hyde Park Fall Kill at Poughkeepsie, NY Crum Elbow Creek at Hyde Park Hyde Park Fire & WD WTP-Crum Elbow Cr. 1843R Hudson River at Poughkeepsie Water Intake Hudson River Poughkeepsie Hudson River L.Hudson R. In Poughkeepsie @ Poughkeepsie WTP Hudson River Meriches Kill - Site 1 Meriches Kill - Site 2 Crum Elbow Creek - Site 1 Hudson River Poughkeepsie Water Treatment Plant Meriches Kill - Site 3 Hudson River near Poughkeepsie, NY Hudson River (H76) Crum Elbow Creek - Site 2 Bard Rock Creek Hudson R. near Center Channel @ Poughkeepsie NY Crum Elbow Creek - Site 3 Highland WD Intake - Hudson River (0615R) Hudson River at Highland Hudson River (H8l) Hudson River (H78) Hudson River (H82)
128 128 160 46 141 40 46 20 85 48 58 63 62 666 26 61 1684287568 218 4458137746 45 47 44 127 44 684879 47 32 179 47 78 18 13 110 107
0 0 0 46 0 40 46 0 0 0 0 63 62
666 0 0
685 0 0 0
3563 0 46 45 47 44
127 44
2194 0 47 32
179 47 0 0 0 0 0
128 128 160 0 0 0 0
20 85 48 58 0 0 0 0
61 999
2872 8 0
895 0 0 0 0 0 0 0
521 0 0 0 0 0 0
18 0 0 0
0 0 0 0 0 0 0 0 0 0 0 0 0 0 26 0 0 25884 0 218 0 1377 0 0 0 0 0 0 4133 79 0 0 0 0 78 0 13 110 107

28

29
Nineteen of 39 water quality monitoring stations in Table 1, represent stations located within or immediately adjacent to park boundaries (Figure 9). However, data from eight stations (ROVA0001 to ROVA0003; ROVA0005; and, ROVA0008 to ROVAOO1 1) are from a 1978-1979 intensive study of Fall Kill on Eleanor Roosevelt National Historic Site by Pandullo Quirk Associates (1979). The remaining 11 monitoring stations (ROVAOO4; ROVA0006; ROVA0007; ROVAOO23 to ROVAOO26; ROVAOO28; ROVAOO3 1, ROVAOO32; and, ROVAOO34) represent recent and continuous monitoring efforts that allow an interpretation of water quality conditions for Roosevelt-Vanderbilt national historic sites. These stations represent the current water quality monitoring program initiated by Roosevelt-Vanderbilt national historic sites in 1994. The surface water quality of Roosevelt-Vanderbilt Mansion national historic sites is considered good, based on 3 years of sampling at 11 stations (appendix A). At Vanderbilt Mansion National Historic Site, only two pH observations (out of 173 total observations from 12 parameters) either equaled or exceeded U.S. Environmental Protection Agency (EPA) criteria. Similarly, only three pH observations exceeded EPA criteria at both the Home of Franklin D. Roosevelt (out of 179 observations from 12 parameters) and Eleanor Roosevelt (out of 132 observations from 12 parameters) national historic sites. However, 10 dissolved oxygen observations on the Fall Kill at Eleanor Roosevelt National Historic Site were below the minimum oxygen concentration of 4 mg/l set as a criteria for the protection of aquatic life by the U.S. Environmental Protection Agency. These episodic occurrences of low dissolved oxygen coincided with the summer months. They were likely due to heavy deposition and decomposition of organic matter leading to higher respiration rates in the water and increased oxygen demand, combined with a low, pond turnover rate. This was especially evident in Upper Vat-Kill Pond. Knowledge of ground water quality is limited to the basinwide assessment by Phillips and Hanchar (1996). They assessed nutrient data (limited to nitrate, 1970-1990) from ground water wells in the Hudson River drainage. Nitrate is the most soluble and mobile form of nitrogen in ground water. Previous investigations have indicated that all principal aquifers in New York State contain ground water with median nitrate concentrations less than the 10 mg/l U.S. Environmental Protection Agency drinking-water criterion (Rogers 1988). Elevated concentrations may be found, however, in shallow, unconfined systems that are susceptible to contamination from overlying sources of nitrate, such as fertilizers, underground sewage-disposal systems, animal waste, and landfills (Rogers 1988). Madison and Brunett (1984) found that national background concentrations of nitrate were low (less than 0.2 mg/l). Phillips and Hanchar (1996) estimated a threshold concentration of 0.3 mg/l indicative of human-induced effects. Further, Phillips and Hanchar found nitrate concentrations in water from unconsolidated deposits ranged from less than the analytical detection limit of 0.1 mg/l to 16 mg/l, within a median concentration of 0.23 mg/I. Nitrate concentrations in water from bedrock ranged from less than 0.1 to 11 mg/l, with a median concentration of 0.3 mg/l. Additional results include: 1) in general, nitrate concentrations in ground water decreased with depth; 2) median nitrate concentrations (0.61 mg/l) were higher in unconsolidated aquifers of less than 35 feet compared with concentrations (0.2 mg/l) greater than 35 feet; and, 3) no correlation between nitrate concentration and land use could be made from the available data.

30
Continued residential development upstream and adjacent to Eleanor Roosevelt national historic site has contributed to an influx of nutrients from septic systems resulting in nutrient loading in adjacent wetlands and ground waters which then transport nutrients to Upper Val-Kill Pond. This anthropogenic nutrient enrichment, together with sediment build-up, has led to the growth of significant stands of purple loosestrife. These stands have expanded out into the middle of Upper Val-Kill Pond and have accelerated siltation by trapping transported sediment. This expansion has resulted in a drastic loss of open water habitat. Significant levels of benzene have been noted in a private well in a residential development adjacent to Eleanor Roosevelt National Historic Site (Hayes 1996). Although no evidence indicates benzene contamination within park waters, the possibility cannot be discounted. Thus, periodic monitoring for selected organic compounds would be prudent. Based on the above discussion and conversations with park staff, potential sources of pollution to park waters appear to include the following:
• discharge of industrial wastes like toxic compounds, particulates and dissolved pollutants;
• nutrient loading of nitrogen and phosphorus from municipal and residential wastes and fertilizers;
• road salt and auto exhaust by-product runoff from roads to surface and ground water;
• gasoline and oil product contamination of surface and ground water by residential and commercial spillage; and,
• bacterial and infectious agent contamination from septic systems.
Water column parameters must be continually monitored to ensure that potential degradations of water quality are identified. The importance of identification of resource impacts for resource protection was recognized by the park in 1994 when continuous water quality monitoring was initiated. Since 1994, a suite of water quality parameters has been sampled regularly by resource management staff (see appendix A). This monitoring program is being conducted at four stations each, at Vanderbilt Mansion National Historic Site and the Home of Franklin D. Roosevelt National Historic Site (Figures 5, 6) and three stations at Eleanor Roosevelt National Historic Site (Figure 7). Table 2 summarizes the 1996 water quality monitoring program at RooseveltVanderbilt national historic sites. In 1996, the program took about 16 work-days to implement at a total cost of $3,000 which included salary, equipment, and supplies.

31
Table 2. The 1996 water quality monitoring program at Roosevelt-Vanderbilt national historic sites (after Hayes 1996).
PARAMETER FREQUENCY PARAMETER FREQUENCY Dissolved oxygen1 monthly Temperature’ monthly Conductivity’ monthly Total dissolved solids”2 monthly pH’ monthly
Secchi disk visibility quarterly Alkalinity3 quarterly Nitrate nitrogen3 quarterly Chlonde3 quarterly Phosphate3 quarterly Fecal coliform/fecal streptococcus4 biannually
1Measured using various electronic meters. 3Measured using a Hach Kit. 2Estimated from conductivity. 4Samples analyzed by local, independent laboratory.
AQUATIC BIOLOGY AND ECOLOGY Roosevelt-Vanderbilt national historic sites are fortunate to have a broad array of natural resources in a relatively small area. Both the Home of Franklin D. Roosevelt and Vanderbilt Mansion national historic sites border the Hudson River. The Hudson River is tidally influenced until it reaches a dam at Troy, New York, 75 miles to the north. This estuarine/marine influence is undoubtedly responsible for the presence of unique plant communities and animal species at the national historic sites, uncommon or lacking in the rest of eastern Dutchess County. Flora Aquatic macrophytes and other wetland plant species and algae/phytoplankton are almost wholly undocumented at Roosevelt-Vanderbilt national historic sites. Inventories of aquatic macrophyte and algae/phytoplankton communities are limited to one 18-year old study at Eleanor Roosevelt National Historic Site (Pandullo Quirk Associates 1979). Pandullo Quirk Associates (1979) sampled aquatic macrophytes at Upper Val-Kill Pond. Ten species were observed, with fanwort (Cabomba caroliniana), duckweed (Lemna minor), and smartweed (Polygonum punctatum) as the dominating species in percent cover. Secondary species included bulthead-lily (Nuphar variegatum), coontail (Ceratophyllum demersum), purple loosestrife (Lythrum salicaria), and cattail (Typha lat~folia). This study, although providing baseline data in the form of a species list, is dated due to the present-day domination of purple loosestrife in Upper Val-Kill Pond and other wetland areas. However, standing crop measures from August 1979 provide quantitative baseline data for comparative purposes. Smartweed, an emergent macrophyte, had the highest standing crop (1,479.3 dry g/m2) and reached highest concentrations in the upper portion of the pond. The bullhead-lily, a rooted macrophyte with floating leaves, had the second highest standing crop (686.8 dry g/m2), and was found primarily just downstream of the smartweed concentration. Fenwort, a submerged macrophyte, had the lowest (of the three species) standing crop (254.9 dry g/m2).
32
Pandullo Quirk Associates (1979) also classified wetlands into four vegetation associations representing successional stages in wetland vegetation. Open water is first colonized by pond macrophytes. As sediment is trapped and organic material is deposited on the bottom, the water gets shallower and wet meadow vegetation (33 species) begins to encroach on the pond. As the wet meadow vegetation type fills in with sediment and organic materials, a shrub swamp vegetation (16 species) succeeds it. Red maple/sedge vegetation (17 species) would be the subsequent stage in wetland vegetational development. As discussed above, these species lists are important starting points, but many changes in plant community structure and function have undoubtedly occurred during the intervening years. Pandullo Quirk Associates (1979) also sampled phytoplankton during the summer of 1979 from Upper Val-Kill Pond. Species richness ranged from 14 to 18 species in June to 33 species in July. There was also a marked 10-fold increase in total abundance from June to July. The June samples were dominated by diatoms (10 to 11 species) followed by green algae (two to six species). Species richness and relative abundances were believed indicative of fair water quality. Diatoms again dominated in July (22 species); however, two species of Fragilaria accounted for approximately 75% of the diatom numbers. This dominance, in addition to a secondary dominance by blue-green algae (Oscillatoria sp.) indicated a degradation in water quality as summer progressed. Other types of plant communities at Roosevelt-Vanderbilt national historic sites, such as cattail and/or common reed (Phraginites australis) marshes, sphagnum swamps, shrub swamps, wet meadows, riparian and intertidal areas, and aquatic macrophyte/phytoplankton from other impoundments have not been adequately described, mapped, or studied. Most documented information is limited to anecdotal comments contained in other studies that have different objectives (e.g., Kiemens et al. 1992). Compounding this is the fact that these areas are usually very sensitive to environmental degradation. Lack of population data or even a complete species list make it difficult to protect such plant communities from external threats such as the continuing pattern of land development in Dutchess County and its associated impacts. Personnel of Roosevelt-Vanderbilt national historical sites have not documented any state or federally listed plant species. However, a park-wide vegetative survey is underway by the Brooklyn Botanic Garden, and results are expected in 1997. Fauna Pandullo Quirk Associates (1979) assessed the aquatic invertebrates of the Eleanor Roosevelt National Historic Site. Fifty-three species of benthic and planktonic invertebrates were collected from Fall Kill and Upper Val-Kill Pond. Pond zooplankton (22 species) was dominated by Rotifera, Cladocera, Copepoda, and Chironomidae. The benthic habitat of the pond produced 19 species; Amphipoda, Chironomidae, Mollusca, and Annelida dominated. The stream benthic community represented the most species rich (30 species) community encountered. Isopoda and Chironomidae were dominant, but with the presence of several clean-water taxa such as
33
Ephemeroptera (mayflies), Trichoptera (caddisflies), Coleoptera (beetles), and Mollusca, Pandullo Quirk Associates (1979) concluded that the aquatic invertebrates of both the pond and stream represent healthy, stable communities. Bode et al. (1995) conducted a biological stream assessment on Crum Elbow Creek. Four sites were sampled, two of which were on Vanderbilt Mansion National Historic Site: one between Route 9 and the upper pond and the other at the Coach House service road bridge. Twenty-three species of aquatic invertebrates were collected at the Route 9 station with dominant taxa including Sphaerium sp. (Mollusca), Ephemeroptera, Trichoptera, and Chironomidae. The other station on NPS property produced 16 species with Sphaerium sp. primarily dominant and Coleoptera secondarily dominant. The primary purpose of this biological assessment was to address general water quality, particularly in relation to the prior discharges of alum to the stream by the Hyde Park Fire and Water District water treatment facility (Schmidt et al. 1986). The methodological approach of this biological assessment is a modified version of what has generically become known as Rapid Bioassessment Protocols (Pflakin et al. 1989). The study concluded that invertebrate communities in Crum Elbow Creek downstream of the former treatment plant showed no adverse impacts attributable to alum applications. Overall, the biological integrity of the invertebrate community equated to an assessment of water quality that ranged from good to excellent across the sampling stations. With the exception of a qualitative benthologic study of limited scope in the tidal cove at the Home of Franklin D. Roosevelt National Historic Site (Kelly and Perrotte 1989), no other work on invertebrates has been conducted at Roosevelt-Vanderbilt national historic sites. Schmidt (1995) surveyed the fishes of Roosevelt-Vanderbilt national historic sites, documenting 20 species. Considering the relatively small size of these national historic sites, this survey documented the presence of a substantial ichthyofauna. Schmidt sampled eight fish species representing four families (Table 3) from two locations on the Fall Kill at Eleanor Roosevelt National Historic Site. These species are indicative of lentic waters and/or species with general habitat preferences. This would be expected because Upper and Lower Val-Kill ponds have changed the stream environment to one more lake-like. A previous study (Schmidt 1986) of the Fall Kill documented a similar concentration of lentic species south of the Hyde Park city limits. Collections by Pandullo Quirk Associates (1979) at Eleanor Roosevelt National Historic Site added three species not found by Schmidt (1995): goldfish (Carassius auratus), an unidentified catfish (Ictaluridae) species, and an unidentified minnow (Notropis sp.). The latter, in all probability, is N. hudsonius. Schmidt (1995) collected 11 fish species representing four families (Table 3) from Crum Elbow Creek on the Vanderbilt Mansion National Historic Site. The impoundments yielded most of these species since the majority of the free-flowing stream has a bedrock substrate that is unsuitable for some stream fishes (Schmidt 1995). An earlier study of Crum Elbow Creek upstream of the park boundary (Schmidt et a!. 1986) found three species (chain pickerel (Esox niger), yellow perch (Percafiavescens), and brown trout (Salmo trutta)) not observed in the 1995
34
study. Schmidt (1995) noted that this creek would go dry downstream of the water treatment plant during summer droughts, and was characterized by low species richness and low numbers. Now that Crum Elbow Creek is no longer the drinking water source for Hyde Park, fish species are apparently recolonizing the area. Schmidt (1995) cited the presence of the cutlips minnow (Exoglossum maxillingua) as a probable result of this recolonization. Only two species were found in Meriches Kill on the Home of Franklin D. Roosevelt National Historic Site, blacknose dace (Rhinichthys atratulus) and American eel (Anguilla rostrata) (Schmidt 1995; Table 3). Given the small size of and limited fish habitat in Meriches Kill, Schmidt does not expect other species except occasional downstream migrants from Roosevelt Cove.
Ten species representing eight families were collected from Roosevelt Cove (Table 3). Schmidt (1995) concluded that Roosevelt Cove contains a typical Hudson River tidal marsh fish fauna. Based on previous studies of Hudson River tidal marsh fishes, Schmidt was able to tentatively classify fishes as residents, seasonal inhabitants, or occasional strays (Table 3).
The presence of rare and state threatened reptile/amphibian species prompted a detailed herpetological inventory. Klemens et al. (1992) surveyed all three national historic sites (primary emphasis was on Eleanor Roosevelt National Historic Site) for herpetofauna with an emphasis on Blanding’s turtle (Emydoidea blandingii), a state threatened species.
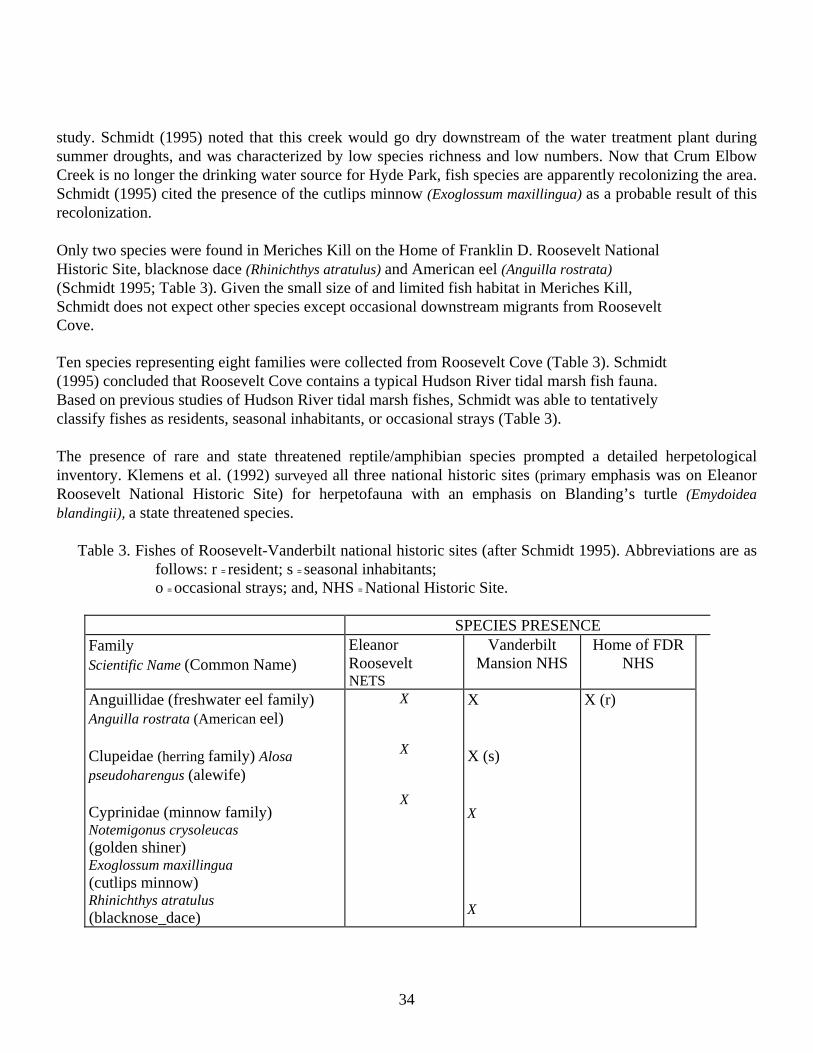
Table 3. Fishes of Roosevelt-Vanderbilt national historic sites (after Schmidt 1995). Abbreviations are as follows: r = resident; s = seasonal inhabitants; o = occasional strays; and, NHS = National Historic Site.
SPECIES PRESENCE Family Scientific Name (Common Name)
Eleanor Roosevelt NETS
Vanderbilt Mansion NHS
Home of FDRNHS
Anguillidae (freshwater eel family) Anguilla rostrata (American eel) Clupeidae (herring family) Alosa pseudoharengus (alewife) Cyprinidae (minnow family) Notemigonus crysoleucas (golden shiner) Exoglossum maxillingua (cutlips minnow) Rhinichthys atratulus (blacknose_dace)
X
X
X
X X (s) X X
X (r)

35
Table 3. Continued from page 34. Family Scientific Name (Common Name)
SPECIES PRESENCE
Eleanor Roosevelt
NHS
Vanderbilt Mansion NHS
Home of FDRNETS
Cyprinus carpio (carp) Notropis hudsonius (spottail shiner) Catostomidae (sucker family) Catostomus commersoni (white sucker) Esocidae (pike family) Esox americanus (redfin pickerel) Fundulidae (killifish family) Fundulus diaphanus (banded killifish) Fundulus heteroclitus (mummichog) Gasterosteidae (stickleback family) Apeltes quadracus (fourspine stickleback) Centrarchidae (sunfish family) Ambloplites rupestris (rock bass) Lepomis auritus’ (redbreast sunfish) Lepomis gibbosus (pumpkinseed) Lepomis macrochirus (bluegill) Micropterus salmoides (largemouth bass) Pomoxis nigromaculatus (black crappie) Moronidae (temperate bass family) Morone americana (white perch) Percidae (perch family) Percaflavescens (yellow perch)
X
X
X X X X X
X (r)
X
X X X X X
X
X (s)
X (r)
X (r)
X (r)
X(r)
X (r)
X (o)
1Listed as rare by New York Natural Heritage Program, but Schmidt (1995) considers this listing amistake.
36
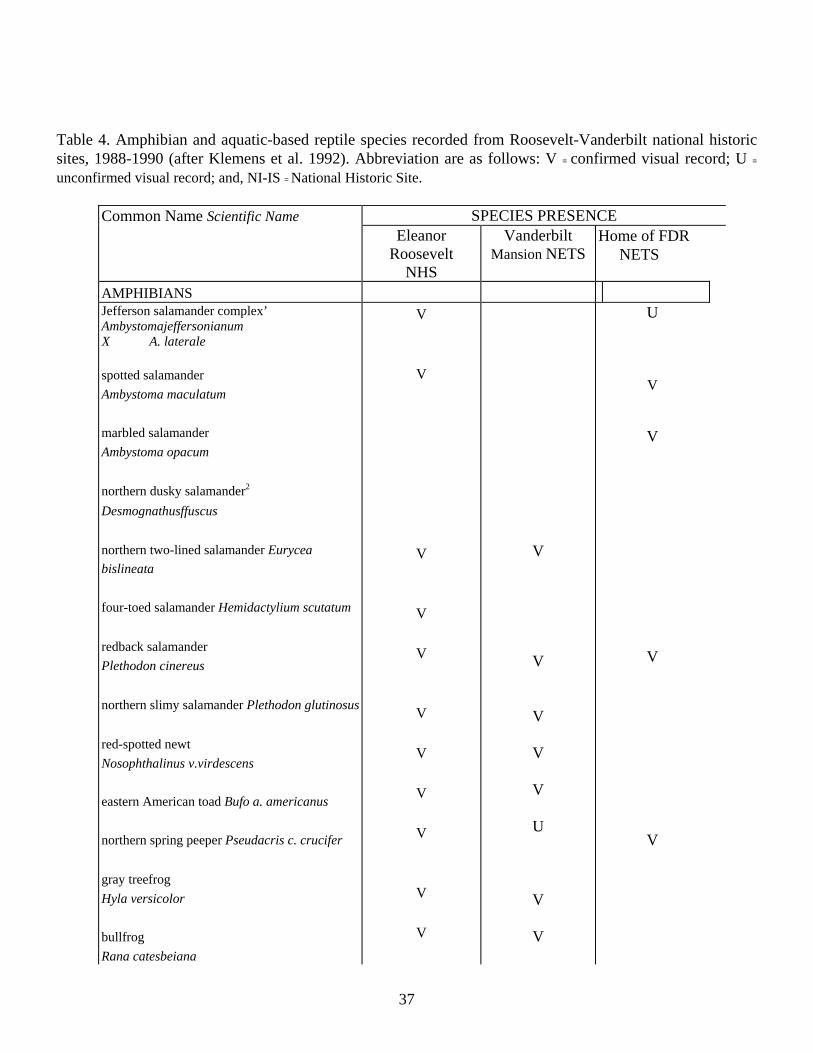
A total of 16 amphibian species and eight aquatic-based reptile species were documented (Table 4). This represents 65% of the total herpetofauna of the Hudson Valley, and highlights the importance of Roosevelt-Vanderbilt national historic sites in maintaining regional biodiversity. Blanding’s turtle is essentially a midwestern species, and its presence in Dutchess County represents a disjunct, relictual distribution (Klemens et al. 1992). A small population of this turtle occurs at Eleanor Roosevelt National Historic Site; individuals were captured in Middle Woodland Pond, Buttonbush Pond, and the shrub swamp that fringes Upper Val-Kill Pond. Blanding’s turtle does not appear to use either lobe of Upper Val-Kill Pond nor was it found at either the Home of Franklin D. Roosevelt or Vanderbilt Mansion national historic sites. Eleanor Roosevelt National Historic Site appears to be a regionally significant site for Blanding’s turtle and the only area in the Fall Kill watershed where multiple sightings of this species have occurred since 1979 (Klemens et al. 1992). The small size of Upper Val-Kill Pond and the presence of this state threatened species in the fringing shrub swamp, will undoubtedly complicate compliance issues involving rehabilitation of the pond to historic conditions. Besides Blanding’s turtle, several other species are currently listed by the New York Department of Environmental Conservation as special concern or threatened (Table 4). With increasing urbanization in Dutchess County, Roosevelt-Vanderbilt national historic sites will become more important as a refuge for many of these species. It is important that park managers recognize the significance of these national historic sites in preserving this regionally significant herpetofauna (Kiemens et al. 1992). Park management activities, therefore, should minimize negative impacts on these species.
37
Table 4. Amphibian and aquatic-based reptile species recorded from Roosevelt-Vanderbilt national historic sites, 1988-1990 (after Klemens et al. 1992). Abbreviation are as follows: V = confirmed visual record; U =
unconfirmed visual record; and, NI-IS = National Historic Site. Common Name Scientific Name SPECIES PRESENCE
Eleanor Roosevelt
NHS
Vanderbilt Mansion NETS
Home of FDR NETS
AMPHIBIANS Jefferson salamander complex’ Ambystomajeffersonianum X A. laterale spotted salamander Ambystoma maculatum marbled salamander Ambystoma opacum northern dusky salamander2 Desmognathusffuscus northern two-lined salamander Eurycea bislineata four-toed salamander Hemidactylium scutatum redback salamander Plethodon cinereus northern slimy salamander Plethodon glutinosus red-spotted newt Nosophthalinus v.virdescens eastern American toad Bufo a. americanus northern spring peeper Pseudacris c. crucifer gray treefrog Hyla versicolor bullfrog Rana catesbeiana
V
V
V
V
V
V
V
V
V
V
V
V
V
V
V
V
U
V
V
U
V
V
V
V

38
Table 4. continued from page 37. Common Name ScientifIc Name SPECIES PRESENCE
Eleanor Roosevelt
NETS
Vanderbilt Mansion NHS
Home of FDRNETS
AMPHIBIANS (continued) greenfrog Rana clamitans melanota pickerel frog Rana palustris woodfrog Rana_sylvatica
V
V
V
V
V
V
V
V
REPTILES common snapping turtle Chelydra s. serpentina painted turtle Chrysemys p. picta Xp. marginata spotted turtle’ Clemmys guttata wood turtle’ Clemmys inscuipta
V
V
V
V
V
V
V
V
V
Blanding’s turtle3 Emydoidea blandingii common map turtle Graptemys geographica common musk turtle Sternotherus odoratus eastern box turtle Terrapene c. carolina
V
V
V
V
V
V
V
‘New York State Species of Special Concern.
2 Collected from tributary stream to Staatsburg Reservoir, adjacent to NPS land. 3New York State Threatened Species.

39
PARK DEVELOPMENT AND OPERATIONS Water Supply Two units, Vanderbilt Mansion National Historic Site and the Home of Franklin D. Roosevelt National Historic Site, are supplied with potable water by the Hyde Park Fire and Water District. Eleanor Roosevelt National Historic Site is supplied potable water by two wells. There are no current water supply issues. The Eleanor Roosevelt National Historic Site water supply system is tested monthly for fecal coliform and results are reported to the Dutchess County Department of Health. Other parameters (lead and nitrate) are sampled annually. Waste Disposal Like the Town of Hyde Park, waste disposal at Roosevelt-Vanderbilt national historic sites is handled by septic systems. A large number of existing tanks have been replaced in the last few years, and no major problems have been reported. However, elevated nitrate levels from water quality monitoring stations downstream of National Park Service septic systems may indicate a potential problem. Consumptive Use Recreational fishing is the only consumptive use permitted in the park. This is a minor activity and poses no problems at this point. The Park Compendium of Regulations issued by the Superintendent prohibits the taking of reptiles and amphibians, which otherwise would be allowed under state law. Road Dc-Icing Operations Heavy salt use by local and state highway departments during winter months has the potential to increase chloride levels in surface and ground waters. However, park water quality monitoring efforts from 1994 to present have not detected elevated levels. Impoundments At Vanderbilt Mansion National Historic Site, a series of four concrete dams form impoundments on Crum Elbow Creek. It is important to maintain the integrity and pond size of these concrete dams and impoundments as historical elements of the cultural landscape. Originally, one of the impoundments was used for hydroelectric generation, but this has been discontinued. At the Home of Franklin D. Roosevelt National Historic Site, there is one concrete dam that forms the impoundment known as the Ice Pond. Historically this pond was used for ice production on the Roosevelt Estate. Siltation will eventually require maintenance of the dam and pond.

40
At Eleanor Roosevelt National Historic Site, the upper Fall-Kill impoundment created by Franklin Roosevelt in 1925 has formed a 7-acre pond and associated wetlands. Since 1970, the pond has undergone a 50% reduction of the open water, primarily through vegetative encroachment, especially non-native purple loosestrife. In order to maintain the cultural landscape, this pond needs to have a large amount of sediment and vegetation removed. Completion of this task is the highest-priority natural resource issue at the park. All dams are inspected and certified safe on an annual basis by the Natural Resource Conservation Service of the U.S. Department of Agriculture.
STAFFING AND ONGOING PROGRAMS Roosevelt-Vanderbilt national historic sites have a total of 57 full-time equivalent (FTEs) positions. However, the natural resource program currently consists of only 1.5 FTEs, a permanent Natural Resource Specialist and a seasonal Biological Technician. In recent years, budget problems and ceilings on FTE levels have repeatedly forced the seasonal position to remain unfilled. In addition, the Natural Resource Specialist has additional responsibilities at Saratoga National Historical Park and other parks in the New England Cluster. Ongoing programs include the previously-discussed water quality monitoring program on four park streams: Crum Elbow Creek, Fall Kill, Meriches Kill, and Bard Rock Creek. In addition, the park is interested in integrating a bioassessment approach into the water quality monitoring program. During 1996-1997, the park will install a stream gage on the Fall Kill. This gage will serve to capture water quantity data preliminary to expected environmental compliance needs prior to any reclamation of Upper Val-Kill Pond.

41
WATER RESOURCE ISSUES
RESTORATION OF UPPER VAL-KILL POND TO HISTORIC CONDITIONS (ELEANOR ROOSEVELT NATIONAL HISTORIC SITE)
Rapid silt deposition of Upper Val-Kill Pond, created by the construction of a concrete dam across the Fall Kill, prompted President Roosevelt to have the pond periodically dredged. Since the last known dredging in the 1950s, up to 13.65 feet of silt has accumulated (Pandullo Quirk Associates 1979; Allen and Bobinchock 1986). Reduction in depth by silt deposition, presumably accompanied by rising nutrient loads (in part due to adjacent residential septic systems), has resulted in the establishment of emergent aquatic plants, both native species as well as purple loosestrife, an invasive exotic perennial. As the growing season progresses, increased plant growth reduces the amount of open water which is gradually altering the character of the historic landscape. The National Park Service is mandated to preserve cultural landscapes at historic sites, and the general management plan (National Park Service 1980), cultural landscape report (Kane and Carruth 1981), and enabling legislation for Eleanor Roosevelt National Historic Site direct the maintenance of the historic character of the site. Natural lakes tend to have diffuse sources of inflowing water, relatively low watershed areas compared to lake surface area, and long hydraulic residence times. Typically, impoundments differ in all of these traits, having one or two major tributaries, a very large watershed compared to lake surface, and relatively short hydraulic residence times. Accordingly, the contributions of dissolved and particulate organic and inorganic materials from impoundment watersheds are also likely to be very high. These differences account for the great variances in water quality that can occur between lakes and reservoirs. Impoundments are extremely efficient sediment traps. Filling in with silt is part of a reservoir’s natural aging pattern, but poor land management practices can speed up the process significantly. Suspended sediment particles that can be easily carried by streams settle out once they reach the relatively quiescent impoundment basins. Sedimentation is a very important process that affects phytoplankton biomass levels, phytoplankton community succession, and transfers of organic matter, nutrients, and particle-associated contaminants from the reservoir’s upper layers to the bottom sediments. Many toxic contaminants become strongly associated with (adsorbed to) suspended particles. The influx of pesticides, herbicides, and toxins adhered to soil particles is becoming an increasingly common problem in impoundments. Incoming silt can bring other problems as well. Silt-laden water can reduce light penetration and, consequently, the light available to algae. Many species of fish are sight feeders; they cannot locate prey efficiently in muddy waters. Silt deposits can also prevent successful hatching of fish eggs that require clean surfaces. Finally, excessive levels of silt can irritate fish tissues, cause physiological damage, and reduce vigor.

42
Depth problems result from loss of volume in an impoundment because of increased sediment load. Increased sediment generally leads to problems with turbidity. The reduction in depth can disrupt uses and encourage extensive weed growth. Increased sediment loads originate externally as soil erosion in the watershed or internally from decaying algae and weeds in the lake itself. The loss of total volume, or infilling, is a problem in a majority of impoundments. Dredging has been and continues to be one of the major restorative approaches used in lake/impoundment management. Dredging, however, doesn’t stop the soil erosion in the watershed. Many operational and compliance issues remain to be resolved before dredging can occur. Operational issues include conducting necessary preliminary studies and understanding alternative dredging techniques and the disposal of dredged material. Compliance issues include environmental analyses necessary under the National Environmental Policy Act and applicable executive orders; other federal laws including the Endangered Species Act and Section 404 of the Clean Water Act; applicable state laws; and, permitting. An obstacle to dredging is the potential existence of Blanding’s turtle habitat within and adjacent to Upper Val-Kill Pond and/or the use of the pond as a migration corridor (Klemens et a!. 1992). Alternative dredging techniques and time frames need to be explored to minimize the effects of dredging.
ADEQUACY OF WATER QUALITY MONITORING PROGRAM (ALL SITES)
While generally good water quality exists within the streams flowing through Roosevelt-Vanderbilt national historic sites, nonpoint source pollutants associated with increasing residential and urban sources could impact existing water quality. These sources include potential contamination from subdivision/commercial development, runoff associated with agriculture and developed areas, septic system leachate, winter use of salt on roads, and lawn and garden chemicals. Residential and commercial development often results in the reduction of infiltration areas, which can increase storm water runoff and alter discharge and hydrologic patterns. This, in turn, may lead to additional sediment loading and channel scour in the receiving stream. In addition, improperly designed slope development or poor construction practices can also increase surface erosion and sediment load. Many of the residences surrounding the park also contain expansive lawn areas, which undoubtedly receive applications of lawn chemicals including fertilizers and pesticides. Little information is currently available regarding the types or amounts of chemicals applied or the potential for runoff of these chemicals into adjacent streams. Contaminants frequently associated with storm water runoff from commercially developed areas including highways and parking lots include total suspended solids, heavy metals, polycyclic aromatic hydrocarbons, and road salts (Ball et al. 1991).

43
Septic tank leachate presents another possible source of water contamination. Visitor facilities and administration buildings within the park rely upon septic systems and leach fields for sewage disposal. Residential and commercial development in the surrounding communities rely exclusively upon septic systems. Understanding these potential impacts, the park initiated a baseline surface water quality program in 1994. The purpose of this program was to provide a long-term record for a minimal set of key parameters which might serve to flag deteriorating water quality. In addition, the familiarity with stream conditions and visual observations by park staff obtained during monitoring might prove useful in detecting possible stream quality deterioration. Once stream water quality degradation is detected, the park would notify the appropriate regulatory state agency. While the field portion of the monthly monitoring program was successfully implemented, the monitoring program lacks an adequate quality assurance/quality control program, and does not provide a mechanism for effective data interpretation and reporting. The quality assurance and quality control, data management, and data interpretation problems experienced in the existing program are not unique to the park. Rather, these problems have been encountered in many National Park Service units where staffing and/or resources have not been sufficient to adequately implement monitoring programs, assure proper quality assurance and quality control, sufficiently evaluate, analyze and report data, and to work with the appropriate regulatory authorities when corrective action is necessary. In addition, the limited number of parameters monitored and/or the location of monitoring stations may not adequately address the types of contamination often associated with nonpoint source pollution. While a program to monitor all of the possible impacts from various nonpoint sources would be extremely costly and is not warranted, the park should initiate a modified long-term monitoring program designed to: 1) continue to flag potential degradation resulting from nonpoint source contamination; 2) provide a more complete assessment of baseline water quality; 3) periodically appraise the health of the aquatic ecosystem; 4) incorporate appropriate quality assurance/control procedures; and 5) compare collected data with other existing state and federal monitoring efforts being undertaken in the lower Hudson River basin. The data collected from this program would greatly assist efforts to upgrade the current classification of the parks’ streams by the State of New York.

44
WETLAND AND RIPARIAN RESOURCE DELINEATION AND MANAGEMENT (ALL SITES)
The parks contain a complex and varied pattern of palustrine, !acustnne, and riverine wetland systems (Cowardin et al. 1979) that primarily result from past glacial activities and their affects on physiography, soils, and hydrology. Ecologically, wetlands provide habitat for a diversity of flora and fauna, some of which is rare, threatened, or endangered. At the local and regional levels, the parks’ wetlands provide for landscape diversity. In terms of water quality, wetlands can improve or maintain water quality by nutrient removal and retention, chemical and microbial processing of some organic constituents, and by trapping and reducing suspended sediment loads. The socio-cultural value of wetlands is also important; particularly the role wetlands play in natural flood control by storing flood waters and slowing flood flows. The values and functions of inland wetlands have been reviewed in detail by Mitch and Gosselink (1986). From a regulatory perspective, specific authorities for protection of wetland resources of the National Park Service are found primarily in the National Park Service Organic Act, the Clean Water Act, the National Environmental Policy Act, and Executive Order 11990 -- Protection of Wetlands. A detailed listing of National Park Service responsibilities in regard to wetland protection is presented in the NPS Floodplain Management and Wetland Protection Guidelines, 45 FR 35922, Section 9. The legal authorities and ensuing regulations for wetlands evolved out of recognition of the invaluable contributions of wetlands to the maintenance of hydrological and biological integrity of aquatic ecosystems. Wetlands in inland regions generally include marshes, shallows, swamps, bogs, wet meadows, and other lands inundated or saturated by water to varying degrees. The National Park Service guidelines call on park units to inventory wetland areas that are currently or potentially subject to public use or development, where the magnitude of hazard and impact of human activities is likely to be the greatest. If available, park units should use wetland inventory maps prepared by the U.S. Fish and Wildlife Service for sites of proposed action. If the information is still inadequate, the park is to conduct an on-site analysis performed by professionals qualified to determine wetlands based on the definition in the Wetlands Executive Order. National Wetland Inventory maps are available for the Roosevelt-Vanderbilt national historic sites, but the data are not digitized (Elliot, C., pers. comm. 1997). Additionally, the geographic information system for the park includes some limited mapping of wetlands, primarily at Vanderbilt Mansion National Historic Site. However, the scale used in these mapping efforts is not sufficiently detailed to permit detection of changes due to natural or human influences, such as the subtle and gradual changes that may be occurring with respect to habitat boundaries and species composition changes. Also, the inadequate information contained in the maps does not meet park management needs especially in regard to National Park Service regulatory policies.

45
There is also a similar lack of information with regard to the wetland plant and animal communities at Roosevelt-Vanderbilt national historic sites. Inventories of wetland plant communities are limited to one 18-year old study at Eleanor Roosevelt National Historic Site. Management staff at Roosevelt-Vanderbilt national historic sites identified this issue during the scoping process for this plan and are aware of the importance of understanding the parks’ wetland resources. Critical to this understanding is an accurate baseline map of the wetland plant communities supported by up-to-date quantitative data regarding the composition and structure of these communities. The map must be meaningful to a variety of users, including resource managers, researchers, planners, interpretive staff, operations personnel, and the general public. Until an accurate baseline map is established, attempts to detect and quantify wetland vegetation change, whether from natural or human caused disturbance or from natural ecological successional processes, will not be successful.
MONITORING SEDIMENTATION RATES IN PONDS (ALL SITES)
Past work (Pandullo Quirk Associates 1979; Allen and Bobinchock 1986) at Eleanor Roosevelt and the Home of Franklin D. Roosevelt national historic sites determined the need for field surveys of all Roosevelt-Vanderbilt national historic sites’ impoundments to determine: 1) the amount of silt accumulation; and, 2) the rate of accumulation. Determination of the amount and rate of sedimentation provides an important advance warning of the need to dredge these impoundments, thus providing adequate time to plan for resource expenditures. It also has important repercussions with respect to geotechnical studies of dams (i.e., sediment buildup exerts static pressure on the dam face), eutrophication, and allogenic succession. Allen and Bobinchock (1986) found that the previous sediment survey at Upper Val-Kill Pond by Pandullo Quirk Associates (1979) was flawed; therefore, they could not determine the rate of sedimentation, although estimates of sediment buildup were possible. However, this information is now needed by the park to plan for the restoration of the pond to historic conditions. The study by Allen and Bobinchock provides the park with the necessary basis to conduct a similar survey that would provide the sedimentation rate and determine the amount of sediment buildup over the intervening years. The survey by Allen and Bobinchock (1986) was the first of its type completed for the Ice Pond at the Home of Franklin D. Roosevelt National Historic Site. Therefore, the actual rate of sedimentation could not be determined. Despite the lack of precise information on sedimentation, they crudely estimated another 100 years before infilling reduces the volume of retained water to 20% of capacity. This estimate needs to be verified by conducting another survey. No other sedimentation surveys have been conducted on any other park impoundment. Allen and Bobinchock (1986) called for additional surveys to be completed 5 years later, or in 1991, to update and quantify rates of sedimentation. To date, that has not been done. Information on sedimentation amount and rate is important because ultimately this information assists the park in preserving the cultural landscapes at Roosevelt-Vanderbilt national historic sites.
46
POTENTIAL RISK OF ZEBRA MUSSEL COLONIZATION
In 1986, larvae of an exotic freshwater moliusc, the zebra mussel (Dreissena polymorpha), was released via ship ballast into Lake St. Clair, Michigan (Miller et al. 1992). In 1991, just 3 years after it was first discovered in Lake St. Clair, zebra mussels were collected in the Illinois, upper Mississipppi, Susquehana, lower Ohio, Tennessee, and Cumberland rivers (Miller et al. 1992; Ludyanskiy et al. 1993), and have been confirmed from the lower Hudson River (U.S. Geological Survey 1997). Using alkalinity maps and water chemistry databases (Larsen and Christie 1993; Whittier and Paulsen 1992) for the Northeast, Whittier et a!. (1995) determined that the lake population in most of Dutchess County, including Roosevelt-Vanderbilt national historic sites, showed high relative risk to zebra mussel invasion. However, the zebra mussel cannot colonize equally in the Northeast, in part, because soft water causes ion exchange and reproductive problems when the calcium reaches a lower limit of approximately 12 mg/l and pH drops below 7.3 (Whittier et al. 1995). The rapid spread of this exotic species is of concern to water resource managers because of its ability to cause economic damage (e.g., clogging intake pipes, fouling boat hulls) and ecological change (e.g., major increases in water clarity, impacts on native mussels). Moreover, numerous hypotheses about its potential long-term ecological impacts (e.g., disrupting food chains, destroying spawning beds) have been discussed in both the technical (Nalepa and Schloesser 1993) and popular press. Zebra mussels are usually no more than two inches in diameter with characteristic zebra-like stripes (Miller et al. 1992). Unlike native mussels that burrow in sand and gravel, zebra mussels spend their adult lives attached to hard substrata. The rapid spread and abundance of zebra mussels can be partly attributed to their reproductive cycle (Snyder et al. 1994). Zebra mussels do not spawn simultaneously. In waters of the United States, larvae can be found from May to October. Native mussels reproduce at a specific time, usually spring. In addition, native mussels usually become reproductive when they are 5 or more years old, unlike the zebra mussel which can reproduce after 1 year or less (Miller et al. 1992). A fully mature female zebra mussel may produce up to one million eggs per season (Snyder et al. 1994). Zebra mussels disrupt the aquatic food chain because they compete for the same type of food as fish larvae and other larger zooplankton (Snyder et al. 1994; Hogan 1995). They eat mostly algae in the 15-40 micrometer size range. Each adult mussel, however, is capable of filtering one or more liters of water each day. They remove nearly all particulate matter, including phytoplankton and some small forms of zooplankton. Instead of passing any undesired particulate matter back into the water, zebra mussels bind it with mucous into loose pellets called pseudofeces that are ejected and accumulate among the shells in the colony (Miller et a!. 1992; Snyder et al. 1994). This mass accumulation could affect the density and biomass of native mussels, immature insects, and other invertebrates, and cover spawning beds used by stream fishes. In the Hudson River,
47
researchers are discovering that zebra mussels are dramatically impacting both phytoplankton and zooplanklon populations, dropping them to less than 20 percent of their normal concentrations (Hogan 1995). Given the fact that zebra mussels are present in the lower Hudson River, the risk of zebra mussel colonization of waters in Roosevelt-Vanderbilt national historic sites needs to be explored. Zebra mussel colonization of park waters could occur via two avenues: introduction through human activities, and ‘natural’ range extension. The potential for introduction should be assessed from the following: 1) Is there an upstream source of the mussels or infested tributaries?; 2) Is there any barge traffic?; 3) Is there heavy boat use and/or a large number of anglers moving boats and equipment from infested waters?; 4) Are the boats coming in from contaminated waters?; 5) Is fish stocking occurring in the watershed, and what is the source water? 6) What is the source of bait sold at local bait and tackle shops?; and, 7) Are adjacent water bodies infested? (Jennings, S., Pers. comm., 1997). If the answer to one or more of these questions is ‘yes’, there is a risk for accidental introduction of zebra mussel. Currently, the only concern at Roosevelt-Vanderbilt national historic sites is the infested adjacent waters. In order for the zebra mussel to extend its range, it needs the appropriate physical and chemical habitat characteristics. For example, if water velocity exceeds 4.9 ft/sec, there is limited opportunity for larvae settlement. Also, if you have backwaters or a lake-like environment (such as behind a dam) then the risk increases. Sustained water velocities greater than 4.9 ft/sec probably occur in the park only during storm events and heavy snowmelt runoff; however, the impoundments and associated backwaters on Crum Elbow Creek, Meriches Kill, and Fall Kill increase the risk of invasion. Based on the limited amount of data collected by the parks’ water quality monitoring program (see appendix B), pH is only sporadically below 7.3 with few monitoring stations having mean pH values below 7.3. Calcium is not a measured parameter in the park’s water quality monitoring program, but alkalinity, which has a direct relationship with calcium (in mg/l) (Whittier et al. 1995), is measured. Alkalinity ranges from 52 to 220 mg/l over all monitoring stations in the park (appendix B). Using a plot of alkalinity versus calcium for the Northeast from Whittier et al. (1995), this alkalinity range equates to calcium concentrations well below the 12 mg/l threshold. From a chemical standpoint, park waters do not appear conducive for zebra mussel colonization and population growth.

48
RECOMENDATIONS
RESTORATION OF UPPER VAL-KILL POND TO HISTORIC CONDITIONS (ELEANOR ROOSEVELT NATIONAL HISTORIC SITE)
Dredging is the only practical way to bring about pond improvement when shoaling is a problem, and dredging has therefore become one of the most frequently prescribed techniques (North American Lake Management Society 1988 and Scott, S., pers. comm. 1997). Sediment removal through dredging can limit submerged aquatic macrophyte growth through deepening, thereby producing light limitation, or by removing favorable sediments to growth. The amount of sediments removed, and hence the new depth and associated light penetration, is critical to successful long-term control of rooted, submerged macrophytes. There appears to be a direct relation between water transparency, simply determined by a Secchi disk, and the maximum depth of colonization by macrophytes. Canfield et al. (1985) provide equations to estimate the maximum depth of colonization in Florida and Wisconsin (probably representative enough of New York conditions) from Secchi disk measurements. Dredging equipment can be classified as mechanical, hydraulic, and pneumatic (Palermo and Pankow 1980; Permanent International Association of Navigation Congresses 1989; Cooke et al. 1986). Mechanical dredging is the excavation of sediment using such devices as clamshell dredges, dipper dredges, draglines, grab buckets, and in some instances front-end loaders and backhoes. The common feature of mechanical dredgers is that all systems consist of containers which are being conveyed. These containers differ in size and form. Mechanical dredgers rely on direct physical contact between the container and the materials to be dredged. The mechanical dredge usually leaves an irregular, cratered bottom and is responsible for generating a large amount of turbidity throughout the water column. Most frequently, mechanical dredgers use barges to receive and to transport the dredged material. These types of dredgers are better suited to harbors and navigation channels because of their size; however, they do extract about one to ten yards of material per grab and there is very little water entrained by the process (30 to 40% solids). Each step of the mechanical dredging operation from initial dredging to final placement is subject to spills and splashing which allow sediment to return to the water. The hydraulic dredge operates on the principle of the centrifugal water pump. A vacuum is created on the intake side of the pump and atmospheric pressure acts to force water and sediments through the suction pipe. However, there is a lot of water entrained by the process (only 6% solids). The dredged materials are either hydraulically pumped via a floating pipeline to the disposal area or dumped into barges or trucks which transport the material to the disposal area. Examples of hydraulic dredges are plain suction, cutterhead-suction, dustpan, sidecase, and trailing hopper.

49
An improvement to the plain suction dredge is the cutterhead. In this dredge, the suction head is fitted with a rotating basket that can have blades or teeth depending on the type of material to be removed. The cutterhead is the most common dredge in use in the U.S. today. It is versatile, efficient and comes in sizes from 6 inches to over 30 inches. The dredge is moved into position by a push boat and is held stable by a stern spud which is anchored into the sediment. The cutterhead suction dredger is particularly effective for maintenance dredging projects in a variety of soil types. Most of the turbidity associated with a cutterhead dredging operation is in the immediate vicinity of the rotating cutterhead. In general, the disadvantage of the suction dredgers is that they leave an irregular bottom and that there is a limited range of materials that can be efficiently dredged. The big advantage is that this dredger is capable of a larger output than any other dredger of comparable power. The pneumatic system was developed in Italy and Japan. The Italian system, called Pneuma System, contains a pump operated by compressed air and consists of three chambers which serve intake receptacles for the material to be dredged and from which the mixture is then discharged either through pipeline or to barges. This pump can dredge only loose and free-flowing materials such as sand and soft silt. This Pneuma System is suited to dredge contaminated material, if operated carefully. The oozer dredger in Japan has a so-called “oozer pump”, a kind of pneumatic pump which consists of a vacuum pump, an air compressor, and a drag head. The vacuum pump creates a negative pressure inside the drag head, thereby causing materials to flow into the pump by water pressure and atmospheric pressure. This system permits dredging at shallow locations, and the dredged material is transported via a pipeline to the disposal place or dumped into barges or trucks for further transport. The oozer pump has good production and is very well suited to dredge contaminated matter. In hydraulic and pneumatic dredging operations, metal or plastic pipelines (the latter only for non-abrasive material) are used to transport dredged material in a water/soil mixture. The pipelines may be either floating, submerged, or on land. They are normally used for discharge into a reclamation area or, in some cases, for discharge into barges or trucks. A floating pipeline is usually supported by means of airtight pontoons or metal cylinders used in pairs and placed on either side of the pipe at suitable intervals to provide buoyancy. The cutterhead suction dredger for instance, is connected to the shore by its floating pipeline and this must be arranged to allow the dredger to advance forward as far as possible without having to stop operation. Palermo and Pankow (1980) rated the various types of dredgers based on the following criteria: availability, safety, resuspension, maneuverability, clean up, cost and production, flexibility, compatibility, draft, and access. Three hydraulic dredges rated the highest with the cutterhead coming in second. The cutterhead holds the following advantages: it is considered the standard hydraulic dredge and is widely available; operation can be optimized with respect to resuspension; and, there are many experienced, capable operators available.

50
With any dredging operation, the potential for serious negative impacts on the pond and surrounding area is very high. Many of these problems are short-lived and can be minimized with proper planning. Among the most serious environmental problems is the failure to have a disposal area of adequate size to handle the high volume of turbid, nutrient-rich water that accompanies the sediments. Unless the sediment water slurry can be retained long enough for evaporation, the runoff water will be discharged to a stream or lake. Turbidity, algal blooms, and dissolved oxygen depletions may occur in the receiving waters. These problems may also develop in the lake during the dredging operation itself, but this is usually temporary. While the potential for negative impacts is high, proper dredge selection and disposal area design will minimize them. Sediment removal via dredging operations is expensive. Peterson (1981) reported a cost range of $0.18 per cubic yard to $10.71 per cubic yard for 64 projects (in 1975 dollars), and found that costs from $0.95 to $1.33 were common and could be considered “reasonable” for hydraulic dredging. Steve Scott (pers. comm. 1997) confirmed that these costs are still applicable in 1997. Dredging costs are highly variable, depending upon site conditions, access, nature of the sludge, and other factors. For example, dredging costs of $10.71 per cubic yard usually involves contaminated sediments or extraordinary disposal needs. In addition, the costs Peterson (1981) reported do not include disposal, transport, or monitoring costs. The dredging of Upper Val-Kill Pond, including actual dredging of jurisdictional wetlands and disposal of spoil, represent a federal activity that must comply with the National Environmental Policy Act and Section 404 of the Clean Water Act. An environmental assessment would be required. In particular, this environmental assessment must also show compliance with Executive Order 11990 (Protection of Wetlands). Due to the complexities of the dredging operation, the environmental assessment should be either contracted out to a local environmental consulting firm with expertise in both dredging and environmental assessments, or to the Denver Service Center, the centralized planning expertise of the National Park Service. Every state and many federal agencies have institutional requirements that must be met before lake restoration can be implemented, thus the park is encouraged, at the start of the environmental assessment process, to conduct an on-site meeting with representatives of the U.S. Army Corps of Engineers, U.S. Fish and Wildlife Service, and appropriate state agencies (e.g., in New York state a dredge/fill operation might require a Mine Land Reclamation permit if spoils are great). This meeting should assist in anticipating problems with the project, thereby avoiding negative reviews once the environmental assessment is released to the public. The environmental assessment should be structured with two alternatives: the no-action alternative and the action (i.e. dredging) alternatives. Much of the rationale for the type of dredging method chosen is discussed above, and can be used in the development of the action alternative. All other alternatives, primarily non-dredging, should be analyzed briefly and dismissed. All information needed to fulfill the permits should be contained in the comprehensive environmental assessment, and the assessment should essentially act as the pond restoration plan.

51
The feasibility of the proposed action should be determined by a reputable, local contractor with expertise in dredging activities, especially those represented by the situation at Upper Val-Kill Pond. Another possibility is to use the services of personnel of the U.S. Army Corps of Engineers, Waterways Experiment Station in Vicksburg, Miss. The Station has some of the world’s foremost authorities on dredging, and much of its work is done on a reimbursable basis (Scott, S., pers. comm. 1997). A feasibility study should include not only the dredging method, but also the disposal method and location. This study should also provide preliminary costs which must be presented in the environmental assessment. The following information will be needed for the environmental assessment and feasibility study:
• delineate all wetlands that will be impacted, both directly or indirectly by the dredging operation. Delineated wetlands include those under jurisdiction by the U.S. Army Corps of Engineers, and those determined pursuant to the NPS Floodplain Management and Wetland Protection Guidelines, 45 FR 35922;
• conduct functional assessment of wetlands to determine changes in wetland functions and
values as a result of direct and/or indirect impacts;
• complete sediment surveys to determine the amount of sediment to be dredged and the rate of sedimentation;
• determine the annual runoff from the surrounding watershed or the amount of stream inflow;
• verify, using additional field surveys, that no other protected species or species of special
concern could be impacted by the proposed action;
• analyze the pond sediments for the presence of heavy metals, chlorinated hydrocarbons, and other potential toxic materials. Special precautions will be required if these substances are present in high concentrations;
• determine the spoil disposal once the amount of material to be dredged is known. For on-site
disposal, the location and size of disposal area must be determined, and the impacts of this type of disposal must be analyzed. If on-site disposal and presampling disposal requirements are not feasible, the only reasonable alternative is to truck the spoil off-site. This will require knowing, in advance, potential off-site disposal locations and their capacity to accommodate the amount of spoil. Regardless of the location of disposal, procedures must conform with local, state, and federal requirements. This might require monitoring of the runoff or leachate from the disposal area.
Kiemens et a!. (1992) suggested the following mitigative measures with regard to Blanding’s turtles and a dredging operation: a) the shrub swamp adjacent to the upper portions of Upper Val

52
Kill Pond is now considered critical habitat for Blanding’s turtles, so any dredging that occurs should be done in a manner that does not draw down the water from Upper Val-Kill Pond. Further, that the lower lobe of the pond can be isolated by placing sheet piling across the pond at its narrowest point. Water can then be drained from the lower lobe while the water level behind the sheet piling is maintained; b) dredging should be conducted between April and September, when Blanding’s turtle is not hibernating in the mud; and, c) to minimize the number of turtles impacted by dredging activities, turtles should be trapped from the pond and placed in a temporary holding pen until dredging is completed. Trapping should occur about two weeks prior to any dredging. Exposing sediments to prolonged drying through drawdown also has its side-effects (North American Lake Management Society 1988). Some rooted plant species are permanently damaged by this condition and the entire plant, including roots and perhaps seeds, is killed if exposed for extended periods. Other species, however, are either unaffected or enhanced. Cooke et al. (1986) summarized the responses of 74 aquatic plants to drawdown. Algal blooms have occurred after some drawdowns. The causes are unclear, but may be related to nutrient release from sediments or to an absence of competition vascular plants. Drying can sharply reduce the abundance of benthic invertebrates essential to fish diets. Also, an oxygen depletion in the remaining water pool can occur, leading to fishkill. Dissolved oxygen should be monitored in small-volume systems, and an aerator should be installed if needed (North American Lake Management Society 1988).
PROPOSED CHANGES TO THE CURRENT WATER QUALITY MONITORING PROGRAM (ALL SITES)
The current water quality monitoring program at Roosevelt-Vanderbilt national historic sites should be modified as detailed below: 1. Parameters All parameters (Table 2) except the fecal coliform/fecal streptococcus analysis should be sampled on a quarterly basis. Fecal coliform analysis should continue to be conducted biannually. In addition, it is important to understand water quality dynamics during significant runoff events. Therefore, all parameters should be sampled during one significant runoff event per year (called a “floating” sample.) MacDonald et a!. (1991) and Sanders et a!. (1987) provide good discussions on the frequency of monitoring. Sampling frequency is a function of the statistical objectives of the monitoring project. Any change in the desired accuracy or reliability of the results directly affects the sample size and the choice of parameters. A monitoring project that is attempting to detect a relatively small change with a high degree of certainty will be more costly than a monitoring program with a lower standard for identifying a
53
statistically-significant change. More measurements will increase the precision and hence the ability to detect change, but the marginal cost and benefit of each additional measurement will vary according to the parameter. All of the parameters in Table 2 are subject to spatial and temporal variability, and this affects their relative precision and ability to detect change. The choice of sampling quarterly for the primary parameters in the monitoring program is based on: a) the amount of staff time, funds, expertise, and equipment needed to make and interpret an individual measurement; and, b) the typical sampling frequency of each of the parameters as discussed in MacDonald et a!. (1991). This physical/chemical sampling framework, coupled with some form of biological monitoring, should provide the park with an effective early warning system to detect changes from anthropogenic sources. Once detected a more intensive and costly short-term monitoring study may be needed to understand the source(s) of the observed changes. 2. Chemical Analysis All chemical analyses, i.e., alkalinity, nitrate/nitrogen, chloride, and phosphate, should be measured by a local water quality laboratory that uses techniques certified by the U.S. Environmental Protection Agency. Hach kits are notoriously insensitive at low chemical concentrations resulting in analyses that are below detection limits. Such has been the case for the first three years of the current monitoring program (see appendix A). Additionally, it is recommended that water samples be collected and tested for the presence of organic compounds. Those organic compounds tested should be the suite of chemicals known as Purgeable Aromatic Hydrocarbons, and commonly referred to as BTEX (for kenzene, toluene, ethyl benzene, and xylenes) which are associated with motor fuel contamination (Irwin, R., Pers. comm., 1997). The close proximity of the residential developments make this a more immediate concern at Eleanor Roosevelt National Historic Site than at the other two national historic sites. For the long-term, it is also important to test for the presence of the BTEX suite of organic chemicals in ground water samples at Roosevelt-Vanderbilt national historic sites, especially at Eleanor Roosevelt National Historic Site. Ground water monitoring wells could be installed in the shrub swamp, at the northern and southern edges of Upper Val-Kill Pond. These wells would be sunk to a depth of two feet below the water table. As well as testing for the presence of organic chemicals, these wells could be used to estimate potential transport of contaminants into park waters. 3. Turbidity Turbidity should be added to the list of parameters sampled at all sites except ELRO-2 (Figure 7). At ELRO-2, the Upper Val-Kill Pond site, the standard Secchi disk depth should be an added parameter. Increases in turbidity are caused by increases in suspended and colloidal matter that can cloud water and diminish light penetration. Turbidity is one expression of the effect of the concentration of suspended solids on the character of a water body (Flora et al. 1984). From 1994-1995,
54
turbidity was measured using a LaMotte Turbidity Water Test Kit. Since most of the turbidity measurements were below detectable limits, it was discontinued as a measured parameter in 1996. However, given the relative ease of measurement, the reduction in sampling frequency, and its correlation with suspended sediments and thus watershed condition, turbidity should remain a part of the water quality monitoring program. Likewise, Secchi disk depth, a determination of clarity in lentic environments, was a measured parameter in 1994, but was discontinued for a similar reason as that for turbidity. The same rationale as above can be used for its inclusion in the water monitoring program. Once Upper Val-Kill Pond is restored, this easy-to-measure parameter will become indispensable as a benchmark of pond condition. If resources allow, Secchi disk depth should be determined at all ponds within Roosevelt-Vanderbilt national historic sites. 4. Stream Discharge An obvious parameter missing from the monitoring program is stream discharge. A stage-discharge relation should be established at the following sites: VAMA-1, HOFR-1, and ELRO-1 (Figures 5, 6, and 7). Staff gages will need to be installed and a rating curve developed for each gaging site. This may require purchase or long-term loan of a flow meter. Purchase price of a quality flow meter ranges from about $1000 to $1500. At each of the above sites, a general reconnaissance should be made so that the most suitable site for the gage is selected. Consideration should be given to the following items (Carter and Davidian 1968):
• channel characteristics; • possibility of backwater from downstream tributaries or other sources; • availability of a nearby cross section where good discharge measurements can be made; • proper placement of a stage gage with respect to the measuring section and to that part of the
channel which controls the stage-discharge relation; and, • possibility of flow bypassing the site in ground water or in-flood channels.
The stage of a stream is the height of the water surface above an established datum plane. Measurements of stream stage are used in determining records of stream discharge. A record of stage can be obtained by systematic observations of a nonrecording gage. The advantages of the nonrecording gage are the low initial cost and the ease of installation. For example, attach a staff gage to a steel fence post and drive it into the stream bed so that some part of the scale is still immersed at the lowest expected water level of the sampling period and the top of the scale protrudes above the water at the highest level. The frequency of the staff gage readings is determined by accuracy requirements and the degree of expected water-level fluctuations. When unexpected alterations in the water supply occur that affect water level, a change in the predetermined visiting schedule is warranted.
55
Discharge measurements are normally made by the current-meter method, which consists of determinations of velocity and area in the parts of a stream cross section. The following is taken from Carter and Davidian (1968):
the cross section is divided into 20-30 partial sections, and the area and mean velocity of each is determined separately. A partial section is a rectangle whose depth is equal to the sounded depth at the meter location (a vertical) and whose width is equal to the sum of half the distances to the adjacent verticals. At each vertical the following observations are made: (1) The distance to a reference point on the bank, (2) the depth of flow, and (3) the velocity as indicated by current meter at one or two points in the vertical. These points are at either the 0.2 and 0.8 depths (two-point method) or the 0.6 depth (one-point method) from the water surface. The average of the two velocities or the single velocity at 0.6 depth, is taken to be the mean velocity in the vertical. The discharge in each partial section is computed as the product of mean velocity times depth at the vertical times the sum of half the distances to adjacent verticals. The sum of the discharges in all the partial sections is the total discharge of the stream.
Determination of discharge at a large majority of gaging stations is a result of the relationship between stage and discharge. These stage-discharge relations are rarely permanent, particularly at low flow, because of changes in the stream channel such as scour and fill, aquatic growth, ice, or debris or because of changes in bed roughness. Frequent discharge measurements are necessary to define the stage-discharge relationship at any time. Kennedy (1984) provides an in-depth discussion for determining the stage-discharge relationship. Observe the relationship by simply constructing a bivariate scatterplot with discharge the dependent variable (ordinate) and stage the independent variable (abcissa). To characterize this relationship, conduct a least-squares regression analysis to determine the best-fitting straight line. Additionally, the quality of the straight-line fit, confidence intervals, and prediction intervals can be estimated. Determining the water flow into and out of a pond, as well as recording changes in pond level, is essential for determining the annual nutrient, organic matter, and sediment loads to the pond and establishing the carrying capacity of the pond, the amount of sediment a pond can assimilate each year without exhibiting problems. A lake-level gaging station should be established on the Upper Val-Kill Pond. This usually consists of placing a staff gage in the lake and making regular readings. The frequency of these readings should at least be quarterly however, monthly readings would be preferable. Knowledge of lake level in the context of water levels in ground water monitoring wells (see above) allows a gross determination of ground water inputs (including associated contaminants) to the pond. 5. Monitoring Sites Since there is little distance between monitoring sites at the three national historic sites (Figures 5, 6, and 7), and because there appears to be no obvious anthropogenic inputs between sites that are reflected in the 1994-1996 sampling data (appendix B), the following sites should be eliminated (quarterly basis only): VAMA-3, HOFR-2, and HOFR-3. A new monitoring site

56
(ELRO-4) should be located on the unnamed eastern tributary to Upper Val-Kill Pond at Eleanor Roosevelt National Historic Site. This new monitoring site will be important in assessing nonpoint source pollution from residential/commercial development to the east of the park boundary. Biannual samples for fecal coliform/fecal streptococcus analysis should be collected from VAMA-1 and VAMA-2 (Figure 5), HOFR-1 and HOFR-3 (Figure 6), and ELRO-1 and ELRO-2 (Figure 7). The current water monitoring program also calls for fecal coliform/fecal streptococcus analysis from the VAMA-3 (Figure 5) site. This site should be eliminated from the program because data obtained there is a duplication of VAMA-1 and VAMA-2. Fecal coliform/fecal streptococcus analysis should also be conducted at the new monitoring site, ELRO-4, discussed above. Water quality parameter monitoring of Roosevelt Cove (station HOFR-4, see Figure 6) at the Home of Franklin D. Roosevelt National Historic Site is essential because of its unique ecological significance, although it is not within the boundaries of the site. However, the monitoring of the cove does compete for limited resources with the other sites in the water quality monitoring program. Partnerships with nearby universities or non-profit organizations should be pursued to provide resource assistance in the continued monitoring of the cove. In addition, water quality sampling at HOFR-4 should be conducted at low tide. 6. Photographic Monitoring During the quarterly sampling of each monitoring station, black and white photographs should be taken looking upstream and downstream of the station. Photographic monitoring is an inexpensive method to assess changes in stream geomorphology, the riparian zone, and other physical habitat features that may be associated with site and watershed conditions. A series of photographs would also allow detection of slow, progressive changes in physical habitat features that otherwise might go undetected until the accumulation of impacts is noticeable. 7. Biological Assessment Biological assessments should be conducted at the following sites on an annual basis (between June and September): VAMA-1; HOFR-1; and, ELRO-1 (Figures 5, 6, and 7). Historically, water resource managers either ignored biological systems or implemented policy with only narrow conceptions of biological conditions and their importance to human society. Reductionist viewpoints dominated water management; legal and regulatory programs avoided most biological issues and contexts; precise biological goals were not well developed or defined; field methods to measure biological condition were not established; links between field measurements and enforceable goals were weak; and approaches to measuring biological condition were not cost effective (Karr 1991). The phrase “biological integrity” was first used in 1972 to establish the goal of the Clean Water Act, “to restore and maintain the chemical, physical, and biological integrity of the Nation’s
57
waters.” This mandate clearly established a legal foundation for protecting aquatic biota. Unfortunately, the vision of biological integrity was not reflected in the act’s implementing regulations. These regulations were aimed at controlling or reducing release of chemical contaminants and thereby protecting human health; the integrity of biological communities was ignored (Karr 1991). As a result, aquatic organisms and aquatic environments have declined precipitously in recent decades. The present water resources crisis extends far beyond pollutant-caused degradation of water quality. We face loss of species, homogenized biological assemblages, and lost fisheries. Widespread recognition of the continued degradation of our water resources has stimulated numerous efforts to improve our ability to track the condition of aquatic ecosystems (Davis and Simon 1995). Comprehensive, multimetric indexes (Barbour et a!. 1995) were first developed in the midwestern United States for use with fishes (Karr 1981; Fausch et al. 1984; Karr et a!. 1986) and modified for use with invertebrates (Ohio EPA 1988; Plafkin et al. 1989; Kerans and Karr 1994; Deshon 1995; Fore et a!. 1996). The conceptual underpinnings of the multimetric approach have now been applied to a variety of geographic locations (Lyons et a!. 1995) and aquatic environments (Davis and Simon 1995), including large rivers, lakes, estuaries, wetlands, riparian corridors. Presently, more comprehensive approaches have been developed and are being adopted by state and federal agencies. Forty-seven states now use multimetric biological assessments of biological condition, and six states are developing biological assessment approaches; only three states used multimetric biological approaches in 1989 (U.S. Environmental Protection Agency 1996a). Efforts are at last being made to monitor the biological integrity of water resources as mandated by the Clean Water Act 25 years ago (Karr 1991; Davis and Simon 1995; U.S. Environmental Protection Agency 1996a,b). Among the most effective monitoring programs are those that improve the capability to detect a wide range of water quality problems by making use of a variety of chemical, toxicological, and biological assessment techniques. Figure 10 illustrates Ohio EPA’s (1988) finding that the use of a combination of chemical and physical analyses, bioassays, and biological field techniques can identify problems that were previously unknown or whose severity had previously been underestimated. The figure shows that at 6% of 431 sites assessed, chemical analyses detected impairment that biological surveys missed; and that at 36% of the sites, biological surveys detected impairment that chemical data missed. The biological assessment on Crum Elbow Creek by Bode et a!. (1995) is a conceptual clone of the multimetric approach using benthic invertebrates. It uses standardized methods for sampling and analysis and has been quality assured (Bode et a!. 1995). It uses four metrics: species richness; EPT value (total number of mayflies, stoneflies, and caddisflies); Hilsenhoff Biotic Index (measure of pollution tolerance of the sampled organisms); and, Percent Model Affinity (see Novak and Bode 1992). The description of overall stream water quality based on these biological parameters uses a four-tiered system of classification (non-impacted, slightly impacted, moderately impacted, and severely impacted). The level of impact is assessed for each metric and then combined for all metrics to form a consensus determination. The consensus is
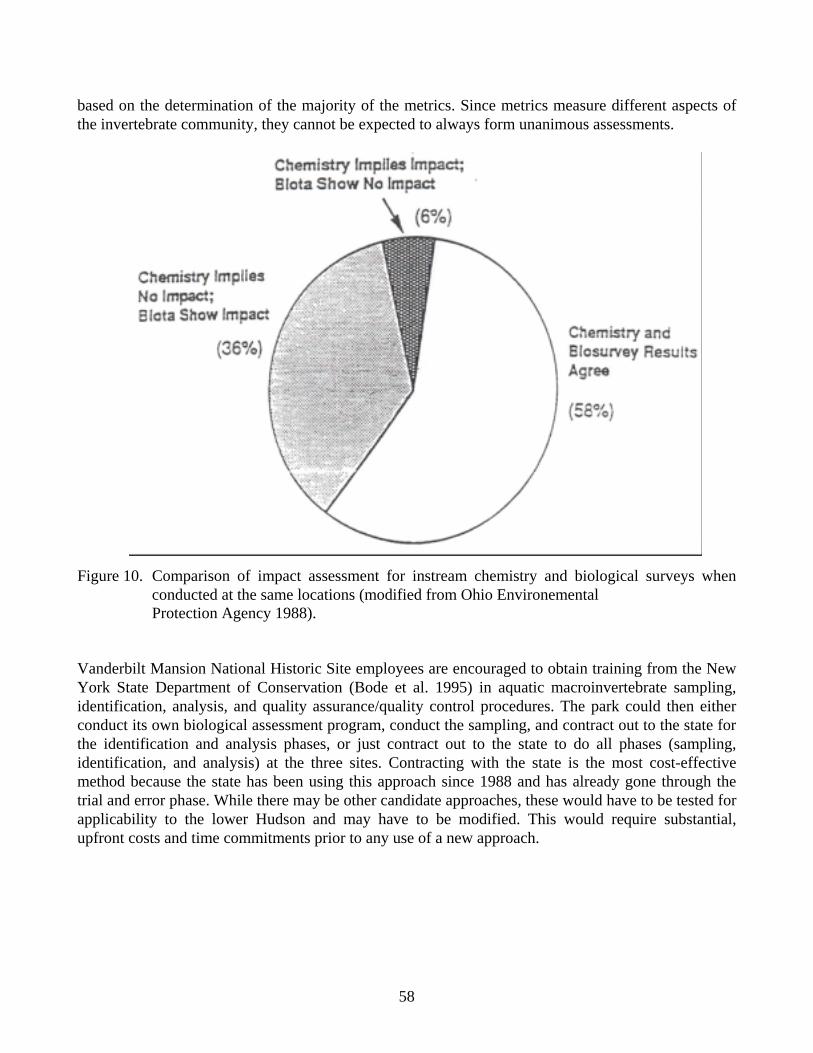
58
based on the determination of the majority of the metrics. Since metrics measure different aspects of the invertebrate community, they cannot be expected to always form unanimous assessments. Figure 10. Comparison of impact assessment for instream chemistry and biological surveys when
conducted at the same locations (modified from Ohio Environemental Protection Agency 1988).
Vanderbilt Mansion National Historic Site employees are encouraged to obtain training from the New York State Department of Conservation (Bode et al. 1995) in aquatic macroinvertebrate sampling, identification, analysis, and quality assurance/quality control procedures. The park could then either conduct its own biological assessment program, conduct the sampling, and contract out to the state for the identification and analysis phases, or just contract out to the state to do all phases (sampling, identification, and analysis) at the three sites. Contracting with the state is the most cost-effective method because the state has been using this approach since 1988 and has already gone through the trial and error phase. While there may be other candidate approaches, these would have to be tested for applicability to the lower Hudson and may have to be modified. This would require substantial, upfront costs and time commitments prior to any use of a new approach.

59
8. Water Quality Monitoring Plan Given the above proposed changes, the water quality monitoring plan (Hayes 1996) should be revised. Sanders et al. (1987) and MacDonald et al. (1991) provide excellent discussions on monitoring plans or aspects of these plans. In addition, the Water Resources Division can assist in this revision. The revised plan should establish a quality assurance/quality control program. This program would include, at the least, the delineation of field sampling and laboratory analytical methods, data storage and retrieval methods, and data analysis and interpretation. In particular, the park is encouraged to use its capability in GIS as a data analysis and interpretation tool. Annual summary reports should be prepared which would include the tabular presentation of the data, data analysis, and data interpretation. For a variety of reasons, many monitoring programs do not follow through to this step, and in such cases the worth of conducting the monitoring program must be questioned. In general, the multiple demands on staff time mean that the monitoring data will be used only if they are summarized and interpreted. The data are more likely to be evaluated by managers and used for the guidance of management decisions. These reports can also be reviewed by the Water Resources Division which will act as a feedback loop providing input into the continued adequacy of the monitoring program. These annual summary reports should be shared with other federal, state, and local agencies, as applicable. This will facilitate discussions with appropriate regulatory authorities when corrective action is necessary. Since the above changes require a further commitment of park resources, Project Statement ROVA-N-003.000 (see appendix B) addresses the modification of the water quality monitoring program and the concomitant resource needs.
WETLAND RESOURCE IDENTIFICATION (ALL SITES)
Protection of Roosevelt-Vanderbilt national historic sites wetland resources requires a knowledge base that permits the design of an adequate inventory and monitoring program of wetlands, vernal ponds, and related biological resources. This knowledge base is also needed to facilitate planning of maintenance and construction projects that minimize impacts on wetlands resources. The first step toward effective protection of the parks’ wetlands involves a careful mapping and field inventory. National Wetland Inventory maps are available, yet these maps are often dated and the scale (1:24,000) is not adequate to detect subtle changes that may be occurring with respect to habitat boundaries or species composition changes. It is recommended that wetlands of the park be mapped using fairly large scale color infrared aerial photography (perhaps 1:4800 or 1 inch = 400 feet). Such a wetlands vegetation map will become a part of the geographic information system of the park and will be referenced to soils, hydrologic data, and other information such as the National Wetlands Inventory maps (which may exist in digital form).

60
Ideally, this mapping should be done in conjunction with a park-wide vegetation or land cover map, with wetlands representing just a few of many cover types. Upon completion of the map, wetland locations and boundaries should be ground truthed and field inventories should be performed that focus on hydrological characteristics (surface and ground water levels), soils, plant species composition and vegetation structure of various wetland types, and faunal surveys. Particular attention to rare species occurrences and notation of critical habitat characteristics is recommended.
Given a baseline map and detailed field inventory, coupled with a routine monitoring program, staff resource managers will be able to detect the response of wetlands to various natural and human-induced disturbances. For example, are wetland surface and ground water levels increasing due to adjacent development activities? What is the response of vegetation composition, structure and wetland boundaries to changing hydrological, water quality, and climatic factors?
Project Statement ROVA-N-01 1.000 (see appendix B) describes a recommended approach for wetlands inventory and assessment activities at Roosevelt-Vanderbilt national historic sites.
MONITOR SEDIMENTATION RATES OF PONDS
(ALL SITES)
There are two generally accepted methods for the determination of recent sedimentation rates in impoundments (North American Lake Management Society 1988). One method involves the determination of the radioisotopes Cesium-137 or Lead-210 in the sediments. Although this method provides accurate estimates of sedimentation rates, it is relatively expensive.
The second method, which is far less sensitive but also much less expensive, is to compare the current bottom contours (the depth to the bottom) with a similar map made several years before. The water level for these two surveys must be the same for comparison or allowances should be made for differing water levels. Before any major dredging is undertaken, the rate of sedimentation should be determined. It is of little value to dredge a reservoir that is filling in at a rate of 2 inches or more per year if watershed controls for erosion are not implemented (North American Lake Management Society 1988).
This second method was used by Allen and Bobinchock (1986) in their sedimentation study of upper Fall-Kill Pond (Eleanor Roosevelt National Historic Site) and the Ice Pond (Home of Franklin D. Roosevelt National Historic Site). Not only does it provide an estimate of sedimentation rate, but it determines the amount of silt accumulation on the bed of impoundments. It is recommended (see Project Statement ROVA-I-010.000, appendix B) that the park use this approach to initiate a sediment monitoring program for these impoundments and others in the national historic sites. This would require establishment of permanent transects at each of the impoundments. The transects must be chosen to adequately characterize the bed configuration. Transects have already been established by Allen and Bobinchock (1986) for

61
upper Fall-Kill Pond and Ice Pond. There is an immediate need to resurvey the transects established by Allen and Bobinchock at upper Fall-Kill Pond and determine the sedimentation rate and amount of sediment that would need to be removed in the proposed dredging operation. This information is needed to determine, more accurately, the costs and impacts of a dredging operation.
At Ice Pond, Allen and Bobinchock (1986) determined that the average water retention capacity of the pond was 60% in 1996. They suggested that their survey be updated in 5 years to quantify the rate and amount of sedimentation. Therefore, it is further recommended that these surveys be conducted at five year intervals. These surveys could be done on a rotating basis by the park (i.e., ponds at one national historic site surveyed one year; ponds at another national historic site surveyed the next year, and so forth) so that the limited resources of the park are not greatly affected. Sedimentation surveys should become part of the park’s water quality monitoring plan (Hayes 1996) with appropriate discussion given to quality assurance, quality control, and data interpretation. These surveys should be discussed in the annual summary report of the water quality monitoring program, when appropriate.
MONITOR FOR PRESENCE OF ZEBRA MUSSELS
Given the close proximity of the now infested Hudson River, the risk for accidental introduction of the zebra mussel to park waters is high. However, the chemistry @H and calcium) of park waters appears to be a limiting factor for zebra mussel colonization and growth. Nevertheless, this pernicious species should not be underestimated.
Monitoring substrates that can be easily removed and examined should be placed in areas, such as HOFR-4, VAMA-3, and VAMA-4, where an early warning of the presence of zebra mussels is required (Miller et al. 1992). Concrete blocks suspended from ropes are frequently used. A set of PVC plates secured to a rope with a weight on the bottom is a preferred method because the plates have a know surface area and are easy to examine and scrape. Since zebra mussels grow very quickly, they should be recognizable within several weeks of initial settlement.
If zebra mussels are found in park waters, management options are generally limited. However, Roosevelt-Vanderbilt national historic sites should seek local/regional expertise through participation in cooperative programs or partnerships with federal, state, or local agencies.

62
LITURATURE CITED
Allen, J., and L. Bobinchock. 1986. ROVA Pond Sedimentation Study. Unpublished Report. National Park Service, North Atlantic Regional Office. Boston, MA.
Ayer, G., and F. Pauszek. 1968. Streams in Dutchess County, N.Y.: their flow characteristics and
water quality in relation to water problems. Bulletin 63, U.S. Geological Survey. Ball, D., R. Hamilton, and R. Harrison. 1991. The influence of highway-related pollutants on
environmental quality. Pages 2-47 in R. Hamilton and R. Harrison, editors. Highway Pollution. Elsevier Press, New York.
Barbour, M., J. Stribling, and J. Karr. 1995. Multimetric approach for establishing biocriteria and
measuring biological condition. Pages 63-77 in W. Davis and T. Simon, editors. Biological assessment and criteria: tools for water resource planning and decision making. Lewis Publishers, Boca Raton, FL.
Bode, R., N. Novak, and L. Abele. 1995. Biological stream assessment, Crum Elbow Creek, Dutchess
County, New York. New York Department of Environmental Conservation, Division of Water, Bureau of Monitoring and Assessment, Albany, NY.
Canfield, D., K. Langeland, S. Linda, and W. Hailer. 1985. Relations between water transparency and
maximum depth of macrophyte colonization in lakes. J. Aquat. Plant Management 23 :25-28. Carter, R., and J. Davidian. 1968. General procedure for gaging streams. Chapter A6 in Techniques of
Water-Resources Investigations of the U.S. Geological Survey. Cooke, G., E. Welch, S. Peterson, and P. Newroth. 1986. Lake and reservoir restoration. Butterworth
Pubi., Boston, MA. Cowardin, L., V. Carter, F. Goiet, and E. LaRoe. 1979. Classification of wetlands and deepwater
habitats of the United States. FWS/OBS-79/3l. U.S. Department of Interior, Fish and Wildlife Service, Washington, D.C.
Davis, W., and T. Simon. 1995. Biological assessment and criteria: tools for water resource planning
and decision making. Lewis Publishers, Boca Raton, FL. Deshon, J. 1995. Development and application of the invertebrate community index (ICI). Pages 217-
243 in W. Davis and T. Simon. Biological assessment and criteria: tools for water resource planning and decision making. Lewis Publishers, Boca Raton, FL.
Dutchess County Department of Planning. 1985. Natural Resources. Poughkeepsie, NY. Elliot, C. 1997. Personal communication. National Wetlands Inventory. U.S. Fish and Wildlife
Service, Denver, CO.
63
Fausch, K, J. Karr, and P. Yant. 1984. Regional application of an index of biotic integrity based on stream fish communities. Trans. Am. Fish. Soc. 113:39-55.
Flora, M., T. Ricketts, J. Wilson, and S. Kunkle. 1984. Water quality criteria: an overview for park natural
resource specialists. WRFSL Report 84-4. Water Resources Division, National Park Service, Fort Collins, CO.
Fore, L., J. Karr, and R. Wisseman. 1996. Assessing invertebrate responses to human activities:
evaluating alternative approaches. J. North Am. Benthological Soc. 15:212-231. Hayes, D. 1997. Personal observation. Resource Management Specialist. Roosevelt-Vanderbilt Historic
National Sites, Hyde Park, NY. Hayes, D. 1996. Water quality monitoring program, Roosevelt-Vanderbilt National Historic Sites. 1996
Program Update. Hyde Park, NY. Hogan, J. 1995. Discovering zebra mussels before they inflict damage. Dreissena! 6(5):4-5. Zebra Mussel
Information Clearinghouse, New York Sea Grant Extension, State University of New York, Brockport, NY. Irwin, R. 1997. Personal communication. Water Resources Division, National Park Service Fort Collins, CO. Jennings, 5. 1997. Personal communication. Resource Management Specialist, St. Croix National Scenic
Riverway, St. Croix Falls, WI. Kane and Carruth. 1981. Comprehensive report on the historic and cultural landscapes. Eleanor Roosevelt
National Historic Site, Hyde Park, NY. Karr, J. 1981. Assessment of biotic integrity using fish communities. Fisheries 6:21-27. Karr, J. 1991. Biological integrity: a long-neglected aspect of water resource management. Ecol. App. 1:66-84. Karr, J., K. Fausch, P. Angermeier, P. Yant, and I. Schlosser. 1986. Assessment of biological intergrity in
running water: a method and its rationale. Special Publication No. 5, Illinois Natural History Survey, Champaign, IL.
Kelly, M. and W. Perotte. 1989. The epiphytic invertebrates of Trapa mataus and Myriophyllum at Roosevelt
Cove, Hyde Park, New York. Kennedy, E. 1984. Discharge ratings at gaging stations. Chapter AlO Techniques of Water Resources
Investigations of the U.S. Geological Survey, Book 3. Kerans, B., and J. Karr. 1994. A benthic index of biotic integrity (B-IBI) for rivers of the Tennessee Valley.
Ecol. App. 4:768-785.

64
Klemens, M., R. Cook, and D. Hayes. 1992. Herpetofauna of Roosevelt-Vanderbilt National Historic Sites, Hyde Park, New York, with emphasis on Blanding’s turtle (Emydoidea blandingii). National Park Service, North Atlantic Regional Office. Tech. Rpt. NPS/NAROSS/NRTR-92-08, Boston, MA.
Larsen, D. and S. Christie. 1993. EMAP-surface waters 1991 pilot report. EPA/620/R-93/003. Environmental
Research Laboratory and Environmental Monitoring and Assessment Program, U.S. Environmental Protection Agency, Corvallis, OR.
Ludyanskiy, M., D. McDonald, and D. MacNeill. 1993. Impact of the zebra mussel, a bivalve invader.
Bioscience 43:533-544. Lyons, J., and S. Navarro-Perez, P. Cochran, E. Santana-C., and M. Guzman-Arroyo. 1995. Index of biotic
integrity based on fish assemblages for the conservation of streams and rivers in west central Mexico. Conserve. Biol. 9:569-594.
MacDonald, L., A. Smart, and R. Wissmar. 1991. Monitoring guidelines to evaluate effects of forestry activities
on streams in the Pacific Northwest and Alaska. EPA 910/9-91-001. U.S. Environmental Protection Agency, Seattle, WA.
Madison, R., and J. Burnett. 1984. Overview of the occurrence of nitrate in ground water of the U.S. Pages 93-
105 National water summary, 1984 - hydrologic events, selected water-quality trends, and ground-water resources. U.S. Geological Survey Water-Supply Paper 2275.
Miller, A., B. Payne, and R. McMahon. 1992. Zebra mussels: biology, ecology, and recommended control
strategies. Tech. Note ZMR-1-01, Zebra Mussel Research Program, Waterways Experiment Station, U.S. Army Corps of Engineers, Vicksburg, MS.
Mitch, W., and J. Gosselink. 1986. Wetlands. Van Nostrand Reinhold Co., New York. Nalepa, T., and D. Schloesser, eds. 1993. Zebra mussels: biology, impacts, and control. Lewis Publishers, Inc.,
Boca Raton, Fl. National Park Service. 1976. Final master plan. Vanderbilt Mansion National Historic Site. Hyde Park, NY. National Park Service. 1977. Master plan. Home of Franklin D. Roosevelt National Historic Site. Hyde Park,
NY. National Park Service. 1978a. Statement for management. Vanderbilt Mansion National Historic Site. Hyde
Park, NY. National Park Service. 1978b. Statement for management. Home of Franklin D. Roosevelt National Historic
Site. Hyde Park, NY. National Park Service. 1980. General management plan. Eleanor Roosevelt National Historic Site. Hyde Park,
NY.

65
National Park Service. 1995. Baseline water quality data, inventory and analysis, Roosevelt-Vanderbilt National Historic Site. Technical Report NPS/NRWRD/NRTR-95/64. National Park Service, Washington, DC.
National Park Service. 1996. Resource management plan. Roosevelt-Vanderbilt National Historic Sites. Hyde
Park, NY. North American Lake Management Society. 1988. The lake and reservoir restoration guidance manual. EPA
440/5-88-002, U.S. Environmental Protection Agency, Washington, D.C. Novak, M., and R. Bode. 1992. Percent model affinity: a new measure of macroinvertebrate community
composition. J. North Am. Benthological Soc. 1 l(1):80-85. Ohio Environmental Protection Agency. 1988. Biological criteria for the protection of aquatic life, volumes 1-3.
Ecological Assessment Section, Division of Water Quality Monitoring and Assessment, Ohio Environmental Protection Agency. Columbus, OH.
Omernik, J. 1987. Ecoregions of the conterminous United States. Annals of the Assoc. Am. Geographers
77(1):1 18-125. Palermo, M., and V. Pankow. 1980. Evaluation of dredges and dredging control technologies. Prepared for U.S.
Environmental Protection Agency, Boston, MA, as draft final report No. 10 of the New Bedford Harbour Superfund Project Acushnet River Estuary Engineering Feasibility Study of Alternatives for Dredging and Dredged Material Disposal.
Pandullo Quirk Associates 1979. Natural resources inventory at Eleanor Roosevelt National Historic Site, Hyde
Park, NY. Report on file at Roosevelt-Vanderbilt National Historic Sites, Hyde Park, NY. 93 pp. and appendices.
Permanent International Association of Navigation Congresses. 1989. Economic methods of channel
maintenance. Report of Working Group 14 of the Permanent Technical Committee II, Supplement to Bulletin N° 67. General Secretariat of PIANC. Brussels, Belgium.
Peterson, S. 1981. Sediment removal as a lake restoration technique. EPA-600/3-81-013. U.S. Environmental
Protection Agency, Washington, DC. Phillips, P., and D. Hanchar. 1996. Water-quality assessment of the Hudson River basin in New York and
adjacent states -- Analysis of available nutrient, pesticide, volatile organic compound, and suspended-sediment data, 1970-1990. U.S. Geological Survey, Water-Resources Investigations Report 96-4065. Troy, NY.
Plafkin, J., M. Barbour, K. Porter, S. Gross, and R. Hughes. 1989. Rapid bioassessment protocols for use in
streams and rivers: benthic macroinvertebrates and fish. EPA/44O/4-89-001. U.S. Environmental Protection Agency, Washington, DC.
Rogers, R. 1988. New York ground-water quality. Pages 385-392 in D. Moody, J. Carr, E. Chase, and R.
Paulson, compilers, National water summary, 1986 - hydrologic events and ground-water quality. U.S. Geological Survey Water-Supply Paper 2325.

66
Sanders, T., R. Ward, J. Loftis, T. Steele, D. Adrian, and V. Yevjevich. 1987. Design of networks for monitoring water quality. Water Resources Publications, Littleton, CO.
Schmidt, R. 1986. Water quality in the Failkill, Town of Poughkeepsie. Report to Poughkeepsie Conservation
Advisory Council, Poughkeepsie, NY. Schmidt, R. E. 1995. Fishes of the Roosevelt-Vanderbilt National Historic Sites, Hyde Park, New York. Dept.
of Interior, National Park Service, New England System Support Office. Tech. Rpt. NPS/NESO-RNR/NRTR/96-06, Boston, MA.
Schmidt, R., E. Kiviat, and D. Roeder. 1986. An ecological assessment of Crum Elbow Creek. Report to Hyde
Park Fire and Water District, Hyde Park, NY. Schmidt, R. 1995. Fishes of the Roosevelt-Vanderbilt National Historic Sites, Hyde Park, New York. Technical
Report NPS/NESO-RNR/NRTR/96-06, New England System Support Office, National Park Service, Boston, MA. 12 pp.
Scott, S. 1997. Personal Communication. Department of the Army, Waterways Experiment Station, Corps of
Engineers. Vicksburg, MS. Snyder, F., M. Hilgendorf, and D. Garton. 1994. Zebra mussels in North America: the invasion and its
implications. FS-045, Ohio Sea Grant Program, Ohio State University, Columbus, OH. Soil Conservation Service. 1955. Soil Survey, Dutchess County, New York. U.S. Department of Agriculture.
Series 1939, No. 23. U.S. Environmental Protection Agency. 1996a. Summary of state biological assessment programs for streams
and rivers. EPA 230-R-96-007. US Environmental Protection Agency, Office of Policy, Planning and Evaluation, Washington, D.C.
U.S. Environmental Protection Agency. 1996b. Biological assessment methods, biocriteria, and biological
indicators: bibliography of selected technical, policy, and regulatory literature. EPA 230-B-96-001. US Environmental Protection Agency, Office of Policy, Planning, and Evaluation, Washington, D.C.
U.S. Geological Survey. 1991. National water-quality assessment program - the Hudson River basin. Water Fact
Sheet. US Geological Survey, Albany, NY. U.S. Geological Survey. 1997. Map- zebra mussel distribution in North American. Nonindigenous aquatic
species data base at the Florida and Caribbean Science Center, Gainesville, FL. Whittier, T., A. Herlihy, and S. Pierson. 1995. Regional susceptibility of northeast lakes to zebra mussel
invasion. Fisheries 20(6): 20-27. Whittier, T. and S. Paulsen. 1992. The surface waters component of the Environmental Monitoring and
Assessment Program (EMAP): an overview. J. Aquat. Ecosystem Health 1:119-126.

67
PREPARES
Roosevelt-Vanderbilt Mansion National Historic Sites David J. Hayes, Resource Management Specialist
Northeast Regional Office, National Park Service
Charles “Norm” Farris, Water Resources Liaison
Water Resources Division, National Park Service David L. Vana-Miller, Hydrologist

68
APPENDIX A: WATER QUALITY DATA, 1994 TO 1997

69
ROOSEVELT-VANDERBILT NHS WATER QUALITY MONITORING PROGRAM . 1994 DATA, ALL SITES
SAMPLE WATER POINT DATE TEMP SALINITYCONDUCT pH DO ALKALINITY NITRATE PHOSPHATE CHLORIDE TURBIDITY (C) (ppt) (mhos) (ppm) (ppm) (ppm) (ppm) (ppm) (JTU) HOFR-1 09-Feb-94 000 0.1 326 7.9 19.0 154.7 0 ND 53.3 0 HOFR-1 01-Jul-94 18.00 0.0 517 7.6 15.6 162 ND ND 66 0 HOFR-1 20.Sep-94 17.50 0.0 470 7.1 12.2 200 0.6 0 100 0 HOFR-1 18-Oct-94 8.20 0.0 422 7.7 15.0 ND ND ND ND ND HOFR-1 21-Dec-94 3.10 0.0 320 7.8 14.0 ND 0 0 80 0 HOFR-2 09-Feb-94 0.00 0.0 287 8.0 19.5 148 ND ND 46.7 0 HOFR-2 01-Jul-94 17.80 0.0 490 7.8 16.3 156 ND ND 66 0 HOFR-2 20-Sep-94 14.10 0.0 297 6.5 12.6 220 0 0 100 0 HOFR-2 18-Oct-94 8.90 0.0 395 8.1 15.5 ND ND ND ND ND HOFR-2 21-Dec-94 3.67 0.0 310 7.6 11.0 ND 0 0 80 0 HOFR-3 02-Feb-94 0.00 0.0 78 7.0 19.9 122 ND ND ND 0 HOFR-3 02-Jul-94 17.25 0.0 490 7.0 14.4 144 ND ND 60 0 HOFR-3 20-Sep-94 12.90 0.0 388 7.2 14.4 180 1.2 0 61.7 0 HOFR-3 18-Oct-94 8.60 0.0 354 7.9 15.9 ND ND ND ND ND HOFR-3 06-Jan-95 0.75 0.0 250 7.1 19.5 ND 0 0.06 65 0 HOFR-4 02-Feb-94 0.00 0.0 130 6.5 16.0 64 ND ND ND 5.8 HOFR-4 02-Jul-94 23.25 0.0 242 7.3 12.5 84 ND ND 32 5 HOFR-4 20-Sep-94 16.30 0.0 271 7.5 13.4 80 0 0 28 0 HOFR-4 18-Oct-94 9.20 0.0 188 8.0 13.8 ND ND ND ND ND HOFR-4 01-Jan-95 0.25 0.0 120 7.3 19.2 ND 0 0 60 20 VAMA-1 23-Feb-94 0.00 0.0 305 7.7 19.2 89 ND ND 35 0 VAMA-1 29-Jun-94 22.60 0.0 403 7.5 15.8 126 <0.2 ND 62 0 VAMA-1 23-Sep-94 14.80 0.0 265 7.2 15.8 110 0.9 0 65 0 VAMA-1 18-Oct-94 9.30 0.0 288 7.6 16.0 ND ND ND ND ND VAMA-1 09-Dec-94 2.80 0.0 138 7.8 12.8 100 0 0 40 0 VAMA-2 23-Feb-94 0.00 0.0 213 7.0 16.0 102 ND 45 5.2 VAMA-2 01-Jul-9421.20 0.0 467 7.3 15.9 126 <0.2 60 0 VAMA-2 23-Sep-94 15.00 0.0 342 7.4 11.8 127 0 0 73.30 VAMA-2 18-Oct-94 10.00 0.0 262 7.5 16.7 ND ND ND ND ND VAMA-2 09-Dec-94 2.10 0.0 138 8.1 9.6 80 0 0 40 0 VAMA-3 23-Feb-94 0.00 0.0 207 6.5 18.5 104 ND 42 0 VAMA-3 01-Jul-9421.00 0.0 428 7.7 18.0 116 <0.2 66 0 VAMA-3 23-Sep-94 15.30 0.01242 7.6 18.1 120 1.5 0 80 0 VAMA-3 18-Oct-94 9.90 0.0 264 7.8 16.2 ND ND ND ND ND VAMA-3 09-Dec-94 2.40 0.0 151 7.6 7.5 80 0 0 40 0 VAMA-4 23-Sep-94 16.00 0.0 488 7.6 18.4 120 0 0 67 6 VAMA-4 18-Oct-94 10.70 0.0 212 7.5 14.6 ND ND ND ND ND VAMA-4 09-Dec-943.10 0.0 124 7.5 10.5 80 0 0 40 0 ELRO-1 04-Mar-94 0.00 0.5 420 7.0 15.8 80 ND ND 50 5 ELRO-1 23-Jun-94 19.30 0.0 462 7.2 2.2 119 ND ND 92 5 ELRO-1 20-Sep-94 15.25 0.0 431 7.8 16.3 140 0 0 120 5 ELRO-1 18-Oct-94 9.50 0.0 299 8.0 11.9 ND ND ND ND ND ELRO-1 09-Dec-94 0.80 0.0 158 8.7 10.2 80 0 0 70 5 ELRO-2 03-Mar-94 ND ND ND ND ND ND ND ND NDND ELRO-2 23-Jun-94 19.90 0.0 504 6.8 1.4 132 <0.2 ND 115 1.6 ELRO-2 20-Sep-94 14.90 0.0 515 7.7 14.1 135 0 0 120 0 ELRO-2 18-Oct-94 9.10 0.0 343 7.8 11.1 ND ND ND ND ND ELRO-2 09-Dec-941.00 0.0 167 7.4 9.8 80 0 0 60 5 ELRO-3 04-Mar-94 0.00 0.0 258 7.0 13.8 84 ND 50 5 ELRO-3 17-Jun-94 19.30 0.0 394 6.6 5.4 121 ND 94 0 ELRO-3 23-Sep-94 15.00 0.0 437 6.3 11.9 140 0 0 100 5 ELRO-3 18-Oct-949.90 0.0 318 7.9 13.1 ND ND ND ND ND ELRO-3 09-Dec-94 1.20 0.0 157 7.0 7.2 80.0 0.0 0.0 60.0 5 Notes: ND=no data collected; BDL=below detection limits; DO=dissolved oxygen; CONDUCT=conductivity; TDS—tetal dissolved solids

70
ROOSEVELT-VANDERBILT NHS WATER QUALITY MONITORING PROGRAM-1995 DATA, HOME OF FDR NHS
SAMPLE WATER POINT DATE TEMP SALINITY TDS CONDUCT pH DO DO ALKALINITY NITRATE PHOSPHATE CHLORIDE TURBIDITY (C) (ppt) (mhos) (ppm) (%) (ppm) (ppm) (ppm) (ppm) (JTU) HOER-i 23-Jan-95 3.00 BDL ND 295 6.60 13.00 ND ND ND ND ND ND HOFR-i 23-Feb-95 2.50 BDL ND 428 7.50 9.00 ND ND ND ND ND ND HOFR-i 27-Mar-95 8.00 BDL ND 282 6.80 12.00 ND 180 0.6 0.14 85 <5 HOFR-1 25-Apr-95 10.75 BDL ND 410 7.00 11.00 ND ND ND ND ND ND HOER-1 23-May-95 12.25 BDL ND 450 8.00 10.00 ND ND ND ND ND ND HOER-i 30-Jun-95 17.6 BDL 292 583 7.78 6.00 ND 180 2.02 0.06 80 <5 HOER-i 31-Jul-95 20.9 BDL 222 423 7.55 8.00 ND ND ND ND ND ND HOFR-1 06-Sep-95 17.0 BDL 315 631 7.88 4.50 ND ND ND ND ND ND HOER-i 25-Sep-95 13.7 BDL 289 577 8.11 9.30 ND 220 0.523 0.1 80 ND HOFR-1 27-Oct-95 10.4 BDL 225 451 8.33 10.30 ND ND ND ND ND ND HOER-i 29-Nov-95 3.2 BDL ND 464 7.80 11.90 ND ND ND ND ND <5 HOER-i 11-Jan-95 1.3 BDL 269 536 8.18 13.30 95 160 ND BDL 65 BDL HOFR-2 23-Jan-95 4.00 BDL ND 270 7.30 12.00 ND ND ND ND ND ND HOFR-2 23-Feb-95 3.00 BDL ND 310 9.50 12.00 ND ND ND ND ND ND HOFR-2 27-Mar-95 9.00 BDL ND 360 11.60 11.00 ND 40 3.25 0.16 70 <5 HOER-2 25-Apr-95 10.00 BDL ND 380 7.10 11.00 ND ND ND ND ND ND HOFR-2 23-May-95 11.OO BDL ND 350 8.00 10.00 ND ND ND ND ND ND HOFR-2 30-Jun-95 16.80 BDL 243 534 7.96 8.00 ND 160 1.14 BDL 60 <5 HOFR-2 31-Jul-95 20.90 BDL 215 397 7.9 8.00 ND ND ND ND ND ND HOER-2 06-Sep-95 16.70 BDL 293 582 7.96 4.30 ND ND ND ND ND ND HOER-2 25-Sep-95 13.30 BDL 274 547 8.05 9.90 ND 180 1.672 0.04 80 <5 HOFR-2 27-Oct-95 9.70 BDL 219 440 8.5 10.40 ND ND ND ND ND ND HOFR-2 29-Nov-95 2.90 BDL ND 453 7.9 11.50 ND ND ND ND ND ND HOER-2 11-Jan-96 1.00 BDL 255 510 8.2 15.20 112 140 0.35 0.08 80 <5 HOFR-3 25-Jan-95 3.00 BDL ND 250 7.20 12.00 ND ND ND ND ND ND HOFR-3 23-Feb-95 2.50 BDL ND 250 8.70 11.00 ND ND ND ND ND ND HOER-3 20-Mar-95 7.00 BDL ND 285 6.50 12.00 ND 110 1.6 BDL 60 <5 HOFR-3 25-Apr-95 9.25 BDL ND 310 7.10 11.00 ND ND ND ND ND ND HOFR-3 23-May-95 11.50 BDL ND 320 8.00 9.00 ND ND ND ND ND ND HOFR-3 30-Jun-95 17.90 BDL 241 466 8.05 7.00 ND 160 2.82 0.22 60 <5 HOFR-3 31-Jul-95 20.60 BDL 184 357 7.54 8.00 ND ND ND ND ND ND HOFR-3 06-Sep-95 17.20 BDL 254 508 8.06 7.80 ND ND ND ND ND ND HOFR-3 26-Sep-95 14.80 BDL 229 443 8.11 8.70 ND 160 1.672 0.16 60 <5 HOFR-3 27-Oct-95 9.90 BDL 192 405 8.50 9.20 ND ND ND ND ND ND HOFR-3 29-Nov-95 3.00 BDL 209 417 7.99 11.20 84 ND ND ND ND ND HOFR-3 11-Jan-96 1.20 BDL 223 453 7.62 16.50 124 120 ND 0.12 55 <5 HOFR-4 25-Jan-95 3.00 BDL ND 120 7.50 12.00 ND ND ND ND ND ND HOFR-4 23-Feb-95 1.00 BDL ND 150 8.00 11.00 ND ND ND ND ND ND HOFR-4 20-Mar-95 5.00 BDL ND 175 6.70 12.00 ND 100 1.6 0.14 35 10 HOFR-4 25-Apr-95 10.50 BDL ND 180 6.50 11.00 ND ND ND ND ND ND HOFR-4 23-May-95 15.00 BDL ND 205 8.00 8.00 ND ND ND ND ND ND HOFR-4 30-Jun-95 25.50 BDL 144 282 7.56 6.00 ND 100 1.32 0.16 40 <5 HOFR-4 31-Jul-95 27.70 BDL 151 301 6.89 L00 ND ND ND ND ND ND HOFR-4 06-Sep-95 24.40 BDL 166 333 8.00 5.40 ND ND ND ND ND ND HOFR-4 26-Sep-95 22.20 BDL 174 350 7.99 9.50 ND 80 0.264 0.14 60 15 HOFR-4 27-Oct-95 12.10 BDL 121 245 8.40 7.10 ND ND ND ND ND ND HOFR-4 29-Nov-95 3.70 BDL ND 252 7.95 10.80 ND ND ND ND ND ND HOFR-4 11-Jan-96 0.80 BDL 146 293 7.76 10.90 79 80 ND BDL 30 <5 Notes: ND=no data collected; BDL=below detection limits; DO=dissolved oxygen; CONDUCT=conductivity; TDS=total dissolved solids

71
ROOSEVELT-VANDERBILT NHS WATER QUALITY MONITORING PROGRAM -1995 DATA, VANDERBILT MANSION NHS
SAMPLE WATER POINT DATE TEMP SALINITY TDS CONDUCT pH DO DO ALKALINITY NITRATE PHOSPHATE CHLORIDE TURBIDITY (C) (ppt) (mhos) (ppm) (%) (ppm) (ppm) (ppm) (ppm) (JTU) VAMA-1 23-Jan-95 2.75 BDL ND 132 6.00 14.00 ND ND ND ND ND ND VAMA-1 24-Feb-95 2.50 BDL ND 180 7.10 11.00 ND ND ND ND ND ND VAMA-1 29-Mar-95 6.00 BDL ND 165 12.20 11.00 ND 100 BDL BDL 40 <5 VAMA-1 25-Apr-95 13.50 BDL ND 230 7.50 10.00 ND ND ND ND ND ND VAMA-i 23-May-95 16.50 BDL ND 305 7.50 8.00 ND ND ND ND ND ND VAMA-i 14-Jun-95 19.00 BDL ND 335 7.50 9.00 ND 140 1.144 0.28 50 <5 VAMA-1 31-Jul-95 22.30 BDL 191 385 7.68 6.00 ND ND ND ND ND ND VAMA-i 05-Sep-95 18.60 BDL 247 495 6.67 8.00 ND ND ND ND ND ND VAMA-1 25-Sep-95 13.70 BDL 235 470 7.07 9.80 ND 120 0.176 0.22 75 <5 VAMA-1 27-Oct-95 10.20 BDL 159 314 8.57 9.70 ND ND ND ND ND ND VAMA-1 29-Nov-95 1.50 BDL ND 292 7.96 11.00 ND ND ND ND ND ND VAMA-1 17-Nov-95 1.00 BDL 155 311 8.29 13.80 98 120 ND BDL 40 <5 VAMA-2 20-Jan-95 5.00 BDL ND 160 7.00 14.00 ND ND ND ND ND ND VAMA-2 24-Feb-95 2.00 BDL ND 258 7.30 12.00 ND ND ND ND ND ND VAMA-2 29-Mar-95 7.00 BDL ND 210 8.90 9.00 ND 110 0.35 0.08 35 <5 VAMA-2 25-Apr-95 12.75 BDL ND 230 7.30 11.00 ND ND ND ND ND ND VAMA-2 23-May-95 16.00 BDL ND 290 8.50 7.00 ND ND ND ND ND ND VAMA-2 26-Jun-95 23.40 BDL 216 433 7.78 8.26 ND 140 0.62 0.14 60 <5 VAMA-2 31-Jul-95 23.10 BDL 188 377 7.71 7.00 ND ND ND ND ND ND VAMA-2 25-Aug-95 19.60 BDL 236 476 7.46 7.00 ND ND ND ND ND ND VAMA-2 25-Sep-95 15.00 BDL 235 471 7.75 9.70 ND 160 0.22 0.04 70 <5 VAMA-2 27-Oct-95 10.20 BDL 158 316 8.56 10.30 ND ND ND ND ND ND VAMA-2 29-Nov-95 1.50 BDL 147 294 7.97 12.40 94 ND ND ND ND ND VAMA-2 17-Jan-96 0.40 BDL 156 312 8.57 13.60 98 100 ND 0.02 40 <5 VAMA-3 20-Jan-95 5.00 BDL ND 320 7.10 11.00 ND ND ND ND ND ND VAMA-3 24-Feb-95 2.00 BDL ND 256 7.30 11.00 ND ND ND ND ND ND VAMA-3 29-Mar-95 7.00 BDL ND 215 7.20 11.00 ND 100 0.88 0.1 40 <5 VAMA-3 25-Apr-95 13.00 BDL ND 240 7.50 10.00 ND ND ND ND ND ND VAMA-3 23-May-95 16.50 BDL ND 310 8.00 9.00 ND ND ND ND ND ND VAMA-3 26-Jun-95 23.10 BDL 216 437 8.26 8.00 ND 140 0.44 0.14 60 <5 VAMA-3 31-Jul-95 23.2 BDL 193 387 7.92 6.00 ND ND ND ND ND ND VAMA-3 25-Aug-95 20.9 BDL 251 500 7.61 5.00 ND ND ND ND ND ND VAMA-3 25-Sep-95 14.2 BDL 253 506 7.92 10.60 ND 160 0.088 <0.02 75 <5 VAMA-3 27-Oct-95 10.6 BDL 163 326 8.68 9.70 ND ND ND ND ND ND VAMA-3 29-Nov-95 1.6 BDL ND 303 8.08 12.20 ND ND ND ND ND ND VAMA-3 17-Jan-96 0.4 BDL 159 317 8.67 13.80 100 100 0.18 <0.02 40 <5 VAMA-4 23-Jan-95 2.75 BDL ND 350 6.80 14.00 ND ND ND ND ND ND VAMA-4 24-Feb-95 1.25 BDL ND 325 7.00 12.00 ND ND ND ND ND ND VAMA-4 29-Mar-95 8.00 BDL ND 245 7.50 12.00 ND 100 0.26 0.1 25 <5 VAMA-4 25-Apr-95 15.25 BDL ND 200 6.00 10.00 ND ND ND ND ND ND VAMA-4 23-May-95 15.00 BDL ND 230 8.00 10.00 ND ND ND ND ND ND VAMA-4 26-Jun-95 19.40 BDL 192 386 7.62 5.00 ND 160 0.7 0.1 35 <5 VAMA-4 31-Jul-95 21.20 BDL 113 226 7.42 9.00 ND ND ND ND ND ND VAMA-4 05-Sep-95 16.80 BDL 191 381 6.71 5.00 ND ND ND ND ND ND VAMA-4 25-Sep-95 12.60 BDL 176 352 7.76 7.40 ND 140 BDL 0.16 35 <5 VAMA-4 27-Oct-95 11.50 BDL 96 192 8.48 9.70 ND ND ND ND ND ND VAMA-4 29-Nov-95 1.70 BDL ND 177 7.88 11.60 ND ND ND ND ND ND VAMA-4 17-Jan-96 0.70 BDL 120 245 8.50 13.60 94 100 ND <0.02 25 <5 Notes: ND=no data collected; BDL=below detection limits; DO=dissolved oxygen; CONDUCT=conductivity; TDS=total dissolved solids
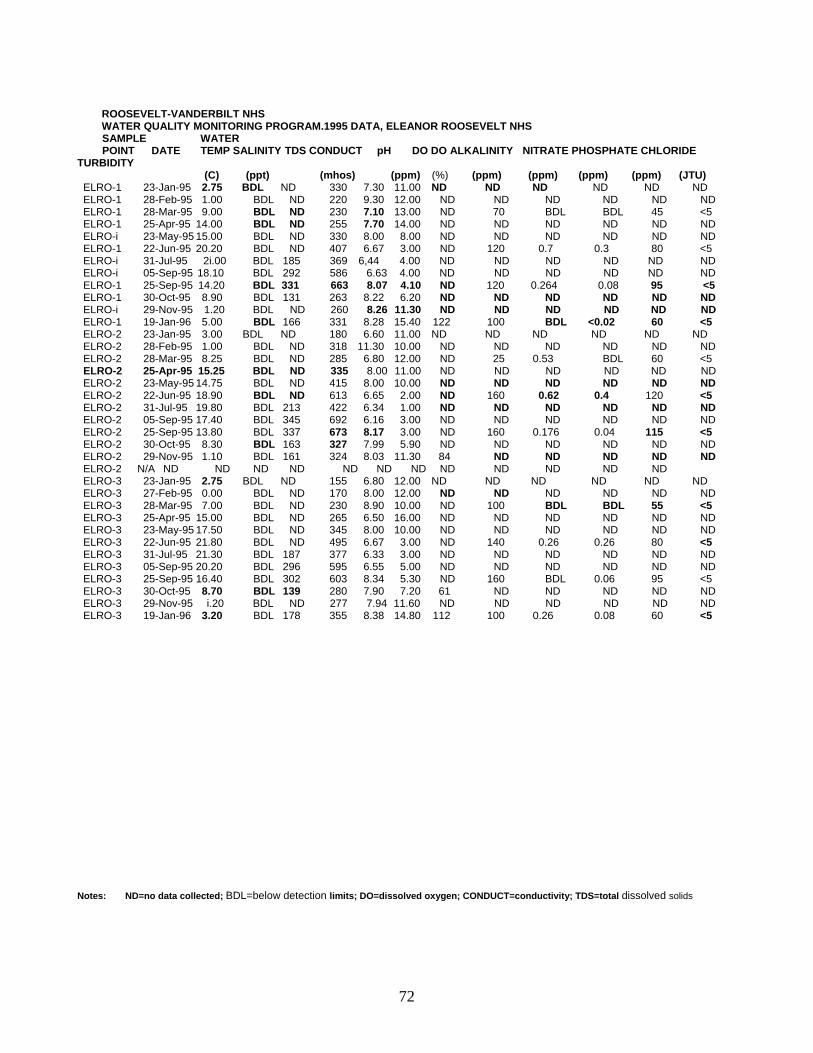
72
ROOSEVELT-VANDERBILT NHS WATER QUALITY MONITORING PROGRAM.1995 DATA, ELEANOR ROOSEVELT NHS
SAMPLE WATER POINT DATE TEMP SALINITY TDS CONDUCT pH DO DO ALKALINITY NITRATE PHOSPHATE CHLORIDE TURBIDITY (C) (ppt) (mhos) (ppm) (%) (ppm) (ppm) (ppm) (ppm) (JTU) ELRO-1 23-Jan-95 2.75 BDL ND 330 7.30 11.00 ND ND ND ND ND ND ELRO-1 28-Feb-95 1.00 BDL ND 220 9.30 12.00 ND ND ND ND ND ND ELRO-1 28-Mar-95 9.00 BDL ND 230 7.10 13.00 ND 70 BDL BDL 45 <5 ELRO-1 25-Apr-95 14.00 BDL ND 255 7.70 14.00 ND ND ND ND ND ND ELRO-i 23-May-95 15.00 BDL ND 330 8.00 8.00 ND ND ND ND ND ND ELRO-1 22-Jun-95 20.20 BDL ND 407 6.67 3.00 ND 120 0.7 0.3 80 <5 ELRO-i 31-Jul-95 2i.00 BDL 185 369 6,44 4.00 ND ND ND ND ND ND ELRO-i 05-Sep-95 18.10 BDL 292 586 6.63 4.00 ND ND ND ND ND ND ELRO-1 25-Sep-95 14.20 BDL 331 663 8.07 4.10 ND 120 0.264 0.08 95 <5 ELRO-1 30-Oct-95 8.90 BDL 131 263 8.22 6.20 ND ND ND ND ND ND ELRO-i 29-Nov-95 1.20 BDL ND 260 8.26 11.30 ND ND ND ND ND ND ELRO-1 19-Jan-96 5.00 BDL 166 331 8.28 15.40 122 100 BDL <0.02 60 <5 ELRO-2 23-Jan-95 3.00 BDL ND 180 6.60 11.00 ND ND ND ND ND ND ELRO-2 28-Feb-95 1.00 BDL ND 318 11.30 10.00 ND ND ND ND ND ND ELRO-2 28-Mar-95 8.25 BDL ND 285 6.80 12.00 ND 25 0.53 BDL 60 <5 ELRO-2 25-Apr-95 15.25 BDL ND 335 8.00 11.00 ND ND ND ND ND ND ELRO-2 23-May-95 14.75 BDL ND 415 8.00 10.00 ND ND ND ND ND ND ELRO-2 22-Jun-95 18.90 BDL ND 613 6.65 2.00 ND 160 0.62 0.4 120 <5 ELRO-2 31-Jul-95 19.80 BDL 213 422 6.34 1.00 ND ND ND ND ND ND ELRO-2 05-Sep-95 17.40 BDL 345 692 6.16 3.00 ND ND ND ND ND ND ELRO-2 25-Sep-95 13.80 BDL 337 673 8.17 3.00 ND 160 0.176 0.04 115 <5 ELRO-2 30-Oct-95 8.30 BDL 163 327 7.99 5.90 ND ND ND ND ND ND ELRO-2 29-Nov-95 1.10 BDL 161 324 8.03 11.30 84 ND ND ND ND ND ELRO-2 N/A ND ND ND ND ND ND ND ND ND ND ND ND ELRO-3 23-Jan-95 2.75 BDL ND 155 6.80 12.00 ND ND ND ND ND ND ELRO-3 27-Feb-95 0.00 BDL ND 170 8.00 12.00 ND ND ND ND ND ND ELRO-3 28-Mar-95 7.00 BDL ND 230 8.90 10.00 ND 100 BDL BDL 55 <5 ELRO-3 25-Apr-95 15.00 BDL ND 265 6.50 16.00 ND ND ND ND ND ND ELRO-3 23-May-95 17.50 BDL ND 345 8.00 10.00 ND ND ND ND ND ND ELRO-3 22-Jun-95 21.80 BDL ND 495 6.67 3.00 ND 140 0.26 0.26 80 <5 ELRO-3 31-Jul-95 21.30 BDL 187 377 6.33 3.00 ND ND ND ND ND ND ELRO-3 05-Sep-95 20.20 BDL 296 595 6.55 5.00 ND ND ND ND ND ND ELRO-3 25-Sep-95 16.40 BDL 302 603 8.34 5.30 ND 160 BDL 0.06 95 <5 ELRO-3 30-Oct-95 8.70 BDL 139 280 7.90 7.20 61 ND ND ND ND ND ELRO-3 29-Nov-95 i.20 BDL ND 277 7.94 11.60 ND ND ND ND ND ND ELRO-3 19-Jan-96 3.20 BDL 178 355 8.38 14.80 112 100 0.26 0.08 60 <5 Notes: ND=no data collected; BDL=below detection limits; DO=dissolved oxygen; CONDUCT=conductivity; TDS=total dissolved solids

73
ROOSEVELT-VANDERBILT NHS WATER QUALITY MONITORING PROGRAM -1996 DATA SAMPLE WATER POINT DATE TEMP TDS CONDUCT pH DO DO ALKALINITY NITRATE PHOSPHATE CHLORIDE TURBIDITY (C) (mhos) (ppm) (%)(ppm) (ppm)(PPM N03) (ppm) (JTU) HOFR-i 31-Jan-96 1.90 224 450 8.17 14.40 106 ND ND ND ND ND HOFR-1 23-Feb-96 3.50 182 363 7.50 12.00 ND ND ND ND ND ND HOFR-1 01-Apr-96 7.30 266 534 8.88 9.50 80 140 0.44 0.80 60 ND HOER-i 02-Jul-96 19.75 266 532 775 6.00 ND 200 3.83 0.22 55 ND HOER-i 23-Jul-96 19.50 248 490 7.80 600 ND ND ND ND ND ND HOER-i 22-Aug-96 19.50 287 567 7.85 8.00ND ND ND ND HOFR-1 19-Sep-96 16.00 197 385 7.70 8.00ND 140 0.40 0.02 40 ND HOFR-2 31-Jan-96 1.90 211 425 8.41 13.60 101 ND ND ND ND ND HOFR-2 23-Feb-96 3.50 175 351 7.60 12.00 ND ND ND ND ND ND HOFR-2 01-Apr-96 7.50 237 473 8.69 10.50 88 140 70.40 0.80 60 ND HOFR-2 02-Jul-96 16.25 171 346 7.80 9.00 ND 100 4.09 0.16 50 ND HOFR-2 23-Jul-96 15.75 164 310 7.55 9.00 ND ND ND ND ND ND HOFR-2 22-Aug-96 17.50 180 353 7.70 9.00 ND ND ND ND ND ND HOFR-2 18-Sep-96 16.50 172 341 760 9.00 ND 120 4.40 0.02 45 ND HOFR-3 31-Jan-96 2.10 184 369 8.54 14.90 111 ND ND ND ND ND HOER-3 23-Feb-96 3.70 159 319 7.75 12.00 ND ND ND ND ND ND HOER-3 01-Apr-96 6.90 207 415 8.84 9.90 82 140 190 1.00 55 ND HOFR-3 02-Jul-96 19.75 211 386 7.85 &00 ND 160 4.31 ND 50 ND HOFR-3 23-Jul-96 18.50 196 391 7.85 8.00ND ND ND BDL ND ND HOFR-3 22-Aug-96 20.50 226 465 7.80 7.00ND ND ND ND ND ND HOFR-3 18-Sep-96 16.50 147 282 7.65 5.00ND 120 4.40 0.14 35 ND HOFR-4 31-Jan-96 0.40 99 202 8.44 15.00106 ND ND ND ND ND HOFR-4 23-Feb-96 1.30 130 262 7.92 11.00ND ND ND ND ND ND HOFR-4 01-Apr-96 6.30 115 232 8.98 9.2079 100 1.72 0.60 35 ND HOFR-4 02-Jul-96 25.50 108 208 7.35 5.00ND 100 1.89 ND 25 ND HOFR-4 23-Jul-96 24.00 106 219 7.20 6.00ND ND ND BDL ND ND HOFR-4 22-Aug-96 25.50 117 234 7.20 6.00ND ND ND ND ND ND HOFR-4 18-Sep-96 22.50 130 261 7.50 7.00ND 100 1.32 0.04 25 ND VAMA-1 31-Jan-96 0.40 133 267 8.16 13.5094 ND ND ND ND ND VAMA-1 20-Feb-96 090158 314 7.85 14.00 NDND ND ND ND ND VAMA-1 16-Apr-96 8.40 111 198 8.51 9.0078 80 0.88 BDL 30 ND VAMA-1 30-Apr-96 11.10 115 230 7.50 10.80104 ND ND ND ND ND VAMA-1 03-Jul-96 22.50 157 316 8.35 7.00ND 120 1.94 ND 35 ND VAMA-1 24-Jul-96 19.25 147 286 7.80 10.00ND ND ND 0.02 ND ND VAMA-1 23-Aug-96 22.50 - 167 329 7.60 9.00ND ND ND ND ND ND VAMA-1 20-Sep-96 15.50 110 217 7.70 10.00ND 100 0.44 BDL 20 ND VAMA-2 31-Jan-96 0.60 132 265 8.22 14.40104 ND ND ND ND ND VAMA-2 20-Feb-96 0.50 167 322 7.84 12.00ND ND ND ND ND ND VAMA-2 16-Apr-96 8.40 114 228 8.50 10.1091 100 0.79 BDL 30 ND VAMA-2 30-Apr-96 11.30 119 245 7.40 9.2094 ND ND ND ND ND VAMA-2 03-Jul-96 22.50 168 338 7.90 7.00ND 140 2.07 ND 35 ND VAMA-2 24-Jul-96 19.25 146 284 7.90 8.00ND ND ND BDL ND ND VAMA-2 23-Aug-96 23.00 170 337 7.70 8.00ND ND ND ND ND ND VAMA-2 20-Sep-96 15.50 110 224 7.70 8.00ND 100 0.40 BDL 20 ND Notes: ND=no data collected; BDL=below detection limits; DO=dissolved oxygen; CONDUCT=conductivity; TDS=total dissolved solids
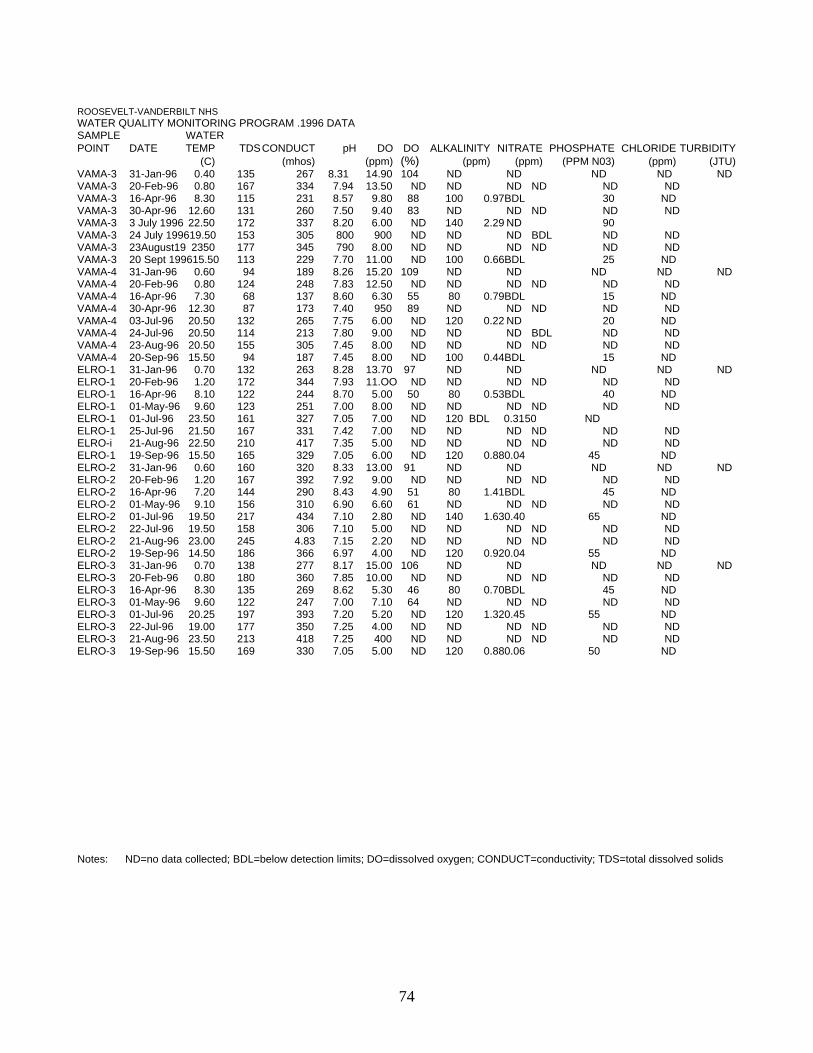
74
ROOSEVELT-VANDERBILT NHS WATER QUALITY MONITORING PROGRAM .1996 DATA SAMPLE WATER POINT DATE TEMP TDS CONDUCT pH DO DO ALKALINITY NITRATE PHOSPHATE CHLORIDE TURBIDITY (C) (mhos) (ppm) (%) (ppm) (ppm) (PPM N03) (ppm) (JTU) VAMA-3 31-Jan-96 0.40 135 267 8.31 14.90 104 ND ND ND ND ND VAMA-3 20-Feb-96 0.80 167 334 7.94 13.50 ND ND ND ND ND ND VAMA-3 16-Apr-96 8.30 115 231 8.57 9.80 88 100 0.97BDL 30 ND VAMA-3 30-Apr-96 12.60 131 260 7.50 9.40 83 ND ND ND ND ND VAMA-3 3 July 1996 22.50 172 337 8.20 6.00 ND 140 2.29 ND 90 VAMA-3 24 July 199619.50 153 305 800 900 ND ND ND BDL ND ND VAMA-3 23August19 2350 177 345 790 8.00 ND ND ND ND ND ND VAMA-3 20 Sept 199615.50 113 229 7.70 11.00 ND 100 0.66BDL 25 ND VAMA-4 31-Jan-96 0.60 94 189 8.26 15.20 109 ND ND ND ND ND VAMA-4 20-Feb-96 0.80 124 248 7.83 12.50 ND ND ND ND ND ND VAMA-4 16-Apr-96 7.30 68 137 8.60 6.30 55 80 0.79BDL 15 ND VAMA-4 30-Apr-96 12.30 87 173 7.40 950 89 ND ND ND ND ND VAMA-4 03-Jul-96 20.50 132 265 7.75 6.00 ND 120 0.22 ND 20 ND VAMA-4 24-Jul-96 20.50 114 213 7.80 9.00 ND ND ND BDL ND ND VAMA-4 23-Aug-96 20.50 155 305 7.45 8.00 ND ND ND ND ND ND VAMA-4 20-Sep-96 15.50 94 187 7.45 8.00 ND 100 0.44BDL 15 ND ELRO-1 31-Jan-96 0.70 132 263 8.28 13.70 97 ND ND ND ND ND ELRO-1 20-Feb-96 1.20 172 344 7.93 11.OO ND ND ND ND ND ND ELRO-1 16-Apr-96 8.10 122 244 8.70 5.00 50 80 0.53BDL 40 ND ELRO-1 01-May-96 9.60 123 251 7.00 8.00 ND ND ND ND ND ND ELRO-1 01-Jul-96 23.50 161 327 7.05 7.00 ND 120 BDL 0.31 50 ND ELRO-1 25-Jul-96 21.50 167 331 7.42 7.00 ND ND ND ND ND ND ELRO-i 21-Aug-96 22.50 210 417 7.35 5.00 ND ND ND ND ND ND ELRO-1 19-Sep-96 15.50 165 329 7.05 6.00 ND 120 0.880.04 45 ND ELRO-2 31-Jan-96 0.60 160 320 8.33 13.00 91 ND ND ND ND ND ELRO-2 20-Feb-96 1.20 167 392 7.92 9.00 ND ND ND ND ND ND ELRO-2 16-Apr-96 7.20 144 290 8.43 4.90 51 80 1.41BDL 45 ND ELRO-2 01-May-96 9.10 156 310 6.90 6.60 61 ND ND ND ND ND ELRO-2 01-Jul-96 19.50 217 434 7.10 2.80 ND 140 1.630.40 65 ND ELRO-2 22-Jul-96 19.50 158 306 7.10 5.00 ND ND ND ND ND ND ELRO-2 21-Aug-96 23.00 245 4.83 7.15 2.20 ND ND ND ND ND ND ELRO-2 19-Sep-96 14.50 186 366 6.97 4.00 ND 120 0.920.04 55 ND ELRO-3 31-Jan-96 0.70 138 277 8.17 15.00 106 ND ND ND ND ND ELRO-3 20-Feb-96 0.80 180 360 7.85 10.00 ND ND ND ND ND ND ELRO-3 16-Apr-96 8.30 135 269 8.62 5.30 46 80 0.70BDL 45 ND ELRO-3 01-May-96 9.60 122 247 7.00 7.10 64 ND ND ND ND ND ELRO-3 01-Jul-96 20.25 197 393 7.20 5.20 ND 120 1.320.45 55 ND ELRO-3 22-Jul-96 19.00 177 350 7.25 4.00 ND ND ND ND ND ND ELRO-3 21-Aug-96 23.50 213 418 7.25 400 ND ND ND ND ND ND ELRO-3 19-Sep-96 15.50 169 330 7.05 5.00 ND 120 0.880.06 50 ND Notes: ND=no data collected; BDL=below detection limits; DO=dissoIved oxygen; CONDUCT=conductivity; TDS=total dissolved solids

75
ROOSEVELT-VANDERBILT NHS WATER QUALITY MONITORING PROGRAM -1997 DATA YTD
SAMPLE WATER NITRATE- POINT DATE TEMP TDSCONDUCT pHDO DOALKALINITY NITRATE NITROGEN PHOSPHATECHLORIDE (°C) (mhos) (mg/l) (%) (mg/l CaCO3)(mg/l N03-) (mg/l N-) (mogul P03-4)(mgfl CI-) HOFR-1 13-Mar-97 3.30 264 529 7.24 14.5 108 140 3.87 0.88 BDL 70 HOFR-1 10-Jun-9715.20 317 634 7.77 2.0 ND 180 4.40 1.00 0.14 80 HOFR-2 13-Mar-97 2.00 251 494 7.81 14.3 104 120 3.52 0.80 BDL 60 HOFR-2 10-Jun-9714.30 265 528 7.96 9.0 ND 160 4.40 1.00 0.14 70 HOFR-3 13-Mar-97 2.10 230 461 7.77 16,9 120 120 4.00 0.91 BDL 55 HOFR-3 12-Jun-9716.80 234 472 7.77 11.8 125 160 7.04 1.60 0.18 65 HOFR-4 13-Mar-97 0.60 126 255 7.80 12.7 87 80 2.60 0.59 BDL 30 HOFR-4 10-Jun-9720.40 140 281 7.89 9.0 ND 100 1.32 0.30 BDL 35 VAMA-1 21-Mar-97 3.40 164 329 7.65 12.8 97 90 ND ND BDL 25 VAMA-i 13-Jun-9720.60 205 380 7.49 9.0 105 140 1.76 0.40 BDL 55 VAMA-2 21-Mar-97 3.50 137 273 7.56 13.3 100 100 ND ND BDL 40 VAMA-2 13-Jun-9721.40 183 366 7.63 10.0 103 160 1.32 0.30 0.10 50 VAMA-3 21-Mar-97 3.50 137 273 7.79 13.2 99 100 ND ND BDL 40 VAMA-3 13-Jun-9720.60 180 357 8.07 10.1 109 180 1.54 0.35 0.14 45 VAMA-4 21-Mar-97 2.80 107 289 7.48 12.8 107 100 ND ND BDL 40 VAMA-4 12-Jun-9717.90 154 317 7.86 8.5 90 140 1.32 0.30 BDL 35 ELRO-1 19-Mar-97 6.30 144 289 7.i5 12.5 100 80 0.88 0.20 BDL 50 ELRO-1 11-Jun-9717.50 100 200 7.60 6.0 24 140 4.40 1.00 0.12 60 ELRO-2 19-Mar-97 6.80 161 323 7.22 14.0 114 80 0.97 0.22 BDL 50 ELRO-2 16-Jun-9716.50 236 473 7.89 4.2 42 140 1.32 0.30 0.12 75 ELRO-3 19-Mar-97 6.80 145 296 7.20 13.7 112 80 1.14 0.26 BDL 50 ELRO-3 16-Jun-97 17.50 221 450 7.52 5.0 48 140 0.88 0.20 0.16 65 Notes: ND=no data collected; BDL=below detection limits; DO=dissolved oxygen; CONDUCT=conductivity;
TDS=total dissolved solids

76
PROJECT STATEMENT: ROVA-N-003.00
Last Update: 09/08/97 Priority: 1 Initial Proposal: 1998 Page Num: 0001
Title: MODIFY WATER QUALITY MONITORING PROGRAM Funding Status: Funded: 23.00 Unfunded: 17.00 Servicewide Issues: N20 (BASELINE DATA) Ni 1 (WATER QUAL-EXT) Cultural Resource Type: N-RMAP Program Codes: Q00 (Water Resources Management) QOl (Water Resources Management) 10-23 8 Package Number: Project Statement Vanderbilt Mansion National Historic Site, Eleanor Roosevelt National Historic Site, and the Home of Franklin D. Roosevelt National Historic Site are commonly grouped together as the Roosevelt-Vanderbilt national historic sites. Primarily managed to preserve and interpret cultural resources, these national historic sites exhibit a regionally-important array of water resources including 4.35 miles of stream, 13.75 acres of ponds, 38.8 acres of freshwater wetlands, 25 acres of tidal freshwater wetlands, and 1.1 miles of frontage along the lower Hudson River all contained within 682 acres. However, the knowledge base for all water resources remains virtually unknown; e.g., surface and ground water quality and general hydrology; aquatic biology, wetland delineation and mapping, wetland species composition and structure, and pond sedimentation rates. Compounding this lack of knowledge about the park’s water resources, is the continued residential and commercial growth either adjacent to park boundaries or within the watershed. Potential nonpoint sources of pollution to park waters include: industrial wastes like toxic compounds, particulates and dissolved pollutants; nutrient loading of nitrogen and phosphorus from municipal and residential wastes; road salt and auto exhaust by-product runoff from roads; gasoline and oil product contamination; and bacterial and infectious agent contamination from septic systems. The National Park Service (1995) conducted surface water quality retrievals for Roosevelt-Vanderbilt national historic sites from six of the U.S. Environmental Protection Agency’s national databases, including STORET. The results of these retrievals for the study area (limits include 3 miles upstream and 1 mile downstream of park boundaries) covered the years 1964 to 1995 and included 39 water quality monitoring stations, 18 industrial/municipal discharge sites, 22 municipal water supply intakes, seven water impoundments, and six active or inactive U.S. Geological Survey gaging stations. Most (20) of the monitoring stations are outside of park boundaries, and represent either older one-time or intensive single-year efforts by collecting agenices, or discontinued stations. The data from these stations are useful for showing historical trends, but are of little use in an assessment of current water quality. However, these data do indicate that surface waters within the study area have been impacted by human activities, including industrial and municipal wastewater discharges, stormwater runoff, and a wide variety of public and private land uses including commercial/residential development (National Park Service 1995).

77
Project Statement: ROVA-N-003.000 Last update: 09/08/97 Priority: 1 Initial Proposal: 1998 Page Num: 0002 Nineteen of the 39 water quality monitoring stations are located within or immediately adjacent to park boundaries. However, data from eight stations are from a 1978-1979 intensive study of Fall Kill on Eleanor Roosevelt National Historic Site by Pandullo Quirk Associates (1979). The remaining 11 monitoring stations represent recent and continuous monitoring efforts that allow an interpretation of water quality conditions for Roosevelt-Vanderbilt national historic sites. These stations represent the current water quality monitoring program initiated by Roosevelt-Vanderbilt national historic sites in 1994 after consultation with the regional water resource specialist. The 1996 version of this water quality monitoring program measures 11 parameters with frequencies ranging from biannually to monthly at 11 stations. The water quality of Roosevelt-Vanderbilt national historic sites is considered good, based on 3 years of sampling at 11 stations. At Vanderbilt Mansion National Historic Site, only two pH observations (out of 173 total observations from 12 parameters) either equaled or exceeded U.S. Environmental Protection Agency (EPA) criteria. Similarly, only three pH observations exceeded EPA criteria at both the Home of Franklin D. Roosevelt (out of 179 observations from 12 parameters) and Eleanor Roosevelt (out of 132 observations from 12 parameters) national historic sites. However, ten dissolved oxygen observations on the Fall Kill at Eleanor Roosevelt National Historic Site were below the minimum oxygen concentration of 4 mg/l which is the criteria set by the U.S. Environmental Protection Agency for the protection of aquatic life. The recently completed water resources management plan for the park (National Park Service 1997) recommends the continuation of a modified, long-term monitoring program designed to provide a more complete assessment of baseline water quality, flag potential degradation resulting from nonpoint source contamination, and periodically appraise the health of the aquatic biological community. Description of Recommended Project or Activity The Roosevelt-Vanderbilt national historic sites Water Resources Management Plan (National Park Service 1997) recommends the continued monitoring of long-term water quality trends by modifying the current monitoring program. The modified water quality monitoring program would measure 15 physiochemical water quality parameters on a quarterly basis at nine stations, and conducts rapid bioassessments at three stations on an annual basis, following protocols developed by the State of New York (Bode et al. 1995). Other significant modifications include: 1) measurement of stream discharge a gaged stations to determine gage-discharge relationships on all streams; 2) use of a laboratory using U.S. Environmental Protection Agency certified procedures for all chemical analyses rather than measurement via Hach Kits; 3) analysis of water samples for the BTEX (benzene, toluene, ethyl benzene, and zylenes) suite of Purgeable Aromatic Hydrocarbons; 4) establishment of ground water monitoring wells; 5) initiation of photographic monitoring during quarterly visits to monitoring stations; and, 6) revision of the water quality monitoring plan to include a quality assurance/quality control program, as well as the institution of annual reports that include tabular presentation of data, data analysis, and data interpretation.

78
Project Statement: ROVA-N-003.000 Last update: 09/08/97 Priority: 1 Initial Proposal: 1998 Page Num: 0003 The implementation of this multi-faceted water quality monitoring program will require expertise and laboratory resources extending beyond the current resources of the park. In the short term, the park proposes to work with other federal, state, and local agencies, the NPS Water Resources Division, and appropriate local universities capable of providing the necessary field equipment, laboratory resources, and QA/QC protocols for recommended field sampling and laboratory analysis. Funding requested here is designed to provide additional support to meet annual costs (over the next four years) of the long-term water quality monitoring program recommended in the Roosevelt- Vanderbilt national historic sites Water Resources Management Plan (National Park Service 1997). It is anticipated that the total annual cost of the water quality monitoring program ($10,000 and 0.15 FTE) will be assumed by the park by the end of the fourth year. Literature Cited Bode, R., N. Novak, and L. Abele. 1995. Biological stream assessment, Crum Elbow Creek, Dutchess County,
New York. New York Department of Environmental Conservation, Division of Water, Bureau of Monitoring and Assessment, Albany, NY.
National Park Service. 1995. Baseline water quality data, inventory and analysis, Roosevelt-Vanderbilt National
Historic Site. Technical Report NPS/NRWRD/NRTR-95/64. National Park Service, Washington, D.C. National Park Service. 1997. Water resource management plan for Vanderbilt Mansion National
Historic Site, Eleanor Roosevelt National Historic Site, and the Home of Franklin D. Roosevelt National Historic Site. Roosevelt-Vanderbilt national historic sites, Hyde Park, NY.
Pandullo Quirk Associates. 1979. Natural resources inventory at Eleanor Roosevelt National Historic Site, Hyde
Park, New York. Report on file at Roosevelt-Vanderbilt national historic sites, Hyde Park, NY. 93 pp and appendices.
Budget and FTEs
FUNDED Budget Source Activity Fund Type ($1 000s) FTEs 1998:PKBASE-NR MON Recurring 3.00 0.05 1999:PKBASE-NR MON Recurring 5.00 0.05 2000:PKBASE-NR MON Recurring 7.00 0.10 2001:PKBASE-NR MON Recurring 8.00 0.15 TOTAL: 23.00 0.35

79
Project Statement: ROVA-N-003.000 Last update: 09/08/97 Priority: 1 Initial Proposal: 1998 Page Num: 0004 Budget and FTEs (continued)
FUNDED Budget Activity Fund Type ($1 000s) FTEs Year 1: MON One-time 7.00 0.10Year 2: MON One-time 5.00 0.10Year 3: MON One-time 3.00 0.00Year 4: MON One-time 2.00 0.00
TOTAL: 17.00 0.20 (Optional) Alternative Actions/Solutions and Impacts (No Information
Provided) Compliance Codes: EXCL (CATEGORICAL EXCLUSION) Explanation: 516 DM2 App. 2, 1.6

80
PROJECT STATEMENT: ROVA-N-011.000
Last Updated: 09/08/97 Priority: 2 Initial Proposal: 1998 Page Num:
0001
Title: WETLAND RESOURCE IDENTIFICATION
Funding Status: Servicewide Issues:
Cultural Resource Type: N-RMAP Program Codes:
10-23 8 Package Number:
Funded: 0.00 Unfunded: 35.00
N20 (BASELINE DATA) Ni 7 (BIODIVERSITY) Q00 (Water Resources Management) QOl (Water Resources Management)
Problem Statement
Roosevelt-Vanderbilt national historic sites reside within the Hudson River drainage basin. The Home of Franklin D. Roosevelt and Vanderbilt Mansion national historic sites lie within the Crum Elbow Creek sub-drainage, and Eleanor Roosevelt National Historic Site lies within the Fall Creek sub-drainage. A very preliminary estimate of the water resource inventory for Roosevelt-Vanderbilt national historic sites includes 4.4 miles of streams, 13.8 acres of ponds, 39 acres of known freshwater wetlands, and 25 acres of tidal, freshwater wetlands.
Known wetland habitats at Vanderbilt Mansion National Historic Site are represented by four small, non-tidal freshwater marshes ranging is size from approximately 0.03 to 0.23 acres (totaling approximately 1 acre). A non-tidal, freshwater swamp exists along the western boundary; it is created by the discharge of a non-perennial stream that drains the hillside below the visitor center. The Hudson River shoreline is outside the boundary of the park, but the river is considered a critical habitat of the park because it fronts 1.1 miles of the park. For example, a bay at the north boundary near Bard Rock Park contains a small area of tidal, freshwater marsh. The wetlands and additional wetland habitats that exist need to be systematically delineated, mapped, and inventoried.
Adjacent to the southwest boundary of the The Home of Franklin D. Roosevelt National Historic Site is Roosevelt Cove, a 25-acre freshwater tidal marsh. Roosevelt Cove is owned by the State of New York, but is under the stewardship of the National Park Service. This cove was created in the 19th century by the construction of railroad tracks along the western boundary, which formed an embayment of the Hudson River shoreline. The restricted tidal exchange then led to the establishment of the tidal freshwater marsh system.
Roosevelt Cove is a productive system, providing feeding and nesting habitat for waterfowl, shorebirds and raptors, including one federally endangered species (bald eagle, Haliaeetus leucocephalus) and one state threatened species (osprey, Pandion haliaetus). This marsh system is critically important within the lower Hudson River basin because of the almost complete disappearance of this type of wetland habitat. For this reason, the Nature Conservancy included it in their Natural Areas Registry Program.
81
Project Statement: ROVA-N-011.000 Last update: 09/08/97 Priority: 2 Initial Proposal: 1998 Page Num: 0002
However, little is known about this wetland community with respect to hydrological and biological information.
There are several other areas of wetlands that have not been adequately described nor mapped. In addition, several wet meadow areas exist downslope of seeps emerging from the steep hillside below the Roosevelt home. Further study of these wetlands is needed to delineate wetland boundaries and describe vegetative communities.
More is known of the wetlands at Eleanor Roosevelt National Historic Site than the other units of Roosevelt-Vanderbilt national historic sites because of the work by Kiemens et al. (1992) on state-listed reptile species and their habitats at the park. However, more accurate and complete hydrological as well as biological information is needed.
A wet meadow (approximately 8 acres) has a number of small drainage channels and ponds of agricultural origin. These combine to form a single tributary to the Fall Kill near the northern edge of the park boundary. Heavily vegetated, these channels are 0.5 miles in total length. The north and upland drainage tributaries both empty into the Fall Kill. The former begins north of the service road and flows 0.2 miles before joining the Fall Kill. The latter consists of a series of small streams that dram the western, upland portion of the park and joins the Fall Kill at two sites after flowing for 0.75 miles.
A shrub swamp lies on the western edge of Upper Val-Kill Pond and extends to the Curan House. Its dominant vegetation includes red maple (Acer rubrum) and sedge (Carex stricta). A swamp lies to the southwest of Lower Val-Kill pond and contains wooded swamp (eastern and north sides) and marsh habitats. A sphagnum shrub swamp is across the entrance road from Buttonbush Pond and drains into the Curan House Pond. It is composed primarily of red maple and sphagnum, with some purple loosestrife and sedge hummocks. A wet meadow exists between the main entrance and the access corridor for an overhead power transmission line. This wet meadow contains diverse vegetation with many depressions that depending upon the season and/or the proximity to a precipitation event, may contain water. The wet meadow vegetation has not been adequately described.
There is a critical lack of information on the wetlands of Roosevelt-Vanderbilt national historic sites. The park needs information in order to develop an appropriate program to protect its wetlands and to develop information for visitors’ interpretation and environmental education activities. A wetland and riparian habitat map is needed, along with inventories of flora and fauna within wetland habitats. Given detailed maps and inventories, resource managers will be able to detect the responses of wetlands and riparian zones to various natural and human-induced disturbances. A mapping and inventory effort will be necessary to address the following resource management issues:
• response of rare wetland-dependent biota and associated critical habitat to water quality
and hydrological stresses; • understand and predict changes in wetland boundaries and community structure in
response to natural and human-induced factors; • provide baseline for effective visitor use planning;

82
Project Statement: ROVA-N-01 1.000 Last update: 09/08/97 Priority: 2 Initial Proposal:1998 Page Num: 0003
When the wetland and riparian zone assessment is coupled with aquatic surveys, water quality monitoring, and upland vegetation surveys, resource managers will have many data sets necessary to make well-informed resource protection decisions.
Description of Recommended Project or Activity
A one-year (in duration, but covers two fiscal years), two-phase wetland mapping and assessment program is recommended. The two phases include: 1) wetland and riparian zone mapping; and, 2) ground truthing and broad and intensive field inventories. It is recommended that a large scale digital wetland map be produced.
Ideally, this task should not be limited to wetlands, but completed in conjunction with park-wide vegetation or cover-type mapping exercises. Aerial photography libraries should be first visited to determine if existing or recent coverage is available. It is recommended that the U.S. Fish and Wildlife Service’s National Wetlands Inventory classification scheme be adopted.
Upon completion of the wetlands map, wetland locations and boundaries will be ground truthed. Boundary delineations will follow accepted, interagency (federal) guidelines for wetland boundary determinations. The field team should first conduct a broad survey to produce plant and animal species lists for each wetland type/community mapped. Plants and animals will be identified to the lowest taxonomic level possible, given the limitations of available taxonomic keys and the time of collection. A species list and classification of wetlands in the park will be developed from these data.
This broad survey should be followed by more intensive field efforts at selected sites for each wetland type. Care should be taken in site selection to insure that a diversity of sites are studied. Intensive field studies should include establishment of quantitative vegetation plots or transects to evaluate species composition and community structure, small mammal and herptile trapping, and the study of relationships between soil type, water table levels, water quality, and species/community type distributions. This intensive field effort should be conducted to encompass all seasonal conditions.
The final report should include maps of the park with wetland types identified. Statistics of each wetland type within watersheds and subwatersheds should be included. A written description for each wetland type and study area, identifying species composition, ecological dynamics, and functions and values of the system will be particularly useful to resource managers and interpretive staffs.
Practical management recommendations for managers will be included in the final report, including what special management activities are needed for long-term protection of certain species or ecosystems.
A specimen archive will be provided for the parks’ reference collection and for interpretive and environmental education purposes. This would include a series of photographs and a collection of preserved or dried specimens for at least the principal and indicator species.

83
Project Statement: ROVA-N-011.000 Last update: 09/08/97
Initial Proposal: 1998
Priority: 2 Page Num: 0004
Literature Cited Kiemens, M., R. Cook, and D. Hayes. 1992. Herpetofauna of Roosevelt-Vanderbilt National Historic
Sites, Hyde Park, New York, with emphasis on Blanding’s turtle (Emydoidea blandingii). National Park Service, North Atlantic Regional Office. Tech. Rpt. NPS / NAROSS / NRTR 92-08, Boston, MA.
Budget and FTEs
FUNDED Budget Source Activity Fund Type ($l000s) FTEs 1998: PK-BASE-NR RES One-time 0.00 0.05 1999: PK-BASE-NR RES One-time 0.00 0.05 TOTAL: 0.00 0.10
UNFUNDED
Budget Activity Fund Type ($1000s) FTEs
Year 1: WATER-RES RES One-time 15.00 0.00Year 2: WATER-RES RES One-time 20.00 0.00 TOTAL: 35.00 0.00
(Optional) Alternative Actions/Solutions and Impacts (No information provided) Compliance codes: EXCL (CATEGORICAL EXCLUSION) Explanation: 516 DM2 APP. 2, 1.6
84
PROJECT STATEMENT: ROVA-N-010.000
Last Update: 09/08/97 Priority: 3 Initial Proposal: 1998 Page Num: 0001
Title: MONITOR SEDIMENTATION RATES OF PONDS
Funding Status: Funded: 0.00 Unfunded: 3.00 Servicewide Issues: N20 (BASELINE DATA) Nl 1 (WATER QUAL-EXT) Cultural Resource Type: N-RMAP Program codes: Q00 (Water Resources Management) QOl (Water Resources Management) 10-238 Package Number: Problem Statement
At Vanderbilt Mansion National Historic Site, the only permanent ponds are impounded, having been constructed during the ownership of Frederick W. Vanderbilt around 1900. These three ponds (approximately 3 total acres), Upper (White Bridge) Pond, Middle (Powerhouse) Pond, and Lower (Lower Dam) Pond are impoundments on Crum Elbow Creek. They are shallow with depths of 1 to 3 feet and significant sediment deposits in their basins.
At The Home of Franklin D. Roosevelt National Historic Site, a concrete dam constructed by President Roosevelt on Meriches Kill formed what is now called Roosevelt Ice Pond. It was used for ice harvesting and swimming by the Roosevelt family. The Ice Pond has an area of 0.7 acres and is between one and seven feet in depth (Allen and Bobinchock 1986).
Allen and Bobinchock (1985) conducted a field survey of pond sedimentation at the Ice Pond. This was the first such survey for the Ice Pond and, therefore, rates of sedimentation could not be accurately estimated. Despite the lack of a previous survey, a rough approximation yielded an estimate of another 100 years to decrease the average water retention capacity of the pond from its 60% capacity in 1905 to 20%. The time frame would be shorter if the integrity of the concrete dam is threatened by an increase in static pressure caused by a sediment wedge. Allen and Bobinchock (1986) suggested that a full-scale geotechnical study of the concrete dam is probably not needed for another decade or two unless structural weakening becomes apparent.
At Eleanor Roosevelt National Historic Site the Upper Val-Kill Pond was created by a concrete dam built in 1925 across the Fall Kill. This pond has an area of approximately 7 acres with a fringing wetland of 14 acres. Depth varies from several inches in the northern section to about 6 feet in the southern lobe. The pond silted in very early, and regular dredging and/or mowing of aquatic vegetation by the Roosevelt family was necessary to maintain open water. Since the last known dredging in the 195 Os, up to 4.2 m of silt has accumulated (Pandullo Quirk Associates 1979; Allen and Bobinchock 1986). Most of the northern portion is nearly filled in today and has been invaded by emergent aquatic plants, both native species as well as purple loosestrife (Lythrum salicaria), an invasive exotic perennial. As the growing season progresses, increased plant growth (perhaps enhanced by rising nutrient loads via residential septic

85
Project Statement: ROVA-N-01 0.000 Last update: 09/08/97 Priority: 3 Initial Proposal: 1998 Page Num: 0002
systems) reduces the amount of open water which is gradually altering the character of the cultural landscape. Upper Val-Kill Pond was the center of the Roosevelt family recreational activities and now is the cornerstone of the cultural landscape at the park. Dredging has been discussed as an option (Pandullo Quirk Associates 1979; Allen and Bobinchock 1986) to recreate the historic scene as mandated by National Park Service policy.
Pandullo Quirk Associates (1979) and Allen and Bobinchock (1986) conducted field surveys of pond sedimentation in Upper Val-Kill Pond. The latter was an attempt to duplicate the same cross-sectional transects of the former. The Allen and Bobinchock (1986) study was useful in delineating the present (1985) conditions of pond geomorphology, the depositional units, and their mean ages of accumulation. However, an accurate assessment of the recent (1979-1985) rates of sedimentation could not be performed because Allen and Bobinchock (1986) were unable to reproduce accurately the Pandullo Quirk Associates (1979) study. Allen and Bobinchock (1986) suggested that another survey of this type be conducted within 5 years to quantify the rates of sedimentation.
Description of Recommended Project or Activity
There are two generally accepted methods for the determination of recent sedimentation rates in impoundments (North American Lake Management Society 1988). One method involves the determination of the radioisotopes Cesium-137 or Lead-210 in the sediments. Although this method provides accurate estimates of sedimentation rates, it is relatively expensive.
The second method, which is far less sensitive but also much less expensive, is to compare the current bottom contours (the depth to the bottom) with a similar map made several years before. The water level for these two surveys must be the same or the depth to the bottom must be corrected if not at the same water level.
This second method was the method of choice used by Allen and Bobinchock (1986) in their sedimentation study of upper Fall-Kill Pond (Eleanor Roosevelt National Historic Site) and the Ice Pond (Home of Franklin D. Roosevelt National Historic Site). Not only does it provide an estimate of sedimentation rate but it determines the amount of accumulated silt. It is recommended that the park continue to monitor these impoundments and others in the park using this approach. This would require establishment of permanent transects at each of the impoundments. These transects must be chosen to adequately characterize the bed configuration. Transects have already been established by Allen and Bobinchock (1986) for upper Fall-Kill Pond and Ice Pond. There is an immediate need to resurvey the transects established by Allen and Bobinchock at upper Fall-Kill Pond and determine the sedimentation rate and amount of sediment that would need to be removed in a proposed dredging operation. The latter is needed to determine accurately the costs of the dredging operation.
At Ice Pond, Allen and Bobinchock (1986) determined that the average water retention capacity of the pond was at 60%. They suggested another survey in 5 years to quantify the rate and amount of sedimentation.
86
Project Statement: ROVA-N-010.000 Last update: 09/08/97 Initial Proposal: 1998
Priority: 3 Page Num: 0003
Therefore, it is recommended that these surveys be conducted as suggested. These surveys could be done on a rotating basis by the park (i.e., ponds at one national historic site surveyed one year; ponds at another site surveyed the next year, and so forth) so that the limited resources of the park are not greatly affected. Sedimentation surveys should become part of the park’s water quality monitoring plan (Hayes 1996) with appropriate discussion given to quality assurance and quality control and data interpretation. These surveys should be discussed in the annual summary report of the water quality monitoring program, when appropriate.
Funding is requested to: 1) meet the immediate need for a sediment survey at upper Fall-Kill Pond; and, 2) establish benchmark sediment conditions at all other impoundments. The requested funding will cover the importation of expertise to train park staff, staff salaries, and boat rental or transportation costs for a loaner boat. All funding for subsequent sediment surveys will be assumed by the park as part of its long-term, water quality monitoring program.
Literature Cited Allen, J., and L. Bobinchock. 1986. ROVA Pond Sedimentation Study. Unpublished Report. National Park
Service, North Atlantic Regional Office. Boston, MA. Hayes, D. 1996. Water quality monitoring program, Roosevelt-Vanderbilt National Historic Sites. 1996 Program
Update. Hyde Park, NY. North American Lake Management Society. 1988. The lake and reservoir restoration guidance manual. EPA
440/5-88-002, U.S. Environmental Protection Agency, Washington, D.C. Pandullo Quirk Associates 1979. Natural resources inventory at Eleanor Roosevelt National Historic Sites, Hyde
Park, NY. Report on file at Roosevelt-Vanderbilt National Historic Sites, Hyde Park, NY. 93pp. and appendices.
Budget and FTEs
FUNDED Budget
Source Activity Fund Type ($l000s) FTEs TOTAL: 0.00 0.00
UNFUNDED
Budget Activity Fund Type ($l000s) FTEs Year 1: RES One-time 3.00 0.00 TOTAL: 3.00 0.00
(Optional) Alternative Actions/Solutions and Impacts (No information provided) Compliance codes: EXCL (CATEGORICAL EXCLUSION) Explanation: 516 DM2 APP. 2, 1.6

87