water resources in england and wales - current state and future...
TRANSCRIPT

Water resources in England and Wales - current state and future pressures
December 2008
GEHO1208BPAS-E-E
Environment Agency Water resources in England and Wales – current state and future pressures
1
We are the Environment Agency. It's our job to look after your environment and make it a better place - for you, and for future generations. Your environment is the air you breathe, the water you drink and the ground you walk on. Working with business, Government and society as a whole, we are making your environment cleaner and healthier. The Environment Agency. Out there, making your environment a better place.
Published by: Environment Agency Rio House Waterside Drive, Aztec West Almondsbury, Bristol BS32 4UD Tel: 0870 8506506 Email: [email protected] www.environment-agency.gov.uk © Environment Agency All rights reserved. This document may be reproduced with prior permission of the Environment Agency.
Environment Agency Water resources in England and Wales – current state and future pressures
2
Contents 1 Introduction 3 2 Available water 4 2.1 Freshwater resources 4 3 Using water in England and Wales 5 3.1 Using freshwater resources 5 3.2 Available water resources 6 3.3 Abstraction uses 6 4 Supplying people with water 10 4.1 Current pressures 10 4.2 Household water use 11 4.3 Household metering 12 4.4 Leakage 13 4.5 Supply demand balance 14 5 Future pressures and trends 15 5.1 Water Framework Directive 15 5.2 Pollution pressures 15 5.3 Water for wildlife 16 5.4 Water for wetlands 16 5.5 Population growth 17 5.6 Trends in household metering and water use 18 5.7 Climate change 19 6 Future strategy 21
Environment Agency Water resources in England and Wales – current state and future pressures
3
1 Introduction Water is essential for human life and to sustain a diverse and thriving water environment. It is important to our economy as an essential requirement for industry, power generation, commerce and agriculture. We need it to support our growing population and to maintain and improve our standard of living. There are significant pressures on water resources which affect both the water environment and water supplies. There are many catchments where there is little or no water available for abstraction during dry periods. Pressures are greatest in South East and Eastern England because of them being the driest parts of England and Wales, coupled with the highest population density and household water use. The demand for water to irrigate crops in East Anglia also adds to the pressure on resources during the driest times of the year. Over the next 30 years, there will be increasing pressures from the rising population and associated development. Looking further ahead, the impact of climate change could have a major impact on the water that will be available for all uses. This report summarises our work which has assessed the current and future pressures on water resources in England and Wales. This has included our Catchment Abstraction Management Strategies, Water Resources Management Plans produced by water companies, river basin and other studies to support the Water Framework Directive and the Habitats Directive, plus work to assess the possible impacts of climate change. This is in addition to our routine monitoring and work by other organisations that helps to establish the state of the water resources in England and Wales. This report brings together this work to present information on the state of water resources and to put the current and future pressures into context. It does not explore the actions that we believe need to be taken to manage water resources in a sustainable way to ensure that there is enough water for people and wildlife. These will be covered in our Water Resources Strategy for England and Wales which we will publish early in 2009. We intend to update this report from time to time to monitor how water resources are used, actual and potential impacts on the water environment from abstraction and how the pressures on future water resources may be changing.
Environment Agency Water resources in England and Wales – current state and future pressures
4
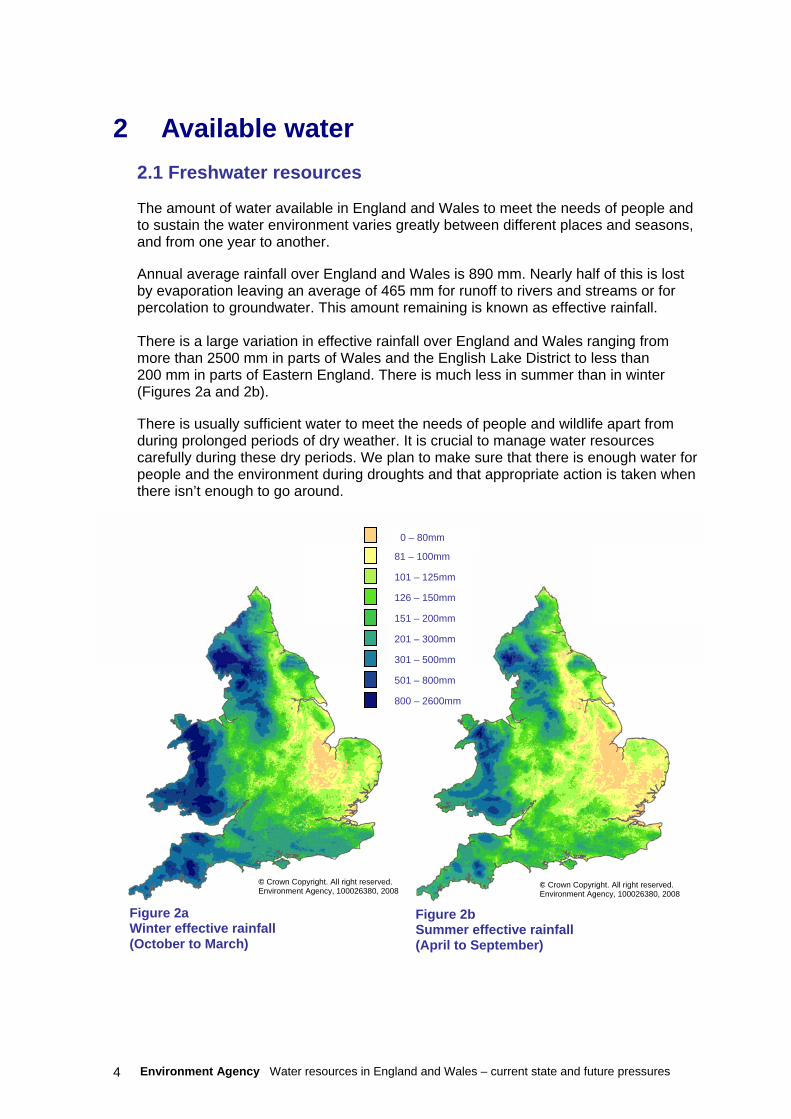
Figure 2a Winter effective rainfall (October to March)
Figure 2b Summer effective rainfall (April to September)
© Crown Copyright. All right reserved. Environment Agency, 100026380, 2008
© Crown Copyright. All right reserved. Environment Agency, 100026380, 2008
0 – 80mm
81 – 100mm
101 – 125mm
126 – 150mm
151 – 200mm
201 – 300mm
301 – 500mm
501 – 800mm
800 – 2600mm
2 Available water
2.1 Freshwater resources The amount of water available in England and Wales to meet the needs of people and to sustain the water environment varies greatly between different places and seasons, and from one year to another. Annual average rainfall over England and Wales is 890 mm. Nearly half of this is lost by evaporation leaving an average of 465 mm for runoff to rivers and streams or for percolation to groundwater. This amount remaining is known as effective rainfall. There is a large variation in effective rainfall over England and Wales ranging from more than 2500 mm in parts of Wales and the English Lake District to less than 200 mm in parts of Eastern England. There is much less in summer than in winter (Figures 2a and 2b). There is usually sufficient water to meet the needs of people and wildlife apart from during prolonged periods of dry weather. It is crucial to manage water resources carefully during these dry periods. We plan to make sure that there is enough water for people and the environment during droughts and that appropriate action is taken when there isn’t enough to go around.
Environment Agency Water resources in England and Wales – current state and future pressures
5
© Crown Copyright. All right reserved. Environment Agency, 100026380, 2008
3 Using water in England and Wales
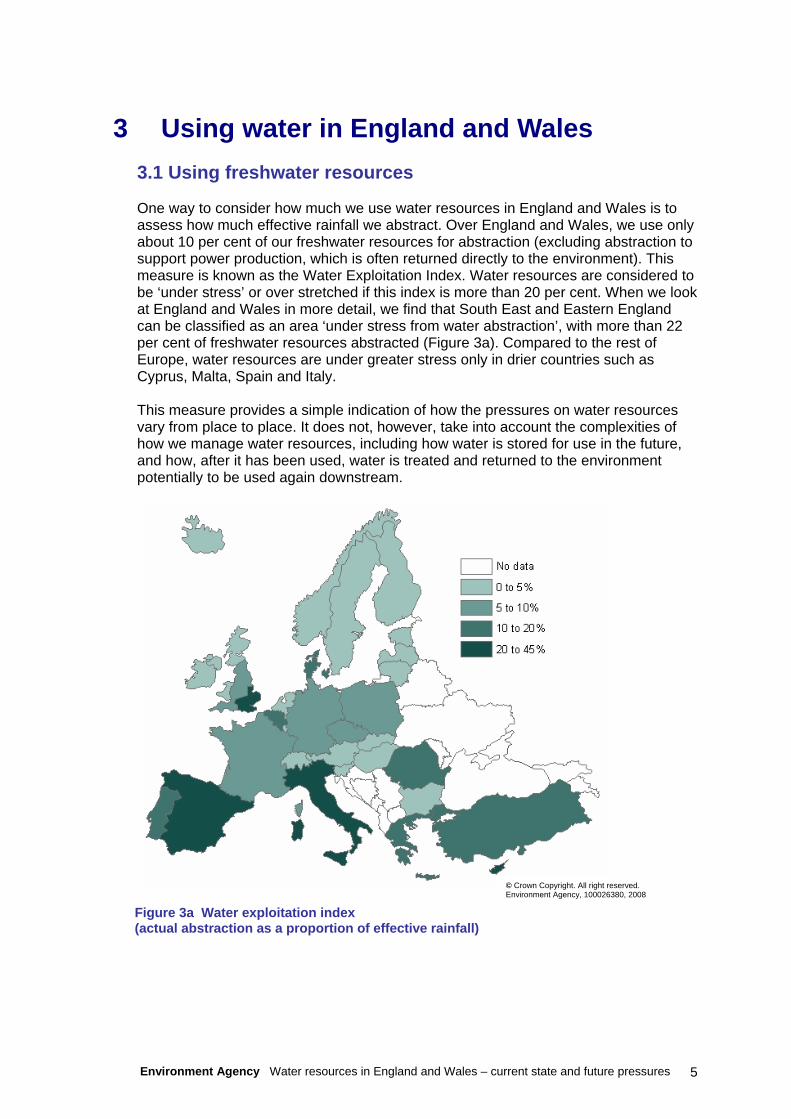
3.1 Using freshwater resources One way to consider how much we use water resources in England and Wales is to assess how much effective rainfall we abstract. Over England and Wales, we use only about 10 per cent of our freshwater resources for abstraction (excluding abstraction to support power production, which is often returned directly to the environment). This measure is known as the Water Exploitation Index. Water resources are considered to be ‘under stress’ or over stretched if this index is more than 20 per cent. When we look at England and Wales in more detail, we find that South East and Eastern England can be classified as an area ‘under stress from water abstraction’, with more than 22 per cent of freshwater resources abstracted (Figure 3a). Compared to the rest of Europe, water resources are under greater stress only in drier countries such as Cyprus, Malta, Spain and Italy. This measure provides a simple indication of how the pressures on water resources vary from place to place. It does not, however, take into account the complexities of how we manage water resources, including how water is stored for use in the future, and how, after it has been used, water is treated and returned to the environment potentially to be used again downstream.
Figure 3a Water exploitation index (actual abstraction as a proportion of effective rainfall)

Environment Agency Water resources in England and Wales – current state and future pressures
6
Figure 3c Water available for abstraction (groundwater)
Figure 3b Water available for abstraction (surface water combined with groundwater)
© Crown Copyright. All right reserved. Environment Agency, 100026380, 2008
© Crown Copyright. All right reserved. Environment Agency, 100026380, 2008
15%
18%
35%
32%
0% 5% 10% 15% 20% 25% 30% 35%
over abstracted
over licensed
no water available
water available
percentage of CAMS units
3.2 Available water resources We assess the water resources that are available for abstraction through our Catchment Abstraction Management Strategies (CAMS). CAMS consider how much freshwater resource is reliably available, how much water the environment needs and the amount of water already licensed for abstraction. This shows us where water is potentially available for abstraction. We have recently completed the first cycle of 119 CAMS, which has for the first time provided us with a comprehensive baseline for all catchments in England and Wales. The results show that there are considerable pressures on water resources throughout England and Wales, not just in the drier South East and Eastern England. Our water resources availability maps (Figures 3b and 3c) show that there are many catchments where there is no water available for abstraction at low flows. In addition, some catchments are over licensed or over-abstracted, and we need to restore a sustainable abstraction regime.
Environment Agency Water resources in England and Wales – current state and future pressures
7
0
10,000
20,000
30,000
40,000
50,000
60,000
70,000
2000/01 2001/02 2002/03 2003/04 2004/05 2005/06 2006/07
megalitres per day
groundwatersurface water (tidal) surface water (non-tidal)
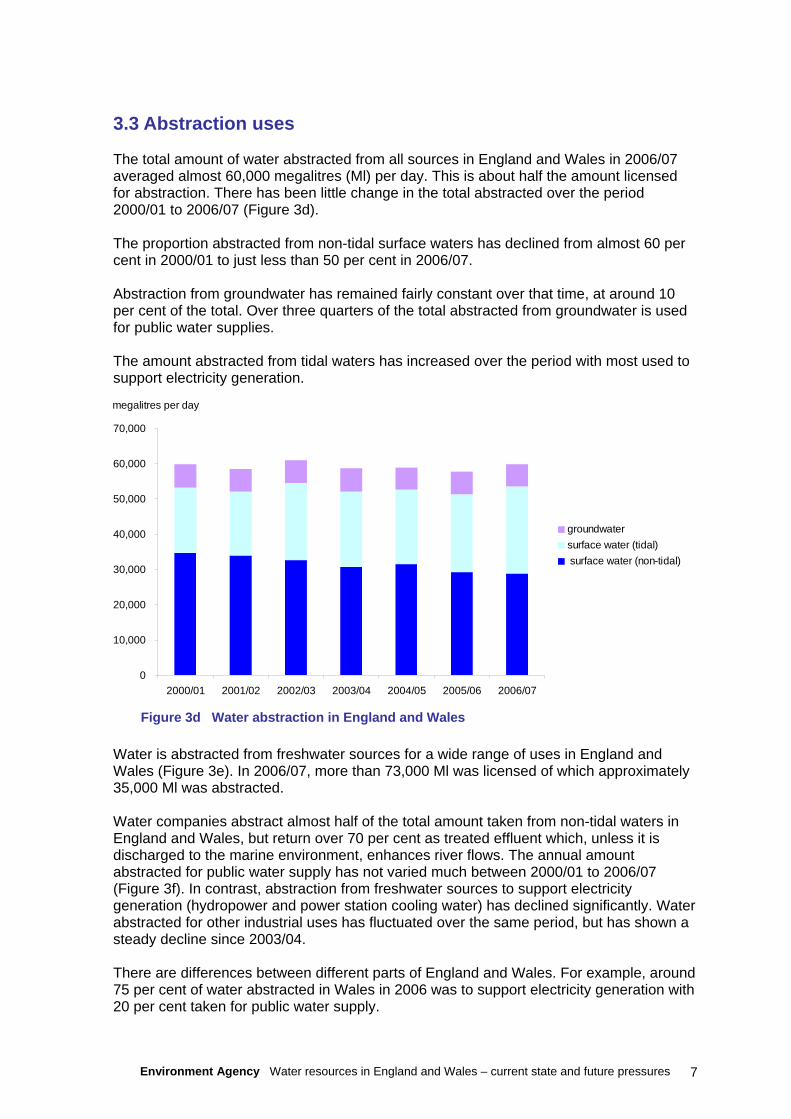
Figure 3d Water abstraction in England and Wales
3.3 Abstraction uses The total amount of water abstracted from all sources in England and Wales in 2006/07 averaged almost 60,000 megalitres (Ml) per day. This is about half the amount licensed for abstraction. There has been little change in the total abstracted over the period 2000/01 to 2006/07 (Figure 3d). The proportion abstracted from non-tidal surface waters has declined from almost 60 per cent in 2000/01 to just less than 50 per cent in 2006/07. Abstraction from groundwater has remained fairly constant over that time, at around 10 per cent of the total. Over three quarters of the total abstracted from groundwater is used for public water supplies. The amount abstracted from tidal waters has increased over the period with most used to support electricity generation. Water is abstracted from freshwater sources for a wide range of uses in England and Wales (Figure 3e). In 2006/07, more than 73,000 Ml was licensed of which approximately 35,000 Ml was abstracted. Water companies abstract almost half of the total amount taken from non-tidal waters in England and Wales, but return over 70 per cent as treated effluent which, unless it is discharged to the marine environment, enhances river flows. The annual amount abstracted for public water supply has not varied much between 2000/01 to 2006/07 (Figure 3f). In contrast, abstraction from freshwater sources to support electricity generation (hydropower and power station cooling water) has declined significantly. Water abstracted for other industrial uses has fluctuated over the same period, but has shown a steady decline since 2003/04. There are differences between different parts of England and Wales. For example, around 75 per cent of water abstracted in Wales in 2006 was to support electricity generation with 20 per cent taken for public water supply.
Environment Agency Water resources in England and Wales – current state and future pressures
8
0
5,000
10,000
15,000
20,000
25,000
30,000
35,000
40,000
45,000
2000/01 2001/02 2002/03 2003/04 2004/05 2005/06 2006/07
megalitres per day
private water supply
agriculture (other)
other uses
spray irrigation
fish farming
industry (excl. electricity supply)
electricity supply
public water supply
0 5,000 10,000 15,000 20,000 25,000 30,000 35,000
public water supply
electricity
other industry
fish farming, cress growing and amenity ponds
spray irrigation
other
agriculture other than spray irrigation
private water supply
abstraction (megalitres)
licensed
actual
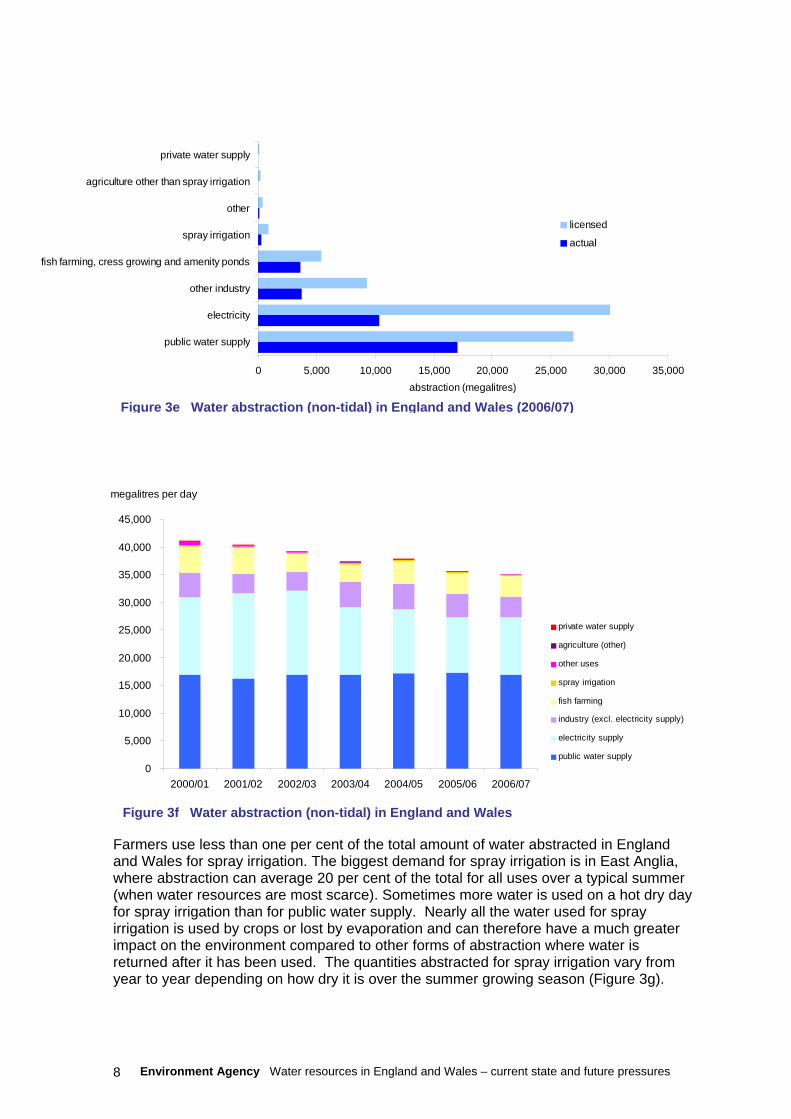
Figure 3f Water abstraction (non-tidal) in England and Wales
Farmers use less than one per cent of the total amount of water abstracted in England and Wales for spray irrigation. The biggest demand for spray irrigation is in East Anglia, where abstraction can average 20 per cent of the total for all uses over a typical summer (when water resources are most scarce). Sometimes more water is used on a hot dry day for spray irrigation than for public water supply. Nearly all the water used for spray irrigation is used by crops or lost by evaporation and can therefore have a much greater impact on the environment compared to other forms of abstraction where water is returned after it has been used. The quantities abstracted for spray irrigation vary from year to year depending on how dry it is over the summer growing season (Figure 3g).
Figure 3e Water abstraction (non-tidal) in England and Wales (2006/07)
Environment Agency Water resources in England and Wales – current state and future pressures
9
0
5,000
10,000
15,000
20,000
25,000
30,000
35,000
40,000
45,000
50,000
2000/01 2001/02 2002/03 2003/04 2004/05 2005/06 2006/07
number of licences
< 20 cubic metres per day
permanent
time limited
Figure 3g
Figure 3h Number of abstraction licences in England and Wales
0
50
100
150
200
250
300
350
2000/01 2001/02 2002/03 2003/04 2004/05 2005/06 2006/07
megalitres per day
0
50
100
150
200
250
300
350
% average rainfall
North WestSouth WestThamesWalesNorth EastSouthernMidlandsAngliansummer rainfall
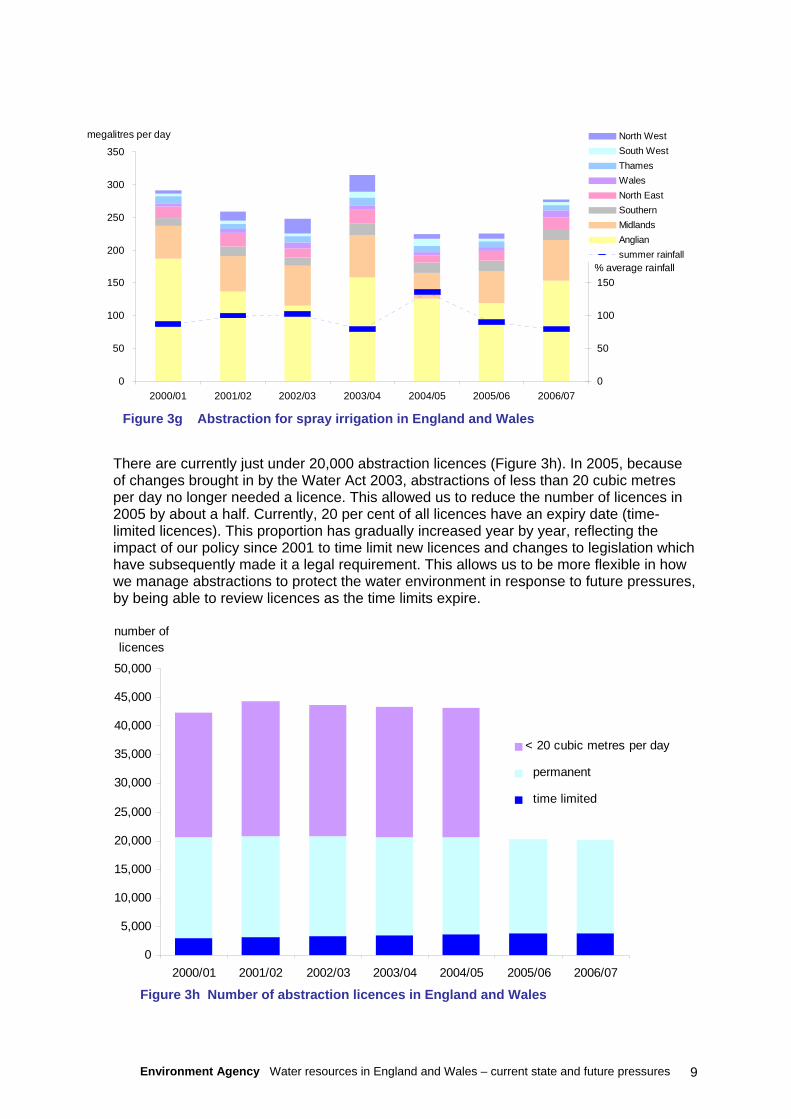
Figure 3g Abstraction for spray irrigation in England and Wales
There are currently just under 20,000 abstraction licences (Figure 3h). In 2005, because of changes brought in by the Water Act 2003, abstractions of less than 20 cubic metres per day no longer needed a licence. This allowed us to reduce the number of licences in 2005 by about a half. Currently, 20 per cent of all licences have an expiry date (time-limited licences). This proportion has gradually increased year by year, reflecting the impact of our policy since 2001 to time limit new licences and changes to legislation which have subsequently made it a legal requirement. This allows us to be more flexible in how we manage abstractions to protect the water environment in response to future pressures, by being able to review licences as the time limits expire.
Environment Agency Water resources in England and Wales – current state and future pressures
10
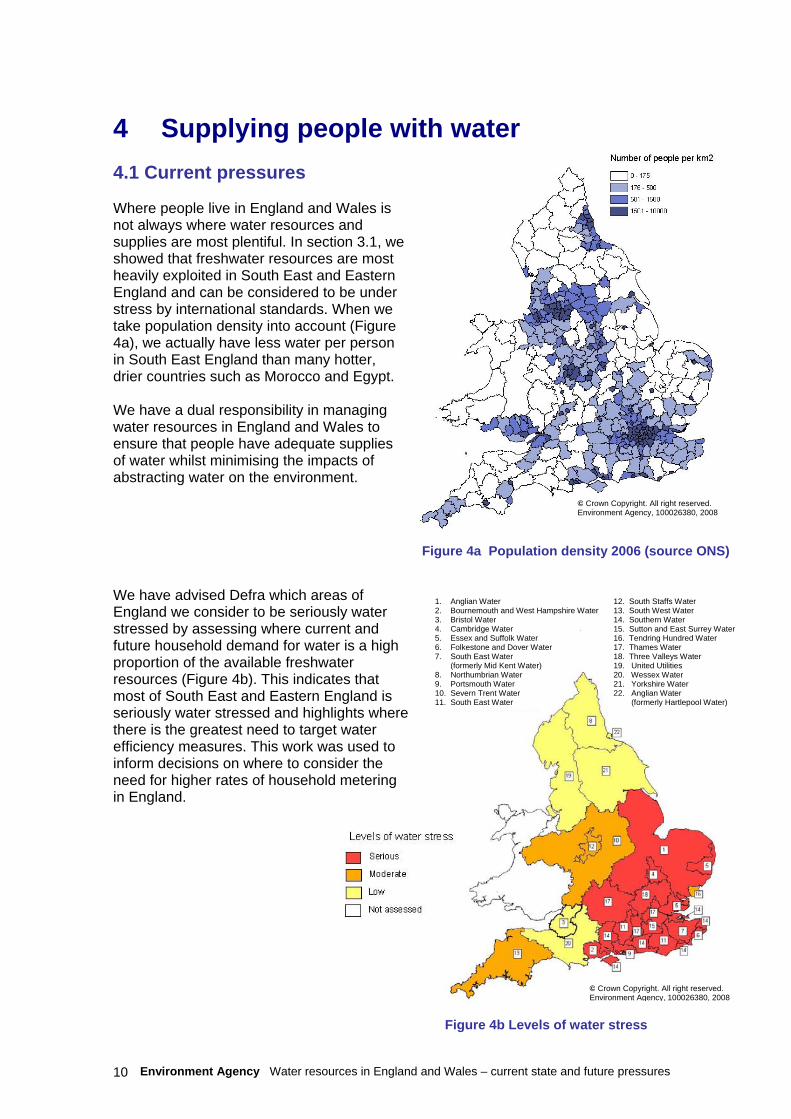
Figure 4a Population density 2006 (source ONS)
© Crown Copyright. All right reserved. Environment Agency, 100026380, 2008
12. South Staffs Water 13. South West Water 14. Southern Water 15. Sutton and East Surrey Water 16. Tendring Hundred Water 17. Thames Water 18. Three Valleys Water 19. United Utilities 20. Wessex Water 21. Yorkshire Water 22. Anglian Water (formerly Hartlepool Water)
1. Anglian Water 2. Bournemouth and West Hampshire Water 3. Bristol Water 4. Cambridge Water 5. Essex and Suffolk Water 6. Folkestone and Dover Water 7. South East Water (formerly Mid Kent Water) 8. Northumbrian Water 9. Portsmouth Water 10. Severn Trent Water 11. South East Water
Figure 4b Levels of water stress
4 Supplying people with water 4.1 Current pressures Where people live in England and Wales is not always where water resources and supplies are most plentiful. In section 3.1, we showed that freshwater resources are most heavily exploited in South East and Eastern England and can be considered to be under stress by international standards. When we take population density into account (Figure 4a), we actually have less water per person in South East England than many hotter, drier countries such as Morocco and Egypt. We have a dual responsibility in managing water resources in England and Wales to ensure that people have adequate supplies of water whilst minimising the impacts of abstracting water on the environment. We have advised Defra which areas of England we consider to be seriously water stressed by assessing where current and future household demand for water is a high proportion of the available freshwater resources (Figure 4b). This indicates that most of South East and Eastern England is seriously water stressed and highlights where there is the greatest need to target water efficiency measures. This work was used to inform decisions on where to consider the need for higher rates of household metering in England.
© Crown Copyright. All right reserved. Environment Agency, 100026380, 2008
Environment Agency Water resources in England and Wales – current state and future pressures
11
100
120
140
160
180
200
1999/00 2000/01 2001/02 2002/03 2003/04 2004/05 2005/06 2006/07 2007/08
litres/head/day
unmetered average metered
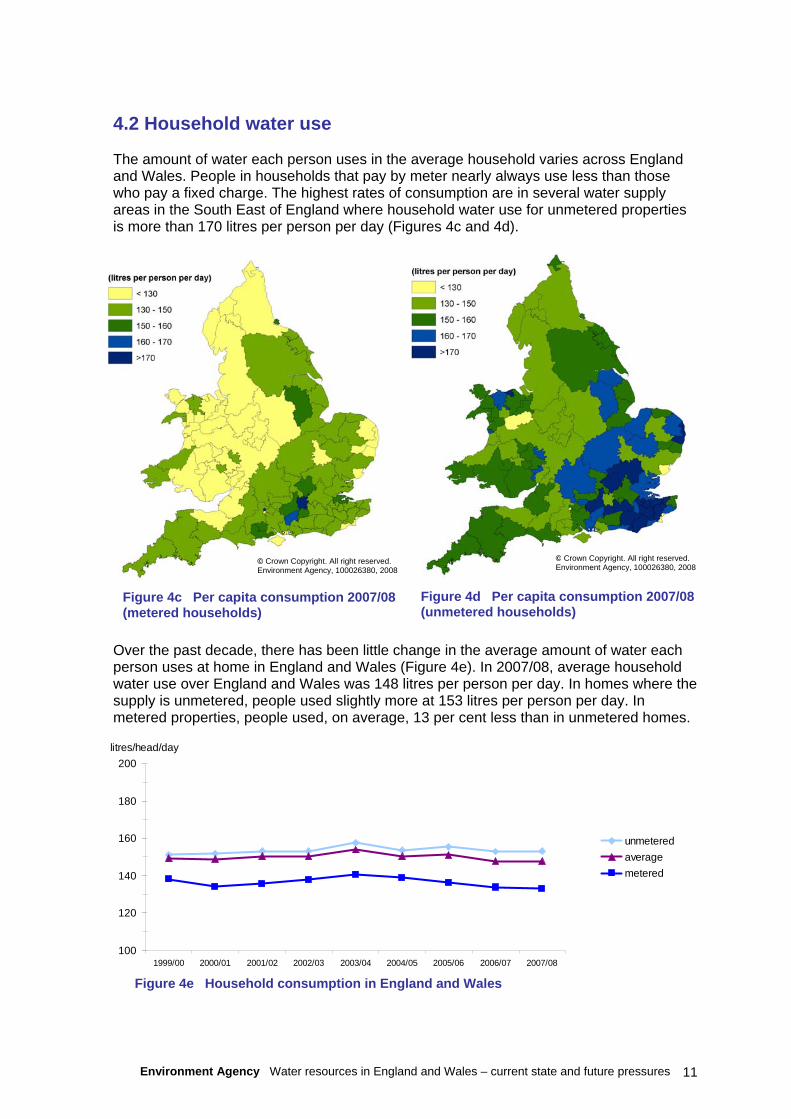
Figure 4c Per capita consumption 2007/08 (metered households)
© Crown Copyright. All right reserved. Environment Agency, 100026380, 2008
Figure 4d Per capita consumption 2007/08 (unmetered households)
4.2 Household water use The amount of water each person uses in the average household varies across England and Wales. People in households that pay by meter nearly always use less than those who pay a fixed charge. The highest rates of consumption are in several water supply areas in the South East of England where household water use for unmetered properties is more than 170 litres per person per day (Figures 4c and 4d).
Over the past decade, there has been little change in the average amount of water each person uses at home in England and Wales (Figure 4e). In 2007/08, average household water use over England and Wales was 148 litres per person per day. In homes where the supply is unmetered, people used slightly more at 153 litres per person per day. In metered properties, people used, on average, 13 per cent less than in unmetered homes.
Figure 4e Household consumption in England and Wales
© Crown Copyright. All right reserved. Environment Agency, 100026380, 2008
Environment Agency Water resources in England and Wales – current state and future pressures
12
0
10
20
30
40
50
60
70
80
90
100
2000 2001 2002 2003 2004 2005 2006 2007 2008
per cent
meteredunmetered
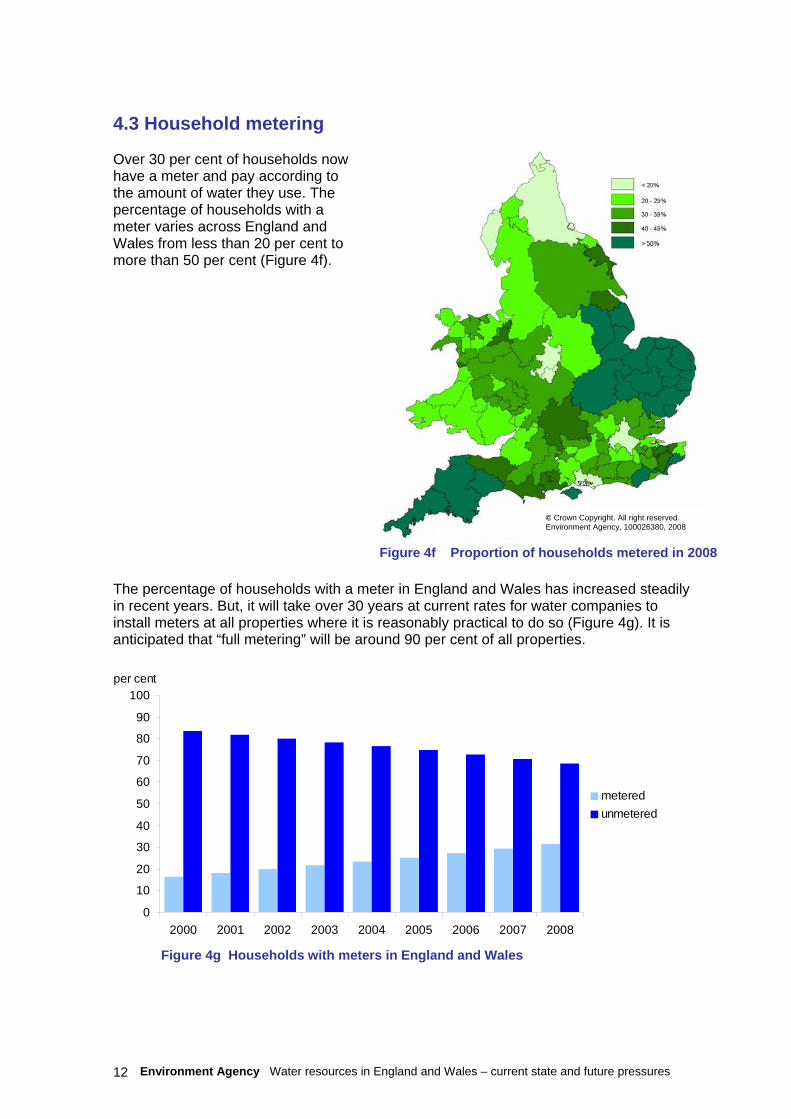
Figure 4g Households with meters in England and Wales
4.3 Household metering Over 30 per cent of households now have a meter and pay according to the amount of water they use. The percentage of households with a meter varies across England and Wales from less than 20 per cent to more than 50 per cent (Figure 4f).
The percentage of households with a meter in England and Wales has increased steadily in recent years. But, it will take over 30 years at current rates for water companies to install meters at all properties where it is reasonably practical to do so (Figure 4g). It is anticipated that “full metering” will be around 90 per cent of all properties.
Figure 4f Proportion of households metered in 2008
© Crown Copyright. All right reserved. Environment Agency, 100026380, 2008
Environment Agency Water resources in England and Wales – current state and future pressures
13
0
1000
2000
3000
4000
5000
6000
1994
-95
1995
-96
1996
-97
1997
-98
1998
-99
1999
-00
2000
-01
2001
-02
2002
-03
2003
-04
2004
-05
2005
-06
2006
-07
2007
-08
megalitres per day
customer supply pipesdistribution mains
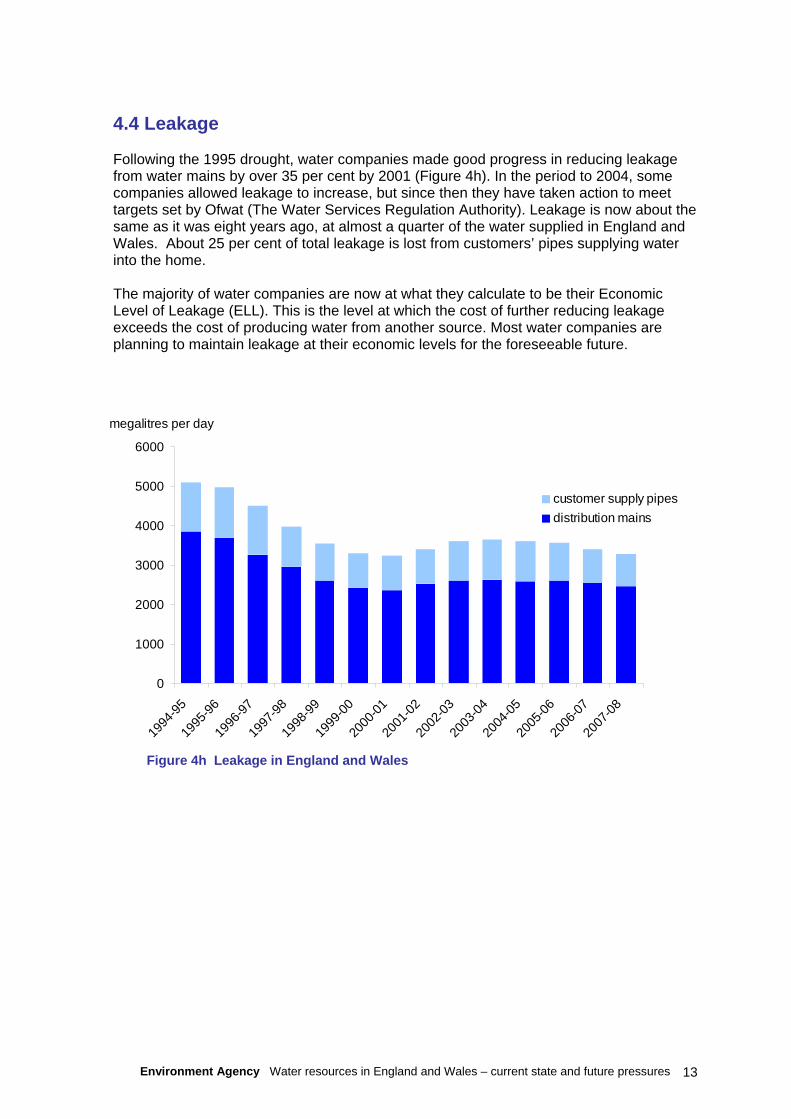
Figure 4h Leakage in England and Wales
4.4 Leakage Following the 1995 drought, water companies made good progress in reducing leakage from water mains by over 35 per cent by 2001 (Figure 4h). In the period to 2004, some companies allowed leakage to increase, but since then they have taken action to meet targets set by Ofwat (The Water Services Regulation Authority). Leakage is now about the same as it was eight years ago, at almost a quarter of the water supplied in England and Wales. About 25 per cent of total leakage is lost from customers’ pipes supplying water into the home. The majority of water companies are now at what they calculate to be their Economic Level of Leakage (ELL). This is the level at which the cost of further reducing leakage exceeds the cost of producing water from another source. Most water companies are planning to maintain leakage at their economic levels for the foreseeable future.
Environment Agency Water resources in England and Wales – current state and future pressures
14
0
2000
4000
6000
8000
10000
12000
14000
16000
18000
20000
1999-00 2000-01 2001-02 2002-03 2003-04 2004-05 2005-06 2006-07 2007-08
megalitres per day
total non-householdtotal householdleakage + other losseswater available in dry year
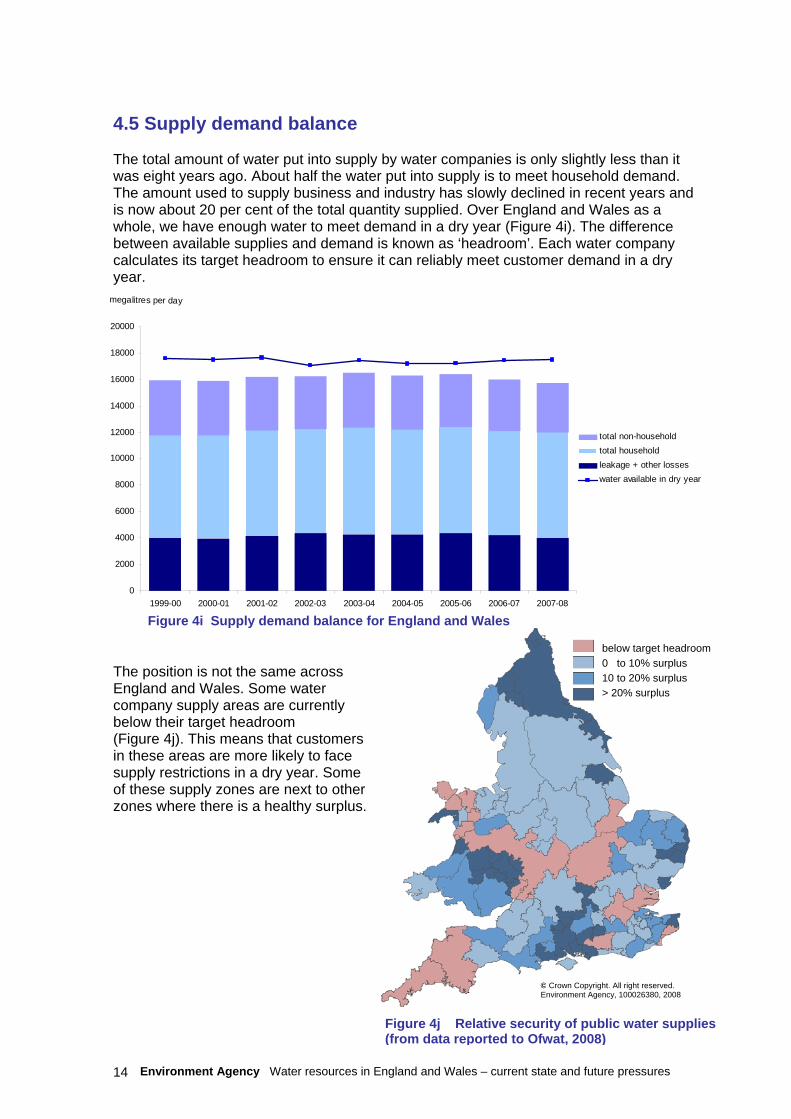
Figure 4i Supply demand balance for England and Wales
© Crown Copyright. All right reserved. Environment Agency, 100026380, 2008
Figure 4j Relative security of public water supplies (from data reported to Ofwat, 2008)
below target headroom 0 to 10% surplus 10 to 20% surplus > 20% surplus
4.5 Supply demand balance The total amount of water put into supply by water companies is only slightly less than it was eight years ago. About half the water put into supply is to meet household demand. The amount used to supply business and industry has slowly declined in recent years and is now about 20 per cent of the total quantity supplied. Over England and Wales as a whole, we have enough water to meet demand in a dry year (Figure 4i). The difference between available supplies and demand is known as ‘headroom’. Each water company calculates its target headroom to ensure it can reliably meet customer demand in a dry year. The position is not the same across England and Wales. Some water company supply areas are currently below their target headroom (Figure 4j). This means that customers in these areas are more likely to face supply restrictions in a dry year. Some of these supply zones are next to other zones where there is a healthy surplus.
Environment Agency Water resources in England and Wales – current state and future pressures
15
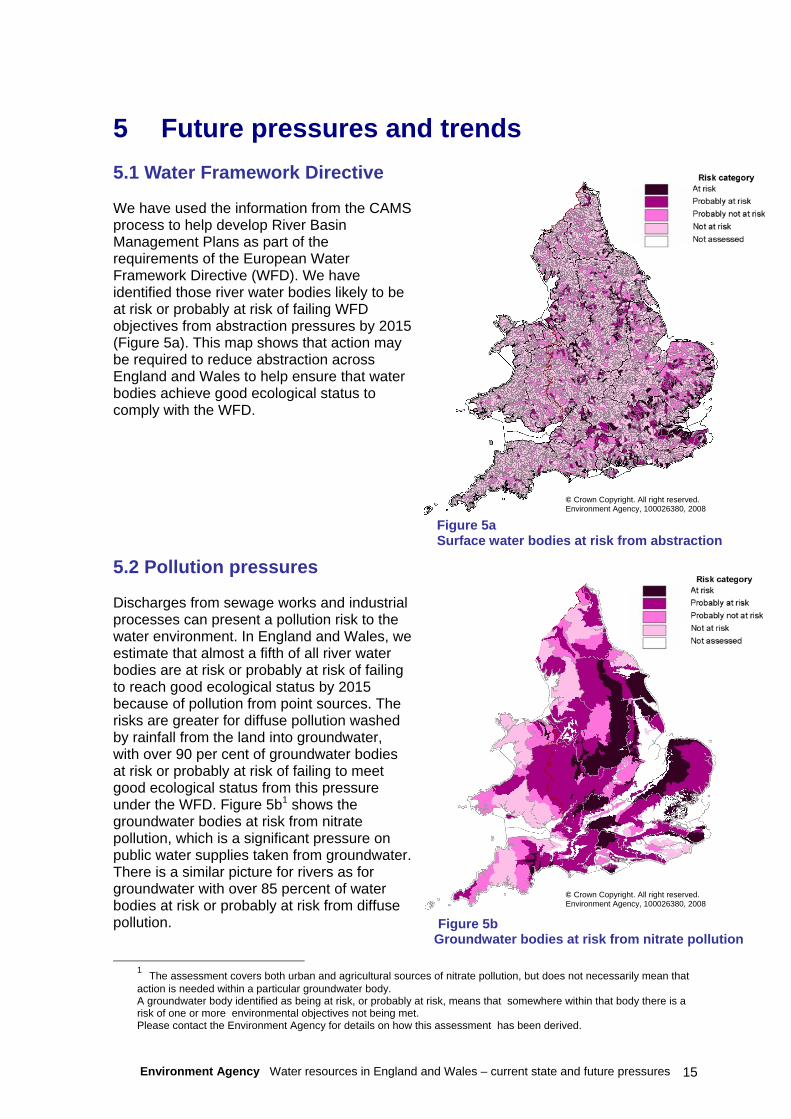
Figure 5b Groundwater bodies at risk from nitrate pollution
© Crown Copyright. All right reserved. Environment Agency, 100026380, 2008
Figure 5a Surface water bodies at risk from abstraction
5 Future pressures and trends 5.1 Water Framework Directive We have used the information from the CAMS process to help develop River Basin Management Plans as part of the requirements of the European Water Framework Directive (WFD). We have identified those river water bodies likely to be at risk or probably at risk of failing WFD objectives from abstraction pressures by 2015 (Figure 5a). This map shows that action may be required to reduce abstraction across England and Wales to help ensure that water bodies achieve good ecological status to comply with the WFD. 5.2 Pollution pressures Discharges from sewage works and industrial processes can present a pollution risk to the water environment. In England and Wales, we estimate that almost a fifth of all river water bodies are at risk or probably at risk of failing to reach good ecological status by 2015 because of pollution from point sources. The risks are greater for diffuse pollution washed by rainfall from the land into groundwater, with over 90 per cent of groundwater bodies at risk or probably at risk of failing to meet good ecological status from this pressure under the WFD. Figure 5b1 shows the groundwater bodies at risk from nitrate pollution, which is a significant pressure on public water supplies taken from groundwater. There is a similar picture for rivers as for groundwater with over 85 percent of water bodies at risk or probably at risk from diffuse pollution.
1 The assessment covers both urban and agricultural sources of nitrate pollution, but does not necessarily mean that action is needed within a particular groundwater body. A groundwater body identified as being at risk, or probably at risk, means that somewhere within that body there is a risk of one or more environmental objectives not being met. Please contact the Environment Agency for details on how this assessment has been derived.
© Crown Copyright. All right reserved. Environment Agency, 100026380, 2008

Environment Agency Water resources in England and Wales – current state and future pressures
16
Figure 5a RSA sites 2008
Figure 5c Restoring Sustainable Abstraction (RSA) sites
Figure 5d England’s freshwater wetlands 50-year vision
© Crown Copyright. All right reserved. Environment Agency, 100026380, 2008
5.3 Water for wildlife There are many important wildlife sites that we believe may have been affected or may be under threat from water abstraction (Figure 5c). Many of these are in East Anglia where available resources are particularly scarce. These sites are included in our Restoring Sustainable Abstraction (RSA) programme where we plan to take action to reduce abstractions after we have confirmed the nature and cause of the problem and have identified a suitable solution.
5.4 Water for wetlands We have worked with our partners (Natural England, English Heritage, RSPB and the Wildlife Trusts) to produce a 50-year vision for England’s freshwater wetlands (Figure 5d). This was launched in July 2008 and shows where new wetlands could be created and current wetlands restored, if enough water is available. The aim is to make space for water in our countryside, help people and wildlife adapt to a changing climate, protect our heritage and reap the benefits that wetlands can provide such as helping to moderate the extremes of flooding and drought.
© Crown Copyright. All right reserved. Environment Agency, 100026380, 2008

Environment Agency Water resources in England and Wales – current state and future pressures
17
40
45
50
55
60
65
70
1971
1976
1981
1986
1991
1996
2001
2006
2011
2016
2021
2026
2031
population (millions)
historic
forecast
Figure 5e Population trends in England and Wales (source ONS)
Figure 5f Projected population growth 2006 to 2031 (source ONS)
© Crown Copyright. All right reserved. Environment Agency, 100026380, 2008
Projected increase in population 2006 to 2031
5.5 Population growth One of the biggest pressures on water resources is the increase in population. It has risen at a faster rate over the past 10 years than the previous 20 across England and Wales as a whole and is forecast to increase at an even greater rate over the next quarter of a century (Figure 5e). By 2031, we expect the total population of England and Wales to grow by an extra 10 million people, an increase of 18 per cent from 2006.
The forecasts vary from place to place with the population in some parts of the country expected to increase by over 40 per cent (Figure 5f). Many of the growth areas are in places where the water environment and/or water supplies are already stressed.
Environment Agency Water resources in England and Wales – current state and future pressures
18
100
120
140
160
180
200
2008 2010 2012 2014 2016 2018 2020 2022 2024 2026 2028 2030 2032 2034
litres/head/day
unmetered
average
metered
0
10
20
30
40
50
60
70
80
90
100
2000 2002 2004 2006 2008 2010 2012 2014 2016 2018 2020 2022 2024 2026 2028 2030 2032 2034
% households metered
areas of serious water stressEngland and Walesrest of England and Wales
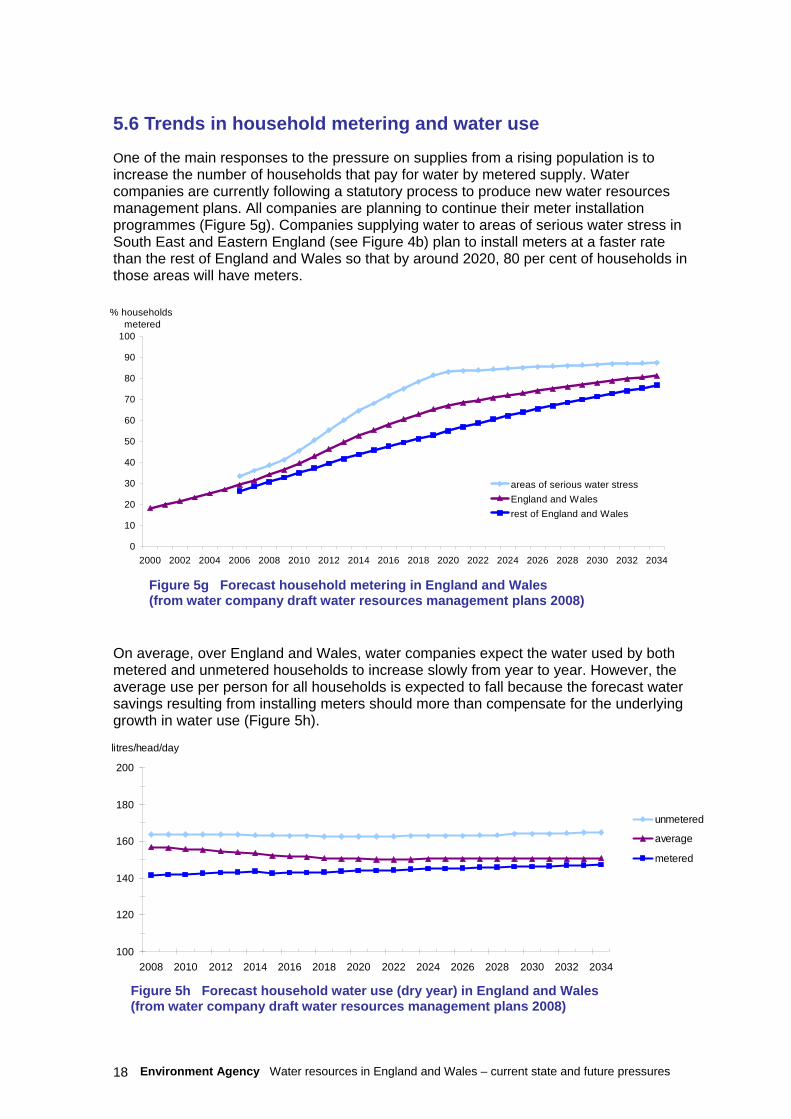
Figure 5g Forecast household metering in England and Wales (from water company draft water resources management plans 2008)
Figure 5h Forecast household water use (dry year) in England and Wales (from water company draft water resources management plans 2008)
5.6 Trends in household metering and water use One of the main responses to the pressure on supplies from a rising population is to increase the number of households that pay for water by metered supply. Water companies are currently following a statutory process to produce new water resources management plans. All companies are planning to continue their meter installation programmes (Figure 5g). Companies supplying water to areas of serious water stress in South East and Eastern England (see Figure 4b) plan to install meters at a faster rate than the rest of England and Wales so that by around 2020, 80 per cent of households in those areas will have meters.
On average, over England and Wales, water companies expect the water used by both metered and unmetered households to increase slowly from year to year. However, the average use per person for all households is expected to fall because the forecast water savings resulting from installing meters should more than compensate for the underlying growth in water use (Figure 5h).

Environment Agency Water resources in England and Wales – current state and future pressures
19
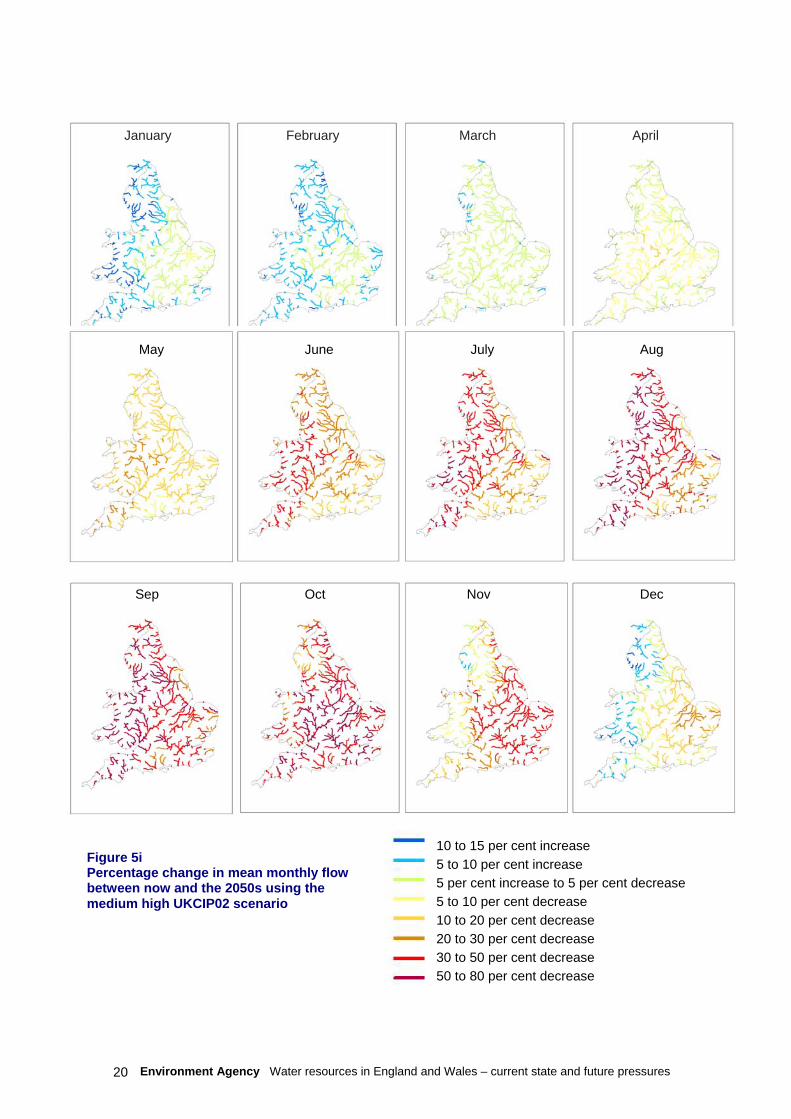
5.7 Climate change We have recently assessed how climate change could affect the water resources that will be available in the future (Figure 5i). Our work shows that there will be a significant impact on average river flows across England and Wales by the 2050s. By 2050, river flows in winter may increase by 10 to 15 per cent but with lower flows in most rivers from April to December. River flows in the late summer and early autumn could fall by over 50 per cent, and by as much as 80 per cent in some catchments. Overall, this could mean a drop in annual river flows of up to 15 per cent. If effects of this magnitude occur, this will probably be the biggest challenge we need to overcome to ensure that there is enough water for people and the environment. Related work indicates that climate change may reduce the recharge of aquifers and lead to a consequent lowering of groundwater levels. As well as reducing river flows and groundwater levels, climate change will have other effects on the water environment, such as increased water temperatures. The warmer climate will also mean higher demands for water by both households and by direct abstraction for crop irrigation.
Environment Agency Water resources in England and Wales – current state and future pressures
20
10 to 15 per cent increase 5 to 10 per cent increase 5 per cent increase to 5 per cent decrease5 to 10 per cent decrease 10 to 20 per cent decrease 20 to 30 per cent decrease 30 to 50 per cent decrease 50 to 80 per cent decrease
January February March April May June July Aug Sep Oct Nov Dec
Figure 5i Percentage change in mean monthly flow between now and the 2050s using the medium high UKCIP02 scenario

Environment Agency Water resources in England and Wales – current state and future pressures
21
6 Future strategy The water resources across much of England and Wales are used intensively and are subject to significant pressures. Meeting the future demands of society, whilst protecting and improving the environment in the face of the impact of climate change, will be a daunting challenge. The future management of this precious resource is too important to be left to chance. In early 2009, we will publish our strategy for managing water resources in England, and Wales, for the next 50 years.

Environment Agency Water resources in England and Wales – current state and future pressures
22
Would you like to find out more about us, or about your environment? Then call us on 08708 506 506 (Mon-Fri 8-6) email [email protected] or visit our website www.environment-agency.gov.uk incident hotline 0800 80 70 60 (24hrs) floodline 0845 988 1188