water recovery and reuse: guideline for safe application...
TRANSCRIPT
Water Recovery and Reuse: Guideline for Safe Application of Water Conservation Methods in Beverage Production and Food Processing
Washington, DC
A Publication of the Center for Risk Science Innovation and Application of the ILSI Research Foundation
Water Recovery and Reuse: Guideline for Safe Application of Water Conservation Methods in Beverage Production and Food Processing

Copyright © ILSI Research Foundation 2013 This work is licensed under the Creative Commons Attribution-Noncommercial-No Derivative Works 3.0 United States License. To view a copy of this license, visit http://creativecommons.org/licenses/by-nc-nd/3.0/us/ or send a letter to Creative Commons, 171 Second Street, Suite 300, San Francisco, California, 94105, USA
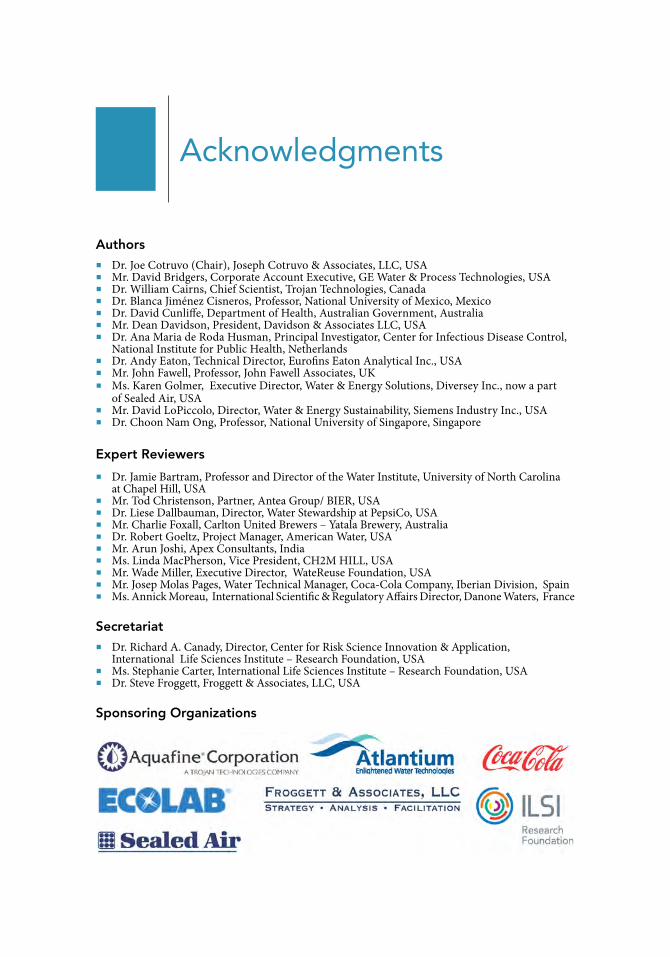
Acknowledgments
Authors
■ Dr. Joe Cotruvo (Chair), Joseph Cotruvo & Associates, LLC, USA ■ Mr. David Bridgers, Corporate Account Executive, GE Water & Process Technologies, USA ■ Dr. William Cairns, Chief Scientist, Trojan Technologies, Canada ■ Dr. Blanca Jiménez Cisneros, Professor, National University of Mexico, Mexico ■ Dr. David Cunliffe, Department of Health, Australian Government, Australia ■ Mr. Dean Davidson, President, Davidson & Associates LLC, USA ■ Dr. Ana Maria de Roda Husman, Principal Investigator, Center for Infectious Disease Control,
National Institute for Public Health, Netherlands ■ Dr. Andy Eaton, Technical Director, Eurofins Eaton Analytical Inc., USA ■ Mr. John Fawell, Professor, John Fawell Associates, UK ■ Ms. Karen Golmer, Executive Director, Water & Energy Solutions, Diversey Inc., now a part
of Sealed Air, USA ■ Mr. David LoPiccolo, Director, Water & Energy Sustainability, Siemens Industry Inc., USA ■ Dr. Choon Nam Ong, Professor, National University of Singapore, Singapore
Expert Reviewers
■ Dr. Jamie Bartram, Professor and Director of the Water Institute, University of North Carolina at Chapel Hill, USA
■ Mr. Tod Christenson, Partner, Antea Group/ BIER, USA ■ Dr. Liese Dallbauman, Director, Water Stewardship at PepsiCo, USA ■ Mr. Charlie Foxall, Carlton United Brewers – Yatala Brewery, Australia ■ Dr. Robert Goeltz, Project Manager, American Water, USA ■ Mr. Arun Joshi, Apex Consultants, India ■ Ms. Linda MacPherson, Vice President, CH2M HILL, USA ■ Mr. Wade Miller, Executive Director, WateReuse Foundation, USA ■ Mr. Josep Molas Pages, Water Technical Manager, Coca-Cola Company, Iberian Division, Spain ■ Ms. Annick Moreau, International Scientific & Regulatory Affairs Director, Danone Waters, France
Secretariat
■ Dr. Richard A. Canady, Director, Center for Risk Science Innovation & Application, International Life Sciences Institute – Research Foundation, USA
■ Ms. Stephanie Carter, International Life Sciences Institute – Research Foundation, USA ■ Dr. Steve Froggett, Froggett & Associates, LLC, USA
Sponsoring Organizations

Executive Summary ..................................................................................................... 1Water Recovery and Reuse Guideline ......................................................................... 4
Suggested 11-Step Procedure for Evaluating and Implementing a Water Recovery and Reuse Process ................................................................................................4
Water Quality Requirements ........................................................................................7Chemical Quality for Minimal or Indirect Product Contact ....................................7Microbial Quality for Minimal or Indirect Product Contact ..................................10No Product Contact Potential ..............................................................................11
Water Recovery Guideline Background Information ................................................. 121.0 Introduction ........................................................................................................ 13
1.1 Added Value ........................................................................................................ 131.2 Water Use in the Beverage Industry .................................................................... 131.3 Guideline Purpose and Scope ............................................................................. 151.4 Challenges Addressed by This Guideline ............................................................ 161.5 Guideline Implementation and System Management ......................................... 17
2.0 Rationales for Water Recovery and Reuse .......................................................... 182.1 Water Quality for Intended Use ........................................................................... 182.2 Water Quality for Contact Uses ........................................................................... 182.3 Water Quality for Non-Contact Uses ................................................................... 18
2.3.1 Microbial Quality ......................................................................................... 192.3.2 Chemical and Physical Water Quality .......................................................... 21
2.4 Occupational Health and Safety .......................................................................... 223.0 Current and Developing Sources of Recovered Water ........................................ 23
3.1 Water Survey ........................................................................................................ 233.2 Water Survey Development: Step by Step .......................................................... 24
3.2.1 Develop a Water Flow Diagram ..................................................................243.2.2 Gather Data on Incoming Water .................................................................253.2.3 Gather Data on Effluent Water ....................................................................253.2.4 Identify Water Users and Recorded Flows ..................................................253.2.5 Identify Water Users with Flows That Are Metered but Not Recorded ......253.2.6 Identify Water Users Where Flows Are Neither Metered or Recorded ......263.2.7 Measure with Meter Flows to Be Counted .................................................263.2.8 Complete the Water Process Flow / Mass Balance Diagram ......................263.2.9 Add Costs to the Water Flow Diagram .......................................................27
3.3 Evaluate the Survey Results .................................................................................273.3.1 Calculate the Water Use Ratio ....................................................................273.3.2 Rank Water Users in the Facility by Volume and Cost ................................28
3.4 Evaluate Multiple Streams of Recovered Water for Various Uses .......................283.4.1 Rainwater .....................................................................................................28
3.4.1.1 Roof Catchment ................................................................................283.4.1.2 Hard Non-Roof Surfaces ...................................................................29
Table of Contents
4.0 Hazard Analysis Critical Control Point and Water Safety Plan ............................304.1 Application of HACCP/WSP Principles to Water Recovery Plans........................31
4.1.1 Assemble the Team .....................................................................................324.1.2 List Opportunities ........................................................................................324.1.3 Identify Potential Uses of Recovered Water ...............................................324.1.4 Identify Potential Hazards at Each Point of Water Recovery ......................324.1.5 Establish Critical Control Points and Limits .................................................324.1.6 Establish a Monitoring System for Each Critical Control Point ...................324.1.7 Establish Corrective Actions ........................................................................324.1.8 Establish Verification Procedures ................................................................324.1.9 Establish Documentation and Record Keeping ..........................................33
4.1.9.1 What to Document ............................................................................334.1.9.2 Why Documenting is Necessary ........................................................33
4.1.10 Training ......................................................................................................344.2 Auditing ...............................................................................................................34
4.2.1 Audit Criteria ...............................................................................................344.2.2 Water Recovery Audit Example ..................................................................34
5.0 Treatment Technologies ......................................................................................355.1 Treatment Options ...............................................................................................35
5.1.1 Selecting Suitable Processes .......................................................................355.1.2 Variable Conditions .....................................................................................375.1.3 Selection of Water Streams for Potential Recovery ....................................375.1.4 Multiple Barrier Treatment ..........................................................................37
5.2 Water Recovery Treatment Studies ......................................................................405.2.1 Regulatory Restrictions ................................................................................405.2.2 Storing Water Produced By a Multiple Barrier Treatment
Process for Reuse ........................................................................................405.2.3 Validation .....................................................................................................40
6.0 Monitoring ..........................................................................................................416.1 Water Characterization Needs .............................................................................416.2 Technology Performance Indicators ....................................................................42
6.2.1 On-line / Real-Time Monitoring ..................................................................426.2.2 Scenarios and Approaches ..........................................................................42
6.2.2.1 Microbiology .....................................................................................426.2.2.2 Chemical Indicators ...........................................................................436.2.2.3 Aesthetics ..........................................................................................436.2.2.4 Disinfectant Residuals .......................................................................436.2.2.5 Total Organic Carbon ........................................................................446.2.2.6 Turbidity ............................................................................................446.2.2.7 Conductivity ......................................................................................446.2.2.8 pH Levels ...........................................................................................44
6.3 Investigative Monitoring ......................................................................................456.4 Identification of Parameter Measures ..................................................................45
6.4.1 Maximum Allowable Levels .........................................................................456.4.2 Frequency and Location of Monitoring .......................................................45
6.5 Operational Monitoring .......................................................................................466.6 Verification Monitoring ........................................................................................46
Appendix A: Case Studies ........................................................................................47Appendix B: Selected Citations ................................................................................64Appendix C: Terminology / Glossary .........................................................................66Appendix D: Water Contaminant Concerns ..............................................................68Appendix E: Regulations And Standards ..................................................................72
Introduction
Many beverage producers and food processors are experiencing multiple pressures to find ways to minimize the total volume of water they use in the production of their product, and also to reduce waste water discharges. Producers need to secure adequate, predictable, and sustainable supplies of water for all uses at reasonable cost, with efficient usage to maximize product output. Reducing the “water footprint” of a facility that is feeling these pressures allows for higher production and less wastage, as well as realization of possible economic advantages, and possibly better relations with local citizens and governments. Water recovery and reuse can achieve significant reductions in water consumption.
Added Value
Water conservation through safe, verifiable recovery processes helps to preserve this precious resource while providing consumers with high-quality foods and bev-erages. Some bottlers have already made strides to reduce their water footprint, in part through water recovery efforts. For example, several reports indicate that water recovery coupled with more efficient water use can often achieve in the range of 25–40% reductions of water used per liter of beverage. These types of results should encourage producers to consider water recovery as an option in their efforts to efficiently utilize their available water resources.
A reader following the guideline will be able to: ■ Conduct a water audit, ■ Identify points where efficiencies can be increased, ■ Select appropriate technologies, and ■ Conduct a hazard analysis of critical control points, and develop, implement,
or refine the HACCP or water safety plan.
Water Recovery and Reuse
Water recovery and reuse is one conservation option in which water can be recov-ered and treated to any quality level for use in the same or other applications. This conservation method can reduce total water consumption and result in less waste and increased production, which in turn fosters improved sustainability as well as continued high-quality product offerings. Water reuse is an option when it is deter-mined to be necessary and cost-effective.
1
Executive Summary
2 |
Advances in water recovery and reuse processes and growing conservation requirements necessitate the need for guidelines to assist producers in assess-ing the opportunities and implementing these technologies safely, efficiently, and cost-effectively.
Guideline Purpose and Scope
This guideline addresses water recovery and reuse in processes for the production of beverages such as soft drinks, sodas, beer, juices, milk, and still or carbonated waters. Although they are specific to these beverage
applications, many of the practices and principles described here for water recovery can be applied to water in food processing facilities with little or no modification. It addresses processes and procedures that do not involve use of recovered water in product. Water recovery for potable purposes, direct addition to product, and water derived from sanitary wastewater sources are outside the scope of this guideline, and will not be discussed here although they may be considered in future guidelines. The following components are included in this guideline:
■ Recommended steps in water purification processes that should be followed when instituting a water recovery and reuse program, and
■ Recommended specifications for treated water quality to assure that the treated water is suitable for the intended use.
The importance of instituting a Hazard Analysis Critical Control Points (HACCP)/Water Safety Plan (WSP)-type management system for overall operations is empha-sized throughout this work.
Guideline Structure
This guideline aims to help beverage producers make decisions about which tech-nologies are appropriate to achieve the water quality goals needed for their desired end uses. End uses could vary from those where drinking water quality is necessary, to irrigation, cooling, sanitation, and facility and equipment cleaning. This work guides readers through decision processes to use water more efficiently at their sites by providing the following:
■ General concepts, ■ Discussion of general recovery and reuse concepts, ■ Detailed “how to” information, ■ Expert recommendations, ■ Case studies illustrating examples of successful water recovery efforts, and ■ Access information for on-line and published resources.
Addressed In This Guideline ■ Opportunities and Threats
for Water Recovery and Reuse
■ Current and Developing Sources of Recovered Water
■ Hazard Analysis Critical Control Points and Water Safety Plans
■ Treatment Technologies ■ Monitoring
Guideline for Water Recovery and Reuse | 3
To help assure safe and effective approaches to optimizing uses of water to meet regulatory requirements and international standards, the water quality recommen-dations included in this guideline for the higher-level end uses are primarily based on the 2011 World Health Organization (WHO) Guidelines for Drinking-Water Quality 4th edition (GDWQ). These recommended values do not supersede national requirements; however, many national water quality requirements are based upon the WHO GDWQ. The additional recommendations therein for aesthetic water aspects, barring national requirements that would supersede these guidelines, are also useful as a basis for the water quality recommendations.
Lower-level uses, such as floor washing and landscape irrigation, have recommended specifications in the guideline that are based on fit-for-purpose, employee safety, and aesthetic considerations. Appropriate monitoring of system performance and processed water quality is essential to achieving consistent fail-safe performance.
The goal of this focus area for the ILSI Center for Risk Science Innovation and Application (RSIA) is to provide authoritative guidance that should bolster the confi-dence of both producers and regulatory decision makers that water recovered in the facility and properly managed would be consistent with regulatory requirements, and will not result in product containing adulterants or contaminants that would reduce the consumer’s perception of quality and consistency, or that would cause occupational or consumer health risks.
Further guideline details are available at: www.ilsi.org/ResearchFoundation/RSIA/Pages/GuidelinesforWaterUse.aspx.
About RSIA and the ILSI Research Foundation
The ILSI Research Foundation was formed in 1984 to create a philanthropic vehi-cle for ILSI to support original research. Its Board of Trustees—from public and private entities around the world—guide the Foundation in its mission to deliver ground-breaking science that is useful now and into the future.
The ILSI Research Foundation Center for Risk Science Innovation and Application uses international, stakeholder-balanced expert groups to develop and apply decision approaches, focusing resources where they matter most for public health.

Water Recovery and Reuse Guideline
A program to recover water for use within a beverage production facility consists of the following systematic series of steps that should be followed to assure the
following:
■ The source water is appropriate and treatable to achieve the requirements of the end use.
■ The selected process train is appropriate for the water being recovered. ■ The recovered water will be of the quality and quantity to assure suitability
for the end use. ■ It is suitable for the performance of the product and process utilizing the
recovered water. ■ It will not affect the safety or aesthetics of the product. ■ It will be compatible with the wellbeing of the workers in the facility. ■ It will not be a basis for consumer concerns. ■ Finally, water reuse is determined to be a reasonable and cost-effective
approach for achieving the goals of the beverage producer.Recovered water that would be directly added to product and sanitary wastewater recovery are outside the scope of this guideline. However, these could be topics for subsequent guidelines.
Suggested 11-Step Procedure for Evaluating and Implementing a Water Recovery and Reuse Process
1. Conduct a water survey to determine the overall water quantity and quality needs of the facility.
Evaluate the total amounts and composition of water that are needed to meet pro-duction goals and the internal uses. Determine quantity and quality required for each of the unit process applications in the facility, and the current usages and future requirements.
2. Determine the available quantity and composition of the available internal and external sources of water. (Detailed in Chapter 3)
The total amount of water available to a facility for productive use will consist of the incoming source water, and water that has been used in the process and is potentially available to be recovered for additional beneficial use. It is important to quantify these water volumes as well as the product water and the discharged wastewater. If the facility has a supervisory control and data acquisition (SCADA) system, consumption
4
Guideline for Water Recovery and Reuse | 5
numbers can be determined from these data. Otherwise, metering may need to be added to obtain the required data. The individual water contributions need to be evaluated to determine their composition in terms of substances of health and aesthetic concerns. Chemical components of the recovered water should be meas-ured periodically to assure that the source composition is as expected and within design limits. Microbial pathogens need not be identified specifically, but indicator organisms can readily be measured (see Guideline Water Quality recommendations in Chapters 2 and 6).
3. Determine the water-related costs associated with the current operation.
Total costs of water include the purchase of externally supplied water, process chem-icals, treatment, and storage costs, as well as monitoring and disposal and any other direct costs associated with the water contribution to the production process.
4. Develop a Hazard Analysis Critical Control Point (HACCP) plan that will be the template for the design and implementation of the water recovery program and its day-to-day operation. (Detailed in Chapter 4)
The HACCP concept provides a structured approach to assessing and managing risks of food and water production facilities. The WHO has adopted the HACCP concept and applied it to drinking water as Water Safety Plans (WSP). Codex Alimentarius describes a seven-point process, the principles of which are as follows: (1) conduct a hazard analysis, (2) determine the critical control points (CCP), (3) establish the critical limits for the CCP, (4) establish a system to monitor control of the CCP, (5) establish the corrective action to be taken when monitoring indicates that a particular CCP is not under control, (6) establish procedures for verification to confirm that the HACCP system is working effectively, and (7) establish documentation concerning all procedures and records appropriate to these principles and their application.
5. Determine the local, national, international, and company water quality specifi-cations for the projected end uses that will be the minimum performance goals for the recovered water, and that will be incorporated in the HACCP plan. (Detailed in Chapter 2)
This guideline provides information on the 2011 WHO Guidelines for Drinking-Water Quality 4th edition (GDWQ) that provide minimum health and aesthetic requirements for water that is used within the facility that has the potential for indirect or minimal contact with product. Quality goals for lower end use applications are also recommended. Producers are always subject to national laws and regulations and company goals that could supersede these recommendations.6. Develop a suitable monitoring plan to assure process control and concordance with the HACCP plan. (Detailed in Chapter 6)
Monitoring will consist both of some frequent on-site and real-time analyses to the extent possible for operational performance monitoring, as well as periodic more comprehensive analyses. Parameters to be monitored include health-based inorganic
6 |
and organic chemicals, indicator microbes, and physical measurements. Determine the access to the in-plant operational monitoring techniques, equipment and train-ing needs, as well as access to qualified external laboratory support when required.
7. Based upon the quantities and compositions of the source waters and the water quality goals, propose a number of candidate treatment trains that would have the capability of meeting those regulatory or desired requirements. (Detailed in Chapter 5)
There is substantial information in the open literature that describes conventional filtration and disinfection technologies, ion exchange, membrane technologies, and advanced oxidation technologies that may be appropriate for particular source waters to be recovered, and end use quality requirements. It will often be necessary to uti-lize experienced expert consultants and engineers to assure the most efficient and successful process for evaluation, design, and introduction of the recovery process.
8. Based on the published literature and the experience of the technologists (including both public water system and bottling facility experience), reduce the options for treatment combinations to perhaps one or two with the best combination of feasibility and performance under the conditions of the facility. (Detailed in Chapter 5)
Factors include costs, equipment availability, system reliability, training and capabili-ties of operators and management, and access to support services that might be needed.
9. Conduct pilot studies on-site to evaluate the selected options and collect all necessary monitoring and cost data to support a judgment that will determine the final treatment train.
There is a large body of literature and significant operating experience available. It is always judicious to utilize well-designed pilot studies to accumulate the data needed to obtain full understanding of the specific elements of a particular application, and to utilize that valuable information in final design and operational decisions. This includes intensive monitoring of water quality parameters. Pilot studies also provide training opportunities for operators to assure smoother introduction of the final system.10. Construct the full-scale facility and conduct start-up studies to assure the operation and performance of the facility.
This is standard practice for installation of any new system. This, along with piloting, is the opportunity to train operating personnel so that they will be fully capable of achieving optimum and continuous performance of the constructed system. When the system is stabilized and performing as required, it can be placed in full operating mode.
11. Go on stream after appropriate regulatory approvals have been obtained, and utilize the HACCP plan as the operating oversight system.
Guideline for Water Recovery and Reuse | 7
Because these applications involve a food product, regulatory approvals are essential and specific to each country. Regulatory requirements need to be understood at the beginning of the development process and regulators should be consulted at that early stage to be assured that all requirements will be understood and that regulatory buy-in can be expected at the start up.
Water Quality Requirements
The baseline minimum water quality goal for recovered water that will have the poten-tial for indirect or minimal product contact is that it must meet the drinking water quality specifications that are contained in the fourth edition of the WHO GDWQ (WHO, 2011). In locations that have applicable national drinking water standards or any local requirements, or if a company has more stringent internal water quality of monitoring requirements those would supersede the WHO guidelines.
Chemical Quality for Minimal or Indirect Product Contact
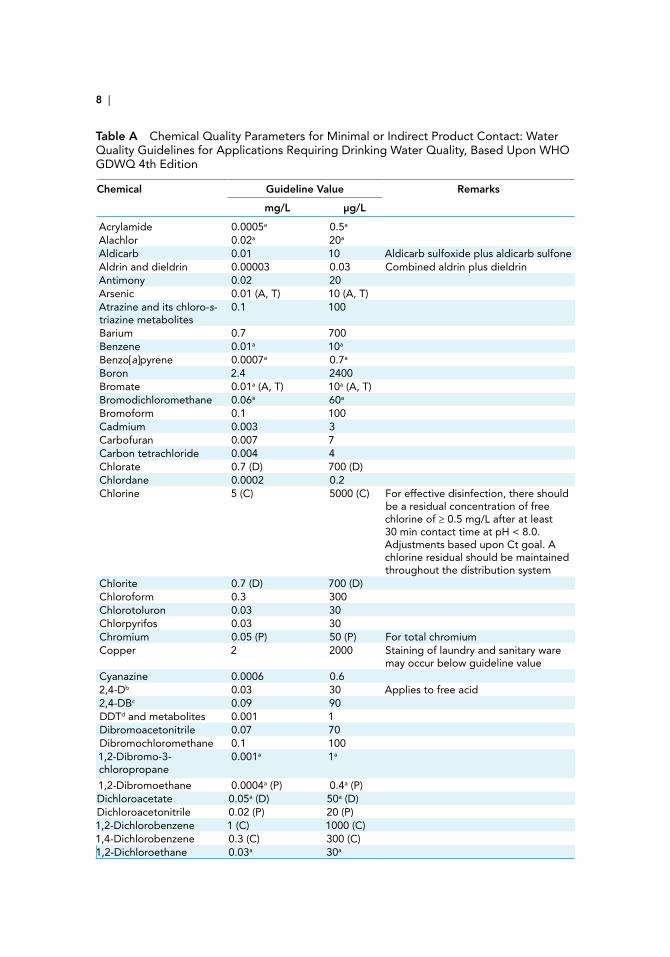
If there are no applicable national standards, the plant should, at a minimum, assure that those GDWQ health-based parameters are met (Table A). These are health-based guidelines that were developed for drinking water applications and they assume consumption of 2 L per day. Although the water should meet these comprehensive requirements, judicious decisions can be made with regard to the monitoring and likelihood of the presence of certain contaminants, for example, if a pesticide is not utilized in the region where the beverage producer is located and has no potential to be present. The measurement frequency for comprehensive analyses of health-related chemical parameters should generally be annually, but this should be determined by the potential variability of the contaminants in influent water and based on the reliability and effectiveness of the treatment processes being employed. Treatment chemicals utilized in the process should meet ANSI/NSF or equivalent standards for products used in drinking water treatment.
Product-specific stability and aesthetic water quality parameters are also important to be included. The WHO GDWQ also provide information on aesthetic and other non-health–related water quality factors. Examples include non-health parameters such as turbidity, total organic carbon, total dissolved solids (TDS), hardness, and pH, which also should be considered depending on the end uses. Because these could affect product quality, company product-specific water quality parameters should also be followed.
Recovered water that has indirect and minimal contact or potential for contact with the final product (e.g., water used to rinse containers or equipment that has direct contact with the final product) should meet the recommended high end use guidelines. In addition, there are other parameters that are critical for operation of particular treatment technologies (e.g., silica and chlorine residual for membrane processes). Recommendations for these parameters are available from the technology manu-facturers. Additional quality specifications may be determined for contaminants
8 |
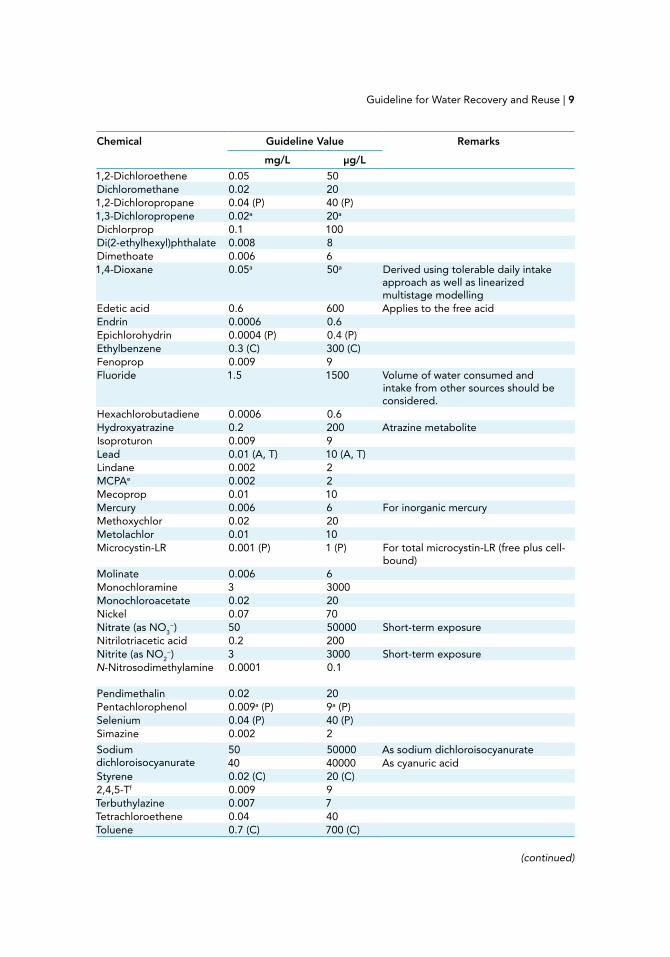
Table A Chemical Quality Parameters for Minimal or Indirect Product Contact: Water Quality Guidelines for Applications Requiring Drinking Water Quality, Based Upon WHO GDWQ 4th Edition
Chemical Guideline Value Remarks
mg/L µg/L
Acrylamide 0.0005a 0.5a
Alachlor 0.02a 20a
Aldicarb 0.01 10 Aldicarb sulfoxide plus aldicarb sulfoneAldrin and dieldrin 0.00003 0.03 Combined aldrin plus dieldrinAntimony 0.02 20Arsenic 0.01 (A, T) 10 (A, T)Atrazine and its chloro-s-triazine metabolites
0.1 100
Barium 0.7 700Benzene 0.01a 10a
Benzo[a]pyrene 0.0007a 0.7a
Boron 2.4 2400Bromate 0.01a (A, T) 10a (A, T)Bromodichloromethane 0.06a 60a
Bromoform 0.1 100Cadmium 0.003 3Carbofuran 0.007 7Carbon tetrachloride 0.004 4Chlorate 0.7 (D) 700 (D)Chlordane 0.0002 0.2Chlorine 5 (C) 5000 (C) For effective disinfection, there should
be a residual concentration of free chlorine of ≥ 0.5 mg/L after at least 30 min contact time at pH < 8.0. Adjustments based upon Ct goal. A chlorine residual should be maintained throughout the distribution system
Chlorite 0.7 (D) 700 (D)Chloroform 0.3 300Chlorotoluron 0.03 30Chlorpyrifos 0.03 30Chromium 0.05 (P) 50 (P) For total chromiumCopper 2 2000 Staining of laundry and sanitary ware
may occur below guideline valueCyanazine 0.0006 0.62,4-Db 0.03 30 Applies to free acid2,4-DBc 0.09 90DDTd and metabolites 0.001 1Dibromoacetonitrile 0.07 70Dibromochloromethane 0.1 1001,2-Dibromo-3-chloropropane
0.001a 1a
1,2-Dibromoethane 0.0004a (P) 0.4a (P)Dichloroacetate 0.05a (D) 50a (D)Dichloroacetonitrile 0.02 (P) 20 (P)1,2-Dichlorobenzene 1 (C) 1000 (C)1,4-Dichlorobenzene 0.3 (C) 300 (C)1,2-Dichloroethane 0.03a 30a
Guideline for Water Recovery and Reuse | 9
Chemical Guideline Value Remarks
mg/L µg/L
1,2-Dichloroethene 0.05 50Dichloromethane 0.02 201,2-Dichloropropane 0.04 (P) 40 (P)1,3-Dichloropropene 0.02a 20a
Dichlorprop 0.1 100Di(2-ethylhexyl)phthalate 0.008 8Dimethoate 0.006 61,4-Dioxane 0.05a 50a Derived using tolerable daily intake
approach as well as linearized multistage modelling
Edetic acid 0.6 600 Applies to the free acidEndrin 0.0006 0.6Epichlorohydrin 0.0004 (P) 0.4 (P)Ethylbenzene 0.3 (C) 300 (C)Fenoprop 0.009 9Fluoride 1.5 1500 Volume of water consumed and
intake from other sources should be considered.
Hexachlorobutadiene 0.0006 0.6Hydroxyatrazine 0.2 200 Atrazine metaboliteIsoproturon 0.009 9Lead 0.01 (A, T) 10 (A, T)Lindane 0.002 2MCPAe 0.002 2Mecoprop 0.01 10Mercury 0.006 6 For inorganic mercuryMethoxychlor 0.02 20Metolachlor 0.01 10Microcystin-LR 0.001 (P) 1 (P) For total microcystin-LR (free plus cell-
bound)Molinate 0.006 6Monochloramine 3 3000Monochloroacetate 0.02 20Nickel 0.07 70Nitrate (as NO3
−) 50 50000 Short-term exposureNitrilotriacetic acid 0.2 200Nitrite (as NO2
−) 3 3000 Short-term exposureN-Nitrosodimethylamine 0.0001 0.1
Pendimethalin 0.02 20Pentachlorophenol 0.009a (P) 9a (P)Selenium 0.04 (P) 40 (P)Simazine 0.002 2
Sodium dichloroisocyanurate
50 50000 As sodium dichloroisocyanurate40 40000 As cyanuric acid
Styrene 0.02 (C) 20 (C)2,4,5-Tf 0.009 9Terbuthylazine 0.007 7Tetrachloroethene 0.04 40Toluene 0.7 (C) 700 (C)
(continued)

10 |
Chemical Guideline Value Remarks
mg/L µg/L
Trichloroacetate 0.2 200Trichloroethene 0.02 (P) 20 (P)2,4,6-Trichlorophenol 0.2a (C) 200a (C)Trifluralin 0.02 20Trihalomethanes Chloroform, bromoform,
bromodichloromethane,and dibromochloromethane. The sum of the ratio of the concentration of each to its respective guideline value should not exceed 1
Uranium 0.30 (P) 30 (P) Only chemical aspects of uranium addressed
Vinyl chloride 0.0003a 0.3a
Xylenes 0.5 (C) 500 (C)
A, provisional guideline value because calculated guideline value is below the achievable quantification level; C, concentrations of the substance at or below the health-based guideline value may affect the appearance, taste or odor of the water, leading to consumer complaints; D, provisional guideline value because disinfection is likely to result in the guideline value being exceeded; P, provisional guideline value because of uncertainties in the health database; T, provisional guideline value because calculated guideline value is below the level that can be achieved through practical treatment methods, source protection, etc. aFor substances that are considered to be carcinogenic, the guideline value is the concentration in drinking water associated with an upper-bound excess lifetime cancer risk of 10−5 (one additional case of cancer per 100,000 population ingesting drinking-water at the guideline value for 70 years). b2,4-Dichlorophenoxyacetic acid. c2,4-Dichlorophenoxybutyric acid.dDichlorodiphenyltrichloroethane.e4-(2-Methyl-4-chlorophenoxy)acetic acid.f2,4,5-Trichlorophenoxyacetic acid.
that are specific to a particular water source or process. They can be derived with the assistance of national regulators or by consultation with qualified toxicologists or microbiologists who are familiar with beverage and food process environments.
Standard food codes typically specify use of drinking water quality for food contact uses, including indirect contact, but allow the use of non-drinking water quality for non-contact uses such as firefighting, refrigeration, steam production, and other “non-culinary” purposes (Codex Alimentarius, 2003; US DHHS, 2009; FSANZ, n.d.). The codes and related standards often include requirements relating to the separation of non-drinking water supplies from drinking water supplies through distinct and labeled water systems. However, the codes do not specify water quality requirements for non-culinary water. Although the codes might be silent on quality requirements, it is expected that water quality and the risks of product contamination would be assessed and included in HACCP plans.
Microbial Quality for Minimal or Indirect Product Contact
The WHO GDWQ rely upon the HACCP/WSP to determine the appropriate tech-nology and operations to assure microbial safety of finished water. Escherichia coli
Table A (Continued)
Guideline for Water Recovery and Reuse | 11
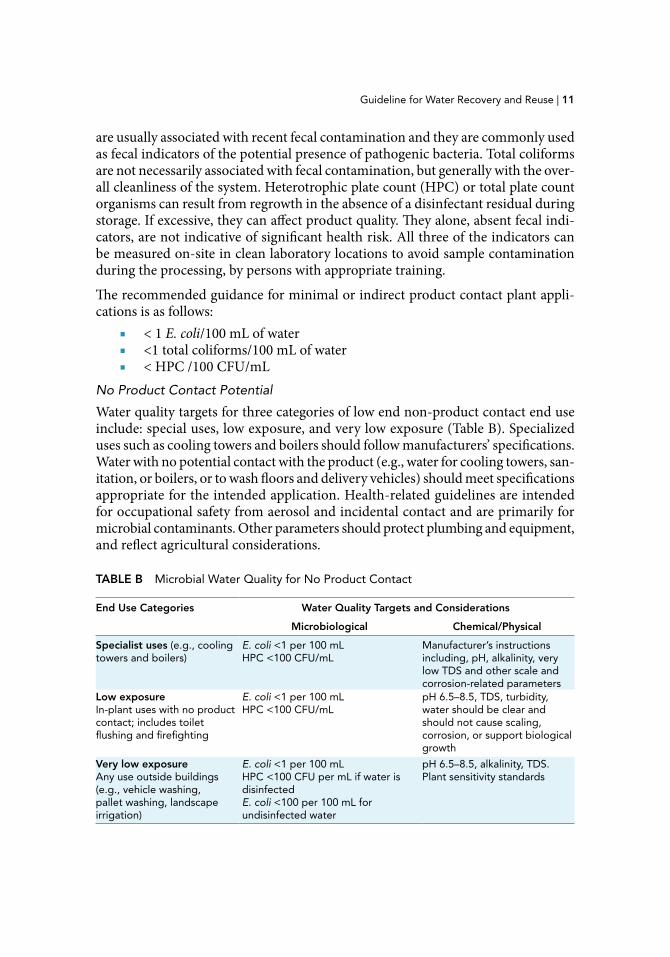
are usually associated with recent fecal contamination and they are commonly used as fecal indicators of the potential presence of pathogenic bacteria. Total coliforms are not necessarily associated with fecal contamination, but generally with the over-all cleanliness of the system. Heterotrophic plate count (HPC) or total plate count organisms can result from regrowth in the absence of a disinfectant residual during storage. If excessive, they can affect product quality. They alone, absent fecal indi-cators, are not indicative of significant health risk. All three of the indicators can be measured on-site in clean laboratory locations to avoid sample contamination during the processing, by persons with appropriate training.
The recommended guidance for minimal or indirect product contact plant appli-cations is as follows:
■ < 1 E. coli/100 mL of water ■ <1 total coliforms/100 mL of water ■ < HPC /100 CFU/mL
No Product Contact Potential
Water quality targets for three categories of low end non-product contact end use include: special uses, low exposure, and very low exposure (Table B). Specialized uses such as cooling towers and boilers should follow manufacturers’ specifications. Water with no potential contact with the product (e.g., water for cooling towers, san-itation, or boilers, or to wash floors and delivery vehicles) should meet specifications appropriate for the intended application. Health-related guidelines are intended for occupational safety from aerosol and incidental contact and are primarily for microbial contaminants. Other parameters should protect plumbing and equipment, and reflect agricultural considerations.
TABLE B Microbial Water Quality for No Product Contact
End Use Categories Water Quality Targets and Considerations
Microbiological Chemical/Physical
Specialist uses (e.g., cooling towers and boilers)
E. coli <1 per 100 mL HPC <100 CFU/mL
Manufacturer’s instructions including, pH, alkalinity, very low TDS and other scale and corrosion-related parameters
Low exposure In-plant uses with no product contact; includes toilet flushing and firefighting
E. coli <1 per 100 mL HPC <100 CFU/mL
pH 6.5–8.5, TDS, turbidity, water should be clear and should not cause scaling, corrosion, or support biological growth
Very low exposureAny use outside buildings (e.g., vehicle washing, pallet washing, landscape irrigation)
E. coli <1 per 100 mL HPC <100 CFU per mL if water is disinfectedE. coli <100 per 100 mL for undisinfected water
pH 6.5–8.5, alkalinity, TDS. Plant sensitivity standards

Water Recovery and Reuse Guideline Background Information
Water is a precious renewable resource. Although the world‘s water quantity is virtually constant, its availability varies by locality, region, and time. Rainfall
is the original fresh water recycle source, but water is often accessed from lakes and rivers and from underground sources. Water can be treated to any required quality by modern technology, including desalination of seawater or brackish water, treat-ment of surface waters and groundwaters, or use of higher technology wastewater purification reclamation processes. Recovered water is a suitable source for many applications and its quality must be tailored to the requirements of the end use. This guideline provides a basis for beverage producers to understand the water quality and economic goals related to water recovery, as well as to assess the practical options, and to select the best course of action for the local circumstances.
1.1 Added Value
Conservation of water through safe, verifiable recovery processes helps preserve this resource while providing consumers with high-quality beverages. Some producers have already made great strides to reduce their water footprints, partly through water recovery. Several reports indicate that water recovery coupled with more efficient water use can often achieve about 25 to 40% reductions of water used per liter of beverage. For example, in Case Study 9 (Appendix A), the Yatala Brewery in Western Australia achieved water savings of 60 million L per year with a 10% reduction in wastewater treatment. Treated wastewater from the plant is used to irrigate an adjacent golf course. Eight other illustrative case studies can be found in Appendix A. Such results encourage water recovery as an option in efforts to efficiently utilize available water resources.
1.2 Water Use in the Beverage Industry
Beverage production requires water as a resource both for product use and for facility maintenance. Beverages, including soft drinks, sodas, beer, juices, milk, and still or carbonated waters, are produced in thousands of locations throughout the world. These beverages are predominantly water based. Water is also needed for processing and sanitation in bottling facilities.
Beverage facilities draw from public supplies of sometimes-varying quality, as well as rivers and lakes, groundwaters, or rain catchment systems. Although many locations may have plentiful supplies relative to demand, and many sources may be replenished
13
Introduction1
14 |
rapidly by rainfall or upland run-off, some groundwaters may be stressed because they are not replenished rapidly and are being depleted by human activities. Some surface waters may be in limited amount seasonally and during times of drought. Additional stresses on water resources come from urbanization and population growth, impacting both the quantity and quality of water in many regions of the world.
The quality of ambient waters is variable by location. Surface waters are subject to contamination by sanitary or industrial waste discharges, urban and rural run-off, fertilizers and pesticides, and organic carbon from natural processes. Some ground-waters are subject to contamination from surface activity, but many groundwaters are protected by overlays that limit transport of surface microbial and chemical con-taminants. However, even protected groundwaters will collect potentially undesirable minerals (e.g., hardness) from the geology. Bottled natural mineral waters receive minimal or no treatment; therefore, they must be safe in their natural state (Codex Alimentarius, 2011). In addition, rooftop and cistern rainwater collection systems require appropriate materials, design, and management to assure water quality.
Beverage producers in each region of the world must cope with the local source water conditions and political and economic environments, which place constraints on water availability. Producers may have a limited set of options, including decreasing withdrawal, increasing costs, and/or water recovery for limited uses. Water treat-ment technology can purify any source water at a cost, but competition, quantity, accessibility, and public perceptions can be more challenging barriers to manage. Water is usually a low cost commodity compared to its intrinsic value. However, the cost of water is increasing, partly due to reduced local availability or to the need for more intensive treatment to be safe for human consumption and suitable for commercial uses.
Some national and/or local jurisdictions have been placing restrictions on the amount of water that is available for use by beverage producers, especially in cases where supplies are limited, the public water service is deficient, or there is potential for environmental harm such as by subsidence due to excessive groundwater withdraw-als. Packaging water-based products is sometimes perceived as taking a local asset of limited availability and not returning it to the local environment. In some areas, politically and emotionally driven pressures result in restrictions on the quantity available for product, compensatory requirements, and increased operating costs, as well as outcries for taking the public’s water. This occurs even though the products provide employment opportunities, and often the bottled products are the safest water available and provide a public health benefit.
For all of these reasons, beverage producers must be sensitive to their particular circumstances and many need to find ways to minimize the total volume of water that they use and utilize the most effective methods to improve a facility’s Water Use Ratio (WUR). The combined consumption of water during production and facility operations is the basis to conceptualize the WUR (SABMiller, 2010). Improving the

Guideline for Water Recovery and Reuse | 15
WUR allows greater production of product as well as possible economic advantages, and likely better relations with local citizens and governments.
1.3 Guideline Purpose and Scope
This guideline will assist the reader to realize water conservation goals through multiple-pass water use for the particular end use application, while ensuring that their commercial products maintain their high quality and remain safe for consump-tion. In addition, the guideline should bolster the decision makers’ and regulators’ confidence that water recovery and reuse will not result in product with adulterants or contaminants that would reduce consumers’ perceptions of quality, or that could cause a health risk.
In this guideline, water recovered, purified, and reused in beverage production is divided into two basic categories based on product contact:
■ Water that has indirect and minimal contact or contact potential for contact with the final product (e.g., water used to rinse containers or equipment that has direct contact with the final product), and
■ Water with no contact or potential for contact with the final product (e.g., water used in irrigation, cooling towers, or boilers or to wash floors and delivery vehicles).
Water is the major contributor of fluid volume to the beverage, but there are also fla-vorings and other components that can introduce contaminants to the final product. The categories of contaminants that can cause water quality or safety concerns include microbials and inorganic and organic chemicals, including industrial chemicals, pesticides, and pharmaceuticals. Aesthetics and product quality can also be affected by parameters such as pH, hardness, total dissolved solids, undesirable color, tastes, and odors. Each of these contaminants is specifically addressed in several sections of Chapter 2.
This guideline utilizes existing information provided in the international 2011 WHO GDWQ, as the basis for the health-based parameters (WHO, 2011). US EPA has updated its water reuse guidelines (US EPA, 2012a), providing an up-to-date com-pilation of concepts, case studies and information on water recovery processes for many analogous applications including beverage production. Box 1.1 summarizes WHO and other guidelines/standards dealing with food or drinking water quality.
End use parameters not involving potential for product exposure can be of lesser sensitivity and are dependent upon the specific application. However, most other quality specifications would not be part of a performance goal for reuse of recovered water. Other applications (e.g., landscape irrigation, sanitation) may have an entirely different set of associated concerns.
This guideline is not intended for product or product component applications, and sources of water that were considered do not include sanitary or industrial wastewater. Figure 1.1 includes water recovery, treatment, and applications for reuse.
16 |
1.4 Challenges Addressed by This Guideline
Beverage production processes cov-ered by this guideline include the production of sodas, soft drinks, beer, juices, milk, and still or carbonated packaged waters. The technologies highlighted here are used in many current beverage operations and drinking water or water purification and reclamation processes, and would be applicable to beverage facilities, either directly or with modifications. Examples of describing monitoring, and documenting the performance of several treatment processes—including coagulation and filtration, adsorption, disinfection, de-colora-tion, microfiltration, ultrafiltration
and reverse osmosis membranes, oxidation, and pH, hardness, or dissolved solids adjustment—are provided.
Many beverage facilities may want to reduce waste and maximize efficiency without jeopardizing quality. However, three circumstances may prevent the realization of these goals: lack of international guidance, lack of technical resources, and lack of a step-by-step guide to conceptualize water quality requirements with the correct treatment processes.
Given the need for producers to secure cost-effective, predictable, and sustainable water supplies, it is essential to establish procedures to efficiently use available waters to cost-effectively maximize product output. Conservation can achieve significant reductions in water consumption. Significant additional reductions can be realized through the recovery of water at a facility. Reuse of water multiple times can be an effective and efficient approach and leaves only a small portion to be disposed of or discharged into the environment.
The immediate opportunities for reuse are with applications that do not require potable water for safe use because there is no contact with product (e.g., facility main-tenance, sanitation, hygiene, some cooling processes, or grounds irrigation). Other applications such as cleaning reusable bottles and cleaning in place (CIP) require high-quality water because some residue might be retained in the product container.
The guideline describes the decision processes to use water more efficiently by dis-cussing general concepts, detailed information, and recommendations that assure safe and effective approaches that meet regulatory requirements and international standards. Examples of successful water recovery efforts are illustrated by case studies.
BOX 1.1 Existing Regulations and Guidelines for Product Waters
Codex Alimentarius (2003), the United States Food Code (USDHHS, 2009), the European Council Drinking Water Directive (98/83/EC), and the Australia New Zealand Food Standards Code (FSANZ, n.d.) refer to the use of drinking water and non-drink-ing water in food production. The codes typically specify that water used in direct contact with foods should comply with drinking water quality requirements as defined in corresponding guidelines and standards such as the WHO GDWQ, the USEPA National Primary Drinking Water Regulations (2006), and the Australian Drinking Water Guidelines (2011).
Guideline for Water Recovery and Reuse | 17
Citations to on-line and published resources, case studies, and technical documents are provided.
The user will be able to conduct a water audit, identify points where efficiencies can be increased, select appropriate technologies, conduct a hazard analysis of critical control points (CCP), and develop their Hazard Analysis Critical Control Points (HACCP) or Water Safety Plan (WSP).
1.5 Guideline Implementation and System Management
The most effective approach to operating a beverage production facility is to follow a HACCP or WSP-type system tailored to that facility. Basic HACCP/WSP principles include: hazard analysis, determination of the CCP, establishing critical limits for the CCPs, monitor control of the CCPs, corrective actions when needed, verification procedures, and documentation for all procedures. A comprehensive HACCP/WSP operating plan covers the production chain from source to product. It is fundamental to implementation of these guidelines to assure proper quality control management of the entire facility.
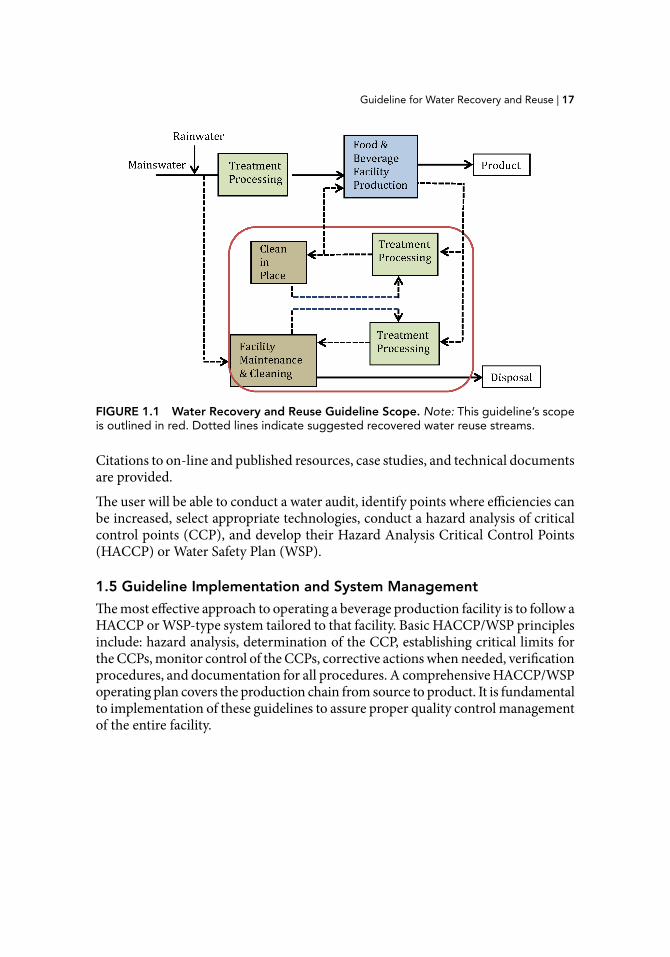
FIGURE 1.1 Water Recovery and Reuse Guideline Scope. Note: This guideline’s scope is outlined in red. Dotted lines indicate suggested recovered water reuse streams.

Water quality guidelines and goals should be driven by the intended end use of the processed water, the potential for consumer and occupational risks, and
potential product effects. This section describes water quality and water recovery opportunities for a range of use types.
2.1 Water Quality for Intended Use
Water recovered in food and beverage premises is divided into two types based on product contact potential: indirect or minimal potential for product contact, and water with no product contact potential. The baseline minimum water quality goals for water that must meet drinking water quality specifications are contained in the WHO GDWQ (WHO, 2011). Maintenance of more than one water supply distribu-tion system within a plant presents a challenge that needs to be addressed over the long term. The risk of cross-connection or inappropriate connection to one of the available water supplies is ever present and its effective management requires great diligence and ongoing training.
Most codes do not specify water quality requirements for non-culinary water. Those water quality goals and risks should also be included in HACCP/WSP plans.
2.2 Water Quality for Contact Uses
This guideline does not cover water recovery for direct product content uses. Specifications for potable direct reuse applications are being actively discussed. The baseline minimum water quality goals are in the WHO GDWQ (WHO, 2011), but additional requirements would be necessary. Additional multi-barrier technologies and quality specifications should be specific to a particular water type or process.
2.3 Water Quality for Non-Contact Uses
Water quality recommendations for reprocessed water being used for non in-plant uses such as vehicle washing or cooling are intended to protect workers and persons in the vicinity from exposure to pathogens and corrosive water with concerns for dermal contact and inhalation of aerosols. Existing guidelines or standards often assume that sanitary wastewater is the source water so they may be especially conservative for better quality sources, such as process-cleaning water rather than sanitary wastewater.
For example, the State of California in the United States has comprehensive standards in its Title 22 regulations (California Department of Health, 2009) for recycled water
18
Rationales for Water Recovery and Reuse 2

Guideline for Water Recovery and Reuse | 19
for food and non-food plant and landscape irrigation, orchards, cooling, toilet flush-ing, fire fighting, laundry, boiler feed, dust control and numerous other applications. Title 22 regulations at 2.2 MPN of total coliforms per 100 mL and 2 nephelometric turbidity units (NTU) would cover most of the listed applications. Those criteria are readily achievable and would be conservative for the non in-plant applications in this guideline, since sanitary wastewater is not a source water. The following sections describe microbial targets and chemical and physical water quality issues for non-contact uses.
2.3.1 Microbial Quality
Water quality specifications are a fundamental requirement for designing and verify-ing the effectiveness of HACCP and WSP. As described in the WHO GDWQ (WHO, 2011), these can take two basic forms:
1. Performance targets describing the removal of specific types of pathogens (i.e., enteric bacteria, viruses, and protozoa). Performance targets require data on pathogen concentrations in source water quality and an assess-ment of water quality requirements associated with end uses.
2. Specified technology targets based on qualitative assessments of source water and end use requirements to identify appropriate treatment processes.
Targets provide certainty in designing systems that produce fit-for-purpose recycled water. The absence of targets can result in high levels of treatment that may not be necessary to assure safe use and significantly increase the cost and complexity of recycling schemes. In many cases, treatment trains used to provide recovered water in beverage plants can meet drinking water specifications. A conservative approach is essential where product safety and public perception is paramount; however, water for cooling towers, boilers, and for washing floors, flushing toilets, and washing vehicles does not require drinking water quality.
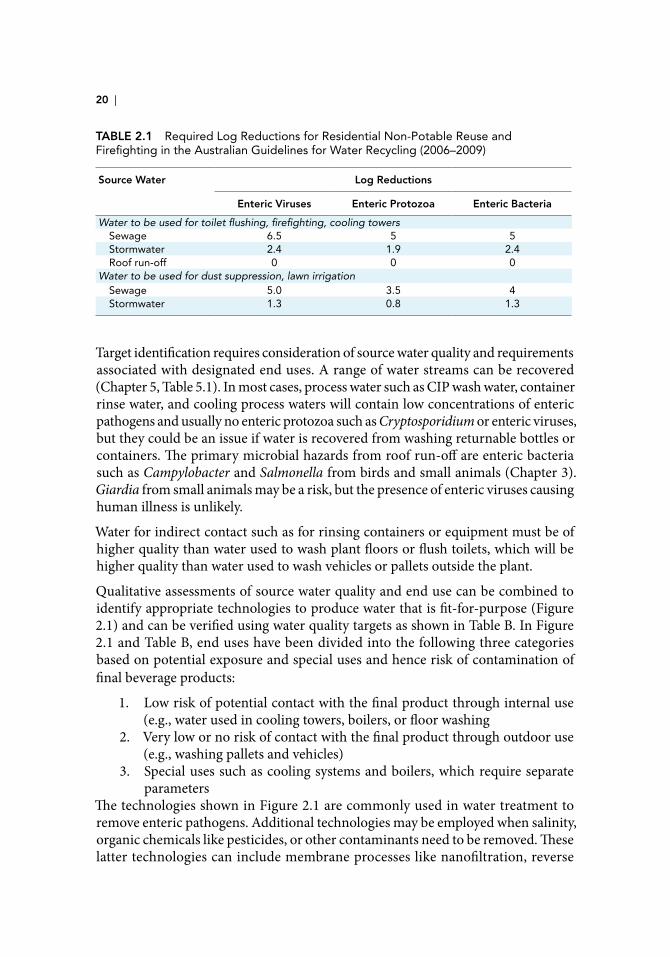
Provision of water quality that is fit-for-purpose is an established principle embed-ded in guidelines for water reuse, such as those from the WHO (2005), the U.S. Environmental Protection Agency (US EPA, 2012a), and the Australian Government (EPHC, NRMMC, NHMRC, 2006–2009). They demonstrate how to produce fit-for-purpose water starting with sources such as sewage, greywater, stormwater, and rainwater. The principal health-related concerns in beverage applications of recov-ered water are associated with microbial pathogens, including bacteria, viruses, and protozoa. They identify treatment processes and water quality targets for a variety of end uses that are relevant for beverage plants, including toilet flushing, firefighting, dust suppression, and in cooling towers. Table 2.1 illustrates log reduc-tion treatment performance influenced by source water quality and end use (EPHC, NRMMC, NHMRC, 2006–2009). Conventional drinking water treatment processes utilize coagulation, sedimentation, filtration, and disinfection steps and they achieve excellent reductions of microbial pathogens and particulates (turbidity). Membranes like microfiltration (MF) and ultrafiltration (UF) are being increasingly used as alternatives to conventional treatment.
20 |
Target identification requires consideration of source water quality and requirements associated with designated end uses. A range of water streams can be recovered (Chapter 5, Table 5.1). In most cases, process water such as CIP wash water, container rinse water, and cooling process waters will contain low concentrations of enteric pathogens and usually no enteric protozoa such as Cryptosporidium or enteric viruses, but they could be an issue if water is recovered from washing returnable bottles or containers. The primary microbial hazards from roof run-off are enteric bacteria such as Campylobacter and Salmonella from birds and small animals (Chapter 3). Giardia from small animals may be a risk, but the presence of enteric viruses causing human illness is unlikely.
Water for indirect contact such as for rinsing containers or equipment must be of higher quality than water used to wash plant floors or flush toilets, which will be higher quality than water used to wash vehicles or pallets outside the plant.
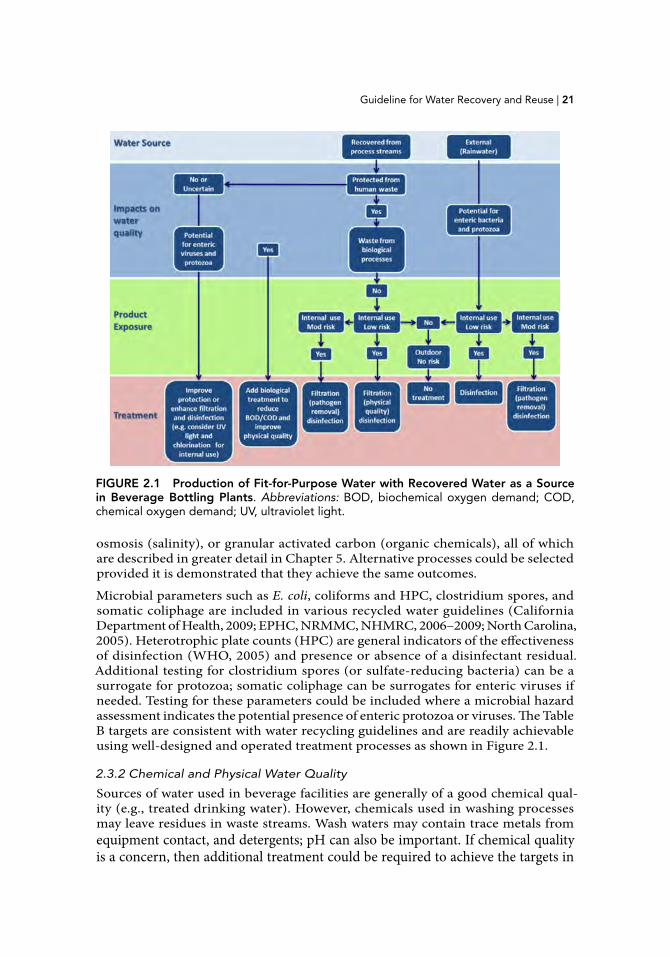
Qualitative assessments of source water quality and end use can be combined to identify appropriate technologies to produce water that is fit-for-purpose (Figure 2.1) and can be verified using water quality targets as shown in Table B. In Figure 2.1 and Table B, end uses have been divided into the following three categories based on potential exposure and special uses and hence risk of contamination of final beverage products:
1. Low risk of potential contact with the final product through internal use (e.g., water used in cooling towers, boilers, or floor washing
2. Very low or no risk of contact with the final product through outdoor use (e.g., washing pallets and vehicles)
3. Special uses such as cooling systems and boilers, which require separate parameters
The technologies shown in Figure 2.1 are commonly used in water treatment to remove enteric pathogens. Additional technologies may be employed when salinity, organic chemicals like pesticides, or other contaminants need to be removed. These latter technologies can include membrane processes like nanofiltration, reverse
TABLE 2.1 Required Log Reductions for Residential Non-Potable Reuse and Firefighting in the Australian Guidelines for Water Recycling (2006–2009)
Source Water Log Reductions
Enteric Viruses Enteric Protozoa Enteric Bacteria
Water to be used for toilet flushing, firefighting, cooling towers Sewage 6.5 5 5 Stormwater 2.4 1.9 2.4 Roof run-off 0 0 0Water to be used for dust suppression, lawn irrigation Sewage 5.0 3.5 4 Stormwater 1.3 0.8 1.3
Guideline for Water Recovery and Reuse | 21
osmosis (salinity), or granular activated carbon (organic chemicals), all of which are described in greater detail in Chapter 5. Alternative processes could be selected provided it is demonstrated that they achieve the same outcomes.
Microbial parameters such as E. coli, coliforms and HPC, clostridium spores, and somatic coliphage are included in various recycled water guidelines (California Department of Health, 2009; EPHC, NRMMC, NHMRC, 2006–2009; North Carolina, 2005). Heterotrophic plate counts (HPC) are general indicators of the effectiveness of disinfection (WHO, 2005) and presence or absence of a disinfectant residual. Additional testing for clostridium spores (or sulfate-reducing bacteria) can be a surrogate for protozoa; somatic coliphage can be surrogates for enteric viruses if needed. Testing for these parameters could be included where a microbial hazard assessment indicates the potential presence of enteric protozoa or viruses. The Table B targets are consistent with water recycling guidelines and are readily achievable using well-designed and operated treatment processes as shown in Figure 2.1.
2.3.2 Chemical and Physical Water Quality
Sources of water used in beverage facilities are generally of a good chemical qual-ity (e.g., treated drinking water). However, chemicals used in washing processes may leave residues in waste streams. Wash waters may contain trace metals from equipment contact, and detergents; pH can also be important. If chemical quality is a concern, then additional treatment could be required to achieve the targets in
FIGURE 2.1 Production of Fit-for-Purpose Water with Recovered Water as a Source in Beverage Bottling Plants. Abbreviations: BOD, biochemical oxygen demand; COD, chemical oxygen demand; UV, ultraviolet light.
22 |
Tables A and B. Turbidity, total organic carbon (TOC), total dissolved solids (TDS), hardness, and pH should be determined by the end uses.
2.4 Occupational Health and Safety
In addition to beverage safety, protecting the health of workers is essential. Providing employees with appropriate training on basic hygiene and on limitations associated with the use of non-product contact water is essential, and should include practices to avoid dermal and aerosol exposure to those lower quality waters. The training should also include communicating the need to minimize unintended uses of water provided for non-product contact uses.
Water generated in beverage production and roof run-off can be reused to reduce total water usage and improve sustainability. Water recovery coupled with more
efficient use of water has achieved significant reductions of WUR (BIER, 2012). This can include increasing the number of cycles water is used within a single process (e.g., cooling) without extensive additional treatment or collection from several processes suitable treatment for use.
Initially a facility must survey the water availability considering daily and seasonal variations, assess current water use (both quality and quantity), and determine potential sources of recoverable water. The survey should include: water inventory, stream mapping, and a production facility survey to locate opportunities to conserve, recover, and reuse water. (Note that survey examples are from audits from different beverage facilities.)
3.1 Water Survey
The numerous water streams within a facility account for most of the total water available. Water leaving the plant (primarily in product or wastewater) equals the water entering, with some lost to evaporation. Seasonal variations in quantity and quality should be considered.
The water survey should be completed for the most recent 12 months, with a probe of current events and snapshot measurements of batch or non-continuous processes. The facility’s supervisory control and data acquisition (SCADA) system may con-tain ongoing or monthly consumption numbers for metered flows. The recorded flows over time will provide an average and range of variation in quantity; quality data should also be generated. Snapshot measurements for specific events should be reviewed with short intervals (10 seconds to 1 minute) to provide sufficiently detailed information.
For non-metered water flows or those with insufficient detail, a meter with recording capabilities (e.g., ultrasonic meter) must be installed on appropriate pipes for each stream to be measured. The data collection time for those meters depends upon the consistency of the flow and whether a batch or continuous operation. A few hours should be sufficient for a continuous operation. Two to three recorded CIP events will capture the flow changes for a batch process like CIP. If different CIP objects and events are involved, sufficient instantaneous measurements should be taken to record all of the CIP procedures.
23
Current and Developing Sources of Recovered Water3
24 |
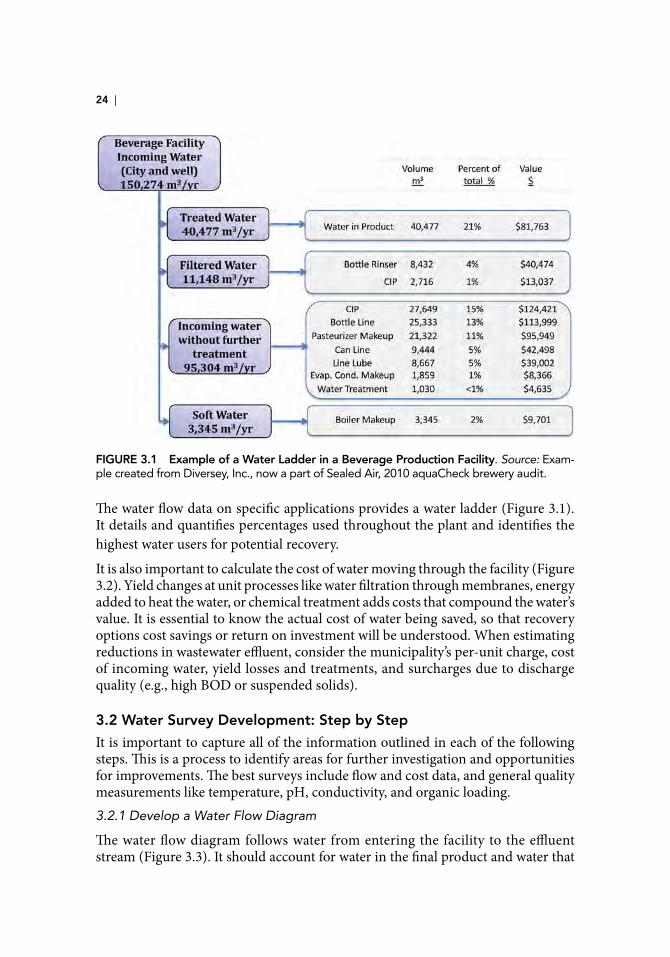
The water flow data on specific applications provides a water ladder (Figure 3.1). It details and quantifies percentages used throughout the plant and identifies the highest water users for potential recovery.
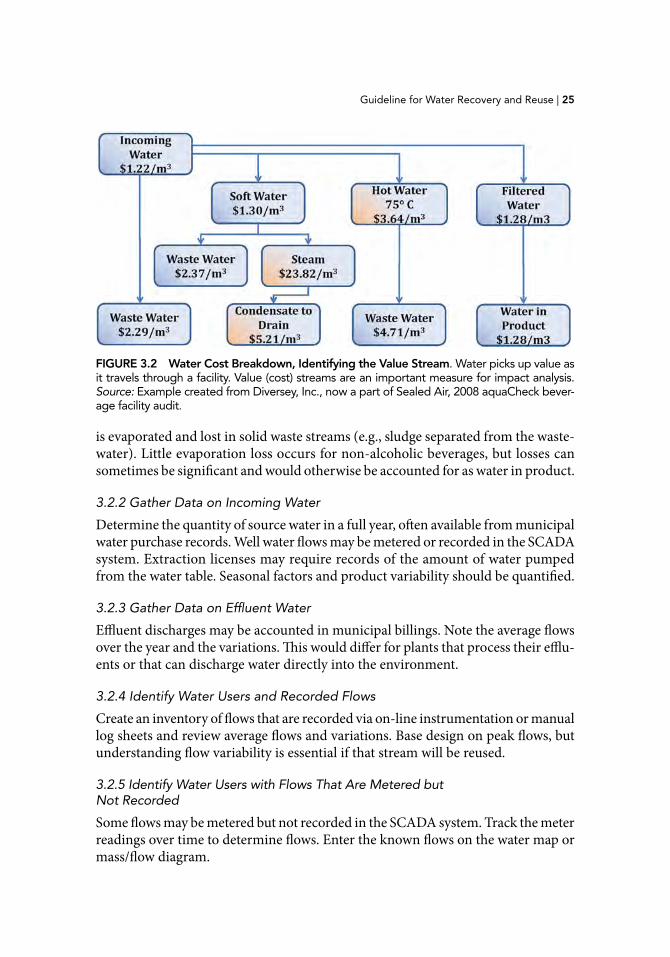
It is also important to calculate the cost of water moving through the facility (Figure 3.2). Yield changes at unit processes like water filtration through membranes, energy added to heat the water, or chemical treatment adds costs that compound the water’s value. It is essential to know the actual cost of water being saved, so that recovery options cost savings or return on investment will be understood. When estimating reductions in wastewater effluent, consider the municipality’s per-unit charge, cost of incoming water, yield losses and treatments, and surcharges due to discharge quality (e.g., high BOD or suspended solids).
3.2 Water Survey Development: Step by Step
It is important to capture all of the information outlined in each of the following steps. This is a process to identify areas for further investigation and opportunities for improvements. The best surveys include flow and cost data, and general quality measurements like temperature, pH, conductivity, and organic loading.3.2.1 Develop a Water Flow Diagram
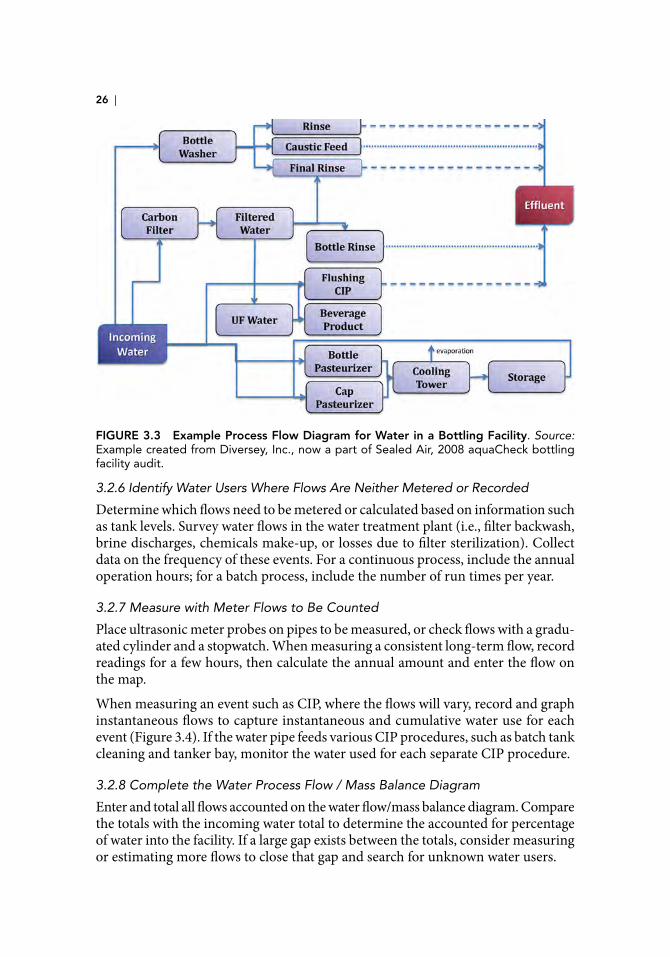
The water flow diagram follows water from entering the facility to the effluent stream (Figure 3.3). It should account for water in the final product and water that
FIGURE 3.1 Example of a Water Ladder in a Beverage Production Facility. Source: Exam-ple created from Diversey, Inc., now a part of Sealed Air, 2010 aquaCheck brewery audit.
Guideline for Water Recovery and Reuse | 25
is evaporated and lost in solid waste streams (e.g., sludge separated from the waste-water). Little evaporation loss occurs for non-alcoholic beverages, but losses can sometimes be significant and would otherwise be accounted for as water in product.
3.2.2 Gather Data on Incoming Water
Determine the quantity of source water in a full year, often available from municipal water purchase records. Well water flows may be metered or recorded in the SCADA system. Extraction licenses may require records of the amount of water pumped from the water table. Seasonal factors and product variability should be quantified.
3.2.3 Gather Data on Effluent Water
Effluent discharges may be accounted in municipal billings. Note the average flows over the year and the variations. This would differ for plants that process their efflu-ents or that can discharge water directly into the environment.
3.2.4 Identify Water Users and Recorded Flows
Create an inventory of flows that are recorded via on-line instrumentation or manual log sheets and review average flows and variations. Base design on peak flows, but understanding flow variability is essential if that stream will be reused.
3.2.5 Identify Water Users with Flows That Are Metered but Not Recorded
Some flows may be metered but not recorded in the SCADA system. Track the meter readings over time to determine flows. Enter the known flows on the water map or mass/flow diagram.
FIGURE 3.2 Water Cost Breakdown, Identifying the Value Stream. Water picks up value as it travels through a facility. Value (cost) streams are an important measure for impact analysis. Source: Example created from Diversey, Inc., now a part of Sealed Air, 2008 aquaCheck bever-age facility audit.
26 |
3.2.6 Identify Water Users Where Flows Are Neither Metered or Recorded
Determine which flows need to be metered or calculated based on information such as tank levels. Survey water flows in the water treatment plant (i.e., filter backwash, brine discharges, chemicals make-up, or losses due to filter sterilization). Collect data on the frequency of these events. For a continuous process, include the annual operation hours; for a batch process, include the number of run times per year.
3.2.7 Measure with Meter Flows to Be Counted
Place ultrasonic meter probes on pipes to be measured, or check flows with a gradu-ated cylinder and a stopwatch. When measuring a consistent long-term flow, record readings for a few hours, then calculate the annual amount and enter the flow on the map.
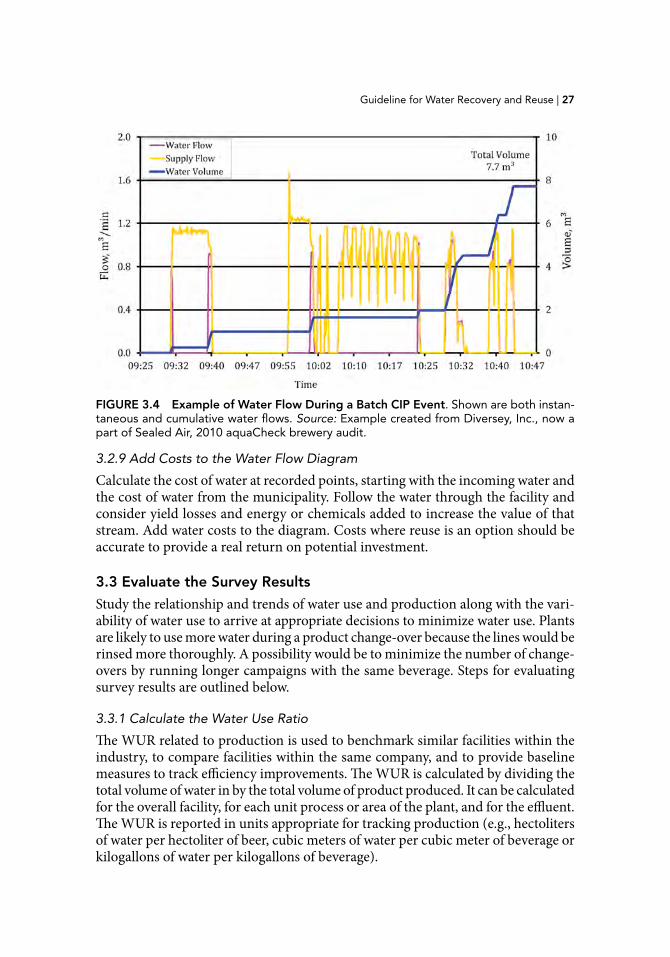
When measuring an event such as CIP, where the flows will vary, record and graph instantaneous flows to capture instantaneous and cumulative water use for each event (Figure 3.4). If the water pipe feeds various CIP procedures, such as batch tank cleaning and tanker bay, monitor the water used for each separate CIP procedure.
3.2.8 Complete the Water Process Flow / Mass Balance Diagram
Enter and total all flows accounted on the water flow/mass balance diagram. Compare the totals with the incoming water total to determine the accounted for percentage of water into the facility. If a large gap exists between the totals, consider measuring or estimating more flows to close that gap and search for unknown water users.
FIGURE 3.3 Example Process Flow Diagram for Water in a Bottling Facility. Source: Example created from Diversey, Inc., now a part of Sealed Air, 2008 aquaCheck bottling facility audit.
Guideline for Water Recovery and Reuse | 27
3.2.9 Add Costs to the Water Flow Diagram
Calculate the cost of water at recorded points, starting with the incoming water and the cost of water from the municipality. Follow the water through the facility and consider yield losses and energy or chemicals added to increase the value of that stream. Add water costs to the diagram. Costs where reuse is an option should be accurate to provide a real return on potential investment.
3.3 Evaluate the Survey Results
Study the relationship and trends of water use and production along with the vari-ability of water use to arrive at appropriate decisions to minimize water use. Plants are likely to use more water during a product change-over because the lines would be rinsed more thoroughly. A possibility would be to minimize the number of change-overs by running longer campaigns with the same beverage. Steps for evaluating survey results are outlined below.
3.3.1 Calculate the Water Use Ratio
The WUR related to production is used to benchmark similar facilities within the industry, to compare facilities within the same company, and to provide baseline measures to track efficiency improvements. The WUR is calculated by dividing the total volume of water in by the total volume of product produced. It can be calculated for the overall facility, for each unit process or area of the plant, and for the effluent. The WUR is reported in units appropriate for tracking production (e.g., hectoliters of water per hectoliter of beer, cubic meters of water per cubic meter of beverage or kilogallons of water per kilogallons of beverage).
FIGURE 3.4 Example of Water Flow During a Batch CIP Event. Shown are both instan-taneous and cumulative water flows. Source: Example created from Diversey, Inc., now a part of Sealed Air, 2010 aquaCheck brewery audit.
28 |
3.3.2 Rank Water Users in the Facility by Volume and Cost
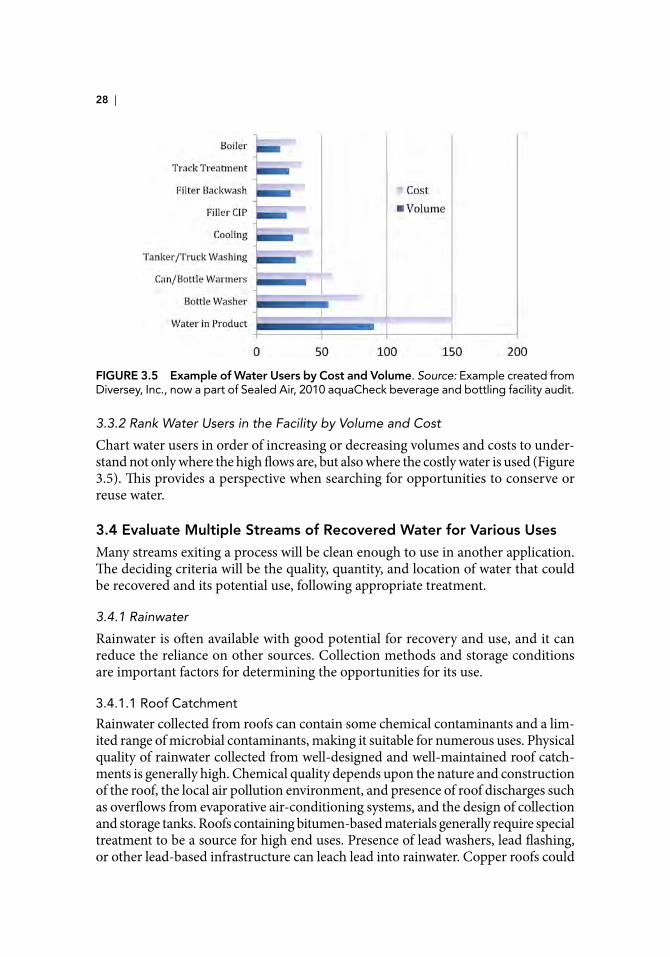
Chart water users in order of increasing or decreasing volumes and costs to under-stand not only where the high flows are, but also where the costly water is used (Figure 3.5). This provides a perspective when searching for opportunities to conserve or reuse water.
3.4 Evaluate Multiple Streams of Recovered Water for Various Uses
Many streams exiting a process will be clean enough to use in another application. The deciding criteria will be the quality, quantity, and location of water that could be recovered and its potential use, following appropriate treatment.
3.4.1 Rainwater
Rainwater is often available with good potential for recovery and use, and it can reduce the reliance on other sources. Collection methods and storage conditions are important factors for determining the opportunities for its use.
3.4.1.1 Roof Catchment
Rainwater collected from roofs can contain some chemical contaminants and a lim-ited range of microbial contaminants, making it suitable for numerous uses. Physical quality of rainwater collected from well-designed and well-maintained roof catch-ments is generally high. Chemical quality depends upon the nature and construction of the roof, the local air pollution environment, and presence of roof discharges such as overflows from evaporative air-conditioning systems, and the design of collection and storage tanks. Roofs containing bitumen-based materials generally require special treatment to be a source for high end uses. Presence of lead washers, lead flashing, or other lead-based infrastructure can leach lead into rainwater. Copper roofs could
FIGURE 3.5 Example of Water Users by Cost and Volume. Source: Example created from Diversey, Inc., now a part of Sealed Air, 2010 aquaCheck beverage and bottling facility audit.
Guideline for Water Recovery and Reuse | 29
increase copper concentrations. Proximity of significant emitting industries such as smelters could also result in chemical contamination (enHealth, 2011). Above ground storage tanks present lower risks than below ground tanks because they are not at risk from chemical spills into the surrounding soils. Either type of storage can be suitable, provided that they are well constructed and protected from spills and ingress of contamination through faults in tank construction (below ground).
The chemical quality of rainwater may meet drinking water requirements, but it should be monitored frequently, especially for microbial contamination, to assure its continued quality. TDS are low compared to the incoming city water. Treated rainwater used alone or mixed with other types of process water can be used for increased cycles through cooling towers or boilers.
After first flush, microbial quality is generally reasonable, with greatest risks from bacterial pathogens (e.g., Campylobacter and Salmonella). Other zoonotic pathogens such as Giardia lamblia and avian viruses can be deposited in fecal material from birds and other small animals (Schets et al., 2010; enHealth, 2011) but risk potential is generally low. Microbial contamination can be reduced, although not eliminated, by good design. This includes insect, vermin, and bird proofing inlets to rainwater collection and storage tanks and ensuring that tanks have fully enclosed roofs to prevent entry of dust and birds and other small animals. Below ground storage facil-ities need to be protected from ingress of microbial contamination at access points and from faults in tank construction.
Untreated rainwater is used in numerous countries as a drinking water source. Microbiological quality is unlikely to be consistent and it is unlikely to be suita-ble for food production without disinfection. Untreated rainwater is suitable for non-drinking domestic purposes and should be acceptable for non-product contact uses in beverage plants.
3.4.1.2 Hard Non-Roof Surfaces
Rainwater collected from hard surfaces such as parking and traffic areas is subjected to a wider range of contaminants, including oils, greases, and other discharges from vehicles, and is more susceptible to chemical spills. This will require higher levels of treatment and more monitoring if it is to be used within beverage facilities.
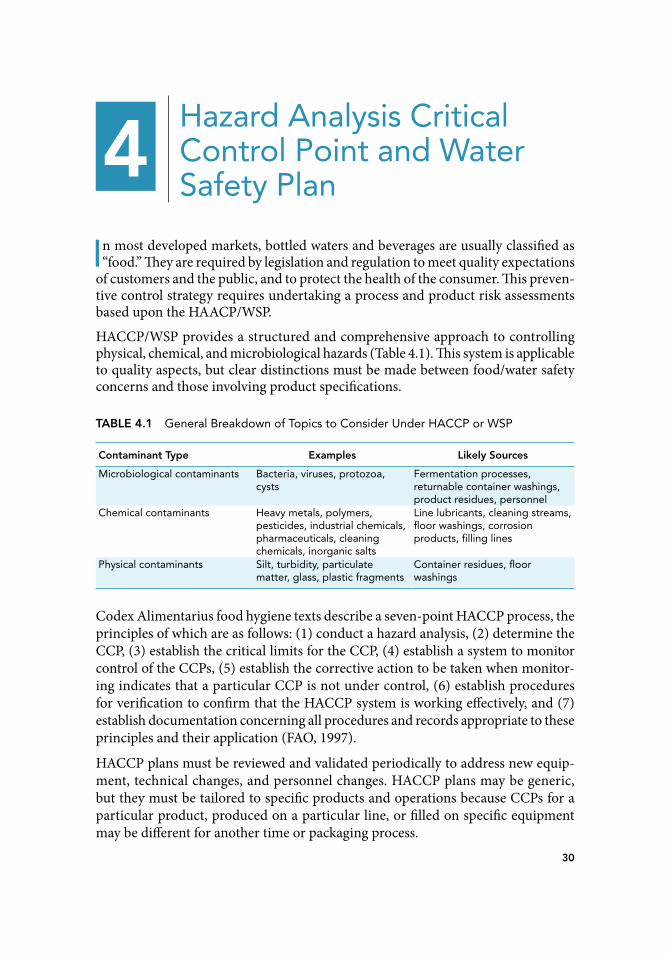
In most developed markets, bottled waters and beverages are usually classified as “food.” They are required by legislation and regulation to meet quality expectations
of customers and the public, and to protect the health of the consumer. This preven-tive control strategy requires undertaking a process and product risk assessments based upon the HAACP/WSP.
HACCP/WSP provides a structured and comprehensive approach to controlling physical, chemical, and microbiological hazards (Table 4.1). This system is applicable to quality aspects, but clear distinctions must be made between food/water safety concerns and those involving product specifications.
30
Hazard Analysis Critical Control Point and Water Safety Plan
4
TABLE 4.1 General Breakdown of Topics to Consider Under HACCP or WSP
Contaminant Type Examples Likely Sources
Microbiological contaminants Bacteria, viruses, protozoa, cysts
Fermentation processes, returnable container washings, product residues, personnel
Chemical contaminants Heavy metals, polymers, pesticides, industrial chemicals, pharmaceuticals, cleaning chemicals, inorganic salts
Line lubricants, cleaning streams, floor washings, corrosion products, filling lines
Physical contaminants Silt, turbidity, particulate matter, glass, plastic fragments
Container residues, floor washings
Codex Alimentarius food hygiene texts describe a seven-point HACCP process, the principles of which are as follows: (1) conduct a hazard analysis, (2) determine the CCP, (3) establish the critical limits for the CCP, (4) establish a system to monitor control of the CCPs, (5) establish the corrective action to be taken when monitor-ing indicates that a particular CCP is not under control, (6) establish procedures for verification to confirm that the HACCP system is working effectively, and (7) establish documentation concerning all procedures and records appropriate to these principles and their application (FAO, 1997).
HACCP plans must be reviewed and validated periodically to address new equip-ment, technical changes, and personnel changes. HACCP plans may be generic, but they must be tailored to specific products and operations because CCPs for a particular product, produced on a particular line, or filled on specific equipment may be different for another time or packaging process.
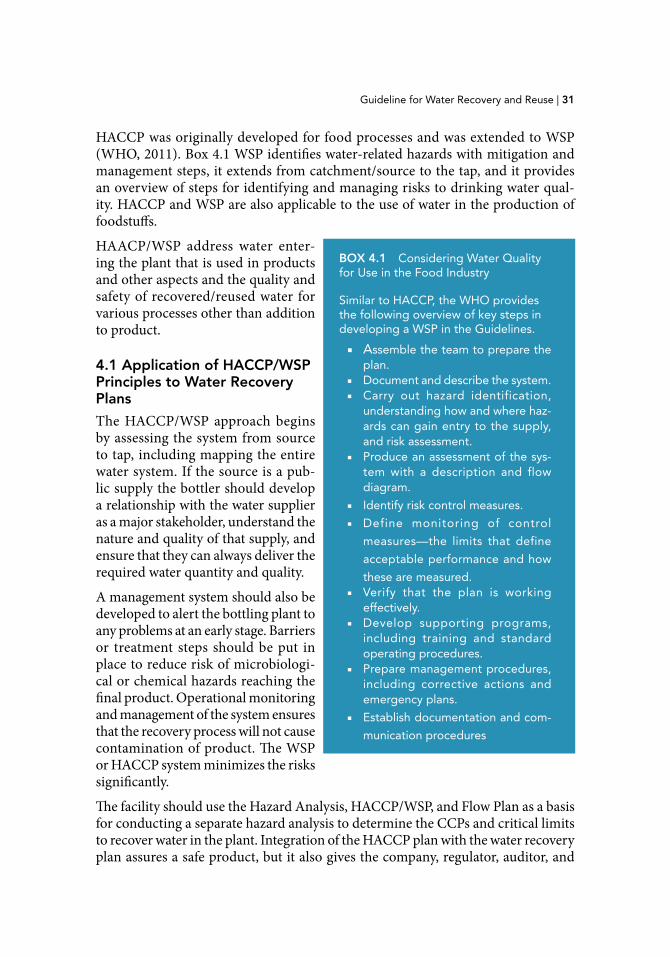
Guideline for Water Recovery and Reuse | 31
HACCP was originally developed for food processes and was extended to WSP (WHO, 2011). Box 4.1 WSP identifies water-related hazards with mitigation and management steps, it extends from catchment/source to the tap, and it provides an overview of steps for identifying and managing risks to drinking water qual-ity. HACCP and WSP are also applicable to the use of water in the production of foodstuffs.
HAACP/WSP address water enter-ing the plant that is used in products and other aspects and the quality and safety of recovered/reused water for various processes other than addition to product.
4.1 Application of HACCP/WSP Principles to Water Recovery Plans
The HACCP/WSP approach begins by assessing the system from source to tap, including mapping the entire water system. If the source is a pub-lic supply the bottler should develop a relationship with the water supplier as a major stakeholder, understand the nature and quality of that supply, and ensure that they can always deliver the required water quantity and quality.
A management system should also be developed to alert the bottling plant to any problems at an early stage. Barriers or treatment steps should be put in place to reduce risk of microbiologi-cal or chemical hazards reaching the final product. Operational monitoring and management of the system ensures that the recovery process will not cause contamination of product. The WSP or HACCP system minimizes the risks significantly.
The facility should use the Hazard Analysis, HACCP/WSP, and Flow Plan as a basis for conducting a separate hazard analysis to determine the CCPs and critical limits to recover water in the plant. Integration of the HACCP plan with the water recovery plan assures a safe product, but it also gives the company, regulator, auditor, and
BOX 4.1 Considering Water Quality for Use in the Food Industry
Similar to HACCP, the WHO provides the following overview of key steps in developing a WSP in the Guidelines.
■ Assemble the team to prepare the plan.
■ Document and describe the system. ■ Carry out hazard identification,
understanding how and where haz-ards can gain entry to the supply, and risk assessment.
■ Produce an assessment of the sys-tem with a description and flow diagram.
■ Identify risk control measures.
■ Define monitoring of control
measures—the limits that define
acceptable performance and how
these are measured. ■ Verify that the plan is working
effectively. ■ Develop supporting programs,
including training and standard operating procedures.
■ Prepare management procedures, including corrective actions and emergency plans.
■ Establish documentation and com-
munication procedures
32 |
customer confidence that the recovered water will not affect product safety and quality. The procedure is outlined below.
4.1.1 Assemble the Team
Management should assure that appropriate multidisciplinary expertise is available on the team developing the plan by including representatives from maintenance, quality assurance, engineering, and product production.
4.1.2 List Opportunities
Evaluate the initial baseline water audit and list potential water reuse opportunities.
4.1.3 Identify Potential Uses of Recovered Water
Describe the system. Create a separate flow diagram for water reuse opportunities and verify its accuracy by conducting a walk-through of the plant.
4.1.4 Identify Potential Hazards at Each Point of Water Recovery
The plan should include the likely hazards and the severity of adverse effects (Table 4.1 and control limits in Table 6.1). Background information is available in reference fact sheets within the WSPs of the WHO GDWQ (2011). Conduct a hazard analysis and determine measures to control identified hazards.
4.1.5 Establish Critical Control Points and Limits
Determine CCPs and monitoring to minimize risk of each identified potential signif-icant hazard. If no control measure exists for a hazard where control is necessary for safety, modify the process to include a control measure. Refer to the WHO GDWQ (WHO, 2011) for specific limits.
4.1.6 Establish a Monitoring System for Each Critical Control Point
The monitoring procedures must be able to detect loss of control at the CCP and provide information in time to make adjustments to ensure control. Monitoring can be as simple as a visual inspection or measuring specific control parameters like pH.
4.1.7 Establish Corrective Actions
Corrective actions must ensure that the CCP has been controlled and include proper disposition of the affected water. Deviation, corrective actions, and disposition of significant off-specification water must be documented in the HACCP/WSP record. Any risk of product contact with the affected water should result in disposition with documentation.
4.1.8 Establish Verification Procedures
All elements of the HACCP/WSP require verification of the controls and their effi-cacy. Review the water HACCP/WSP plan and records, and the deviations and water
Guideline for Water Recovery and Reuse | 33
and product dispositions. Confirm that the CCPs are controlled. Audit frequently enough to ensure that the HACCP plan is being followed continuously.
4.1.9 Establish Documentation and Record Keeping
Documentation and record keeping should include hazard analysis, CCP limit determinations, monitoring activities, deviations, and corrective actions, and mod-ifications to the plan.
Documentation is essential for reviewing the adequacy of any water reuse plan and adherence to regulatory and customer requirements. Documentation shows the process history, monitoring, deviations, and corrective actions (including disposi-tion of product) that occurred in conjunction with the design and implementation of a water reuse plan. The documentation may be in the form of a processing chart, written record, or computerized record. The producer must maintain complete, current, properly filed, and accurate records to ensure regulatory compliance and customer quality assurance, and to demonstrate due diligence in the event of law-suits or litigation. The frequency should be sufficient to provide an indication when situations are changing, with time to react.
There are five basic types of documentation that should be maintained as part of a water recovery or any quality assurance program:
1. Written copy of the plan,2. Support documentation for development of the plan,3. Records and data generated by the plan,4. Methods and procedures used in the plan, and5. Employee training records for implementation and maintenance of the
plan.
4.1.9.1 What to Document
HACPP/WSP plans and compliance or deviation from the plans must be documented. If a parameter is important enough to monitor, it should be documented. Regulatory and contractual agreements will often define required documentation, including flow volumes and concentrations of contaminants or components of concern.
Documentation is critical for the initial water survey and should include the quan-tity and quality of the water with enough data points over the course of time to see variation. One year of data with monthly totals for quantity of water and quantity of production are typically sufficient. Automated entry is the best method to document because it removes the human variable.
4.1.9.2 Why Documenting is Necessary
Documenting baselines and measuring progress allows improvements in key perfor-mance indicators to be demonstrated. Managers can share and reward this success, and use it to motivate co-workers to encourage greater achievements.
34 |
4.1.10 Training
The success of the HACCP/WSP program involves everyone in the facility. Management must be committed to providing sufficient resources and time to train supervisors, plant workers, and technical personnel about their roles. Training is also required when personnel or assignments change.
4.2 Auditing
Periodic auditing verifies that a plan is being followed or a system is functioning as desired and designed. Auditing should be thorough and well documented. The scope may vary and this section describes approaches that are appropriate in food and beverage processing applications.
4.2.1 Audit Criteria
Audit criteria and areas to be audited should be agreed upon in advance of the audit with the external auditor and the company being audited and captured in writing.
The more common components include the following:
■ The company’s own internal HACCP/WSP-based system ■ Safety requirements of the company’s main customer ■ Requirements of a foreign country to which products are to be exported ■ Requirements of international standards, such as WHO GDWQ, ISO 22000,
Food Safety Management Systems, Global Food Safety Initiative, and the new Public Accessible Specifications (PAS) 220 Food Safety (British Standards Institute) – Prerequisite Program and Operational Prerequisite Programs used in conjunction with ISO 22000
■ Membership requirements of a trade association ■ Legal requirements of the local enforcement authority ■ Requirements of a certification organization, such as NSF International,
British Standards Institute, and the Safe Quality Food Institute4.2.2 Water Recovery Audit Example
1. Review the hazard analysis that established the HACCP/WSP.2. Review the water reuse HACCP/WSP.3. Verify product process flow against the HAACP/WSP.4. Review the documented record for selected days of production, including
trends.5. Observe production to confirm HACCP/WSP conformance.6. Review training records for individuals tasked with monitoring,
corrective action, and other critical implementation functions.7. Review complaint and recall files.8. Review regulatory inspection findings and reports.
Numerous water treatment technologies are available for managing almost any water contamination. For high-end applications (i.e., drinking water quality),
multiple technologies are applied to provide multiple barriers of protection in the event of incomplete performance by any of the component processes.
5.1 Treatment Options
The multiple barrier treatment processes can achieve a specific water quality for a particular application. Appropriate multiple barriers can remove various types of contaminants with some redundancy to prevent breakthrough of unwanted contam-inants if one of the processes is not fully functioning. This section describes various treatment processes and their use to recover water.
5.1.1 Selecting Suitable Processes
Source water composition and the particular reuse application are the key determi-nants for selecting the suitable processes at each step. Figure 5.1 illustrates available technologies for a multi-barrier approach to high-end water reuse. There are several water reuse treatment technologies to choose from for a particular step, but the list is not exhaustive. Not all steps are necessarily required, and their order is dependent upon the application. Occasionally, advanced oxidation (hydrogen peroxide/UV, ozone/UV) may be appropriate to remove traces of certain organics of concern that may not be removed by other processes.
To determine which technologies are needed in a particular case, consider the following: ■ Nature and level of contaminant load ■ Required quality and efficiency desired for the targeted use ■ Treatment process characteristics ■ Storage of the treated water (depending on the treatment option) ■ Additional consequences of the reuse program ■ Economics including capital and operating costs
Figure 5.2 describes considerations for selecting water reuse operations and processes for treatment.
35
Treatment Technologies5
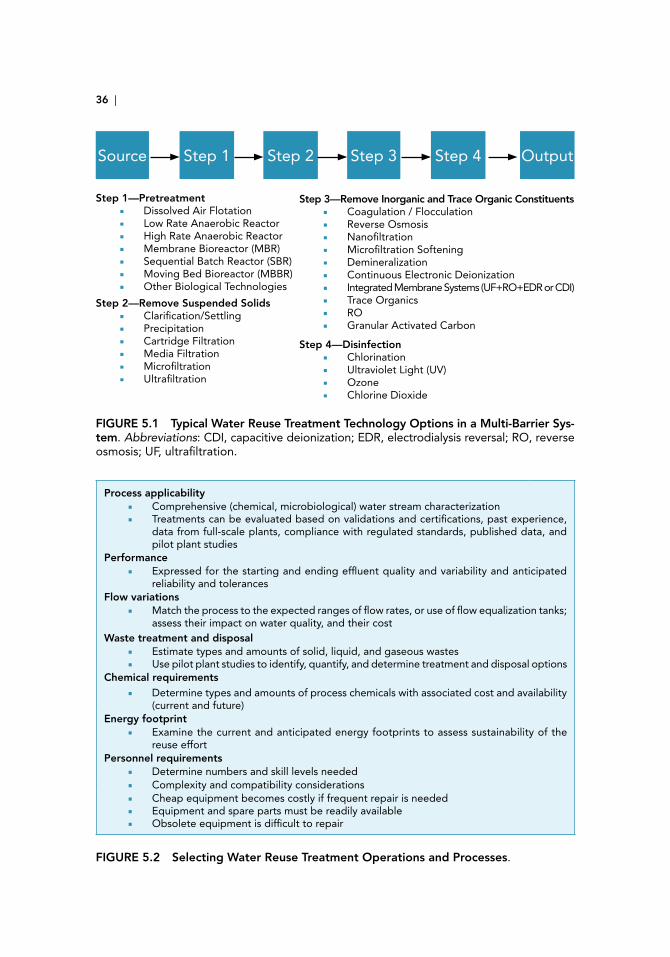
36 |
FIGURE 5.1 Typical Water Reuse Treatment Technology Options in a Multi-Barrier Sys-tem. Abbreviations: CDI, capacitive deionization; EDR, electrodialysis reversal; RO, reverse osmosis; UF, ultrafiltration.
Source Step 1 Step 2 Step 3 Step 4 Output
Step 1—Pretreatment ■ Dissolved Air Flotation ■ Low Rate Anaerobic Reactor ■ High Rate Anaerobic Reactor ■ Membrane Bioreactor (MBR) ■ Sequential Batch Reactor (SBR) ■ Moving Bed Bioreactor (MBBR) ■ Other Biological Technologies
Step 2—Remove Suspended Solids ■ Clarification/Settling ■ Precipitation ■ Cartridge Filtration ■ Media Filtration ■ Microfiltration ■ Ultrafiltration
Step 3—Remove Inorganic and Trace Organic Constituents ■ Coagulation / Flocculation ■ Reverse Osmosis ■ Nanofiltration ■ Microfiltration Softening ■ Demineralization ■ Continuous Electronic Deionization ■ Integrated Membrane Systems (UF+RO+EDR or CDI) ■ Trace Organics ■ RO ■ Granular Activated Carbon
Step 4—Disinfection ■ Chlorination ■ Ultraviolet Light (UV) ■ Ozone ■ Chlorine Dioxide
FIGURE 5.2 Selecting Water Reuse Treatment Operations and Processes.
Process applicability ■ Comprehensive (chemical, microbiological) water stream characterization ■ Treatments can be evaluated based on validations and certifications, past experience,
data from full-scale plants, compliance with regulated standards, published data, and pilot plant studies
Performance ■ Expressed for the starting and ending effluent quality and variability and anticipated
reliability and tolerances Flow variations
■ Match the process to the expected ranges of flow rates, or use of flow equalization tanks; assess their impact on water quality, and their cost
Waste treatment and disposal ■ Estimate types and amounts of solid, liquid, and gaseous wastes ■ Use pilot plant studies to identify, quantify, and determine treatment and disposal options
Chemical requirements ■ Determine types and amounts of process chemicals with associated cost and availability
(current and future)Energy footprint
■ Examine the current and anticipated energy footprints to assess sustainability of the reuse effort
Personnel requirements ■ Determine numbers and skill levels needed ■ Complexity and compatibility considerations ■ Cheap equipment becomes costly if frequent repair is needed ■ Equipment and spare parts must be readily available ■ Obsolete equipment is difficult to repair
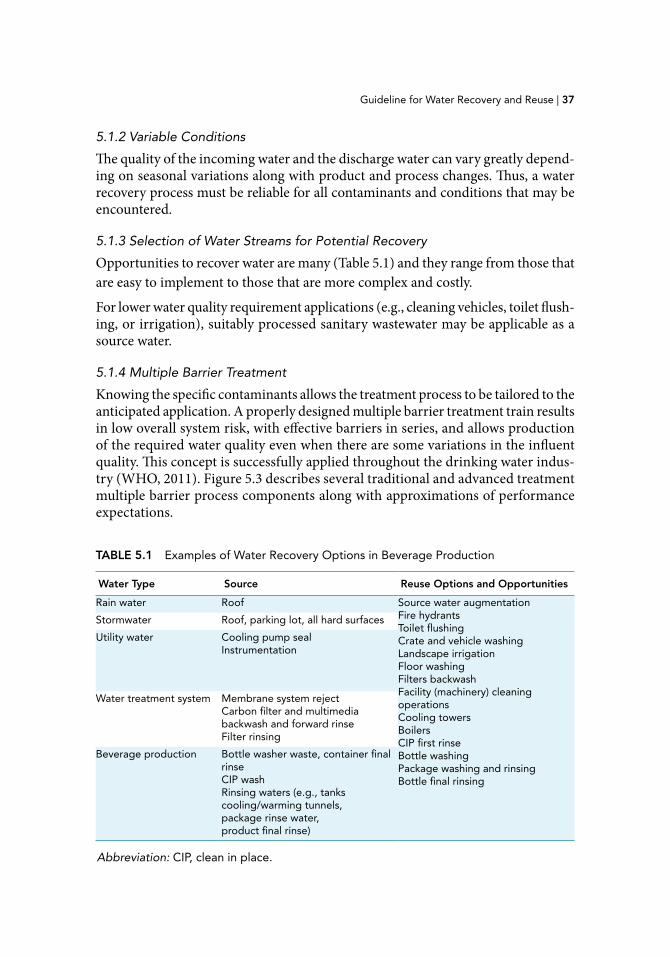
Guideline for Water Recovery and Reuse | 37
5.1.2 Variable Conditions
The quality of the incoming water and the discharge water can vary greatly depend-ing on seasonal variations along with product and process changes. Thus, a water recovery process must be reliable for all contaminants and conditions that may be encountered.
5.1.3 Selection of Water Streams for Potential Recovery
Opportunities to recover water are many (Table 5.1) and they range from those that are easy to implement to those that are more complex and costly.
For lower water quality requirement applications (e.g., cleaning vehicles, toilet flush-ing, or irrigation), suitably processed sanitary wastewater may be applicable as a source water.
5.1.4 Multiple Barrier Treatment
Knowing the specific contaminants allows the treatment process to be tailored to the anticipated application. A properly designed multiple barrier treatment train results in low overall system risk, with effective barriers in series, and allows production of the required water quality even when there are some variations in the influent quality. This concept is successfully applied throughout the drinking water indus-try (WHO, 2011). Figure 5.3 describes several traditional and advanced treatment multiple barrier process components along with approximations of performance expectations.
TABLE 5.1 Examples of Water Recovery Options in Beverage Production
Water Type Source Reuse Options and Opportunities
Rain water Roof Source water augmentationFire hydrants Toilet flushing Crate and vehicle washingLandscape irrigationFloor washingFilters backwashFacility (machinery) cleaning operationsCooling towersBoilersCIP first rinse Bottle washingPackage washing and rinsing Bottle final rinsing
Stormwater Roof, parking lot, all hard surfaces
Utility water Cooling pump seal Instrumentation
Water treatment system
Membrane system rejectCarbon filter and multimedia backwash and forward rinseFilter rinsing
Beverage production Bottle washer waste, container final rinseCIP wash Rinsing waters (e.g., tankscooling/warming tunnels,package rinse water,product final rinse)
Abbreviation: CIP, clean in place.
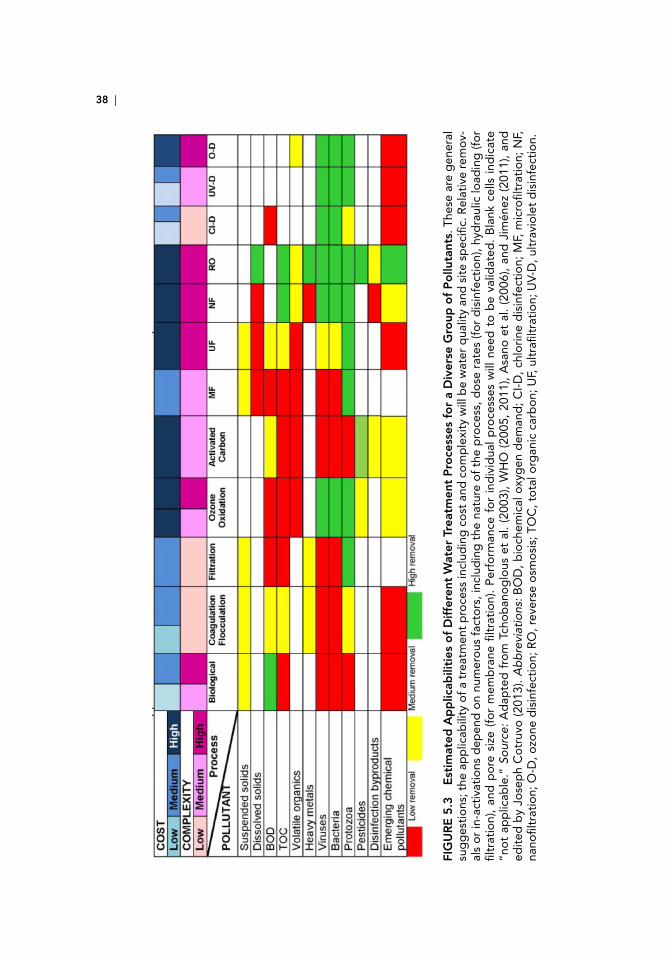
38 |
FIG
UR
E 5
.3
Est
imat
ed A
pp
licab
iliti
es o
f D
iffer
ent
Wat
er T
reat
men
t P
roce
sses
fo
r a
Div
erse
Gro
up o
f P
ollu
tant
s. T
hese
are
gen
eral
su
gg
esti
ons
; the
ap
plic
abili
ty o
f a t
reat
men
t p
roce
ss in
clud
ing
co
st a
nd c
om
ple
xity
will
be
wat
er q
ualit
y an
d s
ite
spec
ific.
Rel
ativ
e re
mo
v-al
s o
r in
-act
ivat
ions
dep
end
on
num
ero
us f
acto
rs, i
nclu
din
g t
he n
atur
e o
f th
e p
roce
ss, d
ose
rat
es (f
or
dis
infe
ctio
n), h
ydra
ulic
load
ing
(fo
r fil
trat
ion)
, an
d p
ore
siz
e (f
or
mem
bra
ne fi
ltra
tio
n).
Per
form
ance
fo
r in
div
idua
l p
roce
sses
will
nee
d t
o b
e va
lidat
ed.
Bla
nk c
ells
ind
icat
e “n
ot
app
licab
le.”
Sou
rce:
Ad
apte
d f
rom
Tch
ob
ano
glo
us e
t al
. (2
003)
, W
HO
(20
05,
2011
), A
sano
et
al.
(200
6),
and
Jim
énez
(20
11),
and
ed
ited
by
Jose
ph
Co
truv
o (2
013)
. Ab
bre
viat
ions
: BO
D, b
ioch
emic
al o
xyg
en d
eman
d; C
I-D
, chl
ori
ne d
isin
fect
ion;
MF,
mic
rofil
trat
ion;
NF,
na
nofil
trat
ion;
O-D
, ozo
ne d
isin
fect
ion;
RO
, rev
erse
osm
osi
s; T
OC
, to
tal o
rgan
ic c
arb
on;
UF,
ult
rafil
trat
ion;
UV-
D, u
ltra
vio
let
dis
infe
ctio
n.
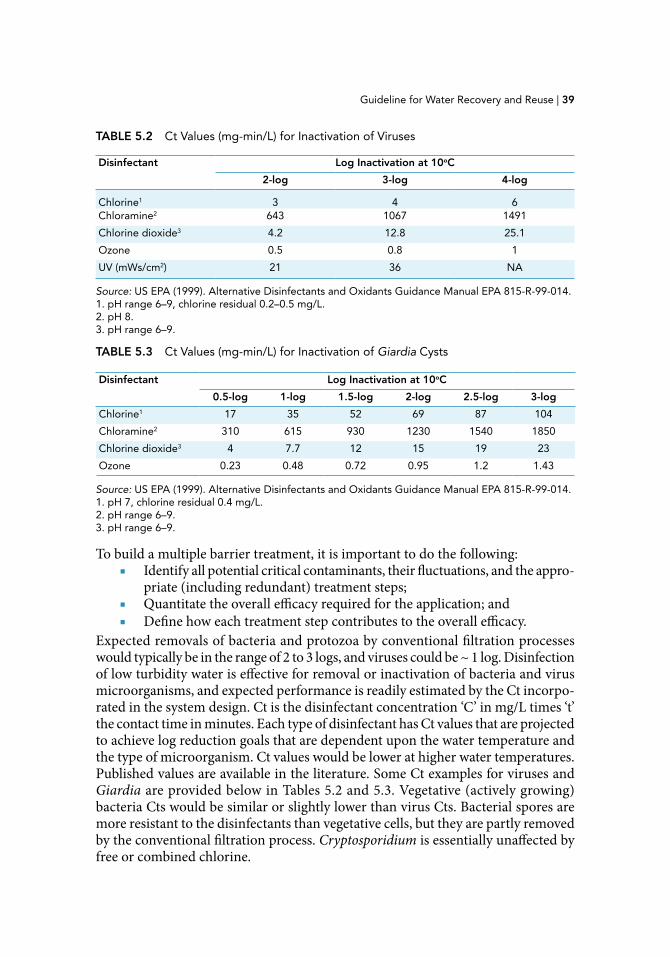
Guideline for Water Recovery and Reuse | 39
To build a multiple barrier treatment, it is important to do the following: ■ Identify all potential critical contaminants, their fluctuations, and the appro-
priate (including redundant) treatment steps; ■ Quantitate the overall efficacy required for the application; and ■ Define how each treatment step contributes to the overall efficacy.
Expected removals of bacteria and protozoa by conventional filtration processes would typically be in the range of 2 to 3 logs, and viruses could be ~ 1 log. Disinfection of low turbidity water is effective for removal or inactivation of bacteria and virus microorganisms, and expected performance is readily estimated by the Ct incorpo-rated in the system design. Ct is the disinfectant concentration ‘C’ in mg/L times ‘t’ the contact time in minutes. Each type of disinfectant has Ct values that are projected to achieve log reduction goals that are dependent upon the water temperature and the type of microorganism. Ct values would be lower at higher water temperatures. Published values are available in the literature. Some Ct examples for viruses and Giardia are provided below in Tables 5.2 and 5.3. Vegetative (actively growing) bacteria Cts would be similar or slightly lower than virus Cts. Bacterial spores are more resistant to the disinfectants than vegetative cells, but they are partly removed by the conventional filtration process. Cryptosporidium is essentially unaffected by free or combined chlorine.
Source: US EPA (1999). Alternative Disinfectants and Oxidants Guidance Manual EPA 815-R-99-014.1. pH range 6–9, chlorine residual 0.2–0.5 mg/L. 2. pH 8. 3. pH range 6–9.
TABLE 5.2 Ct Values (mg-min/L) for Inactivation of Viruses
Disinfectant Log Inactivation at 10oC
2-log 3-log 4-log
Chlorine1 3 4 6Chloramine2 643 1067 1491
Chlorine dioxide3 4.2 12.8 25.1
Ozone 0.5 0.8 1
UV (mWs/cm2) 21 36 NA
Source: US EPA (1999). Alternative Disinfectants and Oxidants Guidance Manual EPA 815-R-99-014.1. pH 7, chlorine residual 0.4 mg/L.2. pH range 6–9.3. pH range 6–9.
TABLE 5.3 Ct Values (mg-min/L) for Inactivation of Giardia Cysts
Disinfectant Log Inactivation at 10oC
0.5-log 1-log 1.5-log 2-log 2.5-log 3-log
Chlorine1 17 35 52 69 87 104
Chloramine2 310 615 930 1230 1540 1850
Chlorine dioxide3 4 7.7 12 15 19 23
Ozone 0.23 0.48 0.72 0.95 1.2 1.43
40 |
5.2 Water Recovery Treatment Studies
Expert advice can assist with selection of treatment options and design and imple-mentation processes. Pilot testing is useful for critical assessment of the proposed treatment scheme under the variable conditions of water quantity and quality commonly observed in a beverage production plant, and for obtaining operational experience and for training purposes.
5.2.1 Regulatory Restrictions
Regulatory restrictions and environmental permits held by bottling facilities often limit the quantity and quality of the waste and wastewater effluent allowed to be discharged from the facility. In some water-scarce areas, a certain amount of water must be returned to the environment. Minimizing water usage can reduce the vol-ume of effluent discharged but it may be more concentrated, which may render it difficult to fulfill the permit discharge requirements and may make additional treatment necessary.5.2.2 Storing Water Produced By a Multiple Barrier Treatment Process for Reuse
It is good practice to minimize the finished water storage time to avoid water quality problems caused by stagnation. How the water is piped and stored prior to use should reflect both variability in source and use rates and the treatment processes. Storage tanks should preferably be made of stainless steel and should not have porous surfaces (e.g., cement or grouted tile) that can allow colonization by microorganisms. Treated water should be free of pathogens, but storage tanks should be routinely cleaned and include disinfection (chemical or UV) to prevent regrowth of nuisance organisms.
5.2.3 Validation
Using technologies that have been validated to appropriate standards helps ensure that the treatment process can accomplish the established performance goals. Technologies are validated by third-party independent organizations, and are often measured to different standards. For example, UV can be validated to the US EPA UVDGM, German DVGW, and Austrian ONORM standards, each of which has different protocols and performance standards. A validation from a third party is strongly recommended, particularly to facilitate acceptance by regulatory authorities.
Implementing a water recovery system in a beverage plant is viable only if there is adequate monitoring, both to validate the initial effectiveness of the processes
and to provide ongoing verification that water quality consistently meets intended needs. Monitoring methods may include on-line analyzers, simple test kits, or com-plex external laboratory measurements, depending in large part on resources, the intended water use, and the degree of precision required.
Initial monitoring to characterize water quality should be more extensive and likely involve outside laboratories. Monitoring for process performance should prefer-entially be in real time and focused on a limited number of indicator parameters. There are many chemical test kits and presence/absence total coliform and E. coli test methods that do not require sophisticated laboratories. On-line sensors exist for several types of chemical indicator measurements (e.g., pH, chlorine residual, TDS, turbidity, and conductivity) that demonstrate that the processes are functioning as designed and expected in the HACCP/WSP plan.
6.1 Water Characterization Needs
Depending upon the ultimate use of recovered water, there are several types of mon-itoring that should be done. The relevant issues for design of a monitoring program for recycled water include source water characterization with periodic follow-up, and process performance monitoring to assure continued acceptable operations. Parameters to be monitored, frequency of monitoring, on-line versus discrete anal-yses, and redundancy of instruments must all be chosen.
Each of these choices is influenced by vulnerability of the source water to contamina-tion and process management requirements, as well as reasonably available options in a given local environment. Any water with potential indirect or direct product contact must meet applicable drinking water standards, whereas any non-product contact requires monitoring for a shorter list of indicator parameters. No single set of ideal monitoring parameters can be identified that would be appropriate for all cases, but this guidance provides a list of parameters that are appropriate as a min-imum for any recovered water use (see Table 2.1).
Source water assessments consider a range of possible contaminants (see Appendix D: Contaminant Concerns) and can be derived from broadly accepted lists such as the WHO GDWQ (2011), WHO guidelines on the management of chemical contaminants (WHO, 2007), company criteria, or local regulatory requirements,
41
Monitoring6
42 |
but they should also reflect local conditions and any hazards that may be plant or locale specific. After the source vulnerability assessment treatment train has been determined, it is not necessary to continually analyze for a wide variety of potential contaminants. Use of proven practical indicator parameters via on-line monitors becomes a cost-effective performance verification process.
6.2 Technology Performance Indicators
An appropriate monitoring scheme is necessary for continuous performance of a unit treatment process. Simpler and low cost indicator measurements should be utilized to track the performance relative to the specifications and to determine needed adjustments.
6.2.1 On-line / Real-Time Monitoring
Ideally, the best type of process performance monitoring is with real-time, on-line monitors. On-line monitors are now available for pH, conductivity, turbidity, par-ticle counts, total organic carbon (TOC) and many individual chemicals. Chlorine and ozone have had on-line monitors available for many years. There are UV trans-mittance monitors (and UV energy output) associated with most UV systems. For organics, on-line monitors are available for TOC. They are not yet available for micro-bial constituents such as coliforms, individual bacterial species, and total bacterial counts; however, there are surrogate methods like chlorine residual and turbidity. On-line monitors are expensive and require regular calibration and maintenance, trained personnel, and access to repair support.
Alternatively, low cost rapid analytical techniques are available for numerous parame-ters for grab samples, which should be collected with sufficient frequency to maintain process control.
6.2.2 Scenarios and Approaches
Different monitoring parameters are appropriate for different water end uses.
6.2.2.1 Microbiology
Microbial risks are acute, thus, microbial monitoring, particularly of water whose character can vary, should be more frequent. Filtration, disinfection, and presence of a disinfectant residual are important indirect indicators of microbial safety. Periodic measurements for E. coli and nuisance organisms are important controls. Weekly E. coli measurement is always recommended as a general indicator of microbial safety, especially for bacteria and viruses. E. coli can originate not only from sanitary waste, but also rain water. For non-contact water use it is an indication of potential fecal contamination, which is an issue for worker safety. Total coliforms can originate from multiple sources (e.g., dust and soils), so they are not a good sanitary waste indicator. Detection of total coliforms would indicate possible problems with the integrity of the treatment system (e.g., exposure to air) or the disinfection process because plant water should be coliform free.

Guideline for Water Recovery and Reuse | 43
There are other microbial species that may be appropriate indicators, including yeast/mold, Pseudomonas, or fecal streptococcus. These should be measured if they are critical parameters for plant performance. HPC (total counts), such as for 2–3 days at 35°C, indicates regrowth in the absence of a disinfectant residual. HPC, E. coli, and coliform monitoring can be conducted on-site using test kit culture systems. These tests require from 18 hours to several days. Therefore, it is important to be preventive in the design of treatment processes and use disinfectant residual and turbidity monitoring as the primary verification methods (see chemical tests, below).
6.2.2.2 Chemical Indicators
There are numerous chemical indicators that may be important for particular pro-cess stream scenarios at a facility, depending on the source water characteristics. These can include specific metals (e.g., Fe, Mn, Pb, etc.), radionuclides (e.g., radium 226/228 and uranium in particular), specific anions (e.g., SO4, NO3
-), silica, nutrients (e.g., NH3, phosphorus oxyanions), disinfection byproducts (e.g., trihalomethanes, haloacetic acids), and some specific synthetic organics. Most are source water issues requiring management in other parts of the plant regardless of water recovery efforts. Most do not require frequent analyses once the composition of the source water is understood and the treatment process has been properly designed However, if water from several systems (e.g., anion exchange, evaporation) is used for recovery, it may be appropriate to conduct occasional more detailed monitoring, but this should evolve from the source water assessment and HACCP/WSP.
6.2.2.3 Aesthetics
Product may be adulterated by adverse tastes, color, or odor from the water, and pH and hardness can also affect product. Turbidity is an important indicator of microbial quality (e.g., Giardia and Cryptosporidium protozoa) that is managed by filtration. In-line turbidity meters (turbidimeters) with alarm systems are routinely available at relatively low cost. Depending on the intended water use, real-time monitoring of turbidity is recommended. Color is generally an indicator of natural organics in the water, or poor control of coagulation or lime softening processes. Color is readily measured by visual or spectrophotometric methods frequently carried out by operators of water plants.
Odor is an important element that should be checked frequently. The best application of odor monitoring is a simple room temperature sniff to determine if there are any objectionable odors (e.g., sulfide or algal products).
6.2.2.4 Disinfectant Residuals
Chlorine, chlorine dioxide, or chloramine residuals could be detrimental for some products. Ozone dissipates rapidly, and UV provides immediate disinfection with no residual. One or more disinfectants are required as part of the treatment pro-cess to ensure microbial safety, and routine residual measurements are important to establish presence and/or absence of desired residuals. On-line monitors with

44 |
alarms exist for chlorine residuals and ozone. Although ozone rapidly dissipates, it has some persistence in a closed system. Chlorine can damage RO membranes and impart taste. Chlorine residuals should be linked to specific processes and products. It is important to measure UV transmittance or UV intensity and contact time to ensure adequate dosage and effectiveness.
The CT concept (concentration in mg/L × contact time in minutes at a particular temperature) is a valuable design and operating parameter to assure effective disin-fection (US EPA, 1999). Each disinfectant has its own CT characteristic indicative of the number of logs removal of the target microbe under the treatment conditions (see Chapter 5).
Inexpensive disinfectant residual test kits are available, but in-line monitoring is preferred for continual microbial safety. The frequency for test kit measurements should be comparable to the company’s source water monitoring (e.g., multiple times per day) at critical control points.
6.2.2.5 Total Organic Carbon
TOC is an excellent surrogate for indicating organic matter in water; however, it is not as necessary as a frequent measurement unless it is a critical performance param-eter for a process such as RO (Table 2.1). TOC is an indicator of treatment process performance. High levels of TOC can foul membranes, provide a nutrient source for bacterial regrowth, or increase disinfectant demand. Manual measurements of TOC are rapid and inexpensive; in-line monitors are more expensive (roughly USD $20,000).
6.2.2.6 Turbidity
Turbidity is an indicator of inadequate filtration performance that can result in microbial contamination, such as failure to adequately remove Cryptosporidium or Giardia. The U.S. treatment standard for turbidity for filtration of surface sources and groundwaters under the influence of surface sources is 0.3 nephelometric turbidity units (NTU) 95% of the time and never exceeding 1 NTU for each operating filter (US EPA, 2006).
6.2.2.7 Conductivity
Electrical conductivity is a good indicator of dissolved inorganic ions in water and the performance of RO. Conductivity is a surrogate for TDS; greater TDS equals greater conductivity. In-line electrical conductivity monitors are inexpensive and provide information on salinity (see Chapter 2).
6.2.2.8 pH Levels
Water acidity or basicity, as measured by pH, is a very useful parameter. pH can relate to corrosion (low or high pH) or precipitation and fouling (high pH). Many recoverable process waters may have extreme pH values (e.g., caustic washes, or
Guideline for Water Recovery and Reuse | 45
regeneration of some ion exchange resins). This guidance provides specific standards for pH (e.g., 4–10) for certain recovery applications and more general guidance in others. In-line pH measurement is available. Manual measurement is simple and cost-effective, with pH meters costing less than USD $1,000. Very low cost pH papers are also an option. If a plant is considering manual measurements, the frequency of manual measurements should be the same as used for principal source water.
6.3 Investigative Monitoring
Investigative monitoring includes the initial comprehensive assessment of water contaminants in source waters to determine needed treatment processes and identify threats to the use of the recycled water. It may require comprehensive monitoring to identify contaminants of concern. There are also investigations in which one of the routinely monitored parameters exceeds a set limit. The parameters being measured will be dictated by the specific cause. This should be discussed in the plant’s HACCP plan.
6.4 Identification of Parameter Measures
The recommended parameters for frequent (preferably in-line) verification mon-itoring to demonstrate that water meets the recovery needs for high-quality water therefore include pH, TDS (as estimated from conductivity), turbidity, and disin-fectant residual. Although it is possible to use statistical process control to monitor changes in water chemistry, the nature of recovery processes is such that the water quality may vary substantially. Thus, in lieu of control charts, this guidance provides limits for different uses (see Chapter 2) where appropriate, and also relies on guidance from treatment process vendors.
6.4.1 Maximum Allowable Levels
Allowable levels for a given parameter are dictated by the end use of the water. For low end non-product contact uses, fewer parameters require monitoring than for potential product contact uses. For recovered water that will potentially be in con-tact with product, the water must also meet applicable drinking water guidelines (WHO, 2011).
6.4.2 Frequency and Location of Monitoring
The routine monitoring frequency depends on the expected variability of components in the recovered water and also the sensitivity of the treatment to water chemistry changes. The HACCP/WSP assessment should identify the CCPs where specific monitoring will be essential for process performance and product quality and also define the frequency.
Monitoring to determine compliance with the guideline parameters should be conducted after treatment. The monitoring site should be immediately after the dis-infectant application and before the end use. Sampling taps should be available at each unit process and at individual waste sources for investigative sampling as necessary.
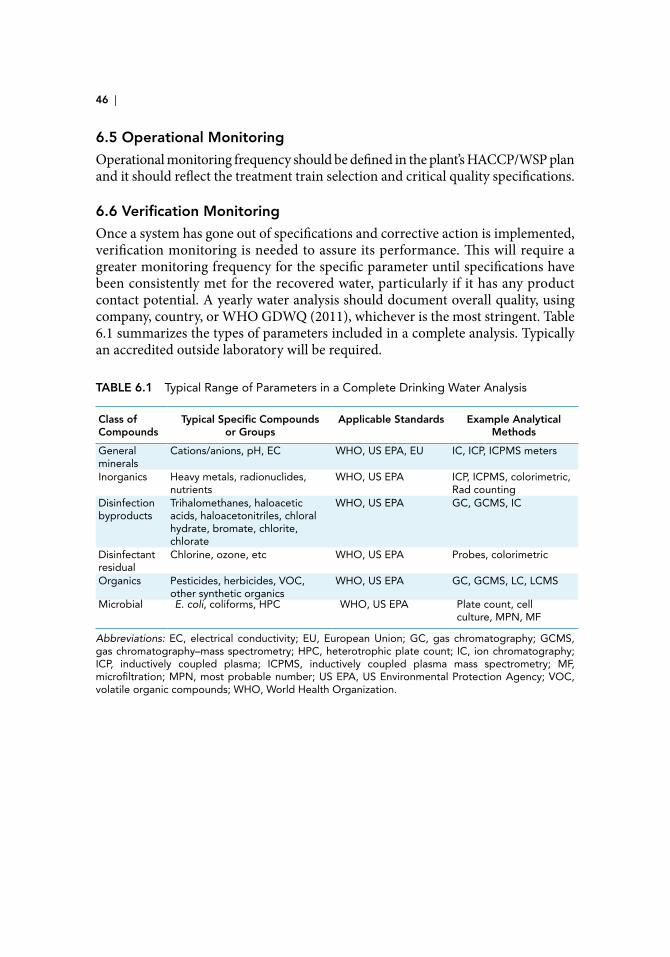
46 |
6.5 Operational Monitoring
Operational monitoring frequency should be defined in the plant’s HACCP/WSP plan and it should reflect the treatment train selection and critical quality specifications.
6.6 Verification Monitoring
Once a system has gone out of specifications and corrective action is implemented, verification monitoring is needed to assure its performance. This will require a greater monitoring frequency for the specific parameter until specifications have been consistently met for the recovered water, particularly if it has any product contact potential. A yearly water analysis should document overall quality, using company, country, or WHO GDWQ (2011), whichever is the most stringent. Table 6.1 summarizes the types of parameters included in a complete analysis. Typically an accredited outside laboratory will be required.
TABLE 6.1 Typical Range of Parameters in a Complete Drinking Water Analysis
Abbreviations: EC, electrical conductivity; EU, European Union; GC, gas chromatography; GCMS, gas chromatography–mass spectrometry; HPC, heterotrophic plate count; IC, ion chromatography; ICP, inductively coupled plasma; ICPMS, inductively coupled plasma mass spectrometry; MF, microfiltration; MPN, most probable number; US EPA, US Environmental Protection Agency; VOC, volatile organic compounds; WHO, World Health Organization.
Class of Compounds
Typical Specific Compounds or Groups
Applicable Standards Example Analytical Methods
General minerals
Cations/anions, pH, EC WHO, US EPA, EU IC, ICP, ICPMS meters
Inorganics Heavy metals, radionuclides, nutrients
WHO, US EPA ICP, ICPMS, colorimetric, Rad counting
Disinfection byproducts
Trihalomethanes, haloacetic acids, haloacetonitriles, chloral hydrate, bromate, chlorite, chlorate
WHO, US EPA GC, GCMS, IC
Disinfectant residual
Chlorine, ozone, etc WHO, US EPA Probes, colorimetric
Organics Pesticides, herbicides, VOC, other synthetic organics
WHO, US EPA GC, GCMS, LC, LCMS
Microbial E. coli, coliforms, HPC WHO, US EPA Plate count, cell culture, MPN, MF
Case Study 1—Global: Recovery and Reuse of Beverage Process WaterFrom: Darshane DV, Gadson JC, Wojna CJ, Rosenfield JA, Chin H, Bowen P
Challenge
In the face of increased water scarcity, water costs, growth projections, and other drivers, Coca-Cola bottling plants sought to further improve their water use effi-ciency. This led to the pursuit of a scientifically rigorous, widely applicable water recovery and reuse approach that could be used by virtually any of the nearly 900 bottling plants in the Coca-Cola system.
Solution
The framework was based on the water safety plan approach consisting of: source vulnerability assessment, source water protection plan, system design, operational monitoring, and management plans.
The system design takes beverage process wastewater and further purifies it to high standards for use in non-product applications. It uses a combination of technolo-gies: chemical treatment, biological treatment in a membrane bioreactor, UF, RO, ozonation, and UV disinfection as described below.
■ Secondary biological treatment. ■ Membrane bioreactor combines ultrafiltration with biological treatment for
excellent solids removal with low sludge production in a small footprint. ■ Ultrafiltration (UF) uses a pressure-driven barrier to remove suspended
solids and pathogens. ■ Reverse osmosis (RO) forces water through membranes under high pressure,
removing some dissolved chemicals and other compounds to produce water with very high purity and low total dissolved solids.
■ Ozonation destroys microorganisms and oxidizes organic materials. ■ Medium pressure ultraviolet (UV) light disinfects water by rendering micro-
organisms inactive. ■ Mixed oxidant disinfection. ■ Chlorination at several points, as appropriate for disinfection and oxidation.
The choice of treatment technologies was dependent upon the characteristics of the beverage waste stream and the planned point-of-use of the water. Some of these
47
Appendix A Case Studies

48 |
technologies effectively remove contaminants, such as heavy metals, while others disinfect. Further, the system employed significant continuous monitoring, auto-mation, and controls.
Two water recovery options were assessed: in-process treatment and process waste water treatment. The in-process reuse option involves the manufacturing process wastewater stream being treated and reused in the same manufacturing func-tion before it reaches the wastewater treatment system, reducing the fresh water requirements for the manufacturing function. The wastewater stream from a given manufacturing process is sent directly to advanced treatment, bypassing the plant-wide wastewater treatment process. After passing through appropriate treatment the process waste stream is recycled back into the process from which it originated. The quality of the water meets the water standards required for the process.
In the process wastewater treatment configuration, the wastewater streams from all manufacturing processes are sent to the existing wastewater treatment system. A portion of the treated effluent is then sent through required advanced treatment steps and recycled back to one or more manufacturing processes. This option maximizes the amount of reuse water because it aggregates manufacturing waste streams (but not sanitary or cafeteria waste streams) from the entire plant (Case Study 1, Figure 1).
Results
The highly purified water from this commercial trial consistently met internal and external regulatory standards and specifications. Samples were analyzed throughout the process treatment train to assess the efficiency and capabilities of each step of the treatment process.
Samples at each intermediate process as well as the final effluent were tested exten-sively by internal and external laboratories. Analyses by third-party laboratories were conducted for 126 parameters, including inorganics, synthetic organics, “semivolatile organics”, volatile organics, disinfection-related chemicals (including trihalometh-anes), pesticides, and microbial analysis for E. coli.
CASE STUDY 1, FIGURE 1 Water Recovery Schematic of The Coca-Cola Company.
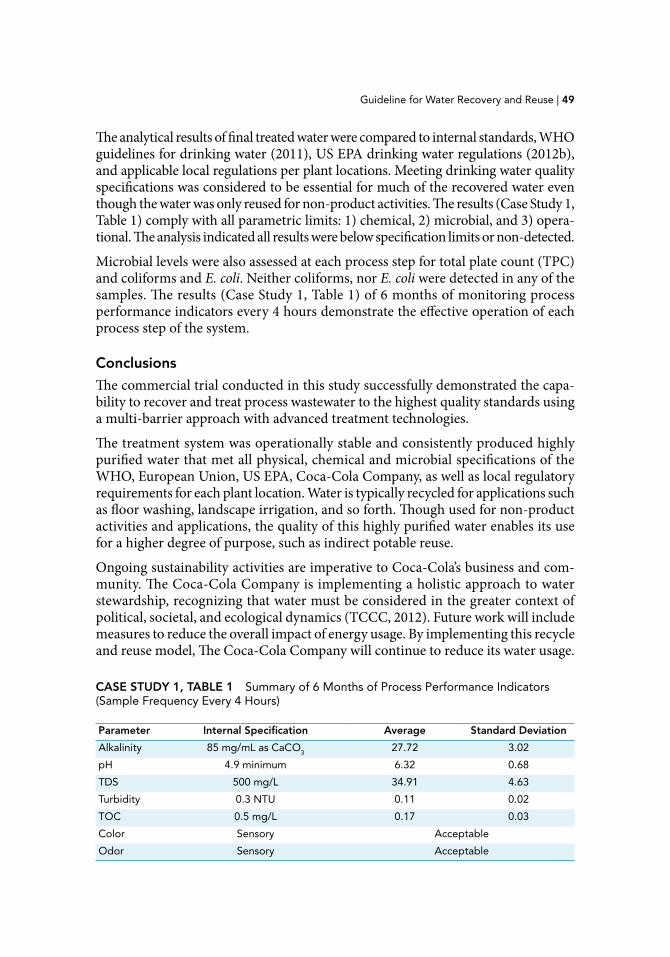
Guideline for Water Recovery and Reuse | 49
The analytical results of final treated water were compared to internal standards, WHO guidelines for drinking water (2011), US EPA drinking water regulations (2012b), and applicable local regulations per plant locations. Meeting drinking water quality specifications was considered to be essential for much of the recovered water even though the water was only reused for non-product activities. The results (Case Study 1, Table 1) comply with all parametric limits: 1) chemical, 2) microbial, and 3) opera-tional. The analysis indicated all results were below specification limits or non-detected.
Microbial levels were also assessed at each process step for total plate count (TPC) and coliforms and E. coli. Neither coliforms, nor E. coli were detected in any of the samples. The results (Case Study 1, Table 1) of 6 months of monitoring process performance indicators every 4 hours demonstrate the effective operation of each process step of the system.
Conclusions
The commercial trial conducted in this study successfully demonstrated the capa-bility to recover and treat process wastewater to the highest quality standards using a multi-barrier approach with advanced treatment technologies.
The treatment system was operationally stable and consistently produced highly purified water that met all physical, chemical and microbial specifications of the WHO, European Union, US EPA, Coca-Cola Company, as well as local regulatory requirements for each plant location. Water is typically recycled for applications such as floor washing, landscape irrigation, and so forth. Though used for non-product activities and applications, the quality of this highly purified water enables its use for a higher degree of purpose, such as indirect potable reuse.
Ongoing sustainability activities are imperative to Coca-Cola’s business and com-munity. The Coca-Cola Company is implementing a holistic approach to water stewardship, recognizing that water must be considered in the greater context of political, societal, and ecological dynamics (TCCC, 2012). Future work will include measures to reduce the overall impact of energy usage. By implementing this recycle and reuse model, The Coca-Cola Company will continue to reduce its water usage.
CASE STUDY 1, TABLE 1 Summary of 6 Months of Process Performance Indicators (Sample Frequency Every 4 Hours)
Parameter Internal Specification Average Standard Deviation
Alkalinity 85 mg/mL as CaCO3 27.72 3.02
pH 4.9 minimum 6.32 0.68
TDS 500 mg/L 34.91 4.63
Turbidity 0.3 NTU 0.11 0.02
TOC 0.5 mg/L 0.17 0.03
Color Sensory Acceptable
Odor Sensory Acceptable
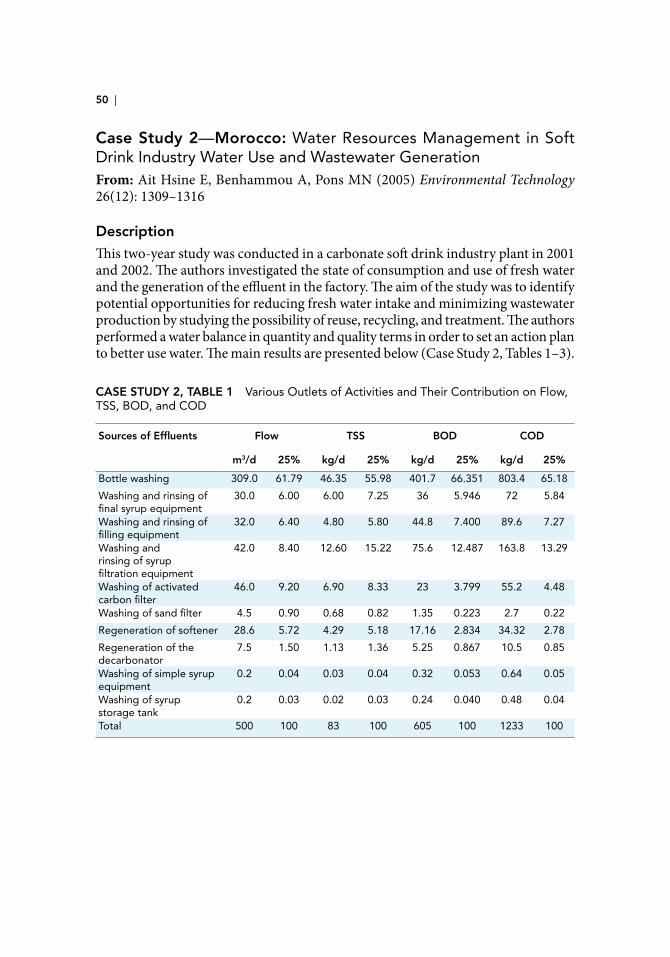
50 |
Case Study 2—Morocco: Water Resources Management in Soft Drink Industry Water Use and Wastewater GenerationFrom: Ait Hsine E, Benhammou A, Pons MN (2005) Environmental Technology 26(12): 1309–1316
Description
This two-year study was conducted in a carbonate soft drink industry plant in 2001 and 2002. The authors investigated the state of consumption and use of fresh water and the generation of the effluent in the factory. The aim of the study was to identify potential opportunities for reducing fresh water intake and minimizing wastewater production by studying the possibility of reuse, recycling, and treatment. The authors performed a water balance in quantity and quality terms in order to set an action plan to better use water. The main results are presented below (Case Study 2, Tables 1–3).
CASE STUDY 2, TABLE 1 Various Outlets of Activities and Their Contribution on Flow, TSS, BOD, and COD
Sources of Effluents Flow TSS BOD COD
m3/d 25% kg/d 25% kg/d 25% kg/d 25%
Bottle washing 309.0 61.79 46.35 55.98 401.7 66.351 803.4 65.18
Washing and rinsing of final syrup equipment
30.0 6.00 6.00 7.25 36 5.946 72 5.84
Washing and rinsing of filling equipment
32.0 6.40 4.80 5.80 44.8 7.400 89.6 7.27
Washing and rinsing of syrup filtration equipment
42.0 8.40 12.60 15.22 75.6 12.487 163.8 13.29
Washing of activated carbon filter
46.0 9.20 6.90 8.33 23 3.799 55.2 4.48
Washing of sand filter 4.5 0.90 0.68 0.82 1.35 0.223 2.7 0.22
Regeneration of softener 28.6 5.72 4.29 5.18 17.16 2.834 34.32 2.78
Regeneration of the decarbonator
7.5 1.50 1.13 1.36 5.25 0.867 10.5 0.85
Washing of simple syrup equipment
0.2 0.04 0.03 0.04 0.32 0.053 0.64 0.05
Washing of syrup storage tank
0.2 0.03 0.02 0.03 0.24 0.040 0.48 0.04
Total 500 100 83 100 605 100 1233 100
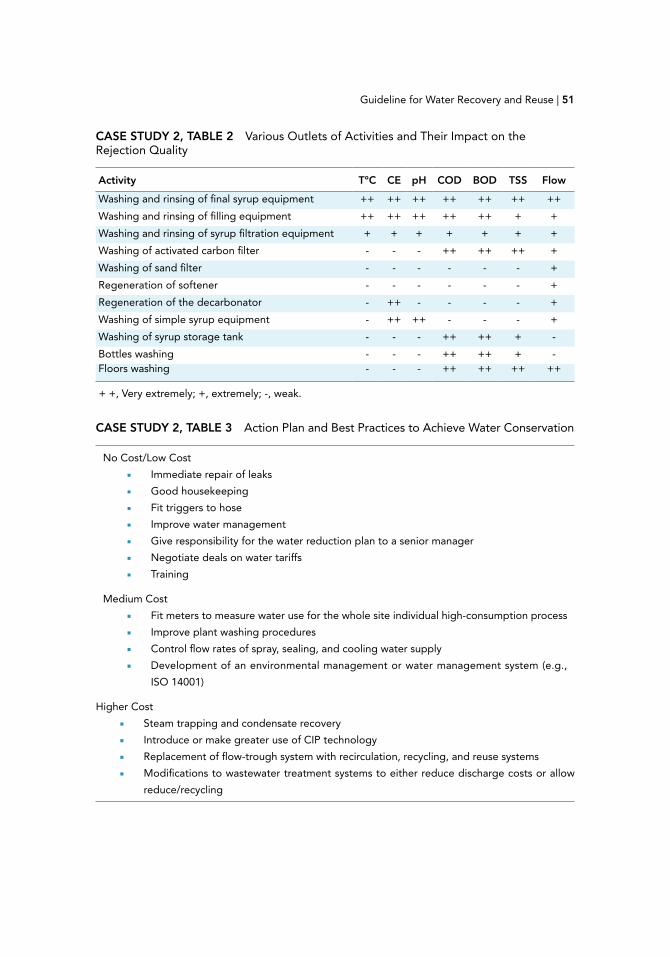
Guideline for Water Recovery and Reuse | 51
CASE STUDY 2, TABLE 2 Various Outlets of Activities and Their Impact on the Rejection Quality
Activity T°C CE pH COD BOD TSS Flow
Washing and rinsing of final syrup equipment ++ ++ ++ ++ ++ ++ ++
Washing and rinsing of filling equipment ++ ++ ++ ++ ++ + +
Washing and rinsing of syrup filtration equipment + + + + + + +
Washing of activated carbon filter - - - ++ ++ ++ +
Washing of sand filter - - - - - - +
Regeneration of softener - - - - - - +
Regeneration of the decarbonator - ++ - - - - +
Washing of simple syrup equipment - ++ ++ - - - +
Washing of syrup storage tank - - - ++ ++ + -
Bottles washing - - - ++ ++ + -Floors washing - - - ++ ++ ++ ++
+ +, Very extremely; +, extremely; -, weak.
CASE STUDY 2, TABLE 3 Action Plan and Best Practices to Achieve Water Conservation
No Cost/Low Cost
■ Immediate repair of leaks
■ Good housekeeping
■ Fit triggers to hose
■ Improve water management
■ Give responsibility for the water reduction plan to a senior manager
■ Negotiate deals on water tariffs
■ Training
Medium Cost
■ Fit meters to measure water use for the whole site individual high-consumption process
■ Improve plant washing procedures
■ Control flow rates of spray, sealing, and cooling water supply
■ Development of an environmental management or water management system (e.g.,
ISO 14001)
Higher Cost
■ Steam trapping and condensate recovery
■ Introduce or make greater use of CIP technology
■ Replacement of flow-trough system with recirculation, recycling, and reuse systems
■ Modifications to wastewater treatment systems to either reduce discharge costs or allow
reduce/recycling
52 |
Conclusions
The main water use was for equipment washing and CIP. The long-term implications of losing its only raw material source far outweighed the short-term impact. For the industry studied, the identified water demand management and cleaner production techniques showed potential for savings in water, water and effluent fees, and min-imization of waste produced.
Improvements can be achieved by first carrying out audits to identify areas of improvement within the manufacturing process. It can then prioritize measures with the best returns within a certain time period, and financial regime. This procedure for the soft drink industries demonstrates the ability to operate in an ecologically friendly and sustainable manner. A full cost benefit analysis would also require an indication of the actual costs of damage to the environment and the real long-run marginal cost of water, which reflects the scarcity of the resource in the case of Morocco. From this work, the industry has been certified with an integrated system of management (ISO 9001-2000 and ISO 14001-1998) since April 2004.
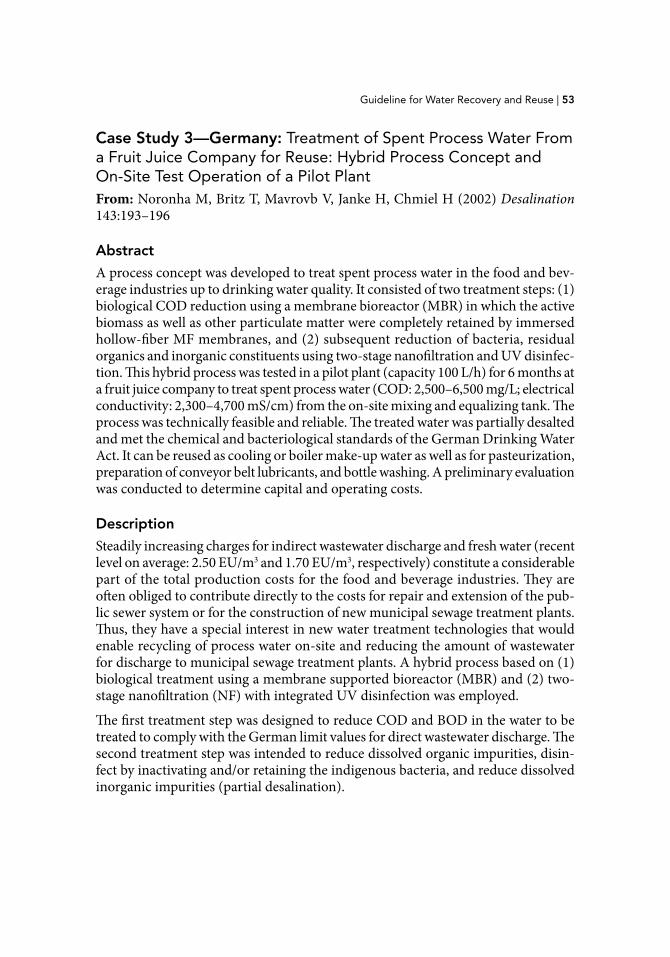
Guideline for Water Recovery and Reuse | 53
Case Study 3—Germany: Treatment of Spent Process Water From a Fruit Juice Company for Reuse: Hybrid Process Concept and On-Site Test Operation of a Pilot PlantFrom: Noronha M, Britz T, Mavrovb V, Janke H, Chmiel H (2002) Desalination 143:193–196
Abstract
A process concept was developed to treat spent process water in the food and bev-erage industries up to drinking water quality. It consisted of two treatment steps: (1) biological COD reduction using a membrane bioreactor (MBR) in which the active biomass as well as other particulate matter were completely retained by immersed hollow-fiber MF membranes, and (2) subsequent reduction of bacteria, residual organics and inorganic constituents using two-stage nanofiltration and UV disinfec-tion. This hybrid process was tested in a pilot plant (capacity 100 L/h) for 6 months at a fruit juice company to treat spent process water (COD: 2,500–6,500 mg/L; electrical conductivity: 2,300–4,700 mS/cm) from the on-site mixing and equalizing tank. The process was technically feasible and reliable. The treated water was partially desalted and met the chemical and bacteriological standards of the German Drinking Water Act. It can be reused as cooling or boiler make-up water as well as for pasteurization, preparation of conveyor belt lubricants, and bottle washing. A preliminary evaluation was conducted to determine capital and operating costs.
Description
Steadily increasing charges for indirect wastewater discharge and fresh water (recent level on average: 2.50 EU/m3 and 1.70 EU/m3, respectively) constitute a considerable part of the total production costs for the food and beverage industries. They are often obliged to contribute directly to the costs for repair and extension of the pub-lic sewer system or for the construction of new municipal sewage treatment plants. Thus, they have a special interest in new water treatment technologies that would enable recycling of process water on-site and reducing the amount of wastewater for discharge to municipal sewage treatment plants. A hybrid process based on (1) biological treatment using a membrane supported bioreactor (MBR) and (2) two-stage nanofiltration (NF) with integrated UV disinfection was employed.
The first treatment step was designed to reduce COD and BOD in the water to be treated to comply with the German limit values for direct wastewater discharge. The second treatment step was intended to reduce dissolved organic impurities, disin-fect by inactivating and/or retaining the indigenous bacteria, and reduce dissolved inorganic impurities (partial desalination).
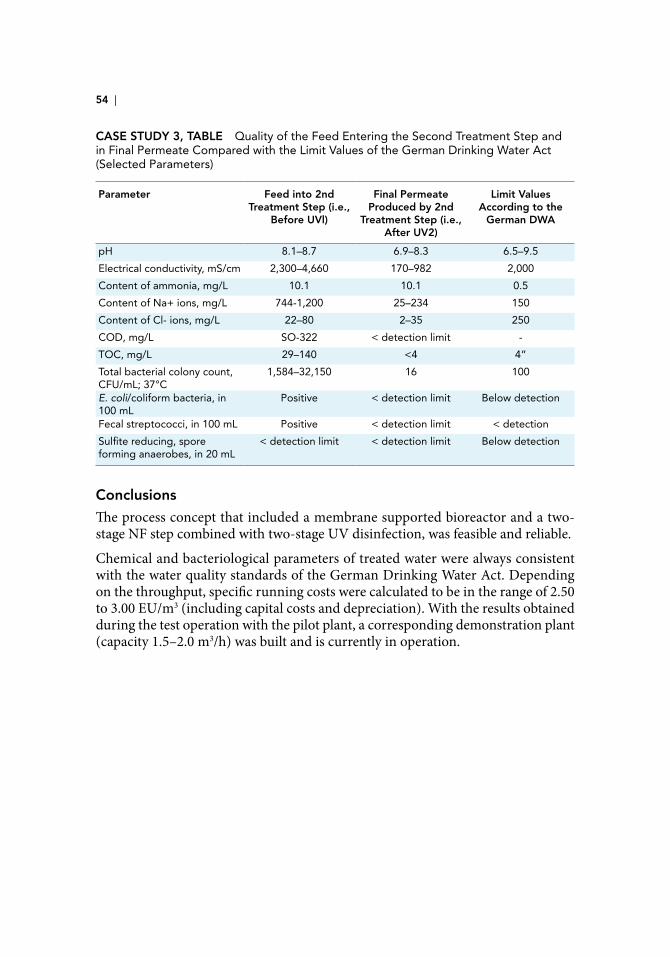
54 |
CASE STUDY 3, TABLE Quality of the Feed Entering the Second Treatment Step and in Final Permeate Compared with the Limit Values of the German Drinking Water Act (Selected Parameters)
Parameter Feed into 2nd Treatment Step (i.e.,
Before UVl)
Final Permeate Produced by 2nd
Treatment Step (i.e., After UV2)
Limit Values According to the
German DWA
pH 8.1–8.7 6.9–8.3 6.5–9.5
Electrical conductivity, mS/cm 2,300–4,660 170–982 2,000
Content of ammonia, mg/L 10.1 10.1 0.5
Content of Na+ ions, mg/L 744-1,200 25–234 150
Content of Cl- ions, mg/L 22–80 2–35 250
COD, mg/L SO-322 < detection limit -
TOC, mg/L 29–140 <4 4”
Total bacterial colony count, CFU/mL; 37°C
1,584–32,150 16 100
E. coli/coliform bacteria, in 100 mL
Positive < detection limit Below detection
Fecal streptococci, in 100 mL Positive < detection limit < detection
Sulfite reducing, spore forming anaerobes, in 20 mL
< detection limit < detection limit Below detection
Conclusions
The process concept that included a membrane supported bioreactor and a two-stage NF step combined with two-stage UV disinfection, was feasible and reliable.
Chemical and bacteriological parameters of treated water were always consistent with the water quality standards of the German Drinking Water Act. Depending on the throughput, specific running costs were calculated to be in the range of 2.50 to 3.00 EU/m3 (including capital costs and depreciation). With the results obtained during the test operation with the pilot plant, a corresponding demonstration plant (capacity 1.5–2.0 m3/h) was built and is currently in operation.
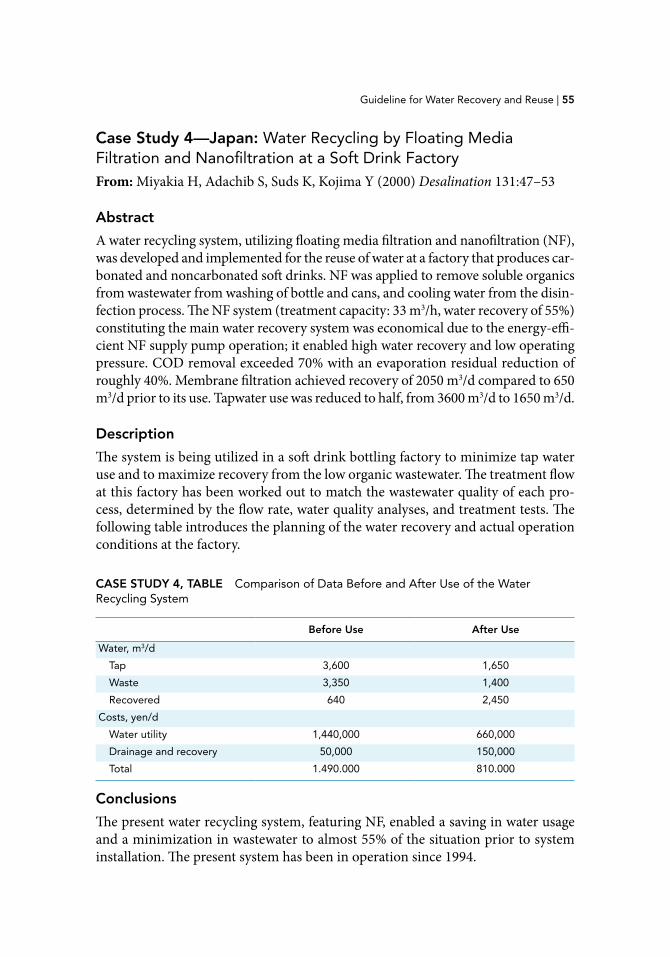
Guideline for Water Recovery and Reuse | 55
Case Study 4—Japan: Water Recycling by Floating Media Filtration and Nanofiltration at a Soft Drink FactoryFrom: Miyakia H, Adachib S, Suds K, Kojima Y (2000) Desalination 131:47–53
Abstract
A water recycling system, utilizing floating media filtration and nanofiltration (NF), was developed and implemented for the reuse of water at a factory that produces car-bonated and noncarbonated soft drinks. NF was applied to remove soluble organics from wastewater from washing of bottle and cans, and cooling water from the disin-fection process. The NF system (treatment capacity: 33 m3/h, water recovery of 55%) constituting the main water recovery system was economical due to the energy-effi-cient NF supply pump operation; it enabled high water recovery and low operating pressure. COD removal exceeded 70% with an evaporation residual reduction of roughly 40%. Membrane filtration achieved recovery of 2050 m3/d compared to 650 m3/d prior to its use. Tapwater use was reduced to half, from 3600 m3/d to 1650 m3/d.
Description
The system is being utilized in a soft drink bottling factory to minimize tap water use and to maximize recovery from the low organic wastewater. The treatment flow at this factory has been worked out to match the wastewater quality of each pro-cess, determined by the flow rate, water quality analyses, and treatment tests. The following table introduces the planning of the water recovery and actual operation conditions at the factory.
CASE STUDY 4, TABLE Comparison of Data Before and After Use of the Water Recycling System
Before Use After Use
Water, m3/d
Tap 3,600 1,650
Waste 3,350 1,400
Recovered 640 2,450
Costs, yen/d
Water utility 1,440,000 660,000
Drainage and recovery 50,000 150,000
Total 1.490.000 810.000
Conclusions
The present water recycling system, featuring NF, enabled a saving in water usage and a minimization in wastewater to almost 55% of the situation prior to system installation. The present system has been in operation since 1994.
56 |
Case Study 5—Thailand: Exploring Zero Discharge Potentials for the Sustainability of a Bottle Washing PlantFrom: Visvanathan C, Hufemia AM (1997) Water Science and Technology 35(9): 181–190
Abstract
The beverage industry is a major contributor to the problem of excessive pumping from existing aquifers in Thailand. In view of a government restriction on ground-water withdrawal, an overall water management plan was drawn for the sustainability of a soft drink plant in Bangkok, which depends solely on a deep-well source for its water needs. Technologies that can recover water for reuse, minimize raw water input, and consequently lead to zero discharge were identified.
The overall water balance drawn for this plant revealed that 76% of the raw water consumed daily ends up in the biological wastewater treatment plant (WWTP). A large portion (40%) of this wastewater is generated from the bottle washing units. By employing microfiltration for polishing of the WWTP effluent, the plant recovered process water for reuse such that groundwater input is reduced by 40% and liquid discharged to the receiving water by 56%.
There are two proposed strategies for recovering rinse water from the bottle washing units. A microfiltration-reverse osmosis system will purify the rinse water for reuse in the bottle washing process, thereby reducing raw water consumption further to 58% and the liquid discharge by 81.5%. On the other hand, a dual filter media-ion exchange system can reduce raw water input to 57% and the liquid discharge by 80.5%.
Description
There is a government restriction on digging more wells around the Bangkok area. This motivated the study. At that time the reuse implemented strategy aimed at using water for cleaning of production floors and surrounding areas, delivery vehicles, and the like. For this, the wastewater produced at the plants was treated with a polishing unit equipped with 0.2μ hollow fiber, polypropylene MF membrane modules has been installed at their WWTP. The study consisted of analyzing the further potential to increase reuse. For this purpose, the water balance table shown on the next page was made.
Conclusions
Water consumption profile of a soft drink plant in Bangkok revealed that raw water is drawn from deep-wells at an average rate of 5,598 m3/d. Out of this volume, 31.3% (1,751 m3/d) is consumed as pre-treated process water, 21.9% (1,226 m3/d) as treated water, and 40.3% (2,254 m3/d) as soft water. The amount of wastewater treated in the biological WWTP averages 4,243 m3/d, 40% of which comes from the bottle washing units.
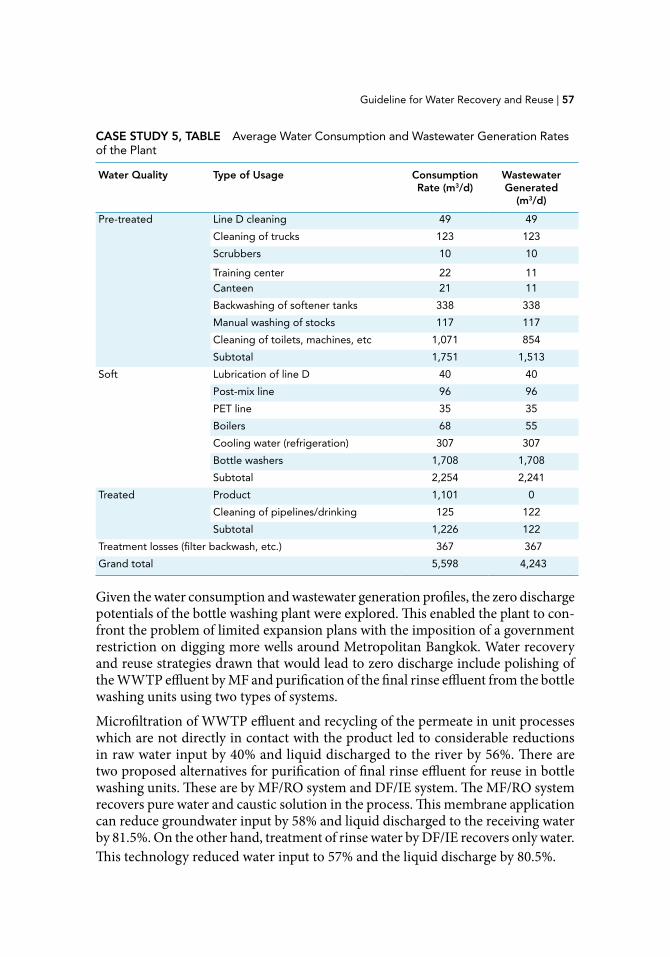
Guideline for Water Recovery and Reuse | 57
Given the water consumption and wastewater generation profiles, the zero discharge potentials of the bottle washing plant were explored. This enabled the plant to con-front the problem of limited expansion plans with the imposition of a government restriction on digging more wells around Metropolitan Bangkok. Water recovery and reuse strategies drawn that would lead to zero discharge include polishing of the WWTP effluent by MF and purification of the final rinse effluent from the bottle washing units using two types of systems.
Microfiltration of WWTP effluent and recycling of the permeate in unit processes which are not directly in contact with the product led to considerable reductions in raw water input by 40% and liquid discharged to the river by 56%. There are two proposed alternatives for purification of final rinse effluent for reuse in bottle washing units. These are by MF/RO system and DF/IE system. The MF/RO system recovers pure water and caustic solution in the process. This membrane application can reduce groundwater input by 58% and liquid discharged to the receiving water by 81.5%. On the other hand, treatment of rinse water by DF/IE recovers only water. This technology reduced water input to 57% and the liquid discharge by 80.5%.
Water Quality Type of Usage Consumption Rate (m3/d)
Wastewater Generated
(m3/d)
Pre-treated Line D cleaning 49 49
Cleaning of trucks 123 123
Scrubbers 10 10
Training center 22 11 Canteen 21 11
Backwashing of softener tanks 338 338
Manual washing of stocks 117 117
Cleaning of toilets, machines, etc 1,071 854
Subtotal 1,751 1,513
Soft Lubrication of line D 40 40
Post-mix line 96 96
PET line 35 35
Boilers 68 55
Cooling water (refrigeration) 307 307
Bottle washers 1,708 1,708
Subtotal 2,254 2,241
Treated Product 1,101 0
Cleaning of pipelines/drinking 125 122
Subtotal 1,226 122
Treatment losses (filter backwash, etc.) 367 367
Grand total 5,598 4,243
CASE STUDY 5, TABLE Average Water Consumption and Wastewater Generation Rates of the Plant
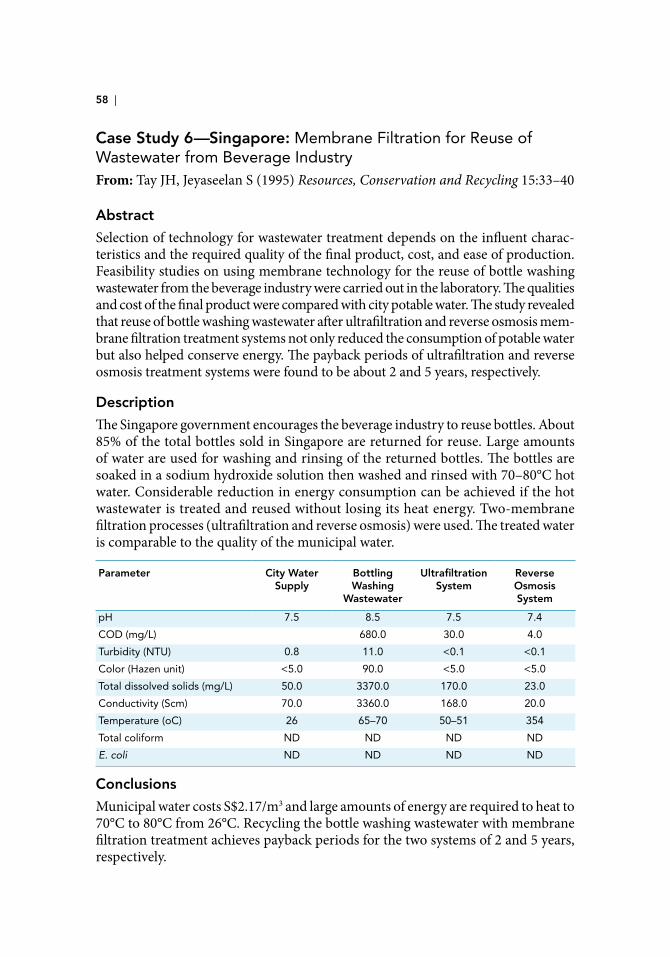
58 |
Case Study 6—Singapore: Membrane Filtration for Reuse of Wastewater from Beverage IndustryFrom: Tay JH, Jeyaseelan S (1995) Resources, Conservation and Recycling 15:33–40
Abstract
Selection of technology for wastewater treatment depends on the influent charac-teristics and the required quality of the final product, cost, and ease of production. Feasibility studies on using membrane technology for the reuse of bottle washing wastewater from the beverage industry were carried out in the laboratory. The qualities and cost of the final product were compared with city potable water. The study revealed that reuse of bottle washing wastewater after ultrafiltration and reverse osmosis mem-brane filtration treatment systems not only reduced the consumption of potable water but also helped conserve energy. The payback periods of ultrafiltration and reverse osmosis treatment systems were found to be about 2 and 5 years, respectively.
Description
The Singapore government encourages the beverage industry to reuse bottles. About 85% of the total bottles sold in Singapore are returned for reuse. Large amounts of water are used for washing and rinsing of the returned bottles. The bottles are soaked in a sodium hydroxide solution then washed and rinsed with 70–80°C hot water. Considerable reduction in energy consumption can be achieved if the hot wastewater is treated and reused without losing its heat energy. Two-membrane filtration processes (ultrafiltration and reverse osmosis) were used. The treated water is comparable to the quality of the municipal water.
Parameter City Water Supply
Bottling Washing
Wastewater
Ultrafiltration System
Reverse Osmosis System
pH 7.5 8.5 7.5 7.4
COD (mg/L) 680.0 30.0 4.0
Turbidity (NTU) 0.8 11.0 <0.1 <0.1
Color (Hazen unit) <5.0 90.0 <5.0 <5.0
Total dissolved solids (mg/L) 50.0 3370.0 170.0 23.0
Conductivity (Scm) 70.0 3360.0 168.0 20.0
Temperature (oC) 26 65–70 50–51 354
Total coliform ND ND ND ND
E. coli ND ND ND ND
Conclusions
Municipal water costs S$2.17/m3 and large amounts of energy are required to heat to 70°C to 80°C from 26°C. Recycling the bottle washing wastewater with membrane filtration treatment achieves payback periods for the two systems of 2 and 5 years, respectively.
Guideline for Water Recovery and Reuse | 59
Case Study 7—United States: Sustainable, Cost-Saving Best Management Practices for Dairy Plants
The primary objective was to address wastewater management and reuse oppor-tunities at dairy facilities while achieving full compliance with effluent limits. The approach that the company developed was well aligned with sustainability, and water reuse and conservation, and was anticipated to provide substantial benefits to finan-cial performance, and to the communities in which company facilities are located.
Two facilities were examined: a combined dairy and bakery in Southern California, and a combined dairy and ice cream plant in Washington State. Sewer surcharge costs were projected to increase significantly over the next 3 years at the Southern California facility. Advanced treatment involving a membrane bioreactor (MBR) was investigated as a means to reduce BOD/COD and suspended solids (SS) loading in the effluent. Surcharge rates are a function of wastewater strength and volume, so MBR would reduce wastewater strength associated surcharge costs. Reuse options were irrigation water for adjacent properties, wash water for truck cleaning, and general recycled water feed to existing local purple lines. Preliminary estimates indicated savings of $25 million on surcharge fees over the project life, with a payback period on the capital investment of approximately 4 years.
At the Washington State facility, the company was struggling to maintain compliance with effluent pH and floatable oil and grease (FOG) limitations in their industrial wastewater discharge permit. Fines for non-compliance could exceed $25,000 per day per violation. A fast-track design of a pH and FOG control system was initiated and a consultant recommended improving wastewater management practices upstream of treatment to maintain compliance and reduce wastewater management costs. The selected design would provide 100% compliance with discharge provisions, and an effluent sampling program would lay the groundwork for future water reuse options. A MBR pilot has been identified and is under evaluation as the first step toward meeting wastewater management and water reuse goals.
An expanded Water/Waste Management Plan (WWMP) was developed to provide the data necessary to evaluate potential process adjustments and support for struc-tural wastewater treatment processes. Typically, up to 30% of dairy plant losses can be eliminated by improved operational practices. A WWMP aims at eliminating preventable losses and applying engineering improvements to minimize these losses. Accordingly, a WWMP will provide a double benefit: reducing wastewater treatment and sewage discharge fees, and increasing revenue by limiting lost or unrecoverable product and saving costs on water purchases.
Implementation of a program for maintaining compliance, upgrading/adding wastewater treatment technologies to existing equipment, and exploring water conservation methods and process best practices are not without challenges. These challenges included retrofitting existing wastewater infrastructure while maintaining

60 |
uninterrupted, 24-hour operation of the manufacturing process, which often repre-sented thousands of dollars of product per minute. Additionally, smaller footprints for new infrastructure were often mandatory, as existing floor space was already allocated to production processes. Process modifications to improve facility water use and conservation methods required extensive investigation of current practices, and future training of employees in new best practices.
Guideline for Water Recovery and Reuse | 61
Case Study 8—Canada: An Apple Processing Facility Addresses Limited Access to Municipal Water and Wastewater Services
In 2009, an apple processing plant, located in Southern Ontario, Canada, did not have access to municipal water or wastewater treatment services: Water for processing, washing, and sanitation was provided by two wells. The company installed a waste-water treatment system that could treat the wastewater from beverage processing and upgrade it to potable water standards, so it could be reused for sanitation and so forth in compliance with Canadian Food Inspection Agency (CFIA) strict standards.
Solution
ALTECH Technology Systems Inc. proposed a System HydroKleenÔ membrane bioreactor (MBR) with reverse osmosis (RO) to produce potable quality water for clean in place (CIP) process equipment and other sanitation activities. As an acti-vated sludge process with flow through aerobic and anoxic chambers, close to 100% of the organics would be degraded. The un-degraded organics and microbes could be separated by an ultrafiltration (UF) membrane and the concentrate would then be re-circulated to the head of the process so un-degraded organics get two passes through the bioreactor; hydraulic residence time is almost unlimited. The anoxic zone of the MBR is instrumental in de-nitrification and reacting with the dead microbes, substantially reducing the amount of waste sludge.
After the UF membrane, the permeate would be low in BOD, TSS, nitrogen, phos-phorous, and harmful bacteria. To upgrade to potable water standards, the water could pass through a RO system. Concentration levels would be “zero” for BOD, TSS, N, and P. Chlorine disinfection would maintain a low residual chlorine. Ultraviolet (UV) technology could also be used. Finally, a small amount of water from the RO concentrate would be discharged, with government approval, to a septic bed to purge the system of sodium salts. The build-up of salts would be the limiting factor for the number of times the water can be re-circulated.
Results
The fully automated System HydroKleen™ MBR was sized to process 10,000 gallons per day of process wastewater to potable water standards, per Ontario Drinking Water Legislation O. Reg 170 and O. Reg 319. The potable water was used for all flume water, tank cleaning, sanitation, CIP units, and all floor and equipment cleaning in compliance with CFIA regulations.
Inlet concentrations of organics from operations into the waste treatment system averaged between 4,000 and 6,000 mg/L BOD. After RO treatment, there are virtually no organics, total suspended solids, phosphorous, or nitrogen. Daily heterotrophic plate counts are now consistently below standards at less than 500 CFU/mL and no E. coli.

62 |
The original cost of the system was CAD $350,000, including engineering, fabrica-tion, installation, and automation. The system has been operating consistently and reliably for a number of years, delivering the required amount of high-quality water to ensure the process is satisfied and not disrupted. Algoma Orchards has since implemented many programs and innovations implementing water conservation and water sustainability.
Guideline for Water Recovery and Reuse | 63
Case Study 9—Australia: Yatala Brewery, Queensland
From: Foxall C (2011) 20 Years of Beers: Becoming the World Benchmark in Water Consumption. Presented at the QWestnet Sustainability Forum, 10 June 2011.
All types of wastewater produced in the brewery with the exception of reverse osmosis brine discharge are treated and recycled.
Wastewater is subject to:
■ Pre-screening ■ Clarification and acidification ■ Anaerobic treatment leading to reduction in COD and the production of
biogas (85%–90% methane*), which is used as a fuel source for boilers ■ Dissolved air flotation (DAF) ■ Moving bed bioreactor ■ Microfiltration and reverse osmosis ■ Advanced oxidation (UV light/titanium dioxide) ■ Chlorination
Recycled water is used for cleaning, including the first rinse of storage vessels, boiler feed, and cooling tower make-up.
The benefits include water savings of 1.3–1.5 mL/d, wastewater discharges reduced to 0.8 L per liter of beer, greatly reduced discharges of COD, and suspended solids. Water use reduced from 3.5 to 2.2 L per liter of beer.
* It is uncommon for brewery wastewater to produce biogas with 85%–90% methane; typically this is 60%–70%.
64
Appendix B Selected Citations
American Public Health Association (2012) Standard Methods for Examination of Water and Wastewater. American Public Health Association, Washington DC. Available from: http://www.standardmethods.org/.
Asano T, Burton F, Leverenz H, Tsuchihashi R, and Tchobanoglous G; Metcalf & Eddy Inc (2006) Water Reuse Issues Technologies and Application. New York, NY: McGraw-Hill. Available from: http://www.mhprofessional.com/product.php?isbn=0071459278.
Beverage Industry Environmental Roundtable (BIER) (2007) Water Use Benchmarking in the Beverage Industry, Trends and Observations.
Beverage Industry Environmental Roundtable (BIER) (2012) Water Use Benchmarking in the Beverage Industry - Trends and Observations in 2011. Available from: http://www.biero-undtable.com/files/BIER Water Use Benchmarking Report 2012.pdf.
California Department of Health (2009) Regulations Related to Recycled Water. Available from: http://www.cdph.ca.gov/certlic/drinkingwater/Documents/Recharge/Purplebookupdate6-01.PDF (Accessed November 2011).
Codex Alimentarius (2003) General Principles of Food Hygiene CAC/RCP 1–1969. Available from: http://www.codexalimentarius.org/standards/list-of-standards/en/?provide=stand-ards&orderField=fullReference&sort=asc&num1=CAC/RCP%20 (Accessed March 2012).
Codex Alimentarius (2011) Natural Mineral Waters CAC/RCP 33-1985. Available from: http://www.codexalimentarius.org/download/standards/224/CXP_033e.pdf.
enHealth (2011) Guidance on Use of Rainwater Tanks. Available from: http://www.ircsa.org/factsheets/Cunliffe.pdf (Accessed November 2011).
Environment Protection and Heritage Council, the Natural Resource Management Ministerial Council and the National Health and Medical Research Council (EPHC, NRMMC, NHMRC) (2006–2009) Australian Guidelines for Water Recycling. Available from: http://www.recycledwater.com.au/index.php?id=16%20 (Accessed November 2011).
European Council Drinking Water Directive (98/83/EC). Available from: http://ec.europa.eu/environment/water/water-drink/index_en.html (Accessed October 2012).
Food and Agriculture Organization of the United Nations (FAO) (1997) Hazard Analysis and Critical Control Point (HACCP) System and Guidelines for its Application. United Nations Food and Agriculture Organization; CAC/RCP 1-1969, Rev. 3. Available from: http://www.fao.org/docrep/005/Y1579E/y1579e03.htm.
Food Standards Australia and New Zealand (FSANZ) (n.d.) Australia New Zealand Food Standards Code. Available from: http://www.foodstandards.gov.au/foodstandards/food-standardscode.cfm (Accessed November 2011).
Foxall C (2011) 20 Years of Beers: Becoming the World Benchmark in Water Consumption. Presented at the QWestnet Sustainability Forum, 10 June 2011. Available from: http://biero-undtable.com/files/BIER Benchmarking Publication 2012.pdf (Accessed November 2011).
Guideline for Water Recovery and Reuse| 65
Jiménez B (2011) Safe sanitation in low economic development areas, Treatise M.Sc. 82. In: Treatise on Water Science, edited by Wilderer P. Vol. 4. Oxford: Academic Press. pp 147–201. Available from: http://www.sciencedirect.com/science/referenceworks/9780444531995#ancv0025.
National Health and Medical Research Council, Natural Resource Management Ministerial Council (2011) Australian Drinking Water Guidelines. Australian Government. Available from: http://www.nhmrc.gov.au/guidelines/publications/eh52.
New South Wales Food Authority (2008) Water Reuse Guideline: Food Businesses Considering Reusing Water. Available from: http://www.foodauthority.nsw.gov.au/_Documents/indus-try_pdf/water-reuse-guidelines.pdf (Accessed November 2012).
North Carolina (2005) Public Utilities Handbook. (Accessed December 2011)SABMiller (2010) Water Futures: Working Together for a Secure Water Future. Available from:
(Accessed March 2012).Schets FM, Italiaander R, van den Berg HHJL, and de Roda Husman AM (2010) Rainwater
harvesting: quality assessment and utilisation in the Netherlands. Journal of Water and Health 8: 224–235. Available from: http://www.iwaponline.com/jwh/008/jwh0080224.htm.
Tchobanoglous G, Burton F, and Stensel D; Metcalf & Eddy Inc (2003) Wastewater Engineering Treatment and Reuse. 4th ed. New Delhi: McGraw-Hill. pp. 1819. Available from: http://www.mcgraw-hill.co.uk/html/1259010791.html.
U.S. Department of Health and Human Services (US DHHS) (2009) US Food Code. (Accessed March 2012).
U.S. Environmental Protection Agency (US EPA) (1999) Alternative Disinfection and Oxidants Manual. EPA 815-R-99-014, April 1999. Available from: http://www.epa.gov/ogwdw000/mdbp/alternative_disinfectants_guidance.pdf.
U.S. Environmental Protection Agency (US EPA) (2006) National Primary Drinking Water Regulations: Long Term Enhanced Surface Water Treatment Rule. Federal Register, Vol. 71, No. 3. Available from: http://www.epa.gov/lt2/ (Accessed November 2012).
U.S. Environmental Protection Agency (US EPA) (2012a) Guidelines for Water Reuse. Available from: http://www.waterreuseguidelines.org/.
U.S. Environmental Protection Agency (US EPA) (2012b) National Primary Drinking Water Regulations. Title 40 Protection of Environment, Chapter 1 – Environment Protection Agency, Part 141. Available from: http://water.epa.gov/action/advisories/drinking/upload/dwstandards2012.pdf (Accessed April 2012).
Victorian Department of Human Services (2008) Cooling Towers and Recycled Water. Available from: http://www.health.vic.gov.au/environment/downloads/cooling_towers.pdf (Accessed November 2011).
World Health Organization (WHO) (2005) Water Safety Plans: Managing Drinking-Water Quality from Catchment to Consumer. WHO/SDE/WSH/05.06. Available from: http://www.who.int/water_sanitation_health/dwq/wsp170805toc.pdf (Accessed March 2012).
World Health Organization (WHO) (2007) Chemical Safety of Drinking-Water: Assessing Priorities for Risk Management. Available from: http://www.who.int/water_sanitation_health/dwq/dwchem_safety/en/ (Accessed March 2012).
World Health Organization (WHO) (2011) Guidelines for Drinking-Water Quality. 4th ed. Available from: http://www.who.int/water_sanitation_health/publications/2011/dwq_guidelines/en/ (Accessed November 2012).
66
Appendix CTerminology / Glossary
Analytical Methods Validation: The process by which it is established, by laboratory studies, that the performance characteristics of the method meet the requirements for the intended analytical applications. (FDA Guidance, part 7. Manufacturing, Processing, or Holding Active Pharmaceutical Ingredients.). Biochemical Oxygen Demand (BOD): An indirect measurement of the amount of organic com-ponents that can be biologically oxidized in a sample of water. The result of a BOD test indicates the amount of water-dissolved oxygen consumed by microbes in a water sample incubated in darkness for 5 days at 20°C. Calibration: The set of operations that establish, under specified conditions, the relationship between values indicated by a measuring instrument or measuring system, or values represented by material measure and the corresponding values of the measurand.Chemical Oxygen Demand (COD): The COD test procedure is based on the chemical oxida-tion of organic and inorganic contaminants, dissolved or suspended in water. The result of a COD test indicates the amount of water-dissolved oxygen (expressed as parts per million or mil-ligrams per liter of water) consumed by the contaminants, during 2 hours of oxidation in a solution of boiling potassium dichromate.Cleaning in Place (CIP): A method of cleaning the interior surfaces of pipes, vessels, process equipment, filters, and associated fittings, without disassembly.Codex Alimentarius: A body within the Food and Agricultural Organization of the United Nations that publishes a collection of internationally recognized standards, codes of practice, guidelines, and other recommendations relating to foods, food production, and food safety.Conductivity (also known as EC or SC): The electrical conductivity of water estimates the total amount of ionic solids (salinity) dissolved in water. The electrical conductivity of the water depends on the water temperature. The electrical conductivity of water increases by 2–3% for an increase of 1°C of water temperature. Consumptive Use: The usage of water in a process that diminishes the total amount available.Critical Control Point (CCP): A point, step, or procedure at which controls can be applied and a safety hazard can be prevented, eliminated, or reduced to acceptable (critical) levels.Critical Limits: A critical limit is the maximum or minimum value to which a physical, biological, or chemical hazard must be controlled at a critical control point to prevent, eliminate, or reduce it to an acceptable level.End Use: The final, intended use of specific waters.Global Food Safety Initiative (GFSI): was founded in 2000 with the goal of improvement of the food safety systems by benchmarking existing food standards against guidelines established by retailers, food manufacturers, consumers, and food safety experts. The worldwide harmoniza-tion of food safety standards would increase the transparency and efficiency in the supply chain, reduce costs, and provide assurance of safe food for consumers
Guideline for Water Recovery and Reuse | 67
Hazard Analysis Critical Control Point (HACCP): A systematic preventive approach to food, water safety, and pharmaceutical safety that addresses physical, chemical, and biological hazards by means of prevention rather than finished product inspection.International Standards Organization (ISO) 22000: A standard that can be used to measure the success of a company’s implementation of HACCP, as well as prerequisites to HACCP and quality systems.Mainswater: Water supplied from a municipal and/or primary distribution center.Multiple Barrier Treatment (MBT): Is an integrated system of procedures, processes, and tools that collectively prevent or reduce the contamination of drinking water from source to tap in order to reduce risks to public health.Nephelometric Turbidity Units (NTU): Turbidity is a measure of the light scattering ability of suspended matter in the water and is often expressed as NTU.Ongoing Validation: Control activities of the method characterize taken during ongoing testing to approve the method control and that the validation results are valid. (ISRAC Validation policy, 1-661004, version 04, 2007.) Pilot Plant: A scaled version of a bottling or processing facility that allows testing, validation, and modification of a water safety plan, HACCP plan, or water recovery plan before full-scale implementation.Prospective Validation: Validation conducted prior to the distribution of either a new product, or product made under a revised manufacturing process, where the revisions may affect the product’s characteristics. Retrospective Validation: Validation of a process for a product already in distribution based upon accumulated production, testing, and control data. (FDA, “Guidelines on General Principles of Process Validation.” Rockville, MD, May 1993, updated 2009.)Re-validation: Repeating validation for method that already had validation. (ISRAC Validation policy, 1-661004, version 04, 2007.)Reverse Osmosis (RO): A membrane technology method that removes most types of molecules and ions from solutions by applying pressure to the solution when it is on one side of a selective semipermeable membrane.Total Dissolved Solids (TDS): The solid material dissolved in water is measured as the mass of residue remaining when a measured volume of filtered water is evaporated.Total Organic Carbon (TOC): The amount of carbon bound in an organic compound; often used as a non-specific indicator of water quality or cleanliness of pharmaceutical manufacturing equipment.Validation: Establishing documented evidence that provides a high degree of assurance that a specific process will consistently produce a product meeting its predetermined specifications and quality attributes. Water Recovery: Capture of water within a facility that may be used for another purpose, thereby reducing the overall amount of water required to supply all of the processes at that facility.Water Recovery Plan (WRP): A plan to ensure safe recovery of water to serve as a source of water after treatment to meet desired water quality.Water Safety Plan (WSP): A HACCP type plan to ensure the safety of drinking water through the use of a comprehensive risk assessment and risk management approach that encompasses all steps in water supply from catchment to consumer.
68
Appendix DWater Contaminant Concerns
Few chemicals have been shown to cause adverse health effects in humans through drinking water, and concerns are almost exclusively from exposure. Arsenic and
fluoride that occur naturally in some groundwaters at excess levels are known to cause cancer (As) or skeletal problems (F). Copper extraction from new pipework can reach very high concentrations especially in contact with aggressive liquids and this can cause gastric irritation on immediate exposure. For most chemicals, international and national standards are developed as benchmarks to judge levels above which margins of safety begin to be eroded. However, chemical, microbial, and physical contaminants can also affect product by adversely affecting taste, odor, or appearance.
Most of the contaminants considered below arise as raw water issues, although some come from treatment processes for municipal drinking water or as used in the bot-tling plant. Materials that come into contact with water as distributed through the plant may also be important, as will the chemicals that are used for processes such as bottle washing. The latter will be present in much higher concentrations and will therefore be of particular consideration.
Contaminants from Natural Sources
Inorganic constituents vary significantly in water concentration. Those of greatest interest are arsenic, fluoride, and nitrate. Others of interest are boron, nickel, sele-nium, and uranium. Natural iron and manganese can cause taste and discoloration at relatively low concentrations.
Surface waters may also suffer from blooms of cyanobacteria (blue-green algae), which are usually intermittent. These organisms can produce substances that cause taste and odor in water and others that can interfere with water treatment. In addition, a high proportion of blooms produce substances that are toxic. Of these, microcystins are a group of substances that are toxic to the liver; a WHO guideline value exists for one of the most commonly encountered and most toxic.
Contaminants from Agricultural Activities
These contaminants fall into two main categories: nutrients (nitrate and phosphate) and pesticides. Agriculture can also make a contribution to emerging contaminants through veterinary pharmaceuticals excreted into animal feces and urine that may reach surface water through run-off and poor handling of slurry.
Guideline for Water Recovery and Reuse | 69
Contaminants from Industrial Sources and Human Dwellings
There is a wide range of substances used in industry that can contaminate water sources. These can reach water from their presence in urban and industrial waste-water, or through spills in industrial premises. Apart from fuels, there are several groups of organic and inorganic substances, including metals such as chromium VI, nickel, and cadmium; hydrocarbons such as styrene and the BTEX (benzene, toluene, ethyl benzene, xylenes) group of substances, which are of concern because of their low taste and odor thresholds; chlorinated substances that are primarily of concern for groundwater include tri- and tetrachloroethane; and carbon tetrachlo-ride. Contaminants such as 1,4-dioxane can be present as solvent stabilizers.
Contaminants from Water Treatment and Materials Used in Contact With Water
A number of contaminants, particularly aluminum and acrylamide, may be intro-duced from coagulation, if treatment processes are not optimized. Trihalomethanes and haloacetic acids are representatives of a range of chlorination byproducts that are formed by the reaction of chlorine with natural organic matter in the water. Other byproducts of interest in beverage manufacturing and bottling are bromate from ozonation or electrolytic generation of hypochlorite, as well as chlorate from breakdown of stored hypochlorite, and chlorate and chlorite from chlorine dioxide.
Contaminants from materials used in contact with drinking water include organic substances such as vinyl chloride, and corrosion-related metals such as iron, nickel, antimony, chromium VI, lead, and copper. Polynuclear aromatic hydrocarbons like benzopyrene may be found as a consequence of old coal tar linings on cast iron water mains. It is important to ensure use of appropriate pipe and materials in beverage production facilities to prevent any significant problems from arising.
Water distribution system piping is also a potential source of contaminants such as heavy metals that may be released from scale or corrosion in the piping, or microbial contaminants that could be released from biofilms.
Contaminants from Bottling Plant Processes
Most of the above substances are primarily of concern for raw water entering the plant, except for those associated with water treatment and materials in contact with water. In the bottle washing process, there will be several chemicals, particularly caustic, used in cleaning. In addition, there is the potential for substances that may be contaminants in the returned bottles due to subsequent misuse of the container. These will be diluted in the washing process and will also be removed in treatment for reuse. Such contaminants could include oils and greases or even pesticides; thus, treatment will be established for their removal based on experience in the plant.
Overall, the impact of chemicals in the washing process is likely to be small because after treatment they will only be present in trace concentrations and small amounts
70 |
might be potentially left on the inside of the bottles. Therefore, there will be only a small chance of there being a risk of detection in the final product and a small chance of risk to the health of consumers.
Emerging Contaminants
As analytical procedures have improved, it has been possible to detect an increasing number of substances at very low concentrations in the low ng/L (parts per trillion) range. Most of these substances are found in urban sanitary wastewater, although not exclusively. They are, therefore, a feature primarily of surface waters impacted by treated sewage effluent.
Among the substances of interest are human hormones and synthetic hormones, particularly estrogens, because these have been shown to cause changes in male fish close to effluent discharges. Humans excrete these hormones, and so there is no simple answer, although where there is reasonable wastewater treatment, there will be some removal and they can be readily removed in drinking water treatment.
A range of pharmaceuticals and their metabolites have been identified in wastewater and river water, as well as some in drinking water. Although assessments indicate that risks are small, public perception is likely to play a key role. The WHO does not recommend routine monitoring at this stage, but they should be considered in any risk assessment, especially in areas with poor regulatory control of pharmaceutical manufacturing facilities.
Microbial Concerns
Human health-related concerns caused by pathogenic microorganisms, which include certain bacteria, viruses, protozoa, molds, and regrowth bacteria. Appropriate water treatment processes can remove essentially all of these microorganisms.
Aesthetic Contaminants of Concern
There are contaminants that are more typically associated with aesthetic consider-ations that may damage product in beverage operations. These include taste, color, odor, hardness, pH, turbidity, iron, manganese, and total dissolved solids.
Taste and odor issues are most applicable for scenarios in which there is direct sig-nificant contact of recovered water with product. They may be associated with the presence of trace volatile contaminants (e.g., sulfides) or even microbial (e.g., algal products). Identifying the causes of a taste issue is always challenging, but a useful approach is to use flavor profile analysis (American Public Health Association, 2012) to identify potential sources of taste and odor problems.
Color is typically associated with the presence of either some types of organic mate-rials or in some cases inorganics such as iron and manganese. Although color is mainly an issue again for direct contact applications, if the color originates from compounds that may precipitate out (e.g., iron or manganese) that could either create
Guideline for Water Recovery and Reuse | 71
a perception issue or perhaps impact heat transfer. It could be a potential issue for beverage producers.
Hardness, like color, could have significant impact on a beverage itself as well as the associated taste; however, hardness is also an issue whenever there is a potential for precipitation (e.g., calcium carbonate scale build-up) such as on cooling towers or boilers.
Turbidity can adversely affect the appearance of a product and can be indicative of potential microbial growth or inadequate filtration treatment.
pH is principally an issue with potential pipe corrosion as well as product quality. In general pH of any recovered water should be maintained in a low corrosivity range, neutral to slightly basic (i.e., 6.5–9).
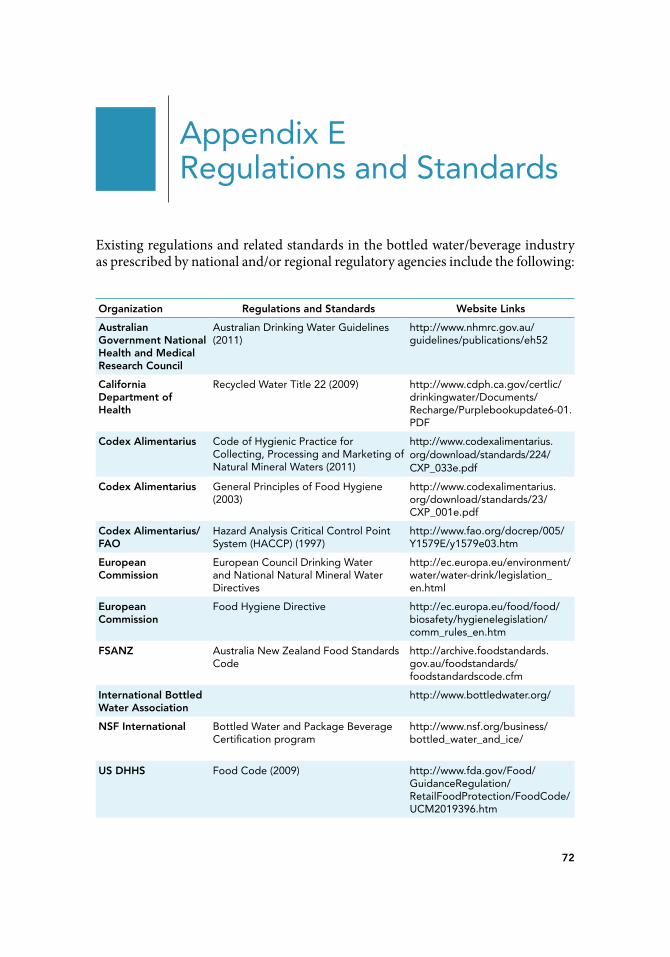
72
Appendix ERegulations and Standards
Existing regulations and related standards in the bottled water/beverage industry as prescribed by national and/or regional regulatory agencies include the following:
Organization Regulations and Standards Website Links
Australian Government National Health and Medical Research Council
Australian Drinking Water Guidelines (2011)
http://www.nhmrc.gov.au/guidelines/publications/eh52
California Department of Health
Recycled Water Title 22 (2009) http://www.cdph.ca.gov/certlic/drinkingwater/Documents/Recharge/Purplebookupdate6-01.PDF
Codex Alimentarius Code of Hygienic Practice for Collecting, Processing and Marketing of Natural Mineral Waters (2011)
http://www.codexalimentarius.org/download/standards/224/CXP_033e.pdf
Codex Alimentarius General Principles of Food Hygiene (2003)
http://www.codexalimentarius.org/download/standards/23/CXP_001e.pdf
Codex Alimentarius/FAO
Hazard Analysis Critical Control Point System (HACCP) (1997)
http://www.fao.org/docrep/005/Y1579E/y1579e03.htm
European Commission
European Council Drinking Water and National Natural Mineral Water Directives
http://ec.europa.eu/environment/water/water-drink/legislation_en.html
European Commission
Food Hygiene Directive http://ec.europa.eu/food/food/biosafety/hygienelegislation/comm_rules_en.htm
FSANZ Australia New Zealand Food Standards Code
http://archive.foodstandards.gov.au/foodstandards/foodstandardscode.cfm
International Bottled Water Association
http://www.bottledwater.org/
NSF International Bottled Water and Package Beverage Certification program
http://www.nsf.org/business/bottled_water_and_ice/
US DHHS Food Code (2009) http://www.fda.gov/Food/GuidanceRegulation/RetailFoodProtection/FoodCode/UCM2019396.htm
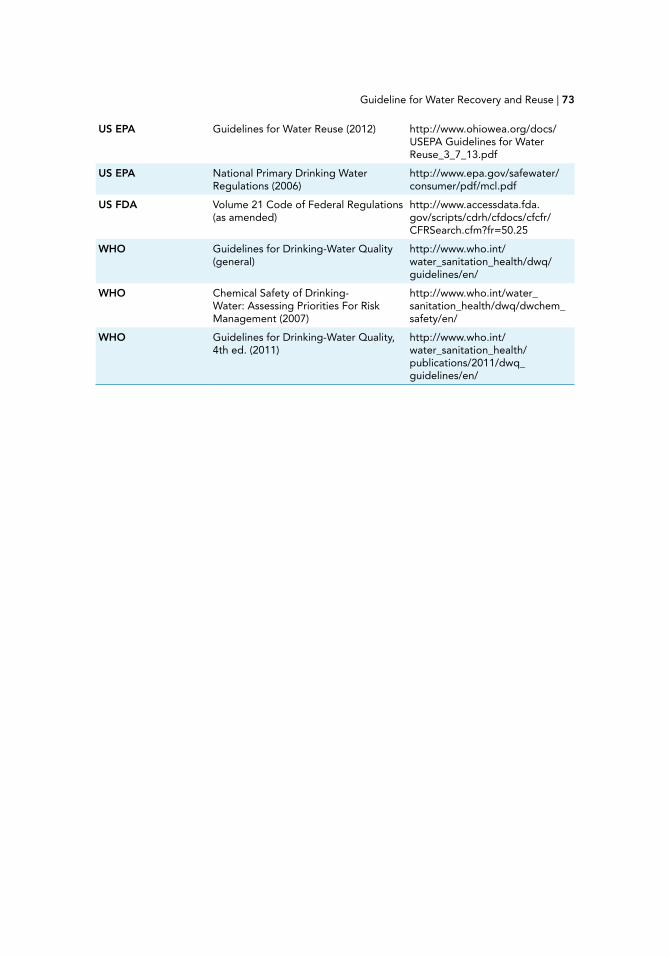
Guideline for Water Recovery and Reuse | 73
US EPA Guidelines for Water Reuse (2012) http://www.ohiowea.org/docs/USEPA Guidelines for Water Reuse_3_7_13.pdf
US EPA National Primary Drinking Water Regulations (2006)
http://www.epa.gov/safewater/consumer/pdf/mcl.pdf
US FDA Volume 21 Code of Federal Regulations (as amended)
http://www.accessdata.fda.gov/scripts/cdrh/cfdocs/cfcfr/CFRSearch.cfm?fr=50.25
WHO Guidelines for Drinking-Water Quality (general)
http://www.who.int/water_sanitation_health/dwq/guidelines/en/
WHO Chemical Safety of Drinking-Water: Assessing Priorities For Risk Management (2007)
http://www.who.int/water_sanitation_health/dwq/dwchem_safety/en/
WHO Guidelines for Drinking-Water Quality, 4th ed. (2011)
http://www.who.int/water_sanitation_health/publications/2011/dwq_guidelines/en/


1.202.659.0074 telephone1.202.659.3859 facsimilewww.riskscience.org
1156 15th Street, NW Suite 200Washington, DC 20005