water quality monitoring from space content/dhi...water quality problems, such as identification of...
TRANSCRIPT

© D
HI
SATELLITE-BASED WATER QUALITY MONITORING
Monitoring of water quality is essential in order to characterize waters and identify
changes or trends in water quality over time, or to be able to respond to emerging
water quality problems, such as identification of sediment plumes, harmful algae
blooms and red tides.
Satellite based remote sensing is recognized as a reliable and cost-effective
technique for describing and quantifying aspects of marine water quality. Using
satellite data archives dating back to 2000, it is possible to establish the long-term
baseline conditions for any region of the World. Using near real-time satellite data in
the operational mode, it is equally possible to derive the current environmental
situation on both the local and regional scale. With a web-based solution, up-to-date
information can be made available with only a few hours delay.
SUMMARY
CLIENT
Infrastructure companies, ports, marine contractors, environmental authorities, oil & gas industry, consultants and contractors
CHALLENGE
Unavailability of historical water quality baseline of an area
Need to monitor the environmental impact of sediment spill during marine construction works
Need to separate the effect of marine construction work from natural occurrence
High cost of traditional monitoring approaches at uncertain safety levels
SOLUTION
Frequently updated maps of baseline conditions based on historic satellite data
Operational data in near real-time made available by email, ftp server or through a web portal
VALUE
Daily information of the regional distribution allowing identification of levels and sources
Very cost-efficient approach compared to traditional in-situ monitoring and with no associated safety issues
Quick access to data from anywhere through a web browser, smart phone and other devices
Near real-time information with data delivery within hours after the satellite overpass
Reliable source of information – the method is well-proven and has been successfully applied globally
Accurate delineation of impact zone
DHI GRAS SOLUTION
WATER QUALITY MONITORING FROM SPACE
Baselines and up-to-date information
Example of a regional sediment map derived from satellite data in 250m resolution © DHI
GRAS / NASA
TYPICAL MONITORING PARAMETERS
Total Suspended Solids
The basic concept behind the TSS
retrieval is to relate the remotely sensed
reflectance measured in various parts of
the electromagnetic spectrum to
particulate matter concentration or
parameters of water column sediment. This approach has
proven robust in coastal and inland waters since scattering
from suspended materials typically dominates the reflectance
spectra when compared to the absorption characteristics of
pure water and phytoplankton. TSS values is derived in units
of mg/l.
Chlorophyll-a
The Chlorophyll-a product provides
estimates of the phytoplankton biomass
in the surface layer of the water body
provided as a measure of concentration.
Chlorophyll-a maps are therefore an effective measure of the
trophic state of the waters and illustrate the spatial variation
and distribution of phytoplankton abundance and biomass in
general of the upper surface layer. Chl-a values is derived in
units of µg/l.
Diffuse Attenuation Coefficient
The diffuse attenuation coefficient in
water indicates how strongly light
intensity at a specified wavelength
(490nm) is attenuated within the water
column. The diffuse attenuation coefficient is an indicator of
the turbidity of the water column – how visible light in the blue-
green part of the spectrum penetrates the water column. It is
directly related to the presence of scattering particles in the
water column and the depth of the euphotic zone, and is
derived in units of m-1.
Sea Surface Temperature
With thermal infrared sensors it is
possible to measure very accurately the
sea surface temperature. Whereas the
sensor registers the signal coming from
the very top-surface layer the measured signal is calibrated to
provide the bulk temperature of the water body at app. 1 m.
depth. SST maps are useful for identifying the varying spatial
variation and flow patterns of the water masses as well as for
identifying frontal systems. SST is derived in units of Celsius
degrees.
Fluorescence Line Height
The fluorescence line height (FLH) is an
indicator of the amount of radiance
leaving the surface of the sea in areas of
the electromagnetic spectra where chlorophyll has the highest
fluorescence emission. FLH is therefore a useful parameter
for identification of areas with high chlorophyll concentrations
and is often linked to harmful algae blooms and red tides. The
FLH parameter is thereby very useful in relation to early
warning systems of e.g. bathing water applications (it is
possible to detect nearby occurrences of HABs or red tide and
issue relevant notifications) and to desalination plants (high
occurrence of algae may damage the filters in the plants –
filters that are very expensive to replace and – which could
lead to disrupted service of the affected plants with associated
consequences for both the plants and the public. FLH values
will be derived in units of mW cm-2
µm-1
sr-1
.
DELIVERABLES AND DISTRIBUTION
The water quality products can be delivered along with
Geodata (GeoTIFF, ASCII, or similar)
Metadata (INSPIRE or similar)
Cartographic presentations (PDF, PNG or similar)
The derived maps and information from the water quality mapping service is typically made available in one or more of the following three approaches:
An email can be dispatched to relevant recipients whenever new information is generated.
Data can be made available on a dedicated password protected ftp
server ready for the client to pull/push the data.
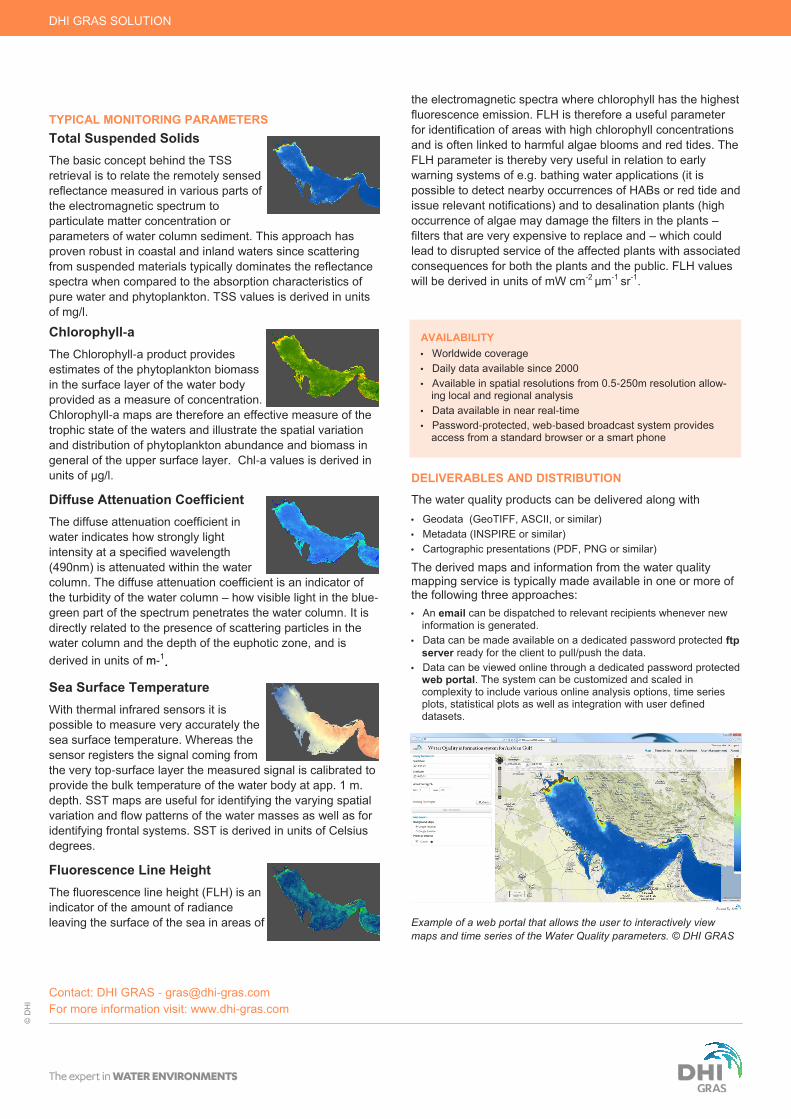
Data can be viewed online through a dedicated password protected web portal. The system can be customized and scaled in complexity to include various online analysis options, time series plots, statistical plots as well as integration with user defined datasets.
Contact: DHI GRAS - [email protected]
For more information visit: www.dhi-gras.com
DHI GRAS SOLUTION ©
DH
I
AVAILABILITY
Worldwide coverage
Daily data available since 2000
Available in spatial resolutions from 0.5-250m resolution allow-ing local and regional analysis
Data available in near real-time
Password-protected, web-based broadcast system provides access from a standard browser or a smart phone
Example of a web portal that allows the user to interactively view
maps and time series of the Water Quality parameters. © DHI GRAS