water quality in the western lake michigan drainages kelly warner, james cerveny, mary ann thomas,...
TRANSCRIPT

Water Quality in theWestern Lake Michigan Drainages
Wisconsin and Michigan, 1992–95
U.S. Department of the InteriorU.S. Geological Survey Circular 1156
science for a changing world

A COORDINATED EFFORT
Coordination among agencies and organizations is an integral part of the NAWQA Program. We thank the following agencies and organizations who contributed to the design of the studies and helped to review data presented in this report.
The following U.S. Geological Survey personnel responsible for implementing the NAWQA Program in the Western Lake Michigan Drainages are acknowledged for their dedication and hard work: Stephen Rheaume, James Setmire, Elise Giddings, Morgan Schmidt, Heather Whitman, Dale Weaver, Michelle Greenwood, Ross Bagwell, Brian Dalsing, Amy Matzen, Evan Bloyer, Lucy Fox, Bart Manion, Ty Sabin, James Rauman, Eileen Cashman, Travis Buros, Winston Nunes, Andrew Legg, Mitchell Harris, Donna Myers, John Tertuliani, Dennis Finnegan, Wallace Larson, James Ellis, John Knudsen, Kevin Metzker, Kelly Warner, James Cerveny, Mary Ann Thomas, Bill Morrow
Illustrations by Michelle M. Greenwood and Morgan A. SchmidtEdited by Michael Eberle and Betty PalcsakTechnical review by William C. Sonzogni, John Koss, and scientists on the NAWQA national synthesis teamManuscript preparation by Heather E. Whitman and Morgan A. SchmidtCover and interior photographs by U.S. Geological Survey, Wisconsin District personnel: Front cover - Peshekee River; Back
cover - Lower Fox River Valley (left), Popple River (center), farmland in southeastern Wisconsin (right)
• American Water Resources Association — Wisconsin Chapter
• Bay-Lake Regional Planning Commission• Brown County Regional Planning
Commission• East Central Wisconsin Regional Planning
Commission• Fox Wolf Basin 2000• Great Lakes Environmental Research
Laboratory• Green Bay Metropolitan Sewage District• Marquette County Land Conservation District• Menominee Tribe of Indians of Wisconsin• Michigan Department of Environmental
Quality• Michigan Department of Natural Resources• Milwaukee Metropolitan Sewerage District• National Oceanic and Atmospheric Agency• National Wildlife Federation
• The Nature Conservancy• North Central Wisconsin Regional Planning
Commission• Oneida Tribe of Indians of Wisconsin• Outagamie County Land Conservation
District• Portage County Land Conservation District• River Alliance of Wisconsin (Tomorrow/
Waupaca Watershed Association)• Sheboygan County Land Conservation
District• Southeast Wisconsin Regional Planning
Department• U.S. Army Corps of Engineers• U.S. Department of Agriculture• U.S. Department of the Interior• U.S. Environmental Protection Agency• U.S. Public Health Service• University of Wisconsin—Extension Service
• University of Wisconsin—Green Bay• University of Wisconsin—Madison• University of Wisconsin—Stevens Point• University of Wisconsin—Milwaukee• Wisconsin Academy of Sciences, Arts and
Letters• Wisconsin Department of Agriculture, Trade,
and Consumer Protection• Wisconsin Department of Natural Resources• Wisconsin Electric Power Company• Wisconsin Geological and Natural History
Survey• Wisconsin Project First• Wisconsin Sea Grant• Wisconsin State Climatologist• Wisconsin State Laboratory of Hygiene• Wolf River Lakes and Streams Association• Wolf River Trout Unlimited
Chief, NAWQA ProgramU.S. Geological Survey
12201 Sunrise Valley Drive, M.S. 413Reston, VA 20192
FOR ADDITIONAL INFORMATION ON THE NATIONAL WATER-QUALITY ASSESSMENT (NAWQA) PROGRAM:
Western Lake Michigan Drainages Study Unit, contact:
District Chief or NAWQA ChiefU.S. Geological Survey
8505 Research WayMiddleton, WI 53562
Information on the NAWQA Program is also available on the Internet via the World Wide Web. You may connect to the NAWQA Home Page using the Universal Resources Locator (URL)
http://wwwrvares.er.usgs.gov/nawqa/The Western Lake Michigan Drainages Study Unit’s Home Page is at URL:
http://wwwdwimdn.er.usgs.gov/nawqa/This Circular is also available on the Internet via the World Wide Web, at URL:
http://water.usgs.gov/lookup/get?circ1156

U.S. GEOLOGICAL SURVEY CIRCULAR
Water Quality in the Western Lake Michigan Drainages, Wisconsin and Michigan, 1992–95
1156
By C.A. Peters, D.M. Robertson, D.A. Saad, D.J. Sullivan, B.C. Scudder, F.A. Fitzpatrick, K.D. Richards, J.S. Stewart, S.A. Fitzgerald, and B.N. Lenz
CONTENTS
National Water–Quality Assessment Program ................... 1
Summary of major issues and findings................................. 2
Environmental setting and hydrologic conditions .............. 4
Major issues and findings........................................................ 8
Levels of some naturally occurring chemicals have the potential to affect human health and aquatic life ........ 8
Fertilizers and livestock wastes increase nutrientsin streams and ground water ......................................... 10
Various factors control pesticide occurrence instreams and ground water .............................................. 12
Urban areas are a source of trace elements andorganic compounds ......................................................... 14
Environmental setting and land use influenceaquatic life ......................................................................... 16
Water-quality conditions in a national context .................... 20
Study design and data collection ........................................... 24
Summary of compound detections and concentrations ..... 26
References .................................................................................. 32
Glossary ..................................................................................... 36
Italicized words are defined in the glossary.

Library of Congress Cataloging in Publications Data
The use of firm, trade, and brand names in this report is for identification purposes only anddoes not constitute endorsement by the U.S. Government
Free on application to theU.S. Geological Survey
Information ServicesBox 25286 Federal Center
Denver, CO 80225
U.S. DEPARTMENT OF THE INTERIOR
BRUCE BABBITT, Secretary
U.S. GEOLOGICAL SURVEY
Thomas J. Casadevall, Acting Director
Water quality in the Western Lake MIchigan Drainages, Wisconsin and Michigan, 1992–95 / by C.A. Peters ... [et.al.].
p. cm. -- (U.S. Geological Survey circular ; 1156)Includes bibliographic references (p. ).Supt. of Docs. no.: I 19.4/2:1156-GISBN 0-607-89146-7
1. Water quality--Michigan, Lake, Watershed. 2. Water quality--Michigan. 3. Water quality--Wisconsin. I. Peters, Charles A. II. Series.TD223.3.W38 1998363.739’42’09774 -- dc21
1998
98-20090
CIP
ISBN 0-607-89146-7

U.S. Geological Survey Circular 1156 1
Began in 1991
Began in 1994
Began in 1997
Not scheduled yet
EXPLANATION
“NAWQA has been enormously helpful in synthesizing data and developing a better understanding of a key ecoregion of the Great Lakes. Contributions from this study will be useful for years to come as this region is managed as an integrated natural resource.”
William C. Sonzogni,University of Wisconsin–Madison,State Laboratory ofHygiene
“The NAWQA program is generating water quality and ecological information that will be useful to the Oneida Environmental, Health and Safety Department in managing tribal water resources. As the Tribe engages in efforts to improve conditions of its watershed, NAWQA data and reports should serve as a reference against which future changes in water quality can be compared.”
Patrick J. Pelky,Oneida Tribe ofIndians of Wisconsin,Environmental, Health and SafetyDepartment
NATIONAL WATER-QUALITY ASSESSMENT PROGRAM
Knowledge of the quality of the Nation’s streams and aquifers is important becauseof the implications to human and aquatic health and because of the significant costsassociated with decisions involving land and water management, conservation, andregulation. In 1991, the U.S. Congress appropriated funds for the U.S. GeologicalSurvey (USGS) to begin the National Water-Quality Assessment (NAWQA) Programto help meet the continuing need for sound, scientific information on the areal extentof the water-quality problems, how these problems are changing with time, and anunderstanding of the effects of human actions and natural factors on water-qualityconditions.
The NAWQA Program is assessing the water-quality conditions of more than 50 ofthe Nation’s largest river basins and aquifers, known as Study Units. Collectively,these Study Units cover about one-half of the United States and include sources ofdrinking water used by about 70 percent of the U.S. population. Comprehensiveassessments of about one-third of the Study Units are ongoing at a given time. EachStudy Unit is scheduled to be revisited every decade to evaluate changes in water-quality conditions. NAWQA assessments rely heavily on existing information col-lected by the USGS and many other agencies as well as the use of nationally consis-tent study designs and methods of sampling and analysis. Such consistency simulta-neously provides information about the status and trends in water-quality conditionsin a particular stream or aquifer and, more importantly, provides the basis to makecomparisons among watersheds and improve our understanding of the factors thataffect water-quality conditions regionally and nationally.
This report is intended to summarize major findings that emerged between 1992and 1995 from the water-quality assessment of the Western Lake Michigan DrainagesStudy Unit and to relate these findings to water-quality issues of regional and nationalconcern. The information is primarily intended for those who are involved in water-resource management. Indeed, this report addresses many of the concerns raised byregulators, water-utility managers, industry representatives, and other scientists, engi-neers, public officials, and members of stakeholder groups who provided advice andinput to the USGS during this NAWQA Study-Unit investigation. Yet, the informa-tion contained here may also interest those who simply wish to know more about thequality of water in the rivers and aquifers in the area where they live.
Robert M. Hirsch, Chief Hydrologist

SUMMARY OF MAJOR ISSUES AND FINDINGSin the Western Lake Michigan Drainages
LEVELS OF SOME NATURALLY OCCURRING CHEMICALS HAVE THE POTENTIAL TO AFFECT HUMAN HEALTH AND AQUATIC LIFE. (p. 8)
Concentrations of naturally occurring constituents are variable in surface water and ground water of the study area. At some sites the concentrations exceed those considered harmful to human health and aquatic life.
• Dissolved solids concentrations above the United States Environmental Protection Agency’s (USEPA) secondary maximum contaminant levels (SMCL) for drinking water were detected in 26 percent of samples from the confined part of the drinking-water aquifer.
• Arsenic concentrations in fine sediments in streams exceeded the Ontario Ministry of Environment and Energy lowest effect level (LEL), for aquatic biota, at 48 percent of sites sampled and the severe effect level (SEL) at one site.
• Radon, a carcinogen, was detected in all 29 drinking-water aquifer wells sampled in the study area. Radon activities in 66 percent of the wells exceeded the previously proposed USEPA standard of 300 picocuries per liter (pCi/L).
• Concentrations of dissolved iron exceeded the previously proposed USEPA maximum contaminant level (MCL) for drinking water of 300 micrograms per liter (µg/L) in 38 percent of drinking-water aquifer wells sampled.
FERTILIZERS AND LIVESTOCK WASTES INCREASE NUTRIENT CONCENTRATIONS IN STREAMS AND GROUND WATER. (p. 10)
Phosphorus and nitrate concentrations in surface water and ground water are highest in agricultural land-use areas. Nutrient concentrations in surface waters were highest during periods of precipitation runoff.
• Ninety-six percent of anthropogenic phosphorus input to the study areais from fertilizer and livestock wastes.
• Median phosphorus concentrations in surface water at fouragricultural study sites exceeded the recommended USEPA limit todiscourage excessive biotic growth in flowing water of 0.1 milligrams per liter (mg/L).
• Analysis of historical data indicated that phosphorus concentrations insurface water downstream from urban areas decreased significantlyduring the 1970s due to the reduction of phosphorus in detergents and improvements in sewage-treatment facilities.
• Nitrate concentrations in surface water from 92 percent of samples from agricultural Indicator Sites were high enough to contribute to algal blooms (greater than 0.3 mg/L) observed at several sites.
• Nitrate concentrations exceeded the USEPA MCL (10 mg/L) during three storms at the East River agricultural Indicator Site, in 9 percent of the samples from the drinking water aquifer, and 22 percent of the surficialalluvial aquifer samples.
• Nitrate concentrations, in the shallow alluvial aquifer where the surficialdeposits were most permeable, exceeded the USEPA MCL in 37 percentof the samples.
WIS.
MICH.
2 WATER QUALITY IN THE WESTERN LAKE MICHIGAN DRAINAGES, WISCONSIN AND MICHIGAN, 1992–95

SUMMARY OF MAJOR ISSUES AND FINDINGSin the Western Lake Michigan Drainages
VARIOUS FACTORS CONTROL PESTICIDE OCCURRENCE IN STREAMS AND GROUND WATER. (p. 12)
Fifteen pesticides were detected in ground water and 33 in surface water. Drinking water standards for atrazine were exceeded in 6 percent of surface-water samples and standards for simazine and alachlor were exceeded in 1 percent of the samples.
• Pesticides commonly applied to farm fields were typically detected in surface water in intensively farmed areas at concentrations 100 times higher than in less intensively farmed areas.
• Atrazine was detected in all 143 surface water samples collected, including some at very low concentrations (0.005 mg/L) from forested areas. Detection in forested areas is probably due to the presence of pesticides in precipitation in the area.
• Highest concentrations of pesticides in surface water occur during runoff in agricultural areas soon after pesticide applications to the farm fields.
• Pesticides were detected in 97 percent of samples from surficial aquifers in intensively farmed areas underlain by relatively permeable surficial deposits. Concentrations of atrazine plus deethylatrazine exceeded the State of Wisconsin’s preventive action limit of 0.3 µg/L in 22 percent of surficial aquifer wells.
• Pesticides were detected in 25 percent of drinking water aquifer wellssampled. Eighty-six percent of these detections were in samples fromwells in the part of the aquifer not covered by the relativelyimpermeable Sinnipee unit.
URBAN AREAS ARE A SOURCE OF TRACE ELEMENTS AND ORGANIC COMPOUNDS. (p. 14)
Concentrations of cadmium, copper, mercury, nickel, lead, and zinc and of many toxic synthetic organic compounds were highest in fine sediments in streams that drained urban areas compared to other land uses.
• Concentrations of PCBs in streambed sediments and fish tissue are 10 times higher in large-river sites draining urban areas than in smaller urban, agricultural, or forested land-use areas.
• Concentrations of DDT remain high in streambed sediments in urban areas and large-river sites more than 20 years after being banned.
• Eight trace elements in fine streambed sediment exceeded established LEL for bulk sediment. The chromium LEL was exceeded in all 42 samples collected. The LEL is the concentration that 95 percent of benthic biota can tolerate.
• Eighty percent of semivolatile organic compounds (SVOCs) analyzed for were detected in at least one sample. Two classes of SVOCs (PAHs and phthalates) were detected more frequently and in higher concentrations at urban-affected sites.
ENVIRONMENTAL SETTING AND LAND USE INFLUENCE AQUATIC LIFE. (p. 16)
Water quality, as indicated by aquatic life, was most influenced by land use and type of surficial deposit.
• Aquatic life was most degraded in urban areas and least degraded in forested areas.
• Indexes of biotic integrity indicated degraded water quality at sites with clay surficial deposits.
• Water quality in streams in primarily agricultural areas was least degraded in the basins with the highest percentage of forested land use.
• In general, there was good agreement between biological indicator scores calculated for habitat, algae, benthic invertebrates, and fish.
U.S. Geological Survey Circular 1156 3

4 WATER QUALITY IN THE WESTERN LAKE MICHIGAN DRAINAGES, WISCONSIN AND MICHIGAN, 1992–95
The Western Lake Michi-gan Drainages Study Unit drains a 20,000-square-mile area in eastern Wisconsin and the Upper Peninsula of Michigan. The study area is comprised of the Fox-Wolf, Milwaukee, Menomi-nee, Oconto, and Peshtigo River Basins in Wisconsin and the Ford and Escanaba River Basins in Michigan.
The overall population in the study area is about 2,435,000 (U.S. Department of Commerce, 1991). Major cities include Mil-waukee, Green Bay, Racine, and Appleton. The Green Bay area, along the lower Fox River, has one of the highest densities of paper mills in the world. Lake Winnebago, a 137,000-acre lake in the Fox River Basin, is a major surface-water feature.
The primary water-quality issues in the study area include contamination and nutrient enrichment of surface water and ground water by agricultural chemicals, contamination of bed sediments of rivers and harbors by toxic substances, contamination and nutrient enrichment of rivers and lakes from industrial and municipal waste discharges, and acidification and mercury con-tamination of lakes and wet-lands in the forested part of the study area
ENVIRONMENTAL SETTING AND HYDROLOGIC CONDITIONSin the Western Lake Michigan Drainages
Source: Seaberand others, 1986.
89°
88°
87°
46°
45°
44°
43°
0 25 50 MILES
0 25 50 KILOMETERS
LakeWinnebago
MilwaukeeR
Wolf
R
Duc
k
Cr
Oconto R
Peshtigo R
Meno m
ineeR
FordR
EscanabaR
Fox R
Wolf R
Fox
R
La
ke
Mi c
hi g
an
Eas
tR
Gr e
en
Ba y
Peshekee
R
Popple R
Tomo rro w R
Pensaukee R
N.B
r.M
ilw.R
LincolnCreek
Green Bay
Milwaukee
Escanaba
EXPLANATION
Basin boundary
County boundary
Stream
Appleton
WISCONSIN
MICHIGAN
Racine

U.S. Geological Survey Circular 1156 5
Land use ranges from forests in the north toagriculture and urbanized land in the southern andeastern parts of the study area.
About 50 percent of the area is forested, with streamsand lakes offering excellent fishing, canoeing, and otherrecreational opportunities. Agriculture is a major activityin the study area, with 37 percent of the area devoted tocropland and pasture land.
The topography of the study area was shaped byglaciation. Surficial deposits range in thicknessfrom zero to several hundred feet.
The bedrock underlying the study area iscomposed of igneous, metamorphic andsedimentary (sandstone, carbonate, and shale)rock. Bedrock dips southeast toward LakeMichigan. The oldest rock subcrops in thenorthwest and the youngest in the southeast.
ENVIRONMENTAL SETTING AND HYDROLOGIC CONDITIONSin the Western Lake Michigan Drainages
89°
46°
45°
44°
43°
88°
87°
0 25 50 MILES
0 25 50 KILOMETERS
Igneous andMetamorphic
Gre
enBa y
La
keM
ichi
gan
SandstoneCarbonateShale
EXPLANATIONBedrock type
EXPLANATIONLand use
Forest
Gre
enBay
0 25 50 MILES
0 25 50 KILOMETERS
89°
46°
88°
87°
45°
44°
43°
La
keM
ichi
gan
WaterUrbanWetlandAgriculture
0
10
20
30
40
50
5
15
25
35
45
0
1,000
2,000
3,000
4,000
5,000
6,000
7,000
8,000
9,000
10,000
Forest
Agriculture
WetlandUrban
Water
AR
EA
, IN
SQ
UA
RE
MIL
ES
PE
RC
EN
TAG
E O
F T
OTA
L A
RE
ALAND USE IN 1983
89°
46°
88°
87°
45°
44°
43°
0 25 50 MILES
0 25 50 KILOMETERS
EXPLANATIONSurficial deposit
Sand and gravel
Gre
en
Bay La
keM
ich i
gan
PeatClayLoamSand

ENVIRONMENTAL SETTING AND HYDROLOGIC CONDITIONSin the Western Lake Michigan Drainages
TO
TA
L P
HO
SP
HO
RU
S C
ON
CE
NT
RA
TIO
N,
IN M
ILLI
GR
AM
S P
ER
LIT
ER
Agriculture Ag/Forest
Forest Urban
Ag1Ag23
Ag2Ag3
AF20F16
F22 U90.002
2.0
0.005
0.01
0.05
0.1
0.5
1.0RHU SitesIndicator Fixed SitesAverage concentrationin RHU
Water quality in the Western Lake Michigan Drainages is affected by natural and anthropogenic factors. In order to study the important water-quality issues, the basin was divided into 28 relatively homogeneous units (RHUs) with unique combinations of land use, surficial-deposit texture, and bedrock by overlaying digital thematic maps (p. 5) of these land features (Robertson and Saad, 1995).
Not all of the 28 RHUs could be sampled; therefore, specific RHUs were selected for sampling on the basis of the major water-quality issues in the RHU. Eleven stream sites, called Fixed Sites, were chosen to describe the variability in streamflow and concentrations of nutrients, major ions, sus-pended sediment, and biological communities. Eight of the 11 Fixed Sites were Indicator Sites, sites selected to repre-sent the quality of water draining from a specific RHU. Four Indicator Sites were on streams representing agricultural RHUs, two were on streams representing forested RHUs, and one each was on a stream representing an urban RHU and a mixed agriculture and forest RHU. The remaining three sites were Integrator Sites, sites located near the mouths of major rivers, where water quality is affected by various combinations of land use, surficial deposits, and bed-rock geology. Each of these 11 sites was sampled at least monthly for 2.5 years.
Additionally, short-term synoptic studies were done to better define the variability in water quality throughout the study area. Figures on p. 24 and the table on p. 25 provide details of those studies.
One of the synoptic studies was conducted to determine if monitoring results from the Indicator Fixed Sites were rep-resentative of specific RHUs and the basin as a whole. The Indicator Fixed Site data were compared to results from a study of 83 sites throughout the basin. Results of that study, conducted during base-flow conditions, indicate that the Indicator Fixed Sites provide a fair representation of specific RHUs and the entire basin.
Fixed site (RHU)Area(mi2)
Land use (percent)
Surficial deposit (percent)
Bedrock
Duck Cr. (Ag1) 95 Agriculture (89) Clay (76) Carbonates
Pensaukee R. (Ag2) 36 Agriculture (86) Loam (99) Carbonates
N. Br. Milwaukee R. (Ag3)
51 Agriculture (88) Sand (89) Carbonates
East R. (Ag23) 47 Agriculture (92) Clay (95) Shale
Tomorrow R. (AF20) 44 Agriculture (58)/Forest (31)
Sand (39)/Sand & Gravel (61)
Igneous/Metamorphic
Peshekee R. (F16) 49 Forest (98) Loam (100) Igneous/Metamorphic
Popple R (F22) 139 Forest (90) Sand (24)/Sand & Gravel (76)
Igneous/Metamorphic
Lincoln Cr. (U9) 10 Urban (100) Clay (100) Carbonates
Menominee R. 3,901 Integrator Integrator Integrator
Fox R. 6,035 Integrator Integrator Integrator
Milwaukee R. 688 Integrator Integrator IntegratorIndicator Fixed Site data are representative ofthe specific RHUs they were selected torepresent (Robertson, 1998).
Water quality in the Western Lake Michigan Drainages isaffected by natural and anthropogenic factors.
Fixed Sites in the Western Lake Michigan Drainages.
Indicator Fixed Site
RHU
Mixed area
Integrator Fixed Site
EXPLANATION
Abbreviat ionsAgFAF
U
Agricul ture
ForestAgr icul ture/ForestUrban
F19
Milwaukee R.
Fox R.
Menominee R.
Gre
enBay L
ake
Mic
hig
an
0 25 50 MILES
0 25 50 KILOMETERS
44°
43°
45°
46°
89°
88°
87°
F18
F19
F16
F22
F7
AF12
F7F14
F17
AF12F21
Ag24
Ag2Ag15AF20
F19
U9
U10
Ag2
Ag28
Ag27
Ag25
23
U9
U11AF26
Ag1
U9
F8
F14
Ag
AF5
F6
F13
Ag3
Ag1Ag4
Ag3
Ag3
U9
6 WATER QUALITY IN THE WESTERN LAKE MICHIGAN DRAINAGES, WISCONSIN AND MICHIGAN, 1992–95

ENVIRONMENTAL SETTING AND HYDROLOGIC CONDITIONSin the Western Lake Michigan Drainages
Ground water studies were also designed to look at the effects of land use, surficial deposit texture, and bedrock geology on water-quality variability. Ground water from the Cambrian-Ordovician aquifer, the most-used drinking-water aquifer in the study area, and from shallow aquifers associ-ated with agricultural land use and two different surficial deposits were sampled to indicate this variability.
Understanding hydrologic and climatic conditions is important for interpreting water-quality data. During wet-weather periods, runoff can carry materials into the stream from the land, and concentrations of nutrients, pesticides, and sediment can increase above those at normal streamflow. Periods of excessive precipitation can cause ground-water levels to rise, contributing a larger ground-water component to streamflow and causing changes in streamwater chemistry. During dry periods, point-source discharges to
streams may degrade stream-water quality. The seasonal tim-ing of precipitation can also affect stream-water quality. For example, precipitation causing runoff early in the growing season, before crops come up and after pesticides and fertil-izers have been applied, can produce significant potential for water contamination.
The average precipitation in the Wisconsin part of the study area during all of 1993 was about 39 inches, or 122 percent of the 30-year statewide average. Annual runoff in 1993 ranged from 240 to 280 percent of normal in the south-ern part of the study area. Precipitation in the study area measured about 31 inches during 1994 and about 29 inches during 1995. Annual runoff was near normal during both years.
Public suppliers provide about 371 million gallons of waterper day (Mgal/d), of which 69 Mgal/d is from ground-watersources. Rural domestic users obtain about 21 Mgal/d, ofwhich 13 Mgal/d is from ground-water sources. LakesMichigan and Winnebago provide most of the surface-watersupply (Horn, written communication, 1997).
Extensive flooding occurred in the study area in the spring of1993. These photos of the North Branch of the Milwaukee Riverwere taken from near the same location (note location of bridgeabutment) during normal flows in 1995 and during the spring1993 floodflows.
Annual discharge measured at the Milwaukee River in 1993was the fourth largest recorded since the start ofmeasurement (historical streamflow data covers the periodof record from 1914–96).
Water use in the Western Lake Michigan DrainagesPrecipitation varies seasonally with 60 percent occurringbetween May and September (Peters, 1997). The 1993 growingseason was much wetter than normal and was the wettest periodduring the 3-year investigation.
PR
EC
IPIT
AT
ION
, IN
INC
HE
S,
AT
ST
EV
EN
S P
OIN
T, W
IS.
AV
ER
AG
E P
RE
CIP
ITA
TIO
N (
1961
-90)
, IN
INC
HE
S, A
T S
TE
VE
NS
PO
INT
, WIS
.
FMA MJ JA SOND J FMAM J JA SOND J FMAM J J ASON1993 1994 1995
10
8
6
4
2
0
10
8
6
4
2
0J D
1212
Long-term average precipitation, 1961-90 Monthly precipitation during study
10,000
10
100
1,000
1994
DIS
CH
AR
GE
,IN
CU
BIC
FE
ET
PE
R S
EC
ON
D Milwaukee River at Milwaukee, Wis.
1993 1995A M J J A S O N D J F MA M J J A S O N D J F MA M J J A S
DischargeMiddle 60 percent of historical streamflow
5,0004,5004,0003,5003,0002,5002,0001,5001,000
5000
1009080706050403020100
(580)(1,991)
PE
RC
EN
TAG
E O
F T
OTA
LW
AT
ER
WIT
HD
RA
WA
LS
ES
TIM
AT
ED
WA
TE
R W
ITH
DR
AW
ALS
IN 1
990,
IN M
ILLI
ON
S O
F G
ALL
ON
S P
ER
DA
Y
Total
Public supply
Domestic supply
Commercial
Industrial and mining
Irrigation and liv
estock
Thermoelectric
Ground waterSurface waterPopulations served,in thousands
(1,991)
U.S. Geological Survey Circular 1156 7

MAJOR ISSUES AND FINDINGSLevels of Some Naturally Occurring Chemicals Have the Potential to Affect Human
DIS
SO
LVE
D S
OLI
DS
,IN
MIL
LIG
RA
MS
PE
R L
ITE
R
Surfa
ce w
ater
,
fore
sted
land
use
Surfa
ce w
ater
,
agric
ultu
ral l
and
use
Gro
und
wat
er,
shal
low
allu
vial
aqu
ifer
Gro
und
wat
er,d
rinki
ng
wat
er a
quife
r, un
conf
ined
Gro
und
wat
er, d
rinki
ng
wat
er a
quife
r, co
nfin
ed
10
10,000
20
50
100
200
500
1,000
2,000
5,000
(58)(100)(175) (19) (10)
SMCL = 500
(15) (9) (5) (3) (8)
ERMSEL
LEL
ERL
AR
SE
NIC
AN
D S
EL
EN
IUM
CO
NC
EN
TR
AT
ION
S,
IN M
ICR
OG
RA
MS
PE
R G
RA
M D
RY
WE
IGH
T
MAJOR LAND USE
0.2
0.5
1
2
5
1020
50
100
200
5001,000
Agricultu
re/
Forest Urban
IntegratorForest
Agricultu
re0.1
(Arseniclevels only)
Arsenic
Selenium
Many naturally occurring chemicals are present in streams and ground water. It is important for water and land managers to understand the natu-ral water chemistry in order to assess the effects of human activities on water quality.
Dissolved constituents in rivers and ground water include the major cations (calcium, magnesium, sodium, potas-sium), major anions (bicarbonate, chloride, and sulfate), nutrients, trace elements (including iron and manga-nese), and radionuclides (uranium, radium, and radon).
The most common ions in most waters in the study area are calcium, magnesium, and bicarbonate. These ions provide many of the dissolved solids in study-area waters. Median
dissolved-solids concentrations in sur-face waters range from about 50 milli-grams per liter (mg/L) in forested parts of the study area to about 500 mg/L in agricultural basins. Median concentra-tions of dissolved solids in ground water range from about 250 mg/L in shallow alluvial aquifers to more than 2,500 mg/L in the drinking-water aqui-fer where it is confined by the Sinnipee confining layer (Richards and others, in press; Saad, 1996 and 1997).
Concentrations of dissolved solids exceeded the USEPA secondary maxi-mum contaminant level (SMCL) of 500 mg/L in 22 percent of surficial aquifer wells and 17 percent of deep drinking water wells sampled (Saad, 1996 and 1997).
Concentrations of arsenic and sele-nium in streambed sediment are vari-able in the study area. Median arsenic concentrations are highest in the for-ested land use area and are correlated with the igneous/metamorphic bed-rock. Arsenic concentrations exceeded the concentrations that 95 percent of the benthic biota can tolerate, the Low-est Effect Level (LEL), at 48 percent of sites sampled.
The chemical composition of naturalwater is primarily derived from thedissolution of minerals in surficialdeposits and bedrock.
Health and Aquatic Life
Runoff in agricultural areas maycontribute significant suspendedsolids to stream water, resulting instreams with a muddy appearance.
Forested land use was related to high concentrations of arsenic and selenium instreambed sediment (Scudder and others, 1997). The igneous/metamorphic bedrockand sand and gravel surficial deposits that are found in most of the forested areas maybe a source for these elements in the study area. Ontario Ministry of Environment andEnergy values (Persaud and others, 1993) are shown for the Lowest Effect Level (LEL)and Severe Effect Level (SEL). Sediment effect criteria from Ingersoll and others (1996)for Effects Range Low (ERL) and Effects Range Median (ERM) are for arsenic only.
Dissolved solids concentrations arevariable in the study area. Highestconcentrations are found in the confinedpart of the drinking water aquifer, whichmay increase treatment costs. SMCL issecondary maximum contaminant level.
EXPLANATION
(35)Number ofobservations
Median
75th percentile
25th percentile
Highest value
Lowest value
8 WATER QUALITY IN THE WESTERN LAKE MICHIGAN DRAINAGES, WISCONSIN AND MICHIGAN, 1992–95

MAJOR ISSUES AND FINDINGSLevels of Some Naturally Occurring Chemicals Have the Potential to Affect Human
Concentrations of iron in ground water varied from near zero to 23,000 micrograms per liter (µg/L). Concen-trations of dissolved iron exceeded the USEPA SMCL of 0.3 mg/L in 38 per-cent of samples collected from drink-ing-water wells and 10 percent of shallow alluvial wells (Saad, 1996 and 1997). The source of the iron in the drinking water aquifer is probably the minerals in the Cambrian/Ordovician aquifer geologic material. The source of iron in the shallow alluvial aquifers may be the minerals in the alluvial materials derived from the igneous and metamorphic bedrock or possibly from supplemental iron that is in some fer-tilizers.
Radon, which can cause lung can-cer, is a radioactive, odorless, and chemically inert gas that occurs natu-rally in the air, soil, and ground water. Radon is a decay product of radium, which in turn is a decay product of ura-nium. Rocks break down mechanically and chemically to form sediments that-contain various amounts of uranium, depending on the source rocks.
Radon in ground water affects radon concentrations in indoor air in homes because it escapes to the indoor air as people use water. Open water-distribution systems allow ground water to aerate and radon to escape. In small, closed water-distribu-tion systems with short transit times, radon cannot escape from the system; therefore it escapes into the indoor air. Research suggests that ingestion of water with high radon con-centrations also may pose risks, although these risks are believed to be much lower than those from inhalation of radon.
Until late 1996, the USEPA had proposed an MCL of 300 picocuries per liter (pCi/L) for radon in drinking water. However, this proposed maxi-mum contaminant level (MCL) was withdrawn by USEPA for further eval-uation; thus, no proposed MCL cur-rently exists. Radon concentrations measured during this study were larger than the previously proposed MCL in 66 percent of the drinking-water aqui-fer wells (Saad, 1996).
Radon concentrations greater than 300 pCi/L were detected in a variety of geohydrologic environments through-out most of the study area, with the exception of the southwest (Saad, 1996). Elevated radon concentrations do not appear to be related to a particu-lar geologic formation or land use.
Radon, a known carcinogen, exceeds the previouslyproposed USEPA standard of 300 picocuries per liter in manydeep wells.
The three cancer risks greater than radon are all factors that can be controlledthrough life-style changes. This figure accounts for all exposures to radon,not only radon in water (not all factors are shown). Source: American Institutefor Cancer Research (1992).
Dissolved iron concentrations arevariable in the study area. SMCL issecondary maximum contaminant level.
44°
89°
45°
88°
46°
87°
0 25 50 MILES
0 25 50 KILOMETERS
Drinking-wateraquifersurvey
Radon, inpicocuries per liter
Aquifer regionally unconfined
Aquifer regionally confined
Aquifer not present
Water
EXPLANATION
130 – 299300 – 599600 – 899900 – 1400
Diet
Tobacco
Occupation
Radon
Pollution
Medical X-Rays
35
30
4
2–3
2
0.5
PERCENTAGES OF CANCER DEATHSATTRIBUTED TO VARIOUS FACTORS
DIS
SO
LVE
D IR
ON
,IN
MIC
RO
GR
AM
S P
ER
LIT
ER
Surfa
ce w
ater
, ign
eous
and
met
amor
phic
bed
rock
Surfa
ce w
ater
,
carb
onat
e be
droc
kG
roun
d w
ater
,
shal
low
allu
vial
aqu
ifer
Gro
und
wat
er, d
rinki
ng
wat
er a
quife
r, un
conf
ined
Gro
und
wat
er, d
rinki
ng
wat
er a
quife
r, co
nfin
ed
100
100,000
200
5001,0002,000
5,00010,00020,000
50,000
(58)(134)(167) (19) (10)
50
2010521
SMCL =300
Health and Aquatic Life
U.S. Geological Survey Circular 1156 9

MAJOR ISSUES AND FINDINGSFertilizers and Livestock Wastes Increase Nutrients in Streams and Ground Water
Animal manure is spread on farm fields,typically in the fall or winter months, as afertilizer. Improper or excess applicationcan result in runoff to streams orinfiltration to ground water. The advent of“precision farming” methods will allowapplication of fertilizers to specific parts offields based on need, and may lead toreduced inputs.
Applications of phosphorus and nitrogen to croplands, urban lawns, and golf courses, in the form of com-mercial fertilizers and(or) animal manure, are common in the study area. In drinking water, concentrations of nitrate in excess of 10 mg/L can cause methemoglobinemia or “blue-baby syndrome” which can be fatal to infants.
Phosphorus is naturally occurring and present in many clay soils in the study area. Man supplements this natu-rally occurring phosphorus with total annual inputs to the study area of 34 thousand tons (6.8 pounds per acre).
Phosphorus concentrations at the 11 Fixed Sites were pri-marily related to land use and secondarily related to clayey surficial deposits in the basin. Median phosphorus concen-trations exceeded the USEPA suggested maximum total phosphorus concentration for flowing water of 0.1 mg/L (U.S. Environmental Protec-tion Agency, 1986) in 57 per-cent of samples collected at the four agricultural sites (Richards and others, 1998).
Nitrate was detected in all 412 stream-water samples collected during the study. Concentrations in 66 percent of all stream samples and 92 percent of samples from agri-cultural sites were high enough to contribute to algal blooms (0.3 mg/L).
Median nitrate concentra-tions at the four agricultural sites and the mixed agricul-ture and forested sites were slightly higher than at the urban site and considerably higher than at the forested sites. Nitrate concentrations at the agricultural East River site exceeded the USEPA MCL (10 mg/L) during three storms in 1994 and 1995. Median nitrate concentrations in river water from Lincoln Creek, the urban site, were similar to the national average concentra-tion (Smith and others, 1993) in urban areas and are proba-bly elevated relative to for-ested land use areas due to the use of fertilizers on lawns and gardens.
Nutrients are essential for aquatic plants;however, in high concentrations they cancause eutrophication, leading tonuisance algal blooms. Algal blooms canbe detrimental to fish and other aquaticorganisms.
Phosphorus concentrations in stream water atagricultural sites were considerably higher than aturban and forested sites during base flow conditions.(RHU labels correspond to the RHU figure on p. 6.)
More than 96 percent of the totalanthropogenic phosphorus input to thestudy area is in the form of commercialfertilizers and livestock manures. Pointsources such as sewage-treatment plantscontribute only about 1.2 percent of thetotal input (Robertson, 1996a).
Median nitrate concentrations, during base-flowconditions, at two of the agricultural sites and themixed agriculture and forested sites were twice thenational average concentration for agriculturalareas (Smith and others, 1993). (RHU labelscorrespond to the RHU figure on p. 6.)
Atmosphere (2.2%)
Point sources (1.2%)
Manure (41.7%)
Commercialfertilizers (54%)
Sources of Phosphorus Inputs
TO
TA
L P
HO
SP
HO
RU
S C
ON
CE
NT
RA
TIO
N,
IN M
ILLI
GR
AM
S P
ER
LIT
ER
Agriculture Ag/Forest Forest Urban
Ag1Ag23
Ag2Ag3
AF20F16
F22 U9
MCL = 0.1
(35) (28) (25) (35) (29) (20) (21) (21)
0.002
2.0
0.005
0.01
0.02
0.05
0.1
0.2
0.5
1.0
(35) (27) (25) (35) (29) (20) (21) (21)
0.02
0.01
0.05
0.1
0.2
0.5
1.0
2.0
5.0
10.0
DIS
SO
LVE
D N
ITR
ITE
PLU
S N
ITR
AT
E,
IN M
ILLI
GR
AM
S P
ER
LIT
ER
Agriculture Ag/Forest Forest Urban
Ag1Ag23
Ag2Ag3
AF20F16
F22 U9
10 WATER QUALITY IN THE WESTERN LAKE MICHIGAN DRAINAGES, WISCONSIN AND MICHIGAN, 1992–95

MAJOR ISSUES AND FINDINGSFertilizers and Livestock Wastes Increase Nutrients in Streams and Ground Water
AMJ JASONDJ FMAMJ JASONDJ FMAMJ JAS1993 1994 1995
0.01
10,000
0.1
1
10
100
1,000
ST
RE
AM
FLO
W,
IN C
UB
IC F
EE
T P
ER
SE
CO
ND
0
8
0
2
4
6
NIT
RA
TE
, IN
MIL
LIG
RA
MS
PE
R L
ITE
R
Duck Creek at Seminary Road near Oneida, Wis.10
100,000StreamflowRoutine sampleStorm sample
AMJ J ASONDJ FMAMJ J ASONDJ FMAMJ J AS1993 1994 1995
0.01
10,000
0.1
1
10
100
1,000
ST
RE
AM
FLO
W,
IN C
UB
IC F
EE
T P
ER
SE
CO
ND
0
0.8
0
0.2
0.4
0.6
TO
TA
L P
HO
SP
HO
RU
S,
IN M
ILLI
GR
AM
S P
ER
LIT
ER
Duck Creek at Seminary Road near Oneida, Wis.1.0
100,000StreamflowRoutine sampleStorm sample
45°
44°30'
89°30'
44°
89°30' 89°
88°30'43°30'
0 10 20 MILES
0 10 20 KILOMETERS
EXPLANATION
Less than 0.050.05–1.92.0–9.9Greater than 10
Dissolved nitrate as N, in milligrams per liter
Land-use study area 1Land-use study area 2
AREA 2
AREA 1
S H A W A N O
W A U PA C A
L A N G L A D E
M A R AT H O N
P O R TA G E
W A U -S H A R A
M A R Q U E T T E
A D A M SC O L U M B I A
F O N DD U
L A C S H E -B O Y G A N
M A N I T O W O CC A L U M E T
O Z A U K E E
W A S H I N G -T O N
G R E E NL A K E
W I N N E B A G O
Lake
Mic
higa
n
MICHIGAN
WISCONSIN
Area detailed below
Nutrient concentrations vary sea-sonally in streams throughout the study area. The highest concentrations occur during stormwater runoff. At two agricultural streams in the study area, more phosphorus was carried during storms in June 1993 than during the next 24 months combined. Highest phosphorus concentrations during periods when storm runoff is absent (base flow) generally occur during the growing season (March to August), and the lowest concentrations occur during the winter (January and Febru-ary). Highest nitrate concentrations during base-flow periods generally occur during the winter months. This may be due to the seasonal change in contributions from ground-water dis-charge to streams or to the seasonal cycle of algae growth in streams.
Nitrate was detected in all 76 ground-water samples collected. Con-centrations of nitrate exceeded the USEPA MCL of 10 mg/L in 9 percent of samples from the drinking-water aquifer and in 22 percent of samples from the surficial alluvial aquifers.
In general, ground water had higher concentrations of nitrate in areas of agricul-ture or mixed agriculture and forested land use than in urbanized and forested watersheds. Ground water from the surficial alluvial aquifer generally had higher concentrations of nitrate than that from wells in the Cambrian-Ordovician drinking-water aquifer (Saad, 1996 and 1997). Concentrations of nitrate in the drinking water aquifer were highest in areas where the Sinnipee confining unit is not present. Ground water in areas where the surficial deposits were sand and gravel had higher nitrate concentrations than in areas where the surficial deposits were sand and clay glacial till (Saad, 1996).
The highest nutrient concentrations occurred during periodsof precipitation runoff.
More than 20,000 samples from morethan 500 stream sites and nearly 1,000samples from about 800 wells in thestudy area were analyzed by variousagencies for nutrients between 1970 and1991 (Robertson and Saad, 1996; Saad1994). Retrospective analysis of thesedata indicated that agricultural land usewas the primary factor affecting the dis-tribution of nutrient concentrations.Phosphorus concentrations decreasedsignificantly in surface water down-stream from urban areas during the1970s because of the reduction of phos-phorus in detergents and improvementsin sewage-treatment facilities.
Water samples from 22 percent of shallow alluvial wellssampled in agricultural land-use areas exceeded theUSEPA maximum contaminant level for nitrate asnitrogen of 10 mg/L. Nitrate concentrations were higherin land use area 2 where surficial deposits were morepermeable (Saad, 1997). Typically, these shallow wellsare not drinking-water sources.
U.S. Geological Survey Circular 1156 11

MAJOR ISSUES AND FINDINGSVarious Factors Control Pesticide Occurrence in Streams and Ground Water
2,4-
D
Aceto
chlor
Alachlo
r
Benflu
ralin
Benta
zon
Butyla
te
Cyana
zine
DCPA
Diazino
n
Diuron
EPTC
Met
olach
lor
Met
ribuz
in
Pebula
te
Pendim
etha
lin
Prom
eton
Propa
chlor
Simaz
ine
Tebut
hiuro
n
Terba
cil
Triclop
yr
Triflur
alin
PE
RC
EN
TA
GE
OF
SA
MP
LES
WIT
H D
ET
EC
TIO
NS
0
50
100
Atrazin
e
25
75
Dichlob
enil
Diethy
lanilin
e
Thiobe
ncar
b
Trialla
te
Row crops;corn and beans
Turfgrass, pasture,and specialty crops
0
.5
1.0
1.5
2.0
2.5
3.0
Miscellaneous uses
US
E O
F P
ES
TIC
IDE
IN W
ISC
ON
SIN
,IN
MIL
LIO
N P
OU
ND
S O
FA
CT
IVE
ING
RE
DIE
NT
PE
R Y
EA
R
Deeth
ylatra
zine
No information onpesticide use
Surface-water detectionGround-water detectionPesticide use
Fifteen pesticides were detected in ground water and 33 in surface water (Sullivan and Richards, 1996; Saad, 1996 and 1997). Most of the pesticides detected in surface water and ground water are herbicides used on corn, soy beans, small grains, and hay. However, there are a number of herbicides and insecticides, more commonly used on lawns and for specialty crops, that have been detected as well. The use of specific pesticides fluctuates over time as new pesticides are developed or as more information is ascertained regarding health effects and persis-tence.
Drinking-water standards (U.S. Environmental Protection Agency, 1996) were exceeded in only 11 of 143 surface-water samples. However, there are established standards for only about 20 percent of the 88 pesticides that were analyzed for as part of this study. There is no clear evidence that
currently used pesticides are adversely effecting aquatic or human health; but at the same time, potential effects of long-term human and environ-mental exposure to both individual pesticides and to complex mixtures of pesticides and their degra-dation products are unknown (Goodbred and others, 1997; Girvin, 1996). The continuing presence of the once widely used insecticide DDT and its degradation products such as DDE, despite the ban on DDT use that wasimposed in the early 1970s, demon-strates the persistence of certain toxic chemicals in the environment. There-fore, continued study of the types and amounts of pesticides in streams and ground water, coupled with the latest information on effects of pesticides on aquatic or human health, is in order.
Concentrations of pesticides were 100 times higher in intensively farmed (row crop) areas of the study area than in nonagricultural areas or in less intensively farmed areas where graz-ing, hay production, and less herbi-cide-intensive crops are raised.
Pesticide concentration in streams show a seasonal pattern (Sullivan and Richards, 1996). The highest pesticide
concentrations typically occur during the first several periods of runoff fol-lowing the application of pesticides.
Numerous pesticides have been detected in precipitation in the study area (Majewski and Capel, 1995). Atrazine concentrations in precipita-tion in the study area are typically about 0.2 µg/L (Goolsby and others, 1994). The presence of atrazine in stream water from the two forested Indicator Sites at concentrations less than 0.005 µg/Lis probably due to atmospheric deposition.
Atrazine, the herbicide most commonly used on corn in the study area (Gianessi and Puffer, 1991) was detected in allof the stream samples and in more than half of the ground-water samples (Sullivan and Richards, 1996; Saad, 1996and 1997). The herbicides simazine, metolachlor, cyanazine, prometon, and alachlor were detected in more than one-half of the stream samples.
Approximately 1,100 tons of pesticideactive ingredient are applied toagricultural land in the study areaeach year.
Pesticide concentrations are highestduring storms that occur soon after theherbicide application period. Pesticideconcentrations exceeded USEPA MCLson several occasions during theserunoff periods.
Mar Apr May June July Aug Sept1994
ST
RE
AM
FLO
W,
IN C
UB
IC F
EE
T P
ER
SE
CO
ND
CO
NC
EN
TR
AT
ION
,IN
MIC
RO
GR
AM
S P
ER
LIT
ER
Approximate period ofherbicide application
Duck Creek near Oneida, Wis.
AtrazineMCL = 3.0
0
3,000
0
500
1,000
1,500
2,000
2,500
0.001
0.0050.01
0.050.1
0.51
510
EXPLANATIONStreamflow
CyanazineMetolachlorAtrazine
12 WATER QUALITY IN THE WESTERN LAKE MICHIGAN DRAINAGES, WISCONSIN AND MICHIGAN, 1992–95

g-waterwells inovered
MAJOR ISSUES AND FINDINGSVarious Factors Control Pesticide Occurrence in Streams and Ground Water
water werele surficiald by thesesed for a
S
and clayal deposits
deposit/description
and gravelal deposits
ATIONplustrazine,rams
ction limitction limit
0.30 3.0
Pesticides applied at the land surface can be carried through the soil and subsoil to ground water with infiltrating rainfall. Pesti-cides were detected most frequently and in highest concen-trations in ground water samples from shallow wells in intensively cultivated agricultural areas underlain by relatively permeable surficial deposits (Saad, 1997).
Pesticides were also detected in deeper ground-water aquifers that are used as drinking-water supplies. Pesticides detected in the deep ground water are gener-ally from areas where the aquifer is not covered by the relatively impermeable Sin-nipee confining unit (Saad, 1996).
Between 1983 and 1995, a total of 32,064 pesticideanalyses were done on samples from 4,155 wells in thestudy area (Matzen and Saad, 1996). In 29 percent of thesampled wells, at least one pesticide was detected.Atrazine and its degradation products exceeded theWisconsin preventive action limit (PAL) of 0.3 microgramper liter in about 10 percent of all wells sampled.Thousands of potential pesticide degradation productsexist and these compounds are rarely included inlaboratory analyses for pesticides. Therefore, it is likelythat pesticide and degradation product occurrences inboth surface and ground water have been, and currentlyare, underestimated in the study area and across theNation.
Pesticides were detected in seven drinkinaquifer wells. Most of the detections were in agricultural areas where the aquifer is not cby the Sinnipee confining unit (Saad, 1996).
89°
88°
87°
46°
45°
44°
43°
0 25 50 MILES
0 25 50 KILOMETERS
Location of wellswhere pesticideswere:
detectednot detected
EXPLANATION
Atrazine concentrations in shallow ground highest in areas with the most permeabdeposits. The shallow ground water targeteagricultural land use studies is seldom udrinking-water source.
44°
89°
45°
88°
46°
87°
0 25 50 MILES
0 25 50 KILOMETER
Drinking-wateraquifer
Aquifer regionally unconfined Aquifer regionally confined Aquifer not presentLake
EXPLANATION
Pesticide or metabolitenot detectedPesticide or metabolitedetected
Milwaukee
Green Bay
0
0
25 50 MILES
25 50 KILOMETERS
Sand surfici
Surficial bedrock
Sand surfici
EXPLANAtrazine deethylain microgper liter
< Dete> Deteand <0.30 –> 3.0
89°
88°
87°
45°
44°
43°
U.S. Geological Survey Circular 1156 13

MAJOR ISSUES AND FINDINGSUrban Areas are a Source of Trace Elements and Organic Compounds
CO
NC
EN
TR
AT
ION
,IN
MIC
RO
GR
AM
S P
ER
GR
AM
0
4
0
1
2
3
Duck Cr.
Lincoln Cr.
Menominee R.Fox R.
Milwaukee R.
Ag1 U9 FI UI UI
Total PCBsin fish tissue(wet weight)
Total PCBsin sediment(dry weight)
CHLOROPHYLL a,IN MICROGRAMS PER LITER
PA
RT
ICU
LAT
E P
CB
,IN
NA
NO
GR
AM
S P
ER
LIT
ER 50
0
40
30
20
10
0 50 100 150 200 250 300
Milwaukee River at
HaytonThiensvillePioneer RoadEstabrook
Concentrations of PCBs are 10 times higherin streambed sediments and biotic tissues aturban Integrator sites (Scudder and others,1997) than in smaller urban, agricultural orforested land use areas. RHU labelscorrespond to the RHU figure on p. 6, “I”represents large-river (Integrator) sites.
Industrial activities in urban areas of the study area have introduced con-taminants into surface water and stream-bed sediments. Parts of the Menominee, Fox, Sheboygan, and Milwaukee Rivers have been desig-nated “areas of concern” (AOCs) by the International Joint Commission, which represents U.S. and Canadian environmental and resource interests in the Great Lakes Region (Interna-tional Joint Commission, 1989). Water, sediment, and biota in these four AOCs have been found to contain a wide array of inorganic and synthetic organic compounds (Wisconsin Department of Natural Resources, 1978 and 1993; Sullivan and Delfino, 1982). The severity of contamination in the AOCs has restricted the use of water for human and animal consump-tion and has limited the recreational uses.
Concentrations of chemicals in the aquatic environment are of concern whenever and wherever organisms, including humans, may be at risk. One way to assess this risk is to measure the amount of contaminants biologi-cally available to organisms, known as bioavailability. Measuring concentra-tions of contaminants in streambed sediments and in biotic tissues can pro-vide information on the bioavailability of contaminants in sediments to partic-ular organisms.
Polychlorinated biphenyls (PCBs), a set of 209 related chlorinated organic compounds, had various industrial uses in the study area such as in hydraulic fluids, cutting oils, sealants, and pesticides. Despite a manufactur-ing ban in the mid-1970s, PCBs con-tinue to be of concern because of their persistent toxicity to organisms.
PCBs are a listed contaminant in all of the designated AOCs.
Data collected during the bed-sedi-ment and tissue studies in the study area indicate that PCB concentrations in the Lower Fox River and in the Mil-waukee River may be linked to algal productivity. Highest particulate PCB concentrations were measured during the algae-rich summer months. Incor-poration of PCBs into algae (Swack-hamer and Skoglund, 1993) provides a pathway for these compounds to move from contaminated river sediments into other organisms, including fish and humans.
The relation between algae measured as chlorophyll-a and PCBsindicates that algal growth, sedimentation, and sedimentresuspension may be important processes controlling the fate ofPCBs in rivers (Fitzgerald and Steuer, 1996).
The industrialized lower Fox River Valleysupports one of the largestconcentrations of paper mills in the world.
Contaminants attached to sediments can be transported from the landsurface to surface water systems. The contaminants can enter the foodchain and lead to bioaccumulation in larger species.
1. Contaminantsare washedinto streamwith sediment.
2. Bottom-feeding fish andaquatic invertebratesbioaccumulate contaminants.
3. Predator species of fishand fish-eating wildlifeconsume prey thathave taken upcontaminants.
Figure source: Bruce Lindsey, USGS
14 WATER QUALITY IN THE WESTERN LAKE MICHIGAN DRAINAGES, WISCONSIN AND MICHIGAN, 1992–95

MAJOR ISSUES AND FINDINGSUrban Areas are a Source of Trace Elements and Organic Compounds
0
0.12
0
0.02
0.04
0.06
0.08
0.10
CO
NC
EN
TR
AT
ION
,IN
MIC
RO
GR
AM
S P
ER
GR
AM
Total DDT infish tissueTotal DDT insedimentTotal chlordanein fish tissueTotal chlordanein sedimentChlordaneanalyzed for,but not detected
Ag1 Ag3 AF20 U9 I I
Duck Cr.
Tomorrow R.
Lincoln Cr.
Menominee R.Fox R.
Milwaukee R.
FI
N. Br. M
ilwaukee R.
Acute exposure (short term, high concentration) to certain trace ele-ments can kill organisms, whereas chronic exposure (long term, low con-centration) can result in mortality or nonlethal effects, such as stunted growth, reduced reproductive success, or deformities.
Concentrations of cadmium, copper, mercury, nickel, lead, and zinc were significantly higher in fine river sedi-ments from large-river and urban sites than in other areas (Scudder and oth-ers, 1997). Trace elements and syn-thetic organic compound concentrations in sediment and fish tis-sue exceeded aquatic-life criteria at some sites.
Semivolatile organic compounds (SVOCs) were analyzed for in stream-bed sediments. Eighty percent of the SVOCs analyzed for in the study area were detected in at least one sample. Two classes of SVOCs (polycyclic aromatic hydrocarbons, PAHs, and phthalates) were detected more fre-quently and in higher concentrations at urban-affected sites (Scudder and oth-ers, 1997).
Concentrations of many toxic synthetic organic compoundswere elevated in streambed sediments and tissues fromurban and large-river sites relative to other land uses. (RHUlabels refer to RHU figure on p. 6; “I” represents large-river(Integrator) sites.
Trace-element concentrations in streambed sediment.
Trace element
Number of samples
OMEELEL
SECERL
OMEESEL
SECERM
Arsenic 40 18 12 1 1
Cadmium 41 25 19 0 2
Chromium 42 42 38 3 1
Copper 42 30 9 3 0
Mercury 42 8 -- 2 --
Nickel 42 25 16 0 0
Lead 42 12 10 1 5
Zinc 42 17 17 1 3
Trace-element concentrations in fine (less than 63 micrometers) streambedsediment exceeded guidelines for bulk sediment in many samples. Comparisonsof trace-element concentrations in fine sediment to bulk sediment guidelines mayoverestimate potential effects on biota. A number of observations from theWestern Lake Michigan Drainages equaled or exceeded published guidelines fortrace-element concentrations in sediment.
[Ontario Ministry of Environment and Energy values (Persaud and others, 1993) are forthe Lowest Effect Level (OMEE LEL) and Severe Effect Level (OMEE SEL). Thesediment effect criteria (SEC) are from Ingersoll and others (1996) for Effects RangeLow (SEC ERL) and Effects Range Median (SEC ERM); --, no guidelines.]
Median concentrations of lead and mercury instreambed sediment exceeded the “lowesteffect level” at urban and large river sites (seetable at right). Lead is a known urbancontaminant whose historical source isprobably gasoline (Callender and Van Metre,1997).
LE
AD
CO
NC
EN
TR
AT
ION
IN
SE
DIM
EN
T,
SEL
ERM
ERL
LEL
IN M
ICR
OG
RA
MS
PE
R G
RA
M,
DR
Y W
EIG
HT
MAJOR LAND USE
Forest
Agricultu
re
Agricultu
re/Forest
Lincoln Cr.
Integrator2
5
10
20
50
100
200
500
1,000
U.S. Geological Survey Circular 1156 15

MAJOR ISSUES AND FINDINGSEnvironmental Setting and Land Use Influence Aquatic Life
Gre
enBay
La
keM
ich i
gan
44°
45°
46°
89°
88°
87°
43°
0
0 25 50 KILOMETERS
25 50 MILES
Hibbards Creek
Casco Creek
Little Scarboro Creek
Krok Creek
Tisch Mills Creek
Mullet River
WatercressCreek
Nichols Creek
East Br.Milwaukee River
Pine RiverWillow Creek
Mecan River
ChaffeeCreek
LawrenceCreek
NeenahCreek
Camp Creek
WhitcombCreek
Silver Creek
Smith Creek
West BranchRed River
Indicator Fixed SiteBenchmark Stream Site
Surface-water sampling siteEXPLANATION
AF20
AF26
Ag1
Ag3
AF20AF26
Ag3Ag1
RHU (see p.#6)
Stream ecology can be affected by a wide variety of human and natural fac-tors. Sampling stream habitat and communities of fish, benthic inverte-brates, and algae provides a unique assessment of the overall health of streams. Relating these findings to information about the natural and human features found in the sampled basins can provide important informa-tion for management of land and water resources.
Nearly 500 biological studies con-ducted in the study area between 1891 and 1996 were identified that relate to water-quality conditions. Most of these studies focused on populations and community structure of aquatic biota in streams thought to be degraded as a result of human activity (Scudder and others, 1996).
Indexes of biotic integrity were cal-culated for each of the four ecological components for 28 streams in the study area. These biotic indexes were devel-oped to provide an indication of water quality based on the ecological compo-nent sampled. Results of the calculated indexes for the Indicator and bench-mark sites were compared to land use, surficial deposit, and bedrock informa-tion in each basin to determine the influence of these environmental fac-tors on aquatic life in the basin.
The number of each type of fish speciespresent in streams provides an indicationof stream-water quality. Twenty-one of the28 streams sampled were classified ascoldwater trout streams (Sullivan, 1997;Sullivan and Peterson, 1997).
Twenty benchmark streams in a predominantly agricultural part of the study areawere selected for detailed ecological studies (Rheaume, Stewart, and Lenz, 1996).These studies were also done at the eight Indicator Fixed Sites (Sullivan and others,1995). The ecological studies conducted at the 28 sites were designed to study theeffects of environmental setting on aquatic life. The studies conducted at the 20benchmark stream sites were also designed to define aquatic life conditions in less-degraded watersheds located in primarily agricultural areas.
16 WATER QUALITY IN THE WESTERN LAKE MICHIGAN DRAINAGES, WISCONSIN AND MICHIGAN, 1992–95

MAJOR ISSUES AND FINDINGSEnvironmental Setting and Land Use Influence Aquatic Life
In general, there was good agreement between individ-ual ecological component scores. At only one of the 20 benchmark streams did results vary by more than one quality category. At four of the eight Indicator Fixed Sites scores varied by two quality catego-ries.
Overall water quality at the benchmark streams, as indi-cated by the four ecological component scores, varied lit-tle within each of the four RHUs sampled. Biotic indexes indicated that water quality at the benchmark streams in RHU 26 were of slightly higher quality than benchmark streams in RHU 3. Benchmark streams in RHU 26 had nearly twice as much forested land in their basins than did RHU 3 streams.
Water quality, as indicated by biotic indexes, varied con-siderably between Indicator Fixed Sites. The urban site had the worst water quality and the forested sites the best water quality. At the agricul-tural Indicator Fixed Sites, water quality varied consider-ably. Scores were nearly as low as the urban site where percent agriculture in the basin was highest; and scores were as high as the forested sites where agricultural landuse percentage was lowest.
Lowest overall scores werefrom basins with clay surficialdeposits. There was no apparent correlation betweenbiotic indexes and bedrocktype or drainage basin area.
Caddisfly larvae are generally found where habitat and waterquality conditions are good. Additional discussion of habitatconditions and invertebrate communities in the study area can befound in Fitzpatrick and Giddings, 1997; Fitzpatrick, Peterson andStewart, 1996; and Rheaume, Lenz, and Scudder, 1996.
Biological indexes for habitat (Great Lakes Environmental Assessment, GLEAS; MichiganDepartment of Natural Resources, 1991), algae (Index of Biological Integrity, IBI; Bahls, 1993),benthic invertebrates (Hilsenhoff Biotic Indexes, HBI and FBI; Hilsenhoff, 1987), and fish (Indexof Biological Integrity, IBI; Lyons, 1992 and Lyons and others, 1996) indicate the water quality ofstreams in the study area. Total score determined by assigning point values for each qualityscore as shown in parentheses. Abbreviations: Ag, agriculture; F, forest; W, wetland;Scores: Excellent (4); Good (3); Fair (2); Poor (1); Very Poor (0)
Peshekee River
Popple River
Pensaukee River
Duck Creek
Tomorrow River
East River
N. Br. Milwaukee R.
Lincoln Creek
Tisch Mills Creek
Krok Creek
Little Scarboro Creek
Casco Creek
Hibbards Creek
E. Br. Milwaukee R.
Nichols Creek
Mullet River
Watercress Creek
Whitcomb Creek
W. Br. Red River
Silver Creek
Smith Creek
Camp Creek
Lawrence Creek
Neenah Creek
Chaffee Creek
Mecan River
Willow Creek
Pine River
FishHabitatInvert-ebratesAlgae
Area(mi ) 2 RHU Land use (percent)
TotalscoreRiver name
Ecological Component
Indi
cato
r F
ixed
Site
sB
ench
mar
k S
trea
ms
49
139
36
95
44
47
51
10
16
78
1
15
16
53
5
46
12
8
37
16
2
5
8
25
9
29
16
21
16
22
2
1
20
23
3
9
1
1
1
1
1
3
20
26
26
26
26
26
26
3
3
3
20
20
20
20
F (98)
F (90)
Ag (86)
Ag (89)
Ag (58)/F (39)
Ag (92)
Ag (88)
U (100)
Ag (81)/W (11)
Ag (61)/W (36)
Ag (94)
Ag (89)/F (7)
Ag (73)/F (14)
Ag (56)/F (32)
Ag (81)/F (19)
Ag (72)/F (15)
Ag (66)/F (31)
F (63)/Ag (30)
F (52)/Ag (38)
F (45)/Ag (35)/W (19)
F (60)/W (35)
F (54)/W (28)/Ag (18)
Ag (49)/F (46)
Ag (58)/F (38)
Ag (44)/F(26)/W (17)
Ag (59)/F (40)
F (52)/Ag (41)
Ag (58)/F (42)
13
12
11
10
13
7
13
6
13
11
13
12
11
13
10
10
11
14
16
11
13
15
13
14
12
13
14
11
U.S. Geological Survey Circular 1156 17

MAJOR ISSUES AND FINDINGSAre Biological and Water-Quality Data Collected by Different Methods Comparable?
Gre
en
Bay
La
keM
ich i
gan
45°
44°
43°
0 25 50 MILES
0 25 50 KILOMETERS
WISCONSIN
MIC
HIG
AN
North BranchMilwaukee River
Silver Creek
MecanRiver
NeenahCreek
Duck Creek
MilwaukeeRiver
Study areaenlargedabove
Manitowoc River
WolfRiver
Water-chemistry siteBiological site
Sampling sites
Aquatic-biology method comparisons were done at six sitesand water-chemistry method comparisons at three sites in thestudy area.
Control of water pollution became a major environmental priority during the last three decades, and in response, water-quality monitoring has expanded rapidly. Today, Federal, State and local water-resource management agencies make a considerable investment in the collection of water-quality informa-tion. A wide variety of procedures are used to collect this information, often depending upon the objectives of the collection effort. A lack of information regarding the quality and comparabil-ity of the data collected can result in duplicated sampling efforts or the underutilization of available water-quality information.
To address these concerns, studies were done to determine the compara-bility of water-chemistry and aquatic-invertebrate data collected by different methods in Wisconsin (Lenz and Miller, 1996; Wisconsin Department of Natural Resources and U.S. Geolog-ical Survey, 1994).
These studies were coordinated with the Wisconsin Department of Natural Resources (WDNR), U.S. Forest Ser-vice (USFS), and a volunteer group, Water Action Volunteers (WAV), in conjunction with the Wisconsin Water Resources Coordination Project, a pilot program implementing the rec-ommendations of the Intergovernmen-tal Task Force on Monitoring Water Quality (ITFM).
During 1993 and 1994, a study was done to compare water-chemistry results obtained using methods of the USGS and the WDNR (Wisconsin Department of Nat-ural Resources and U.S. Geological Survey, 1994). Water-chemistry samples were col-lected four times, twice during base flow conditions and twice during storm runoff conditions, at three streams of var-ious size that were chosen to represent stream variability in the study area. Duplicate samples were collected at each location using each collection, processing, and pres-ervation method for analyses at both the USGS National Water-Quality Laboratory and the Wisconsin State Laboratory of Hygiene.
Total phosphorus, dissolved chlo-ride, and suspended solids (sediment) were the water-chemistry parameters studied. Total phosphorus was chosen as an indicator constituent for nutrient concentrations, and dissolved chloride
was chosen as an indicator for dis-solved major ion concentrations.
Dissolved chloride in samples col-lected using the two agencies’ methods were similar during both high- and low-flow conditions. Results indicated that concentrations of total suspended solids and suspended sediment con-centrations were significantly higher for samples collected by the equal-width increment (EWI) sample method than using the grab sample method during high-flow conditions. Surpris-ingly, total phosphorus concentrations also were similar for each collection method and flow condition. It had been anticipated that total phosphorus would more closely mimic the sus-pended solids (sediment) results dur-ing high-flow conditions. There were significant differences between labora-tories for analyses of concentrations of total phosphorus and dissolved chlo-ride.
In general, laboratory analytical dif-ferences were more important than sample-collection-method differences. Samples collected for phosphorus and chloride by the two methods were comparable when analyzed by the same laboratory.
Results of USGS/WDNR water-chemistry methods comparison
Method tested Total phosphorus Dissolved chloride
Suspendedsediment (SS)/
total suspendedsolids (TSS)
Differences between field-sampling methods
No difference No difference Concentrations of both SS and TSS were significantly higher in EWI samples
Within field-sampling method variability
No difference No difference SS concentrations more variable than TSS
Differences between field-processing methods
No difference No difference No difference
Differences between laboratories
USGS concentrations significantly lower
USGS concentrations significantly lower
Not applicable
18 WATER QUALITY IN THE WESTERN LAKE MICHIGAN DRAINAGES, WISCONSIN AND MICHIGAN, 1992–95

MAJOR ISSUES AND FINDINGSAre Biological and Water-Quality Data Collected by Different Methods Comparable?
0
5
10
15
20
25
30
35
40
45
50
Silver Cr.
Neenah Cr.
Mecan R.
N. Br. M
ilwaukee R.
Milwaukee R.
Duck Cr.
U.S. Geological SurveyWis. Dept. of Natural ResourcesU.S. Forest Service
NU
MB
ER
OF
TA
XA
CO
LL
EC
TE
DAquatic-macroinvertebrate
sampling methods used by the USGS, WDNR, and the USFS at riffle areas of streams were com-pared at six streams of various sizes in the study area. A volunteer group, WAV, performed an in-field invertebrate water-quality rating at one of the streams.
Results of the study indicated that differences in field-collection methods resulted in assessments of different habitats and the collec-tion of different total numbers and proportions of individual species, indicating that field-collection methods need to be considered when comparing macroinverte-brate data among agencies (Lenz and Miller, 1996). However, the sampling methods resulted in simi-lar water-quality ratings using the Hilsenhoff Biotic Index (HBI) a common benthic invertebrate envi-ronmental-tolerance measure.
In another study, USGS and WDNR data bases describing benthic macroinvertebrate com-munities in streams in the study area were paired with water-chemistry data to determine whether the data bases predicted water-quality conditions simi-larly. On the basis of the limited paired data available, the two data bases were shown to predict water-quality similarly using HBI (Lenz, 1997). However, results also indicated that benthic invertebrate data collected at dif-ferent seasons should not be combined when using the data for water-quality assessments.
Different invertebrate sampling techniques resulted indifferent numbers of species collected.
Federal and State agencies work together to providemore comparable aquatic biology results.
The Intergovernmental Task Force On Monitoring Water Quality (ITFM), was a national program designed to coordinate monitoring programs; define efficient roles for Federal, State, and local agencies; evaluate diverse descriptions of aquatic conditions and trends; and to develop a national water-information network (Intergovern-mental Task Force on Monitoring Water Quality, 1994). The National Water-Quality Assessment Monitoring Council was established in May 1997 as the permanent successor to the ITFM.
Hilsenhoff Biotic Index (HBI) of environmental toleranceresults from the three agencies and a volunteer grouppredicted water quality similarly.
The Intergovernmental Task Force On Monitoring Water Quality (ITFM) was a national program designed to coordinate monitoring programs; define efficient roles for Federal, State, and local agencies; evaluate diverse descriptions of aquatic conditions and trends; and develop a national water-information network (Intergovern-mental Task Force on Monitoring Water Quality, 1994). The National Water-Quality Assessment Monitoring Council was established in May 1997 as the permanent successor to the ITFM.
Silver Cr.
Neenah Cr.
Mecan R.
N. Br. M
ilwaukee R.
Milwaukee R.
Duck Cr.0
1
2
3
4
5
6
7
8
9
10
ex
ce
ll
en
tve
ry
good
good
fair
fairl
ypo
orve
rypo
orpo
or
USGS–NAWQA upstream riffleUSGS–NAWQA downstream riffleWDNR riffle replicatesUSFS riffle sample
HIL
SE
NH
OF
F B
IOT
IC IN
DE
X V
ALU
E
WA
TE
R-Q
UA
LIT
Y R
AT
ING
WAV water quality invertebrate rating
U.S. Geological Survey Circular 1156 19

20 WATER QUALITY IN THE WESTERN LAKE MICHIGAN DRAINAGES, WISCONSIN AND MICHIGAN, 1992–95
EscanabaR
Fox R
Wolf R
Green Bay
Milwaukee
EscanabaR
Fox R
Wolf R
Green Bay
Milwaukee
Greater than the 75th percentile(among the highest 25 percent nationally)
Between the median and the 75th percentile
Between the 25th percentile and the median
Less than the 25th percentile(among the lowest 25 percent nationally)
Ranking relative to national conditions–Darker colored circles generally indicatepoorer quality. Bold outline of circle indicates one or more aquatic-life criteria were exceeded.
EXPLANATION
EscanabaR
Fox R
Wolf R
Green Bay
Milwaukee
Seven major water-quality characteristics were evaluated for stream sites in each NAWQA Study Unit. Summary scores for each characteristic were computed for all sites that had adequate data. Scores for each site in the Western Lake Michigan Drainages were compared with scores for all sites sampled in the 20 NAWQA Study Units during 1992–95. Results are summarized by percentiles; higher percentile values generally indicate poorer quality compared with other NAWQA sites. Water-quality conditions at each site also are compared to established criteria for protection of aquatic life. Applicable criteria are limited to nutrients and pesticides in water and semivolatile organic compounds, organochlorine pesticides, and PCBs in sediment. (Methods used to compute rankings and evaluate aquatic-life criteria are described by Gilliom and others, in press.)
Nutrient concentrations in the study area were principally related to land use of the drainage basin. Relative to other Study Units nationally, low, moderate, and high nutrient levels were found in forested, urban, and agricultural basins, respectively. One agricultural site exceeded drinking-water standards during periods of stormwater runoff. Fertilizer and manure application to croplands is the major anthropogenic source of nutrients; however, point sources and atmospheric deposition also contribute to nutrient loading.
Atrazine was detected at all nine fixed sites where samples were analyzed for pesticides. However, concentrations were generally low, especially at sites draining basins with a low percentage of agricultural land use. At the three sites where sufficient data exist for comparison, pesticide concentrations were at or below the median national NAWQA concentration.
NUTRIENTS in water
PESTICIDES in water
ORGANOCHLORINE PESTICIDES and PCBs in bed sediment and biological tissue
WATER-QUALITY CONDITIONS IN A NATIONAL CONTEXTComparison of Stream Quality in the Western Lake Michigan Drainageswith Nationwide NAWQA Findings
Concentrations of PCBs and organochlorine compounds in three streams that drain urban areas were among the highest of all NAWQA Study Unit sites nationally. The three urban sites also exceeded aquatic-life criteria; PCB concentrations in fish have been high enough to prompt bans on fish consumption for the protection of human health. A metabolite of the persistent compound DDT (p,p’-DDE) is also commonly detected at urban sites. Concentrations at agricultural sites were moderately high, whereas those in forested basins were low compared to other national NAWQA sites.

U.S. Geological Survey Circular 1156 21
EscanabaR
Fox R
Wolf R
Green Bay
Milwaukee
EscanabaR
Fox R
Wolf R
Green Bay
Milwaukee
Green Bay
Milwaukee
EscanabaR
Fox R
Wolf R
CONCLUSIONS
In the Western Lake Michigan Drainages, com-pared to other NAWQA Study Units:
• Nutrient and pesticide concentrations areelevated in agricultural basins.
• Sites draining urban areas have elevatedconcentrations of trace elements, SVOCs,and PCBs.
• Northern forested basins have relativelygood surface-water quality; however, traceelement concentrations are slightlyelevated and fish community quality ismoderate.
Rivers in urban settings had some of the highest concentrations of SVOCs of all NAWQA sites nationwide. Three urban sites, the lower Fox and Milwaukee Rivers and Lincoln Creek, had concentrations of SVOCs that exceeded aquatic-life criteria. Forested and agricultural sites had low to moderate concentrations of SVOCs compared to sites nationwide.
Assessment of fish community degradation was based on several factors, including presence of non-native and pollutant-tolerant species, and percentage of diseased fish. Most sites within the study area have relatively high quality fish communities compared to the NAWQA sites in the rest of the Nation. However, Lincoln Creek, an urban site, had highly degraded fish community quality compared to other NAWQA sites.
Some of the highest trace-element concentrations at NAWQA sites nationally were from the lower Fox and Milwaukee Rivers, major rivers in urban settings. Concentrations of arsenic, selenium, and mercury in forested basins in the study area were near the median of all NAWQA sites nationwide. Sites dominated by agricultural land use typically had low levels of trace elements compared to other NAWQA sites nationwide.
TRACE ELEMENTS in bed sediment
FISH COMMUNITY DEGRADATION
SEMIVOLATILE ORGANIC COMPOUNDS in bed sediment
Degradation of stream habitat was based on several factors such as bank erosion, stream modification, and the stability and density of bank vegetation. The degree of stream-habitat degradation within the Study Unit depended on stream size and land use. Sites on streams draining agricultural or urbanized landscapes were degraded compared to NAWQA sites nationwide.
WATER-QUALITY CONDITIONS IN A NATIONAL CONTEXTComparison of Stream Quality in the Western Lake Michigan Drainages
with Nationwide NAWQA Findings
EscanabaR
Fox R
Wolf R
Green Bay
Milwaukee
STREAM HABITAT DEGRADATION

22 WATER QUALITY IN THE WESTERN LAKE MICHIGAN DRAINAGES, WISCONSIN AND MICHIGAN, 1992–95
Greater than the 75th percentile(among the highest 25 percent nationally)
Between the median and the 75th percentile
Between the 25th percentile and the median
Less than the 25th percentile(among the lowest 25 percent nationally)
Ranking relative to national conditions–Darker colored circles generally indicate poorer quality. Bold outline of circle indicates one or more drinking-water standards or criteria were exceeded.
EXPLANATIONAquifer unit (drinking water)
Cambrian–Ordovician aquifer, westof Maquoketa Shale
Land-use studies (shallow ground water)
Corn and alfalfa in glacial till
Corn and alfalfa in sand and gravel
Five major water-quality characteristics were evaluated for ground-water studies in each NAWQA Study Unit. Ground-water resources were divided into two categories:(1) drinking-water aquifers and (2) shallow ground water underlying agricultural or urban areas. Summary scores were computed for each characteristic for all aquifers and shallow ground-water areas that had adequate data. Scores for each aquifer and shallow ground-water area in the Western Lake Michigan Drainages were compared with scores for all aquifers and shallow ground-water areas sampled in the 20 NAWQA Study Units during 1992–95. Results are summarized by percentiles; higher percentile values generally indicate poorer quality compared with other NAWQA ground-water studies. Water-quality conditions for each drinking-water aquifer also are compared to established drinking-water standards and criteria for protection of human health. (Methods used to compute rankings and evaluate standards and criteria are described by Gilliom and others, in press.)
Nitrate concentrations in the shallow-aquifer area underlain by sand and gravel are some of the highest among the NAWQA sites nationwide, probably because highly permeable surficial deposits allow agriculturally derived nutrients to infiltrate to the ground water. The Cambrian- Ordovician drinking-water aquifer and the shallow aquifer overlain by glacial till both had low concentrations of nitrates compared to other national NAWQA data. All three areas had a few samples in which nitrate concentrations exceeded the drinking-water standard, a common occurrence in the Midwest farm belt.
Radon levels for the Cambrian-Ordovician aquifer ranked relatively high among the national NAWQA sites. A natural product of the decay of uranium, radon is a radioactive gas that was detected in all samples collected from the Cambrian-Ordovician aquifer. Two-thirds of the samples exceeded a previously proposed maximum contaminant level of 300 picocuries per liter, although few samples in the southwestern part of the aquifer had high concentrations. The lack of data restricts the ability to speculate about the presence of radon in the shallow aquifers.
RADON
NITRATE
WATER-QUALITY CONDITIONS IN A NATIONAL CONTEXTComparison of Ground-Water Quality in the Western Lake Michigan Drainageswith Nationwide NAWQA Findings
Milwaukee
Green Bay
Milwaukee
Green Bay

U.S. Geological Survey Circular 1156 23
There was only one VOC (Trihalomethanes) detected in the Study Unit, and VOC concentrations at the two wells where detected were low. None of the samples tested above drinking-water standards. Industrial by-products and some pesticides are potential sources of VOCs in ground water.
DISSOLVED SOLIDS
VOLATILE ORGANIC COMPOUNDS
PESTICIDES
CONCLUSIONS
In the Western Lake Michigan Drainages, com-pared to other NAWQA Study Units:
• Nitrate and pesticide concentrations inshallow wells in agricultural areas wereelevated; in areas with permeable surficialdeposits, they were among the highest inthe Nation.
• Drinking-water standards were exceededin a few samples in each of the threeground-water study areas for nitrates anddissolved solids.
• Radon was elevated above the previouslyproposed maximum contaminant level inthe drinking-water aquifer where it wassampled for.
• Land use is the primary influence onground-water quality, whereas surficialdeposits overlying an aquifer have asecondary influence. The confining unitoverlying parts of the Cambrian-Ordovicianaquifer provides some protection of thedrinking water from the effects of humanactivities.
WATER QUALITY CONDITIONS IN A NATIONAL CONTEXTComparison of Ground-Water Quality in the Western Lake Michigan Drainages
with Nationwide NAWQA Findings
Concentrations of dissolved solids were relatively high compared to those in other Study Units. A few samples from each aquifer had concentrations of dissolved solids that exceeded the secondary maximum contaminant level. However, the shallow aquifers are seldom used as a drinking-water source. The area overlain by glacial till had among the highest concentrations of dissolved solids compared to other NAWQA sites nationally.
Pesticide detections in the Cambrian-Ordovician aquifer were similar to the median value from NAWQA sites; however, pesticide concentrations were high in both land-use study areas compared to aquifers in other Study Units. None of the ground-water samples exceeded drinking- water standards for pesticides; however, maximum contaminant levels (MCLs) have been established for only a small percentage of the pesticides detected.
Milwaukee
Green Bay
Milwaukee
Green Bay
Milwaukee
Green Bay

STUDY DESIGN AND DATA COLLECTIONin the Western Lake Michigan Drainages
0
0 25 50 KILOMETERS
25 50 MILES
EXPLANATION
Northern Lakesand ForestsNorth CentralHardwoodForestsSoutheasternWisconsinTill PlainsCentral CornBelt Plains
Intensive-assessment siteSynoptic site
Ecoregions
Stream ecologysites
0
0 25 50 KILOMETERS
25 50 MILES
Ground-water/surface-waterinteraction site
ITFM water-quality siteITFM invertebratesite
Special studysites
EXPLANATION
0
0 25 50 KILOMETERS
25 50 MILES
Silurian–DevonianaquiferSinnipeeconfining unitCambrian–Ordovician aquiferCrystalline rocks
Bedrock aquifers andconfining units
Flow-path locationDrinking-wateraquifer survey
Ground–waterchemistry sites
Land-use survey(sand and clay,shallow ground water)Land-use survey(sand and gravel,shallow ground water)
Water
EXPLANATION
Intensive ecological assess-ments were done at the 11 Fixed Sites to define existing biological conditions to which future moni-toring results will be compared and to assess temporal variations. Synoptic studies were designed to evaluate the spatial distribution of aquatic biological community structure.
To evaluate the effects of agricultural land use and surficial deposits on shal-low ground-water quality, one aquifer overlain by sand and clay and the other by sand and gravel were studied. A drinking-water aquifer survey assessed the water-quality in the most heavily used aquifer in the Study Unit. A study in an agricultural area was designed to determine changes in nutrient and pesti-cide concentrations along shallow ground-water flow paths.
STREAM CHEMISTRY
STREAM ECOLOGY
GROUND-WATER CHEMISTRY
SPECIAL STUDIES
Additional studies provided important information on the water resources of the study area. The interaction between ground water and surface water was investigated using water-chemistry data. A comparison of water-quality sample collection, preservation, shipping, and laboratory techniques of the USGS and the Wisconsin Department of Natural Resources (WDNR) were studied to determine comparability of water-chemistry results. Differences in macroinvertebrate-collection techniques of three agencies were investigated to evaluate comparability of results.
Fixed Sites were established to examine differences in stream-water quality due to the environmental setting (land use, surficial deposits, and bedrock type) of the study area. Intensive Fixed Sites were sampled more frequently to determine seasonal variability in water quality and to test for 88 pesticides. Synoptic studies focused on sampling high and low flows to characterize concentration and spatial distribution of nutrients, pesticides, sediment, and other water-quality characteristics. Streambed sediments, aquatic insects, and fish tissue were analyzed for trace elements and organic compounds.
0
0 25 50 KILOMETERS
25 50 MILES
Stream-chemistrysites
Fixed SitesIntensive FixedSitesSynoptic sitesStreambedsediment sitesAquatic biotatissue sites
UrbanAgricultureForestWater
Generalizedland use
Mixed
EXPLANATION
24 WATER QUALITY IN THE WESTERN LAKE MICHIGAN DRAINAGES, WISCONSIN AND MICHIGAN, 1992–95

SU
c
Fix--
IntSi--
Sy--
,
Co--
),
Co--
),
Intass
,
Sy e -
La--
La--
--
Dr
--
t
Flo
Gr
IT--
4 d
IT--
STUDY DESIGN AND DATA COLLECTIONin the Western Lake Michigan Drainages
MMARY OF DATA COLLECTION IN THE WESTERN LAKE MICHIGAN DRAINAGES STUDY UNIT, 1992–95
Studyomponent
What data were collected and why Types of sites sampledNumber of
sitesSampling frequency
and period
Stream Chemistryed Sites general water chemistry
Streamflow was measured continuously and samples were collected monthly for major ions, nutrients, organic car-bon, suspended sediment, and physical properties to describe concentration, seasonal variability, and loads.
Streams draining basins ranging in size from 10 to 6,332 square miles and repre-senting forested, agricultural, urban, and mixed land uses.
11 Monthly plus storms; April 1993-July 1995
ensive Fixed tes pesticides
In addition to the above constituents, samples were ana-lyzed for 88 dissolved pesticides to describe concentra-tion and seasonal variations.
A subset of Fixed Sites draining agricul-tural and urban land-use areas.
3 Monthly during growingseason;
20 per year, 1993-94
noptic sites waterchemistry
Streamflow, nutrients, pesticides, suspended sediments, and physical properties were determined for high- and(or) low-flow conditions to describe concentrations and spatial distributions.
Streams draining basins ranging in size from 2 to 6,332 square miles and repre-senting forested, agricultural, urban, and mixed land uses.
145 total42 high flow59 low flow95 low flow
Spring and summer 1994summer 1994
July 1995
ntaminants streambedsediments
Streambed sediments were analyzed for trace elements and hydrophobic pesticides and other organic compounds to determine occurrence and spatial distribution.
Depositional zones at all Fixed Sites and numerous synoptic sites.
31 6-9 Fixed Sites in 1992(61994(8), 1995(9);
7-12 synoptic sites in 1992(12), 1995(7)
ntaminants aquatic biota
Trace elements in fish livers and organic compounds in whole insects and whole fish were sampled and analyzed to determine occurrence and spatial distribution.
All Fixed Sites and some synoptic sites. 25 4-8 Fixed Sites in 1992(41994(8), 1995(7);
6-7 synoptic sites in 1992(7), 1995(6)
Stream Ecologyensiveessments
Fish, benthic invertebrates, algae, and aquatic and riparian habitats were sampled and described to assess aquatic biological community structure in different land uses and associated habitats.
Stream reaches collocated with Fixed Sites. Sites represent the variety of land uses, bedrock geology, and surficial texture within the basin.
11 8 Indicator Sites annually1993-95; three reaches
sampled at 3 sites;3 Integrator Sites, 1995
noptic studies Fish, benthic invertebrates, algae, and aquatic and riparian habitats were described to assess spatial distribution of aquatic biological community structure of relatively pris-tine streams in an agricultural setting.
Benchmark stream reaches chosen to repre-sent relatively pristine conditions in agricultural areas. Comparison sites determine variability within RHUs.
34 20 Benchmark sites, oncin spring/summer 1993
and 1995; 12 RHU Comparison sites, 1993
Ground-Water Chemistrynd-use effects sand and clay -- shallow ground water
Major ions, nutrients, pesticides, volatile organic com-pounds (VOCs), tritium, dissolved organic carbon (DOC), chlorofluorocarbons (CFCs) and isotopes of oxy-gen, hydrogen, and uranium were sampled and analyzed for to determine effects of agriculture on the quality of recently recharged ground water in the alluvial aquifer.
Newly installed monitoring wells com-pleted at water table located using a statistically random selection process. Predominantly agricultural land use (80%): corn and alfalfa are the main crops.
26 wells, 2 springs
Once in September 1993and summer 1994
nd-use effects sand and gravel
shallow ground water
Major ions, nutrients, pesticides, VOCs, tritium, DOC, CFCs, and isotopes of oxygen, hydrogen, and uranium were sampled and analyzed for to determine effects of agriculture on the quality of recently recharged ground water in the alluvial aquifer.
Sites with monitoring wells completed at water table chosen using a statistically random selection process. Predomi-nantly agricultural land use (48%): corn and alfalfa are the main crops.
30 Once in September 1994
inking-water survey sandstone
Major ions, nutrients, pesticides, VOCs, radon, tritium, and DOC were sampled and analyzed for to assess the condi-tion of ground-water quality in the most used aquifer in the study area (40% of ground-water use).
Existing domestic, institutional, or public supply wells completed in bedrock (<900 ft.) chosen using a statistically random selection process.
29 Once in June and Augus1995
w path Major ions, nutrients, pesticides, tritium, DOC, CFCs and isotopes of oxygen, hydrogen, and nitrogen and gas com-position were sampled and analyzed to determine changes in nutrients and pesticides along a flow path.
Clusters of wells, lysimeters, and minipie-zometers along an approximate line of a ground-water flow path (2,500 ft) in an agricultural area in Sheboygan County.
10 wells,8 lysimeters,
8 minipiezom-eters, stream
1-3 times each in June 1994, May 1995, and
August 1995
Special Studiesound-water/surface-water interactions
Major ions, nutrients, pesticides, and oxygen and hydrogen isotopes were analyzed to study ground-water/surface-water interaction in the vicinity of the flowpath study area.
Tributaries to North Branch Milwaukee River and shallow ground- water sam-ples from three cross sections from the North Branch Milwaukee River.
10 tributaries,12 minipie-
zometers
Once in August 1993
FMwater quality
Total phosphorus, dissolved chloride, and suspended sedi-ment were determined to compare water-quality collec-tion, preservation, shipping, and laboratory techniques used by the USGS and WDNR.
Rivers under low-flow and high-flow con-ditions.
3 August 1993-July 1994; times each (2 low flow an
2 high flow)
FMBenthic invertebrates
Benthic-invertebrate community structure in riffles was assessed to determine if various sampling methods pre-dict water quality similarly.
Streams ranging in drainage area from 15 to 696 square miles, from cold to warm water, draining different land uses.
6 Once in May 1995
U.S. Geological Survey Circular 1156 25

Herbicide(Trade or common
Rateof
Concentration, inµg/L
The following tables summarize data collected for NAWQA studies from 1992–1995 by showing results for the Western LakeMichigan Drainages Study Unit compared to the NAWQA national range for each compound detected. The data were collected at awide variety of places and times. In order to represent the wide concentration ranges observed among Study Units, logarithmic scalesare used to emphasize the general magnitude of concentrations (such as 10, 100, or 1,000), rather than the precise number. The com-plete dataset used to construct these tables is available upon request.
Concentrations of herbicides, insecticides, volatile organic compounds, and nutrients detected in ground and surface waters of theWestern Lake Michigan Drainages Study Unit. [mg/L, milligrams per liter; µg/L, micrograms per liter; pCi/L, picocuries per liter; %,percent; <, less than; - -, not measured; trade names may vary]
EXPLANATION
Range of surface-water detections in all 20 Study Units
Detection in the Western Lake Michigan Drainages Study Unit
Range of ground-water detections in all 20 Study Units
Drinking-water standard or guidelinea
Freshwater-chronic criterion for the protection of aquatic lifea
Herbicide(Trade or common
ame)
Rateofdetec-
b
Concentration, inµg/L
0.001 0.01 0.1 1 10 100 1,000
SUMMARY OF COMPOUND DETECTIONS AND CONCENTRATIONS
name) detec-
tion b0.001 0.01 0.1 1 10 100 1,000 n
Acetochlor 27%0%
Alachlor (Lasso) 46%1%
2,6-Diethylaniline(Alachlor metabolite)
0%<1%
Atrazine (AAtrex,Gesaprim)
99%34%
Desethylatrazinec
(Atrazine metabolite)
92%47%
Benfluralin (Balan,Benefin, Bonalan)
<1%0%
Bentazon (Basagran,bentazone)
4%0%
Butylate (Sutan,Genate Plus, butilate)
1%0%
Cyanazine (Bladex,Fortrol)
76%1%
2,4-D (2,4-PA) 4%0%
DCPA (Dacthal, chlo-rthal-dimethyl)
<1%<1%
Dacthal, mono-acid(Dacthal metabolite)
1%0%
Dicamba (Banvel,Mediben, MDBA)
1%0%
Diuron (Karmex,Direx, DCMU)
3%0%
EPTC (Eptam) 34%0%
Metolachlor (Dual,Pennant)
65%3%
26 WATER QUALITY IN THE WESTERN LAKE MICHIGAN DRAINAG
tion
Metribuzin (Lexone,Sencor)
9%0%
Pebulate (Tillam) <1%0%
Pendimethalin(Prowl, Stomp)
5%0%
Prometon (Gesa-gram, prometone)
46%4%
Propachlor (Ramrod,propachlore)
<1%0%
Simazine (Aquazine,Princep, GEsatop)
82%4%
Tebuthiuron (Spike,Perflan)
5%1%
Terbacilc (Sinbar) 1%0%
Triallate (Far-Go) 0%<1%
Triclopyr (Garlon,Grazon, Crossbow)
1%0%
Trifluralin (Treflan,Trinin, Elancolan)
<1%0%
Insecticide(Trade or commonname)
Rateofdetec-
tion b
Concentration, inµg/L
Carbarylc (Sevin,Savit)
7%0%
Carbofuranc
(Furadan, Curaterr)
6%1%
0.001 0.01 0.1 1 10 100 1,000
ES, WISCONSIN AND MICHIGAN, 1992–95

Nutrient(Trade or commonname)
Rateofdetec-
Concentration, in mg/L
0.01 0.1 1 10 100 1,000 10,000 100,000
Insecticide(Trade or commonname)
Rateofdetec-
Concentration, inµg/L
0.001 0.01 0.1 1 10 100 1,000
SUMMARY OF COMPOUND DETECTIONS AND CONCENTRATIONS
Chlorpyrifos (Durs-ban, Lorsban)
1%0%
p,p’-DDE (p,p’-DDTmetabolite)
<1%<1%
Diazinon 5%0%
Dieldrin (Panoram D-31, Octalox)
1%0%
Fonofos (Dyfonate) 5%0%
gamma-HCH 1%0%
Malathion (maldison,malathon, Cythion)
2%0%
Methyl parathion(Penncap-M)
<1%0%
Phorate (Thimet,Rampart)
2%0%
Propargite (Comite,Omite, BPPS)
<1%0%
Volatile organiccompound(Trade or commonname)
Rateofdetec-
tion b
Concentration, inµg/L
total Trihalomethanes --2%
0.01 0.1 1 10 100 1,000
Dissolved ammonia 92%86%
Dissolved ammoniaplus organic nitrogenas nitrogen
95%45%
Dissolved phospho-rus as phosphorus
80%48%
Dissolved nitrite plusnitrate
86%56%
Other Rateofdetec-
tion b
Concentration, in pCi/L
Radon 222 --100%
1 10 100 1,000 10,000 100,000
tion btion b
U.S. Geological Survey Circular 1156 27

SUMMARY OF COMPOUND DETECTIONS AND CONCENTRATIONS
Herbicides, insecticides, volatile organic compounds, and nutrients not detected in ground and surface waters of the Western LakeMichigan Drainages Study Unit.
Herbicides
2,4,5-T
2,4,5-TP (Silvex, Fenoprop)
2,4-DB (Butyrac, Butox-one, Embutox Plus, Embu-tone)
Acifluorfen (Blazer, Tackle2S)
Bromacil (Hyvar X, UroxB, Bromax)
Bromoxynil (Buctril, Bro-minal)
Chloramben (Amiben,Amilon-WP, Vegiben)
Clopyralid (Stinger, Lon-trel, Reclaim, Transline)
Dichlorprop (2,4-DP, Seri-tox 50, Kildip, Lentemul)
Dinoseb (Dinosebe)
Ethalfluralin (Sonalan, Cur-bit)
Fenuron (Fenulon, Feni-dim)
Fluometuron (Flo-Met,Cotoran, Cottonex, Metu-ron)
Linuron (Lorox, Linex, Sar-clex, Linurex, Afalon)
MCPA (Rhomene, Rhonox,Chiptox)
MCPB (Thistrol)
Molinate (Ordram)
Napropamide (Devrinol)
Neburon (Neburea, Neb-uryl, Noruben)
Norflurazon (Evital, Pre-dict, Solicam, Zorial)
Oryzalin (Surflan, Dirimal)
Picloram (Grazon, Tordon)
Pronamide (Kerb, Propyza-mid)
Propanil (Stam, Stampede,Wham, Surcopur, Prop-Job)
28 WATER QUALITY
Propham (Tuberite)
Thiobencarb (Bolero, Sat-urn, Benthiocarb, Abolish)
Insecticides
3-Hydroxycarbofuran (Car-bofuran metabolite)
Aldicarb sulfone (Standak,aldoxycarb, aldicarb metab-olite)
Aldicarb sulfoxide (Aldi-carb metabolite)
Aldicarb (Temik, Ambush,Pounce)
Azinphos-methyl (Guthion,Gusathion M)
Disulfoton (Disyston, Di-Syston, Frumin AL,Solvirex, Ethylthiodemeton)
Ethoprop (Mocap, Ethopro-phos)
alpha-HCH (alpha-BHC,alpha-lindane,alpha-hexachlorocyclohexane,alpha-benzene hexachlo-ride)
Methiocarb (Slug-Geta,Grandslam, Mesurol)
Methomyl (Lanox, Lan-nate, Acinate)
Oxamyl (Vydate L, Pratt)
Parathion (Roethyl-P, Alk-ron, Panthion, Phoskil)
cis-Permethrin (Ambush,Astro, Pounce, Pramex, Per-tox, Ambushfog, Kafil, Per-thrine, Picket, Picket G,Dragnet, Talcord, Outflank,Stockade, Eksmin, Coopex,Peregin, Stomoxin, Sto-moxin P, Qamlin, Corsair,Tornade)
Propoxur (Baygon, Blat-tanex, Unden, Proprotox)
IN THE WESTERN LAKE MICH
Terbufos (Contraven,Counter, Pilarfox)
Volatile organiccompounds
1,1,1,2-Tetrachloroethane(1,1,1,2-TeCA)
1,1,1-Trichloroethane(Methylchloroform)
1,1,2,2-Tetrachloroethane
1,1,2-Trichloro-1,2,2-trif-luoroethane (Freon 113,CFC 113)
1,1,2-Trichloroethane(Vinyl trichloride)
1,1-Dichloroethane (Eth-ylidene dichloride)
1,1-Dichloroethene(Vinylidene chloride)
1,1-Dichloropropene
1,2,3-Trichlorobenzene(1,2,3-TCB)
1,2,3-Trichloropropane(Allyl trichloride)
1,2,4-Trichlorobenzene
1,2,4-Trimethylbenzene(Pseudocumene)
1,2-Dibromo-3-chloropro-pane (DBCP, Nemagon)
1,2-Dibromoethane (EDB,Ethylene dibromide)
1,2-Dichlorobenzene (o-Dichlorobenzene, 1,2-DCB)
1,2-Dichloroethane (Ethyl-ene dichloride)
1,2-Dichloropropane (Pro-pylene dichloride)
1,3,5-Trimethylbenzene(Mesitylene)
1,3-Dichlorobenzene (m-Dichlorobenzene)
1,3-Dichloropropane (Tri-methylene dichloride)
1,4-Dichlorobenzene (p-Dichlorobenzene, 1,4-DCB)
1-Chloro-2-methylben-zene (o-Chlorotoluene)
1-Chloro-4-methylben-zene (p-Chlorotoluene)
2,2-Dichloropropane
Benzene
Bromobenzene (Phenylbromide)
Bromochloromethane(Methylene chlorobro-mide)
Bromomethane (Methylbromide)
Chlorobenzene(Monochlorobenzene)
Chloroethane (Ethyl chlo-ride)
Chloroethene (Vinyl chlo-ride)
Chloromethane (Methylchloride)
Dibromomethane (Methyl-ene dibromide)
Dichlorodifluoromethane(CFC 12, Freon 12)
Dichloromethane (Methyl-ene chloride)
Dimethylbenzenes(Xylenes (total))
Ethenylbenzene (Styrene)
Ethylbenzene (Phenyle-thane)
Hexachlorobutadiene
Isopropylbenzene(Cumene)
Methyl tert-butyl etherd
(MTBE)
Methylbenzene (Toluene)
Naphthalene
Tetrachloroethene (Per-chloroethene)
Tetrachloromethane (Car-bon tetrachloride)
Trichloroethene (TCE)
Trichlorofluoromethane(CFC 11, Freon 11)
cis-1,2-Dichloroethene((Z)-1,2-Dichloroethene)
cis-1,3-Dichloropropene((Z)-1,3-Dichloropropene)
n-Butylbenzene (1-Phe-nylbutane)
n-Propylbenzene (Isoc-umene)
p-Isopropyltoluene (p-Cymene)
sec-Butylbenzene
tert-Butylbenzene
trans-1,2-Dichloroethene((E)-1,2-Dichlorothene)
trans-1,3-Dichloropropene((E)-1,3-Dichloropropene)
Nutrients
No non-detects
IGAN DRAINAGES, WISCONSIN AND MICHIGAN, 1992–95

Concentrations of semivolatile organic compounds, organochlorine compounds, and trace elements detected in fish tissue and bedsediment of the Western Lake Michigan Drainages Study Unit. [µg/g, micrograms per gram; µg/kg, micrograms per kilogram; %, percent;<, less than; - -, not measured; trade names may vary]
EXPLANATION
Range of detections in fish tissue in all 20 Study Units
Detection in bed sediment in the Western Lake Michigan Drainages Study Unit
Range of detections in bed sediment in all 20 Study Units
Guideline for the protection of aquatic lifee
Detection in fish tissue in the Western Lake Michigan Drainages Study Unit
emivolatile organicompound
Rate ofdetec-
tion b
Concentration, inµg/kg
10.1 10 100 1,000 10,000 100,000
SUMMARY OF COMPOUND DETECTIONS AND CONCENTRATIONS
1,2,4-Trichloroben-zene
--4%
1,2-Dichlorobenzene --17%
1,2-Dimethylnaphtha-lene
--33%
1,4-Dichlorobenzene --21%
1,6-Dimethylnaphtha-lene
--42%
1-Methyl-9H-fluorene --25%
1-Methylphenan-threne
--38%
1-Methylpyrene --38%
2,2-Biquinoline --4%
2,3,6-Trimethylnaph-thalene
--38%
2,6-Dimethylnaphtha-lene
--62%
2,6-Dinitrotoluene --4%
2-Ethylnaphthalene --29%
2-Methylanthracene --29%
4,5-Methyle-nephenanthrene
--29%
4-Chloro-3-methyl-phenol
--4%
9H-Carbazole --33%
Semivolatile organiccompound
Rate ofdetec-
tion b
Concentration, inµg/kg
10.1 10 100 1,000 10,000 100,000
Sc
9
A
A
A
A
A
B
B
Bt
B
Bt
B
C
C
D
D
Da
H-Fluorene --42%
cenaphthene --38%
cenaphthylene --42%
cridine --21%
nthracene --54%
nthraquinone --29%
enz[a ]anthracene --50%
enzo[a ]pyrene --50%
enzo[b ]fluoran-hene
--54%
enzo[ghi ]perylene --46%
enzo[k ]fluoran-hene
--50%
utylbenzylphthalate --38%
8-Alkylphenol --13%
hrysene --50%
i- n -butylphthalate --75%
i- n -octylphthalate --13%
ibenz[a,h ]nthracene
--29%
U.S. Geological Survey Circular 1156 29

Semivolatile organiccompound
Rate ofdetec-
tion b
Concentration, inµg/kg
10.1 10 100 1,000 10,000 100,000
Organochlorinecompound(Trade name)
Rateofdetec-
Concentration, inµg/kg
0.01 0.1 1 10 100 1,000 10,000 100,000
SUMMARY OF COMPOUND DETECTIONS AND CONCENTRATIONS
Dibenzothiophene --38%
Diethylphthalate --42%
Dimethylphthalate --17%
Fluoranthene --58%
Indeno[1,2,3-cd ]pyrene
--42%
Isoquinoline --17%
Naphthalene --42%
N-Nitrosodi-phenylamine
--4%
Phenanthrene --58%
Phenanthridine --21%
Phenol --92%
Pyrene --58%
Quinoline --21%
bis(2-Ethyl-hexyl)phthalate
--75%
p-Cresol --79%
t
p
t
D3
H
H
P
T
A
C
C
C
L
M
30 WATER QUALITY IN THE WESTERN LAKE MICHIGAN DRAINAG
otal-Chlordane 11%8%
,p’-DDE 61%33%
otal-DDT 61%33%
ieldrin (Panoram D-1, Octalox)
6%8%
eptachlor epoxide 6%0%
exachlorobenzene 6%--
CB, total 28%25%
race element Rateofdetec-
tion b
Concentration, inµg/g
rsenic 33%100%
admium 33%97%
hromium 83%100%
opper 100%97%
ead 0%100%
ercury 50%88%
Nickel 17%100%
Selenium 100%100%
Zinc 100%100%
0.01 0.1 1 10 100 1,000 10,000
tion b
ES, WISCONSIN AND MICHIGAN, 1992–95

Semivolatile organic compounds, organochlorine compounds, and trace elements not detected in fish tissue and bed sediment of theWestern Lake Michigan Drainages Study Unit.
SUMMARY OF COMPOUND DETECTIONS AND CONCENTRATIONS
Semivolatile organiccompounds
1,3-Dichlorobenzene (m-Dichlorobenzene)
2,4-Dinitrotoluene
2-Chloronaphthalene
2-Chlorophenol
3,5-Dimethylphenol
4-Bromophenyl-phe-nylether
4-Chlorophenyl-phe-nylether
Azobenzene
Benzo [c] cinnoline
Isophorone
N-Nitrosodi-n-propylamine
Nitrobenzene
Pentachloronitrobenzene
bis (2-Chloroethoxy)meth-ane
Organochlorinecompounds
Aldrin (HHDN, Octalene)
Chloroneb (chloronebe,Demosan, Soil Fungicide1823)
DCPA (Dacthal, chlorthal-dimethyl)
Endosulfan I (alpha-Endosulfan, Thiodan,Cyclodan, Beosit, Malix,Thimul, Thifor)
Endrin (Endrine)
Heptachlor (Heptachlore,Velsicol 104)
Isodrin (Isodrine, Com-pound 711)
Mirex (Dechlorane)
Pentachloroanisole (PCA,pentachlorophenol metabo-lite)
Toxaphene (Camphechlor,Hercules 3956)
a Selected water-quality standards and guidelines (Gb Rates of detection are based on the number of ana
insecticides were computed by only counting detepounds, which had widely varying detection limitsthan 0.01µg/L, or the detection rate rounds to lesslimits for most compounds were similar to the loware summarized in (Gilliom and others, in press).
c Detections of these compounds are reliable, but conas estimated values (Zaugg and others, 1995).
d The guideline for methyltert-butyl ether is between 2will be 20µg/L (Gilliom and others, in press).
e Selected sediment-quality guidelines (Gilliom and o
alpha-HCH (alpha-BHC,alpha-lindane,alpha-hexachlorocyclohexane,alpha-benzene hexachlo-ride)
beta-HCH (beta-BHC,beta-hexachlorocyclohex-ane,alpha-benzenehexachloride)
cis-Permethrin (Ambush,Astro, Pounce, Pramex,Pertox, Ambushfog, Kafil,Perthrine, Picket, Picket G,Dragnet, Talcord, Outflank,Stockade, Eksmin,Coopex, Peregin, Sto-moxin, Stomoxin P, Qam-lin, Corsair, Tornade)
delta-HCH (delta-BHC,delta-hexachlorocyclohex-ane,delta-benzenehexachloride)
gamma-HCH (Lindane,gamma-BHC, Gammex-ane, Gexane, Soprocide,
illiom and others, in press).
lyses and detections in the Sctions equal to or greater th. For herbicides and insecticthan 1 percent. For other comer end of the national range
centrations are determined w
0 and 40µg/L; if the tentative ca
thers, in press).
gamma-benzene hexachlo-ride,gamma-hexachlorocy-clohexane,gamma-benzene)
o,p’-Methoxychlor
p,p’-Methoxychlor (Mar-late, methoxychlore)
trans-Permethrin(Ambush,Astro, Pounce, Pramex,Pertox, Ambushfog, Kafil,Perthrine, Picket, Picket G,Dragnet, Talcord, Outflank,Stockade, Eksmin,Coopex, Peregin, Sto-moxin, Stomoxin P, Qam-lin, Corsair, Tornade)
U.S. Geological Sur
tudy Unit, not on national daan 0.01µg/L in order to facilitate equides, a detection rate of “<1pound groups, all detection
s shown. Method detection l
ith greater uncertainty than f
ncer classification C is acce
Trace elements
No non-detects
vey Circular 1156 31
ta. Rates of detection for herbicides andal comparisons among com-%” means that all detections are lesss were counted and minimum detectionimits for all compounds in these tables
or the other compounds and are reported
pted, the lifetime health advisory

REFERENCES
American Institute for Cancer Research, 1992, Everything doesn’t cause cancer: Washing-ton, D.C., 4 p.
Bahls, L.L., 1993, Periphyton bio-assessment methods for Montana streams: Water Quality Bureau, Montana Department of Health and Environmental Sciences,Helena, Montana, 38 p. plus appendixes.
Callender, E. and Van Metre, P.C., 1997, Reservoir sediment cores show U.S. lead declines: Environ-mental Science and Technology, v. 31, no. 9, p. 424A-428A.
Fitzgerald, S.A., 1997, Results of qual-ity-control sampling of water, bed sediment, and tissue in the West-ern Lake Michigan Drainages Study Unit of the National Water-Quality Assessment Program: U.S. Geological Survey Water-Resources Investigations Report 97-4148, 24 p.
Fitzgerald, S.A., and Steuer, J.J., 1996, The Fox River PCB transport study — Stepping stone to a healthy Great Lakes ecosystem: U.S. Geological Survey Fact Sheet FS-116-96, 4 p.
Fitzpatrick, F.A., and Giddings, E.M.P., 1997, Stream habitat characteristics of fixed sites in the Western Lake Michigan Drain-ages, Wisconsin and Michigan, 1993–95: U.S. Geological Sur-vey Water-Resources Investiga-tions Report 95-4211-B, 58 p.
Fitzpatrick, F.A., Peterson, E.M., and Stewart, J.S., 1996, Habitat char-acteristics of benchmark streams in agricultural areas of eastern Wisconsin: U.S. Geological Sur-vey Water-Resources Investiga-tions Report 96-4038-B, 35 p.
Gianessi, L.P., and Puffer, C., 1991, Herbicide use in the United States: Quality of the Environ-ment Division, Resources for the Future, Washington, D.C., 128 p.
Gilliom, R.J., Mueller, D.K., and Now-ell, L.H., in press, Methods for comparing water-quality condi-tions among National Water-Quality Assessment Study Units, 1992–95: U.S. Geological Sur-vey Open-File Report 97-589.
Girvin, K.M., 1996, Herbicide trans-port in surface waters and poten-tial effects in aquatic ecosystems: Madison, University of Wiscon-sin, Master’s thesis, 160 p.
Goodbred, S.L., Gilliom, R.J., Gross, T.S., Denslow, N.P., Bryant, W.L., and Schoeb, T.R., 1997, Recon-naissance of 17Β-Estradiol, 11-Ketotestosterone, Vitellogenin, and Gonad Histopathology in Common carp of United States Streams: Potential for Contami-nant-Induced Endocrine Disrup-tion: U.S. Geological Survey Open-File Report 96-627, 47 p.
Goolsby, D.A., Thurman, E.M., Pom-mes, M.L., and Battaglin, W.A., 1994, Temporal and geographic distribution of herbicides in pre-cipitation in the midwest and northeast United States, 1990-91, in Weigmann, D.L., ed., New directions in pesticide research, development, management, and policy: Proceedings of the Fourth National Pesticide Conference, Richmond, Virginia, November 1-3, 1993.
Hilsenhoff, W.L., 1987, An improved biotic index of organic stream pollution: Great Lakes Entomolo-gist, v. 20, p. 31-39.
Horn, Marilee, March-May 1997, U.S. Geological Survey, written com-munication.
Ingersoll, C.G., Haverland, P.S., Bran-son, E.L., Canfield, T.J., Dwyer, F.J., Henke, C.E., Kemble, N.E., Mount D.R., and Fox, R.G., 1996, Calculations and evaluations of sediment effect concentration for the amphipod Hyalella azteca and the midge Chironomus riparius: Journal of Great Lakes Research, v. 22, no. 3, p. 602-623.
Influence of the natural environment was considered wheninvestigating water chemistry.
32 WATER QUALITY IN THE WESTERN LAKE MICHIGAN DRAINAGES, WISCONSIN AND MICHIGAN, 1992–95

REFERENCES
Effects of agriculture on water quality was a focus of theWestern Lake MIchigan Drainages study.
Intergovernmental Task Force on Monitoring Water Quality, 1994, The Strategy for improving water quality monitoring in the United States – Final Report of the Inter-governmental Task Force on Monitoring Water Quality: U.S. Geological Survey, Office of Water Data Coordinations, Reston, Va, 25 p.
International Joint Commission, 1989, Report on Great Lakes water quality: Windsor, Ontario, Great Lakes Water Quality Branch, 128 p.
Lenz, B.N., 1997, Feasibility of com-bining two aquatic invertebrate databases for water-quality assessment: U.S. Geological Sur-vey Fact Sheet FS-132-97, 4 p.
Lenz, B.N., and Miller, M.A., 1996, Comparison of aquatic macroin-vertebrate samples collected using different field methods: U.S. Geological Survey Fact Sheet FS-216-96, 4 p.
Lyons, J.D., 1992, Using the Index of Biotic Integrity (IBI) to measure environmental quality in warm-water streams of Wisconsin: U.S. Department of Agriculture Forest Service General Technical Report NC-149, 51 p.
Lyons, J.D., Wang, L., and Simonson, T.D., 1996, Development and val-idation of an index of biotic integ-rity for coldwater streams in Wisconsin: North American Jour-nal of Fisheries Management,v. 16, no. 2, p. 241-256.
Majewski, M.S., and Capel, P.D., 1995, Pesticides in the atmo-sphere – Distribution, trends and governing factors, Volume One of Pesticides in the Hydrologic Sys-tem: Ann Arbor Press, Inc., Chelsea, Mich., 214 p.
Matzen, A.M., and Saad, D.A., 1996, Pesticides in ground water in the Western Lake Michigan Drain-ages, Wisconsin and Michigan, 1983–1995: U.S. Geological Sur-vey Fact Sheet FS-192-96, 4 p.
Michigan Department of Natural Resources, 1991, Qualitative bio-logical and habitat survey proto-cols for wadeable streams and rivers: Michigan Department of Natural Resources, Surface Water Quality Division, Great Lakes and Environmental Assessment Section, GLEAS Procedures 51, 40 p.
Persaud, D., Jaagumagi, R., and Hay-ton, A., 1993, Guidelines for the protection and management of aquatic sediment quality in Ontario: Ontario Ministry of Environment and Energy, Water Resources Branch, August 1993, 27 p.
Peters, C.A., editor, 1997, Environ-mental setting and implications for water quality in the Western Lake Michigan Drainages: U.S. Geological Survey Water-Resources Investigations Report 97-4196, 79 p.
Rheaume, S.J., Lenz, B.N., and Scud-der, B.C., 1996, Benthic inverte-brates of benchmark streams in agricultural areas of eastern Wis-consin —Western Lake Michigan Drainages: U.S. Geological Sur-vey Water-Resources Investiga-tions Report 96-4038-C, 39 p.
Rheaume, S.J., Stewart, J.S., and Lenz, B.N., 1996, Environmental set-ting of benchmark streams in agricultural areas of eastern Wis-consin: U.S. Geological Survey Water-Resources Investigations Report 96-4038-A, 50 p.
Richards, K.D., Sullivan, D.J., and Stewart, J.S., in press, Surface-water quality at Fixed Sites in the Western Lake Michigan Drain-ages, Wisconsin and Michigan, and the effects of natural and human factors, 1993–95: U.S. Geological Survey Water-Resources Investigations Report 97-4208.
Robertson, D.M., 1996a, Sources and transport of phosphorus in the Western Lake Michigan Drain-ages: U.S. Geological Survey Fact Sheet FS-208-96, 4 p.
U.S. Geological Survey Circular 1156 33
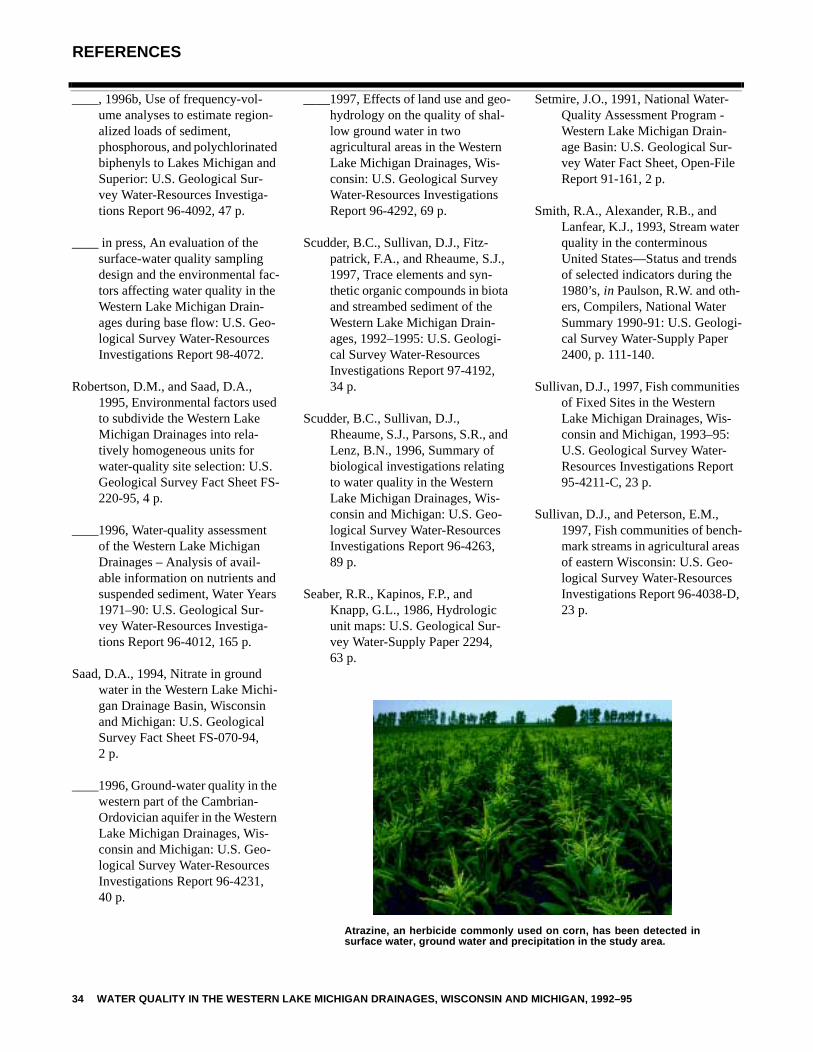
REFERENCES
____, 1996b, Use of frequency-vol-ume analyses to estimate region-alized loads of sediment, phosphorous, and polychlorinated biphenyls to Lakes Michigan and Superior: U.S. Geological Sur-vey Water-Resources Investiga-tions Report 96-4092, 47 p.
____ in press, An evaluation of the surface-water quality sampling design and the environmental fac-tors affecting water quality in the Western Lake Michigan Drain-ages during base flow: U.S. Geo-logical Survey Water-Resources Investigations Report 98-4072.
Robertson, D.M., and Saad, D.A., 1995, Environmental factors used to subdivide the Western Lake Michigan Drainages into rela-tively homogeneous units for water-quality site selection: U.S. Geological Survey Fact Sheet FS-220-95, 4 p.
____1996, Water-quality assessment of the Western Lake Michigan Drainages – Analysis of avail-able information on nutrients and suspended sediment, Water Years 1971–90: U.S. Geological Sur-vey Water-Resources Investiga-tions Report 96-4012, 165 p.
Saad, D.A., 1994, Nitrate in ground water in the Western Lake Michi-gan Drainage Basin, Wisconsin and Michigan: U.S. Geological Survey Fact Sheet FS-070-94, 2 p.
____1996, Ground-water quality in the western part of the Cambrian-Ordovician aquifer in the Western Lake Michigan Drainages, Wis-consin and Michigan: U.S. Geo-logical Survey Water-Resources Investigations Report 96-4231, 40 p.
____1997, Effects of land use and geo-hydrology on the quality of shal-low ground water in two agricultural areas in the Western Lake Michigan Drainages, Wis-consin: U.S. Geological Survey Water-Resources Investigations Report 96-4292, 69 p.
Scudder, B.C., Sullivan, D.J., Fitz-patrick, F.A., and Rheaume, S.J., 1997, Trace elements and syn-thetic organic compounds in biota and streambed sediment of the Western Lake Michigan Drain-ages, 1992–1995: U.S. Geologi-cal Survey Water-Resources Investigations Report 97-4192, 34 p.
Scudder, B.C., Sullivan, D.J., Rheaume, S.J., Parsons, S.R., and Lenz, B.N., 1996, Summary of biological investigations relating to water quality in the Western Lake Michigan Drainages, Wis-consin and Michigan: U.S. Geo-logical Survey Water-Resources Investigations Report 96-4263, 89 p.
Seaber, R.R., Kapinos, F.P., and Knapp, G.L., 1986, Hydrologic unit maps: U.S. Geological Sur-vey Water-Supply Paper 2294, 63 p.
Setmire, J.O., 1991, National Water-Quality Assessment Program - Western Lake Michigan Drain-age Basin: U.S. Geological Sur-vey Water Fact Sheet, Open-File Report 91-161, 2 p.
Smith, R.A., Alexander, R.B., and Lanfear, K.J., 1993, Stream water quality in the conterminous United States—Status and trends of selected indicators during the 1980’s, in Paulson, R.W. and oth-ers, Compilers, National Water Summary 1990-91: U.S. Geologi-cal Survey Water-Supply Paper 2400, p. 111-140.
Sullivan, D.J., 1997, Fish communities of Fixed Sites in the Western Lake Michigan Drainages, Wis-consin and Michigan, 1993–95: U.S. Geological Survey Water-Resources Investigations Report 95-4211-C, 23 p.
Sullivan, D.J., and Peterson, E.M., 1997, Fish communities of bench-mark streams in agricultural areas of eastern Wisconsin: U.S. Geo-logical Survey Water-Resources Investigations Report 96-4038-D, 23 p.
Atrazine, an herbicide commonly used on corn, has been detected insurface water, ground water and precipitation in the study area.
34 WATER QUALITY IN THE WESTERN LAKE MICHIGAN DRAINAGES, WISCONSIN AND MICHIGAN, 1992–95

REFERENCES
Sullivan, D.J., Peterson, E.M., and Richards, K.D., 1995, Environ-mental Setting of Fixed Sites in the Western Lake Michigan Drainages, Michigan and Wiscon-sin: U.S. Geological Survey Water-Resources Investigations Report 95-4211-A, 30 p.
Sullivan, D.J., and Richards, K.D., 1996, Pesticides in streams of the Western Lake Michigan Drain-ages, Wisconsin and Michigan, 1993-95: U.S. Geological Survey Fact Sheet FS-107-96, 4 p.
Sullivan, J.R., and Delfino, J.J., 1982, A select inventory of chemicals used in Wisconsin’s lower Fox River Basin: University of Wis-consin, Madison, Sea Grant Insti-tute Publication WIS-SG-82-238, 176 p.
Swackhamer, D.L., and Skoglund, R.S., 1993, Environmental toxi-cology and chemistry: v. 1,p. 831-838.
U.S. Department of Commerce, 1991, 1990 Census of population and housing, summary population and housing characteristics, Wiscon-sin: Bureau of the Census, CPH–1–51, 370 p.
U.S. Environmental Protection Agency, 1986, Quality criteria for water, 1986, and update no. 1 and update no. 2 (May1, 1987): Wash-ington, D.C., EPA-44015-86-001 [variously paginated].
U.S. Environmental Protection Agency, 1996, Drinking water regulations and health advisories: Washington, D.C., U.S. Environ-mental Protection Agency, Office of Water, EPA-822-B-96-002, 11 p.
Wisconsin Department of Natural Resources, 1978, Investigation of chlorinated and nonchlorinated compounds in the Lower Fox River Watershed: U.S. Environ-mental Protection Agency, EPA/905-3-78-004., 229 p.
Wisconsin Department of Natural Resources, 1993, Upper Green Bay Basin Water Quality Man-agement Plan: Wisconsin Depart-ment of Natural Resources, PUBL-WR-319-93, 238 p.
Wisconsin Department of Natural Resources and U.S. Geological Survey, 1994, A comparison of water-quality sample collection methods used by the U.S. Geo-logical Survey and the Wisconsin Department of Natural Resources in “Findings of the Wisconsin Pilot for the Intergovernmental Task Force on Monitoring Water Quality”: U.S. Geological Survey, Reston, Va., 42 p.
Zaugg, S.D., Sandstrom, M.W., Smith, S.G. and Fehlberg, K.M., 1995, Methods of Analysis by the U.S. Geological Survey National Water Quality Labora-tory—Determination of pesti-cides in water by C–18 solid-phase extraction and capillary-column gas chromatogra-phy/mass spectrometry with selected-ion monitoring: U.S. Geological Survey Open File-Report 95-181, 49p.
U.S. Geological Survey Circular 1156 35

GLOSSARY
The terms in this glossary were com-piled from numerous sources. Some definitions have been modified and may not be the only valid ones for these terms.
Alluvial aquifer - A water-bearing deposit of unconsolidated mate-rial (sand and gravel) left behind by a river or other flowing water.
Anthropogenic - Occurring because of, or influenced by, human activ-ity.
Aquatic-life criteria - Water-quality guidelines for protection of aquatic life. Often refers to U.S. Environmental Protection Agency water-quality criteria for protection of aquatic organisms. See also Water-quality guidelines and Water-quality criteria.
Aquifer - A water-bearing layer of soil, sand, gravel, or rock that will yield usable quantities of water to a well.
Atmospheric deposition - The trans-fer of substances from the air to the surface of the Earth, either in wet form (rain, fog, snow, dew, frost, hail) or in dry form (gases, aerosols, particles).
Base flow - Sustained, low flow in a stream; ground-water discharge is the source of base flow in most places.
Basin - See Drainage basin.
Bedrock - General term for consoli-dated (solid) rock that underlies soils or other unconsolidated material.
Bed sediment - The material that temporarily is stationary in the bottom of a stream or other water-course.
Bed sediment and tissue studies - Assessment of concentrations and distributions of trace elements and hydrophobic organic contam-inants in streambed sediment and tissues of aquatic organisms to identify potential sources and to assess spatial distribution.
Benchmark streams - Sites selected to represent standards of refer-ence for comparison to other streams in similar physical set-tings.
Benthic - Refers to plants or animals that live on the bottom of lakes, streams, or oceans.
Benthic invertebrates - Insects, mol-lusks, crustaceans, worms, and other organisms without a back-bone that live in, on, or near the bottom of lakes, streams, or oceans.
Bioaccumulation - The biological sequestering of a substance at a higher concentration than that at which it occurs in the surrounding environment or medium. Also, the process whereby a substance enters organisms through the gills, epithelial tissues, dietary, or other sources.
Bioavailability - The capacity of a chemical constituent to be taken up by living organisms either through physical contact or by ingestion.
Biota - Living organisms.
Blue-baby syndrome - A condition that can be caused by ingestion of high amounts of nitrate resulting in the blood losing its ability to effectively carry oxygen. It is most common in young infants and certain elderly people.
Carbonate rocks - Rocks (such as limestone or dolostone) that are composed primarily of minerals (such as calcite and dolomite) containing the carbonate ion (CO3
-2).
Climate - The sum total of the meteo-rological elements that character-ize the average and extreme conditions of the atmosphere over a long period of time at any one place or region of the Earth’s sur-face.
Community - In ecology, the species that interact in a common area.
Cattle may destroy habitat and increase nutrient concentrations in streams.
36 WATER QUALITY IN THE WESTERN LAKE MICHIGAN DRAINAGES, WISCONSIN AND MICHIGAN, 1992–95

GLOSSARY
Concentration - The amount or mass of a substance present in a given volume or mass of sample. Usu-ally expressed as micrograms per liter (water sample) or micro-grams per kilogram (sediment or tissue sample).
Confined aquifer (artesian aquifer) - An aquifer that is completely filled with water under pressure and that is overlain by material that restricts the movement of water.
Confining layer - A layer of sediment or lithologic unit of low perme-ability that bounds an aquifer.
Constituent - A chemical or biologi-cal substance in water, sediment, or biota that can be measured by an analytical method.
Contamination - Degradation of water quality compared to origi-nal or natural conditions due to human activity.
Criterion - A standard rule or test on which a judgment or decision can be based.
Cubic foot per second (ft3/s, or cfs) - Rate of water discharge represent-ing a volume of 1 cubic foot pass-ing a given point during 1 second, equivalent to approximately 7.48 gallons per second or 448.8 gal-lons per minute or 0.02832 cubic meter per second.
Degradation products - Compounds resulting from transformation of an organic substance through chemical, photochemical, and/or biochemical reactions.
DDT - Dichloro-diphenyl-trichloroet-hane. An organochlorine insecti-cide no longer registered for use in the United States.
Discharge - Rate of fluid flow passing a given point at a given moment in time, expressed as volume per unit of time.
Dissolved constituent - Operationally defined as a constituent that passes through a 0.45-micrometer filter.
Dissolved solids - Amount of miner-als, such as salt, that are dissolved in water; amount of dissolved sol-ids is an indicator of salinity or hardness.
Drainage basin - The portion of the surface of the Earth that contrib-utes water to a stream through overland runoff, including tribu-taries and impoundments.
Drinking-water standard or guide-line - A threshold concentration in a public drinking-water supply, designed to protect human health. As defined here, standards are U.S. Environmental Protection Agency regulations that specify the maximum contamination lev-els for public water systems required to protect the public wel-fare; guidelines have no regula-tory status and are issued in an advisory capacity.
Ecological studies - Studies of biolog-ical communities and habitat characteristics to evaluate the effects of physical and chemical characteristics of water and hydrologic conditions on aquatic biota and to determine how bio-logical and habitat characteristics differ among environmental set-tings in NAWQA Study Units.
Effects Range Low (ERL) - Concen-tration below which effects are rarely observed or predicted among sensitive life stages and (or) species of biota for Sediment Effect Concentrations used to evaluate sediment concentrations of trace elements and synthetic organic compounds.
Effects Range Median (ERM) - Con-centration above which effects are frequently or always observed among most species of biota for Sediment Effect Concentrations used to evaluate sediment con-centrations of trace elements and synthetic organic compounds.
Environmental setting - Land area characterized by a unique combi-nation of natural and human-related factors, such as row-crop cultivation or glacial-till soils.
Equal-width increment (EWI) sam-ple - A composite sample across a section of stream with equal spac-ing between verticals and equal transit rates within each vertical that yields a representative sam-ple of stream conditions.
Eutrophication - The process by which water becomes enriched with plant nutrients, most com-monly phosphorus and nitrogen.
Fertilizer - Any of a large number of natural or synthetic materials, including manure and nitrogen, phosphorus, and potassium com-pounds, spread on or worked into soil to increase its fertility.
Fish community - See Community.
U.S. Geological Survey Circular 1156 37

GLOSSARY
Fixed Sites - Sites on streams at which streamflow is measured and sam-ples are collected for temperature, salinity, suspended sediment, major ions and metals, nutrients, and organic carbon to assess the broad-scale spatial and temporal character and transport of inor-ganic constituents of streamwater in relation to hydrologic condi-tions and environmental settings. See also Intensive Fixed Sites.
Flow path - An underground route for ground-water movement, extend-ing from a recharge (intake) zone to a discharge (output) zone such as a shallow stream.
Flow path study - Network of clus-tered wells located along a flow-path extending from a recharge zone to a discharge zone, prefera-bly a shallow stream. The studies examine the relations of land-use practices, ground-water flow, and contaminant occurrence and transport. These studies are located in the area of one of the land-use studies.
Glacial till - An unsorted deposit of a wide range of grain sizes directly related to a glacier.
Grab sample - A sample collected from one to three points in a stream using a Van Dorn sampler.
Ground water - In general, any water that exists beneath the land sur-face, but more commonly applied to water in fully saturated soils and geologic formations.
Habitat - The part of the physical environment where plants and animals live.
Herbicide - A chemical or other agent applied for the purpose of killing undesirable plants. See also Pesti-cide.
Indicator Sites - Stream sampling sites located at outlets of drainage basins with relatively homoge-neous land use and physio-graphic conditions; most Indicator-Site basins have drain-age areas ranging from 20 to 200 square miles.
Integrator or Mixed-Use Site - Stream sampling site located at an outlet of a drainage basin that contains multiple environmental settings. Most Integrator Sites are on major streams with relatively large drainage areas.
Intensive Fixed Sites - Fixed Sites with increased sampling fre-quency during selected seasonal periods and analysis of dissolved pesticides for 1 year. Most NAWQA Study Units have one to two Integrator Intensive Fixed Sites and one to four Indicator Intensive Fixed Sites.
Land-use Study - A network of shal-low wells in an area having a rela-tively uniform land use. These studies are to be as a subset of the Study-Unit Survey and have the goal of relating the quality of shallow ground water to land use. See also Study-Unit Survey.
Lowest Effect Level (LEL) - Concen-tration that 95% of the benthic biota can tolerate as part of the Ontario Ministry of Environment and Energy’s established guide-lines for evaluating sediment con-centration of trace elements and synthetic organic compounds as based on freshwater biota.
Major ions - Constituents commonly present in concentrations exceed-ing 1.0 milligram per liter. Dis-solved cations generally are calcium, magnesium, sodium, and potassium; the major anions are sulfate, chloride, fluoride, nitrate, and those contributing to alkalin-ity, most generally assumed to be bicarbonate and carbonate.
Maximum contaminant level (MCL) - Maximum permissible level of a contaminant in water that is deliv-ered to any user of a public water system. MCLs are enforceable standards established by the U.S. Environmental Protection Agency.
Median - The middle or central value in a distribution of data ranked in order of magnitude. The median is also known as the 50th percen-tile.
Indexes of biological integrity were calculated for fish, algae,invertebrates and habitat at 28 sites in the study area.
38 WATER QUALITY IN THE WESTERN LAKE MICHIGAN DRAINAGES, WISCONSIN AND MICHIGAN, 1992–95

GLOSSARY
Metabolite - A substance produced in or by biological processes.
Micrograms per liter (µg/L) - A unit expressing the concentration of constituents in solution as weight (micrograms) of solute per unit volume (liter) of water; equiva-lent to one part per billion in most stream water and ground water. One thousand micrograms per liter equals 1 mg/L.
Milligrams per liter (mg/L) - A unit expressing the concentration of chemical constituents in solution as weight (milligrams) of solute per unit volume (liter) of water; equivalent to one part per million in most streamwater and ground water. One thousand micrograms per liter equals 1 mg/L.
Monitoring - Repeated observation or sampling at a site, on a scheduled or event basis, for a particular purpose.
Monitoring well - A well designed for measuring water levels and test-ing ground-water quality.
Nitrate - An ion consisting of nitrogen and oxygen (NO3
-). Nitrate is a plant nutrient and is very mobile in soils.
Nutrient - Element or compound essential for animal and plant growth. Common nutrients in fer-tilizer include nitrogen, phospho-rus, and potassium.
Organochlorine compound - Syn-thetic organic compounds con-taining chlorine. As generally used, term refers to compounds containing mostly or exclusively carbon, hydrogen, and chlorine. Examples include organochlorine insecticides, polychlorinated biphenyls, and some solvents containing chlorine.
Permeable - The ability to allow flu-ids or gases to move through material such as ground water moving through a porous aquifer.
Pesticide - A chemical applied to crops, rights of way, lawns, or residences to control weeds, insects, fungi, nematodes, rodents or other “pests.”
Phosphorus - A nutrient essential for growth that can play a key role in stimulating aquatic growth in lakes and streams.
Picocurie (pCi) - One trillionth (10-12) of the amount of radioactivity represented by a curie (Ci). A curie is the amount of radioactiv-ity that yields 3.7 x 10¹⁰ radioac-tive disintegrations per second (dps). A picocurie yields 2.22 dis-integrations per minute (dpm) or 0.037 dps.
Point source - A source at a discrete location such as a discharge pipe, drainage ditch, tunnel, well, con-centrated livestock operation, or floating craft.
Pollutant - Any substance that, when present in a hydrologic system at sufficient concentration, degrades water quality in ways that are or could become harmful to human and(or) ecological health or that impair the use of water for recre-ation, agriculture, industry, com-merce, or domestic purposes.
Polychlorinated biphenyl (PCB) - A mixture of chlorinated derivatives of biphenyl, marketed under the trade name Aroclor with a num-ber designating the chlorine con-tent (such as Aroclor 1260). PCBs were used in transformers and capacitors for insulating pur-poses and in gas pipeline systems as a lubricant. Further sale for new use was banned by law in 1979.
Precipitation - Any or all forms of water particles that fall from the atmosphere, such as rain, snow, hail, and sleet.
Radon - A naturally occurring, color-less, odorless, radioactive gas formed by the disintegration of the element radium; damaging to human lungs when inhaled.
Recharge - Water that infiltrates the ground and reaches the saturated zone.
Retrospective analysis - Review and analysis of existing data in order to address NAWQA objectives, to the extent possible, and to aid in the design of NAWQA studies.
Riffle - A shallow part of the stream where water flows swiftly over completely or partially sub-merged obstructions to produce surface agitation.
Runoff - Excess rainwater or snow-melt that is transported to streams by overland flow, tile drains, or ground water.
Secondary Maximum Contaminant Level (SMCL) - The maximum contamination level in public water systems that, in the judge-ment of the U.S. Environmental Protection Agency (USEPA), are required to protect the public wel-fare. SMCLs are secondary (non-enforceable) drinking water regulations established by the USEPA for contaminants that may adversely affect the odor or appearance of such water.
Sediment - Particles, derived from rocks or biological materials, that have been transported by a fluid or other natural process, sus-pended or settled in water.
U.S. Geological Survey Circular 1156 39

GLOSSARY
Semivolatile organic compound (SVOC) - Operationally defined as a group of synthetic organic compounds that are solvent-extractable and can be determined by gas chromatography/mass spectrometry. SVOCs include phenols, phthalates, and polycy-clic aromatic hydrocarbons (PAHs).
Severe Effect Level (SEL) - Concen-tration at which pronounced effects can be expected for the benthic community as part of the Ontario Ministry of Environment and Energy’s established guide-lines for evaluating sediment con-centration of trace elements and synthetic organic compounds as based on freshwater biota.
Streamflow - A type of channel flow, applied to that part of surface run-off in a stream whether or not it is affected by diversion or regula-tion.
Study Unit - A major hydrologic sys-tem of the United States in which NAWQA studies are focused. Study Units are geographically defined by a combination of ground- and surface-water fea-tures and generally encompass more than 4,000 square miles of land area.
Surface water - An open body of water, such as a lake, river, or stream.
Surficial deposits - Material, usually unconsolidated, overlying bed-rock. Surficial deposits in the Study Unit are primarily glacial and alluvial related.
Suspended (as used in tables of chem-ical analyses) - The amount (con-centration) of undissolved material in a water-sediment mix-ture. It is associated with the material retained on a 0.45- micrometer filter.
Tissue study - The assessment of con-centrations and distributions of trace elements and certain organic contaminants in tissues of aquatic organisms.
Trace element - An element found in only minor amounts (concentra-tions less than 1.0 milligram per liter) in water or sediment; includes arsenic, cadmium, chro-mium, copper, lead, mercury, nickel, and zinc.
Urban Site - A site that has greater than 50 percent urbanized and less than 25 percent agricultural area.
Water-quality criteria - Specific lev-els of water quality which, if reached, are expected to render a body of water unsuitable for its designated use. Commonly refers to water-quality criteria estab-lished by the U.S. Environmental Protection Agency. Water-quality criteria are based on specific lev-els of pollutants that would make the water harmful if used for drinking, swimming, farming, fish production, or industrial pro-cesses.
Water-quality guidelines - Specific levels of water quality which, if reached, may adversely affect human health or aquatic life. These are nonenforceable guide-lines issued by a governmental agency or other institution.
Water-quality standards - State-adopted and U.S. Environmental Protection Agency-approved ambient standards for water bod-ies. Standards include the use of the water body and the water-quality criteria that must be met to protect the designated use or uses.
Watershed - See Drainage basin.
Water table - The point below the land surface where ground water is first encountered and below which the earth is saturated. Depth to the water table varies widely across the country.
Wetlands - Ecosystems whose soil is saturated for long periods season-ally or continuously including marshes, swamps, and ephemeral ponds.
Logging can increase sediment concentrations and reduce habitat in streams.
40 WATER QUALITY IN THE WESTERN LAKE MICHIGAN DRAINAGES, WISCONSIN AND MICHIGAN, 1992–95

Peters and others • W
ater Quality in the W
estern Lake Michigan D
rainagesU
SGS C
ircular 1156 • 1998
La
keM
ich
iga
n
Milwaukee
Green Bay
Gre
enBa
y
Wolf R
.
Fo x R.
Milwaukee R.
LakeWinnebago
Menominee R.
MICHIGANWISCONSIN
National Water-Quality Assessment (NAWQA) ProgramWestern Lake Michigan Drainages
NAWQA