water quality improvement plan - cape york nrm
TRANSCRIPT

Cape York Natural Resource Management | 2016
EASTERN CAPE YORK
WATER QUALITYIMPROVEMENT PLAN

Note to the reader ... . . . . . . . . . . . . 1
Referencing this document ... . . . . . . . . . . . . 1
General disclaimer .... . . . . . . . . . . . 1
Acknowledgements .... . . . . . . . . . . . 1
EXECUTIVE SUMMARY . . . . . . . . . . . . . . . 2
Chapter 1: Summary . . . . . . . . . . . . . . . 6
Introduction .... . . . . . . . . . . . 6
Purpose of the Eastern Cape York Water Quality Improvement Plan .... . . . . . . . . . . . 7
Key principles of the Eastern Cape York Water Quality Improvement Plan .... . . . . . . . . . . . 9
The planning region .... . . . . . . . . . . . 9
Characteristics of eastern Cape York .... . . . . . . . . . . . 13
Community consultation and science synthesis ... . . . . . . . . . . . . 16
Environmental Values .... . . . . . . . . . . . 17
Current condition of water quality ... . . . . . . . . . . . . 27
Freshwater and estuary water quality ... . . . . . . . . . . . . 27
Freshwater and estuary water quality guidelines and targets ... . . . . . . . . . . . . 27
Annual loads of suspended sediments and nutrients ... . . . . . . . . . . . . 32
Marine water quality ... . . . . . . . . . . . . 35
Current condition of ecosystem health ... . . . . . . . . . . . . 38
Estuarine systems .... . . . . . . . . . . . 38
Coastal wetlands .... . . . . . . . . . . . 38
Coral reefs ... . . . . . . . . . . . . 38
Potential Biodiversity Impact Matrix ... . . . . . . . . . . . . 39
Seagrass .... . . . . . . . . . . . 41
Dugongs .... . . . . . . . . . . . 41
Sediment and Cape York .... . . . . . . . . . . . 42
Relative risk of water quality ... . . . . . . . . . . . . 44
Zonesofinfluenceofriverfloodplumes . . . . . . . . . . . . . . . 46
Relative risk of water quality to important habitat features .... . . . . . . . . . . . 47
Water Quality Objectives, Water Quality Targets and Management Action Targets .... . . . . . . . . . . . 50
Target summary .... . . . . . . . . . . . 51
Super Gauge technology to accurately measure pollutant loads delivered to the Great Barrier Reef ... . . . . 57
Catchment land use, disturbances and pollution sources .... . . . . . . . . . . . 59
Catchment land use .... . . . . . . . . . . . 59
Grazing and nature and cultural conservation .... . . . . . . . . . . . 60
Agriculture .... . . . . . . . . . . . 60
Urban .... . . . . . . . . . . . 61
Mining .... . . . . . . . . . . . 61
Native forestry ... . . . . . . . . . . . . 61
Ports and shipping .... . . . . . . . . . . . 62
Disturbances .... . . . . . . . . . . . 62
Roads .... . . . . . . . . . . . 62
ConTEnTS

Fire ... . . . . . . . . . . . . 62
Feral animals .... . . . . . . . . . . . 63
Weeds .... . . . . . . . . . . . 63
Management actions to improve water quality ... . . . . . . . . . . . . 67
Grazing .... . . . . . . . . . . . 69
Nature and cultural conservation .... . . . . . . . . . . . 71
Agriculture (horticulture, cropping and plantation forestry) ... . . . . . . . . . . . . 73
Native forestry ... . . . . . . . . . . . . 75
Urban, rural residential and roads .... . . . . . . . . . . . 76
Mining .... . . . . . . . . . . . 78
Ports and shipping .... . . . . . . . . . . . 78
Wetlands .... . . . . . . . . . . . 79
Gullies .... . . . . . . . . . . . 81
Roads,tracks,fencelinesandfirebreaks . . . . . . . . . . . . . . . 83
Impact of main and council roads on water quality on Cape York Peninsula and the Great Barrier Reef ... 85
Fire ... . . . . . . . . . . . . 87
Feral animals – cattle, horses and pigs .... . . . . . . . . . . . 89
Weeds .... . . . . . . . . . . . 91
Chapter 2: Implementation Plan . . . . . . . . . . . . . . . 93
Priority focus for implementation .... . . . . . . . . . . . 93
Northern section (Jacky Jacky, Olive Pascoe and Lockhart) .. . . . . . . . . . . . . . 93
Central section (Stewart, Hann and Normanby) ... . . . . . . . . . . . . 93
Southern section (Jeanie and Endeavour) ... . . . . . . . . . . . . 94
Strategic and staged approach to implementation .... . . . . . . . . . . . 95
Climatechangedefinesourtimelineforimplementation . . . . . . . . . . . . . . . 95
GBR-wideandglobalissuesthatinfluenceimplementation . . . . . . . . . . . . . . . 96
Cape York Catchments to Coral Partnership .... . . . . . . . . . . . 96
Cape York Catchments to Coral management committee .... . . . . . . . . . . . 96
Cape York Catchments to Coral working groups .... . . . . . . . . . . . 98
Working group processes .... . . . . . . . . . . . 99
Implementation costings .... . . . . . . . . . . . 99
Gully management ... . . . . . . . . . . . . 100
Grazing management ... . . . . . . . . . . . . 100
Agriculture management ... . . . . . . . . . . . . 101
Wetland management ... . . . . . . . . . . . . 101
Local government road management ... . . . . . . . . . . . . 101
Urban management ... . . . . . . . . . . . . 102
Fire management ... . . . . . . . . . . . . 102
Pest management ... . . . . . . . . . . . . 102
Adaptive management ... . . . . . . . . . . . . 103
Reasonable assurance .... . . . . . . . . . . . 103
QuantifiedcosteffectivereductiontargetsfortheNormanbyBasin . . . . . . . . . . . . . . . 105
Chapter 3: Integrated Monitoring Program . . . . . . . . . . . . . . . 110
Background .... . . . . . . . . . . . 110
Adaptive management ... . . . . . . . . . . . . 112
Framework for integrating monitoring .... . . . . . . . . . . . 113
Monitoring adoption of management practices .... . . . . . . . . . . . 114
Validating management practice – water quality relationships .... . . . . . . . . . . . 115
Paddock and property scale monitoring .... . . . . . . . . . . . 115
Grazing management ... . . . . . . . . . . . . 115
Fire management ... . . . . . . . . . . . . 116
Main roads (council and state) ... . . . . . . . . . . . . 116
Secondary roads, tracks and fence lines on properties .... . . . . . . . . . . . 116
Horticulture management ... . . . . . . . . . . . . 116
Gullies .... . . . . . . . . . . . 117
Feral animals .... . . . . . . . . . . . 117
Urban and peri-urban (rural residential) .. . . . . . . . . . . . . . 117
Forest logging .... . . . . . . . . . . . 117
Sub-catchment scale monitoring .... . . . . . . . . . . . 117
Nested paddock to sub-catchment case studies (BACI or paired catchment studies) ... . . . . . . . . . . . . 118
Sub-catchment water quality monitoring .... . . . . . . . . . . . 118
Monitoring of agricultural water extraction and retention impacts .... . . . . . . . . . . . 119
Urban / peri-urban / harbours .... . . . . . . . . . . . 119
Mining .... . . . . . . . . . . . 119
Visitor impacts .... . . . . . . . . . . . 119
Catchment scale monitoring .... . . . . . . . . . . . 120
Land use intensity and disturbance mapping .... . . . . . . . . . . . 120
End-of-catchment water quality monitoring: The Super Gauge approach .... . . . . . . . . . . . 120
Catchment modelling .... . . . . . . . . . . . 121
Validate freshwater and marine water quality – ecosystem health relationships .... . . . . . . . . . . . 121
Freshwater aquatic ecosystems .... . . . . . . . . . . . 121
Marine monitoring .... . . . . . . . . . . . 123
Cost of implementing the Integrated Monitoring Program ..... . . . . . . . . . . 128
Chapter 4: Background to Water Quality Improvement Planning in the GBR . . . . . . . . . . . . . . . 130
Purpose of a Water Quality Improvement Plan .... . . . . . . . . . . . 130
Legislative framework for WQIP development ... . . . . . . . . . . . . 131
WQIPs and Healthy Waters Management Plans .... . . . . . . . . . . . 131
State Planning Policy State Interest - water quality ... . . . . . . . . . . . . 132
Chapter 5: Environmental Values . . . . . . . . . . . . . . . 133
Mapping / GIS base layers .... . . . . . . . . . . . 135
Progress of scheduling Environmental Values and Water Quality Objectives .... . . . . . . . . . . . 135
Chapter 6: Community and Science Consultation Process . . . . . . . . . . . . . . . 140
The planning team ..... . . . . . . . . . . 140
Consultation for the Cape York region .... . . . . . . . . . . . 140
Walking the Landscape .... . . . . . . . . . . . 143
Science synthesis ... . . . . . . . . . . . . 144
References . . . . . . . . . . . . . . . 147
Appendices . . . . . . . . . . . . . . . 153
Eastern Cape York Water Quality Improvement Plan Eastern Cape York Water Quality Improvement Plan

Eastern Cape York Water Quality Improvement Plan
1.
Eastern Cape York Water Quality Improvement Plan
2.
Published by: Cape York Natural Resource Management Ltd.© Cape York Natural Resource Management Ltd. 2016
Cape York Natural Resource Management Ltd supports and encourages the dissemination and exchange of its information. The copyright in this publication is licensed under a Creative Commons Attribution 3.0 Australia (CC BY) licence. Under this licence you are free, without having to seek our permission, to use this publication in accordance with the licence terms.
You must keep intact the copyright notice and attribute Cape York Natural Resource Management Ltd as the source of the publication.
For more information on this licence, visit http://creativecommons.org/licenses/by/3.0/au/deed.en
note to the reader
The Eastern Cape York Water Quality Improvement Plan has beenstructuredtoenableyoutoeasilyaccessthekeyfindingsin the first twochapters.Chapter 1presentsa summaryofinformation that was used to develop the implementation plan and Chapter 2 presents the implementation plan. The subsequent chapters and appendices present more detailed information on the Water Quality Improvement Planning processthatwasusedtodevelopthefirsttwochapters.
For more information (i.e. higher resolution maps) please email [email protected]
Referencing this document
Cape York Natural Resource Management and South Cape York Catchments, 2016. Eastern Cape York Water Quality Improvement Plan. Cape York Natural Resource Management, Cooktown, Queensland, Australia.
General disclaimer
The information contained in this report has been compiled in good faith by Cape York NRM and South Cape York Catchments from sources believed to be reliable. However, Cape York NRM and South Cape York Catchments, their officers, board members, employees and consultants donot invite reliance upon, nor accept responsibility for, nor guarantee the accuracy or completeness of the information. Before relying on any information in this report, the reader should make their own enquiries and seek independent professional, scientific and technical advice. The relianceupon and/or use of any information contained in this report shall be at the reader’s own risk and no liability will be accepted for any consequences which may arise directly or indirectly as a result.
Acknowledgements
The Eastern Cape York Water Quality Improvement Plan was funded through the Australian Government Reef Programme and has been developed in partnership with the Queensland Government. The Eastern Cape York Water Quality Improvement Plan will assist with informing priorities under the Reef 2050 Plan.
Cape York Natural Resource Management and South Cape York Catchments would like to thank the following people for their support in developing the Eastern Cape York Water Quality Improvement Plan.
For welcoming us onto their country and for entrusting us with their knowledge and information, we humbly thank the many Traditional Owners, graziers, farmers and other land managers of eastern Cape York.
For written content used in this report and supporting technical appendices: Will Higham, Christina Howley, Jason Carroll, Jessie Price, Jeffrey Shellberg, Jane Waterhouse, Andrew Brooks, Caroline Coppo, Jon Brodie, Jon Spencer, Dane Moulton, Andrew Moss, Carol Honchin, Steve Lewis, Mike Ronan, Peta Standley and Megan Star.
For help with Community Consultation: Susan Marsh, Samantha Hobbs, Desmond Tayley, Lyndal Scobell, Michael Goddard and Kym Dungee.
For expert advice during Walking the Landscape workshops: Julia Stevenson-Lyon, Eda Addicott, Bruce Wannan, Graham Herbert, Glynis Orr, Vince Manly, Neale Searle, Donna Audas and Paul Groves.
For expert advice to our Science Advisory Panel: Chella Goldwin, Glen Holmes, Kevin Gale and John Armour.
For participation in Science Synthesis Workshop: Brendan Ebner, James Donaldson, Carl Mitchell, Gillian McCloskey, Dave Waters, Len McKenzie and Kaz Price.
For reviewing agriculture and grazing implementation strategies: Andrew Hartwig, Scott Wallace, Paul Burke, Rae Schlecht, Chris Johnston, Dominic Henderson, Meghan Blackburn and Leigh Smith.
Eastern Cape York and the Water Quality Improvement Plan
The Eastern Cape York Water Quality Improvement
Plan (WQIP) was developed in consultation with
scientists, Traditional Owners and the wider community
to identify water quality issues and actions to maintain
and improve the rivers, wetlands and reefs of
eastern Cape York. The Plan has been designed to
support the Reef 2050 Long-Term Sustainability Plan
(Commonwealth of Australia, 2015), which sets targets
to reduce sediment and nutrient pollution to the Great
Barrier Reef (GBR). The planning region for the WQIP
includes all the catchments that drain to the northern
Great Barrier Reef, from Jacky Jacky Creek in the
north to the Annan River in the south (Figure 1).
Eastern Cape York Peninsula and the far north region
of the Great Barrier Reef are globally significant
ecosystems. Native vegetation dominates the
landscape and freshwater wetlands and floodplains
are still hydrologically and ecologically connected to
estuarine and marine ecosystems. The northern GBR
marine environment is in much better condition than the
rest of the GBR, and needs to be protected as a future
refugium. While most eastern Cape York rivers are not
pristine, many are in good to excellent condition. In the
more developed catchments, current and historic land
use—including grazing, agriculture, mining, roads,
urban development, changing fire patterns and the
introduction of weeds and feral animals—have caused
some degree of degradation. Most catchments are
experiencing increasing development pressure that
could further degrade river water quality and impact the
health of the reefs.
To improve existing river water quality in the more
degraded areas of Cape York Peninsula, the current
land use impacts on water quality will need to be
addressed through improved management practices,
active land, river and wetland restoration, planning
and regulation, and innovative thinking. However,
preventing further disturbance of catchments from new
developments is also critical if we wish to maintain
the relatively good river water quality and ensure that
the northern GBR does not become degraded like the
central and southern GBR.
Environmental Values and Aquatic Ecosystem Condition
EnvironmentalValues (EVs)define theusesofwater
by humans or aquatic ecosystems and help to prioritise
management goals for specific rivers and uses. The
human-use EVs for eastern Cape York include drinking
water (low to medium use), stock water (low to medium
use in the north and medium to high in the central and
southern regions), irrigation (Laura, Endeavour, McIvor
catchments), cultural and spiritual connections to water
(high use across all regions), aquaculture (low use),
recreationandfishing(mediumtohighuseacrossall
regions), and visual appreciation (medium to high use
across all regions).
Many river catchments and most marine waters in
eastern Cape York were identified as being of high
ecological value (HEV). The management goal for
HEV aquatic ecosystems is to ensure that there is no
detectable decline in condition. However, rivers such
as the upper Normanby and Laura Rivers, Endeavour
River and Oakey Creek (Annan River) have been
identifiedasslightly/moderatelydisturbed.Themarine
receiving waters in Princess Charlotte Bay (Normanby
and Stewart Basins) and southeastern Cape York
(Endeavour Basin) are also identified as slightly
disturbed.
Land Use, Disturbances and Pollutant Sources
Nature and cultural conservation, including National
Park and Traditional Owner land, is the dominant land
use in eastern Cape York (60%). Cattle grazing covers
34% of the region and is an important part of its history,
EXECUTIVE SUMMARY

Eastern Cape York Water Quality Improvement Plan
3.
Eastern Cape York Water Quality Improvement Plan
4.
lifestyleandeconomy.Grazinghasalsobeenidentified
as a trigger for accelerated soil and gully erosion in
Cape York. Gully erosion is a major source of sediment
pollution in the Normanby Basin and other catchments.
Agriculture occurs over a small (<1%) but expanding
area in the Normanby, Jeannie (McIvor) and Endeavour
Basins. Fertiliser and soil run-off is currently a source
of sediment and nutrient pollution in the Laura River
(Normanby Basin) and is likely to occur in other basins,
to a lesser extent. Recent and proposed land clearing,
increased dam building and water extraction, and
additional fertiliser and pesticide use associated with
agricultural developments, will place new pressures
on the Laura, Normanby and McIvor Rivers. Innovative
management will be required to address these
challenges to maintain or improve water quality.
Urban and rural residential land use represents less
than 1% of the total planning area, but has important
water quality implications in these regions due to
the intensity of land use. The Lockhart township in
the Claudie River catchment (Lockhart Basin), the
Laura and Lakeland townships within the Laura River
catchment (Normanby Basin), and Cooktown, Hope
Vale and several peri-urban precincts within the
Annan and Endeavour River catchments (Endeavour
Basin) are concentrated sources of urban water quality
pollution (sediment, nutrients, petroleum, metals and
gross pollutants).
Forestry, mining and other land uses also account
for a small percentage of the total area (<1%) in the
Central and Southern sections of Cape York; but can
besignificantsedimentsourceswhentheyoccurwithin
or near river and creek corridors.
Wetlands cover at least 2% of eastern Cape York.
The important role wetlands play in maintaining
natural hydrological processes, trapping sediment and
processing nutrients has been reduced by late season
wildfire,weedinfestationandferalanimalactivity.
Roads,fencelines,fire,gullyerosion,feralanimalsand
weeds are human disturbances that occur across all
land uses (including conservation). Roads, tracks and
fence lines havebeen identified as the largest direct
human land use disturbance across Cape York. It is
estimated that there are around 20,000 km of these
‘linear disturbances’, and all of these disturbances
deliver excess sediment and nutrients to the stream
network. Inappropriatefire regimes,whichburn large
areas of Cape York, reduce vegetation ground cover
and can also significantly increase sediment and
nutrient pollution in rivers. Feral animals (cattle, horses
and pigs) directly disturb soil and wetlands, while weeds
replace or destroy riparian and aquatic vegetation, all
of which contribute to sediment pollution and loss of
aquatic habitat.
The available Disturbance Index data (Appendix 1)
suggests that the management of accelerated gully
erosion is one of the highest priorities for maintaining
and improving water quality in the northern GBR;
however, linear disturbances (roads, tracks and
fences), agricultural development, and urban/peri-
urban expansion represent the main potential sources
of future declines in water quality.
Commercial shipping is another source of sediment
pollution delivered directly to reefs across all the
eastern Cape York GBR region. Large ships stir up
sediments over large areas, impacting adjacent reefs.
Marine Risk Assessment
The relative risk of degraded water quality among the
basins in the Cape York region was determined by
combining information on the estimated (modelled)
loads of sediment and nutrients from human land
use discharged to the marine environment from each
river basin, and the area of coral reefs and seagrass
meadows that may be exposed to these pollutants.
The Normanby Basin had much more supporting
data than the other basins, and this limited the
capacity to produce a consistent assessment of risk
across all basins.
With these limitations, the assessment concluded that
the greatest risk posed to coral reefs and seagrass from
degraded water quality in the Cape York region is from
the Normanby, Hann and Stewart Rivers, due to the
relatively high level of disturbance and area of impact,
making them a priority for improved management.
However,landdisturbances,pollutantloads,andflood
plume behavior from other catchments remain poorly
quantified to properly assess their risks of impacting
adjacent reefs.
Catchments in the Southern section, such as the
Endeavor, Annan, McIvor and Starke, have intensive
land uses (urban, rural residential, mining, grazing,
agriculture, forestry and roads) that have a cumulative
impact on fresh water and marine water quality.
Intensification of land use in the Southern section is
increasing and the resulting water quality impacts
are not well documented. New agricultural and urban
developments may impact previously less disturbed
rivers. Southern Cape York rivers, such as the McIvor,
Endeavour and Annan, are directly connected to
fringing, inshore, and mid-shelf reefs, as well as
extensivecoastalseagrassmeadows.Riverfloodwater
plumes regularly reach these local reefs, which are of
high cultural, recreational and commercial value to local
communities and Traditional Owners. These reefs are
vulnerable to increased levels of sediment and nutrient
pollution. Rivers in the Endeavour and Jeannie Basins
also discharge directly into the known crown-of-thorns
starfishinitiationareaforthewholeGBR.
Water Quality Guidelines and Targets
Water Quality Guidelines have been established for
eastern Cape York rivers and estuaries based on an
assessment of existing water quality data. The derivation
of guidelines based on local data represents an improved
level of detail to the standard Australian (ANZECC) and
Queensland water quality guidelines. Short-term Targets
(2022) and Long-term Objectives (2050) for reductions in
pollutant loads have also been established.
For the Northern section (Jacky Jacky, Olive, Pascoe
and Lockhart Basins) the target is to maintain current
water quality so that there are no increases in sediment
or nutrient loads.
For the Central and Southern sections, the targets
to improve water quality have been set to reduce
total suspended sediment loads by 25% in the most
disturbed sub-catchments (the upper Normanby,
Laura, Annan and Endeavor Rivers), to achieve a 10%
reduction in sediment loads discharged to the GBR. A
reduction target of 25% of total nutrient loads has also
been set for the Laura River (Normanby Basin).
Long term water quality objectives aim for a 30%
reduction in total sediment loads discharged to the
GBR from the most disturbed catchments. For many
rivers, particularly in the Northern section, limited data
was available and additional sampling is recommended
to improve guideline certainty in these areas.
Implementation
This Water Quality Improvement Plan (WQIP)
will require widespread community acceptance
and involvement in its implementation if it is to be
effective in maintaining and improving water quality.
Implementation of the WQIP involves a range of
management interventions for each section of eastern
Cape York. A staged approach is recommended,
with an initial focus on the Normanby Basin sediment
reduction targets (gully rehabilitation, improved grazing
and agricultural land management), plus actions to
manage road erosion, fire, pests andwetland health
in all disturbed catchments. In the Southern section,
there will be a strong focus on improved management
of urban and rural residential land development, as well
as intensive agricultural land use.

Eastern Cape York Water Quality Improvement Plan
5.
Eastern Cape York Water Quality Improvement Plan
6.
An Integrated Monitoring Strategy has been developed
that will build on and improve existing Cape York
monitoring efforts and partnerships. The monitoring
strategy combines nested paddock, property, sub-
catchment, and catchment scale monitoring with
marine monitoring activities to provide information on
the effect of land use and improved land management
on water quality and ecosystem health. The integrated
monitoring program will provide more accurate
measurements of land use disturbances and pollutant
loads delivered to the GBR over the long-term by
using new technology and established Super Gauge
techniques. The lessons learned from monitoring will be
continuously incorporated into on-ground management
activities to ensure that WQIP implementation is
effective in delivering water quality and ecosystem
health targets.
The establishment of a Cape York Catchments
to Coral Partnership is recommended to provide
strategic direction and coordination of implementation
and monitoring activities. The Catchments to Coral
Partnership will also inform the Queensland and
Australian Governments of issues that are relevant
to the whole of the GBR and/or the protection of the
northern Great Barrier Reef.
Cost Assessment
Costings have been presented for the additional
resources that are required to implement management
actions to protect and maintain water quality and
ecosystem health in major land uses and disturbances
across the region and to reduce suspended sediment
and nutrients to meet the Reef 2050 Plan water quality
targets. The total cost of the additional resources,
including in kind support and monitoring, to implement
thefirststagefrom2016-2022andachievetheshort-
term targets is estimated at $171 million.
A more detailed cost-effectiveness analysis for
achieving long-term sediment reduction targets through
passive and active gully remediation in priority sub-
catchments within the Normanby Basin is presented.
This is an example of the detailed cost effectiveness
analysis that will need to be undertaken for roads,
wetlands, agriculture, fire and urban management,
using the results of the integrated monitoring
program across all basins. Continuous improvement
of prioritisation is recommended through an annual
synthesis of the spatial pattern of disturbance, water
quality and ecological datasets and on-ground
implementation costs.
The land managers of eastern Cape York are resilient
and if provided with additional resources, they are
willing to adopt a range of improved management
practices that will maintain and improve the water
quality and ecosystem health of eastern Cape York for
future generations.
ChAPTER 1: SUMMARY
Introduction
Cape York Peninsula is a diverse and iconic tropical
landscape. Its eastern Great Barrier Reef catchments
are a mosaic of contrasting ecosystems supporting
exceptional biodiversity: savanna, tropical rainforests,
dune fields, sandstone escarpments, wetlands and
heathlands. Compared to southern Great Barrier
Reef regions, eastern Cape York remains relatively
undisturbed by modern industrialisation and
development, and the good condition of the northern
GreatBarrierReefreflectsthis.
The rivers and wetlands of eastern Cape York are also
in good condition compared to many other Australian
and international systems. There are almost no man-
made barriers to fish movement, low levels of most
pollutants, largely intact native vegetation and a high
level of interconnectedness between freshwater and
marine ecosystems. These characteristics ensure
that the water quality of Eastern Cape York’s aquatic
ecosystems remains good.
Water Quality Improvement Plans aim to improve
or maintain the water quality of waterways through
whole catchments to the ocean. This is achieved by
developing land management strategies that reduce
inputs of sediment, nutrient and other pollutants to
rivers and wetlands, and encourage ecosystem repair
and health. While the waterways of eastern Cape York
are currently relatively healthy, there are some areas
where water quality has been impacted by human land
use,introducedplantsandanimalsandfire.TheEastern
Cape York Water Quality Improvement Plan has been
developed to highlight what actions our community can
take to protect the region’s rivers, wetlands and reefs
for future generations.
High Ecological Value waters at Ussher Point (Photo: Kerry Trapnell)

Eastern Cape York Water Quality Improvement Plan
7.
Eastern Cape York Water Quality Improvement Plan
8.
Purpose of the Eastern Cape York Water Quality Improvement Plan
The Eastern Cape York Water Quality Improvement
Plan has been funded by the Australian Government
to inform implementation and investment priorities to
achieve the overarching vision, water quality outcomes
and water quality targets of the Reef 2050 Long-Term
Sustainability Plan (Commonwealth of Australia,
2015). The Reef 2050 Long-Term Sustainability Plan
is referred to as the Reef 2050 Plan throughout this
document. The Reef 2050 Plan is the overarching
framework for protecting and managing the Great
Barrier Reef from 2015 to 2050. The Reef 2050 Plan
is a key component of the Queensland and Australian
Government’s response to the recommendations of the
UNESCO World Heritage Committee.
At the core of the Reef 2050 Plan is an outcomes and
targets framework that will drive progress towards an
overarching vision:
“To ensure the Great Barrier Reef continues to improve on its Outstanding Universal Value every decade between now and 2050 to be a natural wonder for each successive generation to come.”
The Reef 2050 Plan Outcomes Framework has seven
overarching themes—ecosystem health, biodiversity,
heritage,waterquality,communitybenefits,economic
benefits and governance. These themes reflect the
priorityareasforactionidentifiedbygovernmentsand
partners. Together they will address the key risks to the
Reef and will ensure ecologically sustainable use can
continue.
Under each theme, there are the following components:
• Actions-identifiedcomponentsofworktobeundertaken to meet the targets
• Targets - the results being aimed for by 2020, a
five-yeartimehorizon;tofacilitatedeliverytheyare
Specific,Measurable,Achievable,Realisticand
Time-bound (SMART)
• objectives - linking targets to outcomes, expected
to be achieved by 2035, the medium term
• an outcome - which must be achieved by 2050 to
deliver the vision.
The Eastern Cape York Water Quality Improvement
Plan specifically addresses the actions, targets,
objectives and outcome of the water quality theme
(Table 1). The specific Reef 2050 Plan actions and
targets that are addressed are highlighted throughout
this document.
The Eastern Cape York Water Quality Improvement Plan has been developed by Cape York Natural Resource
Management and South Cape York Catchments through funding provided by the Australian Government to
deliver on the following Reef 2050 Plan water quality action:
• WQA7 - Finalise and implement plans (e.g. Water Quality Improvement Plans and Healthy Waters
Management Plans) for Reef catchments and key coastal areas, identifying implementation priorities for
protection of the Reef
Table 1: Reef 2050 Plan Water Quality Theme Actions, Targets, Objectives and Outcome
Improving broadcare land managementWQA1 By 2018, review and update the Reef Water Quality Protection Plan and its targets.
WQA2 Continue improvement in water quality from broadscale land use through implementation of Reef Water Quality Protection Plan 2013 actions.
WQA3 Pending the outcome of the review of regulation and market-based mechanisms to improve water quality, require farmers to be accredited to best management practice guidelines or to operate under an Environmental Risk Management Plan
Improving water quality from all sectorsWQA4 Implement innovative management approaches through the Reef Trust for
improving water quality.WQA5 Increase use of cost-effective measures to improve water quality from broadscale
land use, urban, industrial and port activities.WQA6 Establish an agreed performance-based voluntary reporting framework across
agriculture, urban, ports and industry to measure management efforts to achieve best management practices and to inform regional report cards
WQA7 Finalise and implement plans (e.g. Water Quality Improvement Plans and Healthy Water Management Plans) for Reef catchments and key coastal areas, identifying implementation priorities for protection of the Reef.
WQA8 Increase industry participation in regional water quality improvement initiatives and partnerships aimed at managing, monitoring and reporting of water quality. These should build on existing initiatives such as:• Fitzroy Partnership for River Health• Gladstone Healthy Harbour Partnership• Mackay Whitsunday Healthy Rivers to Reef Partnership.
WQA9 Review and update water quality objectives and Great Barrier Reef Marine Park Authority Water Quality Guidelines at Reef-wide and regionally relevant scales basedonscientificallyverifiedmonitoringandresearch.
Improving urban and industrial water qualityWQA10 Review and set regionally relevant standards for urban and point-source
discharges into the World Heritage Area and ensure licenses meet these standards.
WQA11 Increase adoption of leading practice in the management and release of point-source water affecting the Reef.
WQA12 Implement best practice stormwater management (e.g. erosion and sediment control, water sensitive urban design and capture of gross pollutants) for new development in coastal catchments.
WQA13 Build capacity for local government and industry to improve water quality management in urban areas.
Reducing the impact of ports and dredgingWQA14 Restrict capital dredging for the development of new or expansion of existing port
facilities to within the regulated port limits of Gladstone, Hay Point/Mackay, Abbot Point and Townsville.
WQA15 Develop and implement a dredging management strategy that includes:• an examination, and, where appropriate, a potential pilot program to evaluate
different treatment and re-use options for management dredge material• measures to address dredging-related impacts on Reef water quality and
ecosystem health• a ‘code of practice’ for port-related dredging activities.
WQA16 Develop a State-wide coordinated maintenance dredging strategy which:• identifieseachport’shistoricaldredgingvolumesandlikelyfuturerequirements
and limits• identifiesappropriateenvironmentalwindowstoavoidcoralspawning,
seagrass recruitment, turtle breeding and weather events• examinesopportunitiesforthebeneficialreuseofdredgematerialoron-land
disposal from maintenance activities• establishes requirements for risk-based monitoring programs.
WQA17 Understand the port sediment characteristics and risks at the four major ports and how they interact and contribute to broader catchment contributions within the World Heritage Area.
WQA18 In 2015 legislate to ban sea-based disposal of capital dredge material in the Great Barrier Reef Marine Park and in the balance of the Great Barrier Reef World Heritage Area from port-related capital dredging.
WQA19 Mandatethebeneficialreuseofport-relatedcapitaldredgespoil,suchasland reclamation in port development areas, or disposal on land where it is environmentally safe to do so.
WQA20 The Queensland Government will require all proponents of new dredging works to demonstrate their project is commercially viable prior to commencement.
WQA21 The Queensland Government will not support trans-shipping operations that adversely affect the Great Barrier Reef Marine Park.
WQA22 Support on-land disposal or land reclamation for capital dredge material at Abbot Point.
Monitoring and reportingWQA23 Expand ‘nested’ integrated water quality monitoring and report card programs
at major ports and activity centres (e.g. Gladstone), in priority catchments (e.g. Mackay Whitsundays) and Reef-wide, to guide local adaptive management frameworks and actions.
WQA24 Identify and action opportunities for Traditional Owners, industry and community engagement in on-ground water quality improvement and monitoring programs.
WQT1By 2018:• at least a 50 per
cent reduction in anthropogenic end-of-catchment dissolved inorganic nitrogen loads in priority areas, on the way to achieving up to an 80 per cent reduction in nitrogen by 2025
• at least a 20 per cent reduction in anthropogenic end-of-catchment loads of sediment in priority areas, on the way to achieving up to a 50 per cent reduction by 2025
• at least a 20 per cent reduction in anthropogenic end-of-catchment loads of particulate nutrients in priority areas
• at least a 60 per cent reduction in end-of-catchment pesticide loads in priority areas.
[From Reef Water Quality Protection Plan 2013 targets, based on a comparison with a 2009 baseline]WQT2By 2018:• 90 per cent
of sugarcane, horticulture, cropping and grazing lands are managed using best management practice systems (soil, nutrient and pesticides) in priority areas
• Minimum 70 per cent late dry season groundcover on grazing lands
• The extent of riparian vegetation is increased
• There is no net loss of the extent, and an improvement in the ecological processes and environmental values, of natural wetlands.
[From Reef Water Quality Protection Plan 2013]WQT3By 2020, Reef-wide and locally relevant water quality targets are in place for urban, industrial, aquaculture and port activities and monitoring shows a stable or improving trend.WQT4Water quality in the Great Barrier Reef has a stable positive trend.WQT5Traditional Owners, industry and community are engaged in on-ground water quality improvement and monitoring.
WQO1Over successive decades the quality of water entering the Reef from broadscale land use has no detrimental impact on the health and resilience of the Great Barrier Reef.
WQO2Over successive decades the quality of water in or entering the Reef from all sources including industrial, aquaculture, port (including dredging), urban waste and storm-water sources has no detrimental impact on the health and resilience of the Great Barrier Reef.
Reef water quality sustains the
Outstanding Universal Value, builds resilience
and improves ecosystem health
over each successive decade.
2015 - 2020ACTIONS
2020TARGETS
2035OBJECTIVES
2050OUTCOME

Eastern Cape York Water Quality Improvement Plan
9.
Eastern Cape York Water Quality Improvement Plan
10.
Key principles of the Eastern Cape York Water Quality Improvement Plan
The key principles that supported the development of
the Eastern Cape York Water Quality Improvement
Plan are:
• The planning process engages the people of
eastern Cape York in the development of the Plan
and in water quality management for the region
• The Plan makes best use of available science
though synthesis of data and expertise, and
identifiescriticalknowledgegapsandfuture
monitoring priorities
• The Plan localises Australian Government
and Queensland Government Reef 2050 Plan
commitments and informs future implementation
priorities
• The Plan provides an implementation plan for
priority management actions that is endorsed and
ready to be resourced and implemented
At its core a Water Quality Improvement Plan is about
people:
• People who are responsible for the laws that
govern the area;
• Peoplewhovaluewaterforthebenefitsitprovides
to them;
• People who manage land and water for
conservation, residential and economic uses;
• Peoplewhoconductscientificresearchtoimprove
the understanding of water quality, aquatic
ecosystem health and water management; and
• People who implement programs to protect and
improve the values that water provides.
• The Eastern Cape York Water Quality
Improvement Planning process was designed to
engage as many of these people as possible in the
process of developing a practical implementation
plan that is endorsed by them and can be
resourced and implemented with them in the
future.
The planning region
The planning region for the Eastern Cape York Water
Quality Improvement Plan includes all the catchments
that drain to the northern Great Barrier Reef (GBR),
from Jacky Jacky Creek in the north to the Annan River
in the south (Figure 1).
As part of planning process, the northern GBR has
been broken into three sections; Northern, Central and
Southern, based on logical marine receiving waters,
and the catchments that drain to them (Figure 1).
These logical marine receiving waters were defined
by assessing the coastal landform, hydrographic
processes and potential zone of influence of the
catchments that discharge into the marine receiving
waters. It is important to note that the Normanby, Hann
andStewartRivers’combined influence invery large
widespread flooding may extend from the Central
section well into the Northern section.
The marine receiving waters within the Northern,
Central and Southern section have been broken
up based on cross-shelf boundary lines that define
Marine Water Bodies (enclosed coastal, open coastal,
midshelf, offshore) within the Great Barrier Reef Marine
Park Authority (GBRMPA) water quality guidelines
(Figure 2) (GBRMPA, 2010 and Appendix 5, GBRMPA,
2016).
The catchments within the Northern, Central and
Southern sections have typically been grouped up
into drainage basins; however, several of the planning
processes involved detailed assessments at sub-
catchment and reach scale. For example, the Walking
the Landscape and Environmental Values assessment
for the whole planning region, the gully prioritisation
for Normanby and Hann Basins and the water quality
guidelines for the Normanby Basin were completed
at sub-catchment and reach scale. The Walking
the Landscape analysis of characteristics such as
topography, groundwater, land use and geology was
usedtodefinetheappropriatesub-catchmentscaleto
present.
Table 2 shows the drainage basins, catchments and
sub-catchments that are within each section of the
Region.
Please note that in the map above and throughout this document, the Normanby Basin has been split into the Normanby Sub-Basin and the Hann Sub-Basin and the Olive Pascoe Basin has been split into the Olive Sub-Basin and the Pascoe Sub-Basin.
Figure 1: Drainage Basin Boundaries and Marine Receiving Waters (North, Central and South) Cape York WQIP.
(Source: Waterhouse et al., Marine Risk Assessment, 2015)

Eastern Cape York Water Quality Improvement Plan
11.
Eastern Cape York Water Quality Improvement Plan
12.
The catchment boundary for the Northern section
starts at the boundary between Stewart and Lockhart
drainage basins while the marine receiving water
boundary for the Northern section starts at the mouth
of the Nesbit River. This is to account for the level of
suspendedsedimentinfloodplumescomingfromthe
Stewart, Hann and Normanby Basins and to align with
the Slightly Disturbed marine zone (Figure 11).
From a freshwater aquatic ecosystem standpoint,
Massey Creek (between the Stewart River and
Nesbit River) is the beginning of the undisturbed High
Ecological Value (HEV) ecosystem zone that extends
almost uninterrupted from the northern bank of Massey
Creek to the tip of Cape York.
Table 2: Drainage basin, catchments and sub-catchments within the Northern, Central and Southern sections
of the planning region
Figure 2: Marine Water Bodies (enclosed coastal, open coastal, midshelf and offshore) used in the Eastern Cape
York WQIP (Source: Waterhouse et al., Marine Risk Assessment, 2015)
Section Drainage Basin Catchment Sub-catchmentNorthern Jacky Jacky Jacky Jacky Creek Jacky Jacky CreekNorthern Jacky Jacky Escape River Escape RiverNorthern Jacky Jacky Harmer Creek Harmer CreekNorthern Olive Olive River Glennie CreekNorthern Olive Olive River Kangaroo RiverNorthern Olive Olive River Olive RiverNorthern Pascoe Pascoe River Garraway CreekNorthern Pascoe Pascoe River Yam Creek Northern Pascoe Pascoe River Hann CreekNorthern Pascoe Pascoe River Pascoe RiverNorthern Lockhart Claudie River Wilson CreekNorthern Lockhart Claudie River Claudie RiverNorthern Lockhart Claudie River Scrubby CreekNorthern Lockhart Lockhart River Lockhart RiverNorthern Lockhart Nesbit River Nesbit River Northern Lockhart Chester River Chester RiverCentral Stewart Massey Creek Massey CreekCentral Stewart Breakfast Creek Breakfast CreekCentral Stewart Stewart River Station CreekCentral Stewart Stewart River Stewart River Central Stewart Balclutha Creek Balclutha CreekCentral Stewart Running Creek Running CreekCentral Hann Hann River Annie RiverCentral Hann Hann River Hann RiverCentral Hann Hann River North Kennedy RiverCentral Normanby Normanby River Bizant River Central Normanby Normanby River Kennedy RiverCentral Normanby Normanby River Mosman RiverCentral Normanby Normanby River Deighton RiverCentral Normanby Normanby River Laura River Central Normanby Normanby River Normanby RiverSouthern Jeannie Muck River Muck RiverSouthern Jeannie Howick River Howick RiverSouthern Jeannie Jeannie River Jeannie RiverSouthern Jeannie Starke River Starke RiverSouthern Jeannie McIvor River McIvor RiverSouthern Endeavour Endeavour River Isabella CreekSouthern Endeavour Endeavour River Endeavour North BranchSouthern Endeavour Endeavour River Endeavour South BranchSouthern Endeavour Endeavour River Endeavour Right ArmSouthern Endeavour Endeavour River Endeavour RiverSouthern Endeavour Annan River Oakey CreekSouthern Endeavour Annan River Trevethan CreekSouthern Endeavour Annan River Annan River

Eastern Cape York Water Quality Improvement Plan
13.
Eastern Cape York Water Quality Improvement Plan
14.
Characteristics of eastern Cape York
Cape York Peninsula, as part of the physical bridge
between Australia and Papua New Guinea, represents
an outstanding, evolving, geological landscape. Cape
York Peninsula holds the key to connections between
the ancient, stable shield of Australia and the much
younger, evolving landmass of New Guinea (Valentine,
2006).
The eastern Cape York catchments are representative
of the biodiversity and ecosystems of the whole of
Cape York. The fully functioning savannah ecosystems
represent a biome now largely transformed elsewhere
in the world (Valentine, 2006) and the eastern dune
fields are of global significance as evidence of geo-
evolution under the influence of climate change (sea
level change) (Mackey et. al., 2001).
The eastern Cape York marine environment (northern
GBR) is considered to be in good condition compared
to other parts of the GBR or other global coral reef
ecosystems (Fabricius et al., 2005, Halpern et al., 2008).
In addition to healthy coral reefs this region has high-
value seagrass meadows, high fisheries values and
harbors significant populations of rare or threatened
marine turtles, dugongs and dolphins. This is attributed
to a combination of factors, including good water quality
resulting from lower levels of development within the
eastern Cape York catchments, and less pressure from
recreationalandcommercialfishers,tourismandother
boats. However, threats and impacts to the eastern
Cape York marine environment are generally poorly
documented and quantified, with the exception of
recent research efforts in the Normanby River and past
water quality monitoring in the Endeavour and Annan
rivers.
While sharing iconic features such as the interconnected
savannah, rainforest, dune lakes and mangrove forests,
the three sections of eastern Cape York have unique
characteristics.
Southern
• Extension of the wet tropics into Annan River
• Granite ranges at Black Mountain and Cape
Melville
Central
• ExtensivefloodplainwetlandofRinyirruNational
Park
• Sandstone escarpments
• Princess Charlotte Bay
Northern
• Largest area of lowland rainforest in Australia
• Heathlands between Escape River and
Shelbourne Bay
Termite mounds of Cape York savannah (Photo: Lyndal Scobell) High Ecological Value wetland, Alligator Lagoon, on Lama Lama country (Photo: Jessie Price)
From a human perspective eastern Cape York presents
significant climatic challenges that add to the social
and economic challenges of isolation. Flooding during
the strong monsoon wet season can cut people off for
months at a time and the widespread extended dry
seasonincreasestheimpactandextentofwildfires.
The current population density of eastern Cape York
is very low. The majority of the population lives in the
Southern section of the region within an hour’s drive
of Cooktown. There are small communities spread
throughout the region and the cost of living increases
further north.
Cattle were introduced to Cape York around 1865, and
the majority of the region was developed for extensive
grazing on pastoral leases. Stocking rates are low
compared to other savannah regions and the grazing
systems have low profitability. Profitability declines
further north due to increasing transport costs;
however, future live export opportunities from Weipa
mayimprovecattleprofitability.
In the last 20 years there has been large-scale
land-tenure change from pastoral lease to nature
conservation and Traditional Owner land tenures.
The historic displacement of Traditional Owners has
impacted on connection to Country. This will require
extra resources to overcome particularly in sparsely
populated areas.
The annual economic value of the eastern Cape York
coastal and marine environment is estimated to be
AU $160 million per year (Appendix 12, Thomas and
Brodie, 2015). However, the higher cost of living, low
socio-economic status, and the scale of the land being
managed, creates challenges with adoption of improved
management practices. Anything other than the bare
necessity of land management is unaffordable and not
considered practical. The people of eastern Cape York
require significant technical and financial resources
to enable them to improve grazing, agriculture,
urban, wetland and nature and culture conservation
management practices in priority areas.
The people of eastern Cape York are resilient. If they
are provided with the resources they require, they are
willing to implement region-wide adoption of improved
management to meet Reef 2050 Plan water quality
targets and objectives.

Eastern Cape York Water Quality Improvement Plan
15.
Eastern Cape York Water Quality Improvement Plan
16.
historical land use and disturbance
The focus of this plan is current land use and
disturbance, current threats to water quality and the
priority management actions that can be implemented
to maintain and improve water quality in eastern Cape
York. However, historic land uses have shaped the
current landscape and in some areas this legacy may
continue to impact water quality.
Cattle were introduced to Cape York around 1865 and
cattle numbers increased greatly during the Palmer
River gold rush. Over 150 years of grazing on Cape
York has altered the landscape and left a legacy of gully
erosion in fragile dispersive soil types that continues to
increase sediment loads from some catchments.
There are a range of other historical disturbances that
are likely to have impacted fresh water quality and
marine water quality. It is likely that gold and tin mining
and clearing for agriculture in the late 19th century and
early 20th century and clearing for military purposes
during World War 2 will have significantly increased
erosion and sediment loads to the marine environment
duringfloodeventsinthefollowingareas:
• Endeavour River – Cooktown population explosion
and railway construction to Laura during Palmer
River gold rush in the 19th century
• Upper Stewart River, Station Creek – gold mining
in early 20th century
• Annan River- tin mining and clearing for sugar
cane production in late 19th and early 20th century
• Starke River – gold mining in early 20th century
• Claudie River – clearing for military purposes,
includingairfieldsandbombtestsitesduringWorld
War 2 near Lockhart
The historic port at Port Stewart, once a major port for
supplyingthecattlestationsandgoldfieldsoftheCoen
region (Batavia mine, Great Northern mine), is now too
shallow for all but small vessels to enter from mid to
high tide. Accelerated erosion from mining, roads and
grazing is believed to have caused the sedimentation of
this once busy port.
Evidence of these historic disturbances is still present.
However, the water quality today in the upper Stewart
River and Claudie River is likely to be better than it
was in the early to mid 20th century when mining and
military activities were most active.
For more information refer to Steve Lewis’ report on
historical land use (Appendix 3) and the historical
disturbance section of the report on the Annan River by
Shellberg et al. (2016) (Appendix 4).
Rainforest in the Station Creek headwaters (top) and in the Claudie River (bottom) has naturally regenerated early 20th
century mine sites and World War 2 gun placements. (Photo: Jessie Price)
Community consultation and science synthesis
During the Eastern Cape York Water Quality
Improvement Plan development process, many public
meetings and one-on-one consultations were held with
the communities, Traditional Owners, farmers, graziers
and local government representatives of eastern Cape
York. Meeting processes and surveys for each major
stakeholder group were developed to capture the
criticalinformationrequiredtodefinetheEnvironmental
Values and develop recommended management
actions and implementation strategies presented in
the Eastern Cape York Water Quality Improvement
Plan. Table 3 presents a summary of the community
consultation and science synthesis activities. For more
information on community consultation and science
synthesis see Chapter 6.
Table 3: Summary of community and science consultation activities
Stakeholder Activity Description Purpose numberAgriculture - farmers
Agriculture Round Table meeting
Introduce the Water Quality Improvement Plan process to agricultural community. Gauge willingness to adopt improved management practices.
1
Horticulture network meetings
Introduce the Water Quality Improvement Plan process to horticultural community. Gauge willingness to adopt improved management practices.
2
Individual consultations – property visits or phone calls
Property scale assessment of management practices- Stewardship and Improvement Plans. Collect information for Environmental Values.
13
Graziers Grazing Round Table meeting
To gauge willingness to adopt improved management practices. 1
Presentations with AgForce
Introduce the Water Quality Improvement Plan process to grazing community.
3
Individual consultations – property visits or phone calls
Property scale assessment of management practices- Stewardship and Improvement Plans. Collect information for Environmental Values.
18
Traditional Owners
Field trips on Country Introduce Water Quality Improvement Plan process. Collect information on water assets, threats and pressures, management actions and Environmental Values.
10
Individual consultations Opportunity for editing and comment on content by Traditional Owners and collection of additional information.
8
Local Government
Individual consultations Introduce Water Quality Improvement Plan process Collect information on current management practices, and gauge interest in improved management practices. Collect information for Environmental Values.
3
Walking the Landscape
Walking the Landscape workshops
Describe and document hydrological processes, natural terrain and ecologicalattributes,landscapemodificationsandthreatstowaterquality. Collect information for Environmental Values.
2
Follow-up meetings and teleconferences
Quality assurance – editing and comment. 3
Science Advisory Panel
Workshops Synthesise science and expert opinion to create knowledge. 2Teleconferences Providescientificandtechnicalinputtotheplanningprocess.
Review supporting studies and planning products.
8
Community Public meetings Introduce Water Quality Improvement Plan process. Collect information on water assets, threats and pressures, and Environmental Values.
6
Individual consultations Introduce Water Quality Improvement Plan process. Collect information on water assets, threats and pressures, management actions and Environmental Values. Opportunity for editing and comment on content.
13

Eastern Cape York Water Quality Improvement Plan
17.
Eastern Cape York Water Quality Improvement Plan
18.
Environmental Values
Environmental Values are the qualities that make water
suitable for supporting aquatic ecosystems and human
use (Table 4 and Figure 3). During the Eastern Cape
York Water Quality Improvement Plan development
process, many meetings were held with community
members, grazing and agriculture land managers,
Traditional Owners and ranger groups to ask what
people are using water for. The information gathered
was analysed to determine human use and aquatic
ecosystem Environmental Values in the catchments
and waterways of eastern Cape York. Freshwater
and estuarine Environmental Values for the major
sub-catchments of eastern Cape York are presented
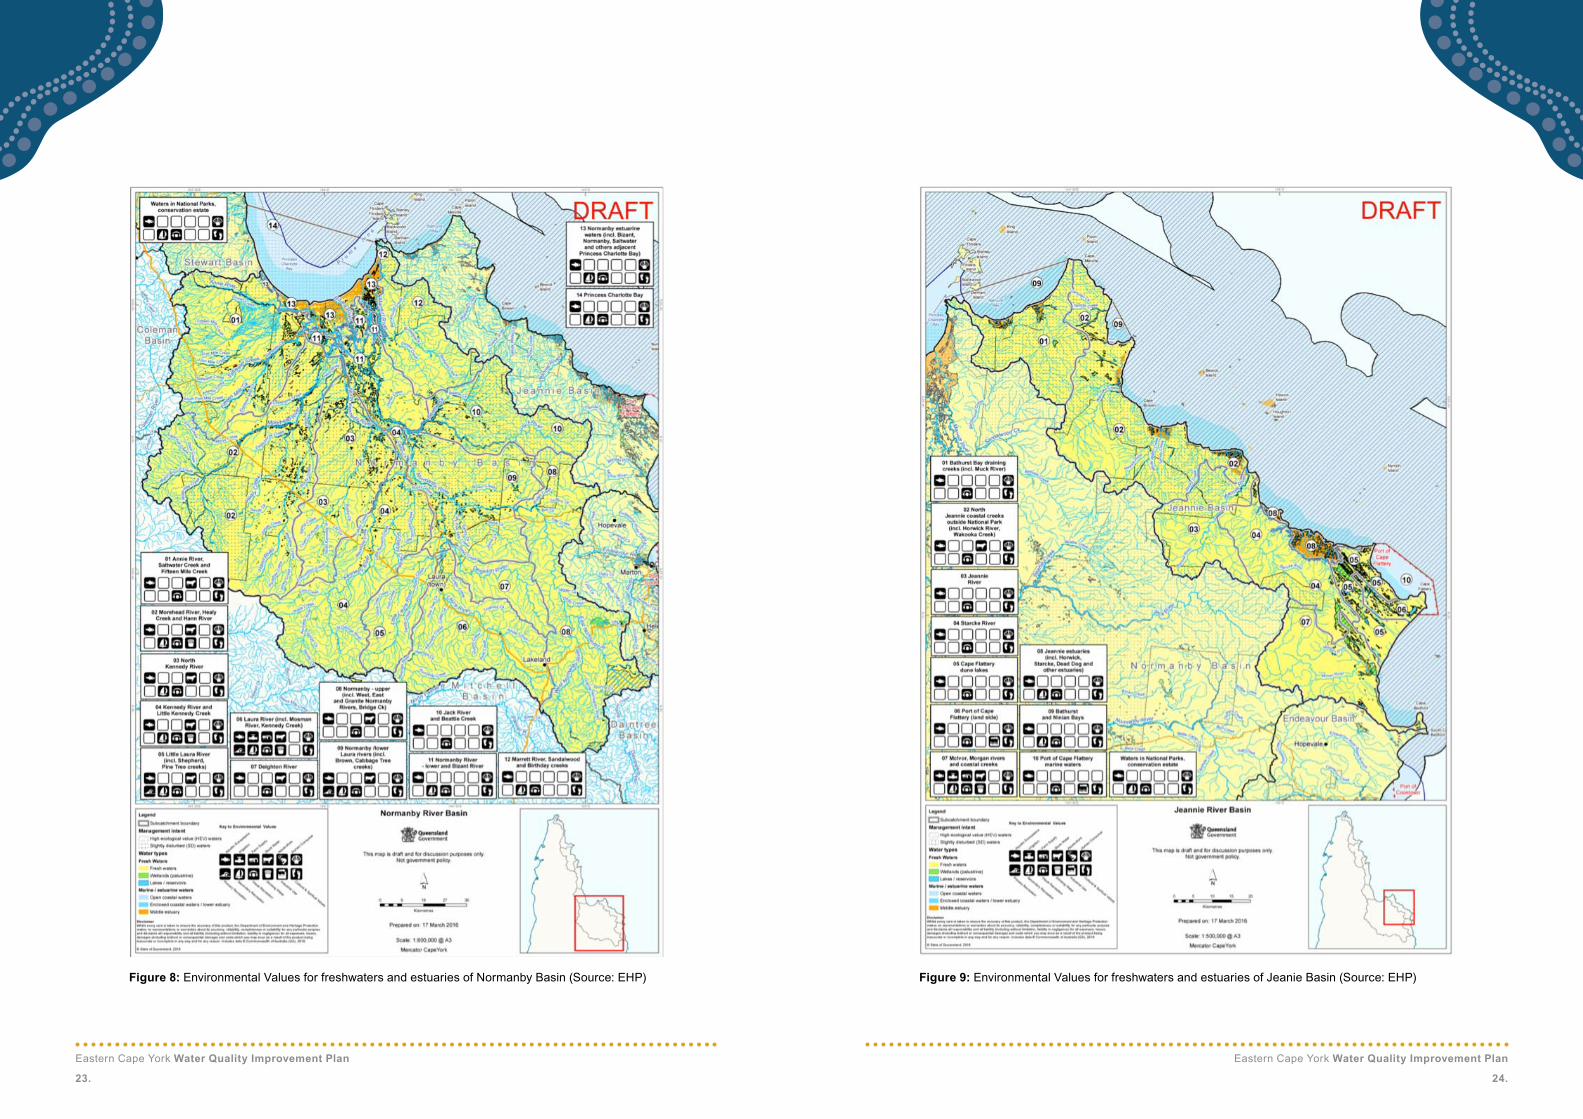
in Figures 4 to 10. Environmental Values for coastal
waters were assessed by Great Barrier Reef Marine
Park Authority and are presented in Figure 11. For
more information on Environmental Values refer to
Chapter 5.
Table 4: DefinitionsofEnvironmentalValuesusedintheconsultationprocess.
Figure 3: A conceptual model presenting the Environmental Values that were assessed through the Eastern Cape
York Water Quality Improvement Plan (swimming in the estuaries of eastern Cape York is not recommended).
Coral reefs provide a range of human use environmental values including primary recreation, secondary recreation, visual appreciation, human consumption and cultural and spiritual values (Photo: Kerry Trapnell)
EnvironmentalValuesanddefinitions
Aquatic Ecosystem
Water for freshwater ecosystem protection
Primary Recreation
Recreation with direct contact with water ie: swimming, snorkeling
Irrigation Irrigating crops such as bananas, legumes etc.
Secondary Recreation
Recreation with indirect contact with water such as boating, canoeing etc.
Stock Water Water for stock consumption Visual Appreciation
Activities with no contact with water ie: sightseeing
Farm Use Water for farm use other than drinking water, such as in fruit packing
Drinking Water
Drinking water supplies for human consumption
Aquaculture Water for aquaculture farming Industrial Water for uses such as power generation, manufacturing plants
human Consumption
Human consumption of wild or stockedfish,crustaceansorshellfish
Cultural and Spiritual
Cultural and spiritual values including those of Traditional Owners

Eastern Cape York Water Quality Improvement Plan
19.
Eastern Cape York Water Quality Improvement Plan
20.
Figure 4: Environmental Values for freshwaters and estuaries of Jacky Jacky Basin (Source: EHP) Figure 5: Environmental Values for freshwaters and estuaries of Olive-Pascoe Basin (Source: EHP)

Eastern Cape York Water Quality Improvement Plan
21.
Eastern Cape York Water Quality Improvement Plan
22.
Figure 6: Environmental Values for freshwaters and estuaries of Lockhart Basin (Source: EHP) Figure 7: Environmental Values for freshwaters and estuaries of Stewart Basin (Source: EHP)
Eastern Cape York Water Quality Improvement Plan
23.
Eastern Cape York Water Quality Improvement Plan
24.
Figure 8: Environmental Values for freshwaters and estuaries of Normanby Basin (Source: EHP) Figure 9: Environmental Values for freshwaters and estuaries of Jeanie Basin (Source: EHP)

Eastern Cape York Water Quality Improvement Plan
25.
Eastern Cape York Water Quality Improvement Plan
26.
Figure 10: Environmental Values for freshwaters and estuaries of Endeavour Basin (Source: EHP) Figure 11: Environmental Values for coastal waters of eastern Cape York (Source: EHP)

Eastern Cape York Water Quality Improvement Plan
27.
Eastern Cape York Water Quality Improvement Plan
28.
Current condition of water quality
Freshwater and estuary water quality
Eastern Cape York is a large region with a diversity of landforms, river types, and land use intensity. While extensive freshwater and/or estuary water quality datasets exist from some eastern Cape York rivers, such as the Annan, Endeavour and Normanby Rivers, there is a paucity of data from many other river systems, particularly those in the Northern section of the region. However, it is generally accepted that water quality in the Northern section is relatively good and is considered to have High Ecological Value (HEV) status.
In the Central section (Stewart Basin, Hann Sub Basin and Normanby Sub-Basin), accelerated erosion from land use has increased sediment concentrations in waterways, particularly during the wet season and flood events(Brooks et al., 2013). A large fraction of these sediments (up to 80%) settle out in the main river channels, wetlands andfloodplains,potentiallyreducinghabitatconditioninthese areas. Highly turbid conditions in the estuary (>500 NTU at times) may be associated with this deposition of sediments from the upper catchment. The remaining fine suspended sediment and associated nutrients aredischargedtotheGBRlagoonduringfloodevents.Duringambientconditions (baseflow), theNormanbyBasin isconsidered to be in generally good condition compared to more intensively developed catchments. There are very low concentrations of pollutants (hydrocarbons, pesticides, metals) and nutrients in the rivers, except for the upper Laura River, where high levels of nutrients and algae are associated with agricultural land use. During periodsofverylowornoflow,poorconditionshavebeenrecorded in the Normanby due to lack of freshwater flushing, cattle accessing the remaining waterholesand the concentration of nutrients, algae and bacteria (Howley, 2010).
In the Southern section, water quality condition is also dependentonseasonandflow.Ambientwaterqualityinthe Annan and Endeavour rivers are generally considered good, with low contaminant levels (suspended sediments,
nutrients, hydrocarbons, metals and herbicides) in the areas that have been sampled (Howley et al., 2012). Duringfloodevents,highconcentrationsofsuspendedsediments (up to 800mg/L) from accelerated erosion, particularly in the Scrubby and Oakey Creek sub-catchments, enter the Annan and Endeavour rivers to be discharged to the marine receiving waters (Eyre and Davies, 1996, Shellberg et al., 2016). Elevated metals have been detected in the upper Annan River associated with releases from a mine tailings dam; however, water quality remains within the acceptable range for the Protection of Aquatic Ecosystems (ANZECC, 2000) for the majority of the year. Although little monitoring has been done, rivers such as the McIvor, Jeannie, and Starcke are also assumed to be in generally good condition, but with some anthropogenic impact from erosion, grazing, mining and agriculture.
Wetland condition, as with the river condition, is extremely variable. During the wet season, most eastern Cape York wetlands appear to be in excellent condition, with good water quality, high aquatic and riparian vegetation cover and diversity. However, across all sections of the region, many wetlands are highly degraded during the dry season, when cattle and feral pigs are concentrated around the wetlands and water quality and vegetation condition is poor (Doupe et al., 2009, Howley et al., 2009, Stephan and Howley, 2009).
Freshwater and estuary water quality guidelines and targets
Water Quality Guidelines have been established for eastern Cape York rivers and estuaries based on an assessment of all available water quality data. Figures 12 and 13 show the water quality monitoring locations for eastern Cape York. The Guidelines report (Moss and Howley, 2016) presents the acceptable range of concentrations for each river for a range of water quality parameters including dissolved oxygen, pH, turbidity, electrical conductivity, nutrients (total, dissolved and particulate nitrogen and phosphorus) and suspended sediments.
Figure 12: Water Quality sample locations for Northern section of eastern Cape York (Source: Appendix 9, Moss and Howley, 2016)

Eastern Cape York Water Quality Improvement Plan
29.
Eastern Cape York Water Quality Improvement Plan
30.
Figure 13: Water Quality Sample locations for Central and Southern sections of eastern Cape York (Source: Appendix 9, Moss and Howley, 2016)
The water quality guidelines apply only to ambient
(baseflow)conditionsformostriversystems;however,
the Normanby guidelines specify water quality ranges
forwetseason,dryseasonandeventflow.Formanyriver
systems or sub-catchments (all basins in the Northern
section, the Stewart Basin and Hann Sub Basin in the
Central section, and most of the Jeannie Basin in the
Southern section), there was only a limited dataset
available and additional monitoring is recommended
to improve guideline certainty. Additional monitoring
ofeventflowconditionstodetectacceleratederosion
impacts is a high priority. Estuary water quality data
was also limited for all but the Normanby, Annan,
Endeavour and Jeannie rivers. Further sampling is
recommended to establish estuarine guidelines for the
remaining estuaries.
Many of the Eastern Cape York freshwaters are
considered to be high ecological value (HEV). For
these waters, the guidelines state that there should be
no detectable change in water quality. For rivers that
are slightly or moderately disturbed such as the upper
Normanby river tributaries, targets have been set for
reductions in suspended sediment concentrations
and particulate nutrients. The targets are for a 10th
percentile reduction in suspended sediments and
particulate nutrients during the wet season and a 25%
reduction of flood event concentrations. At the lower
Normanby (end-of-catchment) targets are set for a
short-term (7 year) 10% reduction in event sediment
and particulate nutrient concentrations. The end-of-
catchment targets are lower due to the large fraction of
sediment that settles out within the catchment. Targets
have also been set to reduce nutrient concentrations in
the Laura River across all seasons.
The proposed water quality guideline sources to protect
human-use EVs (those EVs other than the aquatic
ecosystem, e.g. recreation, stock watering, aquaculture
and crop irrigation) are presented in Table 5. Unless
otherwise stated, these are based on relevant national
water quality guidelines, and reference to those
national guidelines or codes (as updated) is essential
to obtain comprehensive listings of all indicators and
corresponding guideline values. Table 5 presents a
summary only. The human use water quality guideline
source documents include:
• Australian Drinking Water Guidelines (NHMRC,
2011, updated Feb 2016)
• Australia New Zealand Food Standards Code
(Australian Government).
• Australian and New Zealand Guidelines for Fresh
and Marine Water Quality (ANZECC & ARMCANZ,
2000).
• Guidelines for Managing Risks in Recreational
Water (NHMRC, 2008).
For more information on the water quality guidelines for
all rivers refer to Appendix 9: Water Quality Guidelines
for fresh and estuarine waters of Eastern Cape York
(Moss and Howley, 2016).
Eastern Cape York Water Quality Improvement Plan
31.
Eastern Cape York Water Quality Improvement Plan
32.
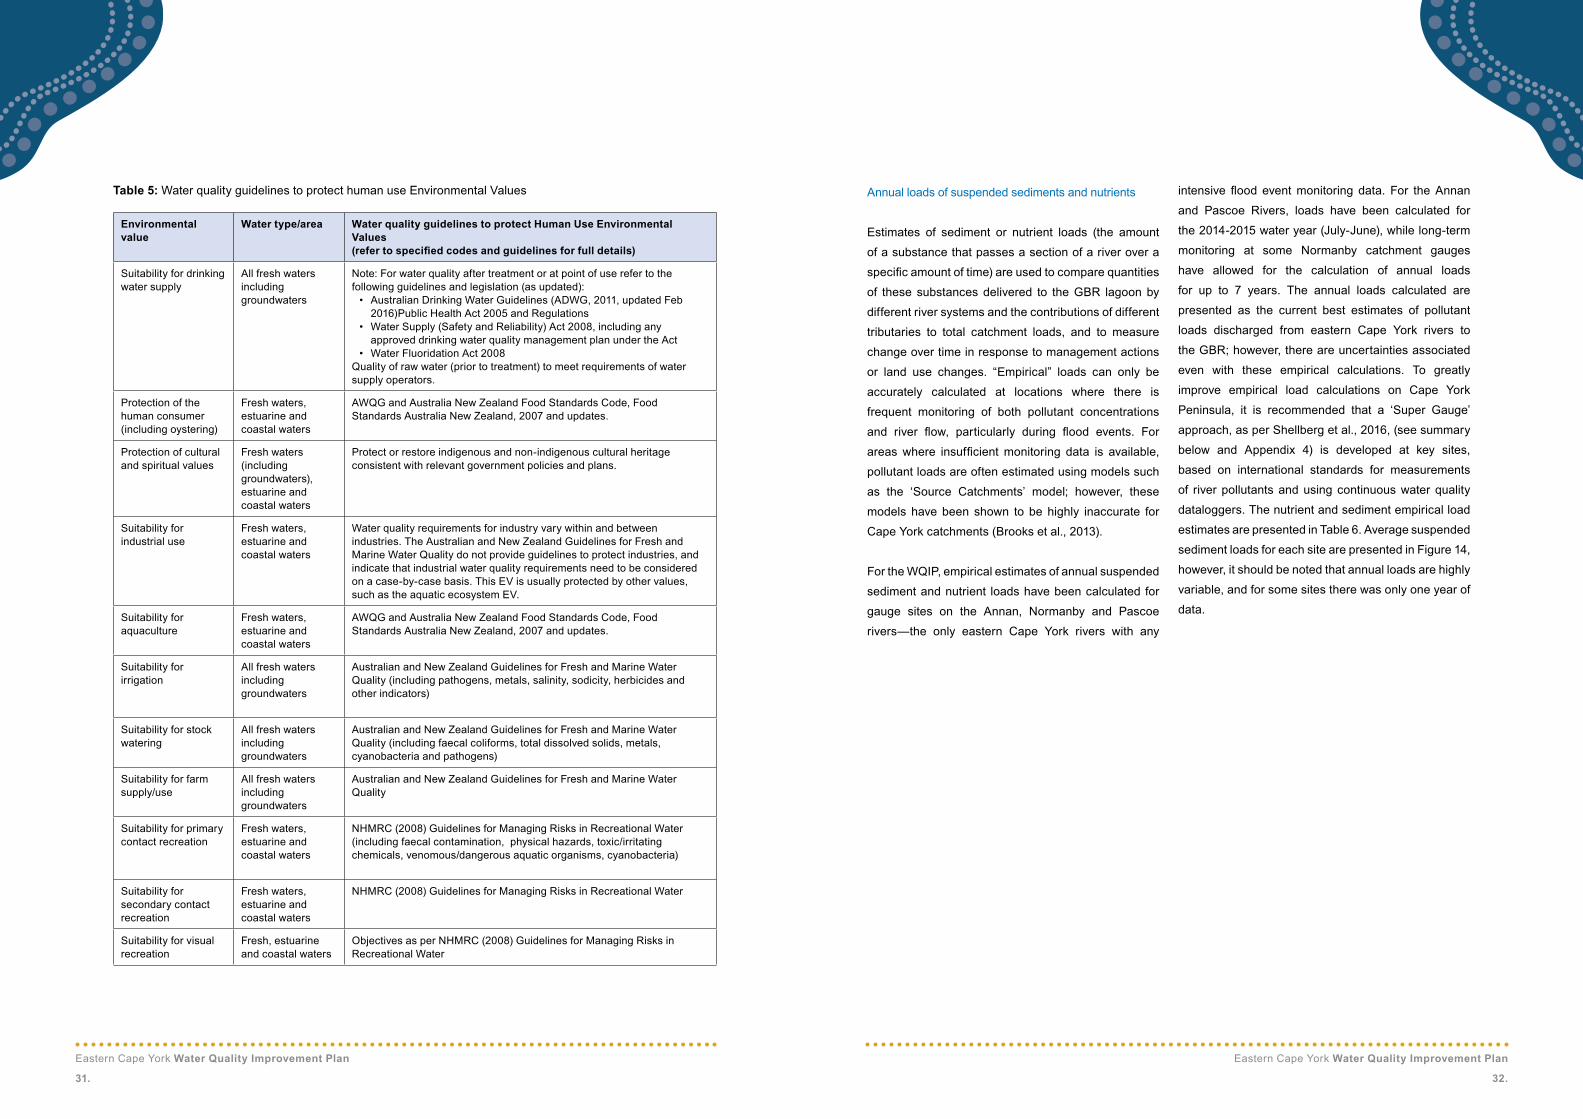
Table 5: Water quality guidelines to protect human use Environmental Values Annual loads of suspended sediments and nutrients
Estimates of sediment or nutrient loads (the amount
of a substance that passes a section of a river over a
specificamountoftime)areusedtocomparequantities
of these substances delivered to the GBR lagoon by
different river systems and the contributions of different
tributaries to total catchment loads, and to measure
change over time in response to management actions
or land use changes. “Empirical” loads can only be
accurately calculated at locations where there is
frequent monitoring of both pollutant concentrations
and river flow, particularly during flood events. For
areaswhere insufficientmonitoring data is available,
pollutant loads are often estimated using models such
as the ‘Source Catchments’ model; however, these
models have been shown to be highly inaccurate for
Cape York catchments (Brooks et al., 2013).
For the WQIP, empirical estimates of annual suspended
sediment and nutrient loads have been calculated for
gauge sites on the Annan, Normanby and Pascoe
rivers—the only eastern Cape York rivers with any
intensive flood eventmonitoring data. For theAnnan
and Pascoe Rivers, loads have been calculated for
the 2014-2015 water year (July-June), while long-term
monitoring at some Normanby catchment gauges
have allowed for the calculation of annual loads
for up to 7 years. The annual loads calculated are
presented as the current best estimates of pollutant
loads discharged from eastern Cape York rivers to
the GBR; however, there are uncertainties associated
even with these empirical calculations. To greatly
improve empirical load calculations on Cape York
Peninsula, it is recommended that a ‘Super Gauge’
approach, as per Shellberg et al., 2016, (see summary
below and Appendix 4) is developed at key sites,
based on international standards for measurements
of river pollutants and using continuous water quality
dataloggers. The nutrient and sediment empirical load
estimates are presented in Table 6. Average suspended
sediment loads for each site are presented in Figure 14,
however, it should be noted that annual loads are highly
variable, and for some sites there was only one year of
data.
Environmental value
Water type/area Water quality guidelines to protect human Use Environmental Values (refertospecifiedcodesandguidelinesforfulldetails)
Suitability for drinking water supply
All fresh waters including groundwaters
Note: For water quality after treatment or at point of use refer to the following guidelines and legislation (as updated):• Australian Drinking Water Guidelines (ADWG, 2011, updated Feb
2016)Public Health Act 2005 and Regulations• Water Supply (Safety and Reliability) Act 2008, including any
approved drinking water quality management plan under the Act• Water Fluoridation Act 2008
Quality of raw water (prior to treatment) to meet requirements of water supply operators.
Protection of the human consumer (including oystering)
Fresh waters, estuarine and coastal waters
AWQG and Australia New Zealand Food Standards Code, Food Standards Australia New Zealand, 2007 and updates.
Protection of cultural and spiritual values
Fresh waters (including groundwaters), estuarine and coastal waters
Protect or restore indigenous and non-indigenous cultural heritage consistent with relevant government policies and plans.
Suitability for industrial use
Fresh waters, estuarine and coastal waters
Water quality requirements for industry vary within and between industries. The Australian and New Zealand Guidelines for Fresh and Marine Water Quality do not provide guidelines to protect industries, and indicate that industrial water quality requirements need to be considered on a case-by-case basis. This EV is usually protected by other values, such as the aquatic ecosystem EV.
Suitability for aquaculture
Fresh waters, estuarine and coastal waters
AWQG and Australia New Zealand Food Standards Code, Food Standards Australia New Zealand, 2007 and updates.
Suitability for irrigation
All fresh waters including groundwaters
Australian and New Zealand Guidelines for Fresh and Marine Water Quality (including pathogens, metals, salinity, sodicity, herbicides and other indicators)
Suitability for stock watering
All fresh waters including groundwaters
Australian and New Zealand Guidelines for Fresh and Marine Water Quality (including faecal coliforms, total dissolved solids, metals, cyanobacteria and pathogens)
Suitability for farm supply/use
All fresh waters including groundwaters
Australian and New Zealand Guidelines for Fresh and Marine Water Quality
Suitability for primary contact recreation
Fresh waters, estuarine and coastal waters
NHMRC (2008) Guidelines for Managing Risks in Recreational Water (including faecal contamination, physical hazards, toxic/irritating chemicals, venomous/dangerous aquatic organisms, cyanobacteria)
Suitability for secondary contact recreation
Fresh waters, estuarine and coastal waters
NHMRC (2008) Guidelines for Managing Risks in Recreational Water
Suitability for visual recreation
Fresh, estuarine and coastal waters
Objectives as per NHMRC (2008) Guidelines for Managing Risks in Recreational Water

Eastern Cape York Water Quality Improvement Plan
33.
Eastern Cape York Water Quality Improvement Plan
34.
Figure 14: Average estimated annual suspended sediment load over the periods of intensive
sampling for Pascoe, Normanby and Annan River gauge sites. The periods of sampling varied
1 to 7 years. The averages are presented only as a rough comparison of loads from different
sub-catchments. Annual loads vary greatly depending on discharge and catchment conditions
(Source: Appendix 8, Howley et al., 2016)
Table 6: Suspended Sediment and Nutrient Load Estimates for Pascoe, Normanby and Annan River gauge sites
(Source: Appendix 8, Howley et al., 2016)
Site CodeWater Year
Discharge SS Tn Pn Don nh3 nox TP PP DoP Po4
GL/year ktonnes tonnes
Pascoe River102102A
2014-15 1,315 56 527 142 254 12 69 21 17 13 1
Normanby River at
Kalpowar105107A
2006-07 1,766 58 723 170 499 22 36 87 20 49 23
2007-08 3,649 206 1841 595 1143 53 43 167 30 70 78
2008-09 2,350 101 1098 266 753 30 58 98 18 72 25
2009-10 2,927 173 1326 65 1229 46 59 159 30 126 14
2010-11 5,960 268 5605 481 839 68 74 318 31 159 141
2011-12 1,162 46 494 139 338 9 13 87 3 65 28
2012-13 1,828 142
2013-14 2,663 150 2069 623 1200 64 53 258 182 52 11
Battlecamp105101A 2013-14 953 584 1589 1256 273 9 55 530 503 13 15
Laura River105102A
2013-14 396 90 316 173 89 4 20 48 34 4 3
2014-15 22 1 12 4 5 0 0 1 1 0 0
East Normanby105105A
2013-14 166 38 135 71 32 1 26 16 14 2 1
2014-15 94 19 83 40 21 1 11 10 8 1 0
West Normanby105106A
2012-13 332 100 338 230 68 50 6
2013-14 300 138 360 279 79 64 6
2014-15 34 8 31 20 6 4 1
Annan River Beesbike107003A
2014-15 303 24 142 67 44 2 37 21 19 3 1
Annan River estuary
2014-15 600 71 271 132 38 32

Eastern Cape York Water Quality Improvement Plan
35.
Eastern Cape York Water Quality Improvement Plan
36.
The Reef 2050 Plan goal is to reduce end-of-river
anthropogenic loads of suspended sediment and
particulate nutrients by at least 20% by 2018. The Cape
York WQIP Science Advisory Panel has determined
that the 20% end-of-catchment anthropogenic load
reductions for sediment and particulate nutrients
are appropriate short-term (by year 2022) goals for
disturbed catchments that are identified as priorities
in eastern Cape York. End-of-catchment sediment
loads in the most disturbed catchments are estimated
to have at least doubled due to human disturbance
(anthropogenic); this equates to a 10% total load
reduction of end-of-catchment sites. However, in order
to achieve this end-of-catchment reduction, a greater
reduction is needed at the most disturbed upstream
sub-catchments. A 50% anthropogenic sediment and
particulate nutrient load reduction target (equating to
25% of total loads) was determined by the Science
Advisory Panel to be a reasonable goal for these
disturbed sub-catchment gauge sites, to achieve a
20% reduction of anthropogenic loads (10% of total
loads) at end-of-river sites. These 25% (disturbed
sub-catchment) and 10% end-of-catchment total load
reductions for suspended sediments and particulate
nutrients correlate to the flood event concentration
reduction targets established in the Eastern Cape
York Water Quality Guidelines Report (Appendix
9, Moss and Howley, 2016). For the less disturbed
(HEV) catchments such as the Pascoe, the target is
to maintain current water quality through management
that ensures there is no increase in pollutant loads.
Applying reduction targets directly to annual loads
values is problematic since these values vary
depending on rainfall and other catchment factors. It
is recommended that a percentage load reduction
target is applied to individual flood events based on
accurate (continuous) measurements of concentration
and discharge, which can be used to evaluate ratings
curves and to calculate event mean concentration
(EMC)foreachfloodevent.
Loads calculation methods, sampling frequencies,
ratings curves, estimated loads tables and
recommendations for future loads calculations are
presented in the Eastern Cape York Sediment and
Nutrient Loads Report (Appendix 8, Howley et al.,
2016).
Marine water quality
Several studies over the past 20 years have shown that
ambient marine water quality in eastern Cape York is
in good condition, and is generally in better condition
than other GBR regions. Fabricius et al. (2005) found
that water around inshore reefs in northern Princess
Charlotte Bay (PCB) had lower nutrient, sediment and
chlorophyll-a concentrations than reefs in the Wet
Tropics, correlating to higher live coral cover, coral
speciesrichnessandfishabundanceinPCB.TheLong-
Term Chlorophyll-a Monitoring Programme (Brodie et
al., 2007) found that inner-shelf waters adjacent to Cape
York Peninsula had mean chlorophyll-a concentrations
(0.21μg/L)lessthanhalfthatofinshorewatersofthe
centralandsouthernGBR(0.54μg/L).
In contrast to ambient water quality, flood event and
flood plume monitoring from the Annan, Endeavour
and Normanby rivers (Southern and Central sections)
have shown that high concentrations of suspended
sediments are discharged from these rivers to the
marine environment, where they regularly inundate
inshore reefs and coastal seagrass meadows. Davies
(1995) measured suspended sediment concentrations
between15-55mg/L inanAnnanRiver floodplume.
In a comparison of Annan River and Daintree River
flood events, Davies and Eyre (2005) found that the
estimated sediment load discharged from the Annan
River was significantly higher than the load from a
larger magnitude flood event in the Daintree River.
Nutrient yields from the Annan were also higher than
those from the Daintree River for the events studied.
Amongst GBR flood plume studies, plume samples
from Princess Charlotte Bay (Normanby Basin event
discharge) had the third highest mean suspended
sediment concentration (21.3 mg/l) next to the Burdekin
and Fitzroy River plumes (Howley et al., in prep; Devlin
2012). High dissolved nitrogen concentrations were
also detected in Princess Charlotte Bay plumes. With
the exception of the Normanby research and one small
AnnanRiverplume,fewCapeYorkfloodplumeshave
been sampled.
An assessment of all the available marine water quality
data for the Northern, Central and Southern sections
of eastern Cape York indicated that ambient water
quality remains in relatively good condition for the
open coastal, mid-shelf and offshore zones, however,
there were some exceedances of the GBR marine
water quality guidelines (Appendix 5). Mean particulate
nitrogen and particulate phosphorus concentrations
exceeded the GBR guidelines in both the dry season
and wet season at a range of zones across all
sections. Mean suspended sediment concentrations
in the Central section for all zones and Northern open
coastal zone also exceeded the guidelines. There were
significant variations between the Northern, Central
(Princess Charlotte Bay) and Southern sections,
howeveritwasdifficulttodrawconclusionsaboutthese
findingsduetothelackofconsistentsamplingregimes
acrosseachofthesections—forexample,floodevent
data was only available from the Normanby Basin
(Central section). The most notable difference was
the elevated chlorophyll-a concentrations detected in
the Southern enclosed coastal zone (Endeavour and
Jeannie Basin receiving waters) during both the dry
and wet seasons (Figure 15). Elevated Chlorophyll-a is
an indicator of elevated nutrients in marine waters and
there is a potential link between elevated Chlorophyll-a
andcrown-of-thornsstarfishoutbreaksintheSouthern
section of the region. Mean suspended sediment
concentrations for the coastal and midshelf zones
were slightly higher in the Central section during the
dry season and were similar to the Southern section
during the wet season (Figure 15). This may indicate
thatthefinesuspendedsedimentfromfloodeventsin
the Normanby, Annan and Endeavour Rivers, which is
estimated to have increased by 50% from human land
use,isbeingre-suspendedduringnon-floodperiodsto
impact water quality in the inshore marine environment
of the Central and Southern sections of eastern Cape
York.
For more information on marine water quality refer
to the synthesis of marine water quality (Appendix 6,
Howley, 2015) and the marine water quality guidelines
(Appendix 5, GBRMPA, 2016)

Eastern Cape York Water Quality Improvement Plan
37.
Eastern Cape York Water Quality Improvement Plan
38.
Figure 15: Wet and dry season marine water quality sampling results for chlorophyll and total suspended solids
(TSS) for Northern, Central (PCB) and Southern sections of eastern Cape York.
Dry Season
Wet Season
Dry Season
Wet Season
Current condition of ecosystem health
Estuarine systems
The eastern Cape York region contains approximately
40,000 km2 of estuarine systems (mangroves,
saltmarsh/salt flats and intertidal flats) and of the 49
estuaries surveyed in this region 47 (95.8%) were
assessed as near pristine and two (4.2%) estuaries
were assessed as largely unmodified (Australian
Government, 2015). The catchment modifying factors
were altered catchment hydrology (extractive industry
and a weir) in the Annan River estuary and estuary use
(port/port works) and land use (urban) in the Endeavour
River estuary.
Coastal wetlands
Coastal wetlands in the eastern Cape York region
are primarily unmodified, andmost catchments have
retained almost all of the natural coastal wetland extent
(Queensland WetlandInfo, 2015). Wetland extent is
reported as part of the Paddock to Reef Program every
four years. In the period between 2009 and 2013, no
net loss of wetlands was reported in the Cape York
Region (Queensland Government, 2015).
Coral reefs
The total area of coral reef in the GBR World Heritage
Area is estimated around 24,000 km2 (GBRMPA, 2014).
The total area of coral reefs calculated in the eastern
Cape York marine NRM region for this assessment
is 10,354 km2 (Coppo et al., 2016) (derived from
GBRMPA coral reef mapping). A large proportion of
reefs are located in the Northern section.
The AIMS Long Term Monitoring Program has
conducted coral reef surveys in the region, at 70
sites for broad scale surveys and 8 sites for intensive
surveys (AIMS, 2015). At inner, middle and outer shelf
reefs in the Northern section coral cover was very
variable between reefs; 20-50%, 10-70% and 20-45%
respectively. Hard coral cover in the Central section
was 10-50%, 5-30% and 5-50% at inner, middle and
outer shelf reefs. All reefs in the Southern section
exhibited variable hard coral cover of between 10-50%.
Average coral cover in the Northern section is higher
than the Central and Southern sections of the region
(Figure 16). Coral reefs in the Northern section are
considered to be in very good condition while the reefs
in the Central and Southern Sections are considered
to be good. While the condition of most reefs in the
Southern section is good, a decline in condition has
been observed at some fringing and in-shore reefs in
the Southern section over the past 20 years (Howley
et al., 2007).
The generally high coral cover and very good condition
of reefs in the Northern section of eastern Cape York
mirrors similarly high levels on the contiguous reefs of
the Torres Strait section of the GBR (Sweatman et al.,
2015). It should be noted that the differences in coral
condition may reflect natural variations in ambient
conditions as well as variations arising from land use
andwaterqualityimpacts.Themostsignificantthreats
to the viability of reefs in eastern Cape York are reduced
water quality and increased storm damage and coral
bleaching due to climate change (Coppo et al., 2016).
At the time of finalising this plan (early 2016), the
northern GBR experienced a significant mass coral
bleaching event that is likely to result in high levels of
coral mortality along all the reefs adjacent to eastern
Cape York. This coral bleaching event can be attributed
to climate change, however, in the short term the
practical mechanism for improving the recovery and
resilience of the affected coral reefs is to take action to
improve water quality in eastern Cape York catchments.

Eastern Cape York Water Quality Improvement Plan
39.
Eastern Cape York Water Quality Improvement Plan
40.
Figure 16: Average hard coral cover of inner, mid and outer shelf reefs within the Northern, Central and Southern
Sections of eastern Cape York (Source: Appendix 7, Coppo et al., 2016)
Potential Biodiversity Impact Matrix
Will Higham (Cape York NRM) and Jessie Price
(South Cape York Catchments)
Little is currently known about the marine water
quality thresholds for a wide range of individual coral
species; however, there are some species of coral
that are more sensitive to water quality degradation.
As marine water quality declines, the more sensitive
species of a coral reef ecosystem are lost and the
less sensitive species dominate, resulting in a loss of
biodiversity and decline in reef condition. The marine
water quality threshold that would degrade a coral reef
in Very Good condition down to Good condition is not
currentlydefined.
The Marine Risk Assessment process that informs this
plan provides a visual representation of the relative risk
of degraded water quality to the marine environment
and has been used by many others to prioritise
investment at both GBR-wide and regional scales.
A major limitation to interpretation of the marine risk
assessment in the northern GBR is that the current
condition of a reef ecosystem is not factored when
calculating relative risk of water quality. For example, a
coralreefecosystemdefinedasVeryGoodcondition
in a relative risk area has a much greater potential for
biodiversity impact (i.e. species loss), than a Moderate
condition reef in the same relative risk area.
A Potential Biodiversity Impact Matrix has been
developed to overcome these limitations and support
interpretation of the relative risk assessment mapping
and decision-making in the Eastern Cape York Water
Quality Improvement Plan.
The Potential Biodiversity Impact Matrix shows that
as current reef condition increases from poor to very
good, and the relative risk of degraded water quality
increases from very low to very high, the potential
biodiversity impact increases from very low to
catastrophic. When applying this matrix to the Marine
Risk Assessment for eastern Cape York, the Southern
and Central sections are considered to be in good
condition, and the Northern section is considered to
be in very good condition.
To interpret the Marine Risk Assessment for eastern
Cape York we used this Potential Biodiversity Impact
Matrix to modify the map of relative risk to water
quality to an indicator of potential biodiversity impact
from degraded water quality.
When applying this matrix to the Marine Risk Assessment for eastern Cape York:
• The Northern section is considered to be Very Good condition
• The Southern and Central sections are considered to be Good condition
Potential Biodiversity Impact MatrixRelative Risk of degraded water quality
Current Reef Condition
Poor Moderate Good Very Good
Very Low Very Low Very Low Low Low - Medium
Low Very Low Low Medium High
Moderate Low Medium High Very High
High Medium High Very High Catastrophic
Very High High Very High Catastrophic Catastrophic

Eastern Cape York Water Quality Improvement Plan
41.
Eastern Cape York Water Quality Improvement Plan
42.
Seagrass
Approximately 35,000 km2 of potential seagrass
habitat has been mapped in the coastal waters around
Queensland and Torres Strait since the mid-1980s
(McKenzie et al., 2010). These surveys, plus statistical
modelling of seagrass in deeper offshore waters, show
that37,454km2oftheseafloorwithintheGreatBarrier
Reef World Heritage Area and Torres Strait has some
seagrass present making Queensland’s seagrass
resourcesgloballysignificant(Colesetal.,2011).The
total area of potential seagrass habitat (surveyed) in
the marine NRM region for Cape York is 2,668km2
(TropWATER, 2013) and the modelled deep water
(>15m) seagrass estimate is 5,668km2 (Coles et al.,
2009). The combined total of 12,218km2 accounts for
~35% of the total area reported for the GBR. A large
proportion of surveyed seagrass and deep water
modelled seagrass are in the Southern section.
Regular seagrass monitoring through the Marine
Monitoring Program indicates that the status of
seagrass condition in the eastern Cape York region is
poor. Coastal intertidal seagrass abundance was very
good in the Central section, poor in the Northern section
and not monitored in the Southern section. Intertidal
reef seagrass abundance is moderate, very poor and
poor in the Northern, Central and Southern sections
respectively. A higher proportion of colonising species
and declining and very poor reproductive effort may
suggest weaker ecosystem resistance to perturbations
and a more vulnerable state for seagrass meadows in
this region.
The largest, and potentially least disturbed, coastal
seagrass meadows (primarily sub-tidal) in eastern Cape
York (those of the Southern section between Cape
Flattery and Cape Melville) have not been monitored
andtheirconditionisnotreflectedinthisassessment.
Extensive seagrass meadows have been mapped
in the Southern section in areas such as Walker Bay
(Annan catchment), Elim Beach and near the mouth of
the Starcke River (Howley, unpublished). The results
of these surveys indicate that there are large areas of
coastal seagrass meadows (intertidal and sub-tidal) in
the Southern section that are in good condition.
Dugongs
Dugong populations along the Eastern Cape York
regional coastline, as well as around large reefs in
Princess Charlotte Bay, had high to very high (>0.5
dugongs/km2) relative dugong density and modelling
of survey results indicate an almost continuous
distribution of dugong along the Eastern Cape York
regional coastline. The very high dugong population
densities in Cape York waters are similar to those found
in the contiguous Torres Strait section of the GBR to
the north of Cape York.
Climate change, coastal development and increases
in terrestrial pollutants (sediment, nutrients and
pesticides) are all considered potential threats to
the coastal and marine assets of the eastern Cape
York region, particularly in the Central and Southern
sections where anthropogenic effects are more likely.
Dugong (Photo: Unknown)
Sediment and Cape York
Jon Brodie, James Cook University
The fine sediment, clay minerals and associated
nutrients are the components of river discharge which
have short time lags in delivery to the GBR (Brodie et
al. 2012b; Lewis et al. 2015a, b) and are associated
with effects that directly impact the biology of reef
species and ecosystems such as increasing turbidity
in coastal waters and loss of light for benthic species
(Fabricius et al. 2014, 2016), coral disease (Haapkyla
et al. 2011), COTS outbreaks (Wooldridge and Brodie
2015), seagrass loss also associated with increased
turbidity and reduced light (Petus et al. 2014;
McKenzie et al. 2015) and the connected decline in
dugong populations (Devlin et al. 2012 ICRS; Coppo
et al. 2014, 2015).
The suspended sediment of most risk to the GBR is
thefine fractionsometimesdefinedas that smaller
than15.7μm, i.e. below the fine silt boundaryand
containingtheclayandfinesiltparticlesizefractions
(Bainbridge et al., 2012, 2014, 2016; Bartley et al.,
2014; Douglas et al. 2008) or of even more risk,
just the clay mineral fraction <4 μm (Bainbridge
et al. 2016) as this is the material which contains
most of the nitrogen and phosphorus content (and
othercontaminants); is transported furthest inflood
plumes(asorganicrichflocs–Bainbridgeetal.2012
– Figure 1), rather than all depositing near the river
mouth (Lewis et al., 2014, 2015a, b; Delandmeter et
al. 2015); stays in suspension longest and is most
effective at attenuating light when in suspension
(Storlazzi et al. 2015) and results in the greatest
degree of resuspension throughout the months
following the river discharge event as seen in the
marine waters of Cape York (Fabricius et al. 2016 -
Figure 2).
Theincreasedfinesedimentsupplyfromrivers(Kroon
et al. 2012; Waters et al. 2014) and the resultant
potential increased turbidity and sedimentation can
have severe impacts on GBR organisms such as
reeffish(e.g.Wengeretal.2011,2012,2013,2014;
Hess et al. 2015; Gordon et al. 2015) through effects
on juvenile recruitment and feeding; corals through
sedimentation (e.g. Weber et al., 2006, 2012; Flores
et al., 2012; Pollock et al. 2014); decreased light
(Fabricius et al. 2013, 2014, 2016); and increasing
the competitive advantage of macro-algae and turf
algae over corals (Gowan et al. 2014; Goatley and
Bellwood 2012, 2013); and seagrass (Collier et al.,
2012, Petus et al., 2014). Suspended sediment also
interacts with other stressors to increase the overall
impact of multiple stressors on coral reefs (Ban et al.
2014; Risk 2014; Graham et al. 2015). Resuspension
of sediment in windy conditions or strong tidal currents
in shallow waters (<15 m) leads to conditions where
suspended sediment concentrations are above the
GBR water quality guidelines (De’ath and Fabricius,
2008; Great Barrier Reef Marine Park Authority,
2010), and this threatens coral reefs and seagrass
meadows through reduced light for photosynthesis
(Bartley et al. 2014).
Figure 1 shows flocs comprised of fine sediment
particles bound by transparent exopolymer particles
(e.g.mucus) forming largemudflocs,withflocsize
increasing with depth. Samples captured along
Plume Transect (bottom section) show an increase
in biological production, i.e. presence of diatoms
and cellulose/gelatinous plankton castings often
aggregatedwithsmallmudflocs.
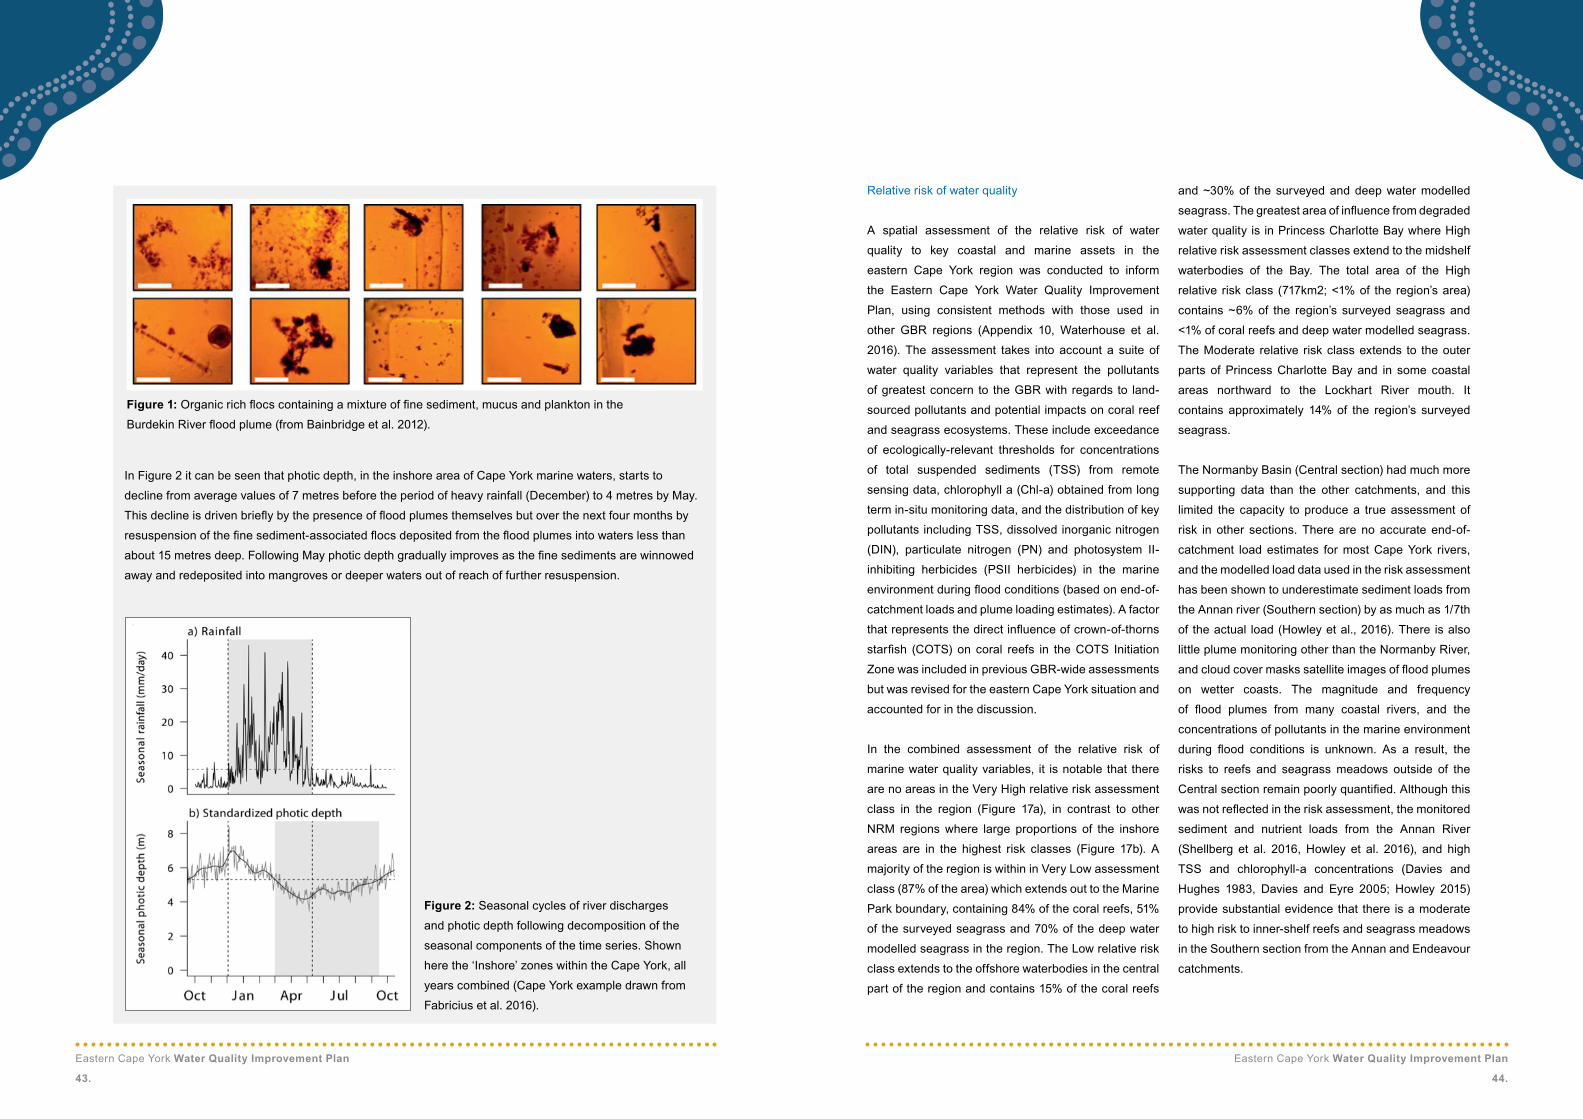
Eastern Cape York Water Quality Improvement Plan
43.
Eastern Cape York Water Quality Improvement Plan
44.
Figure 1:Organicrichflocscontainingamixtureoffinesediment,mucusandplanktonintheBurdekinRiverfloodplume(fromBainbridgeetal.2012).
In Figure 2 it can be seen that photic depth, in the inshore area of Cape York marine waters, starts to
decline from average values of 7 metres before the period of heavy rainfall (December) to 4 metres by May.
Thisdeclineisdrivenbrieflybythepresenceoffloodplumesthemselvesbutoverthenextfourmonthsby
resuspensionofthefinesediment-associatedflocsdepositedfromthefloodplumesintowaterslessthan
about15metresdeep.FollowingMayphoticdepthgraduallyimprovesasthefinesedimentsarewinnowed
away and redeposited into mangroves or deeper waters out of reach of further resuspension.
Figure 2: Seasonal cycles of river discharges
and photic depth following decomposition of the
seasonal components of the time series. Shown
here the ‘Inshore’ zones within the Cape York, all
years combined (Cape York example drawn from
Fabricius et al. 2016).
Relative risk of water quality
A spatial assessment of the relative risk of water
quality to key coastal and marine assets in the
eastern Cape York region was conducted to inform
the Eastern Cape York Water Quality Improvement
Plan, using consistent methods with those used in
other GBR regions (Appendix 10, Waterhouse et al.
2016). The assessment takes into account a suite of
water quality variables that represent the pollutants
of greatest concern to the GBR with regards to land-
sourced pollutants and potential impacts on coral reef
and seagrass ecosystems. These include exceedance
of ecologically-relevant thresholds for concentrations
of total suspended sediments (TSS) from remote
sensing data, chlorophyll a (Chl-a) obtained from long
term in-situ monitoring data, and the distribution of key
pollutants including TSS, dissolved inorganic nitrogen
(DIN), particulate nitrogen (PN) and photosystem II-
inhibiting herbicides (PSII herbicides) in the marine
environmentduringfloodconditions(basedonend-of-
catchment loads and plume loading estimates). A factor
thatrepresentsthedirectinfluenceofcrown-of-thorns
starfish (COTS) on coral reefs in theCOTS Initiation
Zone was included in previous GBR-wide assessments
but was revised for the eastern Cape York situation and
accounted for in the discussion.
In the combined assessment of the relative risk of
marine water quality variables, it is notable that there
are no areas in the Very High relative risk assessment
class in the region (Figure 17a), in contrast to other
NRM regions where large proportions of the inshore
areas are in the highest risk classes (Figure 17b). A
majority of the region is within in Very Low assessment
class (87% of the area) which extends out to the Marine
Park boundary, containing 84% of the coral reefs, 51%
of the surveyed seagrass and 70% of the deep water
modelled seagrass in the region. The Low relative risk
class extends to the offshore waterbodies in the central
part of the region and contains 15% of the coral reefs
and ~30% of the surveyed and deep water modelled
seagrass.Thegreatestareaofinfluencefromdegraded
water quality is in Princess Charlotte Bay where High
relative risk assessment classes extend to the midshelf
waterbodies of the Bay. The total area of the High
relative risk class (717km2; <1% of the region’s area)
contains ~6% of the region’s surveyed seagrass and
<1% of coral reefs and deep water modelled seagrass.
The Moderate relative risk class extends to the outer
parts of Princess Charlotte Bay and in some coastal
areas northward to the Lockhart River mouth. It
contains approximately 14% of the region’s surveyed
seagrass.
The Normanby Basin (Central section) had much more
supporting data than the other catchments, and this
limited the capacity to produce a true assessment of
risk in other sections. There are no accurate end-of-
catchment load estimates for most Cape York rivers,
and the modelled load data used in the risk assessment
has been shown to underestimate sediment loads from
the Annan river (Southern section) by as much as 1/7th
of the actual load (Howley et al., 2016). There is also
little plume monitoring other than the Normanby River,
andcloudcovermaskssatelliteimagesoffloodplumes
on wetter coasts. The magnitude and frequency
of flood plumes from many coastal rivers, and the
concentrations of pollutants in the marine environment
during flood conditions is unknown. As a result, the
risks to reefs and seagrass meadows outside of the
Centralsectionremainpoorlyquantified.Althoughthis
wasnotreflectedintheriskassessment,themonitored
sediment and nutrient loads from the Annan River
(Shellberg et al. 2016, Howley et al. 2016), and high
TSS and chlorophyll-a concentrations (Davies and
Hughes 1983, Davies and Eyre 2005; Howley 2015)
provide substantial evidence that there is a moderate
to high risk to inner-shelf reefs and seagrass meadows
in the Southern section from the Annan and Endeavour
catchments.
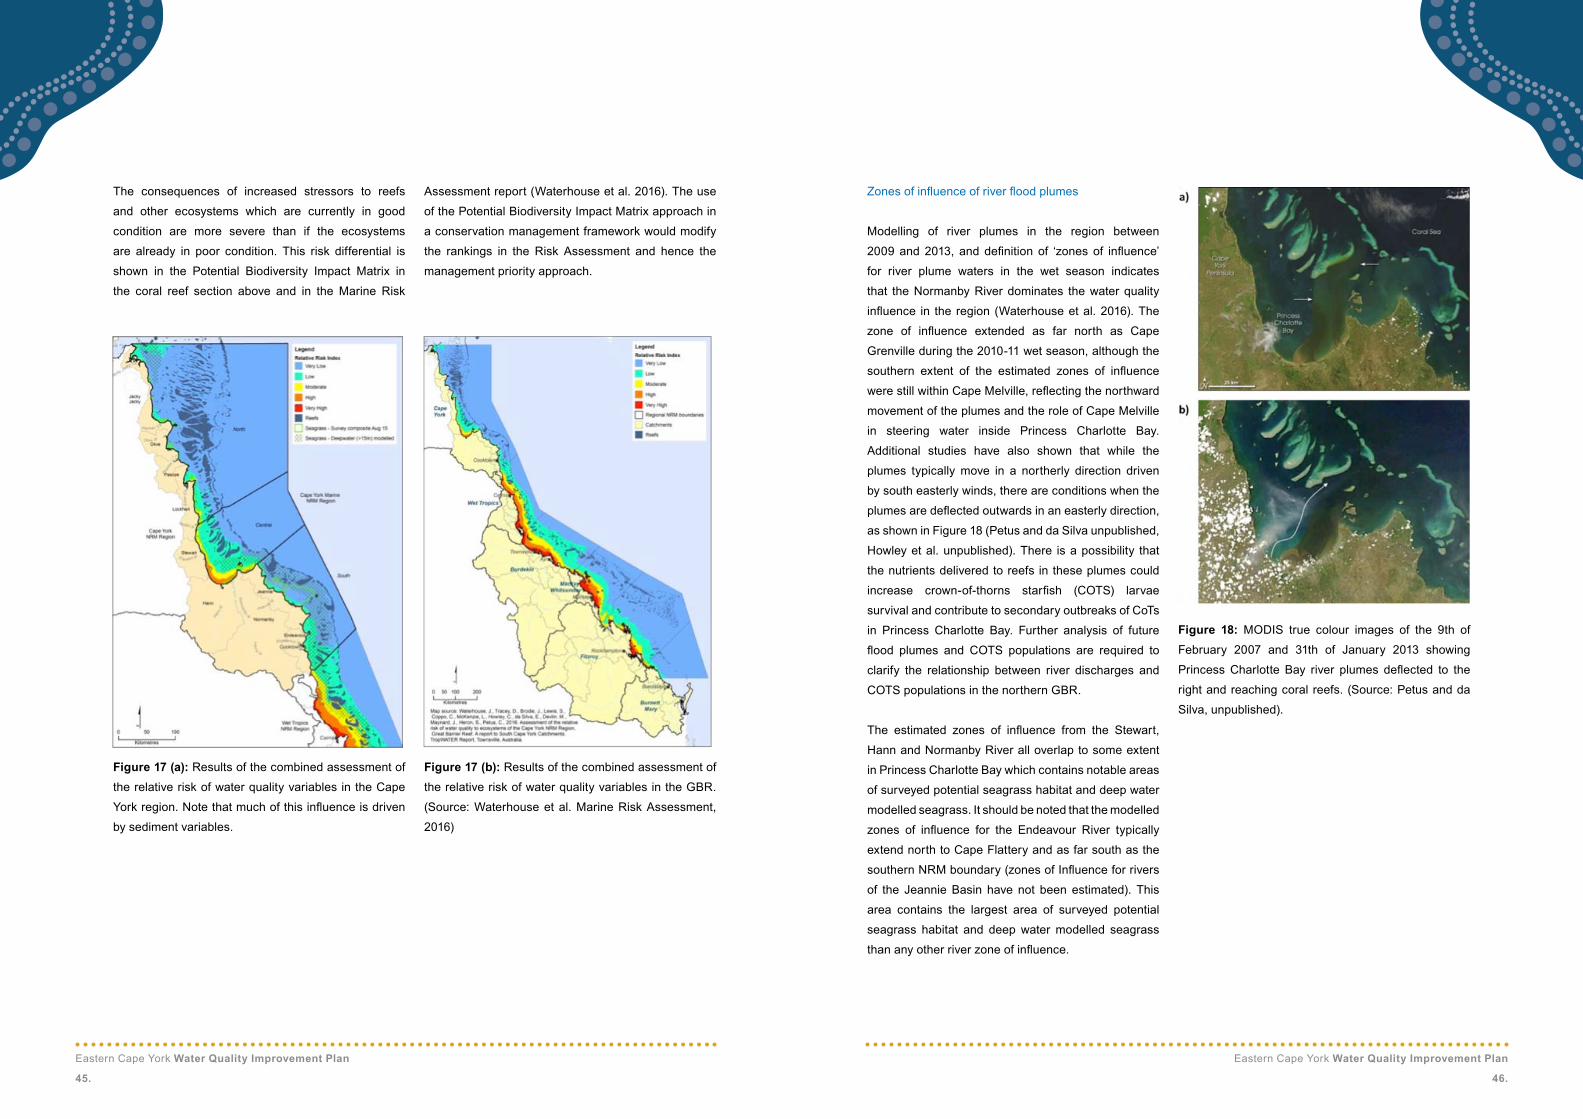
Eastern Cape York Water Quality Improvement Plan
45.
Eastern Cape York Water Quality Improvement Plan
46.
The consequences of increased stressors to reefs
and other ecosystems which are currently in good
condition are more severe than if the ecosystems
are already in poor condition. This risk differential is
shown in the Potential Biodiversity Impact Matrix in
the coral reef section above and in the Marine Risk
Assessment report (Waterhouse et al. 2016). The use
of the Potential Biodiversity Impact Matrix approach in
a conservation management framework would modify
the rankings in the Risk Assessment and hence the
management priority approach.
Zonesofinfluenceofriverfloodplumes
Modelling of river plumes in the region between
2009and2013, and definition of ‘zones of influence’
for river plume waters in the wet season indicates
that the Normanby River dominates the water quality
influence in the region (Waterhouseetal.2016).The
zone of influence extended as far north as Cape
Grenville during the 2010-11 wet season, although the
southern extent of the estimated zones of influence
werestillwithinCapeMelville,reflectingthenorthward
movement of the plumes and the role of Cape Melville
in steering water inside Princess Charlotte Bay.
Additional studies have also shown that while the
plumes typically move in a northerly direction driven
by south easterly winds, there are conditions when the
plumesaredeflectedoutwardsinaneasterlydirection,
as shown in Figure 18 (Petus and da Silva unpublished,
Howley et al. unpublished). There is a possibility that
the nutrients delivered to reefs in these plumes could
increase crown-of-thorns starfish (COTS) larvae
survival and contribute to secondary outbreaks of CoTs
in Princess Charlotte Bay. Further analysis of future
flood plumes and COTS populations are required to
clarify the relationship between river discharges and
COTS populations in the northern GBR.
The estimated zones of influence from the Stewart,
Hann and Normanby River all overlap to some extent
in Princess Charlotte Bay which contains notable areas
of surveyed potential seagrass habitat and deep water
modelled seagrass. It should be noted that the modelled
zones of influence for the Endeavour River typically
extend north to Cape Flattery and as far south as the
southernNRMboundary(zonesofInfluenceforrivers
of the Jeannie Basin have not been estimated). This
area contains the largest area of surveyed potential
seagrass habitat and deep water modelled seagrass
thananyotherriverzoneofinfluence.
Figure17(a):Results of the combined assessment of
the relative risk of water quality variables in the Cape
Yorkregion.Notethatmuchofthisinfluenceisdriven
by sediment variables.
Figure17(b):Results of the combined assessment of
the relative risk of water quality variables in the GBR.
(Source: Waterhouse et al. Marine Risk Assessment,
2016)
Figure 18: MODIS true colour images of the 9th of
February 2007 and 31th of January 2013 showing
PrincessCharlotte Bay river plumes deflected to the
right and reaching coral reefs. (Source: Petus and da
Silva, unpublished).

Eastern Cape York Water Quality Improvement Plan
47.
Eastern Cape York Water Quality Improvement Plan
48.
Relative risk of water quality to important habitat
features
Results of the relative risk assessment for important
habitat features in the eastern Cape York region are
summarised in Table 7. This highlights that many of the
ecosystems in the region are still considered to be in
good condition and are at relatively low risk from water
quality influence. Importantly, in the northern rivers
where there is limited development in the catchments,
the water quality conditions are driven by natural
conditions such as ocean upwelling of nutrients in
the Southern section of the region (associated with
Halimeda banks), and natural turbidity in shallow
coastal waters. As a way of linking these results to
catchmentwater quality influences,modelled end-of-
catchment pollutant loads (generated from the Source
Catchments model framework for the Paddock to
Reef Program) were obtained for each basin for key
pollutants (TSS, DIN, PSII herbicides, PN, Dissolved
Inorganic Phosphorus and Particulate Phosphorus),
and only the anthropogenic portions of regional total
pollutant loads were considered in relating the relative
risk to the basins. The anthropogenic load is calculated
as the difference between the long term average
annual load, and the estimated pre-European annual
load. In addition, the input variables represent longer
term time series, and in most cases, represent average
conditions. While they provide a rough indication of
anthropogenic load, the end-of-catchment models are
considered to be very low reliability for eastern Cape
York rivers (Brooks et al. 2013, Howley et al. 2016)
due to the lack of monitoring data to inform model
development.
Table 7. Results of the relative risk assessment for important habitat features in the East Cape York Region.
(Source: Waterhouse et al. (2016).
Section habitat Feature Description Potential Biodiversity Impact
Relative risk of water quality
Likely rivers ofinfluence
northern
Escape River and Kennedy Inlet System
FHA; WNI; the most extensive stand of medium–tall mangroves in QLD.
Moderate/High
Very Low/Low Limited
Margaret Bay, Lloyd Bay and Cape Grenville Area
FHA; WNI; outstanding seagrass beds (size and diversity); important dugonghabitat;significantwetlands for wading birds.
Moderate/High
Very Low/Low Limited
Raine Island Largest known green turtle rookery;mostsignificantseabirdrookery in the GBRWHA; NP.
Low/Moderate
Very Low Limited
Temple Bay FHA; WNI. Moderate/High
Very Low/Low Olive Pascoe
Weymouth Bay High seagrass diversity. Moderate/High
Very Low/Low Olive Pascoe
Olive River WNI. Moderate/High
Very Low/Low Olive
Cape Direction High seagrass diversity High Low Lockhart
Central
Silver Plains FHA; important hawksbill turtle habitat.
Moderate Low Stewart
Princess Charlotte Bay FHA; WNI; one of the largest tidal wetland areas in Australia; high seagrass diversity; important green turtle foraging grounds and dugong habitat.
High/Very High
Moderate/High
Normanby, Hann, Stewart
Marina Plains—LakefieldAggregation
WHI; >100 permanent riverine lagoons.
High/Very High
Moderate/High
Normanby
Clack Reef Complex WHI; small continental island with fringing reef and seagrass.
Moderate Low Normanby
Flinders Island Group Inner shelf high continental islands with fringing reef and seagrass.
Moderate/High
Low/Moderate
Normanby
Southern
Bay Creek, Cape Melville—Bathurst Bay
WNI; Amongst best representative mangroves on CY.
Low/Moderate
Very Low/Low
Limited
Lizard Island Unique granitic high continental islands with fringing reef and a lagoonal system.
Low Very Low Limited
Starcke River FHA; one of the most varied Cape York coastlines.
Low/Moderate
Very Low/Low
Limited
Howick Island Group Important turtle nesting area. Low Very Low Limited
Cape Flattery Dune Lakes wetland
WNI;Inlargestdunefield(internationalsignificance)ontheeast coast, north of Fraser Is.
Low/Moderate
Very Low/Low
Endeavour
Barrow Point—Cedar Bay
High seagrass diversity. Moderate Low Endeavour, Annan
Annan River FHA. Moderate Low Endeavour, Annan
FhA - Fish Habitat Area; WnI - Wetland of National Importance
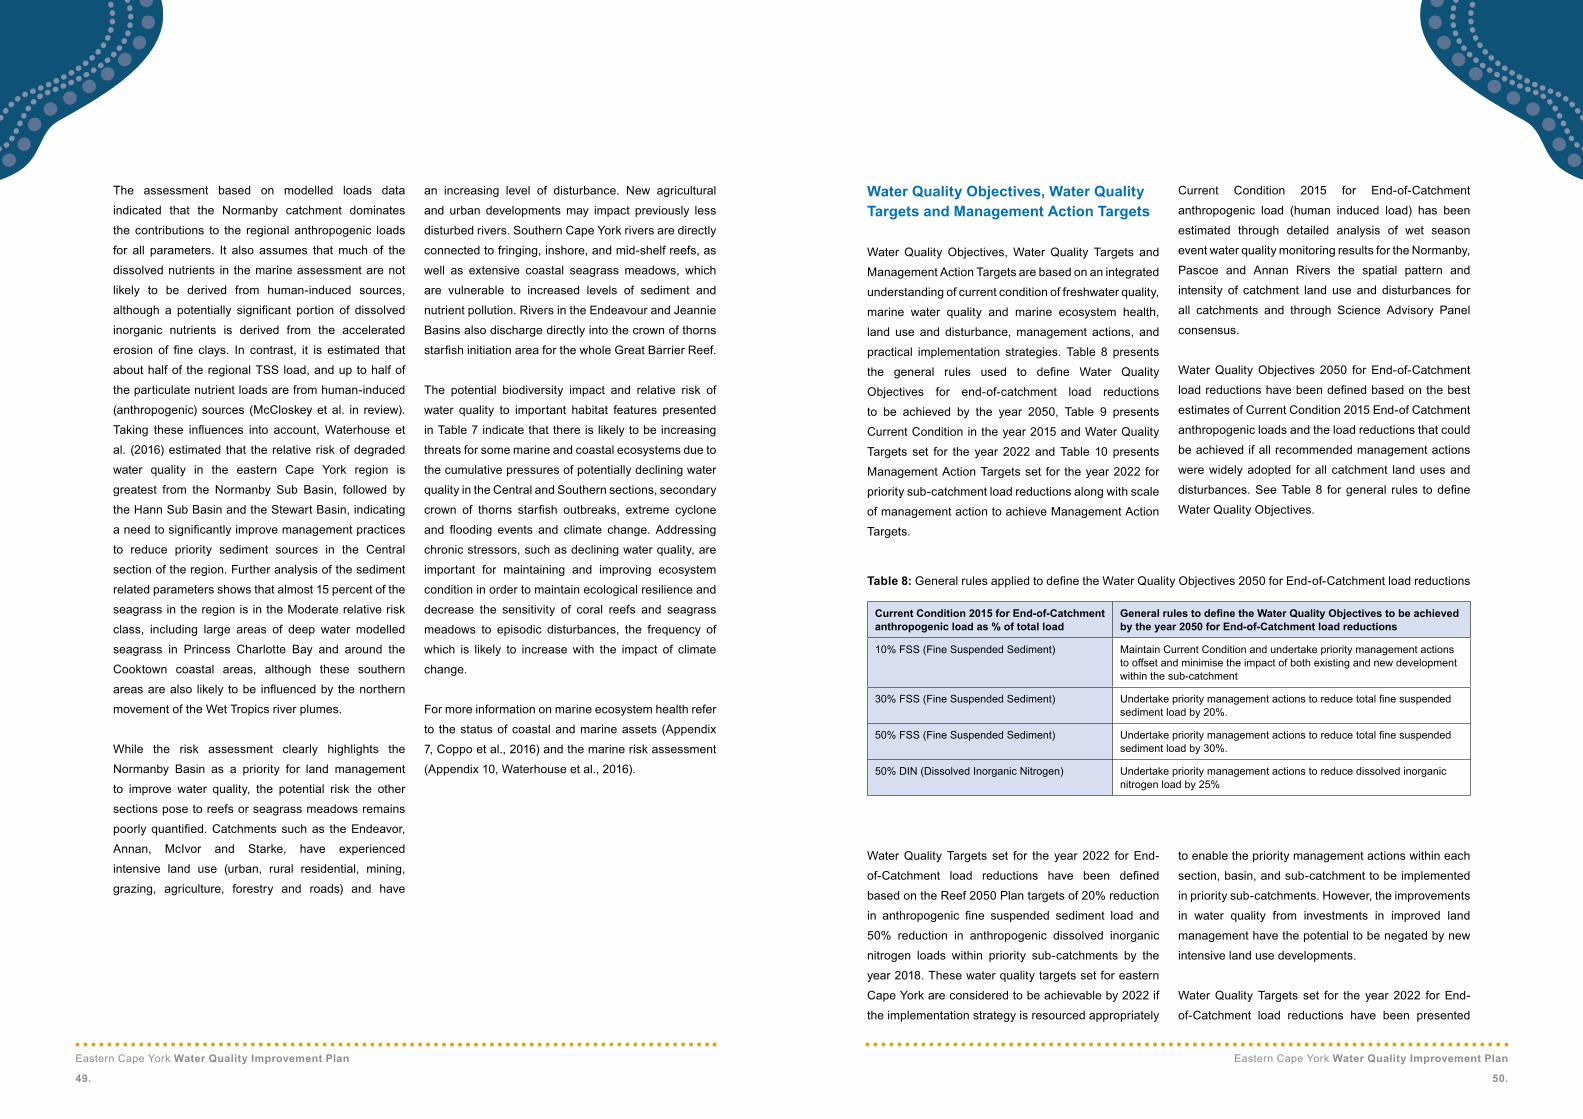
Eastern Cape York Water Quality Improvement Plan
49.
Eastern Cape York Water Quality Improvement Plan
50.
The assessment based on modelled loads data
indicated that the Normanby catchment dominates
the contributions to the regional anthropogenic loads
for all parameters. It also assumes that much of the
dissolved nutrients in the marine assessment are not
likely to be derived from human-induced sources,
although a potentially significant portion of dissolved
inorganic nutrients is derived from the accelerated
erosion of fine clays. In contrast, it is estimated that
about half of the regional TSS load, and up to half of
the particulate nutrient loads are from human-induced
(anthropogenic) sources (McCloskey et al. in review).
Taking these influences into account,Waterhouse et
al. (2016) estimated that the relative risk of degraded
water quality in the eastern Cape York region is
greatest from the Normanby Sub Basin, followed by
the Hann Sub Basin and the Stewart Basin, indicating
aneedtosignificantlyimprovemanagementpractices
to reduce priority sediment sources in the Central
section of the region. Further analysis of the sediment
related parameters shows that almost 15 percent of the
seagrass in the region is in the Moderate relative risk
class, including large areas of deep water modelled
seagrass in Princess Charlotte Bay and around the
Cooktown coastal areas, although these southern
areasarealso likely tobe influencedby thenorthern
movement of the Wet Tropics river plumes.
While the risk assessment clearly highlights the
Normanby Basin as a priority for land management
to improve water quality, the potential risk the other
sections pose to reefs or seagrass meadows remains
poorlyquantified.Catchmentssuchas theEndeavor,
Annan, McIvor and Starke, have experienced
intensive land use (urban, rural residential, mining,
grazing, agriculture, forestry and roads) and have
an increasing level of disturbance. New agricultural
and urban developments may impact previously less
disturbed rivers. Southern Cape York rivers are directly
connected to fringing, inshore, and mid-shelf reefs, as
well as extensive coastal seagrass meadows, which
are vulnerable to increased levels of sediment and
nutrient pollution. Rivers in the Endeavour and Jeannie
Basins also discharge directly into the crown of thorns
starfishinitiationareaforthewholeGreatBarrierReef.
The potential biodiversity impact and relative risk of
water quality to important habitat features presented
in Table 7 indicate that there is likely to be increasing
threats for some marine and coastal ecosystems due to
the cumulative pressures of potentially declining water
quality in the Central and Southern sections, secondary
crown of thorns starfish outbreaks, extreme cyclone
and flooding events and climate change. Addressing
chronic stressors, such as declining water quality, are
important for maintaining and improving ecosystem
condition in order to maintain ecological resilience and
decrease the sensitivity of coral reefs and seagrass
meadows to episodic disturbances, the frequency of
which is likely to increase with the impact of climate
change.
For more information on marine ecosystem health refer
to the status of coastal and marine assets (Appendix
7, Coppo et al., 2016) and the marine risk assessment
(Appendix 10, Waterhouse et al., 2016).
Water Quality objectives, Water Quality Targets and Management Action Targets
Water Quality Objectives, Water Quality Targets and
Management Action Targets are based on an integrated
understanding of current condition of freshwater quality,
marine water quality and marine ecosystem health,
land use and disturbance, management actions, and
practical implementation strategies. Table 8 presents
the general rules used to define Water Quality
Objectives for end-of-catchment load reductions
to be achieved by the year 2050, Table 9 presents
Current Condition in the year 2015 and Water Quality
Targets set for the year 2022 and Table 10 presents
Management Action Targets set for the year 2022 for
priority sub-catchment load reductions along with scale
of management action to achieve Management Action
Targets.
Current Condition 2015 for End-of-Catchment
anthropogenic load (human induced load) has been
estimated through detailed analysis of wet season
event water quality monitoring results for the Normanby,
Pascoe and Annan Rivers the spatial pattern and
intensity of catchment land use and disturbances for
all catchments and through Science Advisory Panel
consensus.
Water Quality Objectives 2050 for End-of-Catchment
loadreductionshavebeendefinedbasedonthebest
estimates of Current Condition 2015 End-of Catchment
anthropogenic loads and the load reductions that could
be achieved if all recommended management actions
were widely adopted for all catchment land uses and
disturbances.SeeTable8 forgeneral rules todefine
Water Quality Objectives.
Table 8:GeneralrulesappliedtodefinetheWaterQualityObjectives2050forEnd-of-Catchmentloadreductions
Water Quality Targets set for the year 2022 for End-
of-Catchment load reductions have been defined
based on the Reef 2050 Plan targets of 20% reduction
in anthropogenic fine suspended sediment load and
50% reduction in anthropogenic dissolved inorganic
nitrogen loads within priority sub-catchments by the
year 2018. These water quality targets set for eastern
Cape York are considered to be achievable by 2022 if
the implementation strategy is resourced appropriately
to enable the priority management actions within each
section, basin, and sub-catchment to be implemented
in priority sub-catchments. However, the improvements
in water quality from investments in improved land
management have the potential to be negated by new
intensive land use developments.
Water Quality Targets set for the year 2022 for End-
of-Catchment load reductions have been presented
Current Condition 2015 for End-of-Catchment anthropogenic load as % of total load
GeneralrulestodefinetheWaterQualityObjectivestobeachievedby the year 2050 for End-of-Catchment load reductions
10% FSS (Fine Suspended Sediment) Maintain Current Condition and undertake priority management actions to offset and minimise the impact of both existing and new development within the sub-catchment
30% FSS (Fine Suspended Sediment) Undertakeprioritymanagementactionstoreducetotalfinesuspendedsediment load by 20%.
50% FSS (Fine Suspended Sediment) Undertakeprioritymanagementactionstoreducetotalfinesuspendedsediment load by 30%.
50% DIN (Dissolved Inorganic Nitrogen) Undertake priority management actions to reduce dissolved inorganic nitrogen load by 25%

Eastern Cape York Water Quality Improvement Plan
51.
Eastern Cape York Water Quality Improvement Plan
52.
as percent reduction in total load. Due to the degree
of uncertainty in the anthropogenic load estimation,
it is more practical to develop monitoring protocols
to measure improvement in total load as a result of
adoption of recommended management actions.
Improvements in water-quality monitoring practices
in Cape York will allow for more accurate total load
estimates and monitoring of load reductions into the
future.
Management Action Targets set by the Scientific
Advisory Panel for the year 2022 for Priority Sub-
catchment load reductions presented as a percent
reduction in total load, have been developed based on
review of all available sub-catchment water quality data,
and consideration of catchment sediment deposition
processes and time lags associated with achieving
End-of-Catchment water quality.
For fine suspended sediment, to achieve an End-of-
Catchment load reduction target, a 2.5x sediment
reduction target would need to be achieved within the
priority sub-catchments for anthropogenic sediment
sources.
For dissolved inorganic nitrogen, as long as all high
priority sub-catchments for agricultural and urban
nitrogen sources are targeted for improvement, the sub-
catchment reduction target and the end-of-catchment
dissolved inorganic nitrogen reduction target are the
same.
For more information on water quality datasets and
the spatial pattern and intensity of catchment land use
and disturbance refer to the loads report (Appendix
8, Howley, 2016) the water quality guidelines report
(Appendix 9, Howley and Moss, 2016) and the
disturbance index report (Appendix 1, Spencer et al.,
2016).
Target summary
Basins within the northern Great Barrier Reef catchment
canbegenerallyclassifiedintothefollowingtwowater
quality goals:
1. Improvement to meet Reef 2050 Plan targets
- Improving water quality from current condition to
achieve a 15% to 25% reduction in fine suspended
sediment load in priority sediment sources at sub-
catchment scale by the year 2022.
2. Maintenance and prevention - Maintaining
current condition of water quality and preventing
new developments or increasing disturbance from
increasing sediment load in the sub-catchment.
For some of these less developed systems, further
characterisation of land disturbances and water quality
impacts are necessary to quantify current condition.
The drainage basins within the planning area have
been allocated the following water quality goals:
Jacky Jacky - Maintenance and prevention
Olive - Maintenance and prevention
Pascoe - Maintenance and prevention
Lockhart - Maintenance and prevention
Stewart - Improvement to meet targets
Hann - Improvement to meet targets
Normanby - Improvement to meet targets
Jeanie - Improvement to meet targets
Endeavour - Improvement to meet targets
Table 9: Current Condition (2015), Water Quality and Management Action Targets (2022)
FSS=finesuspendedsedimentDIN=DissolvedInorganicNitrateMCL=MaintainCurrentLoadHEV = High Ecological Value SD = Slightly Disturbed SMD = Slightly to Moderately Disturbed
Basin Sub-catchment
Aqu
atic
EV
Stat
us
Current Condition 2015
End-of-Catchment anthropogenic load as % of total load
Bold = load monitoring site
Water Quality Target 2022
End-of-Catchment load reduction target as % of total load
Management Action Target 2022
Priority Sub-Catchment load reduction target as % of total load
Jacky Jacky Jacky Jacky Creek HEV 10% FSS MCL MCLEscape River HEV 10% FSS MCL MCLHarmer Creek HEV 10% FSS MCL MCL
olive Glennie Creek HEV 10% FSS MCL MCLKangaroo River HEV 10% FSS MCL MCLOlive River HEV 10% FSS MCL MCL
Pascoe Garraway Creek HEV 10% FSS MCL MCLYam Creek HEV 10% FSS MCL MCLHann Creek HEV 10% FSS MCL MCLPascoe River HEV 10% FSS MCL MCL
Lockhart Wilson Creek HEV 10% FSS MCL MCLClaudie River HEV 30% FSS 6% FSS 15% FSSScrubby Creek HEV 10% FSS MCL MCLLockhart River HEV 10% FSS MCL MCLNesbit River HEV 10% FSS MCL MCLChester River HEV 10% FSS MCL MCL
Stewart Massey Creek SD 10% FSS MCL MCLBreakfast Creek SD 30% FSS 6% FSS 15% FSSStation Creek HEV 30% FSS 6% FSS 15% FSSStewart River SD 30% FSS 6% FSS 15% FSSBalclutha Creek HEV 30% FSS 6% FSS 15% FSSRunning Creek HEV 30% FSS 6% FSS 15% FSS
hann Annie River SD 30% FSS 6% FSS 15% FSSHann River HEV 30% FSS 6% FSS 15% FSSNorth Kennedy River HEV 30% FSS 6% FSS 15% FSS
normanby Bizant River HEV 30% FSS 6% FSS 15% FSSKennedy River HEV 30% FSS 6% FSS 15% FSSMosman River HEV 30% FSS 6% FSS 15% FSSDeighton River HEV 30% FSS 6% FSS 15% FSSLaura River SMD 50% FSS, 50% DIn 10% FSS, 25% DIN
50SSS55050%25% FSS, 25% DIN 50SSS55050%
normanby River SMD 50% FSS 10% FSS 25% FSSJeannie Muck River HEV 10% FSS MCL MCL
Howick River HEV 10% FSS MCL MCLJeannie River HEV 30% FSS 6% FSS 15% FSSStarke River SD 30% FSS 6% FSS 15% FSSMcIvor River SD 30% FSS 10% FSS 15% FSS
Endeavour Isabella Creek SD 30% FSS 6% FSS 15% FSSEndeavour North Branch SD 50% FSS 10% FSS 25% FSSEndeavour South Branch HEV 30% FSS 6% FSS 15% FSSEndeavour Right Arm HEV 30% FSS 6% FSS 15% FSSEndeavour River SMD 50% FSS 10% FSS 25% FSSOakey Creek SMD 50% FSS 10% FSS 25% FSSTrevethan Creek HEV 30% FSS 6% FSS 25% FSSAnnan River SD 50% FSS 10% FSS 25% FSS

Eastern Cape York Water Quality Improvement Plan
53.
Eastern Cape York Water Quality Improvement Plan
54.
Table 10: Priority Management Action Targets (2022) by sub-catchment
FSS = Fine suspended sediment DIN = Dissolved Inorganic Nitrate MCL = Maintain Current LoadHEV = High Ecological Value SD = Slightly Disturbed SMD = Slightly to Moderately DisturbedScale of Management Action to achieve Management Action Targets = H = High, M = Moderate, L = Low
Localising Reef 2050 Plan and Reef Plan 2013 targets
to the Normanby Sub Basin
Reef Plan 2013 Water Quality Targets The Reef Plan 2013 set targets designed to achieve the
overarching goal of ensuring that by 2020 the quality
of water entering the lagoon from broadscale land use
has no detrimental impact on the health and resilience
on the GBR. The Reef Plan 2013 targets to be achieved
by 2018 include:
• At least a 50 per cent reduction in anthropogenic
end-of-catchment dissolved inorganic nitrogen
loads in priority areas.
• At least a 20 per cent reduction in anthropogenic end-of-catchment loads of sediment and particulate nutrients in priority areas.
• At least a 60 per cent reduction in end-of-
catchment pesticide loads in priority areas. The
pesticides referred to are the PSII herbicides
considered are hexazinone, ametryn, atrazine,
diuron and tebuthiuron.
In addition to water quality targets the Reef Plan also
includes land and catchment management targets
which address improved agricultural practices as
well as the protection of natural wetlands. These
land based targets recognise the important role of
land management practices in reducing the end-
of-catchment pollutant load reduction targets and
are based on the conceptual understanding of the
link between management practice standards and
water quality outcomes. The land and catchment
management targets to be achieved by 2018 are:
• 90% of sugarcane, horticulture, cropping
and grazing lands are managed using best
management practice systems (soil, nutrient and
pesticides) in priority areas.
• Minimum 70% late dry season groundcover on
grazing lands.
• The extent of riparian vegetation is increased.
• There is no net loss of the extent, and an
improvement in the ecological processes and
environmental values, of natural wetlands.
Reef 2050 Plan TargetsThe Reef 2050 Long Term Sustainability Plan (Reef
2050 Plan; Commonwealth of Australia 2015) is a
joint initiative between the Australian and Queensland
Governments and provides an overarching strategy
for management of the GBR, and contains objectives,
targets and actions across several themes including:
biodiversity, ecosystem health, heritage, water quality,
community benefits and governance. TheReef 2050
Plan builds on the Reef Plan 2013 targets.
• At least a 50 per cent reduction in anthropogenic
end-of-catchment dissolved inorganic nitrogen
loads in priority areas, on the way to achieving up
to an 80 per cent reduction in dissolved inorganic
nitrogen in priority areas by 2025;
• At least a 20 per cent reduction in anthropogenic end-of-catchment loads of sediment in priority areas, on the way to achieving up to a 50 per cent reduction in priority areas by 2025;
• At least a 20 per cent reduction in anthropogenic
end-of-catchment loads of particulate nutrients in
priority areas; and
• At least a 60 per cent reduction in end-of-
catchment pesticide loads in priority areas.
Example of localising Reef Plan 2013 and Reef 2050 Plan targets to the normanby Sub Basin
Short-term (year 2022), medium-term (year 2030)
and long-term (year 2037) fine suspended sediment
reduction targets have been developed for Normanby
Sub Basin and the Hann Sub Basin. The Normanby
Sub Basin targets are presented below as an example
of how the localised targets represent both Reef Plan
and Reef 2050 Plan targets.
Basin Sub-catchment
Aqu
atic
EV
Stat
us
Management Action Target
2022
Priority Sub-Catchment load reduction target as % of total load
Gra
zing
Agr
icul
ture
Urb
an, R
ural
, Res
iden
tial
nat
ure
Cul
ture
Con
serv
atio
n
Min
ing
Fore
stry
Port
s an
d Sh
ippi
ng
Wet
land
s
Gul
lies
Roa
ds, T
rack
s, F
ence
line
s
Fire
Fera
l ani
mal
s
Wee
ds
Jacky Jacky Jacky Jacky Creek HEV MCL L H H L H L M MEscape River HEV MCL L H L L M L M LHarmer Creek HEV MCL L H L L M M M L
olive Glennie Creek HEV MCL L H L L L L M LKangaroo River HEV MCL L H L L L L M LOlive River HEV MCL L H L L L H M L
Pascoe Garraway Creek HEV MCL L H L L L H M MYam Creek HEV MCL L H L L L H M LHann Creek HEV MCL L H L L L H M LPascoe River HEV MCL L H L L L M M L
Lockhart Wilson Creek HEV MCL L H H L M L M HClaudie River HEV 15% FSS M L H H L H L H M M HScrubby Creek HEV MCL L H H L M L M LLockhart River HEV MCL L H L L L L M LNesbit River HEV MCL L H L L L L M LChester River HEV MCL L H L L L L M L
Stewart Massey Creek SD MCL M H M L L M H HBreakfast Creek SD 15% FSS H H H L M H H HStation Creek HEV 15% FSS H H L H L M H H HStewart River SD 15% FSS H L H H H M H H HBalclutha Creek HEV 15% FSS M H M M M H H HRunning Creek HEV 15% FSS M H M L M H H H
hann Annie River SD 15% FSS M H H H M H H HHann River HEV 15% FSS H H H H M H H HNorth Kennedy River HEV 15% FSS H H H H M H H H
normanby Bizant River HEV 15% FSS H H H L L H H LKennedy River HEV 15% FSS H M H H H M H H HMosman River HEV 15% FSS H H H H M M M HDeighton River HEV 15% FSS H H H H M H M MLaura River SMD 25% FSS 25%
DIN DDIDIN 50SSS55050%
H H M H M H H M M H
normanby River SMD 25% FSS H H M L M H H H M HJeannie Muck River HEV MCL L H M L L H H L
Howick River HEV MCL L H L L L H H LJeannie River HEV 15% FSS L H M M M H H LStarke River SD 15% FSS L L H M M M M M H H MMcIvor River SD 15% FSS M H L H M M M M M H M
Endeavour Isabella Creek SD 15% FSS M L H M L L M M MEndeavour North Branch
SD 15% FSS M H H d H L L L M M M M
Endeavour South Branch
HEV 15% FSS L L H L L L H M L
Endeavour Right Arm HEV 25% FSS M H H L H L H H M MEndeavour River SMD 25% FSS M H H H M M L H M M MOakey Creek SMD 25% FSS M H H L M H H M MTrevethan Creek HEV 25% FSS L H H L L M M L MAnnan River SD 25% FSS L M od H H M M L M H L M

Eastern Cape York Water Quality Improvement Plan
55.
Eastern Cape York Water Quality Improvement Plan
56.
In localising the Reef 2050 Plan targets to the
NormanbySubBasin,theonlymajormodificationhas
been to extend the timeline for target achievement.
This has been done to reflect the practical capacity
building required to achieve cost-effective adoption
of management actions to measurably reduce fine
suspended sediment loads.
The relationship between management action target
timelines and monitoring timelines has also been
considered. A seven-year time delay for End-of-
Catchment monitoring (EoC) and a three-year delay
for Sub-Catchment monitoring (SuC) is considered
practical. In doing this the practical management action
timeline is separated from the practical monitoring
timeline. The Sub-Catchment monitoring (SuC) sites
will need to be installed close to the priority sediment
sources that are being managed to detect change in
sediment load from management within three years.
The End-of-Catchment monitoring (EoC) sites will
need to be monitored continuously from 2016 using a
Super Gauge approach for the monitoring timelines to
be met.
The specific fine sediment fraction that applies to
End-of-Catchment (EoC) and Sub-Catchment (SuC)
targets has also been considered. For End-of-
Catchmenttargetsthefinesedimentfractionhasbeen
defined as <15.7um which represents the clay and
finesiltfractionsthataretypicallytransportedbyflood
plumes greater distances into the marine environment.
ForSub-Catchmenttargetsthefinesedimentfraction
hasbeendefinedas<63umwhichrepresentstheclay
and total silt fractions that potentially impact on both
freshwater and marine ecosystems.
normanby Sub Basin End-of-Catchment reduction targets: fine suspended sediment (<15.7um) loadreduction presented as a percentage of total load.
Short-term (7.5 years, by 2022): 10% total fine
suspended sediment (<15.7um) load reduction,
with a monitoring time lag of seven years, this will
begintobeconfirmedbyEoCMonitoringin2030.
This target is equivalent to 20% anthropogenic load
reduction and consistent with the Reef 2050 Plan
reduction target for 20% reduction in anthropogenic
end-of-catchment loads of sediment in priority
areas by 2018 but with the timeline extended to
2022.
Mid-term (15 years by 2030): 20% total fine
suspended sediment (<15.7um) load reduction,
with a monitoring time lag of seven years, this will
begintobeconfirmedbyEoCMonitoringin2037.
This target is equivalent to 40% anthropogenic
load reduction and consistent with the Reef 2050
Plan reduction target for up to 50% reduction in
anthropogenic end-of-catchment loads of sediment
in priority areas by 2025 but with the timeline
extended to 2030.
Long-term (22.5 yearsby2037): 30% total fine
suspended sediment (<15.7um) load reduction,
with a monitoring time lag of seven years, this will
begintobeconfirmedbyEoCMonitoringin2044.
This target is equivalent to 60% anthropogenic load
reduction and consistent with the Reef Plan 2013
goal that ‘the quality of water entering the lagoon
from broadscale land use has no detrimental
impact on the health and resilience on the GBR’
but with the timeline extended from 2020 to 2037.
normanby Sub Basin Priority Sub-catchment reduction targets: fine suspended sediment
(<63um) load reduction presented as a percentage of
total load. This reduction target is applied to the most
disturbed sub-catchments within the Normanby sub-
basin that will be the focus for management action,
such as the East and West Normanby Rivers and the
upper Laura River.
Short-term (7.5 years, by 2022): 25% total fine
suspended sediment (<63um) load reduction in
priority sub-catchments, with a monitoring time lag
of three years, this will begin to be confirmed by
SuC Monitoring in 2025.
This target is equivalent to 20% anthropogenic
end-of-catchment load reduction and consistent
with the Reef 2050 Plan reduction target for 20%
reduction in anthropogenic end-of-catchment
loads of sediment in priority areas by 2018 but
with the implementation timeline extended from
2018 to 2022.
Mid-term (15 years by 2030): 50% total fine
suspended sediment (<63um) load reduction in
priority sub-catchments, with a monitoring time lag
of three years, this will begin to be confirmed by
SuC Monitoring in 2033.
This target is equivalent to 40% anthropogenic end-
of-catchment load reduction and consistent with
the Reef 2050 Plan reduction target for up to 50%
reduction in anthropogenic end-of-catchment loads
of sediment in priority areas by 2025 but with the
timeline extended to 2030.
Long-term (22.5 years by 2037): 75% total fine
suspended sediment (<63um) load reduction in
priority sub-catchments, with a monitoring time lag
of three years, this will begin to be confirmed by
SuC Monitoring in 2040.
This target is equivalent to 60% anthropogenic end-
of-catchment load reduction and consistent with
the Reef Plan 2013 goal that ‘the quality of water
entering the lagoon from broadscale land use has
no detrimental impact on the health and resilience
on the GBR’ but with the timeline extended from
2020 to 2037.
The End-of-Catchment and Priority Sub-catchment water quality targets and management action targets
have been developed to localise the following Reef 2050 Plan water quality targets:
WQT1 – By 2018• At least a 50% reduction in anthropogenic end-of-catchment dissolved inorganic nitrogen loads in
priority areas on the way to achieving up to an 80% reduction in nitrogen by 2025
• At least a 20% reduction in anthropogenic end-of-catchment loads of sediment in priority areas, on the
way to achieving up to a 50% reduction by 2025
• At least a 20% reduction in anthropogenic end-of-catchment loads of particulate nutrients in priority
areas
WQT2 – By 2018:• 90% of sugarcane, horticulture cropping and grazing lands are managed using best management
practice systems (soil, nutrient and pesticides) in priority areas
• Minimum 70% late dry season groundcover on grazing lands
• The extent of riparian vegetation is increased
• There is no net loss of the extent and an improvement in the ecological processes and environmental
values, of natural wetlands

Eastern Cape York Water Quality Improvement Plan
57.
Eastern Cape York Water Quality Improvement Plan
58.
Super Gauge technology to accurately measure
pollutant loads delivered to the Great Barrier Reef
Dr. Jeffrey Shellberg, Christina Howley
and Jason Carroll
• ASupergaugecombinesinternationalfield
standardsforfluvialrivermonitoringand
continuous water quality surrogate technology,
which are used together to measure pollutant
concentrations, water discharge, and loads
instantaneously through time.
• River gauging at end-of-river sites draining to the
Great Barrier Reef (GBR) can be dramatically
improved using the super gauge approach, which
represents an innovative practice to accurately
measure GBR pollutant load reductions through
2050 and beyond.
• Super gauge technology greatly reduces
measurement and stochastic uncertainty
associated with load calculations by using
accuratefieldandlaboratoryprotocolsand
measuring water quality surrogates at frequent
intervals (10 minutes), such as turbidity or nitrate
analysers.
• Continuous surrogate data are correlated to
periodicfieldsamplesofsuspendedsediment
concentration (SSC), nutrients or other pollutants
at a point in a cross-section, in order to predict
continuous pollutant concentrations over time.
• Correlation of pollutant concentrations to
continuoussurrogatedatasignificantlyreduces
the error introduced by using water discharge (or
stage) as a pollution correlate, whose relationships
are hindered by hysteresis issues on the rising and
fallinglimbsoffloodevents.
• Point samples of sediment and nutrient
concentrations can be collected using the
assistance of refrigerated pump samplers
triggeredbyturbiditythresholdsduringflood.
• Field samples of cross-section average sediment
and nutrient concentrations need to be collected
using isokinetic width and depth sampling
equipment following international standards.
• Measurements of isokinetic cross-section
average concentrations can be compared to point
concentrations to correct these data to average
cross-sectionconditions(boxcoefficient).
• Water discharge in bidirectional tidal estuaries can
be accurately measured using acoustic doppler
velocity meters (ADVMs) to measure ‘velocity
index’ areas that can be correlated to standard
water discharge measurements needed for load
calculations.
• Analysis of high-accuracy event-scale load data
and shifts in continuous ‘time and discharge
weighted’ event mean concentrations (EMC) and
loads for individual types of storm events can be
used to assess changes in loads over both the
short-term (5-10 years) and long-term (50-100
years).
• Annual running costs of a super gauge are
estimatedat$47,000/yearforbothfieldand
laboratory analysis. 10 super gauges on Cape
York and 26 total across the GBR are proposed.
Shellberg, J., Howley, C., Carroll, J., 2016. The Need for a ‘Super Gauge’ Approach Using Surrogate Technologies
and Improved Field and Laboratory Techniques to Accurately Monitor Suspended Sediment and Nutrient Loads
Delivered to the Great Barrier Reef: A Case Study from the Annan River Catchment on the Cape York Peninsula.
Report by South Cape York Catchments with support from the CSIRO, the Queensland Government, and the
Australian Government’s Cape York Water Quality Improvement Plan program. 86pp.

Eastern Cape York Water Quality Improvement Plan
59.
Eastern Cape York Water Quality Improvement Plan
60.
• Pascoe Basin: Nature and cultural conservation
(84%) and grazing (16%) are the dominant land
uses.
• Lockhart Basin: Nature and cultural conservation
(92%) is the dominant land use. Grazing
represents 3%, Urban and other intensive land
uses represent less than 1% (174 ha) and water
represents 5% of the basin area.
• Stewart Basin: Nature and cultural conservation
(92%) is the dominant land use. Grazing
represents 2% and water represents 4% of the
basin area.
• hann Basin: Grazing (56%) and nature and
cultural conservation (43%) are the dominant
land uses. Urban and other intensive land uses
represent less than 1% (192 ha) of the basin area.
• normanby Basin: Grazing (52%) and nature and
cultural conservation (46%) are the dominant land
uses. Cropping (5,718 ha), horticulture (461 ha)
and urban and other intensive land uses (672 ha)
represent less than 1% of the basin area.
• Jeannie Basin: Nature and cultural conservation
(81%) and grazing (11%) are the dominant land
uses. Forestry (2,050 ha), horticulture (44 ha),
cropping (52 ha), and urban and other intensive
land uses (495 ha) represent less than 1% and
water represents 7% of the basin area.
• Endeavour Basin: Nature and cultural
conservation (52%) and grazing (44%) are the
dominant land uses. Urban and other intensive
land uses (3326 ha) represent 2% and forestry
represents 1 %. While horticulture (173 ha) and
cropping (267 ha) represent less than 1% and
water represents 1% of the basin area.
Grazing and nature and cultural conservation
National Parks, nature refuges and Traditional Owner
land tenures represent a relatively high proportion
of the region (60%), with nature and cultural
conservation being the predominate use of this land.
Inthelast20yearstherehasbeenasignificantshift
in land tenure from Pastoral Lease to National Park,
nature refuge and Traditional Owner land tenure that
has implications for productive grazing management
on Traditional Owner land. Issues such as low herd
quality and rundown infrastructure will need to be
overcome by the Traditional Owners who have
aspirations for a cattle business on their land. Grazing
land use now represents only 34% of eastern Cape
York but remains an important part of the history,
lifestyle and economy of this region. While the current
area of grazing land use on pastoral lease is relatively
low, feral cattle and horses remain at grazing land
use densities within a large proportion of the area
designated as nature and cultural conservation land
use (see feral animal section below). Trampling by
feral cattle and horses have degraded wetlands,
permanent springs and riparian vegetation in all
sections and across land uses. Grazing has also been
identifiedasa trigger foracceleratederosionanda
major source of sediments to rivers in the Normanby
Basin and other catchments.
Agriculture
Agriculture occurs over a small (<1%) but expanding
area in the Normanby, Jeannie (McIvor River) and
Endeavour Basins. Bananas and irrigated and dryland
cropping in Lakeland are the current major intensive
agricultural land uses. Fertiliser and soil run-off is a
source of sediment and nutrient pollution in the Laura
River (Normanby Basin) and likely in the other basins
to a lesser extent. There is a high level of concern
amongst the downstream community of Laura about
the impact of agriculture on their social and cultural
uses of the Laura river. Recent and proposed
land clearing, increased dam building and water
extraction, and additional fertiliser and pesticide use
associated with agricultural developments will place
new pressures on the Laura, Normanby and McIvor
Rivers. Innovative management will be required to
address these challenges to maintain or improve
water quality.
Catchment land use, disturbances and pollution sources
Thewaterqualitywithinacatchmentisinfluencedbythe
scale and intensity of land uses and other disturbances
within the catchment. Within the Eastern Cape York
Water Quality Improvement Plan process a catchment
land use and disturbance analysis has been used to
inform decision making in the following areas:
• Providing evidence for the conceptual
understanding of human disturbance on fresh water
quality,floodwaterquality,estuaryandmarine
water quality
• Exploring the cumulative impact that human
disturbances have on water quality within a
catchment
• Exploring the different level of human disturbance
and likely impact on water quality in different
catchments
• Providing information to support interpretation of
ambient and event monitoring results
• Providing information to support the design of
future monitoring and modelling programs
To support the development of management actions
and implementation strategies, catchment land use
mapping undertaken by Queensland Government
(QLUMP2013)hasbeengroupedintothefollowingfive
broad classes:
• Grazing
• Agriculture (horticulture and cropping)
• Urban, Rural Residential areas and roads
• Nature and Cultural Conservation
• Wetlands
Wetlandshavebeenclassifiedasalandusebecauseof
the relatively large spatial extent of wetlands within the
planning region. Wetlands in a healthy condition play
an important role in water quality within catchments by
maintaining natural hydrological processes, sediment
trapping and nutrient processing. Wetlands in poor
condition can have reduced hydrological function and
can become an active sediment and nutrient source.
The following disturbances have also been analysed
in developing the recommended management actions
and implementation strategies:
• Gullies
• Roads,tracks,fencelinesandfirebreaks
• Fire
• Feral animals
• Weeds
These disturbances are present across the whole
region, are found in all five land use classes and if
poorly managed or ignored have negative impacts on
water quality and ecosystem health.
For more information on each land use and disturbance
refer to The Normanby Water Quality Management
Plan (Howley et al., 2014), the disturbance index report
(Appendix 1, Spencer et al., 2016), the gully prioritization
report (Appendix 2, Brooks et al., 2016) and the fire
report (Appendix 13, Standley, 2016).
Catchment land use
Land use characteristics of the Eastern Cape York
region are shown in Table 11. This information is derived
from QLUMP 2013 data. This land use data has been
combined to present the major land uses classes
(grazing, nature and cultural conservation, agriculture,
etc.) in Figure 19, and small-scale land uses (mining,
native forestry, aquaculture etc.) in Figure 20.
Land use within each basin can be summarised as
follows:
• Jacky Jacky Basin: Nature and cultural
conservation (82%) and grazing (9%) are the
dominant land uses. Urban and other intensive
land uses represent less than 1% (65 ha) and water
represents 9% of the basin area.
• olive Basin: Nature and cultural conservation (73%)
and grazing (26%) are the dominant land uses.

Eastern Cape York Water Quality Improvement Plan
61.
Eastern Cape York Water Quality Improvement Plan
62.
Urban
Urban (including rural residential) and other intensive
land uses represent less than 1% of the total
planningarea,buthavesignificantlocalwaterquality
implications in these locations:
• Lockhart township in the Claudie River catchment
(Lockhart Basin)
• Laura and Lakeland townships within the Laura
River catchment (Normanby Basin)
• Cooktown, Hope Vale townships and several
peri urban precincts within the Endeavour River
catchment (Endeavour Basin)
• Rossville township and several peri urban precincts
within the Annan River catchment (Endeavor Basin)
These urban and rural residential centres are all
located adjacent to major river systems, and with the
exceptions of Laura and Lakeland are also in close
proximity to the coast and GBR. Storm-water run-
off, sewerage treatment plants and septic systems,
rubbish and hazardous waste (oils, paints, biomedical
supplies, etc.) disposal, weed spread, and sediment
erosion from building developments and roads can all
impact on water quality in adjacent rivers. Of these,
sediment run-off from building sites with inadequate
erosion control measures and poorly designed roads
are the twomostevident and significant sourcesof
pollution to the GBR from urban or rural residential
areas.
Mining
Mining land use represents less than 0.001% of
the total planning area, but can have significant
local water quality implications due to erosion from
disturbed areas and access roads, and pollutants
from mine tailings. The main mines in the planning
area are:
• Cape Flattery silica mine and port within the Jeanie
Basin
• Collingwood tin mine in the Annan River catchment
• Small alluvial mining leases in the Normanby River
catchment
Historic mining covered a much larger area and
drastically altered waterways and water quality. For
example, hydraulic tin mining in the upper Annan
river catchment in the late 1800s had a devastating
impact on the rivers. Large areas of forest were
cleared, creeks were re-routed in dams and sluices,
and “the water was made muddy for much of the time”
(Anderson, 1983). Recent tin mining in the upper
Annan catchment also increased sediment and metal
concentrations in the Annan River while it was in
operation (Howley, 2012) and a tailings dam remains a
potential source of metals. Small scale alluvial mining
leases still exist in the upper Normanby. These mines
are a substantial local sediment source due to the
fragile dispersive soils and the direct connectivity of
the mine locations with the stream network. Further
development of alluvial mining on fragile dispersible
soils within eastern Cape York should be actively
discouraged because the resulting sediment loss
will counteract current and future efforts to reduce
sediment loss from gully erosion, grazing and roads
in these landscapes.
Native forestry
Forestry land use represents about 0.001% of the
total planning area (1% in the Endeavour Basin)
but has significant local water quality implications
due to erosion from the disturbed area and access
roads. Historic forestry activities on pastoral leases
with fragile dispersible soils in the Normanby River
have contributed to the large areas of gully erosion
on these properties. Further development of forestry
on fragile dispersible soils within eastern Cape York
should be actively discouraged because the resulting
sediment loss will counteract current and future
efforts to reduce sediment loss from gully erosion,
grazing and roads in these landscapes.
Ports and shipping
Ports and shipping represent less than 0.001% of
the total planning area, but have significant local
water quality implications due to dredging and spoil
dumping, waste management and disposal (sewage,
anti-fouling and other chemicals, fuel and oil spillage)
and sediment resuspension from shipping wakes.
The main ports in the planning area are:
• Community port with barge facility at Quintell
Beach, Lockhart River Community
• Port at Cape Flattery silica mine
• Harbour and port at Endeavour River mouth,
Cooktown
The shipping channel within the northern GBR is
a major route for commercial ships going to bulk
ports on the Queensland coast. These ships stir up
sediment in shallow areas, muddying the water over
large areas. Sediment plumes up to 20 km long have
been observed in the wake of ships in the section
between Cape Melville and Cape Tribulation. There
is anecdotal evidence that this has had a detrimental
impact on reefs that are close to the shipping
channel, but there have been no formal studies of this
impact. Ship numbers along the whole of the GBR are
estimated to greatly increase over the next 10 years.
Disturbances
Eastern Cape York has large areas of fragile sodic
or dispersive soils. Development for grazing, roads,
alluvial mining, forestry and agriculture on these
soils has resulted in the formation of severely eroded
landscapes (“gullies” or “breakaways”) that represent
the largest human source of sediment being delivered
to the northern GBR lagoon.
Gully erosion is present across the whole planning
region and can be found in all land uses, but is most
prevalent in the Normanby Basin, where scientists
from Griffith University have conducted detailed
mapping of gullies and research on how to reduce
gully erosion (Shellberg et al. 2013, Appendix 2,
Brooks et al., 2016). Once gullies have been initiated
by soil disturbances, it is extremely difficult to slow
or stop the erosion process. These sensitive, erosion
prone soils are therefore considered to be unsuitable
for any land use other than nature and culture
conservation.
Roads
Roads, tracks, borrow pits and fence lines also occur
across all land uses and catchments and represent
the largest area of intensive human disturbance
across eastern Cape York (Appendix 1, Spencer et
al., 2016). Erosion from roads, tracks, fence lines
and firebreaks has been identified as a significant
sediment source within the Central and Southern
sections of eastern Cape York, and may also be one
of the largest sediment sources within much of the
Northern section of the region due to the low level of
other disturbances.
Despite being a major source of sediment draining
to the Great Barrier Reef, roads and other linear
disturbances have been largely ignored in the past
as a priority for programs aimed at reducing sediment
runoff. Federal- and State-funded road development
programs that create sediment and nutrient pollution
areinconflictwithfundedwaterqualityimprovement
programs aimed at reducing this pollution and
improving reef health.
Fire
Thetimingandfrequencyoffireacrossthelandscape
can have a major impact on water quality. Fires at the
end of the dry season reduce ground cover leading
into the wet season, which increases erosion and
sediment and nutrient levels in rivers. Inappropriate
fireregimesoccuracrossalllandusesandmostofthe
planning region (with the exception of wet rainforest

Eastern Cape York Water Quality Improvement Plan
63.
Eastern Cape York Water Quality Improvement Plan
64.
areas). This has been identified as a contributing
factor to sediment erosion within all sections of
eastern Cape York. The spatial extent of late season
wildfire within the planning region over the last 15
years has been analysed by Cape York NRM based
on a Northern Australian Fire Information (NAFI)
MODIS imagery analysis. This information has been
usedtodeterminepriorityareasforfiremanagement.
Feral animals
Feral cattle, horses and pigs are present across
the whole planning region and can be found in all
land uses. Overgrazing and trampling by feral cattle
and horses, and vegetation destruction by feral
pigs, results in low ground cover and exposed soil
(particularly around wetlands, permanent springs
and riparian areas). This has been identified as a
contributing factor to sediment erosion in addition
to the destruction of aquatic habitat. Improving feral
animal management improves overall ecosystem
health (particularly wetland functionality) and
reduces sediment and associated nutrient loss to
downstream freshwater and marine ecosystems.
Weeds
Sicklepod, hymenachne, rubber vine, pond apple,
gamba grass and salvinia are six invasive weeds of
wetlands and waterways that are present in eastern
Cape York and have the potential to impact widely
on the ecological health of waterways, wetlands and
floodplains. Sicklepod and rubbervine have already
taken over large areas of riparian vegetation in the
southern and central regions of Cape York, reducing
the ability of native trees and grasses to grow and
maintain healthy river banks. Hymenachne and
salvinia are aquatic weeds that can take over wetlands
and rivers, reducing water flow, destroying habitat
and changing water quality. Hymenachne has been
detected in the southern and central zones. Pond
apple is present in all sections of the region where it
can dominate estuary riparian vegetation and change
the ecological function of these habitats.
Improving weed management improves overall
ecosystemhealth(particularlywetlandandfloodplain
functionality) and can help to reduce sediment and
associated nutrient loss to downstream freshwater and
marine ecosystems.
Figure 19: Land use map of the eastern Cape York region, QLUMP 2013
(Source: Appendix 10, Waterhouse et al., 2016)

Eastern Cape York Water Quality Improvement Plan
65.
Eastern Cape York Water Quality Improvement Plan
66.
Figure 20: Location of land use categories (QLUMP 2013) covering relatively small areas. Shown here
to complement Figure 19 where the small areas are not visible (Source: Appendix 1, Spencer et al., 2016)
Table 11. Estimated land use by area (ha) in the Cape York region (based on QLUMP 2013 data used in Source
Catchments modelling)
Basin or Catchment Grazing
Dryland & Irrigated Cropping
Forestry Horticulture UrbanNature and
Culture Conservation
Water Other Total
Jacky Jacky Basin 26,065 9 243,725 29,180 56 299,036
olive Sub Basin 54,511 152,755 1,142 208,408
Pascoe Sub Basin 32,463 176,035 327 12 208,837
Lockhart Basin 7,434 60 262,996 16,659 114 287,263
Stewart Basin 6.469 3 260,500 10,011 276,983
hann Sub Basin 547,100 22 422,671 5644 170 975,607
normanby Sub Basin 762,713 5,718 186 461 144 675,849 16,848 528 1,462,447
Jeannie Basin 39,013 52 2,050 44 15 296,575 25,492 480 363,721
Endeavour Basin 95,579 267 2,529 173 2,617 113,814 2,927 709 218,616
Total 1,469,572 6,037 4,768 678 2,867 2,604,920 108,230 2,069 4,300,918

Eastern Cape York Water Quality Improvement Plan
67.
Eastern Cape York Water Quality Improvement Plan
68.
Management actions to improve water quality
Management actions to improve water quality have
been grouped based on the following land use classes:
• Grazing
• Agriculture (horticulture, cropping and plantation
forestry)
• Native Forestry
• Urban, Rural Residential areas and roads
• Mining
• Ports and Shipping
• Nature and Cultural Conservation
• Wetlands
Table 12 presents a summary of the priority focus for
management actions within the Northern, Central and
Southern sections of the region.
Following the recommended management actions for
each landusetherearespecificmanagementactions
to address the following disturbances that are present
across the whole region:
• Gullies
• Roads,tracks,fencelinesandfirebreaks
• Fire
• Feral animals
• Weeds
Table 12: Priority focus for management actions within the Northern, Central and Southern sections of the region
Different land uses and disturbances have different
impacts on water quality. Table 13 presents a summary
of the water quality parameters that will be improved if the
recommended management actions are implemented.
Table 13: Water quality parameters that will be improved if the recommended management actions are implemented
Section northern Central Southern
Key Feature Most undisturbed section of whole Great Barrier Reef
Eastern Cape York’s agriculture and grazing hub
Eastern Cape York’s residential, tourism and social services centre
Management
Action
Priority
Focus
• Nature and cultural conservation and monitoring
• Wetland management• Grazing management• Ports and Shipping
Management
• Grazing management• Agriculture management• Nature and cultural
conservation• Wetland Management• Native Forestry Management• Mining Management
• Urban, rural residential and road management
• Agriculture management • Grazing management• Nature and cultural
conservation• Wetland Management• Native Forestry Management• Mining Management• Ports and Shipping
Management
Sediment & particulate nutrients
Dissolved nutrients
Residual herbicides
Urban & Industrial pollutants
Ecosystem health
Grazing yes yes
Agriculture yes yes yes yes
Urban Rural Residential and Roads yes yes yes yes yes
Mining yes yes yes yes
Ports and shipping yes yes yes yes
native forestry yes yes
nature and cultural conservation yes yes
Wetlands yes yes yes yes yes
Gullies yes yes
Roads,tracks,fencelinesandfirebreaks yes yes
Fire yes yes yes
Feral animals yes yes
Weeds yes yes

Eastern Cape York Water Quality Improvement Plan
69.
Eastern Cape York Water Quality Improvement Plan
70.
Grazing
Improving grazing management improves herd and
pasturequalityandtheabilitytofinishcattletomarket
specifications as well as reducing sediment and
associated nutrients.
Maintain Healthy Pastures by:
• Monitoring pastures and stocking rates to promote
perennial grass cover and prevent over grazing
• Restoring pastures to a more productive state by
wet season spelling
Repair eroding gullies by:
• Excluding cattle, sowing grass seeds and
managingfire
• Destocking cattle from large areas of highly
erodible soils along rivers
• Engineering structures to stabilise highly active
gully head cuts
Managefiretoimprovegroundcoverby:
• Developingandimplementingafireplan
• Followinganappropriatefireregimeforeachland
type e.g. early, mosaic and storm burning and
rotational burning
• Working with neighbours to coordinate burning
activities
Reduceerosionalongroads,fencelinesandfirebreaks
by:
• Minimising construction of new roads, fence lines
andfirebreaks
• Maintainingroads,fencelinesandfirebreakstoa
high standard
• Relocating roads and fence lines on sensitive soils
to more stable land types
• Diverting water by using erosion control structures
eg. ‘Woah Boys’ and spoon drains
Improve Wetland health by;
• Controlling feral animals and weeds
• Controlling stock access e.g. low stocking rates,
periodic grazing or complete exclusion
Controlling Weeds by:
• Holding new cattle and ensuring feed is clean
• Using vehicle wash down facilities to reduce spread
and introduction of new weeds
• Controlling weeds that impact on waterways such
as hymenachne and sicklepod
Resources required to improve grazing management:• GrazingTechnicalExtensionOfficerstoworkone
on one with grazing landholders and deliver a
voluntary incentive program to encourage adoption
of grazing best management practices (including
incentives to destock cattle from highly erosive
landsandimprovewithinpropertyroad,firebreak
and fence line erosion control)
• Field days, workshops and communication
materials
• Soil mapping and soil tests for grazing
management plans
• Road erosion expert technical support
TheGrazingTechnicalExtensionofficerswillconnect
the participating graziers to other resources that
are recommended for pest, fire, wetland and gully
management.
For more information on prioritisation of grazing
management refer to the grazing implementation
strategy (Appendix 15), the disturbance index report
(Appendix 1, Spencer et al., 2016), the gully prioritisation
report (Appendix 2, Brooks et al. 2016) and the Cape
Yorkfirereport(Appendix13,Standley,2016).
The grazing management actions are designed to localise the following Reef 2050 plan actions to meet Reef
2050 targets:
• CBA11 - Strengthen programs to understand and promote threats to the values of the Reef and what
people can do to address them
• CBT3 - Community participation in stewardship actions to improve Reef health and resilience continues
to grow
• WQA2 - Continue improvement in water quality from broadscale land use through implementation of
Reef Plan actions
• WQT1 - By 2018:
• At least a 20% reduction in anthropogenic end-of-catchment loads of sediment in priority areas, on the
way to achieving up to a 50% reduction by 2025
• At least a 20% reduction in anthropogenic end-of-catchment loads of particulate nutrients in priority
areas
• WQT2 - By 2018:
• 90% of sugarcane, horticulture cropping and grazing lands are managed using best management
practice systems (soil, nutrient and pesticides) in priority areas
• Minimum 70% late dry season groundcover on grazing lands
• The extent of riparian vegetation is increased
• There is no net loss of the extent and an improvement in the ecological processes and environmental
values, of natural wetlands
Breeding bulls a Silver Plains Station (Photo: Jessie Price)

Eastern Cape York Water Quality Improvement Plan
71.
Eastern Cape York Water Quality Improvement Plan
72.
Nature and cultural conservation
Improving nature and cultural conservation management
improves visitor experience and ecosystem health
and resilience and as well as reducing sediment and
associated nutrient loss.
Keep waterways pest free by:
• Controlling weeds and feral animals along
waterways
• Controlling weeds such as sicklepod,
hymenachne, rubbervine, pond apple and gamba
grass
• Looking out for and controlling new pest species
as they arrive
• Utilising vehicle wash down facilities
• Destocking unmanaged cattle
Managefiretoimprovegroundcoverby:
• Developingandimplementingafireplan
• Followinganappropriatefireregimeforeachland
type e.g. early, mosaic and storm burning and
rotational burning
• Working with neighbours to coordinate burning
activities
Reduceerosionalongroads,fencelinesandfirebreaksby:
• Minimising construction of new roads, fence lines
andfirebreaks
• Maintainingroads,fencelinesandfirebreakstoa
high standard
• Relocating roads and fence lines on sensitive soils
to more stable land types
• Diverting water by using erosion control structures
e.g. ‘Woah Boys’ and spoon drains
Repair eroding gullies by:
• Excluding cattle, sowing grass seeds and
managingfire
• Engineering structures to stabilise highly active
gully head cuts
Create aware visitors by:
• Installing interpretive signage and running
awareness campaigns
• Promoting weed wash down activities
• Regular patrol and maintenance of existing 4X4
tracks to discourage use of side tracks
• Maintaining walkways, campsites, toilets and
rubbish disposal
Cultural Management to improve ground cover by:
• Undertaking Traditional burning that promotes
ground cover
Resources required to improve nature and cultural conservation management:• GrazingTechnicalExtensionOfficerstowork
one on one with Traditional Owners and deliver
a voluntary incentive program to encourage
adoption of best management practices (including
incentives to destock cattle from highly erosive
lands, improve pest management and improve
withinpropertyroad,firebreakandfenceline
erosion control) on Traditional Owner lands
• Field day, workshops and communications
materials
• Soil mapping and soil tests for grazing
management plans
• Road erosion expert technical support
TheGrazingTechnicalExtensionOfficerswillconnect
the participating Traditional Owners to other resources
thatarerecommendedforpest,fire,wetlandandgully
management.
For more information on prioritisation of nature and
culture conservation management refer to the grazing
implementation strategy (Appendix 15), the disturbance
index report (Appendix 1, Spencer et al., 2016), the
gully prioritisation report (Appendix 2, Brooks et al.
2016) and the Cape York fire report (Appendix 13,
Standley, 2016).
• hA1 - Build capacity for the involvement of TOs and community members in
• coperative management, planning and impact assessment.
• hT1 - New and effective cooperative management practices are developed for protection and
conservation of GBR Indigenous and non-Indigenous heritage.
• CBA8 - Industry, community and governments work together to implement policies and programs that
address tourism and recreational use of the GBR Marine Park: … provide adequate and well-maintained
visitor infrastructure such as public moorings, interpretive signs, etc.
• CBA11 - Strengthen programs to understand and promote threats to the values of the Reef and what
people can do to address them.
• CBT3 - Community participation in stewardship actions to improve Reef health
• and resilience continues to grow.
• WQT1 - By 2018:
• At least a 20% reduction in anthropogenic end-of-catchment loads of sediment in priority areas, on the
way to achieving up to a 50% reduction by 2025
• At least a 20% reduction in anthropogenic end-of-catchment loads of particulate nutrients in priority
areas.
• WQT2 - By 2018:
• Minimum 70% late dry season groundcover on grazing lands
• The extent of riparian vegetation is increased
• There is no net loss of the extent and an improvement in the ecological processes, and environmental
values, of natural wetlands.

Eastern Cape York Water Quality Improvement Plan
73.
Eastern Cape York Water Quality Improvement Plan
74.
An Indigenous Ranger watches an early-season burn die in the late afternoon (Photo: Jessie Price)
Agriculture (horticulture, cropping and plantation
forestry)
Improving agriculture management improves the
efficiencyandprofitabilityofcropproductionaswellas
reducing sediment, nutrient and pesticide loss.
Improve soil health by:
• Minimising soil disturbance, maintaining ground
cover and crop residue to increase organic matter
and minimise soil loss
• Mapping soils to understand soil variability and
impacts on crop yield
• Avoiding agriculture on nutrient poor erodible soils
near especially near rivers
Reducing nutrients runoff by:
• Applying fertilisers at rates based on crop type,
growth stage, soil testing and yield mapping
• Timing fertiliser application with respect to
irrigation and rainfall to maximise uptake by the
crop and minimise nutrient loss
• Precise placement of fertilser, in a band onto the
bed using subsurface application or liquid products
(avoiding broadcast application)
Reducing pesticide runoff by:
• Applying pesticides at correct rates and based on
pest pressure mapping, crop phase and seasonal
conditions
• Timing pesticide application with respect to
irrigationandrainfalltomaximiseefficiencyofpest
control and minimise pesticide loss
Maximiseirrigationefficiencyby:
• Matching irrigation applications to soil type, crop
phase and plant available water status to reduce
loss to deep drainage
• Designingefficientirrigationsystemsthatminimise
energy consumption and water loss
Maintaindownstreamenvironmentalflowsby:
• Quantifying available water resources and
allocating water based on availability
• Investigating innovative water saving measures
• Farm drainage is well planned (e.g. managing
water logging in cropping areas and avoiding
directingflowsdirectlyintowaterwaysandonto
areas with dispersive soils)
Reduce farm waste by:
• Choosing packing products that can be recycled or
composted
• Designing packing plants and processes that
minimise waste
Minimise soil compaction by:
• Improvingheavyvehicletrafficcontrolstoreduce
soilcompactionandimproveinfiltrationandreduce
runoff
Resources required to improve agriculture management:• PrecisionAgricultureTechnicalExtensionOfficer
to work one on one with farmers and to deliver a
voluntary incentive program to encourage adoption
of innovative agriculture management practices
(including incentives for innovative soil, nutrient
and pesticide management) within agriculture land
uses
• Field days, workshops and communication
materials
• EM soil mapping and soil tests for nutrient
management plans
ThePrecisionAgricultureTechnicalExtensionofficers
will connect the participating farmers to other resources
thatarerecommendedforpest,fire,wetlandandgully
management.
For more information on prioritisation of agriculture
management refer to the agriculture implementation
strategy (Appendix 16).
The agriculture management actions are designed
to localise the following Reef 2050 plan actions to
meet Reef 2050 targets:
• CBA11 - Strengthen programs to understand
and promote threats to the values of the Reef
and what people can do to address them.
• CBT3 - Community participation in
stewardship actions to improve Reef health
and resilience continues to grow.
• WQA2 - Continue improvement in water
quality from broadscale land use through
implementation of Reef Plan actions.
• WQT1 - By 2018:
• At least a 50% reduction in anthropogenic
end-of-catchment dissolved inorganic
nitrogen loads in priority areas on the way
to achieving up to an 80% reduction in
nitrogen by 2025
• At least a 20% reduction in anthropogenic
end-of-catchment loads of sediment in
priority areas, on the way to achieving up to
a 50% reduction by 2025
• At least a 20% reduction in anthropogenic
end-of-catchment loads of particulate
nutrients in priority areas
• WQT2 - By 2018:
• 90% of sugarcane, horticulture cropping
and grazing lands are managed using
best management practice systems (soil,
nutrient and pesticides) in priority areas
• There is no net loss of the extent and an
improvement in the ecological processes
and environmental values, of natural
wetlands

Eastern Cape York Water Quality Improvement Plan
75.
Eastern Cape York Water Quality Improvement Plan
76.
Newly planted bananas on Collins Farm, Lakeland (Photo: Michael Goddard)
Native forestry
Improving native forestry management improves future
timber production as well as reducing sediment and
associated nutrient loss.
Implement sustainable forestry practices by:
• Producing a sustainable timber production plan
that outlines timber harvest over time across the
native forestry production area
• Definehabitatandwaterwayprotectionareas
within the native forestry production area that will
be left in a natural state
• Avoid all forestry activities on sensitive soils or in
areas where there is evidence of gully erosion
• Selective logging – retaining 30 - 50% of large
trees with good form and timber properties to
provide seed source for next generation of trees
(in rainforest, retain 60 - 70% canopy cover after
harvest)
• Thinning regrowth in stages to encourage good
form and achieve optimum stem density
Reduce erosion from loading ramps and along roads,
fencelinesandfirebreaksby:
• Strategically placing loading ramps to minimise
ground disturbance during harvest
• Minimising construction of new roads, fence lines
andfirebreaks
• Maintainingroads,fencelinesandfirebreakstoa
high standard
• Relocating roads and fence lines on sensitive soils
to more stable land types
• Diverting water by using erosion control structures
e.g. ‘Woah Boys’ and spoon drains
Keep waterways pest free by:
• Controlling weeds and feral animals along
waterways
• Controlling weeds such as sicklepod,
hymenachne, rubbervine, pond apple and gamba
grass
• Looking out for and controlling new pest species
as they arrive
• Utilising vehicle wash down facilities
• Destocking unmanaged cattle
Managefiretoimprovegroundcoverby:
• Developingandimplementingafireplan
• Followinganappropriatefireregimeforeachland
type e.g. early, mosaic and storm burning and
rotational burning
• Working with neighbours to coordinate burning
activities
Repair eroding gullies by:
• Excluding cattle, sowing grass seeds and
managingfire
• Engineering structures to stabilise highly active
gully head cuts
Resources required to improve native forestry management:Extra resources are not described for native forestry
management as native forestry typically occurs on
grazinglands.TheGrazingTechnicalExtensionofficers
will connect the participating graziers and Traditional
Owners to other resources that are recommended for
pest,fire,wetlandandgullymanagement.
Urban, rural residential and roads
Improving urban management reduces long-term
maintenance costs and improves social wellbeing
as well as reducing sediment, nutrient and other
pollutant loss.
Keep waterways pest free by:
• Controlling weeds and feral animals along
waterways
• Looking out for and controlling new pest species
as they arrive
Create low impact Urban and Rural Residential
blocks by:
• Implementing best practice erosion control
measures to reduce off-site sediment impacts
during initial development phase
• Keeping stocking rates low to prevent over grazing
• Controlling weeds and feral animals along
waterways
• Encouraging native vegetation along waterways
• Limiting clearing to minimise disturbance
• Zoning to reduce development impacts on
sensitive areas
• Ensuring water, sewage and waste don’t impact
waterways by:
• Installing world-class water and waste
infrastructure
• Incorporating water sensitive design into new
development and existing urban areas
Reducing road development and maintenance
impact by:
• Ensuring road upgrades are designed and
implemented to world class standard
• Timing road works to minimise soil loss
• Stabilising existing stream crossings
• Minimising clearing of road reserves
• Creating weed management programs, focused on
vehicle hygiene and slashing over spraying road
sides
• Creating an aware community by:
• Educating our community about choices that
promote healthy waterways
Resources required to improve urban management:• UrbanTechnicalExtensionOfficerstobuild
technical capacity in urban water management
within local government and coordinate
demonstration sites and education and awareness
• Materials for best practice urban erosion and
sediment control and storm water demonstration
sites
• Training, workshop and communications materials
For more information on prioritisation of urban
management refer to the implementation plan (Chapter
3) and the disturbance index report (Appendix 1,
Spencer et al., 2016).

Eastern Cape York Water Quality Improvement Plan
77.
Eastern Cape York Water Quality Improvement Plan
78.
The urban, rural residential and roads management actions are designed to localise the following Reef 2050
plan actions to meet Reef 2050 targets:
• EhA24 - Work with local councils to build their capacity to effectively implement coastal planning laws
and policies to protect the Reef
• CBA11 - Strengthen programs to understand and promote threats to the values of the Reef and what
people can do to address them
• CBT3 - Community participation in stewardship actions to improve Reef health and resilience continues
to grow
• WQA11 - Increase adoption of leading practice in the management and release of point-source water
affecting the Reef
• WQA12 - Implement best practice stormwater management (e.g. erosion and sediment control, water
sensitive urban design and capture of gross pollutants) for new development in coastal catchments
• WQA13 - Build capacity for local government and industry to improve water quality management in
urban areas
• WQT1 - By 2018:
• At least a 50% reduction in anthropogenic end-of-catchment dissolved inorganic nitrogen loads in
priority areas on the way to achieving up to an 80% reduction in nitrogen by 2025
• At least a 20% reduction in anthropogenic end-of-catchment loads of sediment in priority areas, on the
way to achieving up to a 50% reduction by 2025
• At least a 20% reduction in anthropogenic end-of-catchment loads of particulate nutrients in priority
areas
• WQT2 - By 2018:
• The extent of riparian vegetation is increased
• There is no net loss of the extent and an improvement in the ecological processes and environmental
values, of natural wetlands
Mining
Improving mining management reduces the long-term
impacts on natural environment as well as reducing
sediment, nutrient and other pollutant loss.
Reduce erosion from active mining areas by;
• Implementing world-class erosion control
measures to reduce off-site sediment impacts
Reduceerosionfromroads,fencelinesandfirebreaksby;
• Ensuring access road upgrades are designed and
implemented to world class standard
• Timing road works to minimise soil loss
• Stabilising existing stream crossings
• Minimising construction of new roads, fence lines
andfirebreaks
• Maintainingroads,fencelinesandfirebreakstoa
high standard
• Relocating roads and fence lines on sensitive soils
to more stable land types
• Diverting water by using erosion control structures
eg. ‘Woah Boys’ and spoon drains
Ensure mine storm water, wastewater and sewage
doesn’t impact on waterways by;
• Constructing bund walls so all rainfall is captured
in sediment detention basins and evaporated or
treated
• Ensuring water used in wash plants and mineral
processing is stored in tailings dams and treated
before release
• Ensuring that sediment detention basins, bund
walls and tailings dams have adequate capacity to
deal with monsoon wet season conditions
• Installing tertiary sewage treatment infrastructure
Reduce the long-term impacts of mines by;
• Ensuring mine rehabilitation plans, including
rehabilitation bonds, are at a high standard to
reflectthenaturalvalueofCapeYork
• Rehabilitating abandoned mines and quarries
in the Normanby, Mosman, Annan, Starke and
Stewart catchments
Keep waterways pest free by;
• Controlling weeds and feral animals along
waterways
• Looking out for and controlling new pest species
as they arrive
• Creating weed management programs, focused
on vehicle hygiene and slashing over spraying
roadsides
Resources required to improve mining management:Extra resources required for improving mining
management are not described as this is a regulated
activity.
Ports and shipping
Improving ports and shipping management reduces
the long-term impacts on natural environment as well
as reducing sediment, nutrient and other pollutant loss.
Ensure port storm water, sewage and waste doesn’t
impact on marine environment by;
• Constructing bund walls and storm water storage
so all rainfall from port industrial areas (fuel tank
farms, fueling docks, anti-foulant slipways) is
captured and treated
• Ensuring waste disposal (including waste oil)
and sewage pump-out facilities are available and
maintained to a high standard
• Implementing a regular water quality monitoring
program for early detection of pollutants in port
waters
Reduce impacts of dredging by;
• Minimising dredging of ports and shipping
channels
• Ensuring dredging operations are implemented to
world-class standardsDune lake of eastern Cape York (Photo: Kerry Trapnell)

Eastern Cape York Water Quality Improvement Plan
79.
Eastern Cape York Water Quality Improvement Plan
80.
• Undertaking land-based disposal of dredge
materials
Reduce sediment impacts of shipping by;
• Regularly mapping the deepest shipping channel
in the northern GBR
• Definingandmonitoringshallowsectionsofthe
northern GBR that present highest risk of sediment
impacts
• Considering speed and tide restrictions for largest
ships in these shallow sections
• Implementing regular monitoring of shipping
plumes, water quality and reef condition in shallow
sections
Reduce other pollutant impacts of shipping by;
• Education and enforcement to exclude routine
discharges of oils, chemicals, sewage and waste
within northern GBR
• Education and enforcement to exclude exchange
of ballast water within the northern GBR
Reduce the frequency of shipping incidents (groundings
and collisions) by;
• Requiring compulsory pilotage through the
northern GBR
• Regularly reviewing and improving vessel
monitoring and reporting
Improve the response to shipping incidents by;
• Implementing the highest possible incident
response (equipment and training) at Cooktown,
Cape Flattery and Lockhart River
• Adopting world class management practices in all
current port operations
Creating an aware community by;
• Educating our community about port waste, water
and sewage facilities
•
Resources required to improve ports and shipping management:Extra resources required for improving ports and
shipping management are not described as this is a
regulated activity.
Wetlands
Improving wetland management improves wetland and
floodplain health and improves the sediment trapping
and nutrient processing function of wetlands and
floodplains.
Minimise the impacts of managed and feral animals by:
• Controlling feral animals along waterways
• Looking out for and controlling new pest species
as they arrive
• Controlling stock access eg low stocking rates,
periodic grazing or complete exclusion
Monitor the health of wetlands by;
• Undertaking a Wetland Condition Assessment
at least twice a year (ideally end of wet and end
of dry). Assessments will track the health of a
wetland and allow development of a management
plan
Managefiretoimprovewetlandhealthby;
• Developingandimplementingafireplan
• Followinganappropriatefireregimeforthe
wetland system e.g. early, mosaic and storm
burning and rotational burning
• Working with neighbours to coordinate burning
activities
• Keepingfireoutofwetlandriparianedges
permanently
Keep wetlands from silting up by;
• Identifying and repairing upstream sediment
sourcessuchasgullies,roadsandfirebreaks
Maintain natural water levels by;
• Minimising water extraction particularly in the dry
season
• Limiting vegetation clearing for tracks at vehicle
access points on wetland edges
Keep wetlands weed free by;
• Controlling weeds such as sicklepod,
hymenachne, pond apple and para grass in
wetlands and along edges
• Looking out for and controlling new pest species
as they arrive
• Utilising vehicle wash down facilities
Resources required to improve wetland management:• WetlandCoordinationOfficertodeliveravoluntary
incentive program to encourage adoption of
wetland best management practices within grazing
and nature and culture conservation land uses
• Training, workshop and communications materials
• Wetland monitoring expert technical advice to
support wetland management project design and
wetland condition monitoring
For more information on prioritisation of wetland
management on grazing and nature and culture
conservation land uses refer to the grazing
implementation strategy (Appendix 15), the gully
prioritisation report (Appendix 2, Brooks et al. 2016)
andtheCapeYorkfirereport(Appendix13,Standley,
2016).
The wetland management actions are designed to
localise the following Reef 2050 plan actions to
meet Reef 2050 targets:
• CBA11 - Strengthen programs to understand
and promote threats to the values of the Reef
and what people can do to address them.
• CBT3 - Community participation in
stewardship actions to improve Reef health
and resilience continues to grow.
• WQT1 - By 2018:
• at least a 50% reduction in anthropogenic
end-of-catchment dissolved inorganic
nitrogen loads in priority areas on the way
to achieving up to an 80% reduction in
nitrogen by 2025
• at least a 20% reduction in anthropogenic
end-of-catchment loads of sediment in
priority areas, on the way to achieving up to
a 50% reduction by 2025
• at least a 20% reduction in anthropogenic
end-of-catchment loads of particulate
nutrients in priority areas
• WQT2 - By 2018:
• The extent of riparian vegetation is
increased
• There is no net loss of the extent and an
improvement in the ecological processes
and environmental values, of natural
wetlands

Eastern Cape York Water Quality Improvement Plan
81.
Eastern Cape York Water Quality Improvement Plan
82.
Gullies
Gullies are present across the whole planning region
and can be found in all land uses. Widespread gully
erosion has been identified as the largest sources of
anthropogenic (human caused) sediment within the
Normanby Basin (Central Section). Gullies are also
a significant localised sediment source within the
Northern and Southern sections of the region.
Improving gully management reduces sediment and
associated nutrient loss and improves the ecosystem
health of downstream freshwater and marine
ecosystems.
The spatial extent of gullies within the Normanby and
StewartbasinshasbeenmappedbyGriffithUniversity
(Appendix 1 and Appendix 2). A spatial prioritization,
identifying the top 100 sub-catchments for gully erosion
in theNormanbyhasalsobeencompletedbyGriffith
University (Figure 21 and Appendix 2). This information
has been used to inform the implementation strategies
and prioritisation of investment to reduce sediment loss.
Recommendations for implementation within each
section:
north• Gully mapping to identify priority gully remediation
sites that will improve nature and cultural
conservation and wetland management outcomes.
• Implement high priority gully remediation
demonstration sites.
Central• Implement catchment wide gully management
within grazing and nature conservation land uses.
• Utilise grazing implementation strategy (Appendix
15) and gully prioritization (Appendix 2) to
strategically invest in active gully remediation to
stabilise the most active gullies to achieve the
sediment reduction target.
South• Gully mapping to identify priority gully remediation
sites that will improve urban, rural residential
and road management, grazing management,
nature and cultural conservation and wetland
management outcomes.
• Implement high priority gully remediation
demonstration sites.
Resources required to improve gully management:• GullyErosionTechnicalOfficerscoordinatea
strategic active gully remediation program to
achieve cost effective erosion reduction within
grazing and nature and culture conservation land
uses
• Training, workshop and communications materials
• Gully erosion expert technical advice to support
project design
For more information on prioritisation of gully
management refer to the grazing implementation
strategy (Appendix 15), the disturbance index report
(Appendix 1, Spencer et al., 2016), the gully prioritisation
report (Appendix 2, Brooks et al., 2016) and the alluvial
gully management technical report (Shelberg and
Brooks, 2013).
Figure 21: Top 100 gully erosion sub-catchments in the Normanby Basin. Erosion from alluvial and colluvial sources
(i.e. total gully output) were ranked by TOTAL gully output. (Source: Appendix 2, Brooks et al., 2016)
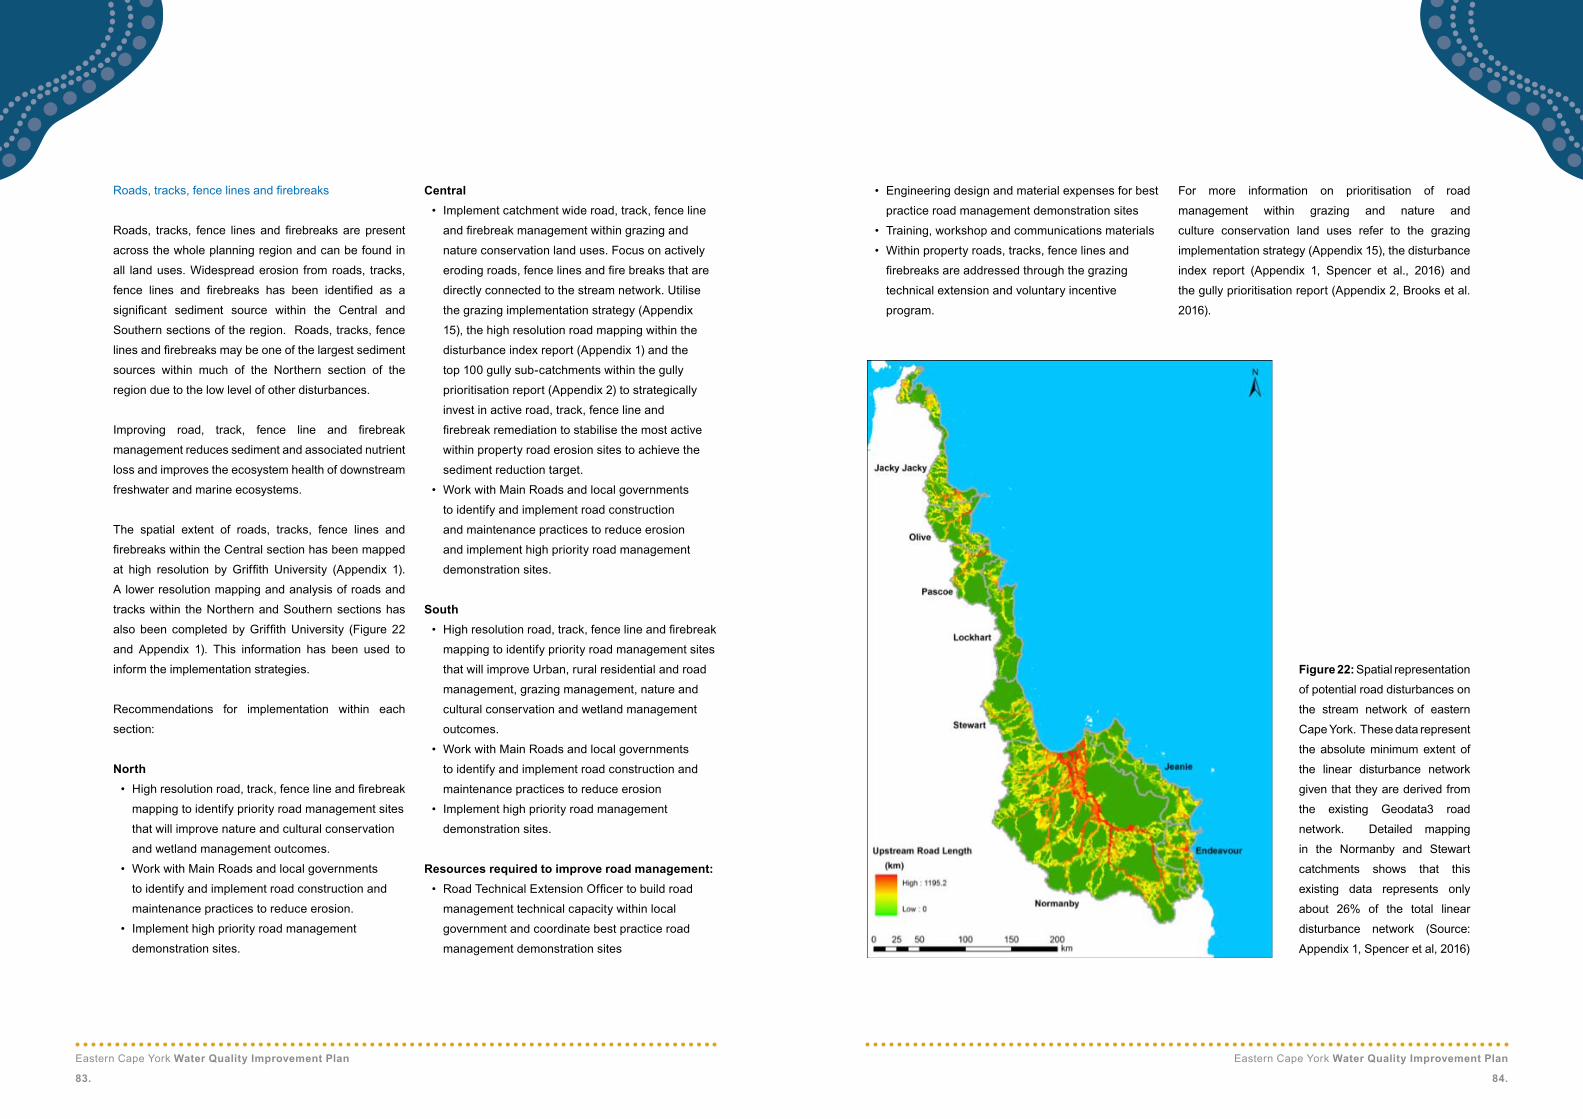
Eastern Cape York Water Quality Improvement Plan
83.
Eastern Cape York Water Quality Improvement Plan
84.
Roads,tracks,fencelinesandfirebreaks
Roads, tracks, fence lines and firebreaks are present
across the whole planning region and can be found in
all land uses. Widespread erosion from roads, tracks,
fence lines and firebreaks has been identified as a
significant sediment source within the Central and
Southern sections of the region. Roads, tracks, fence
linesandfirebreaksmaybeoneofthelargestsediment
sources within much of the Northern section of the
region due to the low level of other disturbances.
Improving road, track, fence line and firebreak
management reduces sediment and associated nutrient
loss and improves the ecosystem health of downstream
freshwater and marine ecosystems.
The spatial extent of roads, tracks, fence lines and
firebreakswithintheCentralsectionhasbeenmapped
at high resolution by Griffith University (Appendix 1).
A lower resolution mapping and analysis of roads and
tracks within the Northern and Southern sections has
also been completed byGriffithUniversity (Figure 22
and Appendix 1). This information has been used to
inform the implementation strategies.
Recommendations for implementation within each
section:
north• Highresolutionroad,track,fencelineandfirebreak
mapping to identify priority road management sites
that will improve nature and cultural conservation
and wetland management outcomes.
• Work with Main Roads and local governments
to identify and implement road construction and
maintenance practices to reduce erosion.
• Implement high priority road management
demonstration sites.
Central• Implement catchment wide road, track, fence line
andfirebreakmanagementwithingrazingand
nature conservation land uses. Focus on actively
erodingroads,fencelinesandfirebreaksthatare
directly connected to the stream network. Utilise
the grazing implementation strategy (Appendix
15), the high resolution road mapping within the
disturbance index report (Appendix 1) and the
top 100 gully sub-catchments within the gully
prioritisation report (Appendix 2) to strategically
invest in active road, track, fence line and
firebreakremediationtostabilisethemostactive
within property road erosion sites to achieve the
sediment reduction target.
• Work with Main Roads and local governments
to identify and implement road construction
and maintenance practices to reduce erosion
and implement high priority road management
demonstration sites.
South• Highresolutionroad,track,fencelineandfirebreak
mapping to identify priority road management sites
that will improve Urban, rural residential and road
management, grazing management, nature and
cultural conservation and wetland management
outcomes.
• Work with Main Roads and local governments
to identify and implement road construction and
maintenance practices to reduce erosion
• Implement high priority road management
demonstration sites.
Resources required to improve road management:• RoadTechnicalExtensionOfficertobuildroad
management technical capacity within local
government and coordinate best practice road
management demonstration sites
• Engineering design and material expenses for best
practice road management demonstration sites
• Training, workshop and communications materials
• Within property roads, tracks, fence lines and
firebreaksareaddressedthroughthegrazing
technical extension and voluntary incentive
program.
For more information on prioritisation of road
management within grazing and nature and
culture conservation land uses refer to the grazing
implementation strategy (Appendix 15), the disturbance
index report (Appendix 1, Spencer et al., 2016) and
the gully prioritisation report (Appendix 2, Brooks et al.
2016).
Figure 22: Spatial representation
of potential road disturbances on
the stream network of eastern
Cape York. These data represent
the absolute minimum extent of
the linear disturbance network
given that they are derived from
the existing Geodata3 road
network. Detailed mapping
in the Normanby and Stewart
catchments shows that this
existing data represents only
about 26% of the total linear
disturbance network (Source:
Appendix 1, Spencer et al, 2016)

Eastern Cape York Water Quality Improvement Plan
85.
Eastern Cape York Water Quality Improvement Plan
86.
Impact of main and council roads on water quality on
Cape York Peninsula and the Great Barrier Reef
Dr. Jeffrey Shellberg and Dr. Andrew Brooks
(GriffithUniversity)
• Roads, borrow pits, tracks, fence lines and other
linear disturbances are a major sediment source
draining to the Great Barrier Reef (Gleeson et al.
2012; Brooks et al. 2013; Shellberg and Brooks
2013)andhavebeenpoorlyquantifiedinthepastto
prioritize sediment reduction to the GBR.
• In the Normanby-Stewart catchment of Cape York
Peninsula, there are >10,800 km of linear road
disturbance covering 7988 ha, which represents the
largest direct human land use disturbance across
Cape York compared to all other intensive land uses
(Spencer et al. 2016).
• Road development represents THE major human
disturbance vector for developing catchments on
Cape York and the GBR, similar to other remote
regions of the globe (e.g., Amazon basin; Laurance
et al. 2001; 2014). Roads pollute sediment and
nutrients, and carry people, animals, weeds, and
development into remote intact ecosystems.
• Annual road maintenance, new road construction,
and legacy road problems pollute 100s of
thousands of tonnes of sediment to Cape York
rivers and the GBR each year. On Cape York, road
maintenance crews replace >25 mm of road surface
lost to erosion each year, which represents > 500
tonnes/km/year not including associated road gully
erosion.
• Both Shire Council and Queensland State road
crews are publically funded many hundreds of
millions of dollars each year to maintain and
develop roads for public use.
• Federal and State funded ‘road development
programs’ that pollute sediment and nutrients are
indirectconflictwithfunded‘reefrescueprograms’
aimed at reducing this pollution.
• Addressingtheseprogramconflictsofinterest
represents the lowest hanging fruit for sediment
pollution abatement by government programs
in the northern GBR, by reducing sediment
disturbance and mobilisation through improved Best
Management Practices (BMPs).
• Shire Councils rely on annual and emergency
State and Federal road funds to maintain their road
development work forces and intricate networks of
contactors and machine operators.
• Historically and recently, there has been little
incentive by road engineers, Councils and
contractors to 1) minimize their sediment and
erosion disturbance volumes and areas along roads
and borrow pits, 2) engineer and construct roads
that will last with minimal ongoing maintenance,
or 3) implement rigorous BMPs to reduce erosion
following international standards. Many recent
examples have been documented of road crews
poorly addressing erosion problems year after year,
and accelerating erosion to the GBR.
• Road construction and maintenance practices that
would never be allowed in southeast Queensland
are prevalent on Cape York Peninsula. Most road
projects do not include effective sediment reduction
BMPs such as minimizing disturbance, active
revegetation of slopes and borrow pits, frequent
effective grade control structures, or avoiding
cutting drains that feed into gullies, creeks and the
GBR.
• The major funding investments to pave (bitumen)
the Peninsula Development Road (PDR) on Cape
York will eventually reduce sediment pollution in
the long-term (>20 years). However, in the short
term (1–10 years), these construction works will
likely contribute tens if not hundreds of thousands
of tonnes of sediment through major earthwork
disturbance and lack of rigorous BMPs. Many
examples have been documented of major
pollution from recent construction and poor road
management along the PDR.
• Best Management Practices (BMPs) to reduce
sediment pollution and erosion along Shire Council
and Queensland State roads are in desperate need
of review and improvement to bring the standards
up to International best practice to reduce GBR
pollution impacts.
• BMP requirements and standards must be
increased for Federal and State funded road
projects, with greater than >20% of project funds
directly invested to avoid or reduce sediment
pollution.
• Cooperation is needed between Federal, State
and Council funded ‘road development programs’
and ‘reef rescue programs’ to ensure that these
programs are not antagonistic and both produce
outcomes for the public good and public trust
(GBR).
• Cooperative education, training, and monitoring
programs are needed for sediment reduction
and avoidance during road projects, through the
interaction of geomorphology scientists, engineers,
road practitioners, and contractors. Independent
monitoring and auditing of BMP implementation
measures and pollution outcomes is essential for
improved management and oversight.
Brooks, A., Spencer, J., Olley, J., Pietsch, T., Borombovits, D., Curwen, G., Shellberg, J., Howley, C., Gleeson, A., Simon, A., Bankhead, N., Klimetz, D., Eslami-Endargoli, L., Bourgeault, A., 2013. An Empirically-Based Sediment Budget for the Normanby Basin: Sediment Sources, Sinks, and Drivers on the Cape York Savannah, Griffith University, Australian Rivers Institute,Final Report for the Australian Government Caring for Our Country - Reef Rescue Program, April 2013, 506pp. http://www.capeyorkwaterquality.info/references/cywq-229.
Gleeson, A., 2012. Cape York’s Unsealed Road Network and Its Impact on the Surrounding Aquatic Ecosystem. Honours thesis, GriffithSchoolofEnvironment,GriffithUniversity,Nathan,QLD.
Laurance, W.F., Cochrane, M.A., Bergen, S., Fearnside, P.M., Delamônica, P., Barber, C., D’Angelo, S., Fernandes, T., 2001. The Future of the Brazilian Amazon. Science, 291(5503), 438-439.
Laurance, W.F., Clements, G.R., Sloan, S., O’Connell, C.S., Mueller, N.D., Goosem, M., Venter, O., Edwards, D.P., Phalan, B., Balmford, A., Van Der Ree, R., Arrea, I.B., 2014. A global strategy for road building. Nature, 513(7517), 229-232.
Shellberg, J.G., Brooks, A.P., 2013. Alluvial Gully Prevention and Rehabilitation Options for Reducing Sediment Loads in the NormanbyCatchmentandNorthernAustralia.GriffithUniversity,Australian Rivers Institute, Final Report for the Australian Government’s Caring for our Country - Reef Rescue Initiative, 312pp. http://www.capeyorkwaterquality.info/references/cywq-223.
Spencer, J., Brooks, A., Curwen, G., Tews, K., 2016. A Disturbance Index Approach for Assessing Water Quality Threats in Eastern Cape York. A report to South Cape York Catchments and Cape York NRM for the Cape York Water Quality Improvement Plan, by theAustralianRiversInstitute,GriffithUniversity,42pp
Road and Fence Network in the Normanby and Stewart Catchments

Eastern Cape York Water Quality Improvement Plan
87.
Eastern Cape York Water Quality Improvement Plan
88.
Fire
Inappropriatefireregimessuchaslate-seasonwildfires
have been present across the whole planning region
(with the exception of wet rainforest areas) in the last
15 years and can be found in all land uses. Late-season
wildfirethatresultsinlowgroundcoverleadingintothe
wetseasonhasbeenidentifiedasacontributingfactor
to sediment erosion within all sections of the region.
Improvingfiremanagementimprovesoverallecosystem
health (particularly wetland functionality) and reduces
sediment and associated nutrient loss to downstream
freshwater and marine ecosystems.
The spatial extent of late-season wildfire within the
planning region over the last 15 years has been analysed
by Cape York NRM based on a Northern Australian Fire
Information (NAFI) modus imagery analysis (Figure 23).
Theareas identifiedas ‘NoBurnRecorded’generally
aligns with the wet rainforest and coastal vegetation
typeshowever therearemanyexamplesoffirescars
not being picked up by the NAFI analysis due to a range
of technical issues. This information has been used to
inform the implementation strategies.
Recommendations for implementation within each
section:
north• Formationoffiremanagementclustergroupsto
developfiremanagementstrategiestoimprove
nature and cultural conservation and wetland
management outcomes.
• Implementfiremanagementstrategies.
Central• Formationoffiremanagementclustergroupsto
developfiremanagementstrategiestoimprove
grazing, nature and cultural conservation and
wetland management outcomes.
• Implementfiremanagementstrategies.
South• Formationoffiremanagementclustergroupsto
developfiremanagementstrategiestoimprove
urban and rural residential, grazing, nature and
cultural conservation and wetland management
outcomes
• Implementfiremanagementstrategies.
Resourcesrequiredtoimprovefiremanagement:• FireCoordinationOfficersandongroundFire
Managersworkingacross18fireclustergroups
to coordinate broad scale early season aerial
burning and provide technical support to encourage
adoption of appropriate burning regimes.
• Material and operating expenses for broad scale
early season aerial burning program (plane and
helicopter time and fuel, aerial incendiaries, etc.)
• Cluster group meetings and communications
materials
• GISandmappingsupportforfiremanagement
plans
Formoreinformationonprioritisationoffiremanagement
within grazing and nature and culture conservation
landusesrefertotheCapeYorkfirereport(Appendix
13, Standley, 2016) and the grazing implementation
strategy (Appendix 15).
Figure 23: Fire Frequency of eastern Cape York (Source: Appendix 13, Standley 2016).

Eastern Cape York Water Quality Improvement Plan
89.
Eastern Cape York Water Quality Improvement Plan
90.
Feral animals – cattle, horses and pigs
Feral cattle, horses and pigs are present across the
whole planning region and can be found in all land
uses. Overgrazing and trampling by feral cattle and
horses and vegetation destruction and cultivation by
feral pigs results in low ground cover and exposed soil
(particularly around wetlands, permanent springs and
riparian areas) leading into the wet season has been
identifiedasa contributing factor to sedimenterosion
within all sections of the region.
Improving feral animal management improves overall
ecosystem health (particularly wetland functionality)
and reduces sediment and associated nutrient loss to
downstream freshwater and marine ecosystems.
The spatial extent of feral animals within the planning
region has been assessed through one on one
consultation with local technical experts, land managers
and wetland condition survey records. A spatial analysis
of typical grazing vegetation types within nature and
cultural conservation land use was undertaken to
estimate the potential area that is impacted by the feral
cattle and horses (Figure 24). This information has been
used to inform the implementation strategies.
Recommendations for implementation within each
section:
north• Support National Park and Traditional Owner
Ranger programs and other land managers to
develop and implement a strategic feral animal
control program to greatly reduce the impact of feral
cattle, horses and pigs on high priority wetland and
nature and cultural conservation areas.
• Implement and monitor high-priority feral animal
control demonstration sites.
Central• Identify opportunities to facilitate grazing,
agriculture and other land manager and community
partnerships to implement coordinated feral animal
control programs.
• Coordinate the establishment of feral animal control
demonstration sites to protect high-priority wetland
and nature and cultural conservation areas.
South• Identify opportunities to facilitate urban and rural
residential, agriculture, grazing and other land
manager and community partnerships to implement
coordinated feral animal control programs.
• Coordinate the establishment of feral animal control
demonstration sites to protect high priority wetland
and nature and cultural conservation areas.
Resources required to improve feral animal management:• Voluntary Incentive program coordinated by local
government to encourage sound pest management
• Pestforumandfieldday,trainingand
communications materials
• Strategic pest mapping for pest management plans
For more information on the prioritisation of feral
animal management within grazing and nature and
culture conservation land uses refer to the grazing
implementation strategy (Appendix 15). Cook Shire
Council, Cape York Weeds and Feral Animals, and
Cape York NRM also have a range of publications and
information on the control of feral animals.
Figure 24: Area that is potentially impacted by feral cattle and horses within National Parks. Feral pig in Jack Lake (Photo: Dr. Jim Mitchell)

Eastern Cape York Water Quality Improvement Plan
91.
Eastern Cape York Water Quality Improvement Plan
92.
Weeds
Sicklepod, hymenachne, rubber vine, pond apple,
and salvinia are six invasive weeds of wetlands and
waterways that are present in Eastern Cape York.
If unmanaged these weeds have the potential to
spread and impact widely on the ecological health of
waterways, wetlands and floodplains. The impact of
these weeds can be summarised as follows:
Sicklepod - an annual broadleaf legume that displaces
nativegrassesaroundrivers,wetlandsandfloodplains.
It is unpalatable so is particularly invasive when
combined with heavy grazing pressure. Has spread
rapidly throughout the Normanby Basin and is also a
major threat to river health in other catchments. Nitrogen
fixationmay increasenitrogen in thesoilsurfaceand
contribute to nitrogen in soil water and runoff water.
Early identification and control of outbreaks (such
as upper Pascoe River) will be required to prevent
establishment within the Northern section of the region.
hymenachne - a perennial grass that displaces
aquatic plants in waterways and wetlands. A very
invasive species with well-established populations in
the Central and Southern sections of the region. Early
identificationandcontrolofoutbreakswillberequired
to prevent establishment within the Northern section of
the region.
Rubber vine - a perennial vine that displaces and
smothers native vegetation in riparian zones. A very
invasive species well established populations in the
Central section of the region. A current containment
line is being maintained just south of Coen at Yarraden
Station. Early identification and control of outbreaks
will be required to prevent establishment within the
Northern section of the region.
Pond apple - a tree that displaces mangroves and
other riparian species in estuarine and coastal
freshwater wetlands. A very invasive species that is the
focusofongoingcontainmentatspecificoutbreaksin
Temple Bay, South Bedford and south of Archer Point.
Early identification and control of new outbreaks will
be required to prevent establishment throughout the
region.
Salvinia - an aquatic weed that displaces other aquatic
vegetation by forming floatingmats that reduce light
availability in water. A very invasive species that is the
focus foreradicationatspecific locations inLakeland
andMountPoverty.Early identificationandcontrolof
new outbreaks will be required to prevent establishment
throughout the region.
Gamba grass - a perennial grass that displaces native
grasses. Has been shown to increase the intensity of
fireregimesandreducecanopycoverandgroundcover
when burnt. A very invasive species that is the focus
for containment and eradication at Kalinga Station
on Hann River and Silver Plains Station on Breakfast
Creek.Earlyidentificationandcontrolofnewoutbreaks
will be required to prevent establishment throughout
the region.
Improving weed management improves overall
ecosystemhealth (particularlywetlandandfloodplain
functionality) and when coupled with improved grazing
management can help to reduce sediment and
associated nutrient loss to downstream freshwater and
marine ecosystems.
The spatial extent of weeds within the planning region
has been assessed through one-on-one consultation
with local technical experts, land managers and
wetland condition survey records. Weed outbreak
and control mapping by Cape York Weeds and Feral
Animals Program and Cook Shire Council has been
used to produce maps of known outbreaks to inform
the implementation strategies.
Recommendations for implementation within each
section:
north• Support National Park and Traditional Owner
Ranger programs to develop and implement a
strategic weed control program to greatly reduce
the impact of the six priority weeds on high-priority
wetland and nature and cultural conservation
areas.
• Surveillance and control of new outbreaks. Regular
surveillance along roads including quarries, and
water access points used for road maintenance
should be a priority.
• Establish and maintain a containment line
including wash-down facilities at Coen, Port
Stewart and Lockhart to minimise the northward
spread of all weeds.
Central• Identify opportunities to facilitate grazing,
agriculture and other land manager and
community partnerships to implement strategic
weed control programs.
• Implement high priority weed control
demonstration sites.
• Establish and maintain a containment line
including a wash-down facility at Lakeland to
minimise the northward spread of all weeds.
South• Identify opportunities to facilitate urban and
rural residential, agriculture, grazing and other
land manager and community partnerships to
implement strategic weed control programs.
• Implement high priority weed control
demonstration sites.
• Establish and maintain a containment line
including a wash-down facility at Rossville to
minimise the northward spread of all weeds.
• Resources required to improve weed
management:
• Voluntary Incentive program coordinated by
local government to encourage sound pest
management
• Construction of community wash down facilities
• Pestforumandfieldday,trainingand
communications materials
• Strategic pest mapping for pest management plans
For more information on the prioritisation of weed
management within grazing and nature and culture
conservation land uses, refer to the grazing
implementation strategy (Appendix 15). Cook Shire
Council, Cape York Weeds and Feral Animals, and
Cape York NRM have a range of publications and
information on the identification and management a
wide range of weeds.
Spraying sicklepod at Helenvale in the Endeavour basin (Photo: Trevor Meldrum)

Eastern Cape York Water Quality Improvement Plan
93.
Eastern Cape York Water Quality Improvement Plan
94.
ChAPTER 2:IMPLEMEnTATIon PLAnPriority focus for implementation
The planning region for the northern Great Barrier Reef
has been broken into three sections based on marine
receiving waters, Northern, Central and Southern and
the catchments that drain to them. The priority focus for
eachsectionreflectshumanuseandassociatedlevel
of risk to water quality and ecosystems and Reef 2050
Plan targets. A staged approach to implementation is
recommended to ensure that measurable progress is
made towards achieving water quality targets.
The priority focus for each section is:
• Northern section - nature and cultural conservation
and monitoring
• Central section - grazing (gully), agriculture and
road management
• Southern section - urban, rural residential and
road and intensive agriculture management
More detail on these priorities is presented below.
The establishment of a Cape York Catchments to
Coral Partnership is recommended to provide strategic
direction and coordination of implementation activities.
The Cape York Catchments to Coral Partnership will
also raise awareness within Queensland and Australian
Government of Great Barrier Reef-wide and global
issues that influence implementation of the Eastern
Cape York Water Quality Improvement Plan.
Northern section (Jacky Jacky, Olive Pascoe and
Lockhart)
This is where the most undisturbed ecosystems are.
Priority focus Wetland, floodplain, estuary and reef ecosystem
management, protection and monitoring. Fire
management, pest management, visitor management
and road management as well as wetland condition
monitoring, water quality monitoring and baseline
marine species diversity and condition monitoring.
Critical issue To document the current condition, threats and
species diversity within the Northern section and
undertakemanagement tominimise threats fromfire,
pests, visitors and roads. Traditional Owner Ranger
Programs and QPW Rangers must be central to the
implementation strategy.
Do nothing? If we don’t act now, there is a risk that climate change
impacts and other threats will result in a loss of species
diversity and/or species range. We will miss the
opportunitytodefinetheextentofspeciesdiversitythat
is present in the northern Great Barrier Reef.
Monitoring questions?What impact has human disturbance in the Great
Barrier Reef catchment had on species diversity
and ecosystem health? Utilise Disturbance index,
ecosystem health and water quality monitoring to
compare relatively undisturbed ecosystems in the
Northern section to:
• Grazing impact on wetland and marine
ecosystems at Port Stewart/ Silver Plains
(Breakfast Creek) in the Central section
• Expansionandintensificationofurban,rural
residential, road and agricultural impacts on
wetland and marine ecosystems at Cooktown,
McIvor River and Annan River in the Southern
section.
• Impact of widespread intensive agricultural and
urban development on wetland and marine
ecosystems in the Wet Tropics region.
Central section (Stewart, Hann and Normanby)
This is where most of the grazing and agriculture is.
Priority focusImproving grazing, agriculture and road management
to minimise the impacts of current and future
development on downstream freshwater and marine
environments. For grazing, focus on catchment wide
adoption of cattle exclusion from gully prone land and
ground cover improvement through stocking rates and
firemanagement.Undertake active gully remediation
in highest priority areas in Normanby River and Hann
River first then Stewart River (Terrible Creek). For
agriculture focus on fostering an innovation network
supported by small grants and one on one technical
support. For roads, work with Main Roads and Cook
Shire Council to implement measures to improve road
construction and maintenance.
Critical issue Take immediate action to reduce sediment loads and
associated nutrient loads from grazing land (gullies),
agriculture and roads to minimise the current impact on
the marine environment.
Do nothing? If we don’t act now there is clear evidence that marine
water quality and ecosystem health will decline in both
theCentralandNorthernsections.Inlargefloodevents
theNormanbyandHannriversproducefloodplumes
that extend well into the Northern section.
Monitoring questions? What is a sustainable allocation of water resources
to irrigatedagricultureandenvironmentalflows in the
Lakeland area?
What are the best long-term solutions to reduce and
avoid gully and road erosion?
How are current rates of accelerated erosion impacting
on downstream environments? What is the impact on
waterholeandwetlandinfillingaswellassedimentand
nutrients discharged to Princess Charlotte Bay?
What proportion of the coastal erosion process in
Princess Charlotte Bay is attributable to human
activity? How will climate change (sea level rise) affect
erosion rates?
Southern section (Jeanie and Endeavour)
This is where most of the people live.
Priority focusImproving current and future urban and rural residential
land development, road construction and intensive
agricultural land use to minimise the cumulative impacts
on downstream freshwater and marine environments.
Critical issue Foster community action to improve urban, peri-urban
and intensive agriculture management. Use practical
demonstration sites, small grants and technical
training in road, gully, storm water, agriculture, riparian
and wetland management to increase community
awareness and capacity. Encourage the adoption
of world-class standards for all new urban and road
developmentsandagriculturalintensification.
Do nothing? If we don’t act now there is a significant risk that
both current and future urban development and
intensification of agricultural land use will impact on
seagrass meadows and inshore fringing reefs. There
is also potential to increase crown of thorns starfish
outbreaks. The coral reefs in the Southern section are
easily accessible for tourism and may represent the
future of Australia’s Reef tourism industry.
Monitoring questions? What role do the Jeannie, Starcke, McIvor, Endeavour
andAnnanRiverfloodplumeshaveoncrownofthorns
starfishoutbreaks?
Can we quantify the current cumulative impacts of
agricultural and urban land use on seagrass meadows

Eastern Cape York Water Quality Improvement Plan
95.
Eastern Cape York Water Quality Improvement Plan
96.
and inshore fringing reefs to establish a baseline for
measuring future impacts on the marine environment
ofpotential intensificationof landuse inJeannieand
Endeavour Basin?
Strategic and staged approach to implementation
To make best use of local capacity and resources there
is a need to use a strategic and staged approach to
implementation.Thefirstthreetofiveyearsshouldfocus
on the highest priority activities within the Northern,
Central and Southern sections of the planning region.
The Cape York Catchments to Coral Partnership will
work to exchange information on implementation
success and failures and opportunities for expanding
the successful activities. Once there is clearly
demonstrated progress and further resources are
secured, then expansion of priority implementation
activities across the region can occur. For example:
• Grazing and gully erosion implementation will
move into Oaky Creek (Annan River) and Jeanie
River once methods applied in the Central section
have been established
• Nature and culture conservation programs will
move south through Stewart basin and Hann Basin
once methods applied in the Northern section
have been established
• Urban and peri urban management programs will
move into Lockhart, Lakeland and Laura once
methods applied in Southern section have been
established
It is important to note that local people will invest
their own resources to implement recommended
management actions if they are provided with technical
support, and encouragement. The cross regional
working groups can help to identify where extra
technical support is required to encourage local action
that is additional and complementary to the priority
focus areas.
Climatechangedefinesourtimelineforimplementation
The Great Barrier Reef Marine Park Authorities’
OutlookReport(2014)definesclimatechangeimpacts
as the single largest threat to the Great Barrier Reef
ecosystem. Improved water quality improves the
resilience of the Great Barrier Reef ecosystem to
recover following cyclone damage and crown of thorn
starfish outbreaks and improves the ability to cope
with the impacts of increased temperature and ocean
acidification. For example, temperature increases by
2018 are expected to result in coral bleaching events
twice per decade and 2035 has been used as a critical
climate change timeline within the Wet Tropics Water
Quality Improvement Plan (Terrain NRM, 2015).
To provide the marine ecosystems within the northern
Great Barrier Reef with resilience to climate change
impacts, the water quality improvement targets need
to be achieved within the marine environment before
the impacts of climate change are expressed. A
seven - year timeline (2016 – 2022) for widespread
land management action has been used within the
implementation plan to maximise the opportunity for
marine water quality to begin improving by 2030 (this
takes into account the long time lags associated with
sediment reduction at whole of catchment scale).
The impact of climate change on the marine ecosystems
within the Central section may be even more extreme,
due to increased sediment loads associated with the
lowland floodplain/coastal plain erosion process in
Princess Charlotte Bay. It is unclear whether climate
change induced sea level rise will accelerate this
erosionprocess.Whilethis lowlandfloodplain/coastal
plain erosion process presents a critical knowledge
gap, it also reinforces the need for significant effort
to improve land management to reduce the other
sediment sources in the Normanby and Hann Basins.
GBR-wide and global issues that influenceimplementation
There are a range of GBR-wide or global issues
that influence WQIP implementation that should
be addressed by Queensland and the Australian
Government to support WQIP implementation in the
northern GBR.
The required actions include:
• GBR-wide pest management strategies for
surveillance and quarantine. For example, to
utilise best practice pest management to create
a quarantine / containment boundary north from
Stewart River – ie at Coen/Port Stewart Road and
north from Lakeland and Rossville
• GBR-wide mining/road/infrastructure development
implemented at world class environmental
standards supported by legislative policies
• GBR-widelanduseintensificationforagriculture
and urban implemented at world class
environmental standards supported by legislative
policies
• GBR-wide integrated voluntary and regulatory
approaches to encourage adoption where
regulationfocusesonreinforcingsignificant
financialinvestmenttolandmanagementchange
• Global climate change impacts create a 15–20-
yeartimelineforachievingsignificantwaterquality
improvement. Between 2030 and 2035, the health
of the whole Great Barrier Reef and its catchment
willbeinfluencedbyclimatechange
• Global economic development paradigm is
encouraging increased human development
pressure and there is a need for greater emphasis
on environmental accounting across the whole
GBR. The northern GBR is one of the last
relatively undisturbed marine ecosystems on Earth
and we need to apply an economic value that
reflectsitsrarityandirreplaceability
Cape York Catchments to Coral Partnership
Successful implementation of the Eastern Cape
York Water Quality Improvement Plan requires a
coordinated strategic approach that engages many
individuals with technical expertise and experience
in the ongoing design and review of practical
implementation strategies. A Cape York Catchments
to Coral Partnership with a structured approach
involving the formation a management committee and
five working groups with coordination and facilitation
by appropriate, regionally-based natural resource
management organisations is recommended.
Cape York Catchments to Coral management
committee
The Cape York Catchments to Coral management
committee will have overall responsibility for
implementing the Eastern Cape York Water Quality
Improvement Plan. The five working groups would
report to the Cape York Catchments to Coral
management committee. Proposed makeup of the
committee is presented in Table 14.

Eastern Cape York Water Quality Improvement Plan
97.
Eastern Cape York Water Quality Improvement Plan
98.
Table 14: Potential members of Cape York Catchment to Coral management committee
Table 15: Working group support roles
The Cape York Catchments to Coral management
committee would provide strategic direction to the
working groups and major implementation programs
as well as the following suggested activities:
• Foster community action with a long term focus on
positive outcomes
• Annual process to synthesise science and
monitoring results which could include production
of an annual implementation report card
• Annual community celebration of success, which
could include awareness raising events such as
fielddaysandacommunityawardsprocess
• Develop strategies that encourage Queensland
and Australian Government to address the
GBR-wideandglobalissuesthatinfluence
implementation
The governance arrangements recommended to
guide and support implementation of the Eastern
Cape York Water Quality Improvement plan have
been developed with reference to the following
Reef 2050 Plan water quality action:
• WQA8 - Increase industry participation in
regional water quality improvement initiatives
and partnerships aimed at managing,
monitoring and reporting of water quality.
These should be based on existing initiatives
such as:
• Fitzroy Partnership for River Health
• Gladstone Healthy Harbour Partnership
• Mackay Whitsunday Healthy Rivers to Reef
Partnership
Cape York Catchments to Coral working groups
The Cape York Catchments to Coral Partnership will
includefiveworkinggroups:
• Urban - including rural residential, roads, ports
and shipping. All three sections but typically meet
in Cooktown (sometimes in Lockhart)
• Roads - including development and maintenance
of all public roads. All three sections but typically
meet in Cooktown
• Grazing - including gullies, farm roads and fence
lines. All three sections but typically meet in Laura
or Coen
• Agriculture - including both intensive and
extensive agriculture. Central and Southern
sections and typically meet in Lakeland or
Cooktown
• nature and Cultural Conservation - including
biodiversity research, species protection plans,
andwetland,floodplain,riverine,estuaryand
marine monitoring. All three sections but typically
meet at Silver Plains, Lockhart or Bamaga.
All of these working groups require overarching
facilitation, coordination and consistent expert technical
supportforfiremanagement,pestmanagement,road
management, gully management, economic analysis
(cost benefit) and disturbance, water quality and
ecosystem monitoring (Table 15). The aim of these
roles is to encourage consistent implementation
methodologies across the region. This will also enable
region wide reporting of successful implementation.
Stakeholder Potential organisations (presented as examples not fait accompli’)
Local NRM coordination Cape York NRM and/or SCYC representatives
Queensland Government OfficeoftheGreatBarrierReefand/orEHPrepresentatives
Australian Government GBRMPA and/or DoE representatives
Local Government Cook Shire Council, NPA Council, Hope Vale Council and Lockhart River Council representatives
Agriculture Sector QFF and/or AgForce representatives
Conservation Sector WWF and/or Wilderness Society and/or South Endeavour Trust representatives
Traditional Owner Sector Cape York Land Council and/or Balkanu representatives
Role Potential organisation
Urban Roads Grazing Agriculture nature and cultural conservation
Coordination Cape York NRM and/or SCYC
All meetings All meetings All meetings All meetings All meetings
Fire technical support
QPWS, Cape York NRM or consultant
As required As required All meetings As required All meetings
Pest technical support
CYWAFAI, DAF or consultant
All meetings As required As required As required All meetings
Road technical support
CSC, Main Roads or consultant
All meetings All meetings All meetings As required All meetings
Gully technical support
SCYC,GriffithUnior consultant
As required All meetings All meetings As required All meetings
Economic analysis technical support
DAF, CQU or consultant
Once per year Once per year Once per year Once per year Once per year
Disturbance, water quality and ecosystem monitoring technical support
SCYC and DSITI or consultant
All meetings All meetings All meetings All meetings All meetings

Eastern Cape York Water Quality Improvement Plan
99.
Eastern Cape York Water Quality Improvement Plan
100.
Working group processes
The five working groups that support the Cape York
Catchments to Coral Partnership will be facilitated
and coordinated by appropriate, regionally-based
Natural Resource Management organisations to ensure
that there is resilience in delivery processes. These
organisations will ensure that the working groups are
supported to undertake the following:
• Cross regional exchange of technical information to
support adaptive implementation (share successes
and failures and plans for future implementation)
• Water quality and ecosystem health monitoring
designs reviewed and results discussed (before
public release if practical)
• Investment priorities and methodologies for
prioritising on ground implementation reviewed and
results discussed (before public release if practical)
• Support development of technical training and
action learning to increase implementation
capability
• Support development of integrated region wide
funding applications
• Support development of communication processes,
including communication materials (such as case
studies) and communication events (such as
demonstrationdaysorfieldtours)
An example of membership and actions that will be
undertaken by the Urban Working Group follows:
Urban Working Group membership:
Cook Shire Council, Hope Vale Council, Lockhart
Council, Northern Peninsula Area Council, roads
technicalsupport,firetechnicalsupport,gullytechnical
support, monitoring technical support, pest technical
support.
Urban Working Group actions:
• Develop urban management framework that is
specifictonorthernGBR.Reviewotherurban
frameworks used in GBR (particularly Cairns and
Townsville)
• Undertake a review of current urban management
practices for all urban centers in the northern GBR
catchment
• Identify opportunities for improved management
that integrates with council implementation
priorities
• Foster an information exchange between councils
within the region and consider technical information
exchange with neighbouring regions through the
regional organisation of councils (NQRoC and
Indigenous Council RoC)
• Identify technical training opportunities for
roadsmanagement,firemanagement,gully
management, stormwater management
• Identify funding opportunities for urban
implementation that the partnership can support.
• Develop urban and peri urban communication
and awareness program that includes pest
management,firemanagement,roadandtrack
management, gully management, vegetation
management
• Identify and support implementation of
demonstration sites that will support community
awareness activities
• Integrate monitoring into demonstration sites to
quantify improvement.
• Report on implementation success and failures
Implementation costings
For most management actions a simple costing method
was used to determine a reasonable cost required to
provide the resources to achieve the sub-catchment
management action targets. For gully management
sufficientsedimentloadreductiondatawasavailableto
enable a cost effectiveness analysis to be undertaken
for sediment reduction in the Normanby Basin. The
Quantified Cost Effective Reduction Targets for the
Normanby Basin is presented after the costing summary
table as an example of quantified cost effectiveness
analysis that can be undertaken during implementation
for other significant sediment sources (suchas roads
and agriculture) as data becomes available.
The cost of the Integrated Monitoring Program is
presented in detail in Chapter 3 and in summary in Table
16. The total cost of the Integrated Monitoring Program
from 2016 – 2022 is $17.05M, which represents 10% of
the total cost of implementation of $171M for the first
seven-year implementation period (2016 to 2022).
Gully management
A strategic active gully remediation program to achieve
cost-effective erosion reduction within grazing and
nature and culture conservation land uses. The following
costings summarises costs from the Quantified Cost
Effective Reduction Target analysis presented in the
section below. These costs are estimated for the seven
years between 2016 and 2022; all other costs presented
are annual.
• Grazing exclusion of top 200 high priority gully
erosion sub-catchments; 4000kms fencing,
@$7000 per km = $28M
• Grazing exclusion and destocking of Springvale
= $2.25M
• High priority active gully remediation projects
1700ha @ $30,000/ha = $51.6M
• 6 x Gully Technical Design and Coordination
Officers=$6.3M
• LiDar and site monitoring to quantify erosion
reduction = $1.85M
These costs will be spread across the seven years with
thefirst twoyearsscalingupascapacitybuilds ($8M
year one, $12M year two and $14M per year for years
three to seven). Individual projects and sites may vary
from year to year depending on the scale of the proposed
projects and the priority of the proposed management
practices in line with the Grazing Implementation
Strategy (Appendix 15) and the Gully Prioritisation
Report (Appendix 2).
Total Cost = $90M per 7 years
Funding required = $90M per 7 years
Landholder contribution = mustering and fence
maintenance support.
Grazing management
Voluntary Incentive program to encourage adoption of
grazing best management practices (including within
propertyroad,firebreakandfencelineerosioncontrol)
within grazing and nature and culture conservation land
uses.
• 40 Projects at $30K per project on 20 properties
per year = $1.2M per year
• 3xGrazingTechnicalExtensionOfficers=$450K
per year
• Field day, workshop and communications materials
= $100K per year
• Soil mapping and soil tests for grazing
management plans = $50K per year
• Road erosion expert technical support = $50K per
year
• Landholder in kind or cash contribution to projects
$15K per project = $600K per year
The number of individual projects and landholders
may vary from year to year depending on the scale of
the proposed projects and the priority of the proposed
management practices in line with the Grazing
Implementation Strategy (Appendix 15).
Total Cost = $2.45M per year
Funding required = $1.85M per year
Landholder contribution = $600K per year

Eastern Cape York Water Quality Improvement Plan
101.
Eastern Cape York Water Quality Improvement Plan
102.
Agriculture management
Voluntary Incentive program to encourage adoption
of innovative agriculture management practices within
agriculture land uses.
• 10 Projects at $15K per project on 6 properties per
year = $150K per year
• PrecisionAgricultureTechnicalExtensionOfficer=
$150K per year
• Field day, workshop and communications materials
= $20K per year
• EM soil mapping and soil tests for nutrient
management plans = $50K per year
• Landholder in kind or cash contribution to projects
$30k per project = $300K per year
The number of individual projects and landholders
may vary from year to year depending on the scale
of the proposed projects and the priority proposed
management practices in line with the Agriculture
Implementation Strategy (Appendix 16).
Total Cost = $670K per year
Funding required = $370K per year
Landholder contribution = $300k per year
Wetland management
Voluntary Incentive program to encourage adoption of
wetland best management practices within grazing and
nature and culture conservation land uses.
• 30 projects at $30K per project on 20 properties
per year = $900K per year
• WetlandCoordinationOfficer=$150Kperyear
• Training, workshop and communications materials
= $50K per year
• Wetland monitoring expert technical advice to
support project design and wetland condition
monitoring = $200K per year
• Landholder in kind or cash contribution to projects
$15K per project = $300K per year
The number of individual projects and landholders
may vary from year to year depending on the scale of
the proposed projects and the priority of the proposed
projects for improving water quality and ecosystem
health.
Total Cost = $1.6M per year
Funding required = $1.3M per year
Landholder contribution = $300K per year
Local government road management
Road management technical capacity building program
within local government
• 1xRoadTechnicalExtensionOfficer=$150Kper
year
• Engineering design and material expenses
for three best practice road management
demonstration sites per year = $150K per year
• Training, workshop and communications materials
= $50K per year
• Council contribution to best practice road
management demonstration sites = $150K per year
The resources allocated to individual demonstration
sites may vary from year to year depending on the
resources required for thespecific roadmanagement
activity and the priority of the proposed activity for
improving water quality.
Total Cost = $500K per year
Funding required = $350K per year
Council contribution = $150K per year
Urban management
Urban water management technical capacity building
program within local government
• 2xUrbanTechnicalExtensionOfficers=$300K
per year
• Material expenses for 10 best practice urban
erosion and sediment control and storm water
demonstration sites per year = $200K per year
• Training, workshop and communications materials
= $50K per year
• Council contribution to best practice urban water
management demonstration sites = $200K per year
The resources allocated to individual demonstration
sites may vary from year to year depending on the
resourcesrequiredforthespecificurbanwaterquality
management activity and the priority of the proposed
activity for improving urban water quality.
Total Cost = $750K per year
Funding required = $550K per year
Council contribution = $200K per year
Fire management
Coordinated broad scale early-season aerial burning
and technical support for Fire Cluster Group program
to encourage adoption of appropriate burning regimes.
• 2xfulltimeFireCoordinationOfficerstocoordinate
aerial burning and on-ground activities through 4
xhalftimefiremanagersworkingacross18fire
cluster groups = $600K per year
• Material and operating expenses for broad-scale
early-season aerial burning program (plane and
helicopter time and fuel, aerial incendiaries, etc) =
$400K per year
• Cluster group meetings and communications
materials = $90K per year
• GISandmappingsupportforfiremanagement
plans = $90K per year
• Landholdercontributiontopropertyscalefire
management(firebreaks,stormburnsetc)$80K
per group = $540K per year
Theresourcesallocatedtoeachfireclustergroup/fire
warden district may vary from year to year depending
on the resources required to implement the priority
activitieswithineachproperty’sfiremanagementplan
for that year.
Total Cost = $1.72M per year
Funding required = $1.18M per year
Landholder contribution = $540K per year
Pest management
Voluntary Incentive program to encourage adoption of
best management practices.
• 30 Projects at $15K per project on 20 properties
per year = $450K per year
• Construction of 1 community wash down facility per
year = $100K per year
• Pestforumandfieldday,trainingand
communications materials = $50K per year
• Strategic pest mapping for pest management plans
= $50K per year
• Landholder in kind or cash contribution to projects
$15K per project = $300K per year
• Local Government in kind or cash contribution to
maintenance of community wash down facility per
year = $50K per year
• Local Government in kind or cash contribution to 3
xPestTechnicalExtensionOfficers=$450Kper
year

Eastern Cape York Water Quality Improvement Plan
103.
Eastern Cape York Water Quality Improvement Plan
104.
The number of individual projects and landholders
may vary from year to year depending on the scale of
the proposed projects and the priority of the proposed
projects for improving water quality and ecosystem
health.
Total Cost = $1.45M per year
Funding required = $650K per year
Landholder + Local Government contribution = $800K
per year
Adaptive management
The integrated monitoring framework described in
Chapter 3 will allow for adaptive management to be
applied to the implementation of the WQIP. Effective
improvement or maintenance of water quality in the
northern GBR requires adaptive management to
account for changing knowledge, biophysical condition,
funding, legislation and public sentiment. Monitoring
for the WQIP implementation should undertake several
functions:
• Quantify the adoption of improved management
practices;
• Determine and validate relationships between
improved management practices, water quality and
load output, as well as ecosystem health;
• Accurately measure pollutant loads delivered to the
sub-catchments, end-of-catchment gauges, and
the GBR to empirically track changes over long
periods of time (next century); and
• Investigate water quality issues of concern to the
community as part of ongoing community-driven
activities in the region.
The results of this monitoring program will feed a
growing body of knowledge regarding the most effective
land management practices to reduce pollutant loads
across the Cape York landscape. These data can
also be applied at a cross-regional, reef-wide level.
The on-going incorporation of the lessons learned
through adaptive management will ensure that WQIP
implementation remains relevant in delivering water
quality and ecosystem health improvements.
Reasonable assurance
This Water Quality Improvement Plan has been
produced using the best available information (with
consideration of time and resourcing constraints) by
experienced water quality improvement planners.
Where limitations to data exist they have been
identifiedthroughouttheplan.Severalofthedatasets,
such as the linear disturbance analysis for Normanby
and Stewart Basins (Appendix 1, Spencer et al.,
2016), gully prioritisation (Appendix 2, Brooks et al.,
2016) and the water quality data set for Normanby
Sub Basin presented in the loads report (Appendix 8,
Howley et al., 2016) and fresh water quality guidelines
(Appendix 9, Howley and Moss, 2016) are considered
to be of high reliability and represent some of the most
detailed datasets of their kind for the Great Barrier
Reef catchment. Many of the other data sets utilised
are considered to be of moderate to low reliability and
have typically been used for basin scale or marine
receiving waters scale analysis. The Science Advisory
Panel process has considered the limitations to the
data sets in the context of the recommended approach
presented in the implementation plan (Chapter 2).
The information contained in this Water Quality
Improvement Plan has been compiled in good faith
by Cape York NRM and South Cape York Catchments
from sources believed to be reliable. However, Cape
York NRM and South Cape York Catchments, their
officers,boardmembers,employeesandconsultants
do not invite reliance upon, nor accept responsibility
for, or guarantee the accuracy or completeness of the
information. Before relying on any information in this
report, the reader should make their own enquiries and
seekindependentprofessional,scientificandtechnical
advice. The reliance upon and/or use of any information
contained in this report shall be at the reader’s own risk
and no liability will be accepted for any consequences
which may arise directly or indirectly as a result.
Table 16: Estimated cost to implement the recommended management actions ($)
Theme Funding breakdown 2016/2017 2017/2018 2018/2019 2019/2020 2020/2021 2021/2022 2022/2023 Total Cost
7 yrs
Gully Management
Funding Required $8,000,000 $12,000,000 $14,000,000 $14,000,000 $14,000,000 $14,000,000 $14,000,000 $90,000,000
In Kind Contribution $0 $0 $0 $0 $0 $0 $0 $0
Total Cost $8,000,000 $12,000,000 $14,000,000 $14,000,000 $14,000,000 $14,000,000 $14,000,000 $90,000,000
Grazing Management
Funding Required $1,850,000 $1,850,000 $1,850,000 $1,850,000 $1,850,000 $1,850,000 $1,850,000 $12,950,000
In Kind Contribution $600,000 $600,000 $600,000 $600,000 $600,000 $600,000 $600,000 $4,200,000
Total Cost $2,450,000 $2,450,000 $2,450,000 $2,450,000 $2,450,000 $2,450,000 $2,450,000 $17,150,000
Agriculture Management
Funding Required $370,000 $370,000 $370,000 $370,000 $370,000 $370,000 $370,000 $2,590,000
In Kind Contribution $300,000 $300,000 $300,000 $300,000 $300,000 $300,000 $300,000 $2,100,000
Total Cost $670,000 $670,000 $670,000 $670,000 $670,000 $670,000 $670,000 $4,690,000
Wetland Management
Funding Required $1,300,000 $1,300,000 $1,300,000 $1,300,000 $1,300,000 $1,300,000 $1,300,000 $9,100,000
In Kind Contribution $300,000 $300,000 $300,000 $300,000 $300,000 $300,000 $300,000 $2,100,000
Total Cost $1,600,000 $1,600,000 $1,600,000 $1,600,000 $1,600,000 $1,600,000 $1,600,000 $11,200,000
Local Government
Road Management
Funding Required $350,000 $350,000 $350,000 $350,000 $350,000 $350,000 $350,000 $2,450,000
In Kind Contribution $150,000 $150,000 $150,000 $150,000 $150,000 $150,000 $150,000 $1,050,000
Total Cost $500,000 $500,000 $500,000 $500,000 $500,000 $500,000 $500,000 $3,500,000
Urban Management
Funding Required $550,000 $550,000 $550,000 $550,000 $550,000 $550,000 $550,000 $3,850,000
In Kind Contribution $200,000 $200,000 $200,000 $200,000 $200,000 $200,000 $200,000 $1,400,000
Total Cost $750,000 $750,000 $750,000 $750,000 $750,000 $750,000 $750,000 $5,250,000
Fire Management
Funding Required $1,180,000 $1,180,000 $1,180,000 $1,180,000 $1,180,000 $1,180,000 $1,180,000 $8,260,000
In Kind Contribution $540,000 $540,000 $540,000 $540,000 $540,000 $540,000 $540,000 $3,780,000
Total Cost $1,720,000 $1,720,000 $1,720,000 $1,720,000 $1,720,000 $1,720,000 $1,720,000 $12,040,000
Pest Management
Funding Required $650,000 $650,000 $650,000 $650,000 $650,000 $650,000 $650,000 $4,550,000
In Kind Contribution $800,000 $800,000 $800,000 $800,000 $800,000 $800,000 $800,000 $5,600,000
Total Cost $1,450,000 $1,450,000 $1,450,000 $1,450,000 $1,450,000 $1,450,000 $1,450,000 $10,150,000
Total Project Funding Required per year $14,250,000 $18,250,000 $20,250,000 $20,250,000 $20,250,000 $20,250,000 $20,250,000 $133,750,000
Total Project In Kind Contribution per year $2,890,000 $2,890,000 $2,890,000 $2,890,000 $2,890,000 $2,890,000 $2,890,000 $20,230,000
Total Project costs per year $17,140,000 $21,140,000 $23,140,000 $23,140,000 $23,140,000 $23,140,000 $23,140,000 $153,980,000
Integrated Monitoring Program $2,050,000 $2,500,000 $2,500,000 $2,500,000 $2,500,000 $2,500,000 $2,500,000 $17,050,000

Eastern Cape York Water Quality Improvement Plan
105.
Eastern Cape York Water Quality Improvement Plan
106.
Quantifiedcosteffectivereductiontargets for the normanby Basin
Fine suspended sediment loads from the Normanby
and Hann Sub Basins present the greatest water
quality risk to the northern GBR. To develop practical
and measureable targets, the percentage of end-of-
catchment anthropogenic load has been converted to
a quantity of total load that is required to be reduced at
both end-of-catchment and in priority sub-catchments.
Thefollowingtenstepswereusedtodevelopquantified
cost-effective fine suspended sediment reduction
targets for Normanby Basin:
1. Analysis of load monitoring data sets and the
extent and intensity of catchment disturbance for
the Hann and Normanby sub basins to estimate
percentageofanthropogenicfinesuspended
sediment loads at the end-of-catchment in 2015
(50% anthropogenic for Normanby sub basin and
30% anthropogenic for Hann sub basin).
2. Utilise Normanby Empirical Sediment Budget
and Source Catchments total load estimates to
convert percentage of anthropogenic load to a
quantityoftotalfinesuspendedsedimentload
(<15.7um) at the end-of-catchment (Tables 17, 18
and 19).
3. Use a 2.5x multiplier to convert the quantity of
end-of-catchmentfinesuspendedsediment
(<15.7um) load reduction to a quantity of priority
sub-catchmentfinesuspendedsediment(<63um)
load reduction. This multiplier represents the
sediment deposition processes that take place
between the priority sub-catchment and the end-
of-catchment.
4. Analyse all available data on the magnitude
of anthropogenic sediment sources in priority
catchments to determine which sediment
sources could be practically reduced to achieve
the quantity of sediment reduction required to
meet targets (Gully erosion presents as the only
major anthropogenic sediment source that has a
reasonable local data set to support a calculation
of scale and cost of management action required
to meet sediment reduction targets).
5. Analyse all available gully erosion data in priority
sub-catchments within the Normanby basin to
estimate the quantity of sediment that could
be reduced in priority sub-catchments through
practical management actions (such as cattle
exclusion and active gully remediation).
6. Estimate the cost of implementing practical
management actions (such as cattle exclusion
and active gully remediation) to achieve the
quantity of sediment reduction that is required to
meet priority sub-catchment load reductions (that
in turn result in end-of-catchment load reduction
targets being met. This can inform an analysis
of cost effectiveness of management actions in
different locations or properties.
7. Estimate the time lags between the adoption of
management actions (cattle exclusion and active
gully remediation) and resulting improvement in
priority sub-catchment and end-of-catchment
water quality. Active gully remediation has shorter
time lags (within three years), whereas grazing
exclusion has longer time lags (up to 22 years)
toachievesignificantmeasurablesediment
reductions.
8. Estimate the time lags for water quality
monitoringtodetectandconfirmchanges
at priority sub-catchment scale and end-of-
catchment scale. Approximately three years
lag at sub-catchment scale and at least seven
years lag at end-of-catchment scale, after
management is implemented (and assuming we
begin collecting Super Gauge water quality data
at sub-catchment and end-of-catchment scale
from 2016).
9. Do the calculations as a straw man to estimate
the scale and cost of practical management
actions (grazing exclusion and active gully
remediation) that could achieve the quantity of
sediment reduction at priority sub-catchment
scale that is required to meet end-of-catchment
targets. Check the result for practicality of
the scale of implementation required to meet
targets and cost effectiveness between different
locations (Table 20).
10. Refineandrepeatcalculationuntilcosteffective
sub-catchment management action targets with
practicalimplementationtimelinesaredefined.
(This process was repeated multiple times to
produce the third estimate presented in Table 20
below).
Results of the above process being undertaken to
produce a third estimate of the scale and costs of
gully erosion control management actions required to
meetfinesuspendedsedimentreductiontargetsinthe
NormanbyBasin(thefirsttwoestimateswerereviewed
by the Science Advisory Panel). This cost and load
reduction analysis is based on the best available
information on sediment load reductions from priority
gully erosion sites identified by Brooks et al., 2016
(Appendix 2).
The following conclusions are based on the estimate
presented in Table 20, of the scale and cost of gully
erosion control management actions required to meet
targets in the Normanby Basin:
• A focused investment of $90M into gully erosion
control activities from 2016 to 2022 will lay the
foundation for achieving a 60% reduction in
anthropogenicend-of-catchmentfinesuspended
sediment loads by 2037
• It is likely that the actual load reductions from
active gully remediation at sub-catchment scale
will be higher due to a complementary reduction
in bank and channel erosion
• It is likely that the actual implementation costs
of active gully remediation required to achieve
the reductions will improve as experience
and capacity improve through on ground
implementation - enabling more to be achieved
with the same investment
• A complementary investment of $43M into the
other recommended management activities
suchasgrazing,agriculture,fire,wetlandand
road management from 2016 to 2022 will ensure
that the 60% reduction in anthropogenic end-of-
catchmentfinesuspendedsedimentloadscanbe
achieved by 2037
• The complementary investment in grazing
technicalextensionofficersandfirecoordination
officersandfiremanagerswillensurethat
grazingexclusionandappropriatefireregimes
are maintained in the long term
• A further investment of $126M into gully erosion
control activities and $86M into other activities
from 2022 to 2037 will ensure that the 2037 load
reductiontargetismetandcanbeconfirmedby
sub-catchment and end-of-catchment monitoring
between 2040 and 2050
• An absolute minimum of $1.85M would be
required between 2016 and 2022 for LiDAR
andstrategicsitemonitoringtoconfirmsoilloss
improvements at small sub-catchment scale and
end-of-catchment scale
• An absolute minimum of $3.25M would be
required between 2022 and 2037 for lidar and
strategicsitemonitoringtoconfirmsoilloss
improvements at small sub-catchment scale and
end-of-catchment scale
• These investments are required to ensure that
the northern GBR has the marine water quality
that is required to maximise the resilience and
adaptation of the northern GBR to future climate
change impacts
Important notes to the conclusions above:
• There are approximately 1500 ha of alluvial and
colluvial gullies mapped using google earth in
the Normanby Basin (Appendix 2, Brooks et al.,
2016). However, LiDAR analysis has revealed

Eastern Cape York Water Quality Improvement Plan
107.
Eastern Cape York Water Quality Improvement Plan
108.
that this represents less than 15% of the actual
gullied area, indicating that the total active gully
area is likely to be at least 10,000 ha’s in the
Normanby Basin
• The Top 100 gully erosion sub-catchments are on
approximately 12 properties within the Normanby
Basin. With Springvale and Crocodile Stations
having the greatest number of the Top 100 gullies
(Appendix 2, Brooks et al., 2016). However,
once the next 100 gully erosion sub-catchments
areidentified(ie101to200),itisestimatedthat
these will be on at least 20 properties in the
Normanby Basin. When other basins (ie. Stewart
and Endeavour) are mapped it is likely that there
will be gullies from these basins within the top
200 gullies.
• Therewasinsufficientdatatoenablea
cost effectiveness analysis of road erosion
remediation works to be undertaken. However, it
is likely that there will be a range of cost-effective
road erosion remediation sites where actively
eroding roads intersect with the stream network
within the top 200 gully erosion sub-catchments
Table 17: Estimationofthequantityoffinesuspendedsediment(t/y)requiredtomeetanthropogenicloadreductiontargets for the Normanby Basin (Normanby plus Hann Sub-Basins).
Table 18: CalculationofAnthropogenicfinesuspendedsedimentloadandquantificationoftotalloadreductionbased on Normanby Empirical Sediment Budget
Table 19:CalculationofAnthropogenicfinesuspendedsedimentloadandquantificationoftotalloadreductionbased on Source Catchments 2015
Please note in Table 18, the Normanby basin sediment budget total sediment load output (<63um) has been
converted to <15.7um using a 65% factor based on estimates made from Kalpowar monitoring data.
Please note in Table 19, Source Catchments predicts <20um which is considered the same as <15.7um given
the uncertainty/error associated with the catchment modelling outputs. As a result a conversion factor was not
considered necessary to convert Source Catchments outputs to <15.7um.
Model
2015 Current ConditionEnd of CatchmentAnthropogenic finesuspended sediment (<15.7um) t/y
2022 Target End of Catchment Fine suspended sediment reduction (<15.7um) t/y
2022 TargetSub Catchment Fine suspended sediment reduction (<63um) t/y
2030 TargetEnd of Catchment Fine suspended sediment reduction (<15.7um) t/y
2030 TargetSub Catchment Fine suspended sediment reduction (<63um) t/y
2037 TargetEnd of Catchment Fine suspended sediment reduction (<15.7um) t/y
2037 TargetSub Catchment Fine suspended sediment reduction (<63um) t/y
normanby Empirical Sediment Budget
232,000 46,000 116,000 93,000 232,000 139,000 349,000
Source Catchments 2015
160,000 32,000 80,000 64,000 160,000 96,000 240,000
normanby Basin Sediment Budget tonnes per year
Total FSS (<63um) 777,000 based on Normanby Empirical Sediment Budget
Normanby Sub Basin Total FSS (<63um) 622,000 based on Normanby Empirical Sediment Budget
Hann Sub Basin Total FSS (<63um) 155,000 based on Normanby Empirical Sediment Budget
Normanby Sub Basin Anthrop FSS (<63um) 50% 311,000 50% based on Science Advisory Panel
Hann Sub Basin Anthrop FSS (<63um) 30% 46,000 30% based on Science Advisory Panel
Total Anthropogenic FSS (<63um) 46% 357,000 46% based on Science Advisory Panel
TotalAnthropogenicFSS(<15.7um) 65% 232,000 65% based on Kalpowar monitoring
20% of anthropogenic by 2022 20% 46,000 7.5 year End of Catchment reduction target
20% of anthropogenic by 2022 2.5x EoC 116,000 7.5 year Sub Catchment reduction target
40% of anthropogenic by 2030 40% 93,000 15 year End of Catchment reduction target
40% of anthropogenic by 2030 2.5x EoC 232,000 15 year Sub Catchment reduction target
60% of anthropogenic by 2037 60% 139,000 22.5 year End of Catchment reduction target
60% of anthropogenic by 2037 2.5x EoC 349,000 22.5 year Sub Catchment reduction target
SourceCatchments(2015) tonnes per year
Total FSS (<15.7um) 226,000 based on Source Catchments
Normanby Sub Basin Total FSS (<15.7um) 181,000 based on Source Catchments
Hann Sub Basin Total FSS (<15.7um) 45,000 based on Source Catchments
Normanby Sub Basin Anthrop FSS (<15.7um) 131,000 based on Source Catchments
Hann Sun Basin Anthrop FSS (<15.7um) 29,000 based on Source Catchments
TotalAnthropogenicFSS(<15.7um) 160,000 based on Source Catchments
20% of anthropogenic by 2022 20% 32,000 7.5 year End of Catchment reduction target
20% of anthropogenic by 2022 2.5x EoC 80,000 7.5 year Sub Catchment reduction target
40% of anthropogenic by 2030 40% 64,000 15 year End of Catchment reduction target
40% of anthropogenic by 2030 2.5x EoC 160,000 15 year Sub Catchment reduction target
60% of anthropogenic by 2037 60% 96,000 22.5 year End of Catchment reduction target
60% of anthropogenic by 2037 2.5x EoC 240,000 22.5 year Sub Catchment reduction target

Eastern Cape York Water Quality Improvement Plan
109.
Eastern Cape York Water Quality Improvement Plan
110.
Incorporating within property roads tracks, fence lines and firebreaks into the quantified costeffective reduction target analysis.
During the early stages of gully erosion implementation,
it is recommended to collect the information required to
undertakeaquantified cost effective reduction target
analysis that includes both active gully erosion and
active roaderosion remediation.Quantificationof the
costandwaterqualitybenefitsofactivelyremediating
withinpropertyroads,tracks,fencelinesandfirebreaks
is required. A focus on the roads, tracks, fence lines and
firebreakswithinthehighestprioritygullyerosionsub-
catchments is recommended due to the complementary
erosion reduction benefits from these high priority
locations for anthropogenic sediment sources.
As implementation progresses the allocation of
resources to gully remediation vs within property road
remediation should be reviewed periodically to ensure
that the most cost effective erosion control actions and
locations are being addressed.
Public road management and improvement is the
responsibility of local, state and federal government,
whereas within property roads are the responsibility
of the individual property owner. A voluntary incentive
program for active remediation of within property roads
shouldbeconsidered,however, theprivatebenefitof
withinpropertyroads,tracks,fencelinesandfirebreaks
should be a key factor in determining the level of
incentive provided for these activities.
Table 20: Estimate of scale and cost of management action to achieve sediment reduction targets in the Normanby
Basin(Sedimentreductionfiguresarecumulative).
ChAPTER 3: InTEGRATEDMonIToRInG PRoGRAMThe aim of this chapter is to define a strategy and
the resource requirements for the development of
an Integrated Monitoring Program to support the
implementation of the Eastern Cape York Water Quality
Improvement Plan (WQIP) and the Reef 2050 Plan.
This monitoring program will build on and dramatically
improve existing Cape York monitoring efforts and
partnerships, to collect data that can support Reef wide
reporting on the outcomes of WQIP implementation.
This is a monitoring and evaluation tool that is required
to implement the WQIP and Reef 2050 Plan. A key
aspect of a catchment monitoring program associated
with a Great Barrier Reef (GBR) WQIP is to accurately
measure pollutant loads delivered to the GBR,
and to track changes over time in relation to WQIP
implementation, land use development, and climate
variability.Thisproposedprogramwillalsosignificantly
improve monitoring of outcomes from investments
in land management change and the long-term
effectiveness of these investments. This monitoring
framework can be implemented immediately with
current knowledge (before future phases of Reef Trust
and other Reef 2050 Plan investments begin) and can
be expanded as the resources become available and
on-ground implementation progresses.
Background
The far north region of the Great Barrier Reef (northern
GBR) and its eastern Cape York catchments are
globally significant. This is a region where native
vegetation dominates the landscape and freshwater
wetlands and floodplains are still hydrologically and
ecologically connected to estuarine and marine
ecosystems. On a global index of human disturbance,
thenorthernGBRhasbeenidentifiedasoneoftheleast
disturbed marine environments on earth (Halpern et al.
2008). Surveys of water quality, seagrass meadows
and coral reef ecosystems show that the Cape York
marine environment is in better condition than much
of the rest of the GBR (Brodie et al., 2007; Fabricius
et al., 2005). At the same time, many of the eastern
Cape York catchments are experiencing continued and
accelerated development pressure that could degrade
river water quality and impact the health of the relatively
intact reefs of the northern GBR.
Despite the importance of the far northern region
to the whole of the Great Barrier Reef, the majority
of monitoring and research effort to date has been
invested in the highly disturbed central and southern
sections of the GBR. This monitoring and research
effort has shown that widespread development of the
central and southern GBR catchment for grazing and
intensive agriculture has had a negative impact on the
ecological health of the downstream seagrass and
nearshore coral reef ecosystems (Schaffelke et al.,
2013, Thompson et al., 2013, McKenzie et al., 2013).
Therehasalsobeenarecognitionthatmodificationof
the hydrological and ecological function of freshwater
wetlands, floodplains and coastal ecosystems in the
central and southern GBR catchments has reduced the
overall health of the GBR ecosystem (GBRMPA, 2014).
These cumulative and widespread (catchment wide)
disturbances have modified the natural landscape
processesandcausedsignificantnegativeecological
consequences for the central and southern GBR (such
as the decline in seagrass condition and a 50% decline
in live coral cover over a 27-year timeframe).
The eastern Cape York catchments have a relatively
smaller scale of human disturbance than the central
and southern GBR, but human disturbance is still
significantwithrealimpactsonwaterquality.European
settlement and disturbance on Cape York started with
the mining boom in the 1870’s at the Palmer River
via Cooktown, followed by other mining booms and
areas (Annan, Normanby, Starke, Stewart, Pascoe
catchments) (e.g., Lewis, 2015; Shellberg et al., 2016).
Mining lead the way toward other land use impacts and
disturbances such as cattle grazing, forest logging,
agricultural development, weed and pest invasion and
urban development.
Gully erosion control activity
Cost to implement 2016 to 2022 ($)
Fine suspended sediment (<63um) reduction by 2022 (t/y)
Cost to implement 2022 to 2030 ($)
Fine suspended sediment (<63um) reduction by 2030 (t/y)
Cost to implement 2030 to 2037 ($)
Fine suspended sediment (<63um) reduction by 2037 (t/y)
Notes:
Top 100 high priority sub-catchments grazing exclusion
14,000,000 19,000 2,800,000 58,000 2,800,000 97,000 Grazing exclusion fencing is done ASAP to enable 2037 target to be met
101-200 high priority sub-catchments grazing exclusion
14,000,000 6,000 2,800,000 18,000 2,800,000 30,000 Grazing exclusion fencing is done ASAP to enable 2037 target to be met
High priority active gully remediation (1700ha per stage)
51,600,000 26,000 51,600,000 53,000 51,600,000 79,000 Three stages of active gully remediation
Springvale grazing exclusion and destocking
2,250,000 14,000 750,000 41,000 750,000 68,000 Grazing exclusion fencing is done ASAP to enable 2037 target to be met
Technical Design and Coordination
6,300,000 3,375,000 3,375,000 Technical design and coordination supports all other activities
Lidar and site monitoring 1,850,000 1,675,000 1,675,000 Lidar and site monitoring to confirmerosionreductions
Total 90,000,000 65,000 63,000,000 170,000 63,000,000 274,000
% of Target based on Source Catchments (2015)
81% 106% 114%
% of Target based on Normanby Empirical Sediment Budget
56% 73% 79%

Eastern Cape York Water Quality Improvement Plan
111.
Eastern Cape York Water Quality Improvement Plan
112.
Cattle grazing, associated disturbances (clearing,
roads and fences, fire changes, weed invasion), and
accelerated gully erosion all impact on the majority of
the eastern Cape York catchments. The conversion of
many historic pastoral leases to nature conservation
and traditional owner land uses has not necessarily
reduced the impact of grazing on the landscape.
Unmanaged cattle remain on the land, typically at
maximum dry season carrying capacity. The eastern
Cape York catchments have large areas of sodic and
dispersive soils that became unstable when grazing
was introduced to the peninsula in the late 19th century.
As a result, large areas of gully erosion have developed
over time to become a major source of sediment to the
downstream freshwater and marine environments,
particularly in the Normanby Basin (Brooks et al., 2013)
but also others.
Linear disturbances such as dirt roads, fence line and
fire break clearings, which are largely ignored in the
central and southern GBR, are relatively more important
in the eastern Cape York catchments because they are
the primary vectors of on-going land use development
and disturbance. Road, track and fence development
divides the landscape into smaller units for more
intensive development and impacts. Roads and fences
disturb erodible tropical soils (e.g., sodic soils on
floodplains)andactaspointsourcesofsedimentwhere
they intersect with the stream network (Brooks et al.,
2013; Shellberg and Brooks, 2013). Currently, there are
tens of thousands of hectares of exposed soils along
road, track and fence networks in the eastern Cape
York catchments, which are effective point sources of
sedimentandnutrients,andcumulativelyassignificant
a source as cleared agricultural land.
The majority of the eastern Cape York catchments
have soils that are unsuitable for intensive agricultural
development. The most suitable intensive agricultural
soils, the red and brown basalt soils (Biggs and Phillip,
1995) in Lakeland, Shiptons Flat, Endeavour Valley and
McIvor Valley were cleared and partially developed for
cropping, horticulture and plantation forestry in the last
century. The major current intensive agricultural land
use is based around bananas and irrigated cropping at
Lakeland, and the Endeavour catchment. Clearing for
new large scale agricultural development for dryland
and irrigated cropping has commenced in recent years
in the Normanby basin. These new developments are
occurring on soils that are considered by some to be
marginally suitable for dryland and irrigated crops, but
which are of lower quality than the basalt soils and more
prone to erosion and sediment pollution. The expansion
of agriculture is accompanied by an increase in water
extraction and surface water impoundments in an area
where groundwater is already deemed to be over-
allocated and groundwater dependent ecosystems
(GDE’s) are threatened.
Thedirect impactsof inappropriatefire regimes, feral
animals (cattle, pigs and horses) and weeds (sicklepod,
grader grass, hymenachne etc.) are also significant
disturbances in the Cape York region. Numerous wetland
surveys have demonstrated widespread degradation of
water quality and aquatic habitat in eastern Cape York
catchments as a result of feral animal activity (Dupre
et al., 2009; Stephan and Howley, 2009). Late dry-
seasonfires,whicharefrequentineasternCapeYork,
have been shown to increase sediment loads in north
Australian rivers (Townsend and Douglas 2000, 2004).
Fire, weeds, cattle grazing, feral animals and
sedimentation from gullies and linear disturbances,
currently present the biggest threats to the ecological
health of the freshwater ecosystems and wetlands,
which are hydrologically and ecologically connected to
the estuarine and marine ecosystems of the northern
GBR. Although these aquatic ecosystems remain
functional and in relatively decent ecological condition,
the impacts from current and historic land uses on
freshwater ecosystems have been well documented
(e.g., Stephan and Howley, 2009; Doupe et al., 2009;
Howley, 2010; Brooks et al., 2013). The loss of fringing
coral reefs has also been observed over the past 25
years (Ian McCollum, Cape York Marine Advisory
Group, personal communication).
Urban, rural residential (peri-urban) and agricultural
development continue to intensify as more people
move into the Cape York region, especially in the
more populated areas of the Endeavour, McIvor, and
Annan catchments. This mixed land use development
poses an ongoing threat to water quality, seagrass
beds, and fringing and in-shore reefs (Carroll et al.,
2007; Howley et al., 2012). Compared to the rest of the
northern GBR, the fringing and in-shore reefs off the
combined Endeavour, McIvor, and Annan catchments
are particularly close and connected to sources of
pollution from land use development.
General land use development, clearing for new roads,
agriculture, urban and rural residential (peri-urban)
landuses,aswellasintensificationof landuse(such
as cleared pasture to irrigated cropping), will result in
increases in the sediment and nutrient loads entering
downstream freshwater and marine environments.
An integrated monitoring program is required for
the northern GBR that is specifically designed to
monitor water quality and pollutant loads, ecosystem
health, and management practice indicators that are
sensitive enough to detect the changes in ecosystem
condition as a result of the type, scale and intensity of
human disturbances present in the eastern Cape York
catchments.
In addition to land use pressures, coral reefs and
associated marine ecosystems are under pressure
from climate change, including ocean acidification,
coralbleachingandcrownofthornsstarfish.Reducing
anthropogenic pollution to the reef by improved land
management practices and remediation activities may
avoid or postpone a tipping point for the Reef.
Accurate monitoring of the Cape York region of the GBR should be a high priority to ensure that this region does not follow the downward trend
in ecosystem health observed in most other GBR catchments, and to ensure that the appropriate management actions are implemented to maintain or improve the current condition of this region.
Adaptive management
The integrated monitoring framework will allow
for adaptive management to be applied to the
implementation of the WQIP. Effective improvement
or maintenance of water quality in the northern GBR
requires adaptive management to account for changing
knowledge, biophysical condition, funding, legislation
and public sentiment.
Monitoring for the WQIP implementation should
undertake several functions:
• Quantify the adoption of improved management
practices;
• Determine and validate relationships between
improved management practices, water quality and
load output, as well as ecosystem health;
• Accurately measure pollutant loads delivered to
the sub-catchments, end-of-catchment gauges,
and the GBR to empirically track changes over
long periods of time (next century); and
• Investigate water quality issues of concern to the
community as part of ongoing community-driven
activities in the region.
The results of this monitoring program will feed a
growing body of knowledge regarding the most effective
land management practices to reduce pollutant loads
across the Cape York landscape. These data can
also be applied at a cross-regional, reef-wide level.
The on-going incorporation of the lessons learned
through adaptive management will ensure that WQIP
implementation remains relevant in delivering water
quality and ecosystem health improvements.

Eastern Cape York Water Quality Improvement Plan
113.
Eastern Cape York Water Quality Improvement Plan
114.
Framework for integrating monitoring
The following framework is proposed to integrate
paddock-scale, sub-catchment, catchment (end-of
river), and marine monitoring activities. This framework
should provide information to resource managers on
the effectiveness of management practices in improving
water quality and ecosystem health throughout the
eastern Cape York region. A conceptual diagram of
future monitoring is shown in Figure 25 (which is still
in draft form).
During the initial WQIP implementation phase,
changes in water quality and aquatic ecosystem
health are most likely to be detected at the paddock,
property or small sub-catchment scale. Time lags
through large catchments and biophysical systems,
time for widespread adoption of management practices
to occur, and improvements needed to the current
methods of measuring change at the end-of-catchment
scale mean that monitoring at paddock to small sub-
catchment scale is more likely to detect water quality
changes over short time frames. However, paddock
or small sub-catchment monitoring cannot confirm
thebenefitstothedownstreamriverandGBRmarine
environment, or provide accurate long-term reporting
on Reef targets. For this reason, the integrated
monitoring plan will incorporate both:
1. Short-term paddock and sub-catchment
monitoring, and
2. Long-term, rigorous, empirical monitoring at end-
of-catchment and marine monitoring locations.
Figure 25. (Draft) Conceptual diagram of future monitoring at different scales in eastern Cape York catchments
To determine change in management practices over
time, monitoring adoption of management practices
by grazing, cropping, horticultural and urban land
managers should be carried out in the region. In addition
to the adoption of management practices, monitoring
of changes in land condition and aquatic ecosystems
should be conducted to determine the relationship
between management practice and water quality.
Management practice monitoring locations should be
selected for both paddock and sub-catchment scale
trials to be conducted by independent auditors working
with landholders, agricultural industry organisations
(AgForce and Growcom), local government and other
catchment stakeholders.
To determine the relationship between water quality
and ecosystem health, water quality and ecosystem
health monitoring locations should be selected for sub-
catchment, end-of catchment and marine receiving
waters. The sub-catchment, end-of-catchment and
marine monitoring locations should be designed and
maintained to provide accurate evidence of long-term
changes in water quality and aquatic ecosystem health.
These different hierarchical levels of monitoring
(adoption of management change; monitoring of the
effects of management practices on the paddock, sub-
catchment and catchment scale; and water quality
and ecosystem health at the end-of-catchment and
marine receiving waters) are described in the following
sections and summarised in Table 21.
Monitoring adoption of management practices
Monitoring adoption of management practices should
be conducted across the drainage basins of eastern
Cape York for different land uses including: nature
conservation, Indigenous land management, cattle
grazing, cropping and horticulture, mining, forestry, peri-
urban and urban development, and road development.
Cape York NRM and South Cape York Catchments are
building on and expanding earlier outreach programs
(Reef Rescue, Cape York Sustainable Futures
(CYSF), Landcare,QDPI,GriffithUniversity)with the
grazing, cropping and horticulture industries to collect
baselinedataanddevelop industry-specificproperty-
scale management practices and improvement
processes that build from industry and international
Best Management Practice (BMP) guidelines. Field
validation of land use management and land condition
is essential to assessing BMP adoption and associated
water quality improvements through time. These data
will need to be collected at a range of spatial scales from
plots to paddocks to properties and sub-catchments.
For grazing, the key management indicators of BMP
uptake include stock numbers, grazing intensity
in different land types, animal health, pasture
condition and cover, rotational grazing, supplemental
feeding, riparian management in frontage country,
gully management, stock water management, fire
management, weed management, and road and fence
management.Acombinationofempiricalfielddataand
land manager survey data can be used to assess the
level of BMP uptake. Remote sensing (satellite data)
analysis to support grazing management is also being
explored through a partnership with the Rangelands
Alliance. These spatial analysis tools may assist with
collecting and interpreting the effectiveness of grazing
management strategies at both a property scale
and catchment scale. Evaluation of the aggregated
information should also be useful for planning delivery
of incentives and extension.
For horticulture and cropping land managers, Precision
Agriculture and automated collection of data should
be promoted through GPS-tracked harvesting and
application of nutrients and pesticides (such as residual
herbicides). Automated data collection is a priority
because it removes the limitations of paper-based
and manual record keeping. Land managers should
be encouraged to maintain real-time spatial records of
tillage, harvesting, fertiliser and pesticide applications,

Eastern Cape York Water Quality Improvement Plan
115.
Eastern Cape York Water Quality Improvement Plan
116.
and water use through adoption of GPS technology,
extension and incentive delivery. To achieve this,
significanteducationandextension resourceswill be
required during implementation to generate enough
land management data for a meaningful baseline to
be established. This extension effort should initially
focus on management areas that contain paddock,
sub-catchment and end-of-catchment monitoring sites
in the Normanby and Endeavour Basins that contain
agriculture.
Validating management practice – water quality relationships
Monitoring of the relationship between management
practices and water quality is necessary to confirm
whethermanagementpracticesidentifiedintheWQIP
will achieve the water quality improvements required to
meet targets and objectives. Some work has already
beendoneinthisarea.Significantresearchefforthas
been undertaken by Griffith University in the last 10
years to create an empirical sediment budget with local
data for the Normanby catchment (Brooks et al., 2013),
whichcanbeimprovedandupdatedwithadditionalfield
data to assess relative risks to water quality. Research
on gully best management practices has shown the
influence of different gullymanagement practices on
sediment yield from treated and untreated gullies,
road networks, and fence lines (Shellberg and Brooks,
2013). The use of rainfall simulation (Rhode, 2015)
can also help assess the relative ratios of pollutants in
run-off from different land uses (horticulture, grazing
and roads). However, the relative concentrations of
pollutantsgeneratedbyaspecificlanduseshouldbe
used along with measurements of aerial coverage, as
unit yield is not as important as yield by land use or
source type calculated within nutrient and sediment
budgets (Brooks et al., 2013).
Plot, paddock and sub-catchment scale research into
relationships between management practice and water
quality should be increased throughout the WQIP
implementation phase. The management practice
monitoring should include economic productivity
and social analysis to help refine implementation of
management practice change. Management practice
monitoring data also can be used to calibrate and
validate existing models such as “How Leaky”
to help extrapolate the results of management
practice implementation to large properties and sub-
catchments. Model extrapolation can be used as a
scenario and education tool, but should not replace a
network of empirical monitoring sites across a range of
land uses and different catchment conditions.
Paddock and property scale monitoring
At the paddock or property scale, monitoring should
be designed to measure relevant changes in land,
water and aquatic ecosystem condition related to the
implementation of management actions associated
with various land uses and land types. In addition
to environmental indicators, financial viability of the
associated business (where relevant) should also be
considered as an important indicator of successful
management change and long-term sustainability.
Grazing management
The priorities for monitoring grazing management
practice are in the Normanby, Stewart, Endeavour,
Jeannie and Pascoe river basins. Performance and
condition indicators that should be monitored at a
paddock and property scale include: ground cover (%
and type of vegetation cover); stock numbers; grazing
intensity in different land types; access to riparian
areas; cattle pad density; depth and use; stock water
management; wetland and/or riparian condition; rainfall
run-off response (via flumes and natural rainfall, or
rainfallsimulation);andfinancialviability.Wetlandand
riparian condition indicators include the number of cattle
pads, hoofprints/m2 and aquatic and riparian vegetation
condition. Appropriate methods for monitoring ground
cover, wetland and riparian areas include plot scale
surveys (Rolfe et al., 2004; Karfs et al., 2009; Shellberg
and Brooks, 2013), remotely sensed Natural Difference
Vegetation Index (NDVI), Tropical Rapid Appraisal
of Riparian Condition (TRARC), and the Cape York
Wetland Condition Assessment Methods (Howley
and Stephan, 2009). Where possible, these indicators
should be monitored using a before/after, control/
impact (BACI) study design.
Fire management
Fire management is an important aspect of land
management for most land types and land uses in the
CapeYorkregion.Wildfirescanincreasesedimentand
nutrient run-off when inappropriate fire regimes are
followed (Townsend and Douglas, 2000; 2004). The
Northern Australian Fire Information (NAFI) satellite
tracking website (http://www.firenorth.org.au/nafi3/)
providesauseful tool formonitoringfireareasburnt,
firefrequency,andtiming.However,smallfiresoflow
intensity are often not detected. Additional on-ground
monitoring indexes include fire intensity, scar height,
riparian area burn frequency, ground cover and water
quality. Existing fire management and monitoring
programs within Cape York Peninsula are numerous,
and are rapidly evolving with emerging carbon
markets. Numerous pastoral lease and Indigenous
landmanagersaremonitoringfireand its impactson
biodiversity and land productivity. Several Aboriginal
fireprogramshaveestablishedmethodsformonitoring
fireimpacts,suchastheChuulangunIPAFireResearch
Program and the Kuku Thaypan Fire Management
Research Project (Standley, 2011).
Main roads (council and state)
Erosion along unpaved main roads needs to be
monitored through an adaptive management program
both during the construction and maintenance
phases of road use, and changes over time. A range
of metrics related to erosion should be used such
as the road surface condition, road and disturbance
width, frequency and volume of inputs of material to
theroadprism,trafficvolume,implementationofroad
BMPs, the frequency of drains (V and table drains), the
connectivity of drains to creeks and waterways, the
extent of gully erosion along drains and road batters,
the erosion condition of battered slopes, grass and rock
cover along battered slopes, and condition and extent
of borrow pits related to erosion and sediment pollution.
Erosion along roads, battered slopes and drains should
be monitored using on-ground plots, permanent photo
points, terrestrial LIDAR of erosion volume, suspended
sediment concentrations of water runoff, and especially
upstream-downstream comparison of suspended
sediment concentrations at creek road crossings.
Secondary roads, tracks and fence lines on properties
The construction and maintenance of fences, roads
and tracks on station and private properties should
be monitored for sediment production and the use of
BMPs through an adaptive management program.
A representative range of roads, fences and tracks
should be monitored for erosion via on-ground plots,
permanent photo points, terrestrial LIDAR, and, where
appropriate, rainfall simulation. A range of metrics
should be used, such as the length of road or fence
of certain types, ground surface condition, soil type,
the width of road or fence clearing, slope of road,
frequency of drainage structures such as whoa boys,
surface erosion on the road or fence line, gully and rill
erosion along the road or fence line and associated
drainage outlets, frequency of fire along fence lines,
and appropriate BMPs.
Horticulture management
Horticulture management practices and effects should
be monitored in the Normanby, Endeavour and Jeannie
Basins. Horticultural monitoring should include:
area under cultivation, inner-row cover, water use,
rate of fertilizer and pesticide application, crop yield,
frequency of soil disturbance and soil compaction.

Eastern Cape York Water Quality Improvement Plan
117.
Eastern Cape York Water Quality Improvement Plan
118.
Nutrient and sediment run-off at the paddock scale can
bemonitored via the use of run-off flumes to collect
water samples as well as rainfall simulation tests. This
paddock monitoring will be complimented by efforts at
the sub-catchment scale addressed below.
Gullies
A full range of gully types needs to be monitored,
includingcolluvial(hillslope)gullies,alluvial(floodplain)
gullies, gullies along paddocks and agricultural areas,
road and fence line gullies, and gullies associated with
mines and road borrow pits. Gully area and the rate of
increase can be measured by detailed GPS surveys,
erosion plots, aerial photos from airplanes or drones,
and airborne or terrestrial LIDAR. Changes in sediment
yield over time from gully complexes (e.g., Shellberg et
al., 2013) can be used to document improvements from
implemented control measures and BMPs (Shellberg
and Brooks, 2013). Other important indicators to be
measured include grass-cover and cattle-pad density
inside and around gullies. These indices should be
measured inside and outside of fenced cattle exclusion
areas and other types of BMPs to better understand
before-after control-impact conditions.
Feral animals
Feralanimalshaveasignificantimpactonwaterquality
and aquatic habitat in wetlands and rivers. The use
of motion detecting cameras is recommended at key
wetland and river riparian sites to monitor the number of
pigs, cattle and horses. Monitoring of pugging, hooves,
riparian and aquatic vegetation and water quality
(turbidity and nutrients, plus pH and metals where acid
sulphate soils are suspected) has been conducted
at numerous south-eastern Cape York wetlands and
should be continued at these sites and instigated at
additional target management areas (Howley and
Stephan, 2009).
Urban and peri-urban (rural residential)
Pollution from both urban and peri-urban (rural
residential) sites should be monitored over time at
the site and property scale. Water quality monitoring
(sediment, nutrients, hydrocarbons, metals, etc)
and disturbance condition assessments are needed
at construction sites, cleared areas, borrow pits,
stormwater drains, industrial sites, rubbish tips,
sewerage treatment plant outfalls or septic tanks,
boat docks and other disturbances. Data at the
site or property scale should be correlated to sub-
catchment and catchment monitoring at adjacent river
sites, especially for peri-urban development and rural
residential agriculture. Previous community-based
monitoring (2002-2010) by CYMAG Env. (Howley,
2010; Howley, 2012) included monitoring of impacts
from STP outfalls, rubbish tips, and boat slipways in
the Endeavour, Annan and Normanby rivers.
Forest logging
Selective forest logging is becoming more common as
an enterprise in targeted areas on eastern Cape York
on private and Aboriginal land. Historic logging was
also more widespread. The cumulative impacts from
logging on water quality mainly come from machinery
ground disturbance and soil compaction along roads
and skid tracks. This disturbance can accelerate
water runoff and soil erosion. Monitoring water quality
impacts at the site, property, and sub-catchment scale
of forestry activities is needed. These data could be
used within an adaptive management framework to
help implement best management practices to reduce
erosion in logging areas.
Sub-catchment scale monitoring
Sub-catchment monitoring entails monitoring the
effects of land use management actions at key
downstream locations, such as long-term gauge sites
on creeks and rivers.
Nested paddock to sub-catchment case studies (BACI
or paired catchment studies)
Case studies at the sub-catchment scale are
recommended to improved knowledge of management
actions on both the paddock and sub-catchment scale.
These studies should be implemented using the BACI
design, utilizing either upstream and downstream sites
or paired sub-catchment sites. These case studies will
incorporate the paddock and sub-catchment monitoring
indicators listed above, nested with downstream
measurement of pollutant loads and water discharge
at BACI sites.
At least one focused case study should be implemented
for each of the following land uses / land management
areas:
• Gully erosion (upper Normanby catchment)
• Agriculture (Lakeland)
• Urban / peri-urban development (Endeavour Basin)
• Fire(waterqualityimpactsfromvariousfire
regimes)
• Grazing
Sub-catchment water quality monitoring
The Queensland Department of Natural Resources
(QDNR) has conducted freshwater ambient monitoring
as part of the State Wide Ambient Network at sub-
catchment gauging stations in Cape York, but the
data are fairly limited. While some physical and
chemical parameters are well represented, nutrient
and suspended sediment sampling and flood event
monitoring has been very limited in these historic data
sets (Moss and Howley, 2015). These limitations have
been addressed to some extent for the Normanby,
Endeavour and Annan Rivers through the efforts of
CYMAG Environmental, South Cape York Catchments
(SCYC) and the Laura Rangers, with both ambient
and event-based monitoring samples being collected
at a range of sites between 2002 and 2015. This
includes reoccupying the historic QDNR gauge at the
West Normanby, one of the highest sub-catchment
sediment contributors per unit area on eastern Cape
York. More recently, monitoring has been undertaken
on the Pascoe River by SCYC and local scientists with
assistance from CSIRO.
Water monitoring programs for the WQIP should build on
these existing community based monitoring programs,
which have been implemented in partnership with the
Qld government (DSITI) and CSIRO. Monitoring at
gauge sites should be expanded to include additional
eastern Cape York rivers and sub-catchment gauges.
Improvementsinfieldmethodsareneededbyinstalling
continuous turbidity dataloggers and automatic pump
samplers designed to provide continuous surrogate data
and improvesamplingacrossfloodevents (Shellberg
et al. 2016). Improving flood event data collection at
existing water gauge sites in sub-catchments should
be seen as an immediate priority.
The existing gauge and water quality monitoring
network should be expanded to include key sub-
catchmentsitesthathavebeenidentifiedaspriorities
for improved monitoring and land management,
including the following sites and others that may be
identifiedduringWQIPimplementation:
• Normanby Basin (West Normanby, Little Laura and
Hann River)
• Annan River (Oakey Creek)
• Endeavour River (Right Branch/ Hopevale)
• McIvor River
• Claudie River
The available eastern Cape York water quality data
has been used to set freshwater and estuarine ambient
and event-based Water Quality Objectives (WQOs) for
eastern Cape York rivers (Moss and Howley, 2015).
This process identified data gaps where insufficient
data were available for setting accurate water quality
guidelines for some sub-catchments or catchments.

Eastern Cape York Water Quality Improvement Plan
119.
Eastern Cape York Water Quality Improvement Plan
120.
During implementation of the WQIP, ambient and
event-based monitoring sites should be increased to
improve the accuracy of water quality guidelines for
each drainage basin. Specific data gaps identified in
the Guidelines Report include:
• Ambient water quality from north-eastern Cape
York rivers (Olive-Pascoe, Lockhart, Stewart)
• Flood event data from all Basin and sub-
catchments with the exception of the Laura-
Normanby sub-basin
• Estuarine water quality for systems other than the
Annan, Endeavour and Normanby
Monitoring of agricultural water extraction and retention
impacts
The expansion of horticulture and cropping is occurring
in the Lakeland region, as well as the Endeavour and
Jeannie Basins. The recent increase in the number of
dams in the Lakeland region, along with groundwater
extraction, has the potential to reduce downstream water
flowsintheLauraRiverandothertributaries,potentially
effecting aquatic habitat and groundwater dependent
ecosystems. Water discharge from rivers, creeks and
springs and groundwater levels in the Lakeland area
are currently being monitored by community groups
and the Qld government to assess any potential
impacts from water extraction and retention. These
monitoring projects should be continued and expanded
upon to document the effects of water extraction and
dams on downstream water quantity and quality, and to
ensurethatminimumwaterflowsforthemaintenance
of aquatic habitats are maintained.
Urban / peri-urban / harbours
Urban and peri-urban areas such as Cooktown,
Endeavour Valley, Hope Vale, Lakeland, Laura,
Rossville, and Lockhart River are associated with
both point source and diffuse water quality impacts.
As the on-going population growth and development
of rural residential and urban areas is predicted,
these areas should be carefully monitored to assess
their cumulative impacts on water quality at the sub-
catchment scale. The area of new clearing and exposed
soil, use of BMPs in development, impervious cover
area, and road/track density should be documented for
correlations with changes in downstream water quality
at the sub-catchment scale.
Mining
The downstream impacts from cumulative mining
related activities need to be monitored over time,
including the initial forest clearing, road or track
developments, tailings dams, sediment and metal
pollutionduringfloods,waterextractionanddischarge,
sewerage and waste oil disposal. The rehabilitation of
old and abandoned mines also needs to be monitored
for water quality impacts and benefits downstream
(e.g. the current dewatering and decommissioning the
Collingwood Mine on the Annan River). Priority mining
areas to be monitored at the sub-catchment scale
include existing mines at the West Normanby and
upper Annan catchments, and historic mining areas in
the Starke, Stewart, and Annan catchments.
Visitor impacts
Tourism and visitor impacts on water quality need to
be monitored and assessed at both the site-scale and
sub-catchment scale.Road and track use and traffic
is a key metric of tourism use and potential impacts
in a given sub-catchment. Existing and new weed
incursions into visitor areas and remote destinations
needs to be monitored and managed. For example,
recreational pig hunting via quad bikes in remote areas
can spread weeds and promote erosion along tracks
and wetlands. Targeted tourism surveys can provide
information on visitor numbers and activities, will help
to focus management needs, and can help reduce
visitor impacts on land and water quality.
Catchment scale monitoring
Land use intensity and disturbance mapping
The systematic mapping of land use and human
disturbance should be conducted annually across
the eastern Cape York catchments. A multi-metric
disturbance index of human land use needs to be
developed to properly identify the spatial and temporal
scale of human impacts to water quality. Land use
(area of grazing, horticulture/cropping, roads, rural
residential, mining, forestry, conservation) and land
disturbance (gullies, fire scars, pests and weeds,
vegetation cover, roads, tracks, fence lines, borrow
pits, bare ground, agricultural tillage, construction
sites, human dwellings, industrial sites) need to
be monitored over time. High-resolution satellite
imagery can be used for both property management
and catchment wide assessments. Satellite imagery
canbeusedeffectivelyforthemappingoffire(NAFI),
vegetation cover (NDVI), land clearing and forestry
(Landsat), road, track and fence density (SPOT
imagery), rural residential and urban development,
and mining activities. However, these data must be
validated with accurate ground surveys of existing
condition, and the resolution of disturbance mapping
must be increased (for example, the use of Landsat
data (30m resolution) within the Statewide Landcover
and Trees Study (SLATS) program is not accurate
enough to detect many of the land use disturbances
occurring on Cape York). Into the future, more
detailed disturbance indices should be conducted
with LiDAR topographic surveys and multispectral
imaging. The land use/disturbance mapping with
LIDAR should be analysed in conjunction with fine
resolution soil mapping (1:25,000 for gully prone
lands, cropping and urban lands and 1:100,000 for
grazing lands) to identify areas within properties that
represent higher risk to water quality and to support
the spatial prioritisation of investments into improved
management practices.
End-of-catchment water quality monitoring: The Super
Gauge approach
Improved end-of-catchment water quality monitoring is
essential to measure real trends in loads of sediment,
nutrients and other pollutants discharged to the
northern Great Barrier Reef from eastern Cape York
catchments. In order to detect both short-term and
long-term changes associated with changing land
use and land management, end-of-catchment water
quality and discharge monitoring programs should be
designed as per the Super Gauge approach detailed
in Shellberg et al. (2016). Super gauges incorporate
internationalstandardsoffieldandlaboratoryprotocols
for monitoring river pollutant loads and provide the
accuracy needed to detect real changes in water
quality over time.
The basic principles of the Super Gauge include:
• Continuous monitoring of water discharge, turbidity
and other WQ indicators,
• Improved measurement of water discharge in tidal
channels (end-of-catchment sites) using ‘velocity
index’ methods,
• Automated samplers to collect nutrient and
suspended sediment concentration (SSC) samples
duringfloodevents(turbiditythresholdsamplers),
• Collection of isokinetic width- and depth-integrated
nutrient and suspended sediment samples to
establish average concentrations across the river
channel, to correlate to and correct point samples,
• Analysis of water quality data over time using high-
accuracy event-scale data, shifts in rating curve
behaviour, and comparison of event loads to actual
catchmentconditionmetricstodefinecatchment
responses to input variables.
A pilot Super Gauge end-of-catchment monitoring
project commenced in the Annan River estuary in
2015, in addition to event monitoring projects at the
Pascoe River and Normanby Rivers. These projects

Eastern Cape York Water Quality Improvement Plan
121.
Eastern Cape York Water Quality Improvement Plan
122.
were implemented by SCYC in partnership with CSIRO
and DSITI and will be expanded upon in 2016. For
example, continuous water quality dataloggers have
been installed in the Normanby and Pascoe River
mouths for the 2016 wet season.
It is recommended that a total of 5 to 10 end-of-
catchment water quality monitoring and gauge sites
be established or brought up to Super Gauge status
for Eastern Cape York. Recommended river mouth
sites include the Pascoe, Claudie, Stewart, Normanby,
Kennedy, McIvor, Endeavour and Annan Rivers
(Shellberg et al., 2016).
Catchment modelling
Improved empirical sediment and nutrient loads data
collected through the end-of-catchment monitoring
projects can also be used to calibrate models used
for scenario analysis and to extrapolate empirical load
data of pollutants discharged to the GBR from eastern
Cape York rivers. Catchment models such as Source
Catchments and the Griffith University Sediment
Budget for Normanby Basin can be used to help assess
the cumulative effects of management practice change
at the end-of-catchments and at selected sites within
catchments. Catchment models can be used to aid
long-term prediction of water quality improvements at
larger catchment scale through scenario development.
However, theoretical sediment and nutrient budget
models cannot replace accurate, long-term empirical
data collection at end-of-catchment locations that are
essential to detecting real and actual change. All model
predictions should be treated as potential scenario
outcomesthatcanonlybeverifiedwithempiricaldata
over the long-term.
Validate freshwater and marine water quality – ecosystem health relationships
The goal of the Eastern Cape York WQIP is to improve
or maintain good water quality to support healthy
freshwater wetlands, rivers, estuaries and marine
environments, and to sustain the diversity of plant
and animal life (including human) that depend upon
these habitats. Monitoring of freshwater, estuarine
and marine ecosystems is necessary to validate the
relationships between water quality and ecosystem
health, and thus to ensure that land management
actions are achieving the end goal of maintaining
healthy ecosystems. Some monitoring of water quality
and ecosystem health has already occurred across
eastern Cape York. However, for the majority of
government-funded land management projects, there
hasbeennomonitoringofthedownstreambenefits(or
lack there-of) to water quality and ecosystem health.
Additional monitoring of the effects of sediments and
nutrients on freshwater and marine ecosystems is
needed to measure the success of land management
actions and to ensure that the targets developed in the
WQIP are appropriate. Since much of the eastern Cape
York freshwater and marine environment is considered
to be in High Ecological Value (HEV) condition, the
monitoring of aquatic ecosystems is also necessary to
provide an early warning of changes resulting from the
intensificationoflandusewhichiscurrentlyoccurring
in some catchments.
Detailed freshwater ecosystem health monitoring
is required for the Olive-Pascoe, Claudie, Stewart,
Normanby and Endeavour Basins. Marine water quality
and ecosystem health should be monitored along
a gradient from the estuaries of each of the major
catchments in these basins to open coastal waters.
Freshwater aquatic ecosystems
Some ecosystem health studies have already been
conducted in eastern Cape York, providing a baseline
condition and methodology for further studies.
Targeted freshwater wetland condition assessments,
biodiversity surveys and long-term wetland monitoring
projects have been implemented in the Normanby
and Annan catchments by Traditional Owner ranger
groups, South Cape York Catchments, the Cape York
Marine Advisory Group, Qld Department of Primary
Industries (DPI), Qld Parks and Wildlife (QPW) and
private landholders such as the South Endeavour
Trust. Specific methods for assessing the condition
of Cape York freshwater wetlands and monitoring
changes in response to management actions have
been developed and utilised across the region (Howley
and Stephan 2009; adapted for I-tracker by NAILSMA
in 2014). The ongoing utilisation of these methods will
assist with the long term assessment of wetland water
quality and ecosystem health and provide a tool for
reporting on the effectiveness of management actions
for improving wetlands health.
As a component of the current WQIP program, James
CookUniversitystaffcarriedoutadetailedstudyonfish
community condition in relation to wetland condition
and water quality in the Violet Vale wetland complex
(Ebner et al., 2015). Similarly, the wetlands and springs
of the eastern Kimba Plateau have been surveyed for
theirwetlandandfishbiodiversityandwaterqualityin
relation to the establishment of the new Olkola National
Park (CYPAL) (Carroll and Coates, 2015; Shellberg
et al., 2015). A ‘Bush Blitz’ biodiversity program on
Olkola Country also greatly added to this knowledge
of aquatic ecosystems. In addition, a rapid assessment
of water quality and ecological health indicators in
eastern Cape York rivers undertaken by DSITI as part
of a Q-Catchments assessment of Cape York River
Basins in 2014 and 2015.
In addition to the water quality monitoring detailed
in the sub-catchment and catchment sections,
recommendations for monitoring freshwater aquatic
ecosystems include the following:
• Baseline studies of wetland condition, aquatic
biodiversity and water quality for High Ecological
Value (HEV) aquatic ecosystems downstream
from grazing and horticultural land, or subject to
other water quality threats such as recurring hot
fires,roaderosionandweedsandferalanimals.
Previouslyidentified(unsurveyed)wetlandsites
include Polly’s Lake and Pelican Lake in Rinyirru
National Park, and Christmas Lake at Kings Plains
Station.Otherwetlandsiteswillbeidentified
through an assessment of the HEV aquatic
ecosystems and a land disturbance and threats
analysis*.
• Continued monitoring of wetland condition and
water quality at sites where land management
actions have already been implemented or are
proposed. Existing monitoring sites include:
• Keatings Lagoon- feral animal fencing project
(Annan River Basin)
• Pooles Lagoon- weed management site (Annan
river Basin),
• Jack Lakes- site of cattle impacts, weed
exclusion zone and CYPAL joint management
strategies (Normanby Basin),
• Wetland monitoring by the Lama Lama rangers
and SCYC including before and after feral animal
exclusion fencing (Normanby and Stewart Basin),
• Monitoring of wetland condition and water
quality in Rinyirru NP in response to on-going
feral animal and weed management programs
(Normanby Basin),
• Muck river wetlands (Cape Melville NP; Jeannie
Basin)- on-going weed and feral animal
management,
• Spring and creek monitoring of groundwater
dependent ecosystems (GDE) around Lakeland
(Normanby Basin).
• Measurements of river channel and wetland
in-fillingbysedimentstodocumenttherateof
in-filling(andassociatedlossofhabitat)resulting
from upstream accelerated erosion.
• Monitoring the response of iconic, keystone,
rare and/or culturally important species such as
freshwaterturtle,sawfish,freshwatermusselsand

Eastern Cape York Water Quality Improvement Plan
123.
Eastern Cape York Water Quality Improvement Plan
124.
barramundi in disturbed river and wetland systems.
Monitoringofculturallysignificantfreshwater
mussels which have been declining in the Annan
River is being undertaken by the Yuku Baja Muliku
rangers. This monitoring will help to document the
response of such species to elevated sediment
and nutrient concentrations, feral animals and
harvest impacts of human activity, as well as
identify priority refuge areas for implementing
management actions to maintain healthy habitat.
*A detailed freshwater wetland strategy is being
developed separately as part of the WQIP.
Marine monitoring
Marine Monitoring in the Cape York NRM region
currently includes ambient marine water quality
monitoring by AIMS, Princess Charlotte Bay flood
plume monitoring under the GBR Marine Monitoring
Program (2012-2015), coral condition surveys by AIMS
and QPW Marine Parks rangers, seagrass monitoring
by local scientists and Traditional Owner groups
(Archer Point and Starcke River mouth) and by James
Cook University (JCU) for the GBR Marine Monitoring
Program (Flinders Isles, Bathurst Bay, Flinders Isles,
Piper Reef, Shelbourne Bay). Mangrove surveys have
been conducted by the Rinyirru Land Trust rangers
and Mangrove-Watch (JCU) at Princess Charlotte Bay.
Many of these efforts are summarised in Coppo et al.,
2016 (Appendix 7).
Existing marine monitoring programs should be
maintained, however new sites need to be added to
establish baseline condition and monitor long-term
changes in marine ecosystem condition in response
to changes in land management. The mapping and
monitoringoftheareasofinfluenceofriverfloodplumes
will be used to identify priority marine ecosystem
monitoring sites.
Priorities for the eastern Cape York marine monitoring
program based on proximity to river mouths and end-of
catchment monitoring sites:
• Marine Water Quality monitoring:
• New marine ambient and event water quality
monitoring transects should be established
to investigate water quality gradients from
the mouth of the Pascoe, Claudie, Stewart,
Normanby, Endeavour and Annan Rivers to the
outer reefs. Monitoring sites should coincide with
seagrass and coral reef monitoring sites.
• CoralReefs(listedwithriversofinfluence):
• Fringing and inshore coral reefs adjacent to river
systemsandreeffishpopulations,
• Dawson, Egret & Boulder Reefs (Annan/
Endeavour Rivers),
• Conical Rock (McIvor River),
• Clack Reef & Flinders Isles reefs (Normanby
River/PCB),
• Hannah, Wilke, etc. (Stewart River/ northern
PCB),
• Farnorthernreefstobeidentified.
• Seagrass meadows in the following areas/within
theinfluenceofthefollowingrivers:
• Walker Bay (Annan River)- monitoring conducted
by CYMAG (2005-2009),
• Endeavour estuary- seasonal monitoring
conducted by CYMAG (2005-2009),
• Starke River- existing baseline mapping by
Juunjuwarra rangers (2013-2014),
• Bathurst Bay- current MMP site (Muck River),
• Stanley Island (Flinders Isles)- current MMP site
(Normanby Basin),
• Corbett Reef seagrass meadows– (Normanby
Basinareaofinfluence),
• Piper Reef/Palmer Islands (north of Pascoe
River)- current MMP site,
• Yum Yum (Pascoe River)- monitoring by
Traditional Owners,
• Shelbourne Bay- current MMP.
• Crown-of-thornsstarfish(COTS):
• Continue current monitoring of COTS on reefs
in south-eastern Cape York region and Princess
Charlotte Bay,
• Increased control efforts in source areas of
COTS outbreaks,
• Improved research into the correlation between
local river nutrient output (Normanby, Jeannie,
Endeavour Basins) and COTS outbreaks in the
Cape York region.
• Flood plumes:
• Satellitemonitoringoffloodplumeareaof
influence–Annan/Endeavour,McIvor,Jeannie,
Normanby, Stewart and Olive-Pascoe.
• Shipping
• Ship frequency,
• Ship sediment re-suspension plumes (Coast
Watch),
• Case studies near shipping channel-
• Sediment deposition on reefs,
• Turbidity dataloggers,
• Coral condition

Eastern Cape York Water Quality Improvement Plan
125.
Eastern Cape York Water Quality Improvement Plan
126.
Table 21: Summary of Paddock, Sub-catchment, Catchment and Marine Monitoring Requirements
Scale Land Use / Management Monitoring Details / IndicatorsPaddock Grazing Ground Cover (% veg)
• BACI plots • Plot scale • NDVI
Stocking Rate in riparian zone
Financial viability
Wetland/ Riparian condition • Cattle pads • Number of hooves/m2• TRARC/CY Wetland Condition Assessment
Rainfall-run off response
Fire • Fire frequency (NAFI)• Fire timing/intensity (NAFI)• Scar height • Riparian burn frequency and other metrics • Ground cover • Nested water quality monitoring
Roads/tracks/fences BMP uptake• Fence and road location• Type of maintenance appropriate to road/fence type
Number of whoaboys and other BMPs
Plot: • Rill density • Erosion score
Gully/rills per kilometre of road or fence
Clearing width
Traffic
Slope and erosion threat
Rainfall-runoff response
Terrestrial LIDAR monitoring of erosion rates
Gullies Measure area and rate of increase (GPS, aerial photos, LiDAR)
Grass cover inside and out
Cattle track density inside and out
Horticulture Rainfall-runoff studies
Gauging of run-off:• Flumes
Nutrient concentration and suspended sediments
Inner row cover
Compaction tests
Area under cultivation
Rate of fertilizer and pesticide application
Water use
Crop yield
Feral Animals Pugging/ vegetation ground cover in wetland & riparian zones
Number of pigs, cows & horses• Camera traps
Water Quality • Turbidity
Sub-Catchment
Urban/ Peri-urban Nutrients and sediment run-off
Storm water runoff: • sediment• nutrients• hydrocarbons• trash• solvents
Area of clearing, extent of BMPs used in development, area of exposed soil
Road/track density
Impervious cover area
Dump/sewage treatment plant/Industrial development • Storm water run-off
Mining and Logging Monitor downstream water quality impacts of development and rehabilitation in conjunction with BMP implementation.
Water Quality Expand existing gauge network • Normanby • Annan (Oaky Creek) • Endeavour (Right Branch) • McIvor• Claudie
WQ monitoring • Turbidity threshold sampling (refrigerated pump sampler) • Community/Ranger WQ monitoring – not volunteer.• Ambient&flood
Water Quantity ContinueandexpandwaterflowmonitoringinLakelandregion
Fire NAFI–ExtentandtimingoffiresOther indicators to be advised.
Vegetation Cover NDVI and other satellite metrics
Roads/tracks/fences density SPOT imagery at high resolution
Horticulture Area
Grazing Area
Visitors Impacts: • Fire• Weeds- number of new incursions• Tracks and off-road use• Roadtraffic
Use targeted tourism surveys
Catchment Water Quality Super gauges at end of-catchment estuary sites. 5 – 10 key sites at river mouths: Pascoe, Claudie, Stewart, Normanby, Kennedy, McIvor, Endeavour and Annan Rivers

Eastern Cape York Water Quality Improvement Plan
127.
Eastern Cape York Water Quality Improvement Plan
128.
Freshwater Aquatic Ecosystems
Grazing, Fire, Feral animals and weeds, gully erosion
Baseline studies of wetland condition, aquatic biodiversity and water quality• HEV sites including Polly and Pelican Lake, Christmas Lagoon, others tobeidentified
• Wetland condition assessments as per Cape York Wetland Condition Assessment methods (Howley and Stephan 2010)
• Indicators to be monitored are site dependentContinue existing wetland monitoring projects• Keatings Lagoon- feral animal fencing project (Annan River Basin)• Pooles Lagoon- weed management site (Annan river Basin)• Jack Lakes- site of cattle impacts, weed exclusion zone and CYPAL
joint management strategies (Normanby Basin)• Wetland monitoring by the Lama Lama rangers and SCYC including
before and after feral animal exclusion fencing (Normanby and Stewart Basin)
• Monitoring of wetland condition and water quality in Rinyirru Natl Park in response to on-going feral animal and weed management programs (Normanby Basin)
• Muck river wetlands (Cape Melville NP; Jeannie Basin)- on-going weed and feral animal management
• Spring and creek monitoring of groundwater dependent ecosystems (GDE) around Lakeland (Normanby Basin).
NewSitesformonitoringtobeidentifiedbasedonimplementationoflandmanagement actions
Grazing,fire,roads,gullyerosion
Rateofriverchannelandwetlandin-fillingbysediments
All land uses Iconic, keystone, rare and/or culturally important species populations (such asfreshwaterturtle,sawfishandbarramundi)indisturbedriverandwetlandsystems.
Marine/Coastal
Coral reefs Coral Indicators:• Live coral • Algal cover • Fish
Monitor reefs in close proximity to rivers –• Dawson, Egret & Boulder – Annan/ Endeavour • Conical Rock – McIvor • Flinders (fringing) • Endeavour (fringing) • Clack • Stewart reefs
NorthernCapeYorkreefstobeidentified
Seagrass meadows Monitor meadows in close proximity to rivers: • Walker Bay (Annan) • Endeavour River mouth • Starke River mouth • Bathurst Bay • Flinders Islands • Pascoe• Claudie
Crown-of-Thorns Expand current monitoring, control measures, and research into relationships to local river nutrient outputs
Flood plumes Satellitemonitoringoffloodplumes:• Jeannie• Annan/Endeavour• Normanby• Olive/Pascoe• McIvor• Stewart
Shipping Ship Frequency Sediment resuspension plumes monitoring Case studies: • Sediment deposition on reefs • Turbidity loggers • Coral condition
Cost of implementing the Integrated Monitoring Program
The monitoring implementation budget should be split
into the four essential core monitoring scales with
approximately a quarter of the total budget allocated
to each section:
1. Paddock Scale Monitoring (25% of total budget)
2. Sub-catchment Scale Monitoring (25% of total
budget)
3. Catchment Scale Monitoring (Super Gauges)
(25% of total budget)
4. Ecosystem Health Monitoring (25% of total
budget)
Costs to implement the recommended monitoring
programwillberefinedinearly2016.Table22provides
a preliminary estimate of costs.
Table 22: Estimated Eastern Cape York Integrated Monitoring Program Costs
*in addition to paddock/property scale monitoring which will be incorporated in sub-catchment Case Studies.
Program Component Initial year program development, setup and equipment costs
On-going annual costs
Potential Organisations Involved
Monitor adoption of management practices
$50,000 $175,000 Cape York NRM / Landcare, QDPI, Rangelands Alliance, Agforce, Growcom, Independent Auditors
Paddock and Property Scale Monitoring
$150,000 $550,000 Land owners, Cape York NRM, SCYC, GU, CSIRO, Cook Shire Council (CSC)
Sub-Catchment Scale monitoring
Land Management Case Studies $50,000* $250,000* Land owners, Cape York NRM, SCYC, GU, CSIRO, CSC
Water quality monitoring at 10 gauge sites
$750,000 $250,000 DSITI, CSIRO, SCYC, Traditional Owner Ranger groups and local scientists
Catchment Scale Land Use Disturbance Index and mapping
$250,000 $125,000 GU, DSITI, CYNRM, SCYC
End-of-Catchment Water Quality Monitoring “Super gauge” sites (7)
$700,000 $250,000 DSITI, CSIRO, SCYC, Traditional Owner Ranger groups and local scientists
Aquatic Ecosystem Health
Freshwater Aquatic Ecosystems $50,000 $300,000 Landowners, SCYC, QPW, JCU, Traditional Owner Corporations and Ranger groups
Marine Ecosystems $50,000 $450,000 SCYC, AIMS, JCU, Traditional Owner Corporations and Ranger groups
Review and Annual Reporting
$100,000 Cape York NRM and SCYC
Total Costs $2,050,000/ first year
$2,500,000/ annum Totalcostoverfirst7years=17.05million

Eastern Cape York Water Quality Improvement Plan
129.
Eastern Cape York Water Quality Improvement Plan
130.
ChAPTER 4: BACKGRoUnD To WATER QUALITY IMPRoVEMEnT PLAnnInG In ThE GBRWater quality determines the suitability of water for
several purposes and is essential to our social and
economic well-being, and ecological health. Water
supports people, agriculture, animals and plants,
and is central to the health of the whole ecosystem
as it connects places, processes and species. The
protection and improvement of water quality sustains
economic and social activities and ensures ecological
health for present and future generations. However, it is
nowwidelyrecognisedthatthequalityofwaterflowing
into the Great Barrier Reef (GBR) lagoon from the land
has deteriorated dramatically over the past 150 years.
These changes can be detected using historic data
such as coral coring and geochemical records.
A great deal of effort has been made by governments
and the community to enhance water quality in the
GBR, primarily through catchment management. The
Queensland and Australian Government’s Reef Water
Quality Protection Plan (Reef Plan) initially established
in 2003 and revised in 2009 and 2013, provides the
foundation for this effort. Reef Plan 2013 states that
its long term goal is to ensure that by 2020 the quality
of water entering the reef from broadscale land use
has no detrimental effect on the health and resilience
of the Great Barrier Reef.” The Plan includes the
deliverable of ‘a Water Quality Improvement Planning
process (aligned with Healthy Waters Management
Plan guideline under the Environment Protection Policy
Water) to consider Reef Plan’s long term goal and use
of consistent modelling information to set regional and
sub-regional water quality and management action
targets that align with Reef Plan’.
In October 2014, the Australian Government’s Reef
Programme committed to funding a Water Quality
Improvement Plan (WQIP) for the eastern Cape York
catchments. This process builds on previous efforts
to prepare the Catchment Normanby Water Quality
Management Plan for the Normanby Basin (Howley et
al., 2014).
The Normanby Catchment Water Quality Management
Plan presented a solid technical foundation for
the production of an Eastern Cape York Water
Quality Improvement Plan for the Great Barrier Reef
catchments within Cape York region. It presented
currentconditionofwaterqualityand identificationof
management actions to improve water quality in the
Normanby Basin. It also presents draft environmental
values for reaches within the Normanby Basin. The
Eastern Cape York Water Quality Improvement Plan
builds from these efforts.
Purpose of a Water Quality Improvement Plan
A WQIP is designed to identify the main threats impacting
waterways and the coastal and marine environment
from land-based activities, and to identify and prioritise
management actions that will protect, halt or reverse the
trend of declining water quality within a region.
Morespecifically,theEasternCapeYorkWaterQuality
Improvement Plan provides a framework to:
• Describe the current state of water quality and
identify water quality threats in the region.
• Identify the priority water quality and ecosystem
health threats for the region, in terms of:
• Current water quality values highlighting those
that are in decline or at risk, and key pollutant
drivers, spatially and by sector;
• Desired water quality environmental and use
values that the community aspires to protect/
enhance;
• Estimate the implications and costs of intervention
options:
• Identify key pollutants to be reduced and key
sources (sectoral and practices);
• Estimate annual pollutant delivery at end-of-
catchment (and where available, sub-catchment
scale), progressing to estimates of loss to
catchment waterways and groundwater as
Boulder Reef, off Cooktown, northern Great Barrier Reef (Photo: Jessie Price)

Eastern Cape York Water Quality Improvement Plan
131.
Eastern Cape York Water Quality Improvement Plan
132.
information becomes available;
• Develop pollutant reduction targets to maintain
the desired in-stream, coastal and marine values
of the region; and
• As information becomes available, map the risk
of off-site pollution at the smallest practical scale,
and estimate and map as applicable production
efficiency(yield/inputs)andpollutionintensity
(unit production/pollution e.g. Fine suspended
sediment and dissolved inorganic nutrients).
• Defineregionalend-of-catchmentpollutant
reduction targets to maintain the coastal and
marine values of the region.
• Definewaterwaysofgreatestecologicalvalue
in the region, and establish priority areas for
protection, restoration, maintenance or adaptation
of the ecological function and health of these
areas.
• Estimate and clearly document the effectiveness
of current management interventions.
• Develop and compare abatement costs for
intervention options to protect desired values.
• Develop an implementation strategy in
consultation with government, industry and
community groups for managing water quality in
the region and achieving the proposed targets,
throughidentificationofmanagementpractices
and projects that can be adopted to meet targets
and objectives in the most cost effective manner.
This will guide strategic investment for addressing
water quality threats to both fresh water and the
Great Barrier Reef in the region for the next 5 to 10
years. Strategies for long term planning consistent
with the Reef 2050 Long Term Sustainability Plan
are also incorporated.
• Develop and agree with stakeholders on a robust,
adaptive, relevant and transparent monitoring,
evaluation and reporting and review framework
for progress at all scales to ensure public
accountability and community support for long
term re-investment in water quality protection, by
cost effective interventions.
Legislative framework for WQIP development
WQIPs and Healthy Waters Management Plans
The GBR Water Quality Improvement Plans are
prepared consistent with the Framework for Marine
and Estuarine Water Quality Protection (2002), and
apply the framework described in the National Water
Quality Management Strategy (NWQMS, 2000). In
Queensland, this is linked through the Environmental
Protection Act 1994 which is the main legislation for
water quality in freshwater, estuarine and marine areas,
and includes the Environmental Protection (Water)
Policy 2009 (EPP Water) and the Environmental
Protection Regulation 2008 (EPR, 2008).
The Environmental Protection (Water) Policy 2009
(EPP Water) seeks to achieve the object of the
Environmental Protection Act 1994 in relation to
Queensland waters—to protect Queensland’s waters
while allowing for development that is ecologically
sustainable. Queensland waters include water in
rivers, streams, wetlands, lakes, aquifers, estuaries
and coastal areas.
This purpose is achieved within a framework that
includes:
• identifying environmental values (EVs) for aquatic
ecosystems, human uses/values (e.g. water for
drinking, farm supply, agriculture, industry, cultural
and spiritual values and recreational use)
• determining water quality guidelines (WQGs) and
water quality objectives (WQOs) to enhance or
protect the environmental values.
The EPP Water process to identify EVs and to
determine WQGs and WQOs is based on relevant
national guidance including the National Water
Quality Management Strategy (NWQMS, 2000),
Implementation Guidelines (1998) , the Australian and
New Zealand Guidelines for Fresh and Marine Water
Quality (2000) , and the Framework for Marine and
Estuarine Water Quality Protection (2002). Additional
Queensland guidelines and fact sheets have been
prepared and are available from the EHP website. A
summary of the process is shown below.
Section 24 of the EPP Water establishes Healthy
Waters Management Plans (HWMPs) as a key planning
mechanism to improve the quality of Queensland
waters.
Key matters to be addressed in a HWMP include
identifying:
• waters to which the plan applies
• issues affecting water dependent ecosystems,
drinkingwaterandnaturalflows
• waterway uses and values (otherwise known as
‘Environmental Values’ and abbreviated as ‘EVs’)
• management goals and Water Quality Objectives
(WQOs)toprotectidentifiedEVs
• ways to protect the environmental values for the
water
• ways to monitor and assess the effectiveness of
the protection.
In catchments draining to the GBR, regional NRM
bodies and Councils (in consultation with EHP) have
prepared WQIPs under the Australian Government’s
Coastal Catchments Initiative (2006-2009). EHP
worked with WQIP project teams to ensure that the
EVs and WQOs were established consistent with
the Environmental Protection (Water) Policy 2009
requirements.
Where Water Quality Improvement Plans adequately
address matters specified under the EPP Water for
HWMPs, they may be accredited as HWMPs. In April
2015 EHP publicly released a Guideline on HWMPs
(emailed to NRM CEOs), which provides more
information on the scope and process recommended
for HWMPs. The HWMP guidelines are available from
the EHP website at http://www.ehp.qld.gov.au/water/
policy/water_quality_improvement_plans.html.
It is important to note that this process was not
completed for the Cape York region prior to the
commencement of the current WQIP project, and
that Environmental Values (EVs) and Water Quality
Objectives (WQOs) developed under the Queensland
legislation have either been scheduled or are in review
for every other GBR NRM region. This process requires
substantial community consultation, and was therefore
a necessary starting point for the Eastern Cape York
Water Quality Improvement Plan.
State Planning Policy State Interest - water quality
• Seeks to ensure that development is planned,
designed, constructed and operated to protect
the environmental values of Queensland waters.
(available from http://www.statedevelopment.qld.
gov.au/about-planning/state-planning-policy.html)
• Requires consideration of the construction and
operational phases for proposed development
assessed under the Sustainable Planning Act
2009, for areas generally greater than 2500m2.
Activities including building and construction on
lots smaller than this threshold must minimise
impact under the general environmental duty
provisions of the Environmental Protection Act
1994.
• Requires reductions in the loads known to
be generated as a result of urbanisation, by
percentagesspecifiedfortherelevantclimatic
regionacrossQueensland,asidentifiedonthe
SPP interactive mapping system (‘Cape York/
FNQ’) for key pollutants of TSS, TN, TP and
gross pollutants.’ The SPP interactive Mapping
System is at http://www.statedevelopment.qld.
gov.au/planning/state-planning-instruments/spp-
interactive-mapping-system.html.
• Allows for local governments to adopt alternative,
locally appropriate, solutions to stormwater
management in their planning schemes.

Eastern Cape York Water Quality Improvement Plan
133.
Eastern Cape York Water Quality Improvement Plan
134.
This component of the Water Quality Improvement
Plan is led by Queensland Government Department
of Environment and Heritage Protection. Staff inputs
to the Eastern Cape York Water Quality Improvement
Plan are summarised below. The work parallels
consultation activities undertaken by Cape York NRM
and South Cape York Catchments (SCYC) with local
stakeholders in response to timelines established for
theWQIP project. The standard process for defining
Environmental Values in Queensland is presented in
Figure 26.
The project team has reviewed GIS and other data
sources on waterway uses/values as an input to the
development of draft Environmental Values (EV’s)
mapping (discussed below). Table 23 presents a
summary of main datasets. These serve as a cross
correlation to the local level stakeholder consultations
undertaken by Cape York NRM and SCYC.
Environmental Values definitions are presented in
Table 24 and a summary of draft Environmental Values
formajorsub-catchmentsdefinedbyCapeYorkNRM
and SCYC are presented in Table 25.
Table 23. GIS Datasets analysed in draft Environmental Values mapping.
Dataset/source Informs output
Qld land use mapping project (QLUMP) InformsidentificationofallEVs mapped
Remnant vegetation mapping /imagery (Qld Govt)
Identifiesareaspreviouslyclearedforhumanactivities
mapped
Historic land use - Hooper, C (2009) North Queensland
Deserted Towns: Torres Strait - Cape York, pp39-47
Identifieslocationsofhistorictowns,miningareasandairfields
mapped
Regional plan Identifiesintendedplanning/landusethroughoutCY region (including areas for conservation)
mapped
Cadastral (leasehold, grazing entitlements, freehold, etc.)
Assists in locating properties permitted to water stock, other purposes.
mapped
Maritime Services Qld – boat ramps/jetties
Recreation, human consumer Interpreted for recreation
Beachsafe Identifieslevelofbeachsafetyforrecreation(swimming etc.)
Interpreted for recreation
Maritime Safety ports limits Identifiesextentofportboundaries(industrialuse) mapped
Qld government enterprise protected estates
National parks and other protected estate designations
mapped
National parks etc. local maps/plans (from QPWS website)
Provide information on facilities and recreation opportunities in NPs
Interpreted for recreation
Qld government point source discharge database, Wastewater tracking and electronic reporting system (WaTERS)
Identify any large scale point source dischargers, licenced under legislation – sewage treatment, mines
Interpreted for discharges
SIR database (Qld Govt) Various EVs including industrial use, grazing Interpreted for EVs
Aquatic conservation assessments (EHP) Aquatic ecosystem current condition (naturalness aquatic and catchment, other criteria)
Reviewed and mapped
Other technical report sources various
ChAPTER 5: EnVIRonMEnTAL VALUES
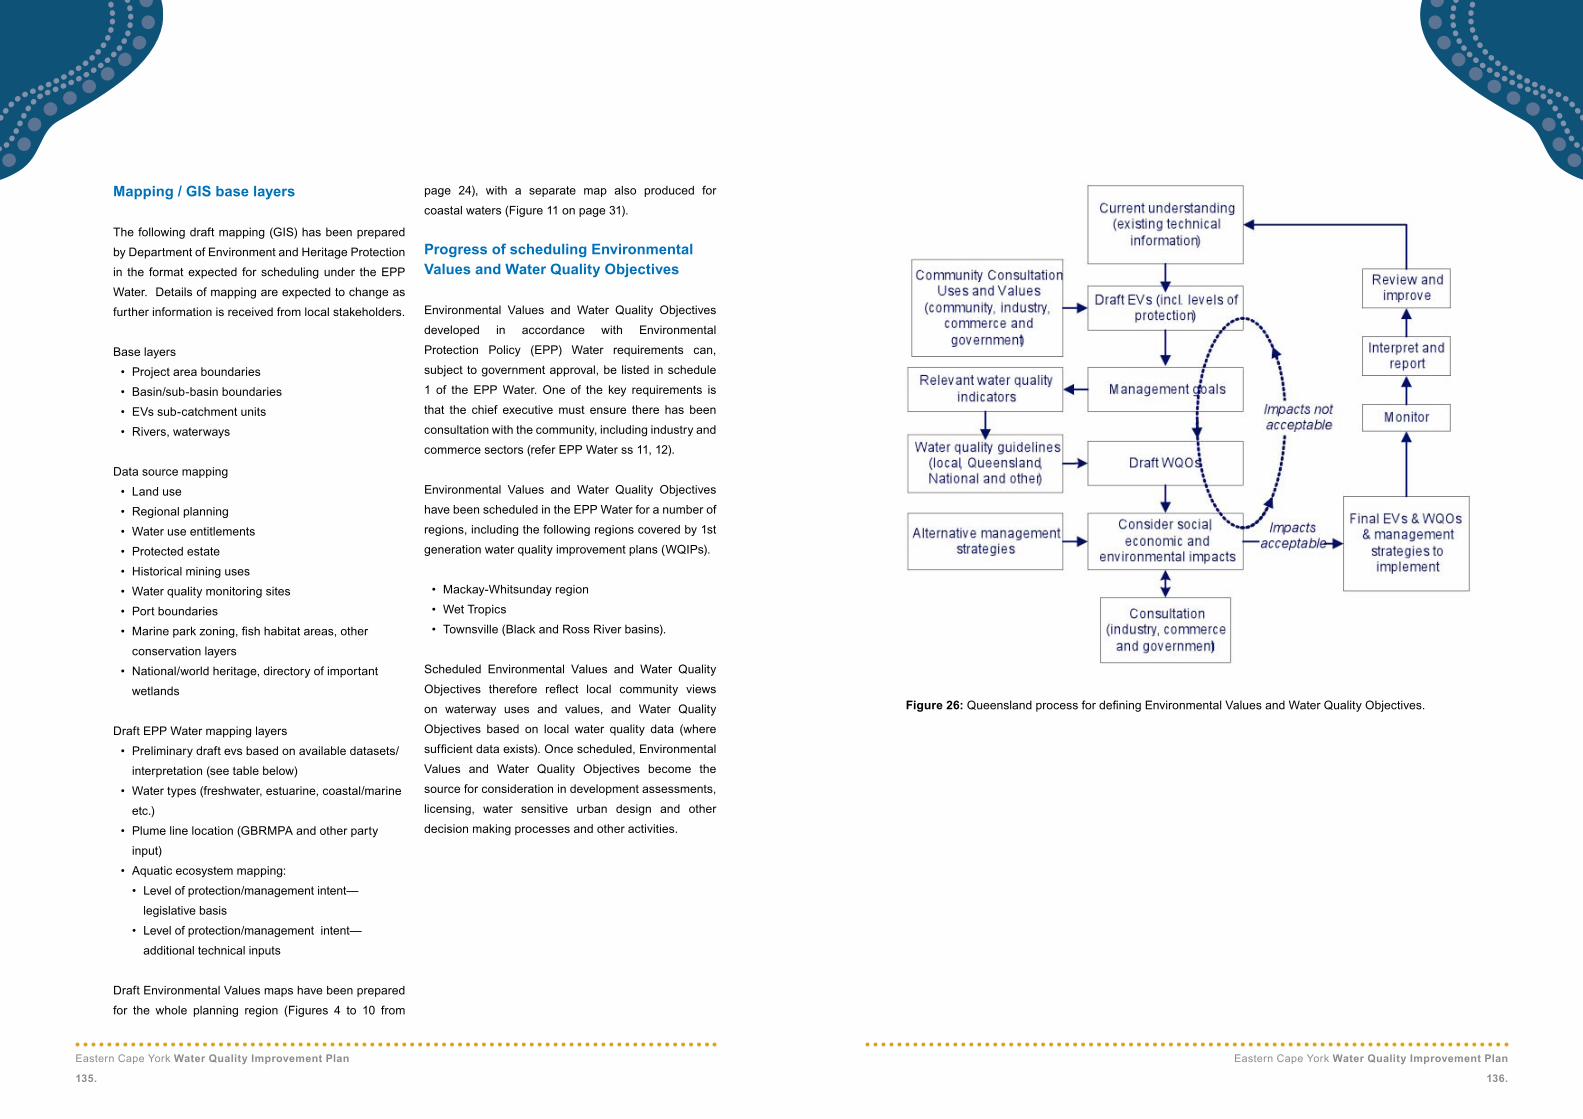
Eastern Cape York Water Quality Improvement Plan
135.
Eastern Cape York Water Quality Improvement Plan
136.
Mapping / GIS base layers
The following draft mapping (GIS) has been prepared
by Department of Environment and Heritage Protection
in the format expected for scheduling under the EPP
Water. Details of mapping are expected to change as
further information is received from local stakeholders.
Base layers
• Project area boundaries
• Basin/sub-basin boundaries
• EVs sub-catchment units
• Rivers, waterways
Data source mapping
• Land use
• Regional planning
• Water use entitlements
• Protected estate
• Historical mining uses
• Water quality monitoring sites
• Port boundaries
• Marineparkzoning,fishhabitatareas,other
conservation layers
• National/world heritage, directory of important
wetlands
Draft EPP Water mapping layers
• Preliminary draft evs based on available datasets/
interpretation (see table below)
• Water types (freshwater, estuarine, coastal/marine
etc.)
• Plume line location (GBRMPA and other party
input)
• Aquatic ecosystem mapping:
• Level of protection/management intent—
legislative basis
• Level of protection/management intent—
additional technical inputs
Draft Environmental Values maps have been prepared
for the whole planning region (Figures 4 to 10 from
page 24), with a separate map also produced for
coastal waters (Figure 11 on page 31).
Progress of scheduling Environmental Values and Water Quality objectives
Environmental Values and Water Quality Objectives
developed in accordance with Environmental
Protection Policy (EPP) Water requirements can,
subject to government approval, be listed in schedule
1 of the EPP Water. One of the key requirements is
that the chief executive must ensure there has been
consultation with the community, including industry and
commerce sectors (refer EPP Water ss 11, 12).
Environmental Values and Water Quality Objectives
have been scheduled in the EPP Water for a number of
regions, including the following regions covered by 1st
generation water quality improvement plans (WQIPs).
• Mackay-Whitsunday region
• Wet Tropics
• Townsville (Black and Ross River basins).
Scheduled Environmental Values and Water Quality
Objectives therefore reflect local community views
on waterway uses and values, and Water Quality
Objectives based on local water quality data (where
sufficientdataexists).Oncescheduled,Environmental
Values and Water Quality Objectives become the
source for consideration in development assessments,
licensing, water sensitive urban design and other
decision making processes and other activities.
Figure 26: QueenslandprocessfordefiningEnvironmentalValuesandWaterQualityObjectives.

Eastern Cape York Water Quality Improvement Plan
137.
Eastern Cape York Water Quality Improvement Plan
138.
Table 24:DefinitionsofEnvironmentalValuesusedintheEasternCapeYorkWaterQualityImprovementPlan
DefinitionsofEnvironmentalValues
Aquatic ecosystem
‘A community of organisms living within or adjacent to water, including riparian or foreshore area.’ (EPP (Water), schedule 2 - Dictionary)
The intrinsic value of aquatic ecosystems, habitat and wildlife in waterways and riparian areas, for example, biodiversity, ecological interactions, plants, animals, key species (such as turtles, platypus, seagrass and dugongs) and their habitat, food and drinking water.
Waterways include perennial and intermittent surface waters, groundwaters, tidal and non-tidal waters, lakes, storages, reservoirs,dams,wetlands,swamps,marshes,lagoons,canals,naturalandartificialchannelsandthebedandbanksofwaterways.
(This EV incorporates the ‘wildlife habitat’ EV used in the South East Queensland Regional Water Quality Management Strategy). See below for more details on aquatic ecosystems, based on the EPP (Water).
high ecological/conservation value waters
‘Watersinwhichthebiologicalintegrityofthewateriseffectivelyunmodifiedorhighlyvalued.’(EPP(Water),schedule2).
Slightly disturbed waters
‘Watersthathavethebiologicalintegrityofhighecologicalvaluewaterswithslightlymodifiedphysicalorchemicalindicatorsbuteffectivelyunmodifiedbiologicalindicators.’(EPP(Water),schedule2).
Moderately disturbed waters
‘Waters in which the biological integrity of the water is adversely affected by human activity to a relatively small but measurable degree.’ (EPP (Water), schedule 2).
highly disturbed waters
‘Watersthataresignificantlydegradedbyhumanactivityandhavelowerecologicalvaluethanhighecologicalvaluewaters or slightly or moderately disturbed waters.’ (EPP (Water), schedule 2).
Seagrass (goal within the aquatic ecosystem EV)
Maintenance or rehabilitation of seagrass habitat. (Applies only to tidal waterways.)
Irrigation
Suitability of water supply for irrigation, for example, irrigation of crops, pastures, parks, gardens and recreational areas.
Farm water supply/use
Suitability of domestic farm water supply, other than drinking water. For example, water used for laundry and produce preparation.
Stock watering
Suitability of water supply for production of healthy livestock.
Aquaculture
Healthofaquaculturespeciesandhumansconsumingaquaticfoods(suchasfish,molluscsandcrustaceans)fromcommercial ventures.
human consumers of aquatic foods
Healthofhumansconsumingaquaticfoods,suchasfish,crustaceansandshellfishfromnaturalwaterways.NotethatinsomeareasoysteringisamorespecificgoalidentifiedunderthehumanconsumerEV(seebelow).
DefinitionsofEnvironmentalValues
oystering (goal within the EV of human consumers of aquatic foods)
Health of humans consuming oysters from natural waterways and commercial ventures. (Applies only to tidal waterways.)
Primary recreation
Health of humans during recreation which involves direct contact and a high probability of water being swallowed, for example,swimming,surfing,windsurfing,divingandwater-skiing.
Primary recreational use, of water, means full body contact with the water, including, for example, diving, swimming, surfing,waterskiingandwindsurfing.(EPP(Water),s.6).
Secondary recreation
Health of humans during recreation which involves indirect contact and a low probability of water being swallowed, for example,wading,boating,rowingandfishing.
Secondary recreational use, of water, means contact other than full body contact with the water, including, for example, boatingandfishing.(EPP(Water),s.6).
Visual recreation
Amenity of waterways for recreation which does not involve any contact with water—for example, walking and picnicking adjacent to a waterway.
Visual recreational use, of a water, means viewing the water without contact with it. (EPP (Water), s. 6).
Drinking water supply
Suitability of raw drinking water supply. This assumes minimal treatment of water is required, for example, coarse screening and/or disinfection.
Industrial use
Suitability of water supply for industrial use, for example, food, beverage, paper, petroleum and power industries, mining andmineralsrefining/processing.Industriesusuallytreatwatersuppliestomeettheirneeds.
Cultural and spiritual values
Indigenous and non-indigenous cultural heritage, for example:• custodial, spiritual, cultural and traditional heritage, hunting, gathering and ritual responsibilities• symbols, landmarks and icons (such as waterways, turtles and frogs)
• lifestyles(suchasagricultureandfishing).Culturalandspiritualvalues,ofwater,meansitsaesthetic,historical,scientific,socialorothersignificance,tothepresentgeneration or past or future generations. (EPP (Water), s. 6).

Eastern Cape York Water Quality Improvement Plan
139.
Eastern Cape York Water Quality Improvement Plan
140.
Table 25: Draft Environmental Values of major sub-catchments of eastern Cape York
ChAPTER 6: CoMMUnITY AnD SCIEnCE ConSULTATIon PRoCESSThe planning team
The planning team involved a partnership between South Cape York Catchments and Cape York NRM and the
main people involved are shown in Table 26 below.
Table 26: South Cape York Catchments and Cape York NRM planning team.
Consultation for the Cape York region
Many planning processes within Cape York region
have attempted to consult with local people to gather
the information that is required to support the planning
purpose. The low population, spread across a large
geographical scale, and difficulty of access, has led
to inadequate processes for many consultations.
Traditional Owners, graziers and farmers have
expressed their concerns about the lack of adequate
consultation when plans are published claiming that
they have undertaken a rigorous consultation process.
For example, “these people come for a meeting to talk
about water, we told them lots of things, we never saw
them again, they steal our thoughts” (P. Port, pers.
comm. 2014).
The rationale behind good community consultation in
this project is that the planning region is vast and little is
known about large stretches of it. The land managers
(graziers, farmers, Traditional Owners, Queensland
Parks and Wildlife Service and other rangers) know
their land and know what is happening on it. Because
the planning region is so large, there is a real need
for prioritisation. The prioritisation process needs to
consider the available information on land disturbance,
freshwater and marine environment condition, and land
managers’ knowledge.
When working with people over an extended consultation
process, there is a need for give and take. The process
was designed to ensure that the land managers would
receive something of value in exchange for the critical
information required for the plan. The process also
utilisedafield-basedinteractionbetweentheplanners
and the land managers. Within Cape York region these
‘on-Country’ consultations provide the best possible
planning results. Table 27 describes this critical
information and the planning products they support.
Draft Environmental Values for major sub-catchments of eastern Cape York HEV = high ecological value, SD = slightly disturbed, SMD = slightly/moderately disturbed, H = high use, M = medium use, L = low use
Basin Sub-catchment
Aqua
tic
ecos
yste
m
Irrig
atio
n
Stoc
k wat
er
Farm
use
Aqua
cultu
re
Hum
an
cons
umpt
ion
Prim
ary
recr
eatio
n
Seco
ndar
y re
crea
tion
Visu
al ap
prec
iatio
n
Drin
king
wate
r
Indu
stria
l
Cultu
ral
valu
e
Jacky Jacky Jacky Jacky Creek HEV - - - - H M H H - - HEscape River HEV - - - L H - M M - - HHarmer Creek HEV - - - - M - L M - - H
Olive Glennie Creek HEV - M - - L - - L - - MKangaroo River HEV - - - - M - M M - - HOlive River HEV - M - - M - H M - - H
Pascoe Garraway Creek HEV - L - - M M - M - - HYam Creek HEV - L - - M - - M - - MHann Creek HEV - L - - L - - L - - MPascoe River HEV - L L - M - M M - - H
Lockhart Wilson Creek HEV - - - - M - M H - - HClaudie River HEV - - - - M - H H - - HScrubby Creek HEV - - - - L - - L - - MLockhart River HEV - - - - M - M M - - HNesbit River HEV - - - - M - L L - - HChester River HEV - - - - M - L L - - M
Stewart Massey Creek SD - H - - M M M M - - HBreakfast Creek SD - H - - M - H M - - HStation Creek HEV - M - - L - - M L - MStewart River SD - - - - M - H M M - HBalclutha Creek HEV - - - - M - L M - - HRunning Creek HEV - - - - M - M M - - H
Hann Annie River SD - M - - M - H H - - MHann River HEV - L - - M - L M L - MNorth Kennedy River HEV - M - - M - H H - - M
Normanby Bizant River HEV - - - - M - H H - - MKennedy River HEV - M - - M - L M L - MMosman River HEV - M - - M - - M - - MDeighton River HEV - M - - M - - L - - HLaura River SMD M H M - M M M H L - MNormanby River SMD - H - - H - H H - - H
Jeannie Muck River HEV - - - - M - L M - - MHowick River HEV - - - - M - M M - - MJeannie River HEV - - - - M - - M - - MStarke River SD - - - - M - - M - - MMcIvor River SD L M L - M - M M L - M
Endeavour Isabella Creek SD L M L - M M L M L - HEndeavour North Branch SD - M L - M L L H L L MEndeavour South Branch HEV L L L - L - - L L - MEndeavour Right Arm HEV - L L - M - - M L - HEndeavour River SMD M M M - M - H H L L HOakey Creek SMD - M L - L - - L L - MTrevethan Creek HEV - M - - L M - H L - HAnnan River SD - M - L M H H H M - H
name Role in WQIP development
Will Higham Project leader
Jason Carroll Community consultation and implementation plan
Jessie Price Community consultation and science synthesis
Christina Howley Foundation monitoring and water quality synthesis
Jeff Shellberg Foundation research and science advisor
Samantha Hobbs Community Consultation
Sue Marsh Community Consultation
Michael Goddard Community Consultation
Desmond Tayley Community Consultation
Lyndal Scobell Communications Support
Kym Dungey GIS Support

Eastern Cape York Water Quality Improvement Plan
141.
Eastern Cape York Water Quality Improvement Plan
142.
Table 27: Critical information from land managers for Eastern Cape York Water Quality Improvement Plan
planning products
Table 28: Stages in the community consultation process
Table 29: Community consultation in each basin
Please Note: Implementation indicates areas where further consultation is required in 2016 during implementation.
In exchange for providing critical information to the
Eastern Cape York Water Quality Improvement Plan,
Water Asset Summaries were produced for the land
managers (Table 30). The summaries reproduce the
information provided by the land manager in a short
report for use in seeking investment in their own
projects.Thiswillnotonlybenefit the landmanagers,
but also ensure increased ownership and use of the
whole Eastern Cape York Water Quality Improvement
Plan and improve the chances of implementation
action uptake. The Water Asset Summaries also
supportcommunicationofthefinalEasternCapeYork
Water Quality Improvement Plan. It is expected that
implementation of this plan will result in the production
of many more Water Asset Summaries that represent
priority actions identified by the people ofCapeYork
that align with Reef 2050 Plan targets and outcomes.
The communication process with grazing and agriculture
land managers resulted in detailed implementation plans
for agriculture and grazing (including gully management)
that address the Reef 2050 Plan sediment reduction
targets (Chapters 4 and 5). These implementation plans
should be periodically reviewed and updated as part of
an adaptive implementation strategy (see Chapter 2).
The three-stage process outlined in Table 28
was developed to efficiently and effectively build
relationships with land managers, collect the required
critical information and present the Eastern Cape York
Water Quality Improvement Plan products. The timing
of the delivery of the process in each basin is presented
in Table 29. While every attempt was made to engage
consistently across the entire planning area, there are
some parts of the planning region that require targeted
engagement during implementation to ensure that the
Eastern Cape York Water Quality Improvement Plan
represents the people of Cape York.
Critical Information from Land Managers WQIP Planning Products Supported
Most valued water assets (wetlands, creeks, rivers, estuarine/coastal zones)
Environmental Values
Use/s of water assets (industry, urban, recreation) Environmental Values
Threats to water assets Catchment Land use Threats and Pressures
Management actions that could be implemented to improve land management and restore or preserve water assets
Management Actions and Management Practice Frameworks
Management actions previously implemented and their success rate
Management Actions and Management Practice Frameworks
Community Consultation Process
Stage 1: Meet land managers and explain consultation process and how informs the Eastern Cape York Water Quality Improvement Plan. Collect information about water assets, threats and pressures and management actions.
Stage 2: Present draft Environmental Values for comment & correction. Ground-truth Walking the Landscape results and the agriculture and grazing implementation strategies.
Stage 3:PresentfinaldraftofEastern Cape York Water Quality Improvement Plan, Water Asset Summaries and agriculture and grazing implementation plans for comment & correction.
Basin Area Stage 1 Stage 2 Stage 3
Jacky Jacky North May 2015 September 2015 February 2016
South Implementation Implementation Implementation
Olive Olive River Implementation Implementation Implementation
Pascoe Pascoe River May 2015 Implementation Implementation
Lockhart North May 2015 December 2015 February 2016
South Implementation Implementation Implementation
Stewart East December 2014 May 2015 February 2016
West December 2014 May 2015 February 2016
Normanby North December 2014 May 2015 February 2016
Central August 2015 November 2015 February 2016
East April 2015 November 2015 February 2016
West August2015 November 2015 February 2016
Jeannie North Implementation Implementation Implementation
South August 2015 December 2015 February 2016
Endeavour Endeavour River August 2015 November 2015 February 2016
Annan River November 2015 December 2015 February 2016

Eastern Cape York Water Quality Improvement Plan
143.
Eastern Cape York Water Quality Improvement Plan
144.
Table 30: Water Asset Summaries produced for each drainage basin
Walking the Landscape
A series of Walking the Landscape workshops provided
the base resolution for describing ecosystem function
and Environmental Values for the Eastern Cape York
Water Quality Improvement Plan. These workshops
combinedthebestavailablescientificexpertknowledge
and analysis with all available region-wide catchment
dataandscientificstudiestodescribethehydrological
processes and attributes across all sub-catchments of
the eastern Cape York basins, as well as the natural
terrain attributes, ecological attributes, landscape
modifications and any water quality or sedimentation
issues. The Walking the Landscape process is a
recognisedmethodfordefiningGroundwaterDependent
Ecosystems under the National Water Management
Framework. Completing the Groundwater Dependent
Ecosystems analysis during the early stages of
implementation is recommended.
This process has provided the Eastern Cape York Water
Quality Improvement Plan with a base layer of information
for analysing risks to water quality, environmental values
andwater types,atafine levelofdetail.TheEastern
CapeYorkWaterQualityImprovementPlanisthefirst
Water Quality Improvement Plan in the Great Barrier
Reef Catchment to use the fine-scaled Walking the
LandscapeProcessasthefirststagetosystematically
analyse risks to water quality, environmental values and
water types.
Twoworkshopswereheldoverfivedaystotal,covering
the seven basins of the Eastern Cape York Water
Quality Improvement Plan.
The landscape process and knowledge experts involved
were:
• Graham herbert, Hydrogeologist, Department of
Natural Resources and Mines
• Glynis orr, Hydrologist, Department of Natural
Resources and Mines
• Vince Manley, Hydrographer, Department of
Natural Resources and Mines
• neale Searle, Hydrographer, Department of
Natural Resources and Mines
• Eda Addicott, Botanist, Queensland Herbarium
• Bruce Wannan, Ecologist, Department of
Environment and Heritage Protection
• Donna Audas, Catchment Scientist, Great Barrier
Reef Marine Park Authority
• Paul Groves, Catchment Modeller, Great Barrier
Reef Marine Park Authority
• Jeff Shellburg, Hydrologist
• Christina howley, Water Quality Scientist
• Andrew hartwig, NRM Specialist, Landcare
Australia
• Jason Carroll, Freshwater Ecologist, South Cape
York Catchments
• Sue Marsh, NRM Specialist, South Cape York
Catchments
• Mike Ronin, Wetlands Specialist, Department of
Environment and Heritage Protection (facilitator)
Following The Walking the Landscape workshops,
Andrew Brooks and John Spencer met with Mike Ronin
toincorporateGriffithUniversity’sspatialinformationfor
Normanby and Stewart Basins.
Science synthesis
The development of the Eastern Cape York Water
Quality Improvement Plan involved synthesis of all
available scientific data with scientific expert opinion
to create knowledge that was applied to the task of
designing the implementation plan.
To ensure that the planning process utilised best
available science a Science Advisory Panel was
established (Table 31).
The primary role of this group was to provide technical
input to the planning process and review planning
products with meetings held as follows:
• october 2014: Two day establishment meeting
• May 2015: Eastern Cape York Water Quality
Improvement Plan progress update and input to
community consultation and WQIP process
• June 2015: Eastern Cape York Water Quality
Improvement Plan progress update and input
to EV’s, Walking the Landscape and Science
Synthesis workshop
• August 2015: Science Synthesis workshop
• September 2015: Eastern Cape York Water
Quality Improvement Plan progress update
• December 2015: Review supporting studies
• January 2016: Review supporting studies
• February 2016: Review Water Quality Targets and
commentsonfirstdraftplan
• March 2016: Review Water Quality Targets and
commentsonfirstdraftplan
Anumberofspecificstudieshavealsosupported the
development of the plan and are available from South
Cape York Catchments or Cape York NRM (Table 32).
The timelines for producing draft supporting studies was
designed to provide analysed data to feed into a major
synthesis event—a three-day synthesis workshop held
in Cooktown between the 10th and 12th of August 2015.
The August synthesis workshop brought together the
key science and technical advisors to the Eastern Cape
York Water Quality Improvement Plan.
The workshop and subsequent Science Advisory Panel
meetings used science coordination and facilitation
Drainage Basin Catchment Water Asset Summary
Jacky Jacky Jacky Jacky Creek Jacky Jacky Creek
Jacky Jacky Creek Lake Bronto and Lake Wicheura
Escape River In 2016
Olive Olive River In 2016
Pascoe Pascoe River In 2016
Lockhart Claudie Claudie River and Wetlands
Lockhart River In 2016
Stewart Lower Stewart Lower Stewart
Breakfast Creek
Scrubby Lagoon
Upper Station Ck
Hann Kennedy Grazing Case Study
Annie River Violetvale Case study
Normanby Normanby The Soak
Normanby Kings Lake
Lakeland In 2016
Jeannie Starke River Woo Yee Wetland
Cape Flattery In 2016
McIvor In 2016
Endeavour Endeavour River Endeavour River
Annan River Annan River
Annan River Keatings Lagoon Case Study

Eastern Cape York Water Quality Improvement Plan
145.
Eastern Cape York Water Quality Improvement Plan
146.
techniques to:
• Build consensus on the assets values and threats
for Cape York
• Identify indicators to measure success of the water
quality improvement plan
• Setting targets and objectives for improvement in
line with Reef 2050 Plan, and
• Begin the development of a method for scoring
the current state of the catchment with ideas for
successful communication.
The scientific knowledge generated through these
process has been incorporated into this plan as well as
thefinalversionsofthesupportingstudies.
During implementation of the Eastern Cape York Water
Quality Improvement Plan it is recommended that
an annual science synthesis event be conducted to
synthesise the latest information and support ongoing
adaptive management.
Table 31: Members of the Science Advisory Panel
Table 32: Summary of the supporting studies used to assist Cape York NRM and South Cape York Catchments in
the development of the Eastern Cape York WQIP.
Member Department/org. Field of expertise
Chella Goldwin / Kevin Gale
Australian Government Australian Government
Christina Howley Howley Consulting Water Quality and aquatic ecosystems
Andrew Moss Department of Science, Information Technology and Innovation
Water Quality
Dane Moulton Department of Environment and Heritage Protection
EPP Water
Carol Honchin Great Barrier Reef Marine Park Authority Marine Water Quality Guidelines
Donna Audas Great Barrier Reef Marine Park Authority Freshwater Ecosystems
Mike Ronan Department of Environment and Heritage Protection
Freshwater Ecosystems
Andrew Brooks GriffithUniversity Catchment hydrology and sediment research sediment research
Jeff Shellberg Private Consultant Catchment hydrology, water quality and sediment research
John Armor / Dave Waters / Gillian McCloskey
Department of Natural Resources and Mines Catchment Modelling
Jon Brodie James Cook University Marine Water Quality
Glen Holmes Private Consultant Marine Ecologist
Supporting study Delivery Partner / Consultant
Authors Chapter # / Appendix #
Current understanding - Waterway uses/aquatic ecosystem valuesBackground to Water Quality Improvement Planning
TropWater, JCU, Cape York NRM
Jane Waterhouse, Will Higham Chapter 4
Environmental Values Department of Environment and Heritage Protection, SCYC, Cape York NRM
Dane Moulton, David Thames (GIS), Jess Price, Will Higham
Chapter 5
Community and Science Consultation Cape York NRM, SCYC Will Higham, Jess Price Chapter 6
Land use change TropWATER, JCU Stephen Lewis Appendix 3
Economic values of coastal and marine ecosystems
TropWATER, JCU Collette Thomas, Jon Brodie Appendix 12
‘Walking the Landscape’ - Documenting knowledge of system function and process understanding
Department of Environment and Heritage Protection
Mike Ronan, Julia Stevenson-Lyon
Appendix 14
Water quality guidelines and targets
Super Guage approach - Annan River water quality synthesis
Consultant, Howley Environmental, SCYC
Jeff Shellberg, Christina Howley, Jason Carroll
Appendix 4
Coastal and Marine Water Quality Guidelines
GBRMPA Carol Honchin Appendix 5
Synthesis of marine water quality Howley Environmental Christina Howley Appendix 6
Synthesis of coastal and marine ecosystem condition
TropWATER, JCU Caroline Coppo, Len McKenzie, Jon Brodie
Appendix 7
Synthesis of Catchment Loads Howley Environmental Christina Howley Appendix 8
Fresh and Estuarine Water Quality Guidelines
Howley Environmental Christina Howley, Andrew Moss
Appendix 9
Implementation and management options
Integrated Monitoring Program Howley Environmental, Cape York NRM, SCYC, Consultant
Christina Howley, Will Higham, Jason Carroll, Jess Price, Jeff Shellberg
Chapter 3
Grazing Implementation Strategy Cape York NRM Will Higham Appendix 15
Agriculture Implementation Strategy Cape York NRM Will Higham Appendix 16
Economics of grazing management Department of Agriculture, Fisheries and Forestry
Megan Star, Miriam East, Teresa Fox
Appendix 11
Cape York Fire Cape York NRM Peta-Marie Standley Appendix 13
Regional spatial prioritisation
Disturbance Index GriffithUniversity John Spencer, Andrew Brooks, Graeme Curwen, Kenn Tews
Appendix 1
Gully Prioritisation GriffithUniversity Andrew Brooks, Graeme Curwen, John Spencer
Appendix 2
Relative risk assessment of degraded water quality on coastal and marine ecosystems
TropWATER, JCU Jane Waterhouse, Jon Brodie, Caroline Coppo, Dieter Tracey, Eduardo da Silva, Caroline Petus, Len McKenzie, Stephen Lewis, Christina Howley, Gillian McCloskey, Will Higham
Appendix 10

Eastern Cape York Water Quality Improvement Plan
147.
Eastern Cape York Water Quality Improvement Plan
148.
AIMS, 2015. Monitoring on the Great Barrier Reef. Retrieved 22 May, 2015, from http://www.aims.gov.au/docs/research/monitoring/reef/reef-monitoring.html
Anderson, C., 1983. Aborigines and Tin Mining in North Queensland: A Case Study in the Anthropology of Contact History. Mankind, 13(6), 473-498.
ANZECC & ARMCANZ, 2000. Australian and New Zealand Guidelines for Fresh and Marine Water Quality. Australian and New Zealand Conservation Council, Agriculture Resource Management Council of Australia and New Zealand (ANZECC & ARMCANZ). National Water Quality Management Strategy (NQWMS), Australian Government, Canberra: http://www.environment.gov.au/water/policy-programs/nwqms/index.html
Australian Government, 2015. OzCoasts, Australian Online Coastal Information. Retrieved 18 May, 2015, from http://www.ozcoasts.gov.au/nrm_rpt/report_cards.jsp
Biggs, A.J.W., Philip, S.R., 1995. Soil Survey and Agricultural Suitability of Cape York Peninsula. Cape York Peninsula Land Use Strategy (CYPLUS), Natural Resources Analysis Program, Queensland. Dept. of Primary Industries Brisbane, QLD.
Brodie, J., De’ath, G., Devlin, M., Furnas, M., and Wright, M., 2007. Spatial and temporal patterns of near-surface chlorophyll a in the Great Barrier Reef lagoon. Marine and Freshwater Research (58), 342-353.
Brooks, A., Spencer, J., Olley, J., Pietsch, T., Borombovits, D., Curwen, G., Shellberg, J., Howley, C., Gleeson, A., Simon, A., Bankhead, N., Klimetz, D., Eslami-Endargoli, L., Bourgeault, A., 2013. An Empirically-Based Sediment BudgetfortheNormanbyBasin:SedimentSources,Sinks,andDriversontheCapeYorkSavannah,GriffithUniversity,Australian Rivers Institute, Final Report for the Australian Government Caring for Our Country - Reef Rescue Program, April 2013, 506pp. http://www.capeyorkwaterquality.info/references/cywq-229.
Brooks, A., Curwen, G., and Spencer J., 2015. A framework for prioritising gully management in the Normanby Basin CapeYork.AustralianRiversInstitute,GriffithUniversity,Brisbane.
Carroll, J., Stephan, K., Howley, C., Seabrook, W., Wood, D., 2007. Annan and Endeavour Strategic Plan. South Cape York Catchments, Cooktown.
Carroll, J., Coates, J., 2015. Fish and Crustacean Survey of Kimba Plateau Springs and Creeks. In: J. Shellberg, M. Ross, A. Hogbin, N. Preece, K. Grimes (Eds.), Kimba Plateau Physical and Biological Diversity, Olkola Country, Cape York Peninsula. Published by Olkola Aboriginal Corporation, with funding from the Queensland Government’s Indigenous Land and Sea Grants Program through the Department of Environment and Heritage Protection, pp. 54-58.
Coles, R., McKenzie, L., De’ath, G., Roelofs, A., Lee Long, W., 2009. Spatial distribution of deepwater seagrass in the inter-reef lagoon of the Great Barrier Reef World Heritage Area. Marine Ecology Progress Series 392, 57–68.
Coles,R.G.,Grech,A.,McKenzie,L.,Rasheed,M.2011.EvaluatingrisktoseagrassesinthetropicalIndo-Pacificregion. CERF 2011, 21st Biennial Conference of the Coastal and Estuarine Research Federation Conference Abstracts. Societies, Estuaries & Coasts: Adapting to Change. 6-10 November 2011, Daytona Beach, Florida, USA. p.43.
Commonwealth of Australia, 2015. Reef 2050 Long-Term Sustainability Plan. Commonwealth of Australia, Canberra. http://www.environment.gov.au/marine/gbr/long-term-sustainability-plan
Coppo, C., McKenzie, L. and J. Brodie, 2016. Status of Coastal and Marine Assets in the Eastern Cape York region, Centre for Tropical Water & Aquatic Ecosystem Research (TropWATER) Publication, James Cook University, Townsville, Report No. 15/65, **pp.
Davies, P.J. and Hughes, H., 1983. High-energy reef and terrigenous sedimentation, Boulder Reef, Great Barrier Reef. BMR Journal of Australian Geology and Geophysics 8:3:201-209. Bureau of Mineral Resources, Geology and Geophysics, Canberra.
Davies, P.L., 1995. Nutrients and suspended sediments in three near pristine tropical rivers on Cape York Peninsular, Southern Cross University.
Davies,P.J.,andEyre,B.D.,2005.EstuarinemodificationofnutrientandsedimentexportstotheGreatBarrierReefmarine park from the Daintree and Annan River catchments. Marine Pollution Bulletin 51(1-4), 174-185.
Devlin, M., 2012. Flood plume monitoring in the Great Barrier Reef, 1994 - 2012. James Cook University, Townsville. https://eresearch.jcu.edu.au/tdh/data/f31cbf35-2c03-4c6f-a312-2f621b1fc5b5
Doupe, R.G., Schaffer, J., Knott, M.J. and Dicky, P.W., 2009. A Description of Freshwater Turtle Habitat Destruction by Feral Pigs in Tropical North-eastern Australia. Herpetological Conservation and Biology (4), 331-339.
Ebner, B. and Donaldson, J. 2015. Wetland Surveys for Aquatic Biodiversity at Violet Vale Station, James Cook University.
Eyre B.D., and Davies P.L., 1996. Task G6: Flood Impact Monitoring Study Sub-task: River and Estuarine Monitoring, Centre for Coastal Management, Southern Cross University.
Fabricius,K.,De’ath,G.,McCook,L.,Turak,E.,andWilliams,D.M.,2005.Changesinalgal,coralandfishassemblagesalong water quality gradients on the inshore Great Barrier Reef. Marine Pollution Bulletin 51(1-4), 384-398.
Great Barrier Reef Marine Park Authority, 2010. Water Quality Guidelines for the Great Barrier Reef Marine Park.
Great Barrier Reef Marine Park Authority, Townsville, 99p.
Great Barrier Reef Marine Park Authority, 2014. Great Barrier Reef Outlook Report, 2014. Great Barrier Reef Marine Park Authority, Townsville.
Great Barrier Reef Marine Park Authority, 2016. Cape York Technical Background document to HWMP. Great Barrier Reef Marine Park Authority, Townsville.
Halpern, B.S., Walbridge, S., Selkoe, K.A., Kappel, C.V., Micheli, F., D’Agrosa, C., Bruno, J.F., Casey, K.S., Ebert, C., Fox, H.E., Fujita, R., Heinemann, D., Lenihan, H.S., Madin, E.M.P., Perry, M.T., Selig, E.R., Spalding, M.,
REFEREnCES

Eastern Cape York Water Quality Improvement Plan
149.
Eastern Cape York Water Quality Improvement Plan
150.
Steneck, R., Watson, R., 2008. A Global Map of Human Impact on Marine Ecosystems. Science, 319, 948-952.
Howley, C., McCollum, I., O’Connell, K., Stephan, K. (2006). Cape York Peninsula Marine and Coastal Natural Resource Management Plan. Cape York Marine Advisory Group , Cooktown. Qld.
Howley, C., Stephan, K., 2009. Cape York Open Freshwater Wetland Assessment Methods. Cape York Marine AdvisoryGroup (CYMAG), Cooktown, QLD.
Howley, C., Lyon, B., Frith, C., Frith, D., Johns, L., Carroll, J., and Stephan, K., 2009. Muck River Biodiversity andWetland Condition Report, 2008 - 2009. CYMAG Environmental Inc., Cooktown, Qld.
Howley, C., 2010. Results of the Laura-Normanby River Water Quality Monitoring Project: An Assessment of AmbientWater Quality and Water Quality Impacts. CYMAG Environmental, Inc., Cooktown, QLD.
Howley, C.M., Shellberg, J.G., Stephan, K., Brooks, A.P., 2013. Normanby Catchment Water Quality Management Plan.GriffithUniversityandHowleyEnvironmentalConsulting,FinalDraftReportfortheAustralianGovernmentCaringforOur Country - Reef Rescue Program, 88pp. http://www.capeyorkwaterquality.info/references/cywq-17, Cooktown, QLD.
Howley, C.M., Olley, J.M., Carroll, J., 2012. Annan and Endeavour River Freshwater and Estuarine Water Quality Report:An Assessment of Ambient Water Quality and Effects of Land Use 2002-2009. CYMAG Environmental Inc., Cooktown,Queensland.
Howley, C., 2012. Annan, Endeavour & Jeannie River freshwater & estuarine water quality report: Ambient Water QualityMonitoring Results 2002 - 2009. CYMAG Environmental, Cooktown, Qld.
Howley, C., 2015. Cape York Peninsula Marine Water Quality Synthesis Technical Report for the CYP Water QualityImprovement Plan. Howley Consulting, Cooktown.
Howley, C. , Huggins, R., Turner, R., Wallace, R., Warne, M., 2016. Eastern Cape York Sediment and Nutrient LoadReport: Empirical Load Estimates from the Normanby, Annan and Pascoe Rivers. Technical Report for the Cape YorkWater Quality Improvement Plan. Howley Consulting, Cooktown
Howley, C., Devlin, M., & Burford, M. (2018). Assessment of water quality from the Normanby River catchment to coastal floodplumesonthenorthernGreatBarrierReef,Australia.Marine and Freshwater Research, 69(6), 859-873.
Howley,C., Carroll, J. and McCollum, I. (unpublished data). Mapping of coastal and reef seagrass meadows in south-east Cape York Peninsula, 2004- 2009. Cape York Marine Advisory Group. Cooktown, Qld.
Karfs, R., Holloway, C., Pritchard, K., Resing, J., 2009. Land Condition Photo Standards for the Burdekin Dry Tropics Rangelands: A Guide for Practitioners. Burdekin Solutions Ltd and Queensland Department of Primary Industries and Fisheries, Townsville.
Lewis, S., 2015. Land use change Cape York NRM region. Report No. 15/xx for the Cape York NRM, Centre for Tropical Water & Aquatic Ecosystem Research (TropWATER) Publication, James Cook University, Townsville.
Mackey,B.G.,Nix,H.andHitchcock,P.2001.TheNaturalHeritageSignificanceofCapeYorkPeninsula.AnutechPtyLtd, ANU, QLD EPA.
McCloskey et al. in review. Source Catchments 2015 modelling results for eastern Cape York Catchments.
McKenzie, L.J., Yoshida, R., Grech, A., Coles, R., 2010. Queensland seagrasses. Status 2010 – Torres Strait and East Coast. Fisheries Queensland (DEEDI), Cairns. 6pp.
McKenzie, L.J., Collier, C., Waycott, M., 2013. Reef Rescue Marine Monitoring Program Inshore Seagrass.
Annual Report for the sampling period 1st July 2011 to 31st May 2012. TropWATER, James Cook University, Cairns, p. 192.
Moss, A.J., Howley, C.M., 2016. Water Quality Guidelines for Fresh and Estuarine Waters of Eastern Cape York: A technical report for the Cape York Water Quality Improvement Plan. Produced for South Cape York Catchments and Cape York NRM by Howley Environmental Consulting and the Qld Department of Science, Information Technology and Innovation, Cooktown, Qld.
NWQMS, 2000. National Water Quality Management Strategy. Australian Government Department of the Environment. http://www.environment.gov.au/water/quality/national-water-quality-management-strategy.
Petus,C.anddaSilva,E.T.unpublished.PrincessCharlotteBay:wheredoriverplumesgo?Afirstoverviewofthespatial and temporal variability of Princess Charlotte Bay River plumes using MODIS true color images. Prepared October 2013, TropWATER, James Cook University Townsville.
Port, P., 2014. Personal communication. Puntimu Outstation, Coen, Queensland, Australia.
Queensland Department of Environment and Resource Management, 2009. Queensland Water Quality Guidelines 2009.
Queensland Government, 2015. Reef Water Quality Protection Plan: Report Card 2013 and 2014 http://reefplan.qld.gov.au/measuring-success/report-cards/2014/catchment-indicators/
QueenslandWetlandInfo,2015.Thisreferenceneedstobedefined
Rhode, K., 2015. Rainfall simulations of land management practices in the Normanby and Endeavour River catchments. Catchment Solutions. Mackay, Qld.
Rolfe, J., Shaw, K., English, B., Kernot, J., 2004. Regional Land Condition Assessment: Grazing Management to Improve Regional Ecosystems, Land Condition and Optimise Beef Production in the Northern Gulf. Queensland Department of Primary Industries and Fisheries, pp. 26.
Schaffelke, B., Anthony, K., Blake, J., Brodie, J., Collier, C., Devlin, M., Fabricius, K., Martin, K., McKenzie, L., Negri, A.,Ronan,M.,Thompson,A.,Warne,M.,2013.2013ScientificConsensusStatement:Chapter1MarineandCoastalImpacts. Reef Water Quality Protection Plan Secretariat, The State of Queensland.

Eastern Cape York Water Quality Improvement Plan
151.
Eastern Cape York Water Quality Improvement Plan
152.
Shellberg, J.G., Brooks, A.P., 2013. Alluvial Gully Prevention and Rehabilitation Options for Reducing Sediment Loads intheNormanbyCatchmentandNorthernAustralia.GriffithUniversity,AustralianRiversInstitute,FinalReportfortheAustralian Government’s Caring for our Country - Reef Rescue Initiative, 312pp. http://www.capeyorkwaterquality.info/references/cywq-223.
Shellberg, J.G., Brooks, A.P., Rose, C.W., 2013. Sediment production and yield from an alluvial gully in northern Queensland, Australia. Earth Surface Processes and Landforms, 38, 1765-1778. DOI: 1710.1002/esp.3414.
Shellberg, J., Ross, M., Hogbin, A., Preece, N., Grimes, K. (Eds.), 2015. Kimba Plateau Physical and Biological Diversity, Olkola Country, Cape York Peninsula. Published by Olkola Aboriginal Corporation, with funding from the Queensland Government’s Indigenous Land and Sea Grants Program through the Department of Environment and Heritage Protection, 120pp.
Shellberg, J., Howley, C., Carroll, J., 2016. The Need for a ‘Super Gauge’ Approach Using Surrogate Technologies and Improved Field and Laboratory Techniques to Accurately Monitor Suspended Sediment and Nutrient Loads Delivered to the Great Barrier Reef: A Case Study from the Annan River Catchment on the Cape York Peninsula. Report by South CapeYorkCatchmentswithsupportfromtheCommonwealthScientificandIndustrialResearchOrganisation,theQueensland Government, and the Australian Government’s Cape York Water Quality Improvement Plan program. 47pp.
Spencer J., Brooks, A., Curwen, G., and Tews, K., 2016. A disturbance index approach for assessing water quality threatsinEasternCapeYork.AustralianRiversInstitute,GriffithUniversity,Brisbane.
Standley, P.M., 2011. Three Action Research Projects: (i) Traditional Knowledge Revival Pathways Fire Program, (ii) KukuThaypanFireManagementResearchProjectand(iii)theImportanceofCampfirestoEffectiveConservation- Cape York Peninsula Australia. Project Summaries in Ecological Management & Restoration, http://site.emrprojectsummaries.org/summaries/page/3/.
Standley, P.M., 2016. Cape York Fire. Cape York Natural Resource Management, Atherton, Queensland, Australia.
Stephan, K. and Howley, C., 2009. Jack Lakes Wetlands Biodiversity Assessment, November 2007 & June 2008. CYMAG Environmental Inc., March 2009
Sweatman, H.P.A., Johns, K.A., Jonker, M.J., Miller, I.R. and Osborne, K., 2015. Final report on coral reef surveys in Torres Strait, Report to the National Environmental Research Program, Reef and Rainforest Research Centre Limited, Cairns.
The State of Queensland, 2013. Reef Water Quality Protection Plan “Reef Plan”. Reef Water Quality Protection Plan Secretariat. July 2013.
Terrain NRM, 2015. Wet Tropics Water Quality Improvement Plan 2015-2020. Terrain NRM, Innisfail. http://www.terrain.org.au/Projects/Water-Quality-Improvement-Plan
Thomas, C. and Brodie, J., 2015. Environmental-economic values of marine and coastal natural assets, Cape York Peninsula NRM marine region, Great Barrier Reef. TropWATER Report 15/59, James Cook University, Townsville, Australia, 47 pp.
Thompson, A., Costello, P., Davidson, J., Schaffelke, B., Uthicke, S., Liddy, M., 2013. Reef Rescue Marine Monitoring Program: Report of AIMS Activities - Inshore coral reef monitoring 2012. Report for Great Barrier Reef Marine Park Authority. Australian Institute of Marine Science, Townsville. 120 pp.
Townsend,S.A.,andDouglas,M.M.,2000.Theeffectofthreefireregimesonstreamwaterquality,wateryieldandexportcoefficientsinatropicalsavannah(northernAustralia).JournalofHydrology229(3-4),118-137.
Townsend,S.A.,andDouglas,M.M.,2004.Theeffectofawildfireonstreamwaterqualityandcatchmentwateryieldinatropicalsavannahexcludedfromfirefor10years(KakaduNationalPark,NorthAustralia).WaterResearch38,3051-3058.
TropWATER James Cook University, 2013. The seagrass habitat map used is comprised of a composite of the survey dataupto2010(observedhabitat).SeagrassspatialdatafilessuppliedbyTropWATERJamesCookUniversity.
Valentine, P., 2006. Compiling a case for world heritage on Cape York Peninsula. James Cook University, Townsville. 80pp.
Waterhouse, J., Tracey, D., Brodie, J., Lewis, S., Coppo, C., McKenzie, L., da Silva, E., Devlin. M., Maynard, J., Heron, S., Petus, C., 2016. Assessment of the relative risk of water quality to ecosystems of the Cape York NRM Region, Great Barrier Reef. A report to South Cape York Catchments. TropWATER Report 16/xx, Townsville, Australia.

Eastern Cape York Water Quality Improvement Plan
153.
Eastern Cape York Water Quality Improvement Plan
154.
Appendix 1 A disturbance index approach for assessing water quality threats in Eastern Cape York
Appendix 2 A framework for prioritising gully management in the Normanby Basin Cape York
Appendix 3 Land use change Cape York NRM region
Appendix 4 The Need for a ‘Super Guage’ Approach Using Surrogate Technologies and Improved Field and
Laborotory Techniques to Accurately Monitor Suspended Sediment and Nutrient Loads
Delivered to the Great Barrier Reef: A Case Study from the Annan River Catchment on the
Cape York Peninsula
Appendix 5 Coastal and Marine Water Quality Guidelines: Cape York Technical Background document to
HWMP
Appendix 6 Cape York Peninsula Marine Water Quality Synthesis Technical Report for the CYP
Water Quality Improvement Plan
Appendix 7 Status of Coastal and Marine Assets in the Cape York Region
Appendix 8 Eastern Cape York Sediment and Nutrient Load Report: Empirical Load Estimates from the
Normanby, Annan and Pascoe Rivers Technical Report for the Cape York Water Quality
Improvement Plan
Appendix 9 Water Quality Guidelines for Fresh and Estuarine Waters of Eastern Cape York: A technical
Report for the Cape York Water Quality Improvement Plan.
Appendix 10 Assessment of the relative risk of degraded water quality to ecosystems of the Cape York NRM
Region, Great Barrier Reef
Appendix 11 Understanding adoption and economic implications of grazing management practice change
in the Cape York Catchment. A review and insight into achieving sediment reductions through
changing management practices
Appendix 12 Environmental-economic values of marine and coastal natural assets, Cape York Peninsula
NRM marine region, Great Barrier Reef
Appendix 13 Cape York Fire
Appendix 14 Walking the Landscape Basin Summaries
Appendix 15 Grazing Implementation Strategy
Appendix 16 Agriculture Implementation Strategy
APPEnDICES

Eastern Cape York Water Quality Improvement Plan
155.
www.australia.gov.au | www.environment.gov.au/marine/gbr/long-term-sustainability-plan
1300 132 262 | 47-49 Maunds Rd, Atherton | PO Box 907 Atherton QLD [email protected] | www.capeyorknrm.com.au
This project is supported by the Queensland Government Department of Natural Resources and Mines